Attached files
| file | filename |
|---|---|
| EX-99.1 - PRESS RELEASE - TPC Group Inc. | dex991.htm |
| 8-K - FORM 8-K - TPC Group Inc. | d8k.htm |
 TPC
Group LLC $150 million Asset Based Sr. Secured Revolving Credit
Facility $280 million Amended Sr. Secured Term Loan Facility Public Lenders’ Presentation March 2010 Exhibit 99.2 |
 Lenders Presentation – March 2010 Forward Looking Statement & Non-GAAP Financial Measures This presentation may contain forward-looking statements, including, in particular,
statements about the plans, strategies and prospects of TPC Group LLC (“the Company” or “TPC”). These forward-looking statements are based on the Company’s current assumptions, expectations and projections about future events. Although the Company believes that the expectations reflected in these forward-looking statements are reasonable, the Company can give no assurance that these expectations will prove to be correct or that synergies or other benefits anticipated in the forward-looking statements will be achieved. Important factors,
some of which may be beyond the Company’s control, that could cause
results to differ materially from management’s expectations are set forth in Amendment No. 1 to the Company’s Registration Statement on Form 10 filed with the Securities
and Exchange Commission. Estimated projected financial information for the
twelve months ended March 31, 2010 is based on the current belief of TPC based on currently available information as to the outcome and timing of future events
and assumptions that TPC believes are reasonable. The assumptions
underlying the estimated projected financial information are inherently uncertain and are subject to significant business, economic, regulatory and competitive risks and
uncertainties that could cause actual results to differ materially from those
TPC anticipates. If the assumptions are not realized, the actual financial results could be substantially different than that currently expected. When reading this
information, you should keep in mind the risk factors and other cautionary statements included in TPC’s filings with the SEC, including its registration statement on Form 10 filed on January 8, 2010. TPC does not undertake any obligation to release publicly the
results of any future revisions TPC may make to the projections or to update
the projections to reflect events or circumstances after the date of this presentation. Therefore, you are cautioned not to place undue reliance on this information. This presentation may also contain non-GAAP financial measures. For a presentation of the most directly comparable GAAP measures and a reconciliation of the two as well as additional detail regarding selected
items impacting comparability, please refer to Appendix. 2 |
 Lenders Presentation
– March 2010 Charles W. Shaver President and Chief Executive Officer Ruth I. Dreessen Executive Vice President and Chief Financial Officer Robert R. Whitlow Vice President, Finance and Treasury 3 Participants |
 Lenders Presentation
– March 2010 4 Agenda Executive Summary Deutsche Bank Investment Highlights Charles W. Shaver President and CEO, TPC Group Company Overview Ruth I. Dreessen Executive Vice President and CFO, TPC Group The Transaction Deutsche Bank Q&A Appendix |
 Lenders Presentation
– March 2010 Executive Summary TPC Group LLC ("TPC" or the "Company") is a leading North American chemicals processor and service provider, whose primary products are butadiene, butene-1, isobutylene, polyisobutylene, and fuel products TPC is seeking to arrange a new asset based revolving credit facility up to $150 million (the "ABL Facility") and to amend to extend up to $280 million of its existing term loan B facility (the "Existing Term Loan B Facility") After the amendment, the Existing Term Loan B Facility may be bifurcated into two tranches: • Existing Term Loan Tranche maturing June 2013 • Extended Term Loan Tranche maturing January 2016 Additionally, the Company is seeking to amend the restricted payment in its current credit agreement to provide flexibility that would allow for the possibility of a one- time upstream distribution to its parent company, TPC Group Inc., of approximately $40 million received from a tax refund For the twelve months ending 3/31/10E, TPC is expecting net revenues of $1,404 million and Adjusted Bank EBITDA (a) of $96 million The transactions are expected to close in early April 2010 5 (a) Not indicative of actual results; for Adjusted Bank EBITDA reconciliation to Adjusted reported EBITDA
and for additional disclosure, refer to slides 35-37. |
 Lenders Presentation – March 2010 Investment Highlights Charles W. Shaver President and CEO, TPC Group 6 |
 Lenders Presentation
– March 2010 Key Investment Highlights » Market Leader in Consolidated Industry • #1 position in Butadiene, Butene-1, HR-PIB, and Diisobutylene in North America • Contractually aligned with cost-advantaged "light" ethylene producers
» Differentiated Business Model • Service-based intermediary with strong infrastructure & logistics network
• Long-standing, service-based contracts limit exposure to commodity prices
» Strong Free Cash Flow • Modest capital expenditures and cost efficient capital structure • Robust cash generation throughout cycle » Positioned for Margin Expansion and Growth • Market dynamics allowing for increased margins • Recent capital investment projects and contract programs now complete » Substantial and Strategic Asset Value • TPC assets are critical component in supply chain • High replacement value is strong barrier to entry » Unique Relationships with Customers and Suppliers • Strong, long-tenured relationships with the largest incumbents in the petrochemical
supply chain » Experienced Management Team • Significant petrochemicals experience 7 |
 Lenders Presentation
– March 2010 Market Leader in Consolidated Industry Product North American Market Position Capacity Share Butadiene #1 33% Butene-1 #1 40% HR-Polyisobutylene #1 63% Diisobutylene #1 100% Isobutylene #2 34% » Through its Crude C4 processing operations, TPC is the largest producer by production capacity of finished butadiene and butene-1 in North America » TPC is one of only two North American Crude C4 processors that can separate and purify butene-1 from Crude C4 » TPC is the only merchant producer in North America of HR Polyisobutylene and Diisobutylene 8 |
 Lenders Presentation
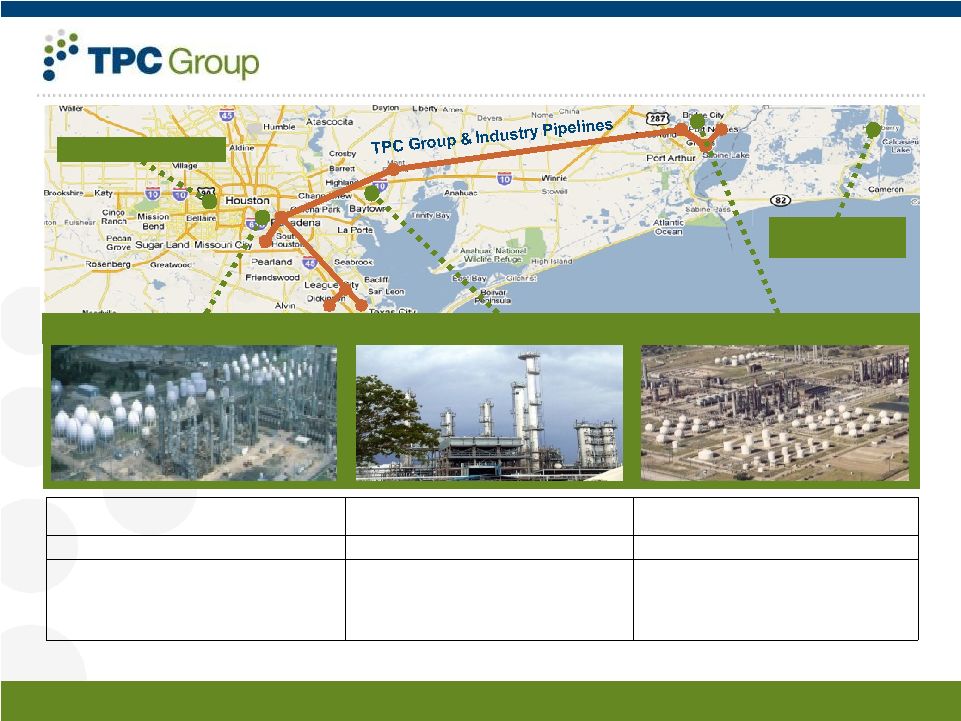
– March 2010 9 9 Positioned as a Crude C4 Processor, Logistics Provider & Marketer » Independent merchant processor status makes TPC a critical component in the supply chain » Provides beneficial relationship for both suppliers and customers » Leads to long-standing, service based contracts that limit exposure to commodity prices
» Ethylene produced by cracking “heavy” (oil) or “light” (natural gas) • Cracking “heavy” produces significantly more C4 than cracking “light” • “Heavy” crackers: integrated with their own C4 processing • “Light” crackers: non-integrated so outsource to TPC » Long-standing, service based contracts limit exposure to commodity prices • TPC receives processing fees from its suppliers • TPC receives service fees from its customers Suppliers rely on TPC for taking their mixed C4s, which they don’t purify and don’t store A Critical Component of the Ethylene Supply Chain Important to Suppliers and Customers Customers rely on TPC for securing their raw material supply, which they can’t make and can’t significantly import Propylene Ethylene Mixed C4 Propylene Ethylene Mixed C4 “Heavy” “Light” Steam Crackers Gasoline Lube/Fuel Additives Plastics Synthetic Rubber Differentiated Business Model |
 Lenders Presentation
– March 2010 Strong Free Cash Flow » Majority of TPC’s revenues are derived from index-based contracts which mitigate TPC’s exposure to chemical market and energy price fluctuations Fiscal year ended June 30, LTM ended 03/31/10E ($ in millions) 2007 2008 2009 Adjusted Bank EBITDA (a) $88.8 $97.3 $72.6 $96.3 Maintenance CapEx (16.4) (15.6) (9.8) (10.5) Interest expense (c) (11.5) (11.5) (11.5) (11.5) Free Cash Flow (d) $60.9 $70.2 $51.3 $74.3 (a) Not indicative of actual results; for Adjusted Bank EBITDA reconciliation to Adjusted reported EBITDA and
for additional disclosure, refer to slides 35-37. (b) Includes $3.4 million recovery from prior period. (c) Estimated based on interest expense as of closing. Excludes interest from swap. (d) For Free Cash Flow reconciliation to Operating Cash Flow , please refer to slide 39. 10 (b) |
 Lenders Presentation
– March 2010 » Beneficiary of cyclical recovery in key markets: multiple company specific upsides
• Beneficiary of macro tailwinds – upswing in Butadiene, Butene-1 and Crude C4 prices » Service based fee contracts • Allow TPC to charge a fee for the value associated with globally aggregating Crude C4 supplies • Provide customers with guaranteed ratable off-take on an annual basis » Differentiated technology enables TPC to capitalize on niche market opportunities
• Company holds several patents related to the production of HR-PIB » Economies of scale: provides attractive incentive for them to ‘outsource’ to TPC Positioned for Margin Expansion and Growth » Significant investments for growth & operational efficiency » Nonene & Tetramer - EBITDA growth » PIB – II - EBITDA growth » New energy production equipment at all three sites » Focus on maintenance and reliability Recent investments and its impact Project Cost Focus Port Neches Acquisition $262 MM Growth Nonene & Tetramer $ 70 MM Growth PIB - II $ 70 MM Growth Houston Boilers $ 40 MM Energy, reliability Energy Projects $ 15 MM Energy Isobutylene $ 11 MM RM, EH&S Other $ 44 MM Maintenance CapEx Total $512 MM 11 |
 Lenders Presentation
– March 2010 rd Substantial and Strategic Asset Value Source: 2006 & 2007 Arthur Lloyd Studies Baytown Operations Port Neches Operations Houston Operations Corporate Offices Lake Charles Terminal 2.4 B lbs/yr Raw C4 Mix Processing 240 M lbs/yr PIB 85 M lbs/yr Nonene 50 M lbs/yr Tetramer 1.8 B lbs/yr Raw C4 Mix Processing 257 acres 165 acres 154 acres Extensive pipeline network Substantial on and off site storage facilities Steam & electrical co-generation (35 MW) Exclusive docks on ship channel Large rail rack & railcar storage yard NA’s largest stand-alone Nonene plant Extensive rail rack & railcar storage yard Pipeline access to customer 3 party terminaling Extensive pipeline network Substantial storage facilities World class dock facilities Extensive rail rack & railcar storage yard 12 |
 Unique,
Long-standing Relationships with Customers and Suppliers » Customers and suppliers put their trust in TPC » Customers rely on TPC for securing raw materials, which they cannot make or significantly import » Suppliers rely on TPC for taking their Crude C4s, which they cannot purify and cannot store • Outsourcing this operation to TPC allows the suppliers to avoid the significant upfront capital cost
» Large chemical producing and refining customer base, large established supplier and customer base » Long term relationships Customers Feedstock Suppliers • Unprecedented processing reliability record • Major Crude C4 processor for thirteen ethylene plants • Highest Crude C4 processing capacity in North America • Five separate processing units at two independent sites • Processing relationships with ten Crude C4 suppliers that exceed fifteen years • Crude C4 processor for every non- integrated North American ethylene producer 13 Lenders Presentation – March 2010 |
 Lenders Presentation
– March 2010 Experienced Management Team » Chief Executive Officer and President and board director of TPC Group Inc. (TPC) since 2004 » Joined TPC Group from Gentek, where he was a Vice President and General Manager » Serves on the board of directors of the National Petrochemicals & Refiners Association (NPRA) and the American Chemistry Council (ACC) Charles W. Shaver » Executive Vice President and Chief Financial Officer since 2005 » Joined TPC Group in 2005 from Westlake Chemical Corporation, where she was Chief Financial Officer and Senior Vice President » Held numerous senior positions with JP Morgan Chase & Co. Ruth I. Dreessen Other Senior Management Name Position Industry Experience Russell T. Crockett Senior Vice President, Commercial 25 Luis E. Batiz Senior Vice President of Operations 33 Christopher A. Artzer Vice President, General Counsel & Secretary 12 Paula S. Sharp Vice President of Human Resources 32 Roger Wollenberg Vice President and Corporate Controller 30 Robert R. Whitlow Vice President, Finance and Treasury 35 Micheal Bloesch VP of Strategic Planning & Isobutylene/Propylene Derivatives Business 19 Glenn E. Bohny Vice President, Commercial 24 14 |
 Lenders Presentation
– March 2010 Company Overview Ruth I. Dreessen Executive Vice President and CFO, TPC Group 15 |
 Lenders Presentation
– March 2010 TPC Snapshot Performance Products Crude C4 Processing (b) FY 2008 FY 2009 788 602 21% 21% 466 315 23% 23% 43 28 33% 43% $0.05 $0.05 Total volume Volume % total Revenue ($ mm) % total Op. margin (c) ($ mm) % total Op. margin/lb FY 2008 FY 2009 3,004 2,295 79% 79% 1,550 1,062 77% 77% 89 37 67% 57% $0.03 $0.02 Butadiene Butene-1 Raffinates & MTBE Isobutylene Products Polyisobutylene (PIB) Propylene Derivatives (a) Not indicative of actual results; for Adjusted Bank EBITDA reconciliation to Adjusted
reported EBITDA and for additional disclosure, refer to slides 35-37. (b) Includes Utilities, MTBE by-product, MTBE – Non Core. (c) Operating margin represents Adjusted reported EBITDA before corporate SG&A
allocations. FY 2008 FY 2009 LTM 3/31/10E Total revenue $2,016 $1,377
$1,404 Adjusted Bank EBITDA (a)
$97 $73
$96 16 ($ in millions) |
 Lenders Presentation
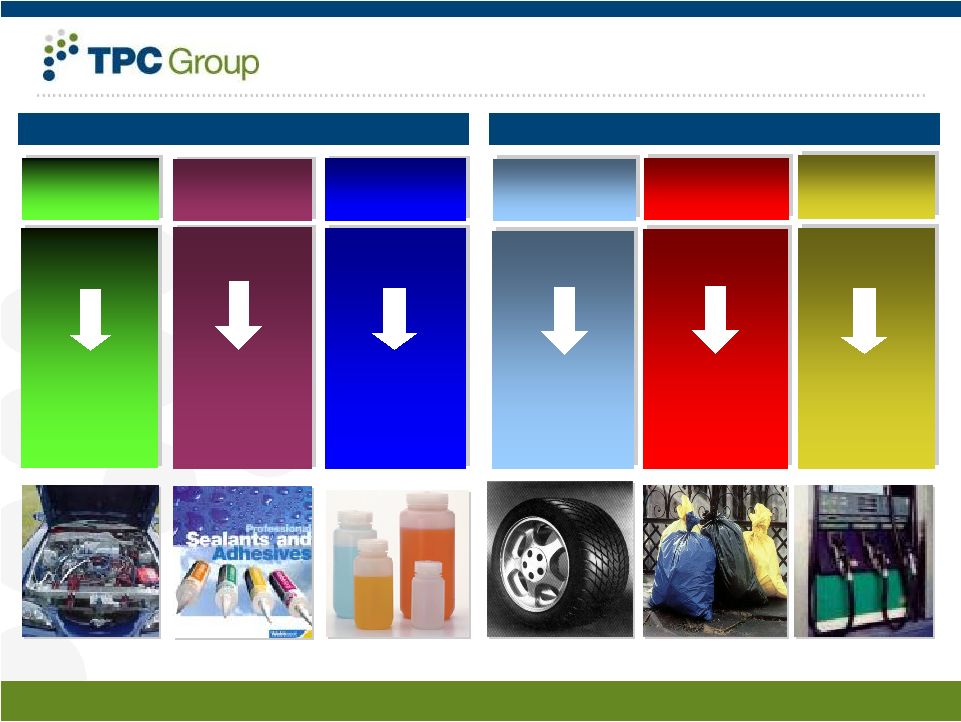
– March 2010 Products Overview Performance Products Crude C4 Processing Synthetic Rubber Elastomers Nylon Polyethylene Fuel Additives 17 Butene-1 Butadiene Plasticizers Lube Additives Surfactants Antioxidants Nonene Tetramer Propylene Derivatives Isobutylene Products Isobutylene Diisobutylene Phenolic Resins Surfactants Fuel & Lube Additives Polyisobutylene “PIB” HR-PIB Conventional PIB Gasoline & Lube Additives Gasoline Blendstocks Butylenes Butane Raffinates & MTBE |
 Lenders Presentation
– March 2010 End Markets Performance Products by Volume Plasticizers Fuels Raff & MTBE Prop. Deriv. Other Lube & Fuel Additives Fuels Isobutylenes Lube & Fuel Additives Total Processing by Volume Synthetic Rubber Nylon Other Crude C4 Processing by Volume 18 Source: Company data Rubber Lube & Fuel Additives Chemicals Other Polyethylene Fuels 100% |
 Lenders Presentation
– March 2010 Manufacturing Overview Source: Company data 19 |
 Lenders Presentation
– March 2010 Gaining Share via Proprietary Technology PIB polymers are a meaningful part of TPC TPC’s patented, Highly Reactive grade, “HR-PIB”, provides important processing & performance
benefits HR-PIB demand growing faster than conventional PIB TPC is North America’s sole merchant producer of HR-PIB HR-PIB has driven TPC’s dramatic PIB share gain: 0% to 50% in 10 yrs 2009 PIB Capacity – North America 2009 PIB Merchant Capacity – North America Source: Company data (1)Production may vary depending on product mix Total Capacity = 940mm lbs/year (1) Merchant Capacity Merchant Capacity = 495mm lbs/year TPC Ineos 20 TPC 100% |
 Lenders Presentation
– March 2010 Unprecedented reduction in demand & pricing • Oil from $125/Bbl to $35/Bbl, now back to $80/Bbl • 50% reduction in volume Recovery in demand & pricing • Incremental month over month improvement through calendar year 2009 Cost control through all aspects of business • Crude C4 capacity rationalization • Personnel reduction (15%) • Reduced capital spending to minimal levels, but critical programs funded Remained cash flow positive through cycle • Business model execution • Management initiatives Started up a new polyisobutylene (PIB) unit • Normal start-up adjustments • On track for ramp up Hurricane Ike business interruption insurance recovery complete • Settled claim at $47.0 million • Deductible of $19.5 million / cash of $27.5 million • $27.1 million cash received (net of fees) Where TPC has been – highlights of last 15 months 21 |
 Lenders Presentation
– March 2010 Product margins improving • Stable hydrocarbon pricing with forward curves sloping upward • Customer demand remaining strong Suppliers & customers recovering • North American demand stable • Global markets improving Well positioned to capitalize on economic recovery • Rationalized Crude C4 capacity • Performance Products demand SEC Registration Statement effective January, 2010 Where TPC is today 22 |
 Lenders Presentation
– March 2010 Where TPC will go – focus for next 12 months Execute growth of Performance Products • Margin recovery • Polyisobutylene ramp up • Nonene / tetramer growth Pursue growth initiatives to increase profitability • Trend toward service based fees • EBITDA margin increase Continue to improve on Operating Excellence • Environmental, Health, Safety & Security performance • Cost management and liquidity • Tight scrutiny of capital expenditures Maintain sustainable and steady cash flows Maintain position as market leader 23 |
 Lenders Presentation
– March 2010 Selected Financial Data – Historical Revenues Adjusted Bank EBITDA (a) ($ in millions) ($ in millions) 24 (a) Not indicative of actual results; for Adjusted Bank EBITDA reconciliation to Adjusted
reported EBITDA and for additional disclosure, refer to slides 35-37. Source: Company filings and Company data |
 Lenders Presentation
– March 2010 The Transaction Deutsche Bank 25 |
 Lenders Presentation
– March 2010 Sources and Uses / Capitalization ($ in millions) Sources of Funds ABL Facility (a) $11.5 Existing Term Loan Tranche (b) 92.4 Extended Term Loan Tranche (b) 175.0 Cash from Balance Sheet 40.0 Total $318.9 Uses of Funds Term Loan B Facility $267.4 Repay Existing Revolver Draw 5.8 Upstream distribution to Parent 40.0 Fees and Expenses 5.7 Total $318.9 (a) $150 million commitment. (b) Assumes 63% extension. (c) Based on LTM 3/31/10E Adjusted Bank EBITDA of $96 million, which is not indicative of actual results. For Adjusted Bank EBITDA reconciliation to Adjusted reported EBITDA and additional disclosure, refer to slides 35-37. (d) For Adjusted Bank EBITDA reconciliation to Adjusted reported EBITDA and for additional disclosure, refer to
slide 35. (e) Market cap of $148 million as of March 16, 2010. 3/31/10E Mult. of LTM Adj. Bank EBITDA (c) % of Total Capitalization Cash $1.0 ABL Facility (a) $11.5 0.1x 2.1% Existing Tranche (b) 92.4 1.0x 17.2% Extended Tranche (b) 175.0 1.8x 32.5% Total Bank Debt $278.9 2.9x 51.9% Insurance Debt 3.4 0.0x 0.6% Total Debt $282.3 2.9x 52.5% Book Equity (d) 255.5 2.7x 47.5% Total Capitalization $537.8 5.6x 100.0% 26 |
 Lenders Presentation
– March 2010 Estimated Core Credit Statistics Credit Statistics LTM 3/31/10E Total Debt $282.3 Adjusted Bank EBITDA $96.3 Capital Expenditures (a) $10.5 Interest Expense (b) $11.5 Total debt / LTM Adjusted Bank EBITDA (c) 2.9x LTM Adjusted Bank EBITDA (c) / Interest Expense 8.4x (LTM Adjusted Bank EBITDA (c) – CapEx) / Interest Expense 7.5x ($ in millions) (a) Includes $3.4 million recovery from prior period. (b) Estimated based on interest expense as of closing. Excludes interest from swap.
(c) Not indicative of actual results; for Adjusted Bank EBITDA reconciliation to Adjusted
reported EBITDA and for additional disclosure, refer to slides 35-37. 27 |
 Summary of Terms
– ABL Revolver 28 Lenders Presentation – March 2010 Facility: Security: Maturity: Accordion: LC sublimit: LIBOR spread: Unused commitment fee: Cash dominion liquidity event: Fixed charge coverage ratio: Borrowing base reporting: Appraisal and field exam frequency: Other covenants: Up to $150.0 million senior secured asset based revolver First priority security interest in accounts, inventory, payments and receivables in respect thereof,
general intangibles related thereto and the proceeds thereof Second lien on assets of the Term Loan B Facility Four years (a) $25.0 million $30.0 million L+300-375 bps, performance based grid (b) Grid (usage), 50 to 75 bps Anytime on event of default, or (i) for three consecutive business days, Availability is less than
the greater of (a) 20% of the Total Commitments and (b) $20.0 million or (ii) at any time,
Availability is less than the greater of (x) 15% of the Total Commitments and (y) $15.0
million. Springing Fixed Charge Coverage Ratio of 1.10:1 anytime Availability is less
than the greater of (i) 15% of the Total Commitments and (ii) $15.0 million Monthly borrowing base certificates, springing to weekly any time Availability is less than the
greater of (i) 33% of the Total Commitments and (ii) $50 million One appraisal per annum and one field exam per annum springing to more frequent based on Availability Other covenants normal and customary for deals of this type including: (i) limitations on liens, (ii)
indebtedness, and (iii) restricted payments and investments; all subject to baskets to be
agreed and Restricted Payments, acquisitions and other investments subject to Payment
Conditions based on Availability and post-transaction compliance with the Consolidated
Fixed Charge Coverage Ratio (“CFCCR”) (a) The Facility will mature the earlier of (i) 4 years from closing, or (ii) if more than $25 million of the
term loan due June 27, 2013 is outstanding on the 90th day prior to such date, then 90 days
prior to June 27, 2013 (b) L+350 for the first two quarters following closing. |
 Lenders Presentation
– March 2010 Summary of Terms – Term Loan B Term loan B – indicative terms Borrower: TPC Group LLC (the “Borrower”) Extension quantum: $175 million Extended maturity: January 2, 2016 – 2.5 year extension Extended tranche pricing: Coupon: L+350 (100 bps increase) LIBOR floor: 1.50% Non-extended tranche pricing: Coupon: L+ 300 (50 bps increase) LIBOR floor: None Amortization: 1% per annum Ranking, security and guarantees: Same as existing TLB Application of prepayments: TPC can direct optional prepayments and mandatory prepayments with proceeds of debt toward either (i) the non-extending loans or (ii) to all term loan Lenders (extending and non-extending)
on a pro rata basis, but not just to extending Lenders – mandatory prepayments (except due to debt issuances) would be pro rata Vote required: 50.1% of Lenders plus the consent of each extending Lender Work fee to Lenders: 10 bps paid to all consenting Lenders whether or not electing to extend 29 |
 Lenders Presentation
– March 2010 Summary of Terms – Term Loan B (cont.) Term loan B - proposed covenant amendments Provision Restricted Payments and Investments: Permit one-time $40mm distribution to shareholders from cash on hand Builder: 50% of Excess Cash Flow (“ECF”) which can be accessed if leverage-post transaction below 3.0x or senior secured leverage-post transaction is below 2.0x Ability to Incur Senior Secured Debt: Permitted for refinancing existing senior secured debt Ability to Incur Senior Unsecured Debt Provided that if senior secured leverage-post transaction is less than 2.0x and total leverage less than 4.25x leverage, will not require proceeds to be swept for debt repayment; proceeds could be then used as Restricted Payments, loans, investments, or acquisitions 30 |
 Lenders Presentation – March 2010 Transaction timeline 31 Denotes holiday Key dates March S M T W T F S 1 2 3 4 5 6 7 8 9 10 11 12 13 14 15 16 17 18 19 20 21 22 23 24 25 26 27 28 29 30 31 April S M T W T F S 1 2 3 4 5 6 7 8 9 10 11 12 13 14 15 16 17 18 19 20 21 22 23 24 25 26 27 28 29 30 Description of key dates Date Term Loan ABL 3/18 » Launch transaction » Launch transaction 3/25 » Lenders’ meeting » Lenders’ meeting 3/30 » Commitments due 4/6 » Commitments due 4/13 » Close and fund » Close and fund |
 Lenders Presentation – March 2010 Q&A 32 |
 Lenders Presentation – March 2010 Appendix 33 |
 Lenders Presentation
– March 2010 Corporate Structure TPC Group Inc. Delaware Corporation Texas Butylene Chemical Corp. Texas Corporation TPC Group LLC Texas Limited Liability Company TP Capital Corp. Delaware Corporation Texas Olefins Domestic / International Sales Corporation (Inactive) Port Neches Fuels LLC Texas Limited Liability Company Texas Petrochemicals B.V. Netherlands B.V. 100% 100% $150 million ABL Facility $280 million Term Loan B Facility 34 |
 Lenders Presentation
– March 2010 35 Adjusted Bank EBITDA reconciliation Source: Company data ($ in millions) Fiscal year ended June 30, Projected LTM ended March 31, 2010 (1) 2007 2008 2009 Net revenues $1,781.5 $2,016.2 $1,376.9 $1,404.3 % growth - 13.2% (31.7%) - Gross profit $241.4 $264.0 $182.7 $235.8 % margin 13.6% 13.1% 13.3% 16.8% Adjusted Reported EBITDA (non-GAAP) $86.1 $103.5 $40.3 $99.5 % margin 4.8% 5.1% 2.9% 7.1% Additional adjustments: Non-Core MTBE (2) $2.7 ($6.2) - - BI Insurance / Hurricane, net (3) - - 37.0 (26.1) Freight payment recovery (4) - - (4.7) - Turnaround adjustments (5) - - - 4.5 Hypothetical net service based fees (6) - - - 18.4 Total adjustments $2.7 ($6.2) $32.3 ($3.2) Adjusted Bank EBITDA (non-GAAP) $88.8 $97.3 $72.6 $96.3 % margin 5.0% 4.8% 5.3% 6.9% Please refer to slides immediately following for discussion of notes (1) to (6) contained in this
reconciliation. |
 Lenders Presentation
– March 2010 Notes to Adjusted Bank EBITDA reconciliation 36 Adjusted Bank EBITDA is included in this presentation to provide lenders with a view of the Company’s
financial performance as adjusted to exclude certain items that might affect the comparability of
results, and to hypothetically reflect recent financial improvements in results for prior
periods. Adjusted Bank EBITDA is not reflective of actual results, and therefore should not be unduly relied upon. Adjusted Bank EBITDA is not a measure computed in accordance with GAAP.
Accordingly it does not represent cash flow from operations, nor is it intended to be presented
herein as a substitute to operating income or net income as indicators of our operating
performance. The reconciliation provided above is to Adjusted EBITDA, another non- GAAP
measure. Adjusted EBITDA is reconciled to net income, the most directly comparable GAAP financial measure, on slide 38. Adjusted Bank EBITDA is not calculated in accordance with the definition of "Consolidated EBITDA"
in the credit facilities. 1.Estimated projected financial information for the twelve months ended March 31, 2010 is based on the
current belief of TPC based on currently available information as to the outcome and timing of
future events and assumptions that TPC believes are reasonable. The assumptions underlying
the estimated projected financial information are inherently uncertain and are subject to
significant business, economic, regulatory and competitive risks and uncertainties that could cause actual results to differ materially from those TPC anticipates. If the assumptions are not realized, the actual
financial results could be substantially different than that currently expected. When
reading this information, you should keep in mind the risk factors and other cautionary
statements included in TPC’s filings with the SEC, including its registration statement on Form 10 filed on January 8, 2010. TPC does not undertake any obligation to release publicly the results of any future
revisions TPC may make to the projections or to update the projections to reflect events or
circumstances after the date of this presentation. Therefore, you are cautioned not to place
undue reliance on this information. 2.Adjustment reflects that TPC has managed its MTBE business as a non-core business since fiscal 2005.
With the completion of the isobutylene processing unit in the first quarter of fiscal 2008, TPC
idled its Houston dehydrogenation units and stopped production of MTBE from those units.
Subsequent to the dehydrogenation units being idled, MTBE has been produced only from TPC’s
C4 processing activities at significantly reduced volumes, and is used either as a feedstock to the Performance Products segment or sold opportunistically into overseas markets. From third quarter of fiscal 2008 forward,
MTBE revenues and operating results are included in the C4 Processing segment category for
reporting purposes. |
 Lenders Presentation
– March 2010 Notes to Adjusted Bank EBITDA reconciliation (cont.) 3. Based on total net business insurance claim of $47.0 million, comprised of (a) $19.5
million deductible, (b) $10.0 million cash recovery received in June 2009 and
(c) $17.5 million cash recovery received in December 2010. Adjustment of $37.0 million in FY2009 period reflects total net business insurance claim of $47.0 million less
$10.0 million cash recovery received in June 2009. Negative adjustment
of $26.1 million in LTM period ending 3/31/10 reflects $10.0 million cash recovery received in June 2009 plus $17.1 cash recovery (net of fees) received in December
2010 less $1.0 million of hurricane-related repairs completed during the
period. This adjustment has been made to enhance the comparability of operating results by excluding items that are nonrecurring or for which the timing and/or
amount cannot reasonably be estimated. 4. Adjustment reflects recovery of $4.7 million from restitution of freight payments. This adjustment has been made to enhance the comparability of operating results by excluding items that are nonrecurring or
for which the timing and/or amount cannot reasonably be estimated. 5. Adjustment adds back $4.3 million of Adjusted EBITDA estimated to have resulted from
reduced contracted sales volumes due to a turnaround at our Houston facility
in February 2010, plus additional estimated losses of $0.2 million as a result
of tolling fees for processing of feedstock due to the turnaround. This adjustment has been made to illustrate what TPC’s operating performance might have been had the turnaround not been undertaken; note,
however, that turnarounds typically occur every three to four years at TPC’s facilities, and their exclusion from this calculation is not intended to suggest that they will not occur again in future periods. 6. In January and February 2010, TPC’s average monthly net service-based fees increased relative to prior months. This
adjustment applies the higher average fees from January and February 2010 to
prior months in the LTM period, in order to hypothetically illustrate what
TPC’s performance would have been had these higher average fees actually
been achieved throughout the period. The adjustment is calculated as (a) $31.1 million, reflecting the actual January and February average multiplied by nine (for the nine months from and including April 2009 to
December 2009), less (b) $12.7 million, the actual amount of service-based fees for the April - December 2009 period (which was already included in estimated Adjusted EBITDA). This adjustment has been made to illustrate the effect of TPC’s recently improved service- based fees on Adjusted EBITDA in prior periods, but it is not intended to suggest that
these fees were achieved or could have been achieved in prior periods, or will
continue to be achieved in future periods. The adjustment is for illustrative purposes only and is not reflective of actual results; accordingly, you are cautioned not
to place undue reliance upon it. 37 |
 Lenders Presentation
– March 2010 Adjusted Bank EBITDA to Net Income reconciliation (a) For additional Adjusted Bank EBITDA disclosure, refer to slide 35. Source: Company data 38 Please refer to slides 36 and 37 for discussion of notes (1) to (6) contained in this
reconciliation. ($ in millions) Fiscal year ended June 30, LTM ended March 31, 2010E (1) 2007 2008 2009 Adjusted Bank EBITDA (a) $88.8 $97.3 $72.6 $96.3 Reconciliation to Adjusted EBITDA as reported Non-Core MTBE (2) ($2.7) $6.2 - - BI Insurance / Hurricane, net (3) - - (37.0) 26.1 Freight payment recovery (4) - - 4.7 - Turnaround adjustments (5) - - - (4.5) Hypothetical net service based fees (6) - - - (18.4) Adjusted Reported EBITDA $86.1 $103.5 $40.3 $99.5 Reconciliation to Net Income (Loss) Income taxes ($13.7) ($14.6) $11.7 ($14.5) Interest expense, net (17.0) (18.9) (16.8) (14.5) Depreciation and amortization (29.1) (35.9) (41.9) (40.5) Loss on sale of assets - (1.1) - - Asset impairment - - (6.0) (6.0) Non-cash stock-based compensation (5.3) (6.5) (6.3) (2.5) Unrealized gain (loss) on derivatives 0.1 0.1 (3.7) 1.6 Net Income (Loss) $21.2 $26.6 ($22.8) $23.2 |
 Lenders Presentation
– March 2010 Free Cash Flow to Operating Cash Flow reconciliation ($ in millions) Fiscal year ended June 30, LTM ended March 31, 2010E (1) 2007 2008 2009 Free cash flow $60.9 $70.2 $51.3 $74.3 Reconciliation to Adjusted Bank EBITDA Maintenance capex 16.4 15.6 9.8 10.5 Interest expense 11.5 11.5 11.5 11.5 Adjusted Bank EBITDA $88.8 $97.3 $72.6 $96.3 Reconciliation to Adjusted reported EBITDA Non-Core MTBE (2) ($2.7) $6.2 - - BI Insurance / Hurricane, net (3) - - (37.0) 26.1 Freight payment recovery (4) - - 4.7 - Turnaround adjustments (5) - - - (4.5) Hypothetical net service based fees (6) - - - (18.4) Adjusted Reported EBITDA $86.1 $103.5 $40.3 $99.5 Reconciliation to Net Income (Loss) Income taxes ($13.7) ($14.6) $11.7 ($14.5) Interest expense, net (17.0) (18.9) (16.8) (14.5) Depreciation and amortization (29.1) (35.9) (41.9) (40.5) Loss on sale of assets - (1.1) - - Asset impairment - - (6.0) (6.0) Non-cash stock-based compensation (5.3) (6.5) (6.3) (2.5) Unrealized gain (loss) on derivatives 0.1 0.1 (3.7) 1.6 Net Income (Loss) $21.2 $26.6 ($22.8) $23.2 Reconciliation to Cash flows from operating activities Distribution received from joint venture $0.8 $1.0 $0.9 $1.5 Adjustments to reconcile net income (loss) to cash flows provided by operating activities Depreciation and amortization $29.1 $35.9 $41.9 $40.5 Amortization of debt issue costs 1.1 1.1 1.4 1.5 Pension Expense 0.5 1.2 0.2 (0.7) Gain on sale of assets - 1.1 - - Deferred income taxes 9.0 11.3 (5.0) 14.5 Stock compensation expense 5.3 6.5 6.3 2.5 Impairment of long-term asset - 0.0 6.0 6.0 Non-cash inducement for conversion of debt (0.8) (1.2) - - Other, net - 0.0 3.0 0.2 Earnings from joint venture (0.7) (0.8) (1.3) (1.5) Changes in assets and liabilities: Accounts receivable 15.1 (38.8) 101.9 (73.4) Inventories (12.8) (18.5) 65.6 (44.4) Other assets 7.6 (10.1) (2.9) 40.8 Accounts payable and accrued liabilities 18.1 42.5 (145.2) 57.1 Net cash provided by operating activities $93.6 $57.8 $50.1 $67.7 39 Please refer to slides 36 and 37 for discussion of notes (1) to (6) contained in this
reconciliation. |