Attached files
Table of Contents
UNITED STATES
SECURITIES AND EXCHANGE COMMISSION
Washington, D.C. 20549
FORM 10-K
| x | ANNUAL REPORT PURSUANT TO SECTION 13 OR 15(d) OF THE SECURITIES EXCHANGE ACT OF 1934 |
For the fiscal year ended December 31, 2009; or
| ¨ | TRANSITION REPORT PURSUANT TO SECTION 13 OR 15(d) OF THE SECURITIES EXCHANGE ACT OF 1934 |
Commission File Number 000-29173
VERENIUM CORPORATION
(Exact name of registrant as specified in its charter)
| Delaware | 22-3297375 | |
| (State or other jurisdiction of incorporation or organization) | (I.R.S. Employer Identification No.) | |
| 55 Cambridge Parkway, Cambridge, MA | 02142 | |
| (Address of principal executive offices) | (Zip Code) | |
Registrant’s telephone number, including area code: (617) 674-5300
Securities registered pursuant to Section 12(b) of the Act:
| Title of Each Class |
Name of Each Exchange on Which Registered | |
| Common Stock, $0.001 par value | The NASDAQ Stock Market, LLC |
Securities registered pursuant to Section 12(g) of the Act: None
Indicate by check mark if the Registrant is a well-known seasoned issuer, as defined in Rule 405 of the Securities Act. Yes ¨ No x
Indicate by check mark if the Registrant is not required to file reports pursuant to Section 13 or Section 15(d) of the Act. Yes ¨ No x
Indicate by check mark whether the Registrant (1) has filed all reports required to be filed by Section 13 or 15(d) of the Securities Exchange Act of 1934 during the preceding 12 months (or for such shorter period that the Registrant was required to file such reports), and (2) has been subject to such filing requirements for the past 90 days. Yes x No ¨
Indicate by check mark whether the Registrant has submitted electronically and posted on its corporate web site, if any, every Interactive Data File required to be submitted and posted pursuant to Rule 405 of Regulation S-T (§ 232.405 of this chapter) during the preceding 12 months (or for such shorter period that the registrant was required to submit and post such files). Yes ¨ No ¨
Indicate by check mark if disclosure of delinquent filers pursuant to Item 405 of Regulation S-K (§ 229.405 of this chapter) is not contained herein, and will not be contained, to the best of registrant’s knowledge, in definitive proxy or information statements incorporated by reference in Part III of this Form 10-K or any amendment to this Form 10-K. ¨
Indicate by check mark whether the Registrant is a large accelerated filer, an accelerated filer, a non-accelerated filer or a smaller reporting company.
| Large accelerated filer ¨ | Accelerated filer x | |
| Non-accelerated filer ¨ (Do not check if a smaller reporting company) | Smaller reporting company ¨ |
Indicate by check mark whether the Registrant is a shell company (as defined in Rule 12b-2 of Act). Yes ¨ No x
The aggregate market value of the voting stock held by non-affiliates of the Registrant as of June 30, 2009 was $52.8 million.*
The number of shares outstanding of the Registrant’s common stock was 12,098,322 as of March 12, 2010. The Registrant has no non-voting stock outstanding.
DOCUMENTS INCORPORATED BY REFERENCE
Portions of the proxy statement for the Registrant’s Annual Meeting of Stockholders to be filed with the Commission on or before April 30, 2010 are incorporated by reference into Part III of this annual report on Form 10-K. With the exception of those portions that are specifically incorporated by reference into this annual report on Form 10-K, such proxy statement shall not be deemed filed as part of this report or incorporated by reference herein.
| * | Based on the closing price of the Registrant’s common stock on the NASDAQ Global Market on June 30, 2009 of $9.12 per share. Excludes the common stock held by executive officers, directors and stockholders whose ownership exceeded 10% of the common stock outstanding at June 30, 2009. This calculation does not reflect a determination that such persons are affiliates for any other purposes. |
Table of Contents
FORM 10-K
For the Year Ended December 31, 2009
INDEX
| Page | ||||
| PART I. | ||||
| Item 1 |
3 | |||
| Item 1A |
30 | |||
| Item 1B |
62 | |||
| Item 2 |
62 | |||
| Item 3 |
63 | |||
| Item 4 |
65 | |||
| PART II. | ||||
| Item 5 |
Market for Registrant’s Common Equity, Related Stockholder Matters and Issuer Purchases of Equity Securities | 66 | ||
| Item 6 |
68 | |||
| Item 7 |
Management’s Discussion and Analysis of Financial Condition and Results of Operations |
69 | ||
| Item 7A |
98 | |||
| Item 8 |
100 | |||
| Item 9 |
Changes in and Disagreements with Accountants on Accounting and Financial Disclosure |
155 | ||
| Item 9A |
155 | |||
| Item 9B |
157 | |||
| PART III. | ||||
| Item 10 |
157 | |||
| Item 11 |
157 | |||
| Item 12 |
Security Ownership of Certain Beneficial Owners and Management and Related Stockholder Matters | 157 | ||
| Item 13 |
Certain Relationships, Related Transactions, and Director Independence |
157 | ||
| Item 14 |
157 | |||
| PART IV. | ||||
| Item 15 |
158 | |||
| 167 | ||||
Table of Contents
Forward-Looking Statements
Except for the historical information contained herein, the following discussion, as well as the other sections of this report, contain forward-looking statements that involve risks and uncertainties. These statements speak only as of the date on which they are made, and we undertake no obligation to update any forward-looking statement.
Forward-looking statements applicable to our business generally include statements related to:
| • | our estimates regarding market sizes and opportunities, as well as our future revenue, product revenue, profitability and capital requirements; |
| • | the length of time that we will be able to fund our operations with existing cash and cash commitments and from other sources or potential sources of financing; |
| • | our expected cash needs, our ability to manage our cash and expenses and our ability to access future financing; |
| • | the continuation of, and expected benefits from, our strategic partnership with BP Biofuels North America LLC, or BP, to advance our cellulosic ethanol technology; |
| • | our ability to continue as a going concern; |
| • | our expected future research and development expenses, sales and marketing expenses, and selling, general and administrative expenses; |
| • | the effects of governmental regulation and programs on our business and financial results; |
| • | our plans regarding future research, product development, business development, commercialization, growth, independent project development, collaboration, licensing, intellectual property, regulatory and financing activities; |
| • | our products and product candidates under development; |
| • | investments in our core technologies and in our internal product candidates; |
| • | the opportunities in our target markets and our ability to exploit them; |
| • | our plans for managing the growth of our business; |
| • | the benefits to be derived from our current and future strategic alliances; |
| • | our anticipated revenues from collaborative agreements, grants and licenses granted to third parties and our ability to maintain our collaborative relationships with third parties; |
| • | our ability to repay our outstanding debt (including in connection with any “make-whole” payments that may be due upon conversion of our 8% Senior Convertible Notes due April 1, 2012 (“2008 Notes”) and 9% Convertible Senior Secured Notes due April 1, 2027 (“2009 Notes”); |
| • | the impact of dilution to our shareholders and a decline in our share price and our market capitalization from future issuances of shares of our common stock (including in connection with conversion of our convertible notes); |
| • | our exposure to market risk; |
| • | the impact of litigation matters on our operations and financial results; and |
| • | the effect of critical accounting policies on our financial results. |
Forward-looking statements applicable to our biofuels business include statements related to:
| • | the continuation of, and expected benefits from, our strategic partnership with BP to advance our cellulosic ethanol technology; |
1
Table of Contents
| • | potential growth in the use of ethanol, including cellulosic ethanol, the economic prospects for the ethanol industry and cellulosic ethanol and the advantages of cellulosic ethanol versus ethanol and other fuel sources; |
| • | the continued development of our pilot facility; |
| • | the optimization of our demonstration-scale facility and our plans to prove the economic and commercial viability of our cellulosic ethanol production process in 2010; |
| • | our statement that production from the commercial-scale cellulosic ethanol facility that Highlands Ethanol, LLC (dbaVercipia Biofuels LLC) (“Vercipia”) is developing in Highlands, Florida could begin as early as 2012 and that we could break ground for that facility as early as 2010, and that the estimated construction cost for that facility will be approximately $300 million; |
| • | the financing, development and construction of commercial-scale cellulosic ethanol facilities; |
| • | our ability to use multiple non-food feedstocks to produce cellulosic ethanol; |
| • | our expectation regarding grant funding and loan guarantee amounts from the U.S. Department of Energy (“DOE”); and |
| • | the implied value of our biofuels business model. |
Forward-looking statements applicable to our specialty enzymes business include statements related to:
| • | our ability to increase or maintain our product revenue and improve or maintain product gross margins; and |
| • | our ability to maintain good relationships with the companies with whom we contract for the manufacture of certain of the products in our specialty enzymes business. |
Factors that could cause or contribute to differences include, but are not limited to, risks related to our ability to fund our operations and continue as a going concern, risks involved with our new and uncertain technologies, risks associated with our dependence on patents and proprietary rights, risks associated with our protection and enforcement of our patents and proprietary rights, our dependence on existing collaborations, our ability to enter into, maintain, continue, or re-new collaboration and joint venture agreements, including our strategic partnership with BP, our ability to commercialize products directly and through our collaborators, the timing of anticipated regulatory approvals and product launches, the timing of conversion of the 2008 Notes and 2009 Notes, if any, and our ability to make any required cash “make-whole” payments due upon such conversion at that time and other risks associated with the 2008 Notes and 2009 Notes as set forth in the section of this report entitled “Risk Factors,” and the development or availability of competitive products or technologies, as well as other risks and uncertainties set forth below and in the section of this report entitled “Risk Factors.”
We use market data and industry forecasts throughout this report. We have obtained this information from internal surveys, market research, publicly available information, and industry publications. Industry publications generally state that the information they provide has been obtained from sources believed to be reliable but that the accuracy and completeness of such information is not guaranteed. Similarly, we believe that the surveys and market research we or others have performed are reliable, but we have not independently verified this information. We do not represent that any such information is accurate.
Trademarks
Cottonase, Deltazym, DirectEvolution, Fuelzyme, GigaMatrix, Luminase, PathwayLibraries, Purifine, Pyrolase and Xylathin are our registered trademarks. Celunol, Diversa, GeneReassembly, Gene Site Saturation Mutagenesis, GSSM, SingleCell, Tunable GeneReassembly and Verenium are our trademarks. Phyzyme is a trademark of Danisco Animal Nutrition. Quantum is a trademark of Syngenta Animal Nutrition. Bayovac is a trademark of Bayer Animal Health. This report also refers to trade names and trademarks of other organizations, each of which is the property of its respective owner.
2
Table of Contents
PART I
| ITEM 1. | BUSINESS. |
Overview
We were incorporated in Delaware in December 1992 under the name Industrial Genome Sciences, Inc. In August 1997, we changed our name to Diversa Corporation. On June 20, 2007, we completed a merger transaction with Celunol Corp. The combined company was renamed Verenium Corporation. We possess a portfolio of specialty enzyme products and are developing technical and operational capabilities designed to enable the production of low-cost, biomass-derived sugars for a number of major industrial applications, including the commercialization of advanced biofuels. In connection with the corporate name change, we also changed our NASDAQ ticker symbol from “DVSA” to “VRNM” and began trading under the new ticker symbol effective June 21, 2007.
We operate in two business segments, biofuels and specialty enzymes. Our biofuels business segment operates through our wholly-owned subsidiary, Verenium Biofuels Corporation, and is focused on developing unique technical and operational capabilities designed to enable the production and commercialization of biofuels, in particular ethanol produced from cellulosic biomass. We believe the most significant near-term commercial opportunity for our biofuels business segment is the large-scale commercial production of cellulosic ethanol derived from multiple biomass feedstocks, with our initial focus on energy canes and grasses. Our specialty enzymes segment develops high-performance enzymes for use within the alternative fuels, specialty industrial processes, and animal nutrition and health markets to enable higher throughput, lower costs, and improved environmental outcomes. We believe the most significant near-term commercial opportunity for our specialty enzymes business segment will be derived from continued sales, and gross product margins from our existing portfolio of enzyme products.
Our biofuels and specialty enzymes businesses are both supported by a research and development team with expertise in gene discovery and optimization, cell engineering, bioprocess development, biochemistry and microbiology. Over the past 18 years, our research and development team has developed a proprietary technology platform that has enabled us to apply advancements in science to discovering and developing unique solutions in complex industrial or commercial applications. We have dedicated substantial resources to the development of our proprietary technologies, which include capabilities for sample collection from the world’s microbial populations, generation of DNA libraries, screening of these libraries using ultra high-throughput methods capable of analyzing more than one billion genes per day, and optimization based on our gene evolution technologies. We have continued to shift more of our resources from technology development to commercialization efforts for our existing and future technologies and products. While our technologies have the potential to serve many large markets, our primary areas of focus for product development are (i) integrated solutions for the production of advanced biofuels, such as cellulosic ethanol, and (ii) specialty enzymes for alternative fuels, specialty industrial processes, and animal nutrition and health. We have current collaborations and agreements with market leaders, such as BP Biofuels North America LLC, or BP, and Bunge Oils, or Bunge, which complement our internal technology and product development efforts.
To advance our efforts to accelerate technology development and commercialization of cellulosic ethanol, we have partnered with BP in two joint ventures. The first joint venture, which commenced in August 2008, is focused on the further development and validation of our first-generation cellulosic ethanol technology, which will be deployed in our first commercial facility. This first joint venture was scheduled to expire on February 1, 2010; however, we recently announced two extensions to the initial 18-month term until April 1, 2010, while we continue to negotitate the terms for advancing our cellulosic ethanol technology.
The second joint venture, doing business under the name Vercipia Biofuels, LLC, or Vercipia, commenced in February 2009, and is intended to serve as the commercial entity for the deployment of cellulosic ethanol technology being developed and proven under the first joint venture. During 2009, Vercipia announced plans to
3
Table of Contents
build its first 36 million gallons-per-year (MGY) commercial cellulosic ethanol plant in Highlands County, Florida, the estimated construction cost of which we expect to be approximately $300 million.
Vercipia expects to fund the cost of the first commercial plant through a combination of debt and equity capital. In 2009, through Vericipia, we and BP filed a joint application for a DOE loan guarantee program. Our application has been selected by the DOE to enter the due diligence phase of its Title XVII Loan Guarantee Program, and Vercipia was invited to begin negotiations for a DOE loan guarantee. If awarded, we expect this program would fund a portion of the cost of construction. We expect the remaining portion to be funded by project equity investments from BP and us. Pending the timing of funding from these sources, Vercipia anticipates that it could break ground on this plant as early as 2010, and could begin producing cellulosic ethanol from this facility as early as 2012. The primary focus of Vercipia is to progress the development of this facility, as well as the development of a second potential commercial site on the Gulf Coast which was contributed to the joint venture, and to create future opportunities for leveraging cellulosic ethanol technologies. All activities and expectations for Vercipia are expressly conditioned upon our continued collaboration with BP, the future terms of which we are continuing to negotiate with BP. There can be no assurance that we will successfully conclude these negotiations in manner that is beneficial to the Company or our biofuels business.
We have a substantial intellectual property estate comprising more than 250 issued patents and more than 350 patent applications as of March 12, 2009. We believe that we can leverage our intellectual property estate to enhance and improve our technology development and commercialization efforts across both business units while maintaining protection of our key intellectual property assets.
Our Strategy
The key elements of our strategy within our biofuels business can be characterized under two broad categories:
Research and development programs aimed at reducing biomass-to-ethanol conversion costs
We plan to exploit our technology development capabilities by supporting programs, alone and with partners, aimed at developing enzymes to break down the more complex starting materials locked within cellulosic biomass into fermentable sugars that could be used to produce biofuels, such as cellulosic ethanol. We are developing lignocellulosic enzyme “cocktails” as part of our overall objective of developing a new, more cost-effective process to break down the more complex starting materials locked within cellulosic biomass into fermentable sugars that could be used to produce cellulosic ethanol. Over the years, we have had several research and development programs aimed at developing these cocktails of enzymes, including programs with BP, Syngenta AG, DOE, Du-Pont Bio-Based Materials, and New Zealand’s Scion and AgResearch Institutes. We believe that our ongoing efforts in this area will not only benefit the advancement of the commercialization of cellulosic ethanol, but may also enable us to create additional enzyme market opportunities that are focused on external applications for the broader biofuels industry.
In order to meet the increased demand for ethanol in the future, feedstocks other than starch will need to be utilized to produce alternative fuel. Many forms of cellulosic biomass can contribute to biofuels, including grain crops and switch grass, or crop residues such as corn stalks, wheat straw, rice straw, grass clippings, and wood residues. These cellulose-containing natural waste products are widely abundant and can be sustainably produced. In addition to fuel, cellulosic biomass can be converted into chemicals used to manufacture products that would otherwise be made from petrochemicals, such as plastics, adhesives, and paints.
Cellulosic biomass has been a challenge for scientists to convert to ethanol. In the past, scientists have used harsh acids and high temperatures to try and break, or hydrolyze, the cellulose molecules into their individual sugar components. However, an economical process has never been developed using traditional chemistry.
We have significant research and development efforts which are aimed at developing “cocktails” of enzymes to break down more complex starting materials commonly referred to as “biomass”—such as corn
4
Table of Contents
stover, wood chips, switchgrass, sugar cane bagasse, and municipal waste materials, for example—into fermentable sugars that could be used to produce ethanol, commonly referred to as “cellulosic ethanol” or “lignocellulosic ethanol.” Regarding biomass-to-ethanol opportunities in general, our strategy for generating ethanol from biomass is built around using our technology platform to develop superior enzymes customized for the starting material and pre-treatment process and then working to produce them cost-effectively. We believe that this approach is more likely to be ultimately successful than competing approaches which are based primarily on taking existing commercial enzymes and simply trying to produce them at low cost. Given the complexities of the process of producing ethanol from biomass, we believe that the same enzyme cocktail is unlikely to work with each source of biomass, each pre-treatment process, and each fermentation organism; rather, we expect that customized sets of new and improved enzymes—that is, ones that are optimized for the specific source of biomass, the specific pre-treatment process, and the specific fermentation organism—will be required to make biomass-to-ethanol an economic reality.
Asset development and commercialization of cellulosic ethanol
With our partner, BP, we plan to provide an end-to-end solution for the production of cellulosic ethanol from a broad variety of biomass feedstocks for incorporation into our facilities and those of third-party licensees. With BP, we are developing fully-integrated cellulosic ethanol production capabilities at our pilot and demonstration-scale facilities in Jennings, Louisiana to validate our production economics. We believe this will support commercial development of cost-effective end-to-end solutions for the production of ethanol from a variety of feedstocks, comprising:
| • | pre-treatment of biomass to make the biomass fibers accessible to enzymes; |
| • | enzyme cocktails to break down biomass to its constituent five-carbon and six-carbon sugars; and |
| • | fermentation organisms to convert the two types of sugars into fuel ethanol. |
We intend to use our integrated solutions, our ongoing research and development efforts, and our process improvements to support our strategy to own and manage, together with strategic partners including BP, cellulosic ethanol production facilities in the United States, and to make our technologies and know-how available to potential licensees throughout the world.
With our partner, BP, we strive to be a leader in developing a cost-effective multi-feedstock commercial cellulosic ethanol production process. We believe that early cellulosic ethanol commercialization could provide significant benefits in setting standards for the emerging cellulosic ethanol industry, giving us access to worldwide business opportunities, and attracting important scientific and business talent, among other potential benefits. While our costs of production of cellulosic ethanol may initially be higher than ethanol produced from sugar, significantly lower feedstock costs for cellulosic biomass, combined with production process cost improvements, have the potential to substantially reduce total production costs for cellulosic ethanol to levels well below that of ethanol produced from grain such as corn. Corn is currently the primary feedstock for ethanol production in the United States.
With partners, including BP, we strive to be the market leader in the design, development and operation of cellulosic ethanol production plants in the United States. Through partnered and joint venture project development and ownership, we intend to advance a pipeline of commercial-scale cellulosic ethanol projects in the United States that we will own and operate, either independently or with other financial and operational partners, such as BP. We plan to develop cellulosic ethanol projects in conjunction with strategic partners who will enhance the competitiveness and ability to finance ethanol projects. Our early joint development strategy is focused on projects with strategic partners who bring financial resources and/or key supplies or services to project development such as feedstocks, sites, agricultural resources, on-site biomass boiler facilities or ethanol off-take agreements. Our expectations concerning our biofuels business are dependent upon our continued collaboration with BP, the future terms of which we are continuing to negotiate with BP. There can be no assurance that we will successfully conclude these negotiations in manner that is beneficial to the Company or our biofuels business.
5
Table of Contents
The key elements of our strategy within our specialty enzyme business are to:
Deploy our enzyme technologies across diverse markets that represent unique and large commercial opportunities. Our specialty enzyme products and product candidates target high-value applications where we believe our enzyme discovery and optimization technologies can deliver superior, proprietary solutions. We believe our combination of independent and partnered products is positioned to generate substantial product revenues at attractive gross profit margins. In 2009, we generated approximately $44 million in such revenues, and expanded our commercial product portfolio from six enzymes in 2008 to nine in 2009. We hope to achieve increased product sales and profit margins to support the future growth and profitability of our portfolio of products sold directly by us and by our partners. We use our enzyme technologies to develop commercial solutions for a broad range of applications within the three focus areas for our enzyme business—alternative fuels, specialty industrial processes, and animal nutrition and health. These markets are largely served by a small number of large, well-established providers. We attempt to work collaboratively with those large industrial companies to develop differentiated, high performance enzyme solutions for their target markets, and to leverage their well-developed distribution capabilities to better exploit commercial opportunities. We believe that this multiple-market approach gives us the ability to broadly apply our unique enzyme development and manufacturing capabilities while minimizing commercialization risk.
Pursue corporate partnerships to enable the development of a broad portfolio of enzyme products and commercialize additional enzyme products. To date, we have commercialized 12 products independently and four products with our partners. We also have a pipeline of early- to late-stage product candidates that could be commercialized in the next several years, some of which may depend upon incremental investment from a strategic partner or partners.
We have identified key market segments where we hope to develop enzyme products through strategic partnerships. Our established criteria for entering into such partnerships include:
| • | commercial revenue opportunity and novelty of the product(s); |
| • | estimated time to market; |
| • | regulatory hurdles; |
| • | infrastructure requirements; industry-specific expertise necessary for successful commercialization; and |
| • | sufficiency of financial resources to fund development and commercialization efforts. |
We believe that select partnerships have allowed, and will continue to allow, us to utilize our partners’ marketing and distribution networks, share the investment risk, and access additional resources to expand our product portfolio and market opportunities. In entering these agreements, we have typically sought to obtain a combination of technology access fees, research support payments, milestone payments, license or commercialization fees, and royalties from the commercialization of products resulting from these alliances.
Protect and enhance our technology leadership position for the development of novel enzymes. We believe that our particular scientific, manufacturing, process engineering and technology capabilities represent a significant, sustainable competitive advantage which we expect to maintain and extend. These capabilities include an end-to-end enzyme product solution, consisting of:
| • | access to novel genetic material; |
| • | several technologies capable of screening more than a billion genes per day; |
| • | multiple evolution technologies for optimizing enzymes; |
| • | manufacturing know-how and capabilities; and |
| • | development of heterologous expression systems which allow for a broader range of organisms from which to develop product candidates. |
6
Table of Contents
Our Business Segments—Biofuels and Specialty Enzymes
Our Biofuels Business
Biofuels Industry Overview
Biofuels are liquid fuels derived from agricultural and other natural or renewable sources. These fuels are used to complement the world’s supply of petroleum and other fossil fuels. A variety of factors contribute to an increasing awareness of and demand for biofuels including, but not limited to, the following:
| • | Macroeconomic factors affecting the global supply of, demand for and price of oil, including significantly increased demand for oil from developing countries whose economies are growing at high rates, such as China and India, coupled with uncertain supplies of oil from sources throughout the world; |
| • | Policies and initiatives developed across the world aimed at reducing dependence on imported sources of oil, particularly from countries and regions that have exhibited the greatest level of instability; |
| • | Increasing awareness and incorporation of “flexible fuel vehicles,” or FFVs, into the world auto supply that are capable of operating on a wider variety of blends of gasoline and ethanol; and |
| • | Broadening development of the required infrastructure to support the use of fuel ethanol, including expansion of distribution channels and retrofitting wholesale and retail points of distribution. |
The Renewable Fuels Standard, or RFS, was established in 2005, and amended in early 2010. The amended RFS mandates minimum annual use of 12.95 billion gallons of renewable fuel in 2010, growing to 36 billion gallons by 2022. This includes 6.5 million gallons of cellulosic ethanol beginning in 2010 increasing to 16 billion gallons by 2022. At current ethanol prices of approximately $1.65 to $1.90 per gallon, this would translate into an addressable market of at least $26 billion annually, not including market opportunities for cellulosic ethanol outside of the United States.
The figure below details the mandated United States consumption of biofuels as provided for by the Energy Independence and Security Act of 2007 (“EISA”).
Figure 1: United States Mandated Renewal Fuels Production (Billions of Gallons)
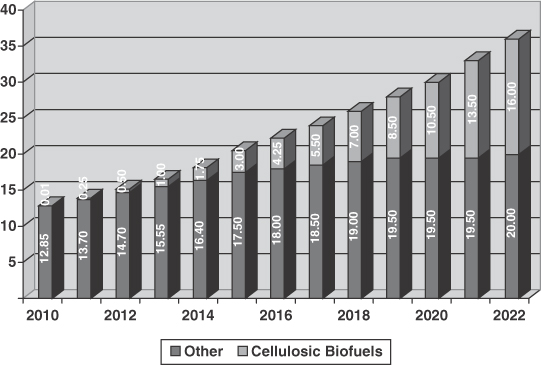
Source: Renewable Fuels Association; www.ethanolRFA.org
7
Table of Contents
Many industry experts believe corn-based ethanol production growth will reach a natural limit of 15 billion gallons per year, in annual production, and the RFS does not mandate use of corn ethanol beyond this level. United States-based demand for ethanol is expected to meet, if not exceed, this level of production for reasons that include the following:
| • | Strong legislative and government policy support—As stated above, the RFS mandates minimum annual renewable fuel usage of 36 billion gallons per year by 2022, including 16 billion gallons of cellulosic biofuels. |
| • | Expansion of gasoline supply—By blending ethanol into gasoline, refiners can expand the volume of fuel available for sale especially when refinery capacity and octane sources are limited. We believe that increased pressure on domestic fuel refining capacity will result in greater demand for ethanol. |
| • | Favorable tax treatment—One factor contributing to ethanol’s attractive economics is the availability of a federal excise tax credit available to blenders/retailers, known as the volumetric ethanol excise tax credit, or VEETC. The credit is currently set at $0.45 per gallon and is scheduled to expire on December 31, 2010. In addition, the Farm, Energy and Conservation Act of 2008 instituted a $1.01 per gallon cellulosic biofuels production credit, inclusive of the VEETC. This credit is set to expire on December 31, 2012. As currently structured, the $0.56/gallon difference between the $1.01 credit and the VEETC is payable directly to producers; in the event the VEETC expires, the full credit is expected to become payable to producers. |
| • | Environmental benefits—Ethanol, as an oxygenate, reduces tailpipe emissions when added to gasoline. The additional oxygen in the ethanol results in a more complete combustion of the fuel in engine cylinders, resulting in reduced carbon monoxide and nitrogen oxide emissions. Prior federal programs that mandated the use of oxygenated gasoline in areas with high levels of air pollution spurred widespread use of ethanol in the United States. |
| • | Geopolitical concerns—The United States currently imports up to 65% of its oil needs, a dependency that is expected to continue. Political unrest and attacks on oil infrastructure in the major oil-producing nations, particularly in the Middle East, have periodically disrupted the flow of oil, which has added a “risk premium” to world oil prices. At the same time, developing nations such as China and India have substantially increased their demand for oil. As a domestically produced, renewable source of energy, ethanol can help to reduce American dependence on foreign oil. |
| • | Ethanol as a gasoline substitute—Ethanol’s role in the United States is gradually shifting from that of an oxygenate/gasoline additive to a true gasoline complement/replacement. Most ethanol currently produced in the United States is used in a fuel blend of 10% ethanol and 90% gasoline called E10, which is used as an oxygenate/fuel additive. Further, the US Environmental Protection Agency contines to evaluate a request from numerous grain ethanol producers to increase the maximum blend level in gasoline to as high as 15 percent. Automakers in the United States have been accelerating their work with FFV programs, according to the National Ethanol Vehicle Coalition (NEVC), resulting in an expanded fleet of vehicles capable of using blends of fuel ranging up to 85% ethanol and 15% gasoline, or E85. E85 contains significantly more ethanol than E10. Future widespread adoption of FFV’s could significantly increase ethanol demand and reduce the consumption of gasoline; however, widespread use of higher ethanol blends in the United States is currently constrained by the lack of a broad distribution infrastructure and limited availability of FFVs. If more vehicles and service stations become flex-fuel capable, this could act as a significant driver of United States ethanol consumption. While the push for E85 has lost some momentum over the recent year due in large part to financial distress in the United States auto industry, investment in both E85 and blender pumps, and supporting infrastructure, remain strong in some regions. Meanwhile, domestic auto manufacturers have maintained and reaffirmed previous voluntary commitments to increase the number of FFV’s they manufacture by 2012. |
8
Table of Contents
The Case for Cellulosic Ethanol
Of all of the alternative fuels produced biologically or from biomass, known as biofuels, that are sold or are being developed, we believe the most significant market, especially within the next five to ten years, is that for fuel ethanol. Within the fuel ethanol market, we believe the most attractive current or future opportunities for our biofuels business are for fuel ethanol derived from cellulosic (plant) biomass, otherwise known as “cellulosic ethanol.”
Fuel ethanol has historically been produced commercially in the United States by processing sugars derived from the starch within a grain source, such as corn kernels, and then fermenting these sugars into ethanol. Recent studies suggest that, even if all United States corn production were dedicated to ethanol production, this would still not match total domestic gasoline demand. Moreover, critics contend, well before this level of fuel production could be achieved, the rising price of corn would begin to negatively impact the costs of animal feed and food based on corn. This has led to an active, public debate of the relative merits of additional corn-based production of fuel ethanol.
An alternative that seeks to meet the need for additional sources of liquid fuels while addressing many of the challenges presented by corn-based ethanol involves the production of fuel ethanol from cellulosic biomass, or cellulosic ethanol. Cellulosic biomass, either agricultural waste or crop residues, such as plant stalks, stems, or leaves, or crops grown specifically for their energy content rather than for their use as food or feed sources, presents an abundant alternative source of sugars that can be converted into ethanol or other forms of biofuels. Examples of cellulosic biomass suitable for conversion to biofuel include sugarcane bagasse, energy cane, sorghum, switchgrass, wood chips, and corn stover. The production of ethanol from cellulosic biomass offers expected advantages over corn-based ethanol production including:
| • | Low-cost, abundant sources of feedstocks that have no competitive food use—According to a joint report of the Department of Energy, or DOE, and the United States Department of Agriculture, or USDA, issued in 2005, land resources in the United States are capable of producing a sustainable supply of 1.3 billion tons per year of cellulosic biomass. The same report concluded that 1 billion tons of cellulosic biomass would be sufficient to displace 30% or more of the present petroleum consumption in the United States. In addition, according to an analysis by the Natural Resources Defense Council published in 2004, cellulosic biofuels could supply more than half of current transportation fuel needs in the United States by 2050, without decreasing the production of food and animal feed. |
| • | Ability to use lands unsuited to food agriculture—Many biomass crops can be grown on lands that are degraded, fallow or in pasture, in use for low-value agricultural crops, or otherwise unsuited for use in food crop agriculture. The production of biomass crops on such lands can relieve pressure on the diversion of prime agricultural lands, best suited for food production, into production of grain ethanol feedstocks. |
| • | Higher yields per acre: The use of high-biomass crops can result in significantly higher yields of ethanol, on a per-acre basis, than can be achieved using conventional grain ethanol technology. This yield advantage can result in significantly lower total land requirements, and reduce the pressure for conversion of lands into agriculture, a source of considerable controversy in the environmental community. |
| • | Reduced susceptibility to volatile commodity price risks—We believe that most biomass feedstocks can be obtained at lower cost and on more favorable contractual terms compared to the cost of corn feedstock. In addition, many cellulosic feedstocks contain lignin (the high energy component of plant biomass) which could be used to reduce operating costs by eliminating or reducing the use of natural gas and other external fuel sources for process energy. We expect that cellulosic ethanol production will entail much less exposure to market and commodity risks such as volatile prices for corn, natural gas, transportation, and corn by-products. |
9
Table of Contents
| • | Superior carbon emissions profile that benefits the environment—Cellulosic ethanol is expected to produce fewer harmful greenhouse gas emissions than corn ethanol and gasoline. According to a report by Argonne National Laboratory, corn ethanol reduces greenhouse gas by 18% to 29% per vehicle mile traveled as compared to gasoline, while cellulosic ethanol reduces greenhouse gas emissions by approximately 85% per vehicle mile traveled. The US Environmental Protection Agency has likewise concluded that cellulosic ethanol production will yield greenhouse gas savings in excess of 60% as required by law and may, in some cases, yield reductions of more than 100% through the use of perennial grasses that return carbon to the soil. Other advantages of cellulosic ethanol may include realizing additional revenues through the sale of carbon credits given the substantially improved carbon emission profile of cellulosic ethanol. |
| • | Proximity to end-user markets—Cellulosic ethanol production facilities will not need to be located near corn allowing their facilities to be possibly located closer to end-user markets, potentially reducing transportation costs. |
While the cost-effective production of ethanol from cellulosic biomass has historically proven challenging using traditional technologies and methodologies, recent advances in the emerging industrial biotechnology industry relating primarily to the development and application of novel, high-performance enzymes and robust fermentation organisms have provided the industry with powerful new tools to address this objective. To date, there is no process that has been commercialized to make cellulosic ethanol cost-effectively. Nonetheless, a number of companies, academic or government institutions, and other non-profit organizations are actively pursuing one or more aspects of the production process, each seeking to provide economical solutions to enable the development and growth of the cellulosic ethanol market.
Generally speaking, efforts to convert cellulose into ethanol follow one of three main processes:
| • | thermochemical conversion of biomass into synthesis gas or “syngas” (a process often referred to as “gasification”), followed by catalytic conversion of the syngas into mixed alcohols that include ethanol and/or alkalines via modified chemistry; |
| • | thermochemical conversion of biomass into syngas, followed by biological conversion of the syngas into ethanol; or |
| • | enzymatic or chemical breakdown of biomass into component sugars, followed by biological fermentation of the sugars into ethanol. |
We have selected enzymatic breakdown of biomass for producing ethanol from cellulose because we believe it has distinct advantages over the thermochemical/gasification methods. Gasification methods present a number of challenges, including the capital intensity of the process, selectivity of the syngas conversion to ethanol, and alcohol tolerance of the organisms capable of converting syngas to ethanol. Furthermore, we believe that our abilities in enzymology, microbiology and process engineering provide a skill-set and foundation for us to successfully pursue an economically viable process for cellulosic ethanol production through enzymatic breakdown of biomass.
10
Table of Contents
Our Process For Ethanol Production
Our process to produce ethanol from cellulosic material is illustrated below:
Figure 2: Process for Cellulosic Ethanol Production
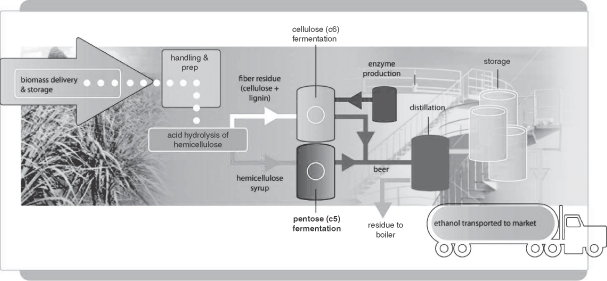
Our process for producing cellulosic ethanol contains the following steps. While several steps are generic to other forms of ethanol production, there are three important steps (steps 4, 5 and 6, below) that we believe are unique to us and are accomplished by us in proprietary ways. The principal steps are as follows:
| 1. | Biomass is delivered to the facility for storage; |
| 2. | Biomass is prepared for processing based on its specific physical and chemical characteristics; |
| 3. | Biomass undergoes mild acid hydrolysis and steam explosion to break down plant matter; |
| 4. | Hemicellulose, in the form of syrup containing xylose and other C5 sugars, is drawn off for processing |
| • | C5 sugars are fermented using our proprietary, engineered E. coli bacterium, yielding a broth containing ethanol, referred to as “beer”; |
| 5. | Residue, in the form of a semi-solid mixture of cellulose and lignin, is sent for further processing |
| • | Cellulose is hydrolyzed into C6 sugars using proprietary enzyme cocktails. C6 sugars are simultaneously fermented using a proprietary engineered bacteria. The C6 fermentation process also yields ethanol referred to as “beer”; |
| 6. | Proprietary enzymes are produced on site which are optimized for a given biomass source to be used in Step 5; |
| 7. | Beer from steps (4) and (5) is collected prior to distillation; |
| 8. | Beer is distilled into high-grade ethanol through the removal of water and residues; |
| 9. | Lignin-rich residue from distillation, or stillage, is burned, yielding steam for the process; and |
| 10. | High-grade ethanol is ready for shipment to market. |
We have employed this process only in small-scale production, including in our laboratories and at our pilot- and demonstration-scale plants in Jennings, Louisiana. We can not guarantee that this process will be effective or efficient for commercial production.
11
Table of Contents
We believe that the following elements of our planned production process will provide us with benefits over existing ethanol production processes:
| • | the ability to process both C5 and C6 sugars results in conversion rates in excess of 70% of the available carbohydrates in biomass material—leading to higher productivity per ton of input than other processes that convert only C6 sugars. We expect that this higher productivity will translate into lower feedstock costs for a targeted level of facility output (see Step 4 above); |
| • | our growth of a proprietary strain of fungus is designed to optimize ethanol production from a given biomass source (see Step 6 above). |
We have an exclusive worldwide license to use, develop and commercially exploit the ethanol production patent estate of the University of Florida Research Foundation, Inc., or UFRFI, numerous United States and foreign patents and patent applications and other related proprietary ethanol technology, and any extensions and improvements thereof for the production of ethanol, all of which is referred to herein as the UFRFI technology.
Our Biofuels Research and Technology
Our patented and proprietary technology and process know-how enable our production of fuel-grade ethanol from low-cost, abundant cellulosic biomass materials, such as agricultural and forestry wastes, dedicated energy crops, and wood. Our technology enables the release and fermentation of sugars in both cellulose and hemicellulose, promoting a high conversion rate of available sugars in a wide range of biomass feedstocks. Competing processes for producing cellulosic ethanol have focused on a single feedstock or only on particular sugars contained in a particular feedstock.
We currently conduct our research activities at our centralized research and development facility in San Diego, as well as at our pilot plant in Jennings, Louisiana. We have successfully conducted laboratory tests on a wide range of feedstocks to produce ethanol including sugar cane bagasse, energy cane, sorghum, corn fiber, sugar beet pulp, citrus pulp and citrus peels, wood wastes, such as saw and pulp mill waste, forestry wastes, such as hardwood and softwood thinnings, rice hulls, rice straw, and corn stover, and urban wastes, such as the paper portion of municipal solid waste and municipal green wastes. We believe our success in laboratory testing of a wide range of feedstocks will provide us the flexibility to utilize an array of feedstocks in our production process. Due to this feedstock flexibility, we believe we will be able to locate facilities in a variety of different geographic markets and, in many cases, closer to end-user markets.
In 2007, we completed a significant upgrade of our cellulosic ethanol pilot plant. We believe that this pilot plant is among the nation’s first pilot-scale cellulosic ethanol plants, and is a key asset of our on-going research and development program, providing us with the opportunity to refine production processes and validate our technology. In 2008, we completed construction of a 1.4 million gallons-per-year (MGY) demonstration plant on the same site, and in February 2009, we completed the commissioning of this facility. Throughout 2009 and into early 2010, we have focused on process and mechanical improvements to optimize the facility and seek to prove the economic and commercial viability of our cellulosic ethanol production process during 2010. We believe our demonstration-scale cellulosic ethanol facility represents one of the first of its kind in the United States. Further, we believe that our combined pilot and demonstration plant facilities will enable us to refine our production processes in advance of building, or partnering with others to build, commercial-scale cellulosic ethanol production facilities. Both the pilot plant and the demonstration plant are located at a site we own in Jennings, Louisiana.
Our Strategic Partnership with BP
We have entered into a strategic partnership with BP to accelerate the development and commercialization of cellulosic ethanol, specifically in the field of conversion of biomass to fermentable sugars for the production, or the use in production, of ethanol. We believe that our strategic partnership with BP is critical to our success in
12
Table of Contents
validating and commercializing our first-generation cellulosic ethanol technology. This strategic collaboration consists of two phases, which are described below and include a technology development joint venture and a commercial development joint venture.
In August 2008, we announced the initial phase of the partnership, which includes a joint technology development effort that utilizes our broad technology platform in an effort to supply enabling technology to support the development of a portfolio of low-cost, environmentally-sound cellulosic ethanol production facilities in the United States, and potentially throughout the world. During the initial 18-month phase of the joint development program, we received a total of $90 million from BP. This joint development program was scheduled to expire on February 1, 2010; however, however, we recently announced two extensions to the initial 18-month term until April 1, 2010, while we continue to negotitate the terms for advancing our cellulosic ethanol technology. In connection with the joint development program, we formed Galaxy Biofuels LLC, or Galaxy, a special purpose entity, which is equally owned by BP and us, and entered into a Joint Development and License Agreement with BP. Our expectations concerning our biofuels business are dependent upon our continued collaboration with BP, the future terms of which we are continuing to negotiate with BP. There can be no assurance that we will successfully conclude these negotiations in manner that is beneficial to the Company or our biofuels business. Galaxy has access to certain intellectual property rights held or controlled by the parties prior to entering the Joint Development and License Agreement, all of which will continue to be owned by the respective contributing company. Galaxy owns new intellectual property relating to cellulosic ethanol production developed through the joint development program and is responsible for administering the licensing of the technology package resulting from the joint development program. Prior to entering into this strategic partnership, we had no material relationship with BP.
We are primarily responsible for executing the joint development program and have agreed with BP that for a limited period we will not use our existing technology in any other technology development program in the defined field, with certain exceptions. The limited period may be extended if the joint development program between the parties is extended. While the primary focus of Galaxy is to encourage the use of the technology package resulting from the joint development program in facilities that are jointly-owned by BP and us in the United States, Galaxy may license the technology and the technology package to us and to BP separately, as well as to third-party commercial projects in the United States and elsewhere.
The financial terms of this phase of the strategic partnership include:
| • | $45 million, payable in three installments, for broad access to our cellulosic ethanol technology platform, production facilities, and employee scientific knowledge and expertise. We received cash payments of $24.5 million at closing, $6.5 million on January 2, 2009, and $14.0 million on July 1, 2009. |
| • | $15 million paid on January 2, 2009 and an additional $2.5 million per month have been paid beginning February 2009 through and including March 2010 to co-fund various scientific and technical initiatives within the cellulosic ethanol field. |
On February 18, 2009, we announced the second phase of our strategic partnership, a joint venture to develop and commercialize cellulosic ethanol from non-food feedstocks. The joint venture company, Vercipia, is owned equally by us and BP. Vercipia will act as the commercial entity for the deployment of cellulosic ethanol technology being developed and proven under our joint development program with BP. This collaboration is intended to progress the development of one of the nation’s first commercial-scale cellulosic ethanol facilities, located in Highlands County, Florida and to create future opportunities for leveraging cellulosic ethanol technologies.
Together, we and BP have agreed to commit a total of $45 million in funding and assets to Highlands, including an aggregate cash commitment of $22.5 million from BP and contribution by us of development assets related to our Highlands County, Florida development project and another commercial project site in early stages of development in the Gulf Coast region. Highlands will be led and supported by a team comprised of employees from both BP and Verenium and will be governed with equal representation from both companies.
13
Table of Contents
Highlands will initially focus on developing and securing financing for the commercial-scale cellulosic ethanol facility in Highlands County, Florida and expects to break ground on that site in 2010. The estimated construction cost for this 36 MGY facility approximately $300 million. We expect the first production of cellulosic ethanol from this plant could begin as early 2012.
Our Biofuels Asset Development, Commercialization and Growth Strategy
With our partner, BP, we expect to be the market leader in the design, development, and operation of cellulosic ethanol production plants using the following strategies:
| • | Commercialization of Technology. Our strategy is to become one of the first and leading domestic producers of cellulosic ethanol. We intend to achieve this first through the successful operation of our pilot and demonstration-scale plants in Jennings, Louisiana. With our commercialization partner BP, we are moving forward with the design, development and plans for construction of the first commercial-scale cellulosic ethanol plant in Highlands County, Florida. |
| • | Project Development and Ownership. We currently intend to develop a pipeline of commercial-scale cellulosic ethanol projects in the United States that we will own and operate, either independently or with strategic partners, such as BP. |
| • | Joint Venture Project Development and Ownership. We currently intend to develop cellulosic ethanol projects in conjunction with partners who may enhance our competitiveness and ability to finance our projects. Our early joint development strategy is focused on projects, developed with BP, under which we intend to engage partners or suppliers who bring key supplies, services, and capabilities to project development such as engineering, construction and operations expertise, as well as feedstocks, sites, on-site biomass boiler facilities or ethanol off-take agreements. |
| • | Worldwide Licensing of Technology. We currently intend to pursue licensing arrangements ourselves and through the Galaxy joint venture with BP, including outside of the United States, to maximize the reach of our technology and increase our market penetration. We expect that these licensing efforts will accelerate after construction of a commercial plant is completed and the technology is proven at that scale. |
| • | Project Financing. Through Vercipia, our joint venture with BP, we intend to employ well-developed project finance structures using a prudent level of non-recourse debt in order to finance our facilities at an optimal cost of capital. We estimate that construction costs for the first commercial plant in Florida will be approximately $300 million. We hope to finance the majority of the cost of the commercial plant with non-recourse project finance debt through a loan guarantee program sponsored by the DOE. Together with BP, in 2009 we submitted a joint application for this loan guarantee, and our application has been selected by the DOE to enter the due diligence phase of the loan guanrantee program. Under the program, the DOE could grant loan guarantees for a substantial portion of the total capital cost of the project. There can be no assurance that we or BP will be successful in obtaining all or a portion of this loan guarantee. |
| • | Management Depth and Industry Expertise. We will continue to augment our management team to maintain deep scientific talent and a full suite of project development skills, including expertise in areas such as agronomics, engineering, finance, and operations. |
Our strategy is based on providing an integrated and proprietary solution for the cellulosic ethanol industry by exploiting our current and expected scientific research, process engineering and optimization, project development, project finance and enterprise risk management skills. We currently intend to utilize three scales of facilities in connection with the production of cellulosic ethanol. After a process for a given feedstock is developed at the laboratory scale, we test this process in our pilot plant, which is run as a research and development facility with components that generally have a capacity of less than 50,000 gallons of ethanol per year. The next stage of development is via a demonstration-scale plant, in which the process developed at the laboratory and the pilot plant is scaled-up to demonstrate the economics of producing cellulosic ethanol using the
14
Table of Contents
relevant feedstock and process at a scale of approximately 1.4 MGY. We intend to build, own, and operate multiple commercial-scale plants utilizing multiple feedstocks/processes throughout the United States and other parts of the world, either independently or with strategic and financial equity partners, including our commercialization partner, BP. Finally, assuming that the economics of producing cellulosic ethanol are adequately demonstrated in a commercial-level facility, we expect that, particularly for regions outside of the United States, we may enter into further licenses and/or strategic partnerships for our licensees and/or partners to deploy our technologies and processes in plants that they will build, own, and operate and from which we would derive royalties, profit-sharing, or other revenues, which we would share with BP through our Galaxy joint venture. Our expectations concerning our biofuels business are dependent upon our continued collaboration with BP, the future terms of which we are continuing to negotiate with BP. There can be no assurance that we will successfully conclude these negotiations in manner that is beneficial to the Company or our biofuels business.
Where possible, plants may be co-located with other industrial facilities to leverage existing infrastructure, thus lowering capital and operating costs while accelerating commercial operation. We intend to develop and optimize the technologies and enzymes for the production of ethanol from biomass using our in-house research and development staff, strategic alliances, mergers and acquisitions, or a combination thereof.
Our planned activities under our commercial joint venture with BP may include executing agreements with strategic partners that may improve the competitiveness and financing attractiveness of our commercial projects. Our early partnering strategy also contemplates projects with strategic partners who bring key supplies or services to project development, such as feedstocks, sites, on-site biomass boiler facilities or ethanol off-take agreements. Industries offering these types of services and supply opportunities include the agriculture, industrial, petroleum refining, and gasoline blending industries, among others. Plants may be built at sites close to dedicated energy crops in order to minimize feedstock transportation costs. Because we believe our technology can accommodate many different feedstocks, and is not dependent upon geographic location or feedstock type, the potential for plant siting is broad and diverse.
We plan to generate economic return from jointly-owned commercial facilities through the sharing of net income generated from each commercial plant with our equity partners. We may also elect to sell a portion of any equity position we have in a commercial facility as a means to fund investments in future commercial facilities, research and development programs, acquisition of technologies, or to fund general working capital, as necessary.
Through our Galaxy joint venture with BP, we may also license our proprietary technology to extend our commercial reach and accelerate our market penetration, both outside the U. S. and domestically. In these instances, we may not pursue an equity interest in such projects, but instead may seek to earn license fees and royalties and fees related to technology transfer and process design. For example, under a technology transfer and license agreement, Marubeni Corp. and Tsukishima Kikai Co., Ltd., or TSK, currently operate a 1.4 million liters-per-year cellulosic ethanol demonstration plant using our proprietary technology in Osaka, Japan. We believe that this Marubeni/TSK plant represents the world’s first plant operating commercially to produce cellulosic ethanol from construction and demolition wood waste. Last year, through our relationship with Marubeni/TSK, construction was completed and operation began at a small scale plant in Sarubeni, Thailand, where our proprietary technology is used to commercially produce cellulosic ethanol from bagasse and molasses.
Our Specialty Enzymes Business
Within our specialty enzymes business, we have identified the following three focus areas in which we have pursued product opportunities either independently or through collaborations and distribution agreements with third parties:
| • | Alternative fuels; |
| • | Specialty industrial processes; and |
| • | Animal nutrition and health. |
15
Table of Contents
Within these three focus areas, we have a combination of (i) enzyme products that either we or one of our partners have commercialized; (ii) enzyme product candidates that either we or one of certain partners are developing; and (iii) research and development programs for the development of additional enzyme product candidates and new or improved products and processes. We plan to pursue strategic partners that would provide the necessary capital to further advance our early-stage programs and products. Through our independent and collaborative research and development programs, we have developed commercial enzyme products across multiple markets. In addition, we have developed a pipeline of enzyme product candidates that we expect to launch independently and/or in collaboration with strategic partners. To date, we have commercialized 18 products, either independently or in collaboration with our partners. The following table lists the key current products in our product portfolio, market applications, our partners, the estimated market size, and the development status of each.
Figure 3. Specialty Enzymes Current Product Portfolio
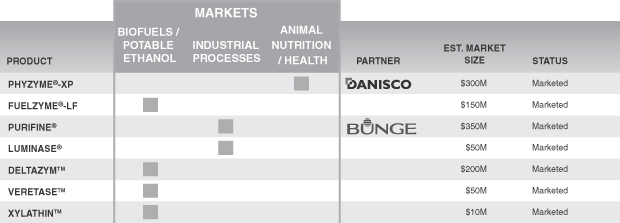
We market our specialty enzymes through a combination of our direct sales force, independent commissioned sales agents, and marketing and distribution agreements with our collaborative partners. Danisco Animal Nutrition, or Danisco, has been our largest customer for the past several years. Danisco accounted for approximately 50%, 53%, and 35% of our total revenue for the years ended December 31, 2009, 2008 and 2007.
Enzymes for Alternative Fuels
We have developed, either independently or through our collaborations, a number of enzyme products and product candidates that may be utilized to convert various sources of starch into sugars that can be used to produce ethanol from grains, commonly referred to as “bioethanol.”
Fuelzyme-LF Enzyme
Fuelzyme—LF enzyme is a next-generation alpha amylase enzyme designed to significantly improve the efficiency and economics of ethanol production from corn and other grain or starch sources. This product dramatically lowers the viscosity of either a grain mash or starch stream and operates at a much higher temperature and at a significantly lower pH than other commercially available enzymes. These enhanced characteristics offer ethanol producers the potential for substantial throughput advantages and cost savings. It works in concert with other enzymes to efficiently convert the starch present in corn and other sources into sugars that can then be processed into ethanol. Ethanol producers have traditionally used other alpha amylase enzymes that do not reduce the mash or starch stream viscosity as efficiently as our enzyme, thus limiting plant capacity. In addition, the conventional alpha amylases operate at a higher pH than downstream fermentation, requiring costly process adjustment (pH reduction with sulfuric acid), whereas Fuelzyme™-LF optimum pH is much closer to that of the fermentation process. We manufacture this enzyme under our agreement with Fermic S.A. de C.V., a U.S. Food and Drug Administration (“FDA”)-approved fermentation and synthesis plant located in Mexico City.
16
Table of Contents
Veretase Enzyme
Veretase enzyme is our next generation alpha amylase which can be used in food applications in the production of potable alcohol, such as vodka or gin, and sugars for sweeteners, such as glucose or high fructose corn syrup, or HFCS. In addition to superior thermostability, we believe the ability of Veretase to perform at low pH is a major advantage in this market. Alpha-amylases for food use and fuel have similar value propositions and market dynamics. We are currently selling Veretase in North America through our grain ethanol sales force, the same team selling Fuelzyme. Veretase is approved by both FDA as Generally Recognized As Safe (“GRAS”) and the Center for Veterinary Medicine (“CVM”) in the U.S., and approved in France for food applications. We estimate that the addressable market for this product is in excess of $50 million per year.
Deltazym Enzyme
Deltazym enzyme is a glucoamylase used in grain ethanol processing, which has been largely commoditized due to the fact that there is little basis for differentiation in its operational characteristics, although it is a necessary component enzyme in grain ethanol processing. We began distributing Deltazym in 2009, enabling us to offer glucoamylase to our Fuelzyme customers, addressing some customer preferences for a single source supplier of enzymes. Our objective for this product is to leverage our existing Fuelzyme salesforce, which should generate distributor margins (15% gross margin), with no incremental sales costs. We estimate that the addressable market for this product is in excess of $200 million per year.
Xylathin Enzyme
Xylathin enzyme is designed to significantly improve the economics of fuel ethanol production from cereal grains. Xylathin breaks down xylan, a compound found in cereal grains such as wheat, rye and barley, and reduces mash viscosity. This fast-acting enzyme is designed to allow producers to shorten retention times and reduce enzyme dose. The main markets for Xylathin are Europe and Canada, which are the largest regions that process wheat into fuel ethanol. We sell Xylathin into Europe through our distribution partner, Add Food Service GmbH. We estimate that the addressable market for this product is in excess of $10 million per year.
Purifine Enzyme for Biodiesel Applications
We announced in October 2006 that Purifine enzyme was approved by the U.S. Environmental Protection Agency (EPA) for non-food applications, thus enabling commercial-scale trials in dedicated biodiesel plants to determine the extent to which Purifine enzyme can improve overall yield of biodiesel fuel from seed oil processing. While we developed our Purifine enzyme primarily for the edible oils market, it is used very early in the vegetable oil refining process, before the point where the refining process differentiates between food and non-food (biodiesel) applications. Our laboratory studies have shown that Purifine enzyme provides significant benefits in the simplified refining processes utilized during preparation of seed oils for biodiesel. These benefits include increased yield, reduced chemical usage, improved operating efficiency, and reduced waste by allowing a higher percentage of the vegetable oil feedstock to be recovered and converted to biodiesel.
Enzymes for Specialty Industrial Processes
Within the area of specialty industrial processes, we have identified a number of opportunities for high-value enzymes to potentially decrease processing time, improve product quality, lower total processing costs, and/or reduce harmful waste streams. In many cases, these enzymes are intended to replace or reduce the use of commodity chemicals that have been traditionally used in the applicable industrial process.
Purifine for Enhanced Processing of Edible Nutritional Oil
Our Purifine enzyme is a novel oil processing enzyme designed to increase the yield of oil from oil seeds, enabling a novel degumming process that converts low-value byproducts (phospholipids) to increased oil yields while reducing the phosphorus content of the oil as required by the oil refining process. The total oil yield increase is expected to vary between 1-2%, depending on the phospholipid content of the crude vegetable oil. The enzyme has been developed to be compatible with current processing technologies, and, therefore, minimal
17
Table of Contents
capital investment is anticipated to be required to obtain the yield benefits that can be achieved with Purifine. Purifine is also expected to minimize chemical usage, improve operating efficiency, and reduce waste by allowing a higher percentage of oil to be recovered from oil seeds economically.
We launched Purifine on a commercial basis in 2007, and have entered into an agreement with Bunge Oils, Inc. whereby we have taken advantage of their process scale-up expertise to develop and validate the Purifine-based degumming process at scale. In addition, we are working with Bunge to develop next-generation enzyme products for vegetable oil processing.
Purifine has been approved in the United States and Europe for both food and industrial uses. In addition, we have obtained approval for use in Argentina and Brazil, both major producers of soybeans. Our first commercial scale implementation of Purifine was at one of Bunge’s refineries in Argentina. Having validated the process commercially, we and Bunge have begun a broader roll out in Latin America. For example, Bunge’s plant in Brazil was designed to run Purifine and is being commissioned at present. In addition to Bunge, the largest soybean crushing and refining facility, Molinos Río de la Plata, has implemented Purifine enzymatic degumming.
To assist in market development and ensure proper engineering design and implementation of process equipment necessary to facilitate enzymatic degumming, during 2009, we teamed with Alfa Laval, a leading engineering firm with a global presence in oilseed processing. We have granted Alfa Laval a non-exclusive license to implement Purifine enzymatic degumming.
We estimate the addressable market for Purifine within the global seed oil processing market to be in excess of $350 million annually.
Luminase for Pulp and Paper Processing
We have developed enzymes to aid in bleaching pulp, that reduce the need to use strong oxidizing chemicals, such as chlorine compounds. These enzymes can reduce the cost of pulp processing both by reducing the amount of oxidizing chemicals required and the expense associated with treating the waste water resulting from the use of these harsh chemicals.
In July 2004, we launched our Luminase PB-100 enzyme for pulp bleaching enhancement, and in 2006, we began marketing an additional product under the Luminase line of enzymes, Luminase PB-200 enzyme, for higher temperature processes. These products improve the response of pulp fiber to bleaching chemicals, which can reduce the need for harsh bleaching chemicals or enable the customer to make whiter pulp for new products. Decreasing bleach chemicals lowers costs and offers a potential environmental benefit by reducing the amount of waste material requiring removal from pulp mill effluent. In mills, both Luminase PB-100 enzyme and Luminase PB-200 enzyme have outperformed competitive products, demonstrating bleach chemical cost savings of up to 20%. Additionally, Luminase enzymes may produce whiter pulp, potentially extending a customer’s market to new products.
Specialty Enzymes for Animal Nutrition and Health
Animal Feed Additives to Enhance Animal Nutrition
Animal feed additives are designed to increase absorption of essential vitamins and minerals, increase nutritional value and animal product yield, and reduce harmful materials in animal waste. We are developing several classes of enzymes, including phytases and carbohydrases, for the increased absorption of organic phosphorous and digestibility of carbohydrates, as well as the promotion of weight gain in livestock.
When used as an additive in animal feed applications, phytase enzymes allow higher utilization of naturally occurring phosphorus from the feed, thereby increasing its nutritional value and reducing phosphate pollution.
18
Table of Contents
We estimate that the worldwide market for phytase enzymes is more than $300 million per year, and growing at more than 5% per year. Recent estimated growth in the worldwide market for phytase enzymes has been driven by economics as well as regulatory pressure to decrease pollution caused by the phosphate-rich waste from swine and poultry farms that is a leading cause of water pollution. We have one commercial phytase product to address this market, and have two additional products under development.
| • | Phyzyme XP |
In March 2003, Danisco Animal Nutrition launched Phyzyme XP, which was a result of a research collaboration between our companies. The addition of Phyzyme XP to animal feed has been shown to reduce the need for inorganic phosphorus supplementation by approximately 20% and lower the level of harmful phosphates that are introduced to the environment through animal waste by approximately 30%, resulting in inorganic phosphate cost savings and a significant reduction in environmental pollution. We are responsible for manufacturing Phyzyme XP, and Danisco is responsible for its sales and marketing.
Specialty Enzyme Products in Development
As more fully described on page 21 of this annual report on Form 10-K, in late 2009 we concluded our research collaboration with Syngenta. In connection with this settlement, we received exclusive microbial rights to an array of proprietary molecules expressed microbially and through other non-plant means such as algae, providing a strong foundation for several pipeline initiatives intended to serve multiple markets, including animal feed, biofuels, pulp and paper, and baking. As a result of our agreement with Syngenta, we have a pipeline of nine potential product candidates in various stages of development which we believe could be commercialized within the next two to five years, including the following late-stage enzyme development candidates:
| • | Alpha amylases and glucoamylases for starch processing in biofuels production |
| • | Xylanases, beta-glucanases and phytases for use in animal feed |
Our Strategic Partnerships
Our strategy includes pursuing strategic collaborations with market leaders in our target markets. In exchange for selected rights to our technologies, current and future products, these strategic alliances provide us funding and resources to develop and commercialize a larger product portfolio. In various instances, these strategic alliances allow us to leverage our partners’ established brand recognition, global market presence, established sales and distribution channels, and other industry-specific expertise. The key components of the commercial terms of such arrangements typically include some combination of the following types of fees: exclusivity fees, technology access fees, technology development fees and research support payments, as well as milestone payments, license or commercialization fees, and royalties or profit sharing from the commercialization of any products that result from the alliance. As of December 31, 2009 our strategic partners, including BP, have provided us with more than $375 million in funding since inception, including $22.7 million from various government agencies, and are committed to additional funding of more than $14.8 million through 2012, subject to our performance under existing agreements, excluding milestone payments, license and commercialization fees, and royalties or profit sharing. Our committed funding includes $7.5 million from our Vercipia joint venture with BP, announced in February 2009, which is to be paid during the first quarter 2010. Vercipia operates as a separate commercial entity, with the $7.5 million in committed BP funding used solely for this entity. All activities and expectations for Vercipia are expressly conditioned upon our continued collaboration with BP, the future terms of which we are continuing to negotiate with BP. There can be no assurance that we will successfully conclude these negotiations in manner that is beneficial to the Company or our biofuels business.
19
Table of Contents
Our significant strategic partnerships include the following:
Biofuels
BP
As more fully described on page 12 and 13 of this annual report on Form 10-K, we have a two-phase strategic partnership with BP focused on the development and commercialization of cellulosic ethanol technology.
United States Department of Energy (DOE)
On July 14, 2008, the we announced that we had been awarded a grant from the DOE under a $40 million program to support the development of small-scale cellulosic ethanol biorefinery plants. The total award allocated to us under the program of $10.0 million will be used towards scaling and validating our cellulosic technology for commercialization at the demonstration-scale facility in Jennings, Louisiana.
In February 2008, we were awarded a $8.5 million grant for the development of improved enzyme systems to be used in converting biomass into clean, renewable cellulosic ethanol. The grants are being appropriated over a four-year period beginning in 2008 and expiring in 2011. Under this grant, we are leveraging our proprietary library of enzymes and DirectEvolution technology to develop and optimize more robust and cost-effective enzymes to breakdown biomass.
In March, 2007, we were selected as one of five recipients of a DOE project focused on developing highly efficient fermentative organisms to convert biomass material to ethanol. With the grant, we continue to advance the ethanologen platform licensed from the University of Florida. Further development of the fermentation organisms is focused on optimizing the ability to ferment sugars produced from a wide variety of feedstocks and to increase robustness in a commercial-scale fermentation process, while simultaneously reducing costs and increasing product yields.
Specialty Enzymes
Bunge Oils
In February 2006, we entered into an agreement with Bunge Oils, Inc., a part of Bunge North America, to discover and develop novel enzymes optimized for the production of edible oil products with enhanced nutritional or health benefits. Under the terms of the agreement, we are responsible for discovering, optimizing, and manufacturing enzymes, and Bunge is responsible for commercializing oils using new enzyme-enabled processes. We received an upfront technology access fee and receive full research funding for our enzyme discovery and development activities under the project. Further, we are also eligible to receive milestone payments for successful enzyme development activities as well as royalties on any products that are commercialized.
In November 2007, we entered into an agreement with Bunge Oils to promote the commercialization of Purifine and the product development and commercialization of next-generation enzyme products for seed oil processing. Pursuant to the agreement, Bunge contributes process scale-up expertise for the development of the Purifine degumming process at plant scale. In addition, Bunge contributes to the funding of R&D projects to develop next generation enzyme products for seed oil processing. Bunge and we will also share profits on sales of Purifine enzyme.
20
Table of Contents
Syngenta
In addition to research collaborations we entered into in 1999 and 2003 with affiliates of Syngenta AG, a related party, in December 2006, we entered into a license and research agreement to supersede and replace the aforementioned research collaborations. This license and research agreement was focused on the discovery and development of a range of novel enzymes to economically convert pre-treated cellulosic biomass to mixed sugars—a critical step in the process of biofuel production. This license and research agreement allowed us to independently develop and commercialize fermentation-based enzyme combinations from our proprietary platform, and to pursue opportunities for the integrated commercialization of biofuels. Syngenta had exclusive access to enzymes from our platform to express in plants for enhanced cost-effective production, in addition to certain rights to develop a combination of transgenically-expressed enzymes and enzymes expressed via fermentation as part of so-called “mixed delivery” enzyme cocktails. Under the terms of the agreement, Syngenta agreed to provide us guaranteed research funding of a minimum of $8 million in each of 2007 and 2008.
In November 2009, we announced the successful closure of our previously defined programs under our joint research program with Syngenta. In connection with the completion of these programs, we executed a settlement agreement whereby we obtained additional exclusive rights to an array of proprietary biomolecules expressed microbially, as well as non-exclusive rights to the same biomolecules expressed through non-plant and non-microbial means. Under the terms of the agreement, Syngenta will retain exclusive rights to the biomolecules expressed in plants, as well as nonexclusive rights to the same biomolecules expressed through non-plant and non-microbial means.
We did not receive continued funding from Syngenta in 2009. Revenue recognized under the Syngenta agreements was $0.7 million, $9.4 million and $12.7 million for the years ended December 31, 2009, 2008, and 2007.
Cargill Health and Food Technologies
In 2005, we signed a collaboration agreement with Cargill Health and Food Technologies to discover and develop novel enzymes for the cost-effective production of a proprietary Cargill product involving multiple enzyme steps, and in 2006, this collaboration agreement was expanded to include additional enzymes beyond the initial targeted set. In 2007, this agreement was further extended through May 2008. Under the terms of the agreement, we received upfront payments and research funding, and we are entitled to receive milestone payments, license fees, and royalties on products that may be developed under the agreement. In May 2008, Cargill exercised an early option to license one of the enzymes under the agreement.
BASF
In 2001, we entered into a collaboration agreement with BASF AG to develop biocatalytic enzymes. In 2003, BASF licensed a proprietary enzyme for the biocatalytic synthesis of a chiral pharmaceutical intermediate as a result of the collaboration. Under the terms of the license, we received a license fee and became entitled to receive royalties based on the sale and/or production of the intermediate produced using the biocatalytic enzyme. In 2006, we expanded our relationship with BASF by entering into a master collaboration agreement under which we are responsible for the discovery and optimization of new enzymes, and BASF is responsible for process and product development and commercialization. Under the 2006 collaboration agreement, we have received technology access fees and research support payments, and are entitled to receive milestone payments and royalties based on sales of products resulting from the collaboration.
21
Table of Contents
Our Enabling Platform—Research and Development
Technologies and Advantages
Traditional Approaches and Their Limitations
Enzymes have been shown to catalyze thousands of individual chemical reactions. Nearly all of the currently characterized enzymes have been isolated from organisms that were cultured in the laboratory, representing only a small percentage of the billions of species believed to exist. The reasons for this include:
| • | Less than 1% of microbial species will ordinarily grow under standard laboratory conditions; |
| • | Enzymes and other bioactive molecules may only be produced at specific times during growth or under specific conditions not present in the lab; and |
| • | Even when enzymes are found, recovery of the corresponding genes can be difficult. |
Accordingly, biodiversity remains largely untapped.
Once an enzyme of interest is discovered from a microbial sample, the genetic sequence of the gene encoding it can be studied, and genetic variation can be introduced in an attempt to modify its function through a process of test tube evolution. Genetic variation is generated predominantly by two methods: mutation and recombination. Mutation is the introduction of changes into a gene. Mutation can be achieved by several methods, including forcing the DNA to replicate in a manner that intentionally causes random changes. Recombination, or shuffling, the other method for producing genetic variation, is the mixing of two or more related genes to form hybrids. However, the generation of improved variants has, to date, been inefficient and laborious, or has allowed only closely related genes to be recombined.
Once a desired gene is found and optimized, commercial production requires insertion of the gene into a production system or host. Almost all of the current commercial enzymes used in industrial applications today were derived from cultured microorganisms and produced in these or similar organisms referred to as homologous expression. However, genes encoding unique biomolecules may not be able to be expressed and commercially produced in traditional systems. Thus, traditional methods present both the problem of novel biomolecule identification and the challenge of commercial production of any identified biomolecules.
Biodiversity Access
Our discovery program begins with access to biodiversity. Biodiversity can be defined as the total variety of life on earth, including genes, species, ecosystems, and the complex interactions between them. We have collected microbial samples from numerous types of ecosystems represented on earth, including such environments as geothermal and hydrothermal vents, acidic soils and boiling mud pots, alkaline springs, marine and freshwater sediments, savanna grasslands, rainforests, montane and subalpine landscapes, industrial sites, arctic tundra, and dry Antarctic valleys. We have also sampled microbial communities living in close association with insects, arachnids, and nematodes, as well as the symbionts residing within marine sponges, soft corals and termites. All of our samples from the countries within our biodiversity access network have been acquired through agreements that permit broad access to biologically diverse environments within such countries. These agreements are generally with domestic land management agencies and scientific research institutions associated with appropriate government agencies. Our relationships have been founded on the fundamental principles of the Convention on Biological Diversity: (1) conservation of biological diversity; (2) the sustainable use of its resources; and (3) the fair and equitable sharing of the benefits derived from the utilization of genetic resources.
We believe our ability to create highly representative libraries using minute samples of genetic material collected from diverse environments is an important factor to our success. Our need to use only small environmental samples results in minimal impact to the surrounding ecosystem, enabling us to enter into formal genetic resource access agreements. To date, we have obtained samples under various access agreements from
22
Table of Contents
Alaska, Antarctica, Australia, Bermuda, Costa Rica, Ghana, Hawaii, Iceland, Indonesia, Kenya, Mexico, the Meadowlands Superfund site, Puerto Rico, Russia, the San Diego Zoological Society, South Africa, and Yellowstone National Park. We have also accessed marine and terrestrial samples from Antarctica, as well as deep-sea hydrothermal vents off the shores of Costa Rica and the Pacific Northwest.
Screening
We have developed an array of automated, ultra high-throughput screening technologies and enrichment strategies. Our proprietary rapid screening capabilities are designed to discover novel biomolecules by screening for biological activity, known as expression-based screening, as well as by identifying specific DNA sequences of interest, known as sequence-based screening.
We have developed numerous assays capable of expression-based screening from thousands to over 1 billion clones per day. Our key screening technologies include SingleCell screening and high-throughput robotic-based screening. Our ultra high-throughput SingleCell screening system uses Fluorescence Activated Cell Sorting, or FACS, a third-party technology that enables the rapid identification of biological activity within a single cell or individual organism. Our SingleCell screens have been developed to identify clones based on activity or DNA sequences. This system incorporates a laser with multiple wavelength capabilities and the ability to screen up to 50,000 clones per second, or over 1 billion clones per day. Our robotic screening systems use high-density (up to 1536 wells) microtiter plates and are capable of screening and characterizing over 1 million clones per day. If the clone expresses an activity or contains a DNA sequence of interest, we isolate it for further analysis.
Our GigaMatrix platform permits rapid screening of genes and gene pathways, and has increased the productivity of our discovery programs for products such as novel enzymes. The GigaMatrix technology greatly expands the amount of molecular diversity that can be screened to discover products. The platform also dramatically reduces equipment and operator time through massively parallel dispensing and reading of biological samples. The GigaMatrix plates, with wells each about the diameter of a human hair, are reusable and require only miniscule volumes of reagents, making them highly cost effective.
Because we have conducted extensive activity-based screening and cataloged thousands of unique genes and their sequences, we are able to use unique signatures within these gene sequences with known function to identify the function of genes in public databases based on their sequences. These newly identified sequences are then added to the repertoire of proprietary sequences in our own database. As more microbial genomes are sequenced, our ability to associate gene sequence with enzyme function has been enhanced significantly. This sequence database provides us with opportunities to identify more sequences with similar function and the potential to modify these sequences in order to create optimized catalysts and other biomolecules for various commercial applications.
Our DirectEvolution Technologies
The genetic code is structured such that a sequence of three nucleotides defines an amino acid. Nature uses 20 common amino acids in proteins arranged in a sequence, defining the protein structure and activity. Over the course of almost 4 billion years of evolution, nature has sampled countless sequence possibilities to evolve proteins to function optimally within the cell. However, when a protein is removed from its natural cellular environment and used to perform reactions, such as an enzyme used to catalyze a chemical process, its function may not be optimal. Laboratory methods can accelerate the evolutionary process of optimization outside of the cell by creating a large number of variants for screening. In the traditional method for improving proteins, called site-directed mutation, a single site is typically targeted for change based on prior knowledge of the protein structure. Other traditional techniques, including random mutation, typically produce single nucleotide changes which can only access a limited number of alternative amino acids, typically fewer than three of the possible 19 alternatives. These methods are limited by their inability to produce all DNA and amino acid sequence variations. Furthermore, the large number of resulting sequences presents formidable screening challenges.
23
Table of Contents
We believe our techniques overcome the limitations of these traditional methods, not only because of our superior screening capabilities, but also by increasing the number and types of sequence variations we can create. Our evolution technologies used to modify the DNA sequence of the genes, our DirectEvolution technologies, include Gene Site Saturation Mutagenesis, or GSSM, and Tunable GeneReassembly. Our GSSM technology is a patented method of creating a family of related genes that all differ from a parent gene by at least a single amino acid change at a defined position. The family of variant genes created using GSSM is then available to be screened for proteins with improved qualities, such as increased ability to work at high temperature, increased reaction rate, resistance to deactivating chemicals, or other properties important in a chemical process. Individual changes in the gene that cause improvements can then be combined to create a single highly improved version of the protein.
In addition to altering single genes using our GSSM technique, we use our Tunable GeneReassembly technology for the reassembly of related or unrelated genes from two or more different species or strains. Our Tunable GeneReassembly technology recombines multiple genes to create a large population of new gene variants. The new genes created by Tunable GeneReassembly are then screened for one or more desired characteristics. This evolutionary process can be repeated on reassembled genes until new genes expressing the desired properties are identified. Tunable GeneReassembly technologies can be used to evolve properties which are coded for by single or multiple genes. We have received more than 20 patents worldwide for our broad portfolio of proprietary processes for evolution, from gene shuffling based on interrupted DNA synthesis, to Tunable GeneReassembly, GSSM, and a number of additional evolution technologies. We believe that the ability to selectively apply our GSSM and Tunable GeneReassembly technologies to optimize enzymes provides us with a distinct competitive advantage over competing technologies. In one program, we have used this technology to improve enzyme stability by a factor of 30,000.
High-Throughput Culturing Platform (HTC)
HTC provides access to previously uncultured microorganisms by creating nano-environments similar to those encountered in natural habitats. The specific technology and an extensive report on its findings have been published in the Proceedings of the National Academy of Sciences. Using HTC, novel isolates can be cultured and assayed for biological activities of interests in a high-throughput manner.
Government Grants and Contracts
To date we have received grant contracts for more than $40 million in funding from a number of government agencies, including the United States Department of Defense, the DOE, and the National Institutes of Health. Revenue related to government grants and contracts was $16.8 million, $6.9 million and $2.7 million for the years ended December 31, 2009, 2008, and 2007. As of December 31, 2009, we had approximately $12.7 million in funding committed from various government agencies through 2012.
Manufacturing, Supply, and Distribution Agreements
Biofuels
Due to the early-stage nature of our biofuels business, we do not currently have any significant manufacturing, supply and distribution agreements in our biofuels segment.
Specialty Enzymes
Danisco Animal Nutrition
In May 1996, we entered into a collaboration agreement with Danisco Animal Nutrition (formerly Finnfeeds International Ltd) to jointly identify and develop a novel phytase enzyme that when used as an additive in animal feed applications allows higher utilization of phytic acid phosphates from the feed, thereby increasing its
24
Table of Contents
nutritional value. The addition of phytase to animal feed reduces the need for inorganic phosphorus supplementation and lowers the level of harmful phosphates that are introduced to the environment through animal waste, resulting in inorganic phosphate cost savings and a significant reduction in environmental pollution. Following the completion of the initial objectives of our agreement with Danisco, in December 1998, we entered into a license agreement with Danisco to commercialize an enzyme developed under the collaboration agreement. Under the terms of the license agreement, we granted Danisco an exclusive license to manufacture, use, and sell the developed enzyme. In consideration for the license, we are paid a royalty on related product sales made by Danisco equal to 50% of the operating profits generated by Danisco on such sales. In March 2003, the FDA approved Phyzyme XP Animal Feed Enzyme, which we developed in collaboration with Danisco. In October 2006, Danisco announced that the European Union, or EU, Commission had granted approval for the use of Phyzyme XP in broiler chicken feeds. Additionally, we entered into a manufacturing agreement with Danisco to supply commercial quantities of Phyzyme XP at our cost to manufacture such quantities.
License or Other Acquisition Agreements
Biofuels
Marubeni Corporation and Tsukishima Kikai Co., Ltd
In July 2001, we signed a Joint Development and Technology Transfer Agreement with the Marubeni Corporation and Tsukishima Kikai Co., Ltd., or TSK. Our technology transfer agreement with Marubeni and TSK covers certain markets in Japan, Malaysia, Thailand, and Indonesia. Under this agreement, Marubeni, TSK, and their partners have built a 1.4 million liters-per-year cellulosic ethanol production facility which is currently in start-up and commissioning, and which we believe will be the world’s first plant operating commercially that will produce cellulosic ethanol from construction and demolition wood waste. This plant, in Osaka, Japan, is expected to be expanded later to produce 4 million liters-per-year of cellulosic ethanol per year. In addition, through our partnership with Marubeni, construction was completed and operation began at a small scale plant in Sarubeni, Thailand, where our proprietary technology is used to commercially produce cellulosic ethanol from bagasse and molasses.
University of Florida Research Foundation, Inc. (UFRFI)
UFRFI has granted us an exclusive worldwide license, or the UFRFI license, to use, develop and commercially exploit the UFRFI technology and any extensions and improvements of the technology for the production of ethanol. The UFRFI license expires on the later of October 2015 or the expiration of the last patent related to the UFRFI technology. Based on the latest to expire of the granted United States patents, the UFRFI license will extend into 2022. Pending and future patent applications related to the UFRFI technology, if granted, would extend the expiration date of the UFRFI license beyond 2026.
Specialty Enzymes
In addition to our strategic alliances, during the normal course of business we have entered into various agreements whereby we have in-licensed or otherwise acquired patented technologies to supplement our internally developed technologies, none of which we consider individually significant or material to our specialty enzyme business.
Competition
Biofuels
The United States ethanol market is highly competitive as well as highly fragmented. According to the Renewable Fuels Association, or the RFA, the United States ethanol industry trade association, world ethanol production was estimated at more than 19. billion gallons in 2009, of which more than 10 billion gallons was
25
Table of Contents
produced in the United States. The United States and Brazil are the world’s largest producers of ethanol. The ethanol industry in the United States consists of more than 175 production facilities and is primarily corn-based, while Brazilian ethanol production is primarily from sugar cane.
In addition to corn ethanol producers, we expect to compete with other cellulosic ethanol producers using different technology platforms, as well as other providers of alternative and renewable fuels. Companies with announced pilot plant and/or demonstration plant development activities in the cellulosic ethanol space include Abengoa, BlueFire, Genencor, Iogen, Losonoco, Mascoma, Range Fuels, and Xethanol. Larger industrial companies with announced cellulosic strategies include Archer Daniels Midland, DONG Energy (Elsam), DuPont/Broin, Tate & Lyle, and Novozymes. Cellulosic gasification technologies are being pursued by companies including ClearFuels and BRI-Infinium.
Some or all of these competitors or other competitors, as well as academic, research and government institutions, are developing or may develop technologies for, and are competing or may compete with us in, the production of ethanol from cellulosic biomass or other feedstocks, such as municipal or construction waste, production of cellulosic ethanol or other fuels employing different steps within the production process, such as acid hydrolysis and/or gasification, and/or the production of other alternative fuels or biofuels, such as biobutanol. As a result, our competitors may be able to develop competing and/or superior technologies and processes, and compete more aggressively and sustain that competition over a longer period of time than we could.
Specialty Enzymes
We are a leader in the field of biomolecule discovery and optimization from biodiversity. We are not aware of another company that has the scope and integration of technologies and processes that we have. There are, however, a number of competitors who are competent in various steps throughout our technology process. In addition, many of our potential competitors in these markets have substantially greater financial, technical, and marketing resources than we do and may succeed in developing products that would render our products or those of our strategic partners obsolete or noncompetitive. In addition, many of these competitors have significantly greater experience than we do in their respective fields. Our ability to compete successfully will depend on our ability to develop proprietary products that reach the market in a timely manner and are technologically superior to, and/or are less expensive than, other products on the market. Current competitors or other companies may develop technologies and products that are more effective than ours. Our technologies and products may be rendered obsolete or uneconomical by technological advances or entirely different approaches developed by one or more of our competitors. The existing approaches of our competitors or new approaches or technology developed by our competitors may be more effective than those developed by us.
Any enzyme products that we develop will compete in multiple, highly competitive markets. For example, Codexis, Maxygen, Inc., Evotec, and Xencor have alternative evolution technologies. Integrated Genomics Inc., Myriad Genetics, Inc., and ArQule, Inc. perform screening, sequencing, and/or bioinformatics services. Novozymes A/S and Genencor International Inc. are involved in development, overexpression, fermentation, and purification of enzymes. There are also a number of academic institutions involved in various phases of our technology process. Many of these competitors have significantly greater financial and human resources than we do. We believe that the principal competitive factors in our market are access to genetic material, technological experience and expertise, and proprietary position. We believe that we compete favorably with respect to the foregoing factors.
Manufacturing Strategy
Biofuels
Please refer to the previous description of our biofuels planned production and commercialization and growth strategies on page 13 through 15 of this annual report on Form 10-K.
26
Table of Contents
Specialty Enzymes
Our specialty enzyme manufacturing strategy is to secure contract manufacturing relationships with qualified third parties possessing sufficient fermentation capacity to meet our commercial production requirements. We add supplemental equipment as required for our specific products, and we deploy our technical personnel on site at contract manufacturing facilities as needed to supervise production of our products. Our employees have experience in scale-up and production of industrial enzymes. We have cleared regulatory requirements for our commercial enzymes, and we are producing these products at commercial under a manufacturing services agreement with Fermic, S.A. de C.V., or Fermic. Fermic manufactures products for our sales in addition to products produced under supply agreements for partners. We have our own pilot development facility in San Diego, CA that is used for developing new products and processes, providing developmental quantities of products for internal and external use, and for producing commercial quantities of smaller-scale specialty products. We will continue to depend on contractual arrangements with third parties to provide the bulk of the capital infrastructure required for large-scale commercial manufacturing.
During 2002, we entered into a manufacturing services agreement with Fermic, a United States Food and Drug Administration-approved fermentation and synthesis plant located in Mexico City, to provide us with the capacity to produce commercial quantities of certain enzyme products. Based on actual and projected increased product requirements, the agreement was amended in 2004 to provide for additional capacity to be installed over the succeeding four-year period. The agreement was further modified in 2006 to adjust for certain cost increases, and to provide extended timeframes for installing incremental capacity. Under the terms of the agreement, under limited circumstances we can cancel the committed purchases with thirty months’ notice. Pursuant to our agreement with Fermic, we are also obligated to reimburse monthly costs related to manufacturing activities. These costs scale up as our projected manufacturing volume increases. As of December 31, 2009, under this agreement we have made minimum purchase commitments to Fermic of approximately $35.9 million over the next three years. In addition, under the terms of the agreement, we are required to purchase certain equipment required for fermentation and downstream processing of our products. Through December 31, 2009, we had incurred costs of approximately $20.9 million for equipment related to this agreement. During 2010, we anticipate spending as much as $2.5 million in additional equipment costs related to the manufacturing agreement. As we continue to develop our commercial manufacturing platforms, we will be required to purchase additional capital equipment under this agreement.
Fermic and Genencor are currently our only two suppliers for commercial-scale enzymes. We do not currently depend on any single supplier for the raw materials necessary for the operation of our business.
Government Regulation and Environmental Matters
Biofuels
We are and will be upon completion of our ethanol production facilities, subject to various federal, state and local environmental and other laws and regulations, including, but not limited to, those relating to the discharge of materials into the air, water and ground, the generation, storage, handling, use, transportation and disposal of hazardous materials and the health and safety of our employees. Some of these laws and regulations can require expensive pollution control equipment or operational changes in order to limit actual or potential impacts to the environment. Violation of these laws and regulations or permit conditions can result in substantial fines, natural resource damage claims, criminal sanctions, permit revocations and facility shutdowns. We do not anticipate a material adverse impact on our business or financial condition as a result of our efforts to comply with these requirements.
There is a risk of liability for the investigation and cleanup of environmental contamination at each of the properties we own or operate and at off-site locations where we arrange for the disposal of hazardous substances. If these substances have been or are disposed of or released at sites that undergo investigation or remediation by regulatory agencies, we may be responsible under the Comprehensive Environmental Response, Compensation,
27
Table of Contents
and Liability Act, or CERCLA, or other environmental laws, for all or part of the costs of investigation or remediation and for damage to natural resources. We also may be subject to related claims by private parties alleging property damage and personal injury due to exposure to hazardous or other materials at or from these properties. Some of these matters may require us to expend significant amounts for investigation and/or cleanup or other costs. We currently do not have material environmental liabilities relating to contamination at or from our facilities or at off-site locations where we have transported or arranged for the disposal of hazardous substances.
In addition, new laws, new interpretations of existing laws, increased governmental enforcement of environmental laws or other developments could require us to make additional significant expenditures. Continued government and public emphasis on environmental issues can be expected to result in increased future investments for environmental controls at our ongoing operations. Present and future environmental laws and regulations and related interpretations applicable to our operations, more vigorous enforcement policies and discovery of currently unknown conditions may require substantial capital and other expenditures.
The hazards and risks associated with producing and transporting our products, such as fires, natural disasters, explosions, abnormal pressures, blowouts and pipeline ruptures, also may result in personal injury claims or damage to property and third parties. As protection against operating hazards, we maintain insurance coverage against some, but not all, potential losses. Our coverage includes physical damage to assets, employer’s liability, comprehensive general liability, automobile liability and workers’ compensation. We believe that our insurance is adequate and customary for our industry, but losses could occur for uninsurable or uninsured risks or in amounts in excess of existing insurance coverage. We currently do not have pending material claims for damages or liability to third parties relating to the hazards or risks of our business.
Specialty Enzymes
All of our products to date have applications other than as regulated drug products. Non-drug biologically derived products are regulated in the United States based on their application, by either the United States Food and Drug Administration, or FDA, the Environmental Protection Agency, or EPA, or, in the case of plants and animals, the United States Department of Agriculture, or USDA. In addition to regulating drugs, the FDA also regulates food and food additives, feed and feed additives, and GRAS (Generally Recognized As Safe) substances used in the processing of food. The EPA regulates biologically derived chemicals not within the FDA’s jurisdiction. Although the food and industrial regulatory process can vary significantly in time and expense from application to application, the timelines generally are shorter in duration than the drug regulatory process.
The European regulatory process for these classes of biologically derived products has undergone significant change in the recent past, as the EU attempts to replace country by country regulatory procedures with a consistent EU regulatory standard in each case. Some country-by-country regulatory oversight remains. Most other regions of the world generally accept either a United States or a European clearance together with a filing of associated data and information for their review of a new biologically derived product.
In the United States, transgenic agricultural products may be reviewed by the FDA, EPA, and USDA, depending on the plant and the trait engineered into it. The regulatory process for these agricultural products can take up to five years of field testing under USDA oversight, and up to another two years for applicable agencies to complete their reviews.
Outside of the United States, scientifically-based standards, guidelines and recommendations pertinent to transgenic and other products intended for the international marketplace are being developed by, among others, the representatives of national governments within the jurisdiction of the standard-setting bodies, including Codex Alimentarius, the International Plant Protection Convention, and the Office des International Epizooties. The use of the existing standard-setting bodies to address concerns about products of biotechnology is intended to harmonize risk-assessment methodologies and evaluation of specific products or classes of products.
28
Table of Contents
In the future we may be subject to additional laws, regulations, policies, approvals and the like of federal, state, local, municipal, foreign and other bodies.
Proprietary Rights
Our intellectual property consists of patents, copyrights, trade secrets, know-how, and trademarks. Protection of our intellectual property is a strategic priority for our business. Our ability to compete effectively depends in large part on our ability to obtain patents for our technologies and products, to maintain trade secrets, to operate without infringing the rights of others, and to prevent others from infringing on our proprietary rights. As of December 31, 2009, we owned more than 260 issued patents relating to our technologies and had more than 380 patents pending. In addition, as of December 31, 2009, we had in-licensed over more than 100 patents or patent applications that we believe strengthen our patent position.
We also rely on trade secrets, technical know-how, and continuing invention to develop and maintain our competitive position. We have taken security measures to protect our trade secrets, proprietary know-how and technologies, and confidential data and continue to explore further methods of protection. Our policy is to execute confidentiality agreements with our employees and consultants upon the commencement of an employment or consulting arrangement with us. These agreements generally require that all confidential information developed or made known to the individual by us during the course of the individual’s relationship with us be kept confidential and not disclosed to third parties. These agreements also generally provide that inventions conceived by the individual in the course of rendering services to us shall be our exclusive property.
Our intellectual property rights may be challenged by others. For example, in February 2007, an interference proceeding was declared in the United States Patent and Trademark Office between a United States patent assigned to us and a pending United States patent application owned by another party, with allowable claims directed to our GeneReassembly technology. On February 25, 2008 the Board of Patent Appeals and Interferences ruled against us and the claims in our issued patent were cancelled.
We may also become involved in disputes as to whether we infringe the intellectual property rights of others. We cannot assure you, that if we are sued on any patent we would prevail. If we become involved in such a dispute, we may be exposed to a significant damage award and/or injunction that could have a material adverse effect on our business.
Employees
As of December 31, 2009, we had 270 full-time employees, 27 of whom held Ph.D. degrees. Of these employees, 119 were engaged in research and development, 10 were engaged in commercial development, 52 were engaged in our demonstration-scale and pilot plant facilities and 75 were engaged in selling, general and administrative activities. None of our employees is represented by a labor union or covered by collective bargaining agreements. We have not experienced any work stoppages and consider our employee relations to be good.
Investor Information
Financial and other information about us is available on our website (http://www.verenium.com). We make available on our website, free of charge, copies of our annual report on Form 10-K, quarterly reports on Form 10-Q, current reports on Form 8-K, and amendments to those reports filed or furnished pursuant to Section 13(a) or 15(d) of the Securities Exchange Act of 1934 as soon as reasonably practicable after we file such material electronically or otherwise furnish it to the Securities and Exchange Commission. The content on any website referred to in this annual report on Form 10-K is not incoroporated herein by reference unless expressly noted.
29
Table of Contents
| ITEM | 1A. RISK FACTORS. |
Except for the historical information contained herein, this annual report on Form 10-K contains forward-looking statements that involve risks and uncertainties. Our actual results may differ materially from those discussed here. Factors that could cause or contribute to differences in our actual results include those discussed in the following section, as well as those discussed in Part II, Item 7 entitled “Management’s Discussion and Analysis of Financial Condition and Results of Operations” and elsewhere throughout this annual report on Form 10-K. You should consider carefully the following risk factors, together with all of the other information included in this annual report on Form 10-K. Each of these risk factors could adversely affect our business, operating results, and financial condition, as well as adversely affect the value of an investment in our common stock.
Risks Applicable to Our Business Generally
We will need additional capital in the future. If additional capital is not available, we may have to curtail or cease operations.
We will need to raise more money to continue to fund our business. Our capital requirements will depend on several factors, including:
| • | Expenditures and investments to implement our biofuels business strategy, including increased capital expenditures in relation to such strategy, for example, to optimize our demonstration-scale facility, and build our commercial-scale facilities under our agreement with BP; |
| • | The level of research and development investment required to maintain our technology leadership position; |
| • | Our ability to enter into new agreements with collaborative partners or to extend the terms of our existing collaborative agreements, and the terms of any agreement of this type, including our agreement with BP; |
| • | The success rate of our discovery efforts associated with milestones and royalties; |
| • | Our ability to successfully commercialize products developed independently and the demand for such products; |
| • | The timing and willingness of strategic partners and collaborators to commercialize our products that would result in royalties; |
| • | Costs of recruiting and retaining qualified personnel; and |
| • | Our possible acquisition or licensing of complementary technologies or acquisition of complementary businesses. |
We may seek additional funds through a combination of existing and additional corporate partnerships and collaborations, federal, state and local grant funding and loan guarantees, product sales, selling or financing assets, and the sale of equity or debt securities. In addition, we expect to attempt to raise funds in the non-recourse, project-finance capital markets to finance growth of our project portfolio. Such funds may not be available to us or may be available on terms not satisfactory to us. We currently have applications pending for federal, state and local financial incentives such as grants; however, such funds may not be available to us in adequate amounts, if at all. An inability to raise adequate funds to support the growth of our project portfolio will materially adversely affect our business.
If we cannot raise more money, we will have to implement one or more of the following remedies:
| • | reduce our capital expenditures; |
| • | further scale back our development of new enzyme products; |
30
Table of Contents
| • | scale back our efforts to commercialize cellulosic ethanol; |
| • | significantly reduce our workforce; |
| • | sell some or all of our assets; |
| • | seek to license to others products or technologies that we otherwise would seek to commercialize ourselves; and/or |
| • | curtail or cease operations. |
We have a history of net losses, we expect to continue to incur net losses, and we may not achieve or maintain profitability.
As of December 31, 2009, we had a net loss for the year ended of $21.9 million an accumulated deficit of approximately $630.0 million. We expect to continue to incur additional losses for the foreseeable future.
Product revenues currently account for the majority of our annual revenues, and we expect that a significant portion of our revenue for 2010 will result from the same sources, as well as from grant revenue. Future revenue from collaborations is uncertain and will depend upon our ability to maintain our current collaborations, including that with BP, enter into new collaborations and to meet research, development, and commercialization objectives under new and existing agreements, and we have been de-emphasizing collaborations that are not core to our strategic market focus. Over the past two years, our product revenue in absolute dollars and as a percentage of total revenues has increased significantly, and our grant revenue in absolute dollars and as a percentage of total revenues has increased significantly during 2009. Our product and grant revenue may not continue to grow in either absolute dollars or as a percentage of total revenues. If product revenue increases, we would expect sales and marketing expenses to increase in support of increased volume. Additionally, as our business model develops, our general and administrative expenses might increase based on broadening our infrastructure to support continued growth in the business. In addition, the amounts we spend will impact our ability to become profitable and this will depend, in part, on:
| • | the progress of our research and development programs for the production of ethanol from various sources of cellulosic biomass; |
| • | the cost of building, operating and maintaining research and production facilities; |
| • | the number of production facilities that we ultimately attempt to develop; |
| • | the time and expense required to prosecute, enforce and/or challenge patent and other intellectual property rights; |
| • | how competing technological and market developments affect our proposed activities; and |
| • | the cost of obtaining licenses required to use technology owned by others for proprietary products and otherwise. |
We may not achieve any or all of our goals and, thus, we cannot provide assurances that we will ever be profitable on an operating basis or maintain revenues at current levels. If we fail to achieve profitability and maintain or increase revenues, the market price of our common stock will likely decrease.
Even if we generate significant additional revenue in our specialty enzymes business, we do not expect to achieve overall profitability for the foreseeable future, as we make additional investments to implement our vertical integration strategy within biofuels. In order for us to generate revenue, we must not only retain our existing collaborations and/or attract new ones and achieve milestones under them, but we must also develop products or technologies that we or our partners choose to commercialize and that are commercially successful and from which we can derive revenue through sales or royalties. Even if we do achieve profitability, we may not be able to sustain or increase profitability on a quarterly or annual basis.
31
Table of Contents
We continue to experience losses from operations, and we may not be able to fund our operations and continue as a going concern.
The report of our independent registered public accounting firm for the fiscal year ended December 31, 2009 contains an explanatory paragraph which states that we have incurred recurring losses from operations and, based on our operating plan and existing working capital, this raises substantial doubt about our ability to continue as a going concern. We have an accumulated deficit of approximately $630.0 million.
We have used the proceeds received from sales of our 2007 Notes in April 2007 and 2008 Notes in February 2008 to make enhancements to our pilot facility, to complete construction and commissioning of our demonstration-scale facility in Jennings, Louisiana, to advance development of the site for our first commercial cellulosic ethanol plant, to commercialize our specialty enzymes products, to continue our research and development efforts in both specialty enzymes and biofuels, and for expenses related to the merger with Celunol, all of which have adversely affected, and will continue to adversely affect, our operating results until revenues reach levels at which we can fully support our operating and capital expenditures. We have used the net proceeds of our equity offering in October 2009 for general corporate purposes, which include research and development, capital expenditures, working capital, and general and administrative expenses.
We will require additional capital to fund our operations, including substantial capital to fund the first commercial cellulosic ethanol plant with BP, which we estimate will cost approximately $300 million to complete. We believe that we will be successful in raising or generating additional cash to fund these requirements through a combination of additional corporate partnerships and collaborations, federal, state and local grant funding, selling and financing assets, incremental product sales, and, if necessary and available, the sale of equity or debt securities. There can be no assurance that we will be able to obtain any sources of financing on acceptable terms, or at all. If we are unsuccessful in raising additional capital from any of these sources, we may need to defer, reduce or eliminate certain planned expenditures, including our collaboration with BP.
If we are not able to reduce or defer our expenditures, secure additional sources of revenue or otherwise secure additional funding, we may be unable to continue as a going concern, and we may be forced to restructure or significantly curtail our operations, file for bankruptcy or cease operations.
We are dependent on our collaborative partners, including BP, and our failure to successfully manage our existing and future collaboration relationships could prevent us from developing and commercializing cellulosic ethanol and/or our specialty enzyme products, and achieving or sustaining profitability.
Revenue from our collaborations has decreased both as a proportion of our total revenue and in absolute dollars in recent years. Since we do not currently possess the resources necessary to independently fund the development and commercialization of cellulosic ethanol, or all of the potential specialty enzyme products that may result from our technologies, we expect to continue to pursue, and in the near-term derive additional revenue from, strategic alliance and collaboration agreements to develop and commercialize products and technologies that are core to our current market focus, such as our collaboration with BP. We will have limited or no control over the resources that any strategic partner or collaborator may devote to our products and technologies. Any of our present or future strategic partners or collaborators may fail to perform their obligations as expected. These strategic partners or collaborators may breach or terminate their agreements with us or otherwise fail to conduct their collaborative activities successfully and in a timely manner. For example, we have recently entered into negotiations with our strategic partner, BP, and have not yet come to acceptable terms on the second phase of our collaboration, which has required two one-month extensions of the negotiating period. Our expectations concerning our biofuels business are dependent upon our continued collaboration with BP, the future terms of which we are continuing to negotiate with BP. There can be no assurance that we will successfully conclude these negotiations in manner that is beneficial to the Company or our biofuels business. Further, our strategic partners or collaborators may not develop technologies or products arising out of our collaborative arrangements or devote sufficient resources to the development, manufacture, marketing, or sale of these technologies and products. If any of these events occur, or we fail to enter into or maintain strategic alliance or collaboration agreements, we may not be able to commercialize our technologies and products, grow our business, or generate sufficient revenue to support our operations.
32
Table of Contents
Our present or future strategic alliance and collaboration opportunities could be harmed if:
| • | We do not achieve our research and development objectives under our strategic alliance and collaboration agreements; |
| • | We are unable to fund our obligations under either of our joint ventures with BP or with any of our other strategic partners or collaborators; |
| • | We are unable to obtain funding to build commercial cellulosic ethanol plants; |
| • | We develop technologies or products and processes or enter into additional strategic alliances or collaborations that conflict with the business objectives of our strategic partners or collaborators; |
| • | We disagree with our strategic partners or collaborators as to rights to intellectual property we develop, or their research programs or commercialization activities; |
| • | Our strategic partners or collaborators experience business difficulties which eliminate or impair their ability to effectively perform under our strategic alliances or collaborations; |
| • | We are unable to manage multiple simultaneous strategic alliances or collaborations; |
| • | Our strategic partners or collaborators become competitors of ours or enter into agreements with our competitors; |
| • | Our strategic partners or collaborators become less willing to expend their resources on research and development due to general market conditions or other circumstances beyond our control; |
| • | Consolidation in our target markets limits the number of potential strategic partners or collaborators; or |
| • | We are unable to negotiate additional agreements having terms satisfactory to us. |
We are dependent on BP under our joint ventures in cellulosic ethanol.
We have a strategic partnership with BP to accelerate the development and commercialization of cellulosic ethanol technology. The first phase of our partnership combines a broad technology platform and operational capabilities in an effort to advance the development of a portfolio of low-cost, environmentally-sound cellulosic ethanol production facilities in the United States, and potentially throughout the world. The second phase of our partnership is focused on the commercial deployment of our technologies into a commercial-scale cellulosic ethanol production facility. We are dependent upon BP’s financial and technical contributions under both of these joint ventures in order to realize the benefits of the strategic partnership with BP and continue to operate our biofuels business, as it is currently composed. If BP were not to engage actively in efforts to perform under our joint ventures or were to pursue alternative efforts in cellulosic ethanol, the joint ventures may not be successful and our business could be harmed, including requiring us to shutdown or dispose of our biofuels business. The efforts under the first phase of our partnership have been co-funded by BP under an 18-month initial agreement that was scheduled to expire on January 31, 2010 and was extended through April 1, 2010. We and BP are currently in discussions to extend this partnership beyond its initial 18-month term, which discussions have required to have been extended for two one-month periods because we have been unable to reach acceptable terms. If BP were to discontinue its participation in either of these joint ventures, we would need to continue the efforts on our own or identify and enter into arrangements with one or more other partners, or shutdown or dispose of our biofuels business. If we were to have to fund all of the technology development efforts, we would need to raise additional funds to do so, which would be difficult in the current financing environment. Alternatively, it may be difficult for us to find a different partner that is a good strategic fit and to enter into a new strategic relationship on terms that are favorable to us. If we could not find an alternative way to pursue our development and commercialization efforts in cellulosic ethanol, our business would be adversely affected.
33
Table of Contents
Our failure to successfully develop our cellulosic ethanol processes and technology would adversely affect our ability to achieve the benefits under our strategic partnership with BP, and could prevent us from successfully developing and commercializing cellulosic ethanol and achieving or sustaining profitability.
A substantial part of our efforts in our biofuels business over the near term will be focused upon the joint development program with BP. We have agreed with BP that for a limited period, we will not use our existing technology in any other technology development program in the field of conversion of biomass to fermentable sugars for the production, or the use in production, of ethanol, with limited exceptions. The limited period may be extended if our joint development program with BP is extended. We are responsible for performance of substantially all of the activities under the joint development program. If we are not successful in achieving the objectives of the joint development program, BP may terminate the joint development program, and we will no longer be entitled to receive any payments from BP for performance of the joint development program, which would have a material adverse impact on our business, financial condition, and results of operations. The technology in the defined field that we develop in the course of the joint development program will be owned by Galaxy, a special purpose entity which is equally owned by BP and us. We will only have access to the technology owned by Galaxy through any license that Galaxy grants to us. In addition, the license to our existing technology that we granted to Galaxy in the defined field will continue in effect on a non-exclusive basis even if the joint development program terminates, unless the termination is caused by BP’s failure to make payments to us when due. If BP terminates the joint development program, we may not be successful in entering into an agreement with another strategic partner or otherwise economically exploiting our technology in the defined field, and the continuing rights of Galaxy to exploit our existing technology and technology developed during the joint development program may adversely affect our ability to do so.
If we are unable to perform our obligations under our joint development program with BP, including funding our portion of its costs, we may lose certain voting rights in the management of Galaxy, the special purpose entity formed to exploit the technology developed through our relationship with BP, and the anticipated economic benefits resulting from the joint development program may be delayed or may not occur.
We are co-funding our joint development program with BP and have an equal vote with BP in decisions regarding the management of Galaxy, including decisions regarding future funding, the commercial use of the technology package that we anticipate will result from the joint development program and the timing of monetary distributions to the owners of Galaxy. However, if we are unable to fund our portion of the joint development program costs, or are unable to fulfill certain of our other obligations under the joint development program, we may lose our ability to participate in certain aspects of the decision-making process, including decisions about how and when funding occurs. If we are unable to fulfill our funding commitments, BP may chose to fund our portion of the joint development program and to receive its contributions back before we receive any additional distributions from license fees, royalties or other revenue, which could result in the delay of distributions to us or in our receiving no distributions. A delay or failure to receive distributions could have a material adverse impact on our future revenues and could have a material adverse impact on our business, financial condition and results of operations.
If we do not participate in projects under our commercial joint venture with BP or are unable to fund our portion of projects that we have elected to participate in under the joint venture, our interest in the joint venture may be bought out by BP or diluted, and the anticipated economic benefits to us of the joint venture may be lost or reduced.
We are participating in commercial development activities with BP under Highlands Ethanol, LLC (dbaVercipia Biofuels) (“Vercipia”), a joint venture owned equally by BP and us, which will act as the commercial entity for the deployment of cellulosic ethanol technology being developed and proven under our joint development program with BP. This joint venture is intended to progress the development of one of the nation’s first commercial-scale cellulosic ethanol facilities, located in Highlands County, Florida, and to create
34
Table of Contents
future opportunities for commercializing cellulosic ethanol technologies. If we do not continue to participate in the development of the Vercipia project by funding our portion of the costs, or if we do participate but are unable to meet our funding obligations with respect to the project, BP may chose to buy out our interest in the joint venture or may dilute our interest in the joint venture. Loss or reduction of our interest in Vercipia could have a material adverse impact on our future revenues and could have a material adverse impact on our business, financial condition and results of operations.
If we are unable to co-develop commercial plant production projects with BP under our Vercipia joint venture, we may not achieve the anticipated benefits of our relationship with BP.
There are substantial risks involved in the design, development, and construction of commercial-scale cellulosic ethanol production facilities, which is the focus of our Vercipia joint venture with BP, including, but not limited to, the following risks:
| • | legal and regulatory risk related to land use, permitting, and environmental regulations; |
| • | cost overruns; |
| • | risk that technology will not scale from a demonstration to commercial facility; |
| • | risk that production costs will not be competitive with the price of competing fuels like gasoline or corn-based ethanol; |
| • | inability to obtain necessary financing to fund the commercial project; |
| • | decrease in support from the government through loss of subsidies, loss of tax credits, or a decrease in federal financial support including the risk that we may not be granted the loan guarantee from the DOE which BP and we recently applied for; and |
| • | introduction of next-generation technologies that are superior to our cellulosic ethanol process technology. |
Any one of these factors could have a material adverse impact on our and BP’s ability to complete our first planned commercial facility, which would have a material adverse impact on our business, financial condition and results of operations.
We should be viewed as an early stage company with new and unproven technologies.
You must evaluate our business in light of the uncertainties and complexities affecting an early stage biotechnology company or cellulosic ethanol manufacturing company. Our existing proprietary technologies are new and in the early stage of development for both biofuels and specialty enzymes. We may not be successful in the commercial development of these or any further technologies, products or processes. Successful products and processes require significant development and investment, including testing, to demonstrate their cost- effectiveness prior to regulatory approval and commercialization. To date, we have commercialized 14 of our own products, all in the specialty enzymes area, including our Purifine, Fuelzyme, Veretase, Xylathin, and Luminase enzymes. In addition, four of our collaborative partners, Invitrogen Corporation, Danisco Animal Nutrition, Givaudan Flavors Corporation, and Syngenta Animal Nutrition (formerly known as Zymetrics, Inc.), have incorporated our technologies or inventions into their own commercial products from which we have generated and/or can generate royalties. We have not yet commercialized any products or processes related to our biofuels segment. Our specialty enzyme products and technologies have only recently begun to generate significant revenues. Because of these uncertainties, our discovery process may not result in the identification of product candidates or biofuels production processes that we or our collaborative partners will successfully commercialize. If we are not able to use our technologies to discover new materials, products, or processes with significant commercial potential, or if we are unable to sell our cellulosic ethanol or an integrated solution for the production of cellulosic ethanol, we will continue to have significant losses in the future due to ongoing expenses for research, development and commercialization efforts and we may be unable to obtain additional funding to fund such efforts.
35
Table of Contents
We may not have adequate funds to pay interest on our 2007 Notes and 2009 Notes, or to purchase the 2007 Notes and 2009 Notes on required purchase dates or upon a fundamental change.
In April 2007, we completed the sale of $120 million of 2007 Notes, the terms of which include provisions whereby on each of April 1, 2012, April 1, 2017 and April 1, 2022, holders of the 2007 Notes may require us to purchase, for cash, all or a portion of their 2007 Notes at 100% of their principal amount, plus any accrued and unpaid interest up to, but excluding, that date. In September 2009, pursuant to privately negotiated exchange agreements with Verenium, certain holders of the 2007 Notes exchanged approximately $30.5 million in aggregate principal amount of 2007 Notes for approximately $13.7 million in aggregate principal amount of our 2009 Notes. As of December 31, 2009, approximately $69 million of the 2007 Notes remains outstanding. If a “fundamental change,” which is defined in the indenture related to the 2007 Notes and in the indenture related to the 2009 Notes, occurs, holders of the 2007 Notes or 2009 Notes may require us to repurchase, for cash, all or a portion of their 2007 Notes or 2009 Notes, as applicable. We may not have sufficient funds to pay the interest, purchase price or repurchase price of the 2007 Notes or 2009 Notes when due. In addition, the terms of any borrowing agreements which we may enter into from time to time may require early repayment of borrowings under circumstances similar to those constituting a “fundamental change.” For example, the holders of the 2008 Notes may require us to redeem the 2008 Notes under such circumstances. Those agreements may also make our repurchase of 2007 Notes or 2009 Notes an event of default under the agreements. If we fail to pay interest on the 2007 Notes or 2009 Notes or to purchase or repurchase the 2007 Notes or 2009 Notes when required, we will be in default under the indenture for the 2007 Notes or the indenture for the 2009 Notes, as applicable, which would also cause an event of default under the 2008 Notes and may also cause an event of default under the terms of other borrowing arrangements that we may enter into from time to time. Any of these events could have a material adverse effect on our business, results of operations and financial condition, up to and including causing us to cease operations altogether.
We may not have adequate funds to pay interest or “make-whole” payments on our 2008 Notes, or to purchase the 2008 Notes at required times.
In February 2008, we completed a private placement of $71 million of 2008 Notes and warrants to purchase our common stock. As of December 31, 2009, approximately $15.2 million of the 2008 Notes remains outstanding. On July 1, 2008, certain terms of all of the outstanding 2008 Notes were modified pursuant to convertible note amendment agreements entered into with certain holders of the 2008 Notes.
We are required to pay interest on the 2008 Notes at the rate of 8% per year, and the 2008 Notes also include a “make-whole” provision whereby, upon any holder’s conversion of the 2008 Notes for common stock, we are obligated to pay such holder an amount equal to the interest foregone over the life of the 2008 Notes based on such conversion, discounted back to the date of conversion using the published yield on two-year U.S. Treasury notes as the discount rate. The 2008 Notes provide that we may, subject to the satisfaction of certain conditions, pay interest or “make-whole” amounts with shares of our common stock at a 5% discount to the applicable stock price at the time of the interest payment or conversion. As of December 31, 2009, our potential maximum remaining “make-whole” obligation assuming conversion of 100% of the 2008 Notes on that date was approximately $3.0 million, which we may be required to settle in cash if we are unable to satisfy the conditions for paying “make-whole” amounts with shares or the noteholders do not otherwise waive these conditions. Were many holders of our 2008 Notes to convert their 2008 Notes, or if a significant amount were converted at approximately the same time, and we were at that time unable to satisfy the conditions for paying “make-whole” amounts in shares and the noteholders did not otherwise waive those conditions, our cash resources at that time could be insufficient to make the required “make-whole” payments. Also, one holder of 2008 Notes has asserted that certain “make- whole” payments made to it in shares should have been paid in cash, and has filed a lawsuit against us asserting a conversion price of $9.36, rather than $25.56 (and with the recent amendment of the 2008 Notes and recent equity financing, $17.89), for a portion of its 2008 Notes for which it has submitted conversion notices. The lawsuit requests additional shares based on such conversions, damages and declaratory relief. We have disputed the assertions made by that noteholder and believe our positions are correct. However, if we were
36
Table of Contents
found to have been required to pay such “make-whole” payments in cash, or were found to have otherwise not satisfied our obligations under the 2008 Notes, we could, among other negative consequences, be required to redeem some or all of the 2008 Notes. The holders of the 2008 Notes may also require us to redeem their 2008 Notes in connection with certain “change of control” events, and any borrowing agreements which we may enter into from time to time may similarly require early repayment of borrowings under circumstances like those constituting a “change of control” under the terms of the 2008 Notes. For example, the holders of the 2007 Notes and 2009 Notes may require us to repurchase, for cash, all or a portion of the 2007 Notes or 2009 Notes, as applicable, in such circumstances. Those agreements may also make our repurchase of 2008 Notes an event of default under the agreements. We may not have sufficient funds to pay any required cash interest or cash “make-whole” payments or repurchase or redemption amounts of the 2008 Notes when due, or any amounts due under other borrowing agreements at the same time such amounts are due under the 2008 Notes or otherwise, and any default under the 2008 Notes or any other borrowing agreements (including the 2007 Notes and 2009 Notes) could cause events of default under our other debt obligations (including the 2009 Notes, 2008 Notes and the 2007 Notes, as applicable). Any of these events could cause the maturity of some or all of our debt obligations (including the 2009 Notes, 2008 Notes and the 2007 Notes, as applicable) to be accelerated, and could have a material adverse effect on our business, results of operations and financial condition, up to and including causing us to cease operations.
Conversion of the 2008 Notes, the 2007 Notes and/or the 2009 Notes, exercise of related warrants, anti-dilution adjustments that may occur under the 2008 Notes and/or the related warrants, and the issuance of shares of common stock in payment of interest or “make-whole” payments under the 2008 Notes will dilute the ownership interest of existing stockholders.
The conversion or exercise of some or all of the 2007 Notes, 2009 Notes and/or the 2008 Notes and related warrants, and the issuance of shares of common stock in payment of interest or “make-whole” payments under the 2008 Notes, could significantly dilute the ownership interests of existing stockholders. In April 2008, the conversion price of the 2007 Notes decreased from $97.92 per share to $76.80 per share, based on a re-set provision contained in the 2007 Notes. In February 2009, the conversion price of the 2008 Notes decreased from $49.08 per share to $25.56 per share, based on a re-set provision contained in the 2008 Notes, in July 2009 decreased further to $20.88 per share in connection with the amendment of the 2008 Notes, and in October 2009 decreased further to $17.89 per share in connection with our recent equity financing. The initial conversion price of the 2009 Notes is $9.60 per share and is subject to reduction based on a re-set provision contained in the 2009 Notes. These re-sets and other reductions in the applicable conversion prices for the 2007 Notes, 2008 Notes and 2009 Notes have caused, and will continue to cause, additional shares to be issued upon conversion of these instruments compared to the number of shares initially issuable upon such conversions.
The 2008 Notes also contain a version of broad-based weighted average anti-dilution protection, subject to certain exceptions and limitations, which could cause further reductions in the $17.89 conversion price for the 2008 Notes should we engage in subsequent issuances that trigger those provisions. One holder of the 2008 Notes has filed a lawsuit against us asserting a conversion price of $9.36, rather than $25.56 (and with the recent amendment of the 2008 Notes, and recent equity financing, $17.89), for a portion of its 2008 Notes for which it has submitted conversion notices. We have disputed this assertion and believe our position is correct. If we were required to honor those conversion notices or future conversion notices at the lower conversion price, that would cause additional shares to be issued. Additionally, the warrants related to the 2008 Notes and certain warrants held by Syngenta contain weighted average anti-dilution protection that could also cause more shares to become issuable under those warrants if we engage in subsequent issuances that trigger those provisions. In addition, given the low recent values for our stock price, to the extent we satisfy required interest or “make-whole” payments under the 2008 Notes by issuing shares, which we intend to do to the extent permissible under the terms of the 2008 Notes, including to the extent we obtain waivers from the holders to do so, we will be issuing relatively more shares than if our stock price was at a higher level. For example, in connection with the conversion of $45.9 million in aggregate principal amount of 2008 Notes that occurred between January 1, 2009 and March 12, 2010, we issued approximately 1.9 million shares in partial satisfaction of the related
37
Table of Contents
“make-whole” obligations. Sales in the public market of the common stock issuable upon conversion of the 2007 Notes and/or 2008 Notes or exercise of the related warrants, or issuable in payment of interest or “make-whole” payments under the 2008 Notes, have, and we expect that any future sales based on such conversions, exercises or issuances will continue to, adversely affect prevailing market prices of our common stock. In addition, the existence of the 2007 Notes and 2008 Notes may encourage short selling by market participants because the conversion of the 2007 Notes and 2008 Notes could be used to satisfy short positions, or the anticipated conversion of the 2007 Notes or 2008 Notes into shares of our common stock could depress the price of our common stock.
The covenants in the 2008 Notes restrict our financial and operational flexibility.
We are subject to certain covenants under the 2008 Notes that restrict our financial and operational flexibility. For example, we are restricted from incurring additional indebtedness (other than certain project financing debt, certain unsecured subordinated indebtedness and up to $187 million principal amount of additional indebtedness). The 2008 Notes also include a version of broad-based weighted average anti-dilution protection, subject to certain exceptions and limitations, and the warrants issued in connection with the 2008 Notes also contain weighted-average anti-dilution protection. Any future financing by us involving the issuance of equity, or rights to acquire equity, at a price or prices below the prevailing conversion price of the 2008 Notes at the time of such financing would trigger these provisions in the 2008 Notes and the warrants, causing a further, possibly substantial, reduction in the conversion price for the 2008 Notes or the exercise price of the warrants and additional possible dilution for our shareholders, which would increase the cost and reduce the benefits to us of any such equity financing. As a result of these covenants, our ability to finance our operations through the incurrence of additional debt or the issuance of additional equity is limited. The 2008 Notes also contain other covenants that restrict our financial and operational flexibility.
One holder of our 2008 Notes (the “Disputing Noteholder”) has filed a lawsuit against us asserting that our recent amendment of the 2008 Notes, which became effective on July 6, 2009, failed to amend such noteholder’s 2008 Note (the “Disputed Note”), and that certain actions we have taken that are permitted under the terms of the 2008 Notes, as recently amended, constitute a breach under the Disputed Note.
The Disputing Noteholder did not consent to the recent amendment of our 2008 Notes and has asserted that such amendment did not effectively amend the Disputed Note. We have disputed this assertion and believe that the recent amendment effectively amended all of the 2008 Notes, including the Disputed Note. The 2008 Notes, as recently amended, and the Disputed Note, if not amended, contain different provisions regarding the amount of indebtedness that we may incur, actions that we may take vis-à-vis the 2007 Notes, our use of cash from any sale of specified assets, and with respect to anti-dilution protection. If it is ultimately determined that the recent amendment did not amend the Disputed Note, certain actions that we have taken or that we may take that are permitted under the terms of the 2008 Notes, as recently amended, may be determined to cause a default under the Disputed Note. For example, our exchange in September 2009 of approximately $30.5 million in aggregate principal amount of our 2007 Notes for approximately $13.7 million in aggregate principal amount of our 2009 Notes was permitted under the terms of the 2008 Notes, as recently amended, but would not be permitted under the terms of the 2008 Notes that were in effect prior to the amendment. The Disputing Noteholder has asserted that the exchange of our 2007 Notes for 2009 Notes is not authorized under the Disputed Note and is invalid.
Our high level of debt limits our ability to fund general corporate requirements, limits our flexibility in responding to competitive developments, increases our vulnerability to adverse economic and industry conditions, and may harm our financial condition and results of operations.
The face value of our total consolidated long-term debt as of December 31, 2009, which includes the 2007 Notes, the 2008 Notes, and the 2009 Notes was approximately $97.9 million, representing approximately 78% of our total capitalization as of such date.
38
Table of Contents
Our level of indebtedness could have important adverse consequences on our future operations, including:
| • | making it more difficult for us to meet our payment and other obligations under the 2007 Notes, 2008 Notes, and 2009 Notes; |
| • | reducing the availability of our cash flow to fund working capital, capital expenditures, acquisitions and other general corporate purposes, and limiting our ability to obtain additional financing for these purposes; |
| • | resulting in an event of default if we fail to comply with the financial and other restrictive covenants contained in our debt agreements, which could result in all of our debt becoming immediately due and payable; |
| • | limiting our flexibility in planning for, or reacting to, and increasing our vulnerability to, changes in our business, the industries in which we operate and the general economy; and |
| • | placing us at a competitive disadvantage compared to our competitors that have less debt or are less leveraged. |
Moreover, if we fail to make any required payments under our debt, or otherwise breach the terms of our debt, all or a substantial portion of our debt could be subject to acceleration. In such a situation, it is unlikely we would be able to repay the accelerated debt, which would have a material adverse impact on our business, results of operations and financial condition, up to and including causing us to cease operations.
If the recent volatility in the United States and global equity and credit markets and the decline in the general world economy continue for an extended period of time, it may become more difficult to raise money in the public and private markets and harm our financial condition and results of operations.
The United States and global equity markets have recently been extremely volatile and unpredictable, reflecting in part a general concern regarding the global economy. This volatility in the market affects not just our stock price, but also the stock prices of our collaborators. In addition, this volatility has also affected the ability of businesses to obtain credit and to raise money in the capital markets. If we or our collaborators are unable to obtain credit or raise money in the capital markets, we may not be able to continue to fund our current research and development projects, fund our current products, raise project finance capital for the development of commercial cellulosic ethanol plants, or otherwise continue to maintain or grow our business.
We do not anticipate paying cash dividends, and accordingly, stockholders must rely on stock appreciation for any return on their investment in us.
We anticipate that we will retain our earnings, if any, for future growth and therefore do not anticipate paying cash dividends in the future. As a result, only appreciation of the price of our common stock will provide a return to stockholders. Investors seeking cash dividends should not invest in our common stock.
We may encounter difficulties managing our growth, which could adversely affect our results of operations.
Our strategy includes entering into and working on simultaneous projects, frequently across multiple industries, in both our specialty enzymes and biofuels businesses. This strategy places increased demands on our limited human resources and requires us to substantially expand the capabilities of our administrative and operational resources and to attract, train, manage and retain qualified management, technicians, scientists and other personnel, especially with respect to our vertical integration strategy within biofuels. Our ability to effectively manage our operations, growth, and various projects requires us to continue to improve our operational, financial and management controls, reporting systems and procedures and to attract and retain sufficient numbers of talented employees, which we may be unable to do. We may not be able to successfully implement improvements to our management information and control systems in an efficient or timely manner. In addition, we may discover deficiencies in existing systems and controls.
39
Table of Contents
If we engage in any acquisitions, we will incur a variety of costs, may dilute existing stockholders, and may not be able to successfully integrate acquired businesses.
If appropriate opportunities become available, we may consider acquiring businesses, assets, technologies, or products that we believe are a strategic fit with our business. As of December 31, 2009, we have no commitments or agreements with respect to any material acquisitions. If we further pursue such a strategy, we could:
| • | issue additional equity securities which would dilute current stockholders’ percentage ownership; |
| • | incur substantial additional debt; or |
| • | assume additional liabilities. |
We may not be able to successfully integrate any businesses, assets, products, technologies, or personnel that we might acquire in the future without a significant expenditure of operating, financial, and management resources, if at all. In addition, future acquisitions might negatively impact our business relations with our current and/or prospective collaborative partners and/or customers. Any of these adverse consequences could harm our business.
Our business is subject to complex corporate governance, public disclosure, and accounting requirements that have increased both our costs and the risk of noncompliance.
Because our common stock is publicly traded, we are subject to certain rules and regulations of federal, state and financial market exchange entities charged with the protection of investors and the oversight of companies whose securities are publicly traded. These entities, including the Financial Accounting Standards Board, the Public Company Accounting Oversight Board, the SEC, and NASDAQ, have implemented requirements, standards and regulations, including expanded disclosures, accelerated reporting requirements and more complex accounting rules, and continue developing additional requirements. Our efforts to comply with these regulations have resulted in, and are likely to continue resulting in, increased general and administrative expenses and diversion of management time and attention from operating activities to compliance activities. We may incur additional expenses and commitment of management’s time in connection with further evaluations, either of which could materially increase our operating expenses or accordingly increase our net loss.
Because new and modified laws, regulations, and standards are subject to varying interpretations, in many cases due to their lack of specificity, their application in practice may evolve over time as new guidance is provided by regulatory and governing bodies. This evolution may result in continuing uncertainty regarding financial disclosures and compliance matters and additional costs necessitated by ongoing revisions to our disclosures and governance practices. This further could lead to possible restatements, due to the complex nature of current and future standards and possible misinterpretation or misapplication of such standards.
If we fail to maintain an effective system of internal controls, we may not be able to accurately report our financial results or prevent fraud and as a result, investors may be misled and lose confidence in our financial reporting and disclosures, and the price of our common stock may be negatively affected.
The Sarbanes-Oxley Act of 2002 requires that we report annually on the effectiveness of our internal control over financial reporting. A “significant deficiency” means a deficiency or a combination of deficiencies, in internal control over financial reporting that is less severe than a material weakness yet important enough to merit attention by those responsible for oversight of our financial reporting. A “material weakness” is a deficiency, or a combination of deficiencies in internal control over financial reporting, such that there is a reasonable possibility that a material misstatement of the annual or interim financial statements will not be prevented or detected on a timely basis.
In the past, we have disclosed material weaknesses with our financial statement close process that we have since remediated. Although we have made and are continuing to make improvements in our internal controls, if
40
Table of Contents
we discover other deficiencies or material weaknesses, it may adversely impact our ability to report accurately and in a timely manner our financial condition and results of operations in the future, which may cause investors to lose confidence in our financial reporting and may negatively affect the price of our common stock. Moreover, effective internal controls are necessary to produce accurate, reliable financial reports and to prevent fraud. If we continue to have deficiencies in our internal controls over financial reporting, these deficiencies may negatively impact our business and operations.
Our ability to compete may decline if we do not adequately protect our proprietary technologies or if we lose some of our intellectual property rights due to becoming involved in expensive lawsuits or administrative proceedings.
Our success depends in part on our ability to obtain patents and maintain adequate protection of our other intellectual property for our technologies and products in the United States and other countries. In addition, unauthorized parties may attempt to copy or otherwise obtain and use our products or technology. Monitoring and preventing unauthorized use of our intellectual property is difficult and expensive, and we cannot be certain that the steps we have taken will prevent unauthorized use of our technology, particularly in foreign countries where the laws may not protect our proprietary rights as fully as in the United States. If competitors are able to use our technology, our ability to compete effectively could be harmed. Although we have adopted a strategy of seeking patent protection in the United States and in foreign countries with respect to certain of the technologies used in or relating to our products, as well as anticipated production capabilities and processes, others may independently develop and obtain patents for technologies that are similar to or superior to our technologies. If that happens, we may need to license these technologies and we may not be able to obtain licenses on reasonable terms, if at all, which could cause great harm to our business.
Our commercial success depends in part on not infringing patents and proprietary rights of third parties, and not breaching any licenses or other agreements that we have entered into with regard to our technologies, products, and business. The patent positions of companies whose businesses are based on biotechnology, including our patent position, involve complex legal and factual questions and, therefore, enforceability cannot be predicted with certainty. We intend to apply for patents relating to our technologies, processes and products as we deem appropriate. Patents, if issued, may be challenged, invalidated, or circumvented. We cannot be sure that patents have not been issued that could block our ability to obtain patents or to operate as we would like. Others may develop similar technologies or duplicate technologies developed by us. There may be patents in some countries that, if valid, may block our ability to commercialize products in these countries if we are unsuccessful in circumventing or acquiring the rights to these patents. There also may be claims in published patent applications in some countries that, if granted and valid, may also block our ability to commercialize processes or products in these countries if we are unable to circumvent or license them. Our intellectual property rights may be challenged by others. For example, in February 2007, an interference proceeding was declared in the United States Patent and Trademark Office between a United States patent assigned to us and a pending United States patent application owned by a third party, with allowable claims directed to our GeneReassembly technology. On February 25, 2008 the Board of Patent Appeals and Interferences ruled in favor of the other party and the claims in our issued patent were cancelled. We are not currently a party to any litigation with regard to our patent position. However, the biotechnology industry is characterized by frequent and extensive litigation regarding patents and other intellectual property rights. Many biotechnology companies have employed intellectual property litigation as a way to gain a competitive advantage. When and if we become involved in litigation or interference proceedings declared by the United States Patent and Trademark Office, or oppositions or other intellectual property proceedings outside of the United States, to defend our intellectual property rights or as a result of alleged infringement of the rights of others, we might have to spend significant amounts of money. Any intellectual property litigation could potentially force us to do one or more of the following:
| • | stop selling, incorporating or using our products that use the challenged intellectual property; |
| • | stop production of cellulosic ethanol at our production facilities; |
41
Table of Contents
| • | obtain from the owner of the infringed intellectual property right a license to sell or use the relevant technology, which license may not be available on reasonable terms, or at all; or |
| • | redesign those products, facilities or processes that use any allegedly infringing technology, which may result in significant cost or delay to us, or which could be technically infeasible. |
We are aware of a significant number of patents and patent applications relating to aspects of our technologies filed by, and issued to, third parties. We cannot assure you that if we are sued on these patents we would prevail.
Should any third party have filed, or file in the future, patent applications or obtained patents that claim inventions also claimed by us, we may have to participate in an interference proceeding declared by the relevant patent regulatory agency to determine priority of invention and, thus, the right to a patent for these inventions in the United States. Such a proceeding, like the one described above, could result in substantial cost to us even if the outcome is favorable. Even if successful, an interference may result in loss of claims. The litigation or proceedings could divert our management’s time and efforts. Even unsuccessful claims could result in significant legal fees and other expenses, diversion of management time, and disruption in our business. Uncertainties resulting from initiation and continuation of any patent or related litigation could harm our ability to compete.
Confidentiality agreements with employees and others may not adequately prevent disclosure of trade secrets and other proprietary information.
In order to protect our proprietary technology and processes, we also rely in part on trade secret protection for our confidential and proprietary information. We have taken measures to protect our trade secrets and proprietary information, but these measures may not be effective. Our policy is to execute confidentiality agreements with our employees and consultants upon the commencement of an employment or consulting arrangement with us. These agreements generally require that all confidential information developed by the individual or made known to the individual by us during the course of the individual’s relationship with us be kept confidential and not disclosed to third parties. These agreements also generally provide that inventions conceived by the individual in the course of rendering services to us shall be our exclusive property. Nevertheless, our proprietary information may be disclosed, and others may independently develop substantially equivalent proprietary information and techniques or otherwise gain access to our trade secrets. Costly and time-consuming litigation could be necessary to enforce and determine the scope of our proprietary rights, and failure to obtain or maintain trade secret protection could adversely affect our competitive business position.
Ethical, legal, and social concerns about genetically engineered products and processes could limit or prevent the use of our products, processes, and technologies and limit our revenue.
Some of our anticipated products and processes are genetically engineered or involve the use of genetically engineered products or genetic engineering technologies. If we and/or our collaborators are not able to overcome the ethical, legal, and social concerns relating to genetic engineering, our products and processes may not be accepted. Any of the risks discussed below could result in expenses, delays, or other impediments to our programs or the public acceptance and commercialization of products and processes dependent on our technologies or inventions. Our ability to develop and commercialize one or more of our technologies, products, or processes could be limited by the following factors:
| • | Public attitudes about the safety and environmental hazards of, and ethical concerns over, genetic research and genetically engineered products and processes, which could influence public acceptance of our technologies, products and processes; |
| • | Public attitudes regarding, and potential changes to laws governing, ownership of genetic material which could harm our intellectual property rights with respect to our genetic material and discourage collaborative partners from supporting, developing, or commercializing our products, processes and technologies; and |
42
Table of Contents
| • | Governmental reaction to negative publicity concerning genetically modified organisms, which could result in greater government regulation of genetic research and derivative products, including labeling requirements. |
The subject of genetically modified organisms has received negative publicity, which has aroused public debate in the United States and other countries. This adverse publicity could lead to greater regulation and trade restrictions on imports and exports of genetically altered products.
Compliance with regulatory requirements and obtaining required government approvals may be time consuming and costly, and could delay our introduction of products.
All phases, especially the field testing, production, and marketing, of our current and potential products and processes are subject to significant federal, state, local, and/or foreign governmental regulation. Regulatory agencies may not allow us to produce and/or market our products in a timely manner or under technically or commercially feasible conditions, or at all, which could harm our business.
In the United States, specialty enzyme products for our target markets are regulated based on their use, by either the FDA, the EPA, or, in the case of plants and animals, the USDA. The FDA regulates drugs, food, and feed, as well as food additives, feed additives, and substances generally recognized as safe that are used in the processing of food or feed. While substantially all of our current specialty enzyme projects to date have focused on non-human applications and specialty enzyme products outside of the FDA’s review, in the future we may pursue collaborations for further research and development of drug products for humans that would require FDA approval before they could be marketed in the United States. In addition, any drug product candidates must also be approved by the regulatory agencies of foreign governments before any product can be sold in those countries. Under current FDA policy, our products, or products of our collaborative partners incorporating our technologies or inventions, to the extent that they come within the FDA’s jurisdiction, may be subject to lengthy FDA reviews and unfavorable FDA determinations if they raise safety questions which cannot be satisfactorily answered, if results from pre-clinical or clinical trials do not meet regulatory requirements or if they are deemed to be food additives whose safety cannot be demonstrated. An unfavorable FDA ruling could be difficult to resolve and could prevent a product from being commercialized. Even after investing significant time and expenditures, our collaborators may not obtain regulatory approval for any drug products that incorporate our technologies or inventions. Our collaborators have not submitted an investigational new drug application for any product candidate that incorporates our technologies or inventions, and no drug product candidate developed with our technologies has been approved for commercialization in the United States or elsewhere. The EPA regulates biologically derived chemical substances not within the FDA’s jurisdiction. An unfavorable EPA ruling could delay commercialization or require modification of the production process resulting in higher manufacturing costs, thereby making the product uneconomical. In addition, the USDA may prohibit genetically engineered plants from being grown and transported except under an exemption, or under controls so burdensome that commercialization becomes impracticable. Our future products may not be exempted by the USDA.
In order to achieve and maintain market acceptance, our biofuels business will need to meet a significant number of environmental and other regulations and standards established by various federal, state and local regulatory agencies. As these regulations and standards evolve, and if new regulations or standards are implemented, we may be required to modify our proposed facilities and processes or develop and support new facilities or processes and this will increase our costs. Any failure to comply, or delays in compliance, with the various existing and evolving industry regulations and standards could prevent or delay our production of ethanol and the provision of related services including plant operation and engineering services in support of anticipated licenses of our technology, which could harm our biofuels business. Market uncertainty regarding future policies may also affect our ability to develop new ethanol production facilities or license our technologies to third parties. Any inability to address these requirements and any regulatory changes could have a material adverse effect on our biofuels business, financial condition and operating results.
43
Table of Contents
Our results of operations may be adversely affected by environmental, health and safety laws, regulations and liabilities.
We are subject to various federal, state and local environmental laws and regulations, including those relating to the discharge of materials into the air, water and ground, the generation, storage, handling, use, transportation and disposal of hazardous materials, and the health and safety of our employees. In addition, some of these laws and regulations require our contemplated facilities to operate under permits that are subject to renewal or modification. These laws, regulations and permits can often require expensive pollution control equipment or operational changes to limit actual or potential impacts to the environment. A violation of these laws and regulations or permit conditions can result in substantial fines, natural resource damages, criminal sanctions, permit revocations and/or facility shutdowns.
Furthermore, as we operate our business, we may become liable for the investigation and cleanup of environmental contamination at each of the properties that we own or operate and at off-site locations where we may arrange for the disposal of hazardous substances. If these substances have been or are disposed of or released at sites that undergo investigation and/or remediation by regulatory agencies, we may be responsible under the Comprehensive Environmental Response, Compensation and Liability Act, or other environmental laws for all or part of the costs of investigation and/or remediation, and for damages to natural resources. We may also be subject to related claims by private parties alleging property damage and personal injury due to exposure to hazardous or other materials at or from those properties. Some of these matters may require expending significant amounts for investigation, cleanup, or other costs.
In addition, new laws, new interpretations of existing laws, increased governmental enforcement of environmental laws, or other developments could require us to make additional significant expenditures. Continued government and public emphasis on environmental issues can be expected to result in increased future investments for environmental controls at ethanol production facilities. Present and future environmental laws and regulations, and interpretations thereof, applicable to ethanol operations, more vigorous enforcement policies and discovery of currently unknown conditions may require substantial expenditures that could have a material adverse effect on our results of operations and financial position.
We use hazardous materials in our business. Any claims relating to improper handling, storage, or disposal of these materials could be time consuming and costly and could adversely affect our business and results of operations.
Our research and development processes involve the controlled use of hazardous materials, including chemical, radioactive, and biological materials. Our operations also produce hazardous waste products. We cannot eliminate entirely the risk of accidental contamination or discharge and any resultant injury from these materials. Federal, state, and local laws and regulations govern the use, manufacture, storage, handling, and disposal of these materials. We may be sued for any injury or contamination that results from our use or the use by third parties of these materials, and our liability may exceed our total assets. In addition, compliance with applicable environmental laws and regulations may be expensive, and current or future environmental regulations may impair our research, development, or production efforts.
Many competitors and potential competitors who have greater resources and experience than we do may develop products and technologies that make ours obsolete or may use their greater resources to gain market share at our expense.
The biotechnology industry is characterized by rapid technological change, and the area of biomolecule discovery and optimization from biodiversity is a rapidly evolving field. Our future success will depend on our ability to maintain a competitive position with respect to technological advances. Technological development by others may result in our products and technologies becoming obsolete.
44
Table of Contents
We face, and will continue to face, intense competition in our specialty enzymes business. There are a number of companies who compete with us in various steps throughout our technology process. For example, Codexis, Maxygen, Inc., Evotec, and Xencor have alternative evolution technologies. Integrated Genomics Inc., Myriad Genetics, Inc., and ArQule, Inc. perform screening, sequencing, and/or bioinformatics services. Novozymes A/S, Genencor International Inc., and Dyadic International are involved in development, overexpression, fermentation, and purification of enzymes. There are also a number of academic institutions involved in various phases of our technology process. Many of these competitors have significantly greater financial and human resources than we do. These organizations may develop technologies that are superior alternatives to our technologies. Further, our competitors may be more effective at implementing their technologies for modifying DNA to develop commercial products.
The ethanol production and marketing industry is extremely competitive. In addition to cellulosic ethanol producers using different technology platforms, our competitors are grain ethanol producers as well as other providers of alternative and renewable fuels. Significant competitors in the grain ethanol production and marketing industry include Archer Daniels Midland Company, Cargill, Inc., VeraSun Energy Corporation, and Aventine Renewable Energy, Inc. Many companies are engaged in research and development activities in the emerging cellulosic ethanol industry, and companies with announced pilot facility and/or demonstration facility development activities in the cellulosic ethanol space include Abengoa Bioenergy Corp., BlueFire, Genencor, Iogen Corporation, Losonoco, Mascoma, Range Fuels, and Xethanol. Larger industrial companies with announced cellulosic strategies include Archer Daniels Midland, DONG Energy (Elsam), DuPont/POET (formerly known as Broin), Tate & Lyle, and Novozymes. Cellulosic gasification technologies are being pursued by companies including ClearFuels and BRI-Infinium. Some or all of these competitors or other competitors, as well as academic, research and government institutions, are developing or may develop technologies for, and are competing or may compete with us in, the production of ethanol from cellulosic biomass or other feedstocks, such as municipal or construction waste, production of cellulosic ethanol or other fuels employing different steps within the production process, such as acid hydrolysis and/or gasification, and/or the production of other alternative fuels or biofuels, such as biobutanol. Some of our competitors have substantially greater production, financial, research and development, personnel and marketing resources than we do. As a result, our competitors may be able to develop competing and/or superior technologies and processes, and compete more aggressively and sustain that competition over a longer period of time than we could. Our lack of resources relative to many of our significant competitors may cause us to fail to anticipate or respond adequately to new developments and other competitive pressures. This failure could reduce our competitiveness and prevent us from achieving any market share, sales and/or profitability, and adversely affect our results of operations and financial position.
Our ability to compete successfully will depend on our ability to develop proprietary products that reach the market in a timely manner and are technologically superior to and/or are less expensive than other products on the market. Current competitors or other companies may develop technologies and products that are more effective than ours. Our technologies and products may be rendered obsolete or uneconomical by technological advances or entirely different approaches developed by one or more of our competitors. The existing approaches of our competitors or new approaches or technology developed by our competitors may be more effective than those developed by us.
If we lose key personnel or are unable to attract and retain additional personnel, it could delay our product development programs, harm our research and development efforts, and we may be unable to pursue collaborations or develop our own products.
The loss of any key members of our senior management, or business development or scientific staff, or failure to attract or retain other key management, business development or scientific employees, could prevent us from developing and commercializing biofuels and cellulosic ethanol and other new products and entering into collaborations or licensing arrangements to execute on our business strategy. We may not be able to attract or retain qualified employees in the future due to the intense competition for qualified personnel among biotechnology and other technology-based businesses, particularly in the San Diego and New England areas, or
45
Table of Contents
due to competition for, or availability of, personnel with the qualifications or experience necessary for our biofuels business, particularly in the Jennings, Louisiana area. If we are not able to attract and retain the necessary personnel to accomplish our business objectives, we may experience constraints that will adversely affect our ability to meet the demands of our collaborative partners in a timely fashion or to support our internal research and development programs. In particular, our product and process development programs are dependent on our ability to attract and retain highly skilled scientists, including molecular biologists, biochemists, and engineers. Competition for experienced scientists and other technical personnel from numerous companies and academic and other research institutions may limit our ability to do so on acceptable terms. All of our employees are at-will employees, which means that either the employee or we may terminate their employment at any time.
Several members of our senior management team have not worked together for a significant length of time and they may not be able to work together effectively to develop and implement our business strategies and achieve our business objectives. Management will need to devote significant attention and resources to preserve and strengthen relationships with employees, customers and others. If our management team is unable to develop successful business strategies, achieve our business objectives, or maintain positive relationships with employees, customers, suppliers or other key constituencies, including our strategic collaborators and partners, our ability to grow our business and successfully meet operational challenges could be impaired.
Our planned activities will require additional expertise in specific industries and areas applicable to the products and processes developed through our technologies or acquired through strategic or other transactions, especially in our biofuels business. These activities will require the addition of new personnel, including management, and the development of additional expertise by existing management personnel. The inability to acquire these services or to develop this expertise could impair the growth, if any, of our business.
We may be sued for product liability.
We may be held liable if any product or process we develop, or any product which is made or process which is performed with the use of any of our technologies, causes injury or is found otherwise unsuitable during product testing, manufacturing, marketing, or sale. We currently have limited product liability insurance covering claims up to $10 million that may not fully cover our potential liabilities. In addition, if we attempt to obtain additional product liability insurance coverage, this additional insurance may be prohibitively expensive, or may not fully cover our potential liabilities. Inability to obtain sufficient insurance coverage at an acceptable cost or otherwise to protect against potential product liability claims could prevent or inhibit the commercialization of products or processes developed by us or our collaborative partners. If we are sued for any injury caused by our products, our liability could exceed our total assets.
Risks Specific to Our Vertically-Integrated Biofuels Business
We may not be successful in the development of individual steps in, or an integrated process for, the production of ethanol from cellulosic biomass at commercial scale in a timely or economic manner or at all.
The production of ethanol from cellulosic biomass requires multiple integrated steps, including:
| • | obtaining the cellulosic raw material; |
| • | pretreatment of the biomass to make its constituent fibers accessible to enzymes; |
| • | treatment with enzymes to produce fermentable sugars; |
| • | fermentation by organisms to produce ethanol from the fermentable sugars; |
| • | distillation of the ethanol to concentrate and separation of it from other materials; |
| • | purification of the ethanol; and |
| • | storage and distribution of the ethanol. |
46
Table of Contents
We are currently focused on the pilot-scale research and development of such processes in our pilot facility in Jennings, Louisiana, as well as the optimization of our demonstration-scale facility located at the same site that is intended to demonstrate the economics of cellulosic ethanol production using our proprietary processes. We have limited experience with sourcing cellulosic feedstocks and distilling ethanol produced from biomass, and we have no experience storing and/or distributing significant volumes of ethanol produced from biomass sources. To date, we have focused the majority of our research and development efforts on producing ethanol from corn stover, sugarcane bagasse, and wood. The technological and logistical challenges associated with each one of these processes are extraordinary, and we may not be able to resolve such difficulties in a timely or cost effective fashion, or at all. Even if we are successful in developing an economical commercial-scale process for converting a particular cellulosic biomass to cellulosic ethanol, we may not be able to adapt such process to other biomass raw materials.
While we have a pilot-scale cellulosic ethanol facility and have commissioned our demonstration-scale cellulosic ethanol facility to demonstrate the economics of cellulosic ethanol production using our proprietary processes, we have yet to complete the optimization of our demonstration-scale facility, nor have we begun construction of a large-scale commercial cellulosic ethanol facility. While we have estimated the construction and operating costs for our initial large-scale commercial cellulosic ethanol facilities, these assumptions may prove to be incorrect. Accordingly, we cannot be sure that we can manufacture cellulosic ethanol in an economical manner at large scale. If we fail to commence large-scale production in a timely manner or to develop large-scale manufacturing capacity and experience, or fail to manufacture cellulosic ethanol economically on a commercial scale or in commercial volumes, our commercialization of cellulosic ethanol and our business, financial condition, and results of operations will be materially adversely affected.
We may not be able to implement our planned expansion strategy to build, own and operate commercial-scale cellulosic ethanol facilities, including as a result of our failure to successfully manage our growth, which would prevent us from achieving our goals.
Our strategy currently includes the continued development of our pilot-scale facility for process development, optimization of our demonstration-scale plant to validate the economics of our processes at commercial-scale volumes of cellulosic ethanol production, and development and construction of commercial scale plants for the production of large quantities of ethanol for commercial distribution and sale. We plan to grow our business by investing in new facilities and/or acquiring existing facilities, either independently or with potential development partners, as well as pursuing other business opportunities such as the production of other renewable fuels to the extent we deem those opportunities advisable. We believe that there is increasing competition for suitable production sites. We may not find suitable sites for construction of new facilities, suitable acquisition candidates or other suitable expansion opportunities.
We must also obtain numerous regulatory approvals and permits in order to construct and operate facilities. These requirements may not be satisfied in a timely manner or at all. Federal and state governmental requirements may substantially increase our costs, which could have a material adverse effect on our results of operations and financial position. Our expansion plans may also result in other unanticipated adverse consequences, such as the diversion of management’s attention from our existing operations and products.
Rapid growth, resulting from our operation or other involvement with cellulosic ethanol facilities or otherwise, may impose a significant burden on our administrative and operational resources. Our ability to effectively manage our growth will require us to substantially expand the capabilities of our administrative and operational resources and to attract, train, manage and retain qualified management, technicians and other personnel. We may be unable to do so.
We may not find additional appropriate sites for new facilities, or development partners with whom we can implement our growth strategy, and we may not be able to finance, construct, develop or operate these new facilities successfully. We also may be unable to find suitable acquisition candidates. Accordingly, we may fail
47
Table of Contents
to implement our planned expansion strategy, including as a result of our failure to successfully manage our growth, and as a result, we may fail to achieve our goals.
We have experienced, and may continue to experience, significant delays or cost overruns related to our cellulosic ethanol plant projects.
We have experienced cost overruns for our demonstration-scale facility through the commissioning phase. We may continue to experience significant delays or cost overruns during the optimization phase as a result of a variety of factors, such as shortages of workers or materials, transportation constraints, adverse weather, unforeseen design flaws, construction defects, or labor issues, any of which could prevent us from commencing or optimizing operations as expected at our facilities.
Our construction costs may also increase to levels that would make a new facility too expensive to complete or, for demonstration and commercial-scale plants, unprofitable to operate. Contractors, engineering firms, construction firms and equipment suppliers may lack the expertise in cellulosic ethanol, which may result in delays or cost overruns. Contractors, engineering firms, construction firms and equipment suppliers also receive requests and orders from other clients, including other ethanol companies and, therefore, we may not be able to secure their services or products on a timely basis or on acceptable financial terms.
If we are unable to successfully commercialize our technology, our business may fail to generate sufficient revenue, if any, which would adversely affect our operating results.
We expect to derive a significant portion of our future revenue from the commercialization of our proprietary technology for producing fuel-grade cellulosic ethanol by developing, either alone or with partners, cellulosic ethanol production plants and by licensing our proprietary technology. In order to develop a viable cellulosic ethanol business, we will need to:
| • | successfully complete the optimization of our demonstration facility; |
| • | successfully design, finance and construct commercial-scale cellulosic ethanol facilities; and |
| • | prove that we can operate commercial-scale ethanol facilities at costs that are competitive with grain-based ethanol facilities, other cellulosic ethanol technologies that may be developed and other alternative fuel technologies that may be developed. |
Currently, there are no commercial-scale cellulosic ethanol production plants in operation in the United States, and we have no previous experience developing, constructing or operating commercial-scale cellulosic ethanol production plants. We are in the optimization phase of our first demonstration-scale cellulosic ethanol facility. There can be no assurance that we will be able to develop and operate cellulosic ethanol production plants on a commercial scale, that we will be able to successfully license our technology to third parties, or that any cellulosic ethanol facilities developed by us or our licensees will be profitable.
We may not realize the economic return expected from our acquired in-process research and development.
We allocated $42.4 million of the purchase price of Celunol on June 20, 2007 to acquired in-process research and development projects. Acquired in-process research and development, or IPR&D, represents the valuation of acquired, to-be-completed research projects. Prior to the merger, Celunol’s ongoing research and development initiatives primarily involved the development of its patented and proprietary biotechnology to enable production of fuel-grade ethanol from cellulosic biomass materials. As of the merger date, pursuant to authoritative guidance, these projects were not determined to have reached technological feasibility and have no alternative future use. Accordingly, the amounts allocated to those projects were expensed in our statements of operations in June 2007, the period in which the merger was consummated.
48
Table of Contents
The values of the research projects, namely, our “Generation 1” or “Gen 1” technology, were determined by estimating the costs to develop the acquired technology into commercially viable products, estimating the resulting net cash flows from the projects, and discounting the net cash flows to their present value. These cash flows were estimated by forecasting total revenue expected from these products and then deducting appropriate operating expenses, cash flow adjustments and contributory asset returns to establish a forecast of net cash flows arising from the acquired in-process technology. These cash flows were substantially reduced to take into account the time value of money and the risks associated with the inherent difficulties and uncertainties given the projected stage of development of these projects at closing. Due to the nature of the forecast and the risks associated with the projected growth and profitability of the developmental projects, discount rates of 40% were considered appropriate for valuation of the IPR&D. We believe that these discount rates were commensurate with the projects’ stage of development and the uncertainties in the economic estimates described above.
Since our IPR&D represents costs for technology that has not yet reached technological feasibility, we have, and will continue to, require substantial investment in the future development and commercialization of our Gen 1 technology. While we expect to deploy this technology at a commercial scale as early as 2012, we cannot assure you that we will ever be successful in commercializing this technology. If these projects are not successfully developed, our sales and profitability will be adversely affected in future periods.
If we are unable to successfully operate our pilot cellulosic ethanol production facility or to successfully optimize and operate our demonstration-scale cellulosic ethanol production facility, we may be unable to proceed with the development of cellulosic facilities on a commercial-scale, which would have a material adverse effect on our business.
To date, we have not operated demonstration-scale cellulosic ethanol facilities or built or operated commercial-scale cellulosic ethanol facilities. The development of a portfolio of ethanol production facilities is dependent on the performance of our pilot facility, which we continue to upgrade, as well as our demonstration facility, which is now in the optimization phases. The operation of our pilot facility and the optimization of our demonstration facility might be subject to significant interruption and delay in case of a major accident or damage from severe weather or other natural disasters, or due to supply shortages of necessary materials and services which we, along with other participants in the ethanol industry, have experienced. For these and other reasons, the operation of our pilot facility and the optimization and operation of our demonstration facility may be subject to significant cost overruns from our budgeted amounts. If we are unable to fund these expenditures, our progress at the pilot facility and demonstration facility could be significantly delayed or curtailed until such financing is available. In addition, our demonstration facility, once operational, may not produce ethanol in sufficient quantities or the operating costs for the facility may be significantly higher than we have expected. If we are unable to produce ethanol in the demonstration facility at competitive variable and/or total costs, we may be unable to proceed with the development of commercial-scale facilities.
In order to successfully develop commercial-scale facilities, we will need to address siting, construction and other issues, and if we fail to successfully overcome these issues we will not be able to commercialize our technology.
Even if we can demonstrate that our technology can be deployed on a commercial-scale to produce cellulosic ethanol on a cost-competitive basis, in order to be successful we must develop a number of commercial-scale projects. In order to successfully develop commercial-scale projects, we must overcome a number of risks and uncertainties including the following:
| • | Sites. In order to develop commercial facilities, we will need to identify and obtain rights to appropriate sites. In evaluating and obtaining sites, we will need to address a number of issues, including the proximity to potential feedstocks and proximity to transportation infrastructure and end-user markets. Competition for suitable cellulosic ethanol production sites may increase as the market evolves. We may not find suitable additional sites for the construction of new facilities. |
49
Table of Contents
| • | Joint Venture Partners. In addition to identifying sites for projects we develop on our own and with BP, we may seek to develop commercial facilities through other joint venture partners. We may not find suitable joint venture partners for construction of new facilities. As the market for cellulosic ethanol projects evolves, competition may increase for potential joint venture partners with favorable sites. |
| • | Supply of Cellulosic Feedstock. Operation of commercial facilities requires a continuous long-term supply of feedstocks that are generally located in geographic proximity to the facility. We may not be successful in obtaining long-term supply agreements, or our supply of feedstocks could be disrupted by weather, climate, natural disasters, or other factors. In addition, prices and competition for feedstocks could increase, adversely effecting our ability to operate economically or at all. |
| • | Off-Take Arrangements. In order to successfully develop a commercial-scale facility, we will need to enter into off-take arrangements for the sale of ethanol to be produced at that facility. If we are unable to enter into appropriate off-take arrangements, we may be unable to obtain project financing for the particular facility. |
| • | Construction. We will need to identify and retain a significant number of contractors, engineering firms, construction firms and equipment suppliers on satisfactory terms in order to be able to develop and construct multiple commercial-scale cellulosic ethanol facilities. These vendors also receive requests and orders from other companies in the ethanol and other industries and, therefore, we may not be able to secure their services or products on a timely basis or on acceptable financial terms. If we are unable to enter into construction and supply contracts on satisfactory terms, we will not be able to obtain financing for our commercial scale projects. In addition, our construction costs may also increase to levels that would make a new facility too expensive to develop or unprofitable to operate. |
| • | Operating Risks. If we are able to build commercial-scale ethanol facilities, our operation of these facilities may be subject to labor disruptions and unscheduled downtime, or other operational hazards inherent in the ethanol industry, such as equipment failures, fires, explosions, abnormal pressures, blowouts, pipeline ruptures, transportation accidents and natural disasters. Some of these operational hazards may cause personal injury or loss of life, severe damage to or destruction of property and equipment or environmental damage, and may result in suspension of operations and the imposition of civil or criminal penalties. Our insurance may not be adequate to fully cover the potential operational hazards described above. Any delay in development or interruption due to these potential operational risks could result in substantial losses and material adverse effects on our results of operations. |
We will rely heavily on future strategic partners to support our biofuels business.
An important component of our current business plan is to enter into strategic partnerships:
| • | to provide capital, equipment and facilities, including significant capital for the construction of cellulosic ethanol research and production facilities; |
| • | to provide expertise in performing certain process development, production and logistical activities; |
| • | to provide funding for research and development programs, process development programs and commercialization activities; |
| • | to provide access to cellulosic feedstocks; and |
| • | to support or provide sales, marketing and distribution services. |
These arrangements with collaborative partners are, and will continue to be, critical to our success in implementing our vertical integration biofuels strategy and manufacturing and selling cellulosic ethanol profitably. We cannot guarantee that any collaborative relationship(s) will be entered into, or if entered into, will continue or be successful. Our collaborative partners could experience business difficulties which eliminate or
50
Table of Contents
impair their ability to effectively perform under our arrangements with them. Failure to make or maintain these arrangements or a delay or failure in a collaborative partner’s performance under any such arrangements would materially adversely affect our business and financial condition.
We cannot control our collaborative partners’ performance or the resources they devote to our programs. We may not always agree with our partners nor will we have control of our partners’ activities. The performance of our programs may be adversely affected and programs may be delayed or terminated or we may have to use funds, personnel, equipment, facilities and other resources that we have not budgeted to undertake certain activities on our own as a result of these disagreements. Performance issues, program delays or termination or unbudgeted use of our resources may materially adversely affect our business and financial condition.
Disputes may arise between us and a collaborative partner and may involve the issue of which of us owns the technology and other intellectual property that is developed during a collaboration or other issues arising out of the collaborative agreements. Such a dispute could delay the program on which we are working or could prevent us from obtaining the right to commercially exploit such developments. It could also result in expensive arbitration or litigation, which may not be resolved in our favor. Our collaborative partners could merge with or be acquired by another company or experience financial or other setbacks unrelated to our collaboration that could, nevertheless, adversely affect us.
In order to gain broad acceptance of our technology, we may need to enter into licensing arrangements with third parties. If we fail to successfully identify and enter into licenses with qualified third parties or to successfully manage existing and future licensing relationships, we may not be able to successfully commercialize our technology.
We currently have a technology transfer agreement in place with Marubeni Corporation and Tsukishima Kikai Co., Ltd. We also expect that a significant portion of our future revenue could be derived from licensing agreements that we or our Galaxy joint venture with BP will enter into in the future. If we fail to enter into and maintain license agreements, we may not be able to gain broad acceptance for our technology, grow our business or generate sufficient revenues to support our operations. Our future license opportunities could be harmed if:
| • | we do not successfully operate our pilot facility or successfully optimize and operate our demonstration facility; |
| • | we are unable to successfully develop commercial-scale facilities; |
| • | we develop processes or enter into licenses that conflict with the business objectives of our existing licensees; |
| • | we disagree with our licensees as to rights to intellectual property we develop or our licensees’ research programs or commercialization activities; |
| • | we are unable to manage multiple licensee relationships; |
| • | our licensees become our competitors or enter into agreements with our competitors; |
| • | our licensees become less willing to expend their resources on research or development due to general market conditions or other circumstances beyond our control; or |
| • | consolidation in our target markets limits the number of potential strategic licensees or we are unable to negotiate additional license agreements having terms satisfactory to us. |
We may not be able to develop manufacturing capacity sufficient to meet demand in an economical manner or at all.
If demand for cellulosic ethanol increases beyond the scope of our production facilities, we may incur significant expenses in the expansion and/or construction of production facilities and increases in personnel in
51
Table of Contents
order to increase production capacity. To finance the expansion of a commercial-scale production facility is complex and expensive. We cannot assure you that we will have the necessary funds to finance the development of production facilities, or that we will be able to develop this infrastructure in a timely or economical manner, or at all.
The feedstocks, raw materials and energy necessary to produce ethanol may be unavailable or may increase in price, adversely affecting our sales and profitability.
We intend to use various sources of cellulosic biomass, such as sugarcane bagasse, dedicated energy crops, agricultural residues (which may include corn stover), sorghum, switchgrass and wood, to make cellulosic ethanol. However, rising prices for any or all of these feedstocks would produce lower profit margins and, therefore, represent unfavorable market conditions. This is especially true since market conditions generally would not allow us to pass along increased costs to customers, because the price of ethanol is primarily determined by other factors, such as the price of oil and gasoline. Additionally, once we elect to use a particular feedstock in the ethanol production process, it may be technically or economically impractical to change to a different feedstock. At certain levels, feedstock prices may make ethanol uneconomical to use in markets where the use of fuel oxygenates is not mandated.
Weather conditions and other factors affecting crop yields, farmer planting decisions, and general economic, market and regulatory factors may influence the availability, transportation costs and price of biomass feedstocks used in our pilot facility and to be used in our demonstration- and commercial-scale production facilities. There can be no guarantee that feedstock costs to us may not increase over time. Government policies and subsidies with respect to agriculture and international trade, and global and local demand and supply, also impact the price and transportation costs of agricultural products. The significance and relative effects of these factors on the potential cost of feedstocks are difficult to predict. Any increase in the cost of feedstocks will result in increased costs, and negative effects on our operating results. Other inputs to our cellulosic-ethanol production process will also be subject to price variation. These include chemicals, nutrients, enzymes, acid and lime, among others. Increases in the costs of these materials, or our failure to achieve reductions in the use of such materials, could increase our operating costs and have negative effects on our operating results. The gross margin of our anticipated ethanol production business depends principally on the spread between the price for ethanol and our production costs. Any increase in production costs or decrease in the demand or price of ethanol will negatively affect our business.
The production of ethanol also requires a significant amount of other raw materials and energy, primarily water, electricity and natural gas. We plan to utilize the lignin remaining after the pretreatment of cellulosic biomass as a source of energy to power our cellulosic ethanol production facilities, however we may not be successful in using lignin as a source of energy and, if so, we may have to supplement our energy use with other sources, including electricity and natural gas. The prices of electricity and supplemental fuels such as natural gas have fluctuated significantly in the past and may fluctuate significantly in the future. Local water, electricity and gas utilities may not be able to reliably supply the water, electricity and supplemental fuels that our facilities will need or may not be able to supply such resources on acceptable terms. In addition, if there is an interruption in the supply of water or energy for any reason, we may be required to halt ethanol production.
The high concentration of our efforts towards developing processes for the production of cellulosic ethanol could increase our losses, especially if demand for ethanol declines.
If we are successful in producing and marketing cellulosic ethanol, our revenue will be derived primarily from sales of ethanol. Ethanol competes with several other existing products and other alternative products could also be developed for use as fuel additives. An industry shift away from ethanol or the emergence of new competing products may reduce the demand for ethanol. A downturn in the demand for ethanol would significantly and adversely affect any sales and/or profitability.
52
Table of Contents
The market price of ethanol is volatile and subject to significant fluctuations, which may cause our profitability from the production of cellulosic ethanol to fluctuate significantly.
The market price of ethanol is dependent upon many factors, including the price of gasoline, which is in turn dependent upon the price of petroleum. Petroleum prices are highly volatile and difficult to forecast due to frequent changes in global politics and the world economy. The distribution of petroleum throughout the world is affected by incidents in unstable political environments, such as Iraq, Iran, Kuwait, Saudi Arabia, Nigeria, Venezuela, the former U.S.S.R. and other countries and regions. The industrialized world depends critically upon oil from these areas, and any disruption or other reduction in oil supply can cause significant fluctuations in the prices of oil and gasoline. We cannot predict the future price of oil or gasoline and may establish unprofitable prices for the sale of ethanol due to significant fluctuations in market prices. In recent years, the prices of gasoline, petroleum and ethanol have all reached historically high levels. If the prices of gasoline and petroleum decline, we believe that the demand for and price of ethanol may be adversely affected. Fluctuations in the market price of ethanol may cause our revenue and profitability to fluctuate significantly from quarter-to-quarter and year-to-year.
The production of ethanol has expanded rapidly in recent years. As of the end of 2009, according to RFA, there was more than 13 billion gallons of installed capacity in the US, including more than 1.15 billion gallons of idled capacity, and over 1.4 billion gallons of projects under construction or expansion. We expect existing ethanol plants to expand by increasing production capacity and actual production, particularly in response to the mandates contained in the Renewable Fuel Standard as expanded in the Energy Independence and Security Act of 2007 (“RFS2”). Increases in the demand for ethanol may not be commensurate with increasing supplies of ethanol, particularly in light of factors such as the 10% limitation on ethanol blending in gasoline and the rate of expansion of E85 dispensing infrastructure. Thus, increased production of ethanol may lead to lower ethanol prices. Also, the increased production of ethanol could result in increased demand for feedstocks for the production of ethanol. This could result in higher prices for feedstocks and cause higher ethanol production costs and, in the event that we are unable to pass increases in the price of feedstocks on to our customers, will result in lower profits. We cannot predict the future price of ethanol or feedstocks. Any material decline in the price of ethanol, or any material increase in the price of feedstocks, will adversely affect any sales and/or profitability.
If ethanol demand decreases, does not increase, or does not increase as much as supply, there may be excess capacity in our industry which would likely cause a decline in ethanol prices, adversely impacting our results of operations, cash flows and financial condition.
Domestic fuel ethanol production has increased steadily from 1.5 billion gallons per year in 1999 to 10.6 billion gallons per year in 2009, according to the Renewable Fuels Association. In addition, there is a significant amount of capacity being added to the fuel ethanol industry, including capacity that may be added as a result of government programs and/or incentives, and capacity added to address anticipated increases in demand. However, demand for ethanol may not increase as quickly as expected, or at all. If the ethanol industry has excess capacity, a fall in prices will likely occur which will have an adverse impact on the viability of our vertical integration strategy within biofuels, as well as our results of operations, cash flows and financial condition if we proceed to market ethanol. Demand for ethanol could be impaired due to a number of factors, including regulatory developments, limits on the blending of ethanol in gasoline, the pace of infrastructure development for high-ethanol fuel blends including E85, and reduced United States gasoline consumption. Reduced gasoline consumption could occur as a result of increased gasoline or oil prices. For example, price increases could cause businesses and consumers to reduce driving or acquire vehicles with more favorable gasoline mileage capabilities. A petition filed with the EPA in March 2009 to allow an increase of ethanol blending in gasoline from 10% up to 15% remains pending in early 2010.
53
Table of Contents
The United States ethanol industry is highly regulated by federal and state legislation and regulation and any changes in such legislation or regulation could materially adversely affect our results of operations and financial condition.
The elimination or significant reduction in the Federal Excise Tax Credit could have a material adverse effect on our results of operations.
The production of ethanol is made significantly more competitive by federal tax incentives. The Volumetric Ethanol Excise Tax Credit, or VEETC, program, which is scheduled to expire on December 31, 2010, allows gasoline distributors that blend ethanol with gasoline to receive a federal excise tax rate reduction for each blended gallon they sell regardless of the blend rate. The current federal excise tax on gasoline is $0.184 per gallon, and is paid at the terminal by refiners and marketers. If the fuel is blended with ethanol, the blender may claim a $0.45 tax credit for each gallon of ethanol used in the mixture. In addition, Congress enacted a $1.01/gallon production tax credit (“PTC”) that is available to cellulosic biofuels producers in the Farm, Conservation and Energy Act of 2008 (“FCEA”). This credit, which is inclusive of the VEETC, is set to expire on December 31, 2012. The VEETC may not be renewed prior to its expiration in 2010, or if renewed, it may be renewed on terms significantly less favorable than current tax incentives. In addition, the blenders’ credits, as well as other federal and state programs benefiting ethanol (such as tariffs), generally are subject to United States government obligations under international trade agreements, including those under the World Trade Organization Agreement on Subsidies and Countervailing Measures, and might be the subject of challenges thereunder, in whole or in part. The elimination or significant reduction in either the VEETC or the PTC could have a material adverse effect on our results of operations.
Waivers of the Renewable Fuels Standard minimum levels of renewable fuels included in gasoline, or the lapse of the increased weight given for the use of cellulosic ethanol for compliance with the Renewable Fuels Standard, could have a material adverse effect on our results of operations.
Under the Energy Policy Act of 2005, the Department of Energy, in consultation with the Secretary of Agriculture and the Secretary of Energy, may waive the Renewable Fuels Standard, or RFS, mandate with respect to one or more states if the administrator determines that implementing the requirements would severely harm the economy or the environment of a state, a region or the United States, or that there is inadequate supply to meet the requirement. Any waiver of the RFS with respect to one or more states or with respect to a particular year, or the lapse or alteration of the extra weight cellulosic ethanol is given in complying with the RFS, could adversely affect demand for ethanol and could have a material adverse effect on our results of operations and financial condition.
While the Energy Policy Act of 2005 imposes the RFS, it does not mandate the use of ethanol and eliminates the oxygenate requirement for reformulated gasoline in the Reformulated Gasoline Program included in the Clean Air Act.
The Reformulated Gasoline, or RFG, program’s oxygenate requirements contained in the Clean Air Act was completely eliminated on May 5, 2006 by the Energy Policy Act of 2005. While the RFA expects that ethanol should account for the largest share of renewable fuels produced and consumed under the RFS, the RFS is not limited to ethanol and also includes biodiesel and any other liquid fuel produced from biomass or biogas. The elimination of the oxygenate requirement for reformulated gasoline in the RFG program included in the Clean Air Act may result in a decline in ethanol consumption in favor of other alternative fuels, which in turn could have a material adverse effect on our results of operations and financial condition.
The elimination or alteration of the mandates for ethanol use contained in the Energy Independence and Security Act of 2007 could have a material adverse effect on our results of operations.
Under the Energy Independence and Security Act of 2007, use of renewable fuels, including ethanol, in the United States is mandated to increase from 12.95 billion gallons in 2010 to 36 billion gallons by 2022. The Act
54
Table of Contents
also mandates the use of 16 billion gallons per year of cellulosic ethanol by 2022. Elimination or reduction of these mandated targets could adversely affect demand for ethanol and could have a material adverse effect on our results of operations and financial condition.
Changes in enacted federal, state or local legislation, or the enaction of new legislation, may adversely impact our business.
Federal, state and local legislators may enact legislation, or modify or amend currently enacted legislation, that could adversely affect the industries in which we currently operate. For example, several federal laws encourage the development of the ethanol and/or biofuels industry in the United States. If those laws are repealed or are not renewed, it could adversely impact the ethanol and/or biofuels industries as a whole, which would have an adverse effect on our financial results. In addition, legislation could be enacted that might not negatively impact our industry as a whole, but could negatively impact that portion of the industry in which we operate or our particular business. For example, in the future we may consider the effect of state or local incentives, such as grants or tax abatements, in formulating our internal projections and budgets and when choosing where to locate and operate commercial-scale plants for the production of cellulosic ethanol. If those incentives should be repealed or no longer become available, the profitability of any commercial-scale plants which are reliant on such incentives could be negatively affected, which in turn would negatively affect our operating results.
Certain countries can export ethanol to the United States duty-free, which may undermine the ethanol production industry in the United States.
Imported ethanol is generally subject to a $0.54 per gallon tariff and a 2.5% ad valorem tax that was designed to offset the $0.51 per gallon ethanol subsidy available under the federal excise tax incentive program for refineries that blend ethanol in their fuel. There is a special exemption from the tariff for ethanol imported from certain countries in Central America and the Caribbean islands, which is limited to a total of 7.0% of United States production per year (with additional exemptions for ethanol produced from feedstock in the Caribbean region over the 7.0% limit). We do not know the extent to which the volume of imports would increase or the effect on United States prices for ethanol if the tariff is not renewed beyond its current expiration in early 2011. In addition The North America Free Trade Agreement countries, Canada and Mexico, are exempt from duty. Imports from the exempted countries have increased in recent years and are expected to increase further as a result of new plants under development. In particular, the ethanol industry has expressed concern with respect to a new plant under development by Cargill, Inc., one of the largest ethanol producers in the United States, in El Salvador that would take the water out of Brazilian ethanol and then ship the dehydrated ethanol from El Salvador to the United States duty-free. Since production costs for ethanol in Brazil are estimated to be significantly less than what they are in the United States, the import of the Brazilian ethanol duty-free through El Salvador, or the import of ethanol duty-free from any country exempted from the tariff, may negatively impact the demand for domestic ethanol and the price at which we sell our ethanol.
Our competitive position, financial position and results of operations may be adversely affected by technological advances.
Even if we are able to execute our business plan and develop commercial-scale cellulosic ethanol production plants and successfully license our proprietary technology, the development and implementation of new technologies may result in a significant reduction in the costs of ethanol production by others. For example, any technological advances by others in the efficiency or cost to produce ethanol from corn or other biomass could have an adverse effect on our competitiveness. We cannot predict when new technologies may become available, the rate of acceptance of new technologies by our competitors or the costs associated with new technologies. In addition, advances in the development of alternatives to ethanol could significantly reduce demand for or eliminate the need for ethanol. Any advances in technology which require significant capital expenditures to remain competitive or which reduce demand or prices for ethanol would have a material adverse effect on the results of our operations and financial position.
55
Table of Contents
The termination or loss of our exclusive license from the University of Florida Research Foundation, Inc., would have a material adverse effect on our business.
We have an exclusive worldwide license to use, develop and commercially exploit the ethanol production patent estate of the University of Florida Research Foundation, Inc., or UFRFI, which consists of several patents and pending patents and other related proprietary ethanol technology, and any extensions and improvements thereof for the production of ethanol, all of which is referred to herein as the UFRFI technology. The UFRFI license agreement expires on the later of October 2015 or the expiration of the last patent related to the UFRFI licensed technology. Based on the latest to expire of the current granted United States patents, the UFRFI license agreement will extend into 2022. Pending and future patent applications related to the UFRFI licensed technology, if granted, would extend the expiration date of the UFRFI license agreement beyond 2026. Loss of the rights to the UFRFI technology licensed to us, for example, due to our inability to comply with the terms and conditions or otherwise of the UFRFI license agreement would have a material adverse effect on our business.
Growth in the sale and distribution of ethanol is dependent on the changes to and expansion of related infrastructure which may not occur on a timely basis, if at all, and our contemplated operations could be adversely affected by infrastructure disruptions.
Substantial development of infrastructure will be required by persons and entities outside our control for our contemplated licensing and cellulosic ethanol production operations, and the ethanol industry generally, to grow. Areas requiring expansion include, but are not limited to:
| • | the automobile industry’s manufacture of flexible fuel vehicles; |
| • | additional rail capacity affecting distribution of ethanol; |
| • | additional storage facilities for ethanol; |
| • | increases in truck fleets capable of transporting ethanol within localized markets; |
| • | expansion of refining and blending facilities to handle ethanol; and |
| • | growth in service stations equipped to handle ethanol fuels. |
Substantial investments required for these infrastructure changes and expansions may not be made or they may not be made on a timely basis. Any delay or failure in making the changes to or expansion of infrastructure could hurt the demand for our proprietary technology or the production of cellulosic ethanol, impede our delivery of cellulosic ethanol, impose additional costs on us, or otherwise have a material adverse effect on our results of operations or financial position. Our contemplated business will be dependent on the continuing availability of infrastructure and any infrastructure disruptions could have a material adverse effect on our business.
New ethanol plants under construction or decreases in the demand for ethanol may result in excess United States production capacity.
A number of our competitors are divisions of substantially larger enterprises and have substantially greater financial resources than we have. Smaller competitors also pose a threat. Farmer-owned cooperatives and independent firms consisting of groups of individual farmers and investors have been able to compete successfully in the ethanol industry. These smaller competitors operate smaller facilities which do not affect the local price of corn grown in proximity to the facility as much as larger facilities. In addition, many of these smaller competitors are farmer-owned and often require their farmer-owners to commit to selling them a certain amount of corn as a requirement of ownership. A significant portion of production capacity in the ethanol industry consists of smaller-sized facilities. In addition, institutional investors and high net worth individuals could heavily invest in ethanol production facilities and oversupply the demand for ethanol, resulting in lower ethanol price levels that might adversely affect the results of our contemplated cellulosic ethanol production operations and financial position.
56
Table of Contents
Risks Specific to Our Specialty Enzymes Business
Macroeconomic conditions beyond our control could lead to decreases in demand for our products, reduced profitability or deterioration in the quality of our accounts receivable.
Domestic and international economic, political and social conditions are uncertain due to a variety of factors, including
| • | global, regional and national economic downturns; |
| • | the availability and cost of credit; |
| • | volatility in stock and credit markets; |
| • | energy costs; |
| • | fluctuations in currency exchange rates |
| • | the risk of global conflict; |
| • | the risk of terrorism and war in a given country or region; and |
| • | public health issues. |
Our business depends on our customers’ demand for our products and services, the general economic health of current and prospective customers, and their desire or ability to make investments in technology. A deterioration of global, regional or local political, economic or social conditions could affect potential customers in a way that reduces demand for our products and disrupts our manufacturing and sales plans and efforts. These global, regional or local conditions also could disrupt commerce in ways that could interrupt our supply chain and our ability to get products to our customers. These conditions may also affect our ability to conduct business as usual. Changes in foreign currency exchange rates may negatively impact reported revenue and expenses. In addition, our sales are typically made on unsecured credit terms that are generally consistent with the prevailing business practices in the country in which the customer is located. A deterioration of political, economic or social conditions in a given country or region could reduce or eliminate our ability to collect accounts receivable in that country or region. In any of these events, our results of operations could be materially and adversely affected.
The financial instability of our customers could adversely affect our business and result in reduced sales, profits and cash flows.
We sell our products to and extend credit to our customers based on an evaluation of each customer’s financial condition, usually without requiring collateral. Our Fuelzyme customers are particularly exposed to the challenges facing the corn ethanol industry. While customer credit losses have historically been within our expectations and reserves, we cannot assure you that this will continue. The financial difficulties of a customer could cause us to curtail business with that customer or the customer to reduce its business with us and cancel orders. Our inability to collect on our trade accounts receivable from any of our major customers could adversely affect our results of operations and financial condition.
Our international manufacturing operations are subject to the risks of doing business abroad, which could affect our ability to manufacture our products in international markets, obtain products from foreign suppliers or control the costs of our products.
We manufacture a majority of our commercial enzyme products through a manufacturing facility in Mexico City owned by Fermic S.A., or Fermic. As a result, we are subject to the general risks of doing business outside the U.S., particularly Mexico, including, without limitation, work stoppages, transportation delays and interruptions, political instability, expropriation, nationalization, foreign currency fluctuation, changing economic conditions, the imposition of tariffs, import and export controls and other non-tariff barriers, and changes in local government administration and governmental policies, and to factors such as the short-term and long-term effects
57
Table of Contents
of health risks like the recent outbreak of swine flu. There can be no assurance that these factors will not adversely affect our business, financial condition or results of operations.
If we are unable to access the capacity to manufacture products in sufficient quantity, we may not be able to commercialize our products or generate significant sales.
We have only limited experience in enzyme manufacturing, and we do not have our own internal capacity to manufacture specialty enzyme products on a commercial scale. We expect to be dependent to a significant extent on third parties for commercial scale manufacturing of our specialty enzyme products. We have arrangements with third parties that have the required manufacturing equipment and available capacity to manufacture our commercial enzymes. While we have our own pilot development facility, we continue to depend on third parties for large-scale commercial manufacturing. Additionally, one of our third party manufacturers is located in a foreign country, and is our sole-source supplier for most of our commercial enzyme products. Any difficulties or interruptions of service with our third party manufacturers or our own pilot manufacturing facility could disrupt our research and development efforts, delay our commercialization of specialty enzyme products, and harm our relationships with our specialty enzyme strategic partners, collaborators, or customers.
We have experienced inventory losses and decreased manufacturing yields related to our manufacturing processes for Phyzyme and Fuelzyme, which negatively impacted our product gross margins.
We have in the past experienced inventory losses and decreased manufacturing yields related to contamination and manufacturing issues for Phyzyme and Fuelzyme. While we believe we have adequately resolved our contamination issues and have recovered a substantial portion of such losses from our third-party manufacturer Fermic, there can be no assurance that such losses will not occur in the future or that any amount of future losses will be reimbursed by Fermic. If such contamination issues continue in future periods, or we are not able to otherwise improve our manufacturing yields, our results of operations and financial condition would be adversely affected.
If Genencor assumes all or a part of our Phyzyme manufacturing, our gross product revenues will be adversely impacted and our product gross margins could decline.
Due to capacity constraints at Fermic in 2008, we were not able to supply adequate quantities of Phyzyme necessary to meet the increased demand from Danisco. As a result, we contracted with Genencor, a subsidiary of Danisco, to serve as a second-source manufacturer for Phyzyme. Pursuant to current accounting rules, revenue from Phyzyme that is supplied to us by Genencor is recognized in an amount equal to the royalty on operating profit received from Danisco, as compared to the full value of the manufacturing costs plus the royalty on operating profit we currently recognize for Phyzyme we manufacture at Fermic. While this revenue recognition treatment has little or no negative impact on the gross margin we recognize for every sale of Phyzyme, it does have a negative impact on the gross product revenue we recognize for Phyzyme as the volume of Phyzyme manufactured by Genencor increases.
In addition, our supply agreement with Danisco for Phyzyme contains provisions which allow Danisco, with six months advance notice, to assume manufacturing rights of Phyzyme. If Danisco were to exercise this right, we would also have the right to reduce our capacity commitment to Fermic; nevertheless, we may still experience significant excess capacity at Fermic as a result. If we were unable to absorb this excess capacity with other products, our results of operations and financial condition would be adversely effected.
We have only limited experience in independently developing, manufacturing, marketing, selling, and distributing commercial specialty enzyme products.
We currently have only limited resources and capability to develop, manufacture, market, sell, or distribute specialty enzyme products on a commercial scale. We will determine which specialty enzyme products to pursue
58
Table of Contents
independently based on various criteria, including: investment required, estimated time to market, regulatory hurdles, infrastructure requirements, and industry-specific expertise necessary for successful commercialization. At any time, we may modify our strategy and pursue collaborations for the development and commercialization of some specialty enzyme products that we had intended to pursue independently. We may pursue specialty enzyme products that ultimately require more resources than we anticipate or which may be technically unsuccessful. In order for us to commercialize more specialty enzyme products directly, we would need to establish or obtain through outsourcing arrangements additional capability to develop, manufacture, market, sell, and distribute such products. If we are unable to successfully commercialize specialty enzyme products resulting from our internal product development efforts, we will continue to incur losses in our specialty enzymes business, as well as in our business as a whole. Even if we successfully develop a commercial specialty enzyme product, we may not generate significant sales and achieve profitability in our specialty enzymes business, or in our business as a whole.
We have relied, and will continue to rely, heavily on strategic partners to support our specialty enzymes business.
Historically, we have relied upon a number of collaborations, including those with Syngenta, Danisco, Bunge, Cargill, and BASF, to enhance and support our development and commercialization efforts for our specialty enzymes. An important component of our business plan is to enter into strategic partnerships:
| • | to provide capital, equipment and facilities, including significant capital to develop and expand our enzyme manufacturing capabilities; |
| • | to provide funding for research and development programs, process development programs and commercialization activities for our specialty enzyme products; and |
| • | to support or provide sales, marketing and distribution services for our specialty enzyme products. |
These arrangements with collaborative partners are, and will continue to be, critical to the success of our specialty enzymes business. We cannot guarantee that any collaborative relationship(s) will be entered into, or if entered into, will continue or be successful. Our collaborative partners could experience business difficulties which eliminate or impair their ability to effectively perform under our arrangements with them. Failure to make or maintain these arrangements or a delay or failure in a collaborative partner’s performance under any such arrangements would materially adversely affect our business and financial condition.
We cannot control our collaborative partners’ performance or the resources they devote to our programs. We may not always agree with our partners nor will we have control of our partners’ activities. The performance of our programs may be adversely affected and programs may be delayed or terminated or we may have to use funds, personnel, equipment, facilities and other resources that we have not budgeted to undertake certain activities on our own as a result of these disagreements. Performance issues, program delays or termination or unbudgeted use of our resources may materially adversely affect our business and financial condition.
Disputes may arise between us and a collaborative partner and may involve the issue of which of us owns the technology and other intellectual property that is developed during a collaboration or other issues arising out of the collaborative agreements. Such a dispute could delay the program on which we are working or could prevent us from obtaining the right to commercially exploit such developments. It could also result in expensive arbitration or litigation, which may not be resolved in our favor. Our collaborative partners could merge with or be acquired by another company or experience financial or other setbacks unrelated to our collaboration that could, nevertheless, adversely affect us.
59
Table of Contents
Risks Related to Owning Our Common Stock
We are subject to anti-takeover provisions in our certificate of incorporation, bylaws, and Delaware law and have adopted a shareholder rights plan that could delay or prevent an acquisition of our company, even if the acquisition would be beneficial to our stockholders.
Provisions of our certificate of incorporation, our bylaws and Delaware law could make it more difficult for a third party to acquire us, even if doing so would be beneficial to our stockholders. In addition, we adopted a share purchase rights plan that has anti-takeover effects. The rights under the plan will cause substantial dilution to a person or group that attempts to acquire us on terms not approved by our board of directors. The rights should not interfere with any merger or other business combination approved by our board, since the rights may be amended to permit such an acquisition or may be redeemed by us. These provisions in our charter documents, under Delaware law, and in our rights plan could discourage potential takeover attempts and could adversely affect the market price of our common stock. Because of these provisions, our common stockholders might not be able to receive a premium on their investment.
We expect that our quarterly results of operations will fluctuate, and this fluctuation could cause our stock price to decline, causing investor losses.
Our quarterly operating results have fluctuated in the past and are likely to do so in the future. These fluctuations could cause our stock price to fluctuate significantly or decline. Revenue and expenses in future periods may be greater or less than in the immediately preceding period or in the comparable period of the prior year. Some of the factors that could cause our operating results to fluctuate include:
| • | termination of strategic alliances and collaborations; |
| • | the success rate of our discovery efforts associated with milestones and royalties; |
| • | the ability and willingness of strategic partners and collaborators to commercialize, market, and sell royalty-bearing products or processes on expected timelines; |
| • | our ability to enter into new agreements with potential strategic partners and collaborators or to extend the terms of our existing strategic alliance agreements and collaborations, and the terms of any agreement of this type; |
| • | our need to continuously recruit and retain qualified personnel; |
| • | our ability to successfully satisfy all pertinent regulatory requirements; |
| • | our ability to successfully commercialize products or processes developed independently and the demand and prices for such products or processes; |
| • | the cost and timing of optimization and operation of our cellulosic ethanol demonstration facility; |
| • | the extent, cost and timing of any new projects for the development of commercial-scale cellulosic ethanol facilities; |
| • | general and industry specific economic conditions, which may affect our, and our collaborative partners’, research and development expenditures; and |
| • | increased expenses related to the implementation of our vertical integration strategy within biofuels. |
A large portion of our expenses, including expenses for facilities, equipment and personnel, are relatively fixed. Failure to achieve anticipated levels of revenue could therefore significantly harm our operating results for a particular fiscal period.
Due to the possibility of fluctuations in our revenue and expenses, we believe that quarter-to-quarter comparisons of our operating results are not a good indication of our future performance. Our operating results in some quarters may not meet the expectations of stock market analysts and investors. In that case, our stock price would probably decline.
60
Table of Contents
Our stock price has been and may continue to be particularly volatile.
The market price of our common stock has in the past been and is likely to continue to be subject to significant fluctuations. Between January 1, 2006 and November 6, 2009, the closing market price of our common stock has ranged from a low of $2.76 to a high of $138.95. Since the completion of our merger with Celunol on June 20, 2007, the closing market price of our common stock has ranged from $2.76 to $81.96. The closing market price of our common stock on December 31, 2009 was $4.50, and the closing price of our common stock on March 12, 2010 was $5.95. Some of the factors that may cause the market price of our common stock to fluctuate include:
| • | the entry into, or termination of, key agreements, including key collaboration agreements and licensing agreements; |
| • | interruption or delay in the optimization and operation of our cellulosic ethanol demonstration facility; |
| • | risks and uncertainties related to siting, permitting, construction, materials and equipment procurement, and other issues related to development of commercial-scale facilities; |
| • | any inability to obtain additional financing on favorable terms to fund our operations and pursue our business plan; |
| • | reductions in the price of gasoline or increases in the prices for biomass feedstocks; |
| • | future royalties from product sales, if any, by our collaborative partners; |
| • | future royalties and fees for use of our proprietary processes, if any, by our licensees; |
| • | the initiation of material developments in, or conclusion of litigation to enforce or defend any of our intellectual property rights or otherwise; |
| • | our results of operations and financial condition, including our cash reserves and cost level; |
| • | general and industry-specific economic and regulatory conditions that may affect our ability to successfully develop and commercialize biofuels and cellulosic ethanol and other products; |
| • | significant accidents, damage from severe weather or other natural disasters affecting our cellulosic ethanol pilot and demonstration facilities; |
| • | developments involving our 2009 Notes, 2008 Notes and 2007 Notes; |
| • | the loss of key employees; |
| • | the introduction of technological innovations or alternative fuel sources or other products by our competitors; |
| • | decreases in the market for ethanol, and cellulosic ethanol; |
| • | sales of a substantial number of shares of our common stock by our large shareholders; |
| • | changes in estimates or recommendations by securities analysts, if any, who cover our common stock; |
| • | future sales of our common stock or other capital-raising activities; |
| • | issuance of shares by us, and sales in the public market of the shares issued, upon conversion of the 2009 Notes, 2008 Notes, 2007 Notes or exercise of our outstanding warrants, including the extent to which we issue shares versus pay cash in satisfaction of any “make-whole” obligation arising upon conversion of some or all of the 2008 Notes and 2009 Notes or to pay interest due under the 2008 Notes and 2009 Notes; and |
| • | period-to-period fluctuations in our financial results. |
Moreover, the stock markets in general are currently experiencing substantial volatility related to general economic conditions and may continue to experience volatility for some time. The stock markets have
61
Table of Contents
experienced in the past substantial volatility that has often been unrelated to the operating performance of individual companies. These broad market fluctuations may also adversely affect the trading price of our common stock.
In the past, following periods of volatility in the market price of a company’s securities, stockholders have often instituted class action securities litigation against those companies. Such litigation, if instituted, could result in substantial costs and diversion of management attention and resources, which could significantly harm our profitability and reputation.
Concentration of ownership among our existing officers, directors and principal stockholders may prevent other stockholders from influencing significant corporate decisions and depress our stock price.
Our officers, directors, and stockholders with at least 10% of our stock together controlled approximately 12% of our outstanding common stock as of December 31, 2009. If these officers, directors, and principal stockholders act together, they will be able to exert a significant degree of influence over our management and affairs and matters requiring stockholder approval, including the election of directors and approval of mergers or other business combination transactions. The interests of this concentration of ownership may not always coincide with our interests or the interests of other stockholders. For instance, officers, directors, and principal stockholders, acting together, could heavily contribute to our entering into transactions or agreements that we would not otherwise consider. Similarly, this concentration of ownership may have the effect of delaying or preventing a change in control of our company otherwise favored by our other stockholders. This concentration of ownership could depress our stock price.
Future sales of our common stock in the public market could cause our stock price to fall.
Sales of a substantial number of shares of our common stock in the public market, or the perception that these sales might occur could depress the market price of our common stock and could impair our ability to raise capital through the sale of additional equity securities. As of March 12, 2010, we had 12,098,322 shares of common stock outstanding.
Furthermore, the anti-dilution provisions of our 2008 Notes and of the warrants issued in connection therewith would be triggered by any issuance of shares of our common stock at a price below the conversion price or exercise price, as applicable, in effect at the time of such issuance, resulting in an increase in the number of shares of common stock issuable upon conversion or exercise, as applicable, of the 2008 Notes and the warrants issued in connection therewith, causing a further dilutive effect to other stockholders.
| ITEM 1B. | UNRESOLVED STAFF COMMENTS. |
None.
| ITEM 2. | PROPERTIES. |
Our executive offices are currently located in a 21,000 square foot office in Cambridge, Massachusetts leased through December 2013. Our research and development facilities are currently located in adjacent 75,000 and 61,000 square foot buildings in San Diego, California. The San Diego facilities are leased through November 2015 and March 2017, respectively. In connection with the corporate reorganization we announced on January 5, 2006, we consolidated our research and development facilities and in October 2007 we entered into a sublease agreement with a subtenant to occupy approximately 52,000 square feet of the 61,000 square-foot facility in San Diego. The sublease agreement expires in February 2015. We believe that our facilities are suitable and adequate to meet our current requirements. We support both our biofuels and specialty enzymes segments out of our San Diego and Cambridge facilities.
62
Table of Contents
We also own approximately 100 acres of land in Jennings, Louisiana, the site of our pilot plant and demonstration plant, and associated administrative and training facilities, all which support our biofuels business segment. We believe that our combined pilot and demonstration plant facilities will enable us to refine our production processes in advance of building, or partnering with others to build, commercial-scale cellulosic ethanol production facilities.
As part of our planned commercial facility in Highlands County, Florida and through one of our joint ventures with BP, we have an agreement which includes a facility site option and two farm leases. The first farm lease agreement was entered into on June 6, 2008 for a thirteen month term for 16,200 net plantable acres. The second farm lease agreement is for 192.4 net plantable acres for a term of one year to be automatically renewed for five years. The site option agreement for 142.2 acres of land was entered into on November 1, 2007 for a five year term, with an option to extend for 20 years.
| ITEM 3. | LEGAL PROCEEDINGS. |
Class Action Shareholder Lawsuit
In June 2004, the Company executed a formal settlement agreement with the plaintiffs in a class action lawsuit filed in December 2002 in a U.S. federal district court (the “Court”). This lawsuit is part of a series of related lawsuits in which similar complaints were filed by plaintiffs against hundreds of other public companies that conducted an Initial Public Offering (“IPO”) of their common stock in 2000 and the late 1990s (the “IPO Cases”). On February 15, 2005, the Court issued a decision certifying a class action for settlement purposes and granting preliminary approval of the settlement subject to modification of certain bar orders contemplated by the settlement. On August 31, 2005, the Court reaffirmed class certification and preliminary approval of the modified settlement. On April 24, 2006, the Court held a Final Fairness Hearing to determine whether to grant final approval of the settlement. On December 5, 2006, the Second Circuit Court of Appeals vacated the lower Court’s earlier decision certifying as class actions the six IPO Cases designated as “focus cases.” The Company is not one of the six focus cases. Thereafter, the District Court ordered a stay of all proceedings in all of the IPO Cases pending the outcome of the plaintiffs’ petition to the Second Circuit for rehearing en banc and resolution of the class certification issue. On April 6, 2007, the Second Circuit denied plaintiffs’ rehearing petition, but clarified that the plaintiffs may seek to certify a more limited class in the District Court. Accordingly, the settlement as originally negotiated was terminated pursuant to stipulation of the parties and will not be finally approved. On or about August 14, 2007, Plaintiffs filed amended complaints in the six focus cases, and thereafter moved for certification of the classes and appointment of lead plaintiffs and lead counsel in those cases. The six focus case issuers filed motions to dismiss the claims against them in November 2007 and an opposition to plaintiffs’ motion for class certification in December 2007. The Court denied the motions to dismiss on March 16, 2008. On October 2, 2008, the plaintiffs withdrew their class certification motion. On February 25, 2009, liaison counsel for plaintiffs informed the district court that a settlement of the IPO Cases had been agreed to in principle, subject to formal approval by the parties and preliminary and final approval by the court. On April 2, 2009, the parties submitted a tentative settlement agreement to the court and moved for preliminary approval thereof. On June 11, 2009, the Court granted preliminary approval of the tentative settlement and ordered that notice of the settlement to be published and mailed. The District Court held a final fairness hearing on September 10, 2009. On October 6, 2009, the District Court certified the settlement class in each IPO Case and granted final approval to the settlement. On or about October 23, 2009, three shareholders filed a Petition for Permission To Appeal Class Certification Order, objecting to the District Court’s final approval order and, in particular, asserting that the District Court’s certification of the settlement classes violates the Second Circuit’s earlier class certification decisions in the IPO Cases. Beginning on October 29, 2009, a number of shareholders also filed direct appeals, objecting to final approval of the settlement. Similar petitions and direct appeals may be filed by other shareholders. If the settlement is affirmed on appeal, the settlement will result in the dismissal of all claims against the Company and its officers and directors with prejudice, and the Company’s pro rata share of the settlement fund will be fully funded by insurance.
63
Table of Contents
The Company is covered by a claims-made liability insurance policy which it believes will satisfy any potential liability of the Company under this settlement. Due to the inherent uncertainties of litigation, and because the objecting shareholders are seeking to challenge the settlement on appeal, the ultimate outcome of this matter cannot be predicted.
Noteholder Lawsuit
On April 30, 2009, Capital Ventures International (“CVI”), a holder of the 2008 Notes, filed a lawsuit against the Company in the United States District Court for the Southern District of New York alleging that the Company breached the terms of the 2008 Notes by processing certain conversion notices submitted to the Company by CVI at $2.13 per share (now $25.56 per share on a reverse split-adjusted basis) or, following the amendment of the 2008 Notes, $1.74 per share (now $20.88 on a reverse-split adjusted basis) rather than $1.47 per share (now $17.64 per share on a reverse-split adjusted basis) and asserting that CVI is entitled to additional shares based on its asserted conversion price, as well as damages, and requesting a declaratory judgment that $1.47 per share (now $17.64 per share on a reverse-split adjusted basis) is the conversion price for the 2008 Notes. On June 3, 2009, CVI amended its complaint to also request a declaratory judgment that the Company cannot amend the 2008 Notes, pursuant to their terms, without the consent of each affected noteholder, including CVI. The Company filed its answer to CVI’s amended complaint on June 30, 2009, denying all material allegations of the complaint, as amended. An initial pre-trial conference was held on August 11, 2009 and the case is presently in the discovery phase.
On October 6, 2009, in response to the Company’s exchange of approximately $30.5 million of 2007 Notes, the granting of security interest in certain assets of the Company to exchanging holders and holders of the 2008 Notes and the public offering of common stock and warrants, CVI filed a Motion to Amend First Amended Complaint (the “Motion”). CVI’s proposed amended pleading alleges that the Company further breached the Note by both amending the terms of the 2008 Notes without CVI’s express consent and then undertaking various transactions authorized by the amendment. The amended pleading also alleges that as a result of these transactions the conversion rate should have adjusted to $4.27 per share rather than $17.89 per share. On February 25, 2010, the Court granted CVI’s Motion and CVI filed its Second Amended Complaint. The Company intends to file a response to the Second Amended Complaint on March 15, 2010.
Between February 27, 2009 and January 19, 2010, CVI converted all of their 2008 Notes, or approximately $14.5 million in face value, and the Company has issued approximately 1.3 million shares on a reverse-split adjusted basis, to settle these conversions and related “make-whole” obligations. Assuming the conversion prices asserted by CVI of $17.64 from February 27, 2009 through October 5, 2009 and $4.27 for conversions subsequent to October 6, 2009, 1.1 million additional shares would be issuable in connection with CVI’s conversions. The Company does not believe that this lawsuit will have a material impact on its financial statements. The Company believes any contingent liabilities related to these claims are not probable or estimable and therefore no amounts have been accrued for these matters.
Royalty Dispute
On August 31, 2009, the Company initiated an arbitration proceeding against Asahi Glass Co., Ltd. (“Asahi”) in the ICC International Court of Arbitration. The arbitration relates to a license agreement with Asahi whereby the Company obtained the right to use Asahi technology in connection with the manufacture of a product sold by the Company. In the arbitration, the Company seeks determinations that historical royalty payments made to Asahi were properly calculated and paid, reflecting all amounts properly subject to royalty obligations, and that Asahi has wrongfully interfered with advantageous business relations of the Company, as well as reimbursement of its damages, costs and expenses. In response to the Company’s Request for Arbitration, Asahi has claimed entitlement to additional royalties, breach of contract, patent infringement, misappropriation of trade secrets, breach of a covenant of good faith and fair dealing, and, if the Company is not found to have breached any of its obligations, seeks to set aside the contract. The Company believes it has valid defenses to Asahi’s claims, and intends to pursue those defenses, as well as its pending claims against Asahi, vigorously.
64
Table of Contents
In addition to the matters noted above, from time to time, the Company is subject to legal proceedings, asserted claims and investigations in the ordinary course of business, including commercial claims, employment and other matters, which management considers to be immaterial, individually and in the aggregate. In accordance with generally accepted accounting principles, the Company makes a provision for a liability when it is both probable that a liability has been incurred and the amount of the loss can be reasonably estimated. These provisions are reviewed at least quarterly and adjusted to reflect the impacts of negotiations, settlements, rulings, advice of legal counsel and other information and events pertaining to a particular case. Litigation is inherently unpredictable. However, the Company believes that it has valid defenses with respect to the legal matters pending against the Company. It is possible, nevertheless, that the Company’s consolidated financial position, cash flows or results of operations could be negatively affected by an unfavorable resolution of one or more of such proceedings, claims or investigations.
| ITEM 4. | RESERVED. |
65
Table of Contents
PART II
| ITEM 5. | MARKET FOR REGISTRANT’S COMMON EQUITY, RELATED STOCKHOLDER MATTERS AND ISSUER PURCHASES OF EQUITY SECURITIES. |
Set forth below is a table and chart comparing the total return on an indexed basis of $100 invested on December 31, 2004 in our common stock, the NASDAQ Market Index (total return) and our Verenium Peer Group, as identified in (b) below. The total return assumes reinvestment of dividends.
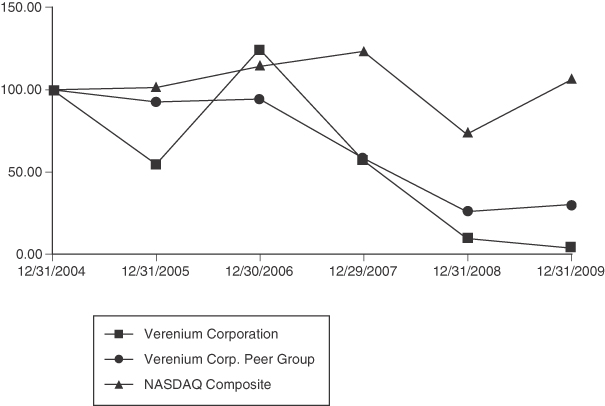
| Fiscal Year Ending | ||||||||||
| Company/Index/Market |
12/31/2005 | 12/30/2006 | 12/29/2007 | 12/31/2008 | 12/31/2009 | |||||
| Verenium Corp. |
54.92 | 124.49 | 57.09 | 10.07 | 4.29 | |||||
| Verenium Corp. Peer Group |
92.64 | 94.32 | 58.62 | 26.18 | 30.49 | |||||
| NASDAQ Market Index |
101.33 | 114.01 | 123.17 | 73.11 | 105.61 | |||||
(a) On June 20, 2007, we completed our merger with Celunol Corp., a private company. Upon completion of the merger we renamed the company Verenium Corporation. In connection with the corporate name change, we also changed our NASDAQ Global Market ticker symbol from “DVSA” to “VRNM” and began trading under the new ticker symbol effective June 21, 2007. The following table sets forth the high and low sale prices for our common stock for the periods indicated, as reported on the NASDAQ Global Market. The prices for the quarters ended before September 9, 2009 have been adjusted to reflect the 1-for-12 reverse stock split effected on that date. Such quotations represent inter-dealer prices without retail markup, markdown, or commission and may not necessarily represent actual transactions.
(b) We have identified our peer group for purposes of this table as the following companies: Aventine Renewable Energy, Biofuel Energy Corp, Exelixis Inc., Maxygen Incorporated, Pacific Ethanol, Inc., Senomyx,
66
Table of Contents
Inc. and Symyx Technologies, Inc. The companies we have identified in this peer group do not necessarily reflect all companies that we consider to be direct competitors, a listing of which can be found on page 26 of this annual report of Form 10-K.
| High | Low | |||||
| 2009 |
||||||
| First Quarter |
$ | 16.92 | $ | 2.76 | ||
| Second Quarter |
10.44 | 3.36 | ||||
| Third Quarter |
8.40 | 6.36 | ||||
| Fourth Quarter |
6.75 | 3.42 | ||||
| High | Low | |||||
| 2008 |
||||||
| First Quarter |
$ | 58.68 | $ | 28.20 | ||
| Second Quarter |
47.40 | 21.36 | ||||
| Third Quarter |
39.84 | 10.80 | ||||
| Fourth Quarter |
16.56 | 6.60 | ||||
As of March 12, 2010, there were approximately 85 holders of record of our common stock. We have never declared or paid any cash dividends on our capital stock. On March 12, 2010, the last sale price reported on the NASDAQ Global Market for our common stock was $5.95 per share. We currently intend to retain future earnings, if any, for development of our business and, therefore, do not anticipate that we will declare or pay cash dividends on our capital stock in the foreseeable future.
67
Table of Contents
| ITEM | 6. SELECTED FINANCIAL DATA. |
The selected consolidated financial data set forth below with respect to our consolidated statements of operations for the years ended December 31, 2009, 2008, and 2007, and with respect to our balance sheets at December 31, 2009 and 2008 are derived from our audited consolidated financial statements, which are included elsewhere in this report. The consolidated statement of operations data for the years ended December 31, 2006 and 2005 and the balance sheet data as of December 31, 2007, 2006, and 2005 are derived from our audited consolidated financial statements that are not included in this report. The selected consolidated financial data set forth below includes Celunol Corp. for the period from and including June 21, 2007 through December 31, 2009. All share and per share data has been retroactively adjusted for our 1-for-12 reverse stock split, which was effective September 9, 2009.
The selected financial information set forth below should be read in conjunction with “Management’s Discussion and Analysis of Financial Condition and Results of Operations” and our consolidated financial statements and related notes appearing elsewhere in this annual report on Form 10-K.
| Year Ended December 31, | ||||||||||||||||||||
| 2009 | 2008 | 2007 | 2006 | 2005 | ||||||||||||||||
| (in thousands, except per share data) | ||||||||||||||||||||
| Statement of Operations Data: |
||||||||||||||||||||
| Product revenue |
$ | 43,956 | $ | 49,083 | $ | 25,975 | $ | 15,867 | $ | 9,832 | ||||||||||
| Grant revenue |
16,837 | 6,920 | 2,717 | 3,317 | 10,079 | |||||||||||||||
| Collaborative revenue |
5,118 | 13,656 | 17,581 | 30,014 | 34,392 | |||||||||||||||
| Total revenue |
65,911 | 69,659 | 46,273 | 49,198 | 54,303 | |||||||||||||||
| Operating expenses: |
||||||||||||||||||||
| Cost of product revenue |
27,929 | 35,153 | 19,815 | 12,914 | 10,662 | |||||||||||||||
| Research and development |
63,961 | 63,438 | 52,296 | 46,667 | 68,382 | |||||||||||||||
| Selling, general and administrative |
38,356 | 44,822 | 37,497 | 30,192 | 17,359 | |||||||||||||||
| Goodwill impairment charge |
— | 106,134 | — | — | — | |||||||||||||||
| Acquired in-process research and development |
— | — | 42,400 | — | — | |||||||||||||||
| Amortization of acquired intangible assets |
— | — | — | — | 2,602 | |||||||||||||||
| Asset impairment charges |
— | — | — | — | 45,745 | |||||||||||||||
| Total operating expenses |
130,246 | 249,547 | 152,008 | 89,773 | 144,750 | |||||||||||||||
| Loss from operations |
(64,335 | ) | (179,888 | ) | (105,735 | ) | (40,575 | ) | (90,447 | ) | ||||||||||
| Interest and other income, net |
130 | 960 | 3,802 | 2,307 | 2,011 | |||||||||||||||
| Interest expense |
(11,105 | ) | (9,823 | ) | (5,652 | ) | (1,003 | ) | (1,282 | ) | ||||||||||
| Gain on contract settlement |
870 | — | — | — | — | |||||||||||||||
| Loss on exchange of 2007 Notes |
— | (3,599 | ) | — | — | — | ||||||||||||||
| Gain on amendment of 2008 Notes |
3,977 | — | — | — | ||||||||||||||||
| Gain (loss) on debt extinguishment upon conversion of convertible debt |
8,946 | (118 | ) | |||||||||||||||||
| Gain on net change in fair value of derivative assets and liabilities |
5,277 | 3,478 | — | — | — | |||||||||||||||
| Net loss |
(56,240 | ) | (188,990 | ) | (107,585 | ) | (39,271 | ) | (89,718 | ) | ||||||||||
| Loss attributed to noncontrolling interest in consolidated entities |
34,349 | 12,500 | — | — | — | |||||||||||||||
| Net loss attributed to Verenium Corporation |
$ | (21,891 | ) | $ | (176,490 | ) | $ | (107,585 | ) | $ | (39,271 | ) | $ | (89,718 | ) | |||||
| Net loss per share, basic and diluted |
$ | (2.58 | ) | $ | (33.03 | ) | $ | (23.65 | ) | $ | (10.14 | ) | $ | (24.43 | ) | |||||
| Weighted average shares outstanding |
8,470 | 5,344 | 4,550 | 3,872 | 3,672 | |||||||||||||||
| As of December 31, | ||||||||||||||||||||
| 2009 | 2008 | 2007 | 2006 | 2005 | ||||||||||||||||
| (in thousands) | ||||||||||||||||||||
| Balance Sheet Data: |
||||||||||||||||||||
| Cash, cash equivalents and short-term investments |
$ | 32,055 | $ | 7,458 | $ | 57,977 | $ | 51,912 | $ | 65,428 | ||||||||||
| Restricted cash |
10,400 | 10,040 | — | — | — | |||||||||||||||
| Working capital (deficit) |
21,408 | (23,765 | ) | 35,344 | 40,440 | 53,753 | ||||||||||||||
| Total assets |
167,922 | 153,623 | 264,779 | 79,905 | 98,069 | |||||||||||||||
| Long-term debt, less current portion |
105,756 | 130,495 | 121,160 | 3,724 | 6,332 | |||||||||||||||
| Stockholders’ equity (deficit) |
30,202 | (27,692 | ) | 95,215 | 42,916 | 64,804 | ||||||||||||||
68
Table of Contents
| ITEM 7. | MANAGEMENT’S DISCUSSION AND ANALYSIS OF FINANCIAL CONDITION AND RESULTS OF OPERATIONS. |
The following discussion of our financial condition and results of operations should be read in conjunction with the consolidated financial statements and the notes to those statements included elsewhere in this report. The results of operations discussed herein include the operating results of Celunol Corp. for the period from and including June 21, 2007 through December 31, 2009.
Except for the historical information contained herein, the following discussion, as well as the other sections of this report, contain forward-looking statements that involve risks and uncertainties. These statements speak only as of the date on which they are made, and we undertake no obligation to update any forward-looking statement.
Forward-looking statements applicable to our business generally include statements related to:
| • | the length of time that we will be able to fund our operations with existing cash and cash commitments and from other sources or potential sources of financing; |
| • | our expected cash needs, our ability to manage our cash and expenses and our ability to access future financing; |
| • | the continuation of, and expected benefits from, our strategic partnership with BP Biofuels North America LLC (“BP”) to advance our cellulosic ethanol technology; |
| • | our ability to continue as a going concern; |
| • | our estimates regarding market sizes and opportunities, as well as our future revenue, product revenue, profitability and capital requirements; |
| • | our expected future research and development expenses, sales and marketing expenses, and selling, general and administrative expenses; |
| • | the effects of governmental regulation and programs on our business and financial results; |
| • | our plans regarding future research, product development, business development, commercialization, growth, independent project development, collaboration, licensing, intellectual property, regulatory and financing activities; |
| • | our products and product candidates under development; |
| • | investments in our core technologies and in our internal product candidates; |
| • | the opportunities in our target markets and our ability to exploit them; |
| • | our plans for managing the growth of our business; |
| • | the benefits to be derived from our current and future strategic alliances; |
| • | our anticipated revenues from collaborative agreements, grants and licenses granted to third parties and our ability to maintain our collaborative relationships with third parties; |
| • | our ability to repay our outstanding debt (including in connection with any “make-whole” payments that may be due upon conversion of our 8% Senior Convertible Notes due April 1, 2012 (“2008 Notes”) and 9% Convertible Senior Secured Notes due April 1, 2027 (“2009 Notes”)); |
| • | the impact of dilution to our shareholders and a decline in our share price and our market capitalization from future issuances of shares of our common stock (including in connection with conversion of our convertible notes); |
| • | our exposure to market risk; |
69
Table of Contents
| • | the impact of litigation matters on our operations and financial results; and |
| • | the effect of critical accounting policies on our financial results. |
Forward looking statements applicable to our biofuels business include statements related to:
| • | the continuation of, and expected benefits from, our strategic partnership with BP to advance our cellulosic ethanol technology; |
| • | potential growth in the use of ethanol, including cellulosic ethanol, the economic prospects for the ethanol industry and cellulosic ethanol and the advantages of cellulosic ethanol versus ethanol and other fuel sources; |
| • | the continued development of our pilot facility; |
| • | the optimization of our demonstration-scale facility and our plans to prove the economic and commercial viability of our cellulosic ethanol production process in 2010; |
| • | our expectation that production from the commercial-scale cellulosic ethanol facility that Highlands Ethanol, LLC (dba Vercipia Biofuels LLC) (“Vercipia”) is developing in Highlands, Florida could begin as early as 2012 and that we could break ground for that facility as early as 2010, and that the estimated construction cost for that facility will be approximately $300 million; |
| • | the financing, development and construction of commercial-scale cellulosic ethanol facilities; |
| • | our ability to use multiple non-food feedstocks to produce cellulosic ethanol; |
| • | our expectation regarding funding amounts from the U.S. Department of Energy; and |
| • | the implied value of our biofuels business model. |
Forward looking statements applicable to our specialty enzymes business include statements related to:
| • | our ability to increase or maintain our product revenue and improve or maintain product gross margins; and |
| • | our ability to maintain good relationships with the companies with whom we contract for the manufacture of certain of the products in our specialty enzymes business. |
Factors that could cause or contribute to differences include, but are not limited to, risks related to our ability to fund our operations and continue as a going concern, risks involved with our new and uncertain technologies, risks associated with our dependence on patents and proprietary rights, risks associated with our protection and enforcement of our patents and proprietary rights, our dependence on existing collaborations, our ability to enter into and/or maintain collaboration and joint venture agreements, including our strategic partnership with BP, our ability to commercialize products directly and through our collaborators, the timing of anticipated regulatory approvals and product launches, the timing of conversion of the 2008 and 2009 Notes, if any, and our ability to make any required cash interest or “make-whole” payments if and when required, other risks associated with the 2008 and 2009 Notes as set forth in the section of this report entitled “Risk Factors,” and the development or availability of competitive products or technologies, as well as other risks and uncertainties set forth below and in the section of this report entitled “Risk Factors.”
Overview
We operate in two business segments, biofuels and specialty enzymes. Our biofuels business segment operates through our wholly-owned subsidiary, Verenium Biofuels Corporation and jointly-owned subsidiaries with BP, Galaxy Biofuels LLC (“Galaxy”), and Vercipia, and is focused on developing unique technical and operational capabilities designed to enable the production and commercialization of biofuels, in particular ethanol produced from cellulosic biomass. We currently believe the most significant commercial opportunity for
70
Table of Contents
our biofuels business segment will be derived from the large-scale commercial production of cellulosic ethanol derived from multiple non-food biomass feedstocks, with our initial focus on energy canes and grasses. Our specialty enzymes segment develops high-performance enzymes for use within the alternative fuels, specialty industrial processes, and animal nutrition and health markets to enable higher throughput, lower costs, and improved environmental outcomes. We believe the most significant commercial opportunity for our specialty enzymes business segment will be derived from continued sales, and gross product margins from our existing portfolio of enzyme products.
Our biofuels and specialty enzymes businesses are both supported by a research and development team with expertise in gene discovery and optimization, cell engineering, bioprocess development, biochemistry and microbiology. Over the past 18 years, our research and development team has developed a proprietary technology platform that has enabled us to apply advancements in science to discovering and developing unique solutions in complex industrial or commercial applications. We have dedicated substantial resources to the development of our proprietary technologies, which include capabilities for sample collection from the world’s microbial populations, generation of DNA libraries, screening of these libraries using ultra high-throughput methods capable of analyzing more than one billion genes per day, and optimization based on our gene evolution technologies. We have continued to shift more of our resources from technology development to commercialization efforts for our existing and future technologies and products. While our technologies have the potential to serve many large markets, our primary areas of focus for product development are (i) integrated solutions for the production of advanced biofuels, such as cellulosic ethanol, and (ii) specialty enzymes for alternative fuels, specialty industrial processes, and animal nutrition and health. We have current collaborations and agreements with market leaders, such as BP, Bunge Oils and the U.S. Department of Energy, each of which complement our internal technology and product development efforts.
We have a substantial intellectual property estate comprising more than 260 issued patents and more than 380 pending patents as of December 31, 2009. We believe that we can leverage our intellectual property estate to enhance and improve our technology development and commercialization efforts across both business units while maintaining protection on key intellectual property assets.
We have incurred net losses since our inception. For the year ended December 31, 2009, we had a net loss of $21.9 million, and as of December 31, 2009, we had an accumulated deficit of approximately $630.0 million. Our results of operations have fluctuated from period to period and likely will continue to fluctuate substantially in the future. We expect to incur losses into the foreseeable future as a result of any combination of one or more of the following:
| • | anticipated additional investments to implement our biofuels commercialization strategy, including capital expenditures related to optimization of our demonstration facility, and capital or operating costs we may incur for land acquisition, feedstock development, and design and engineering for our first commercial plants through our joint ventures with BP; |
| • | maintaining our sales and marketing infrastructure to support our specialty enzyme business; |
| • | our continued investment in manufacturing facilities necessary to meet anticipated demand for our products; and |
| • | continued research and development expenses for our biofuels commercialization strategy as well as the progression of internal product candidates in our specialty enzymes business. |
Results of operations for any period may be unrelated to results of operations for any other period. In addition, we believe that our historical results are not a good indicator of our future operating results.
As more fully described in the Liquidity and Capital Resources section beginning on page 91, Risk Factors beginning on page 30 and Note 1 of the Notes to Consolidated Financial Statements beginning on page 105 of this report, our independent registered public accounting firm has included an explanatory paragraph in its report
71
Table of Contents
on our 2009 financial statements related to the substantial doubt in our ability to continue as a going concern. We believe that we will be successful in raising or generating additional cash through a combination of corporate partnerships and collaborations, federal, state and local grant funding, selling or financing assets, incremental product sales and the additional sale of equity or debt securities; however, if we are unable to raise additional capital from any of these sources, we will need to defer, reduce or eliminate certain planned expenditures, restructure or significantly curtail our operations, file for bankruptcy or cease operations.
Recent Strategic Events, Financing Transactions, and Capital Requirements
Extension of BP Collaboration
On February 1, 2010, we announced the extension of the initial 18-month joint development program established in August 2008 with our partner BP, which was scheduled to expire on February 1, 2010, until March 1, 2010. We received an additional $2.5 million from BP to co-fund various scientific and technical initiatives for the month of February 2010. Further, on March 1, 2010, we announced a second one-month extension through April 1, 2010, for which an additional $2.5 million was funded by BP for the additional month. We and BP are continuing negotiations regarding the terms for advancing our cellulosic ethanol technology.
Completion of Syngenta Research Collaboration
On October 28, 2009, we entered into an agreement with Syngenta in connection with the completion of previously defined programs under our joint research collaboration. We have executed an agreement whereby we gained additional exclusive rights to an array of proprietary biomolecules expressed microbially, as well as non-exclusive rights to the same biomolecules expressed through non-plant means such as algae. As a result of this transaction, we obtained broad rights to several late-stage enzyme development candidates.
Public Offering of Common Stock and Warrants
On October 6, 2009, we issued 2,250,000 shares of our common stock and warrants to purchase an additional 900,000 shares of common stock in an underwritten public offering at a price of $6.00 per unit. Each unit consists of one share of common stock and a warrant to purchase 0.40 of a share of common stock. The shares of common stock and warrants are immediately separable and issued separately. The warrants have a five-year term and an exercise price of $7.59. Net proceeds after underwriting discounts and commissions and expenses, were approximately $12.2 million.
2009 Notes
On September 1, 2009 and September 25, 2009, we completed privately negotiated exchanges with certain existing holders of our 2007 Notes. Pursuant to the exchange agreements, certain existing holders of the 2007 Notes agreed to exchange $30.5 million in aggregate principal for the 2007 Notes, for $13.7 million in aggregate principal amount of 2009 Notes.
The 2009 Notes are secured by a first priority lien (subject to certain exceptions and permitted liens) on certain of our assets including, present and future receivables, inventory, general intangibles, equipment, investment property, stock of subsidiaries, and certain other assets and proceeds relating thereto. The collateral securing 2009 Notes is subject to certain carve-outs, cash and cash equivalents and intellectual property. As part of the 2009 Notes issuance, the 2008 Notes were also secured by the first priority lien
The 2009 Notes bear interest at 9% per year, payable in cash semi-annually, and commencing on October 1, 2009, are convertible at the option of the holders any time prior to maturity, redemption or repurchase into shares
72
Table of Contents
of our common stock at a conversion rate of 104.17 shares per $1,000 principal amount of 2009 Notes (subject to adjustment in certain circumstances), which represents a conversion price of $9.60 per share, provided that upon conversion the holders make certain certifications. A holder that surrenders 2009 Notes for conversion in connection with a “make-whole fundamental change” that occurs before April 5, 2012 may in certain circumstances be entitled to an increased conversion rate. In no event will the conversion price of the 2009 Notes be less than the $7.32 per share. The total common shares that would be issued assuming conversion of the entire $13.7 million in 2009 Notes is 1.4 million shares, excluding common shares to be issued for potential “make-whole” payments.
2008 Notes Amendment
On July 1, 2009, we entered into amendment agreements of our 2008 Notes to modify certain terms of the 2008 Notes. The amendments became effective on July 6, 2009. Pursuant to the terms of the 2008 Notes, the 2008 Notes may be amended and restated with the written consent of the holders representing at least 66.67% of the 2008 Notes outstanding. As of July 1, 2009, there was approximately $29.5 million aggregate principal amount of the 2008 Notes outstanding. We entered into the amendment agreements with all but one of the noteholders, which include the holders of approximately $25.6 million or 86.8% of the 2008 Notes.
The amendment agreements provide for the following:
| • | lowering the conversion price from $25.56 to $20.88; |
| • | lowering the price at which the 2008 Notes are subject to automatic conversion at the Company’s option and subject to the satisfaction of certain conditions from $98.16 to $41.76; |
| • | clarifications for the provisions that provide for interest and make-whole payments to be made in shares of our common stock, subject to certain restrictions; |
| • | modification of the anti-dilution protections from full ratchet to, in most cases, a version of broad-based weighted average, subject to certain limitations; and |
| • | modification of certain covenants intended to provide us with greater flexibility to engage in certain financing and other strategic transactions, including the ability to incur indebtedness or liens, engage in restructuring transactions involving our 2007 Notes and engage in certain asset sales; and |
| • | a relinquishment by the holders of the 2008 Notes who signed amendment agreements of certain rights and potential rights related to conversions of 2008 Notes and payments made by us with respect thereto prior to July 1, 2009. |
In connection with the 2009 Notes exchange described above, we agreed to grant equal and ratable security interests in the collateral securing the 2009 Notes to the holders of the 2008 Notes.
As disclosed in Note 8 of the Notes to Consolidated Financial Statements, one holder of 2008 Notes is a party to a pending lawsuit against us, whereby that holder also seeks declaratory judgment that its 2008 Notes may not be amended by the Required Holders without that holder’s consent.
Years Ended December 31, 2009 and 2008
Selected Segment Financial Data
Our business consists of two business units, which we refer to as our biofuels segment and our specialty enzymes segment. The biofuels segment is focused on developing unique technical and operational capabilities designed to enable the production and commercialization of biofuels, in particular ethanol from cellulosic biomass. The specialty enzymes segment develops high performance enzymes for use within the alternative fuels, specialty industrial processes, and animal nutrition and health markets to enable higher throughput, lower costs, and improved environmental outcomes.
73
Table of Contents
We assess performance and allocate resources based on discrete financial information for the biofuels and specialty enzymes segments. For the biofuels segment, performance is assessed based on total operating expenses and capital expenditures. For the specialty enzymes segment performance is assessed based on total revenues, product revenues, product gross profit, total operating expenses and capital expenditures. For the years ended December 31, 2009 and 2008, the specialty enzyme segment comprised 100% of our product revenue and cost of product revenue. Our operating expenses for each segment include direct and allocated research and development and selling, general and administrative expenses. In management’s evaluation of performance, certain corporate operating expenses are excluded from the business segments such as: non-cash share-based compensation, restructuring charges, severance, depreciation and amortization, and other corporate expenses, which are not allocated to either business segment. In addition, we evaluate segment performance based upon capital expenditures and other assets that are specifically identified to the business segment, excluding certain corporate assets such as cash, short-term investments, and other assets that can be attributed to, or utilized by, both business segments. Expenses and assets shared by the segments require the use of judgments and estimates in determining the allocation of expenses to the two segments. Different assumptions or allocation methods could result in materially different results by segment. Further, expenses allocated to each of the two segments may not be indicative of the expenses of each operating segment if such segments operated on a stand-alone basis.
Selected operating results for the year ended December 31, 2009 and 2008 for each of our business segments is set forth below (in thousands):
| 2009 | 2008 | |||||||||||||||||||||||||||||
| Biofuels | Specialty Enzymes |
Corporate | Total | Biofuels | Specialty Enzymes |
Corporate | Total | |||||||||||||||||||||||
| Product revenue |
$ | — | $ | 43,956 | $ | — | $ | 43,956 | $ | — | $ | 49,083 | $ | — | $ | 49,083 | ||||||||||||||
| Collaborative and grant revenue |
15,978 | 5,977 | — | 21,955 | 1,635 | 18,941 | — | 20,576 | ||||||||||||||||||||||
| Total revenues |
15,978 | 49,933 | — | 65,911 | 1,635 | 68,024 | — | 69,659 | ||||||||||||||||||||||
| Product gross profit |
— | 16,027 | — | 16,027 | — | 13,930 | — | 13,930 | ||||||||||||||||||||||
| Operating expenses* (excluding cost of goods sold) |
65,903 | 13,122 | 23,292 | 102,317 | 54,865 | 32,196 | 127,333 | 214,394 | ||||||||||||||||||||||
| Total Operating income (loss) |
(49,925 | ) | 8,882 | (23,292 | ) | (64,335 | ) | (53,230 | ) | 675 | (127,333 | ) | (179,888 | ) | ||||||||||||||||
| Loss attributed to noncontrolling interests in consolidated entities |
34,349 | — | — | 34,349 | 12,500 | — | — | 12,500 | ||||||||||||||||||||||
| Operating income (loss) attributed to Verenium |
$ | (15,576 | ) | $ | 8,882 | $ | (23,292 | ) | $ | (29,986 | ) | $ | (39,730 | ) | $ | 675 | $ | (127,333 | ) | $ | (167,388 | ) | ||||||||
| Capital expenditures |
$ | 4,891 | $ | 527 | $ | — | $ | 5,418 | $ | 43,319 | $ | 3,121 | $ | 194 | $ | 46,634 | ||||||||||||||
| * | Corporate operating expenses include approximately $106.1 million in a non-cash goodwill impairment charge in 2008. |
74
Table of Contents
Identifiable assets by operating segment are set forth below (in thousands):
| As of December 31, 2009 | ||||||||||||
| Biofuels | Specialty Enzymes |
Corporate | Total | |||||||||
| Property, plant and equipment, net |
$ | 102,810 | $ | 2,430 | $ | 3,159 | $ | 108,399 | ||||
| Cash and other assets (1) |
8,190 | 10,109 | 41,224 | 59,523 | ||||||||
| Total identifiable assets |
$ | 111,000 | $ | 12,539 | $ | 44,383 | $ | 167,922 | ||||
| (1) | As of December 31, 2009, Biofuels cash and other assets includes $7.2 million of Vercipia cash and cash equivalents which is limited for use in Vercipia operations. |
| As of December 31, 2008 | ||||||||||||
| Biofuels | Specialty Enzymes |
Corporate | Total | |||||||||
| Property, plant and equipment, net |
$ | 109,030 | $ | 3,502 | $ | 4,739 | $ | 117,271 | ||||
| Cash and other assets |
702 | 11,101 | 24,549 | 36,352 | ||||||||
| Total identifiable assets |
$ | 109,732 | $ | 14,603 | $ | 29,288 | $ | 153,623 | ||||
Consolidated Results of Operations
Revenues
Revenues for the years ended December 31, 2009 and 2008 are as follows (in thousands):
| 2009 | 2008 | % Change | |||||||
| Revenues: |
|||||||||
| Phyzyme phytase |
$ | 32,781 | $ | 36,963 | (11 | )% | |||
| All other products |
11,175 | 12,120 | (8 | )% | |||||
| Total product |
43,956 | 49,083 | (10 | )% | |||||
| Grant |
16,837 | 6,920 | 143 | % | |||||
| Collaborative |
5,118 | 13,656 | (63 | )% | |||||
| Total revenues |
$ | 65,911 | $ | 69,659 | (5 | )% | |||
Revenues decreased 5%, or $3.7 million, to $65.9 million for the year ended December 31, 2009 compared to December 31, 2008. For the year ended December 31, 2009, our revenue mix continued to shift to a larger percentage of product and grant revenues, consistent with our strategy to grow product sales and biofuels projects, and de-emphasize collaborations that are not core to our strategic market focus. Product and grant revenues represented 92% of total revenues for the year ended December 31, 2009, as compared to 80% for the year ended December 31, 2008.
Product revenues decreased $5.1 million, or 10%, for the year ended December 31, 2009 as compared to the same period in 2008. This decrease is attributed primarily to the following factors:
| • | While gross shipments of Phyzyme for the year ended December 31, 2009 remained at levels comparable to 2008, our reported net Phyzyme revenue was lower than our reported net revenue in the same periods of the prior year. This is attributed to a larger percentage of Phyzyme sales manufactured by Genencor, a subsidiary of Danisco, for which we recognize only the royalty component on operating profit for Phyzyme sales. Due to capacity constraints during late 2008, we contracted with Genencor to serve as a second-source manufacturer of Phyzyme. We recognize revenue from Phyzyme that is manufactured by Genencor in an amount equal to the royalty on operating profit we receive from |
75
Table of Contents
| Danisco, as compared to the full value of the manufacturing costs plus royalty on operating profit we recognize for Phyzyme we manufacture at Fermic. |
| • | We discontinued two of our product lines, Bayovac-SRS and Quantum, during early 2008. |
The decrease in Phyzyme product revenue was offset in part by an increase in sales of our Fuelzyme and Xylathin enzymes, which continued to gain acceptance in the grain ethanol markets, and our Veretase enzyme for the potable ethanol market.
Revenues from Phyzyme represented approximately 75% of total product revenues for the year ended December 31, 2009 and 2008. We expect that Phyzyme will continue to represent a significant percentage of our total product revenues in the foreseeable future.
Given the worldwide recession, we cannot be certain that demand for our enzyme products and resulting sales will meet expectations. In particular:
| • | Following a year of substantial growth in revenues and related market share of our Phyzyme enzyme in 2008, we and our partner Danisco, saw a softening in the phytase animal feed market attributed to a recessionary decline in consumer consumption of protein and financial distress in the poultry industry, which negatively impacted demand for feed and thus our enzyme, particularly during the first half of 2009. Nevertheless, Phyzyme sales strengthened in late 2009, as demand for poultry began to recover with economic conditions. |
| • | Demand for Fuelzyme was significantly impacted by challenges in the corn ethanol industry, which experienced significant distress in 2009 due to high corn prices and low ethanol prices. During the first half of 2009, there were several well-publicized bankruptcies, including two of the largest producers of corn ethanol in the U.S. operating rates in the industry were significantly reduced, which negatively impacted demand for enzymes in the first half of 2009. Recently, we have begun to see ethanol plant operating rates return to pre-2009 levels, and some idle capacity has been brought back on line, signaling a recovery in the corn ethanol industry over the latter part of 2009. |
| • | A primary market for Purifine, used for soybean oil processing, is Latin America, which has suffered drought, political upheaval over taxes on agriculatural exports, and overall challenging market conditions since early 2008. As a result, adoption of Purifine in the region has been delayed, thus Purifine revenue was below expectations for 2009. Though we anticipate a ramp-up in Purifine revenues, it has been slower than initially expected. However, Purifine has gained strong commercial traction during 2009. In addition to continued demand from Bunge, or primary customer for Purifine, we recently signed a long-term contract with Molinos, operator of the world’s largest soybean processing plant in Argentina, to implement the commercial-scale oil degumming process using Purifine. |
Grant revenue increased $9.9 million, to $16.8 million for the year ended December 31, 2009 compared to 2008. The increase in grant revenue was primarily attributable to various new grants awarded during late 2008 and throughout 2009 from the Department of Energy to further optimize our demonstration-scale facility. We continue to pursue additional opportunities to secure federal, state or local agency funding to support our biofuels initiatives. As of December 31, 2009, we have committed funding from various governmental agencies totaling $12.7 million through 2012, and expect to continue to see a decrease in grant revenue during 2010 as compared to 2009.
Collaborative revenue decreased $8.5 million, to $5.1 million for the year ended December 31, 2009. We have continued to de-emphasize collaborations that are not core to our current focus in favor of greater emphasis
76
Table of Contents
on sales of products and biofuels projects. We anticipate that collaborative revenue will continue to represent a small component of our revenue in 2010, due in large part to this de-emphasis of non-strategic collaborations and decrease in revenue related to wind-down of projects with existing strategic collaborators, such as our settlement agreement with Syngenta.
On October 28, 2009, we completed previously defined programs under our joint research collaboration with Syngenta. In connection with the completion of those programs, the parties have executed an agreement whereby we gained additional exclusive rights to an array of proprietary biomolecules expressed microbially, as well as non-exclusive rights to the same biomolecules expressed through non-plant means such as algae, further bolstering our specialty enzymes product pipeline.
We will continue to pursue opportunities to expand, renew, or enter into new collaborations that we believe fit our strategic focus and represent product commercialization opportunities in the future; however, there can be no assurance that we will be successful in renewing or expanding existing collaborations, or securing new collaboration partners.
Our revenues have historically fluctuated from period to period and likely will continue to fluctuate substantially in the future based upon the adoption rates of our new and existing commercial products, timing and composition of funding under existing and future collaboration agreements, timing and amount of funding under government grants, as well as regulatory approval timelines for new products. We anticipate that our revenue mix will continue to shift toward a higher percentage of product and grant revenue.
Product Gross Profit & Margin
Product gross profit for the years ended December 31, 2009 and 2008 are as follows (in thousands):
| 2009 | 2008 | % Change | |||||||||
| Product revenue |
$ | 43,956 | $ | 49,083 | (10 | )% | |||||
| Cost of product revenue |
27,929 | 35,153 | (21 | )% | |||||||
| Product gross profit |
16,027 | 13,930 | 15 | % | |||||||
| Product gross margin |
36 | % | 28 | % | |||||||
Cost of product revenue includes both fixed and variable costs, including materials and supplies, labor, facilities, royalties and other overhead costs, associated with our product revenues. Excluded from cost of product revenue are costs associated with the scale-up of manufacturing processes for new products that have not reached commercial-scale production volumes, which we include in our research and development expenses. Cost of product revenue decreased $7.2 million, or 21%, to $27.9 million for the year ended December 31, 2009. This decrease resulted primarily from the change in production for our Phyzyme product revenue and related cost manufactured by Genencor as described below, combined with inventory losses and additional freight costs incurred in 2008 as further described below.
We manufacture most of our enzyme products through a manufacturing facility in Mexico City, owned by Fermic S.A., or Fermic. We also have contracted with Genencor, a subsidiary of Danisco, to serve as a second-source manufacturer of Phyzyme. As discussed above, we recognize revenue from Phyzyme that is manufactured by Genencor in an amount equal to the royalty received from Danisco, as compared to the full value of the manufacturing costs plus the royalty on operating profit we currently recognize for Phyzyme we manufacture at Fermic. While this revenue recognition treatment has little or no negative impact on the gross margin in absolute dollars we recognize for every sale of Phyzyme, it does have a negative impact on the gross product revenue we recognize for Phyzyme as the volume of Phyzyme manufactured by Genencor increases.
77
Table of Contents
Product gross margin totaled $16.0 million, or 36% of product revenue for the year ended December 31, 2009 compared to $13.9 million, or 28% of product revenue for the year ended December 31, 2008. Gross margin percentage improvement for the year ended December 31, 2009 reflects various factors, specifically:
| • | Due to our manufacturing arrangement with Genencor to serve as a second-source manufacturer for Phyzyme as previously described, we record revenue and costs related to Phyzyme that Genencor manufactures on a net basis versus a gross basis. This had no impact on the absolute value of our gross margin, but resulted in an increase to the gross margin percentage reported for the year ended December 31, 2009. |
| • | During the year ended December 31, 2008, gross margin percentage was lower due to (i) inventory losses related to contamination issues in our Phyzyme enzyme manufacturing process; and (ii) incremental zero-margin freight revenue and related costs incurred to meet customer ship dates. Both of these factors negatively impacted gross profit and resulted in a lower gross margin in 2008. |
| • | During 2009, we experienced a favorable product mix shift to products with lower production costs, such as Fuelzyme. |
For the reasons described above, we believe that product gross margin dollars is a better indication of performance than product gross margin percentage.
Because a large percentage of our manufacturing costs are fixed, our gross margin may be negatively impacted in the future if our product revenues decrease or if they do not grow in line with our increase in minimum capacity requirements at Fermic. Our gross margins are also dependent upon the mix of product-related sales as the cost of product-related revenue varies from product to product.
In addition, because Phyzyme represents a significant percentage of our product revenue, our product gross margin is impacted to a great degree by the gross margin achieved on sales of Phyzyme. Under our manufacturing and sales agreement with Danisco, we sell our Phyzyme inventory to Danisco at our cost and then, under a license agreement, share 50% of Danisco’s profit, as defined, when the product is sold to Danisco’s customer. As a result, our total cost of product revenue for Phyzyme is incurred as we ship product to Danisco, and the royalty on operating profit is recognized in the period in which the product is sold to Danisco’s customer as reported to us by Danisco. We may record our quarterly royalty on operating profit based on estimates from Danisco, and the final calculation of profit share is sometimes finalized in the subsequent quarter; accordingly, we are subject to potential adjustments to our actual royalty on operating profit from quarter-to-quarter. These adjustments, while typically considered immaterial in absolute dollars, could have a significant impact on our reported product gross margin from quarter-to-quarter.
In addition, our supply agreement with Danisco for Phyzyme contains provisions which allow Danisco, with six months advance notice, to assume manufacturing rights for Phyzyme. If Danisco decides to exercise this right, we may experience excess capacity at Fermic. If we are unable to absorb this excess capacity with other products in the event that Danisco assumes all or a portion of Phyzyme manufacturing rights, this may have a negative impact on our revenues and our product gross margin.
Operating Expenses
Research and development and selling, general and administrative expenses for the years ended December 31, 2009 and 2008 are as follows (in thousands):
| 2009 | 2008 | % Change | |||||||
| Research and development |
$ | 63,961 | $ | 63,438 | 1 | % | |||
| Selling, general and administrative expenses |
$ | 38,356 | $ | 44,822 | (14 | )% | |||
78
Table of Contents
Our operating expenses excluding cost of product revenue for the year ended December 31, 2009 decreased 5% due to decreased research and development efforts associated with specialty enzyme projects offset by increases in expenses related to our demonstration-scale facility optimization efforts, further offset by cost minimization efforts during 2009.
Research and Development
Research and development expenses consist primarily of costs associated with internal development of our technologies and our product candidates, including engineering costs associated with our pilot and demonstration–scale cellulosic ethanol facilities, manufacturing scale-up and bioprocess development for our current products, and costs associated with research activities performed on behalf of our collaborators.
For the year ended December 31, 2009, we estimate that approximately 38% of our research and development personnel costs, based upon hours incurred, were spent on unfunded product and technology development, and that approximately 62% were spent on research activities funded in whole or in part by our partners. For the year ended December 31, 2008, we estimate that approximately 78% of our research and development personnel costs, based upon hours incurred, were spent on unfunded product and technology development, and that approximately 22% were spent on research activities funded by our collaborations and grants. The increase in percentage of time spent on funded product and technology development from the prior year is primarily attributed to our focus on cellulosic ethanol process development, which is partially funded by federal grants and BP through our Galaxy joint venture.
We have a limited history of developing commercial products and technologies. We determine which products and technologies to pursue independently based on various criteria, including: investment required, estimated time to market, regulatory hurdles, infrastructure requirements, and industry-specific expertise necessary for successful commercialization. Successful products and technologies require significant development and investment prior to regulatory approval and commercialization. As a result of the significant risks and uncertainties involved in developing and commercializing such products, we are unable to estimate the nature, timing, and cost of the efforts necessary to complete each of our major projects. These risks and uncertainties include, but are not limited to, the following:
| • | Our products and technologies may require more resources than we anticipate if we are technically unsuccessful in initial development or commercialization efforts; |
| • | The outcome of research is unknown until each stage of testing is completed, up through and including trials and regulatory approvals, if needed; |
| • | It can take many years from the initial decision to perform research through development until products and technologies, if any, are ultimately marketed; |
| • | We have product candidates and technologies in various stages of development related to collaborations and grants as well as internally developed products and technologies. At any time, we may modify our strategy and pursue additional collaborations for the development and commercialization of some products and technologies that we had intended to pursue independently. For example, in 2008 we entered into a joint collaboration with BP to co-fund the advancement and validation of our cellulosic ethanol process technology, which had previously been largely self-funded; and |
| • | Funding for existing products or projects may not be available on commercially acceptable terms, or at all, which may cause us to defer or reduce our product development efforts. |
Any one of these risks and uncertainties could have a significant impact on the nature, timing, and costs to complete our product and technology development efforts. Accordingly, we are unable to predict which potential commercialization candidates we may proceed with, the time and costs to complete development, and ultimately
79
Table of Contents
whether we will have any products or technologies approved by the appropriate regulatory bodies. The various risks associated with our research and development activities are discussed more fully in this report under “Risk Factors.”
Our research and development expenses increased $0.5 million, to $64.0 million (including share-based compensation of $2.3 million) compared to $63.4 million (including share-based compensation of $4.4 million) for the year ended December 31, 2008. Our research and development expenses by operating segment for the years ended December 31, 2009 and 2008 were as follows (in thousands):
| 2009 | 2008 | % Change | |||||||
| Biofuels |
$ | 59,709 | $ | 38,945 | 53 | % | |||
| Specialty Enzymes |
4,252 | 24,493 | (83 | )% | |||||
| $ | 63,961 | $ | 63,438 | 1 | % | ||||
Biofuels Research and Development
Research and development expenses related to our biofuels business include costs related to our ongoing development and validation of our cellulosic ethanol process technology, including, but not limited to, enzyme discovery and development and bioprocess development designed to improve ethanol yields and reduce cost-per-gallon, feedstock testing and validation at the laboratory, pilot- and demonstration-plant scale, as well as costs related to commissioning, optimization and operation of our demonstration-scale facility in Jennings, Louisiana. During 2008, costs related to our ligno-cellulosic enzyme development programs which were partially funded by Syngenta, were included in specialty enzymes research and development. In 2009, we have categorized these costs in our biofuels segment.
Our biofuels research and development expenses increased $20.8 million for the year ended December 31, 2009 from $38.9 million in 2008. This increase relates primarily to $7.7 million in depreciation expense for our demonstration-scale facility which was placed in service in February 2009, the acceleration of our biofuels technology development efforts during 2008 and 2009, particularly related to our demonstration-scale facility commissioning and optimization at our site in Jennings, Louisiana, which BP has substantially funded through our Galaxy joint venture, as well as our commercialization efforts through the Vercipia entity. As described in more detail below, our gross research and development costs related to Galaxy and Vercipia are included in “Research and development” on our Consolidated Statements of Operations, with BP’s cost reimbursement to us included in “Loss attributed to noncontrolling interests in consolidated entities.”
We consider our current cellulosic ethanol technology under development to be our “Generation 1” or “Gen 1” technology. To date, we have demonstrated that our Gen 1 technology can produce cellulosic ethanol at a small scale in the laboratory, pilot plant, and demonstration-scale facility, but at yields and cost that are not yet commercially viable. We will require continued and substantial investment to further develop our Gen 1 technology, and continue to believe that Gen 1 will produce a viable technology that could be deployed on a commercial scale as early as 2012. We anticipate that we could break ground on our first commercial plant as early as 2010.
Specialty Enzymes Research and Development
Research and development expenses related to our specialty enzyme business include costs related to ongoing bioprocess development and manufacturing process yield improvements, funded support for research collaborations and to a lesser extent, early stage product development.
Due to limited capital resources and challenging economic conditions, we are not spending significant resources on early stage specialty enzyme product development without additional investment from strategic partners.
80
Table of Contents
Our specialty enzymes research and development expenses decreased $20.2 million for the year ended December 31, 2009 compared to the comparable period in 2008. This decrease is related primarily to our shift in focus to biofuels process development and, to a lesser extent, the de-emphasis of early stage product development for our specialty enzyme business segment and collaboration and grant work not core to our current focus.
Selling, General and Administrative Expenses
| 2009 | 2008 | % Change | |||||||
| Selling, general and administrative |
$ | 38,356 | $ | 44,822 | (14 | )% | |||
Selling, general and administrative expenses decreased $6.5 million, or 14%, to $38.4 million (including share-based compensation of $5.4 million) for the year ended December 31, 2009. Excluding the impact of share-based compensation, selling, general and administrative expenses decreased $5.0 million for the year ended December 31, 2009 as compared to the same period in 2008. The decrease during the year ended December 31, 2009 compared to the same period in the prior year was primarily due to the decrease in consulting and advisory expenses related to the first phase of our collaboration with BP, Galaxy, in August 2008, partially offset by the biofuels commercial development efforts for our first commercial plant, which BP partially funds through our Vercipia joint venture, and cost minimization efforts in 2009.
Share-Based Compensation Charges
We recognized $7.7 million, or $0.91 per share, and $11.2 million, or $2.10 per share, for the years ended December 31, 2009 and 2008. Share-based compensation expense was allocated among the following expense categories (in thousands):
| 2009 | 2008 | |||||
| Research and development |
$ | 2,285 | $ | 4,391 | ||
| Selling, general and administrative |
5,403 | 6,842 | ||||
| $ | 7,688 | $ | 11,233 | |||
Share-based compensation decreased $3.5 million for the year ended December 31, 2009 as compared to the same period in 2008, primarily related to the suspension of our employee stock purchase plan during the first quarter of 2009 and an overall decrease in equity awards granted since our merger with Celunol Corp in 2007, partially offset by the tender offer option exchange which resulted in approximately $0.9 million in additional expense during the year.
Goodwill Impairment
During 2008, we determined that the market value of our common stock and convertible debt was not adequate to support the carrying value of our goodwill resulting from the June 2007 merger between Diversa and Celunol. As a result, pursuant to authoritative accounting guidance we recorded a non-cash charge of $106.1 million in 2008, representing full impairment of the carrying value of our goodwill. We believe that this impairment was reflective primarily of current market conditions, and was not indicative of a change in our business or implied value of our underlying biofuels business model aimed toward the commercialization of cellulosic ethanol.
Interest and other income, net
Interest income on cash and short term investments was $0.1 million for the year ended December 31, 2009 compared to $1.0 million for the year ended December 31, 2008 primarily due to lower average cash and investment balances during 2009.
81
Table of Contents
Interest expense
Interest expense was $11.1 million, net of $1.0 in capitalized interest for the demonstration-scale facility, for the year ended December 31, 2009 compared to $9.8 million for the year ended December 31, 2008, net of $6.2 million in capitalized interest for the demonstration facility. Our demonstration-scale facility was placed in service in February 2009, and as such, we ceased capitalizing interest on that date. The increase in interest expense from the comparable periods in 2008 was primarily attributed to the decrease in capitalized interest partially offset by the decrease in 2008 Notes principal outstanding from conversions. Total interest expense for the years ended December 31, 2009 and 2008 comprised of the following (in thousands):
| 2009 | 2008 | |||||||
| 5.5% coupon interest, payable in cash |
$ | 4,902 | $ | 5,734 | ||||
| Non-cash amortization of debt issuance costs |
831 | 938 | ||||||
| 2007 Notes Total |
5,733 | 6,672 | ||||||
| 8% coupon interest, payable in cash or common stock |
2,573 | 4,340 | ||||||
| Non-cash accretion of debt discount |
3,067 | 4,009 | ||||||
| Non-cash amortization of debt issuance costs |
247 | 449 | ||||||
| 2008 Notes Total |
5,887 | 8,798 | ||||||
| 9% coupon interest, payable in cash or common stock |
411 | — | ||||||
| Non-cash amortization of debt premium |
(136 | ) | — | |||||
| 2009 Notes Total |
275 | — | ||||||
| Equipment financing |
26 | 150 | ||||||
| Other |
223 | 360 | ||||||
| Capitalized interest |
(1,039 | ) | (6,157 | ) | ||||
| Total interest expense |
$ | 11,105 | $ | 9,823 | ||||
Gain on Contract Settlement
On October 28, 2009, we entered into an agreement with Syngenta in connection with the completion of previously defined programs under our joint research collaboration. As of the separation date, approximately $0.9 million in deferred revenue was outstanding related to Syngenta for unearned, prepaid research funding under the previous agreement. The $0.9 million was recognized as gain on contract settlement for the year ended December 31, 2009, as the amount represented cash received in excess of research labor hours incurred, for which we had not completed the revenue earning process.
Loss on Exchange of Convertible Notes
In connection with the issuance of the 2008 Notes, we exchanged $18.5 million in aggregate principal amount of the 2007 Notes for approximately $16.7 million in aggregate principal amount of the 2008 Notes. Pursuant to current accounting rules, we recorded a non-cash loss on the exchange of $3.6 million, equal to the difference between the carrying value of the 2007 Notes and the fair value of the 2008 Notes and warrants issued.
Gain on Amendment of 2008 Notes
In connection with the amendment of the 2008 Notes, the 2008 Notes conversion price was reduced from $25.56 to $20.88 and the anti-dilution protection included in the 2008 Notes was changed from full ratchet anti-dilution protection to, in most cases, a version of broad-based weighted average anti-dilution protection, subject to certain limitations. Pursuant to authoritative guidance, we determined that the amendment qualified as a liability extinguishment, and recorded a gain on the amendment of $4.0 million, equal to the difference between the fair value of the 2008 Notes compound embedded derivative before and after the amendment.
82
Table of Contents
Gain on Net Change in Fair Value of Derivative Assets and Liabilities
The fair value of the 2008 Notes compound embedded derivative, warrants, the convertible hedge transaction in connection with our 2008 Notes and 2009 Notes compound embedded derivative are recorded as a derivative asset or liability and marked-to-market each balance sheet date. The change in fair value is recorded in the Consolidated Statement of Operations as “Gain on net change in fair value of derivative assets and liabilities.” We recorded a net gain of $5.3 million for the year ended December 31, 2009 compared to $3.5 million for the year ended December 31, 2008 related to the change in fair value of our recorded derivative asset and liabilities.
Gain (loss) on Debt Extinguishment Upon Conversion of Convertible Debt
During the year ended December 31, 2009, we recorded a gain on debt extinguishment of $8.9 million compared to a loss of $0.1 million for the year ended Decembre 31, 2008. The gain (loss) calculated as the difference between the carrying value of the converted 2008 Notes and the fair value of the shares of common stock delivered to the noteholders upon conversion. The carrying value of the converted 2008 Notes for the year ended December 31, 2009 was equal to the $43.7 million of principal less the unamortized debt discount and issuance costs, which totaled $32.7 million, as of the conversion date. During the year ended December 31, 2009, we issued a total of 3.7 million shares with a total market value as of the dates of conversion of $23.8 million to settle the 2008 Notes and “make-whole” payments. The carrying value of the converted 2008 Notes was equal to $8.9 million which represented the difference between the principal converted of $12.1 million and the unamortized debt discount and issuance costs. During the year ended December 31, 2008, we issued a total of 3.7 million shares with a total market value as of the dates of conversion of $9.0 million to settle the converted 2008 Notes and related “make-whole” payments.
Loss Attributed to Noncontrolling Interests in Consolidated Entities
In connection with the initial phase of our strategic partnership with BP, we formed Galaxy as a special purpose entity. We are considered the primary beneficiary of Galaxy and consolidate its financial results. Pursuant to current accounting rules, the transaction fees and joint development fees are accounted for as follows:
| • | The license to technology we granted to Galaxy and ongoing joint development work we perform for Galaxy are accounted for as capital contributions to Galaxy; |
| • | Transaction fees and joint development fees paid by BP are accounted for as capital contributions to Galaxy, which are subsequently distributed to us as a reduction to our capital account; |
| • | Ongoing joint development fees are accounted for as a monthly expense of Galaxy. |
In connection with the second phase of our strategic partnership with BP, we hold a 50% interest in Vercipia, a special purpose entity. We are considered the primary beneficiary of Vercipia and consolidate its financial results. Pursuant to current accounting rules, the ongoing joint development is considered a monthly expense of Vercipia. All contributions are contributed directly into Vercipia.
As a result, our consolidated financial statements include a line item called “Noncontrolling interests in consolidated entities.” On our Consolidated Balance Sheets, this line reflects BP’s ownership of Galaxy’s and Vercipia’s equity. This line item is reduced by BP’s 50% share of Galaxy’s and Vercipia’s losses, and increased by cash contributions made by BP. BP’s share of losses is reflected in our Consolidated Statements of Operations as “Loss attributed to noncontrolling interests in consolidated entities.” Galaxy and Vercipia have incurred losses through December 31, 2009, 50% of which have been allocated to BP, and we anticipate these entities will continue to incur losses related to ongoing joint development through at least the initial joint development program and construction processes.
83
Table of Contents
Years Ended December 31, 2008 and 2007
Selected Segment Financial Data
The results of operations for the year ended December 31, 2008 include the combined operations resulting from our merger with Celunol on June 20, 2007. The results of operations for the year ended December 31, 2007 include the historical results of Diversa Corporation and Celunol operations for the period from and including June 21, 2007 through December 31, 2007, and are not reflective of the combined operations for the full year.
Selected operating results for the year ended December 31, 2008 and 2007 for each of our business segments is set forth below (in thousands):
| 2008 | 2007 | ||||||||||||||||||||||||||||||
| Biofuels | Specialty Enzymes |
Corporate | Total | Biofuels | Specialty Enzymes |
Corporate | Total | ||||||||||||||||||||||||
| Product revenue |
$ | — | $ | 49,083 | $ | — | $ | 49,083 | $ | — | $ | 25,975 | $ | — | $ | 25,975 | |||||||||||||||
| Collaborative and grant revenue |
1,635 | 18,941 | — | 20,576 | — | 20,298 | — | 20,298 | |||||||||||||||||||||||
| Total revenues |
1,635 | 68,024 | — | 69,659 | — | 46,273 | — | 46,273 | |||||||||||||||||||||||
| Product gross profit |
— | 13,930 | — | 13,930 | — | 6,160 | — | 6,160 | |||||||||||||||||||||||
| Operating expenses* (excluding cost of goods sold) |
54,865 | 32,196 | 127,333 | 214,394 | 20,499 | 53,480 | 58,214 | 132,193 | |||||||||||||||||||||||
| Total Operating income (loss) |
(53,230 | ) | 675 | (127,333 | ) | (179,888 | ) | (20,499 | ) | (27,022 | ) | (58,214 | ) | (105,735 | ) | ||||||||||||||||
| Loss attributed to noncontrolling interests in consolidated entities |
12,500 | — | — | 12,500 | — | — | — | — | |||||||||||||||||||||||
| Operating income (loss) attributed to Verenium |
$ | (40,730 | ) | $ | 675 | $ | (127,333 | ) | $ | (167,388 | ) | $ | (20,499 | ) | $ | (27,022 | ) | $ | (58,214 | ) | $ | (105,735 | ) | ||||||||
| Capital expenditures |
$ | 43,319 | $ | 3,121 | $ | 194 | $ | 46,634 | $ | 26,991 | $ | 2,636 | $ | 4,603 | $ | 34,230 | |||||||||||||||
| * | Corporate operating expenses include approximately $106.1 million in a non-cash goodwill impairment charge in 2008 and $42.4 million non-cash acquired in-process research and development charge in 2007. |
Identifiable assets by operating segment are set forth below (in thousands):
| As of December 31, 2008 | ||||||||||||
| Biofuels | Specialty Enzymes |
Corporate | Total | |||||||||
| Property, plant and equipment, net |
$ | 109,030 | $ | 3,502 | $ | 4,739 | $ | 117,271 | ||||
| Cash and other assets |
702 | 11,101 | 24,549 | 36,352 | ||||||||
| Total identifiable assets |
$ | 109,732 | $ | 14,603 | $ | 29,288 | $ | 153,623 | ||||
84
Table of Contents
| As of December 31, 2007 | ||||||||||||
| Biofuels | Specialty Enzymes |
Corporate | Total | |||||||||
| Goodwill |
$ | — | $ | — | $ | 106,134 | $ | 106,134 | ||||
| Property, plant and equipment, net |
66,380 | 6,655 | 3,628 | 76,663 | ||||||||
| Cash, short-term investments and other assets |
1,219 | 16,971 | 63,792 | 81,982 | ||||||||
| Total identifiable assets |
$ | 67,599 | $ | 23,626 | $ | 173,554 | $ | 264,779 | ||||
Consolidated Results of Operations
Revenues
Revenues for the years ended December 31, 2008 and 2007 are as follows (in thousands):
| 2008 | 2007 | % Change | |||||||
| Revenues: |
|||||||||
| Phyzyme phytase |
$ | 36,963 | $ | 16,237 | 128 | % | |||
| All other products |
12,120 | 9,738 | 24 | % | |||||
| Total product |
49,083 | 25,975 | 89 | % | |||||
| Collaborative |
13,656 | 17,581 | (22 | )% | |||||
| Grant |
6,920 | 2,717 | 155 | % | |||||
| Total revenues |
$ | 69,659 | $ | 46,273 | 51 | % | |||
Revenues increased 51%, or $23.4 million, to $69.7 million for the year ended December 31, 2008 primarily due to higher product revenue. For the year ended December 31, 2008, our revenue mix shifted to a larger percentage of product revenue, consistent with our strategy to grow product sales and de-emphasize collaborations that are not core to our strategic market focus. Product revenue represented 70% of total revenues for the year ended December 31, 2008, as compared to 56% for the year ended December 31, 2007.
Product revenues increased $23.1 million, or 89%, for the year ended December 31, 2008 as compared to the year ended December 31, 2007. This increase was attributable primarily to increased revenue and royalty associated with Phyzyme XP phytase sold through our collaboration with Danisco. The increase in Phyzyme revenue was primarily related to the following factors:
| • | In late 2006, the EU Commission granted permanent authorization for the use of Phyzyme XP in broiler poultry feed in Europe which has expanded the end user market for Phyzyme XP; |
| • | In late 2006, Danisco introduced a new dry, pelletized, and thermally-stable formulation of Phyzyme XP; and |
| • | Beginning in late 2007, due to an increase in the cost of phosphates (an animal feed additive), sales volumes of Phyzyme XP to Danisco’s current customers have been positively impacted, as many of these customers have increased Phyzyme dosages as a replacement for higher-cost phosphates. |
Non-Phyzyme related product revenue increased $2.4 million, or 24%, for the year ended December 31, 2008 as compared to the year ended December 31, 2007 primarily due to increased sales of our Fuelzyme-LF and Purifine products. This increase was offset by the discontinuation of our Bayovac SRS and Quantum products. Product revenue for the year ended December 31, 2008 includes $2.5 million of revenue from sales of these products during the first six months of fiscal 2008. These products were discontinued due to the following:
| • | In late 2007, because of new entrants into the vaccine market and resulting pressure on pricing and margins, we made the strategic decision to exit the animal health vaccine market to focus on product |
85
Table of Contents
| commercialization efforts in areas that are more strategic to our current focus, namely biofuels. In connection with this decision, we terminated our Licensing and Collaboration Agreement with Microtek, and discontinued sales of Bayovac SRS after March 31, 2008; and |
| • | In February 2008, AB Enzymes and AB Vista (collectively, “AB”), both subsidiaries of Associated British Foods plc, announced the acquisition of Syngenta’s Quantum Phytase feed enzyme business. Prior to this transaction, we supplied Quantum Phytase to Syngenta pursuant to a manufacturing and supply agreement. We were unable to reach a manufacturing and supply agreement with AB on commercially agreeable terms. |
Revenue from Phyzyme represented approximately 75% of total product revenue for the year ended December 31, 2008 as compared to 63% for the year ended December 31, 2007.
Collaborative revenue decreased 22%, or $3.9 million, to $13.7 million for the year ended December 31, 2008. Collaborative revenue accounted for 20% of total revenue for the year ended December 31, 2008 as compared to 38% of total revenue for the year ended December 31, 2007. We have continued to de-emphasize collaborations that are not core to our current focus in favor of greater emphasis on sales of products.
Grant revenue increased 155%, or $4.2 million, to $6.9 million for the year ended December 31, 2008. The increase in grant revenue was primarily attributable to a grant awarded in the fourth quarter 2008 from the Department of Energy to discover and develop new enzymes and enzyme cocktails to break down various types of biomass. We continue to pursue additional opportunities to secure federal, state or local agency funding to support our biofuels initiatives. As of December 31, 2008, we had committed funding from various governmental agencies totaling $19.1 million through 2012.
Product Gross Profit & Gross Margin
Product gross profit and product gross margin for the years ended December 31, 2008 and 2007 are as follows (in thousands):
| 2008 | 2007 | % Change | |||||||||
| Product revenue |
$ | 49,083 | $ | 25,975 | 89 | % | |||||
| Cost of product revenue |
35,153 | 19,815 | 77 | % | |||||||
| Product gross profit |
13,930 | 6,160 | 126 | % | |||||||
| Product gross margin |
28 | % | 24 | % | |||||||
Product gross profit totaled $13.9 million, or 28% of product revenue, for the year ended December 31, 2008 compared to $6.2 million, or 24% of product revenue, for the year ended December 31, 2007. Gross profit and margin improvement is reflective of higher sales volumes to absorb our fixed costs, partially offset by lower-than anticipated manufacturing yields for Phyzyme and, to a lesser extent, incremental zero-margin freight revenue incurred during the first half of 2008 to meet customer ship dates which negatively impacted gross profit margin by approximately one percentage point during the year ended December 31, 2008.
Our product gross margins in 2008 were below our target of 30%, primarily due to manufacturing variances related to unfavorable yields and higher raw material prices. Over time, our gross margins should be positively impacted by continued growth in sales of our enzyme products, as well as cost efficiencies we would expect to achieve if we continue to scale up production and improve our manufacturing yields. Because a large percentage of our manufacturing costs are fixed, we should realize continued margin improvements as product revenues increase; however, our margins may be negatively impacted in the future if our product revenues do not grow in line with our increase in minimum capacity requirements at Fermic.
86
Table of Contents
Because Phyzyme represents a significant percentage of our product revenue, our product gross margin is impacted to a great degree by the gross margin achieved on sales of Phyzyme. Under our agreement with Danisco, we sell our Phyzyme inventory to Danisco at our cost and then receive a royalty on Danisco’s operating profit, as defined, when the product is sold to the end user. As a result, our total cost of product revenue for Phyzyme is incurred as we ship product to Danisco, and royalty on operating profit is recognized in the period in which the product is sold to the end user as reported to us by Danisco. We may record our quarterly royalty on operating profit based on estimates from Danisco, and the final calculation royalty on operating profit is sometimes finalized in the subsequent quarter; accordingly, we are subject to potential adjustments to our actual royalty on operating profit from quarter-to-quarter. These adjustments, while typically considered immaterial in absolute dollars, could have a significant impact on our reported product gross margin from quarter-to-quarter.
Our product gross margin is dependent upon the mix of product sales as the cost of product revenue varies from product to product. We believe that our product gross margin should be positively impacted as we grow sales of products we market and sell directly to end users, namely Fuelzyme-LF and Purifine, which are expected to have higher gross margins than our Phyzyme products. Cost of product revenue includes both fixed and variable costs, including materials and supplies, labor, facilities and other overhead costs, associated with our product revenues. Excluded from cost of product revenue are costs associated with the scale-up of manufacturing processes for new products that have not reached commercial-scale production volumes, which we include in our research and development expenses. Cost of product revenue increased $15.3 million, or 77%, to $35.2 million for the year ended December 31, 2008 compared to the year ended December 31, 2007. This increase resulted primarily from the increase in product revenues, and to a lesser extent, the increase in our fixed manufacturing costs under our contract with Fermic.
Operating Expenses
Research and development and selling, general and administrative expenses for the years ended December 31, 2008 and 2007 are as follows (in thousands):
| 2008 | 2007 | % Change | |||||||
| Research and development |
$ | 63,438 | $ | 52,296 | 21 | % | |||
| Selling, general and administrative expenses |
$ | 44,822 | $ | 37,497 | 20 | % | |||
The operating expenses for the year ended December 31, 2008 increased compared to the prior year ended December 31, 2007, related primarily to the biofuels business only being included in operating expenses since the closing of the June 2007 merger with Celunol, as well as our acceleration of biofuels development and commercialization efforts in 2008.
Research and Development
Research and development expenses consist primarily of costs associated with internal development of our technologies and our product candidates, including engineering costs associated with our pilot and demonstration-scale cellulosic ethanol facilities, manufacturing scale-up and bioprocess development for our current products, and costs associated with research activities performed on behalf of our collaborators.
For the year ended December 31, 2008 we estimate that approximately 78% of our research and development personnel costs, based upon hours incurred, were spent on internal product and technology development, and that approximately 22% on research activities funded by our collaborators and grants. For the year ended December 31, 2007 we estimate that approximately 61% of our research and development personnel costs, based upon hours incurred, were spent on internal product and technology development, and that approximately 39% on research activities funded by our collaborators and grants. The increase in time spent on internal product and technology development from the prior year is primarily attributed to our focus on cellulosic ethanol process development since the merger with Celunol, and to a lesser extent, bioprocess development and technical support for our enzyme products that have already been introduced commercially.
87
Table of Contents
Our research and development expenses increased $11.1 million, to $63.4 million (including share-based compensation of $4.4 million) compared to $52.3 million (including share-based compensation of $3.7 million) for the year ended December 31, 2008. Our research and development expenses by operating segment for the years ended December 31, 2008 and 2007 were as follow (in thousands):
| 2008 | 2007 | % Change | |||||||
| Biofuels |
$ | 41,467 | $ | 13,474 | 208 | % | |||
| Specialty Enzymes |
21,971 | 38,822 | (43 | )% | |||||
| $ | 63,438 | $ | 52,296 | 21 | % | ||||
Biofuels Research and Development
Research and development expenses related to our biofuels business include cost related to our ongoing development and validation of our cellulosic ethanol process technology, including, but not limited to, enzyme discovery and development and bioprocess development designed to improve ethanol yields and reduce cost-per-gallon, feedstock testing and validation at the laboratory, pilot- and demo-plant scale, as well as costs related to commissioning, optimization and operation of our demo plant in Jennings, Louisiana.
Our biofuels research and development expenses increased $28.0 million from 2007 to 2008. This increase is related to two factors. First, our 2008 expenses include a full twelve months of post-merger biofuels-related expenses, while in 2007 our expenses included only about six months of post-merger expenses. Second, we accelerated our biofuels technology development efforts during 2008, particularly related to our demo plant start-up and commissioning at our site in Jennings, Louisiana.
Specialty Enzymes Research and Development
Research and development expenses related to our specialty enzyme business include costs related to ongoing bioprocess development and manufacturing process yield improvements, funded support for research collaborations and to a lesser extent, early stage product development.
Our specialty enzymes research and development expenses decreased $16.9 million from 2007 to 2008. This decrease is related primarily to our shift in focus to biofuels process development after the merger with Celunol on June 20, 2007, and to a lesser extent the de-emphasis of early stage product development for our specialty enzyme business segment and collaboration and grant work not core to our current focus.
Selling, General and Administrative Expenses
Selling, general and administrative expenses increased $8.3 million, or 23%, to $44.3 million (including share-based compensation of $6.8 million) for the year ended December 31, 2008. This increase is largely due to incremental personnel and overhead costs resulting from the merger with Celunol in June 2007, incremental legal expense, consulting and advisory expenses related to the first phase of our collaboration with BP, and, to a lesser extent, increased personnel costs and professional services costs to support the growth in product sales and increased complexity of our business. These increases were partially offset by charges incurred during 2007 of $4.0 million related to severance, bonus and modifications to equity awards pursuant to transitional employment and severance agreements with certain executives after the completion of the merger with Celunol in June 2007.
88
Table of Contents
Share-Based Compensation Charges
We recognized $11.2 million, or $0.17 per share, and $11.0 million, or $0.20 per share, for the years ended December 31, 2008 and 2007. These charges had no impact on our reported cash flows. Share-based compensation expense was allocated among the following expense categories (in thousands):
| 2008 | 2007 | |||||
| Research and development |
$ | 4,391 | $ | 3,669 | ||
| Selling, general and administrative |
6,842 | 7,297 | ||||
| $ | 11,233 | $ | 10,966 | |||
Share-based compensation increased $0.3 million for the year ended December 31, 2008 as compared to the same period in 2007, primarily related to additional grants related to new hires during 2008. Included in share-based compensation for the year ended December 31, 2007 are non-recurring charges of $2.3 million related to modification of vesting for restricted stock awards for certain executives in connection with separation agreements relating to the merger with Celunol.
Goodwill Impairment
During 2008, we determined that the market value of our common stock and convertible debt was not adequate to support the carrying value of our goodwill resulting from the June 2007 merger between Diversa and Celunol. We recorded a non-cash charge of $106.1 million during the quarter ended September 30, 2008, representing full impairment of the carrying value of our goodwill. We believe that this impairment is reflective primarily of current market conditions, and is not indicative of a change in our business or implied value of our underlying biofuels business model aimed toward the commercialization of cellulosic ethanol.
Acquired in-process Research and Development
We allocated $42.4 million of the purchase price in connection with our merger with Celunol in June 2007 to acquired in-process research and development projects. Acquired in-process research and development (“IPR&D”) represents the valuation of acquired, to-be-completed research projects. Celunol’s ongoing research and development initiatives have primarily involved the development of its patented and proprietary biotechnology to enable production of fuel-grade ethanol from cellulosic biomass materials. As of the merger date, pursuant to authoritative guidance under these projects were not determined to have reached technological feasibility and determined to have no alternative future use. Accordingly, the amounts allocated to those projects were written off in the second quarter of 2007, the period the merger was consummated.
Restructuring Charges
We recorded charges of $12.0 million during the year ended December 31, 2006 in connection with our strategic reorganization in January 2006, which included costs for employee separation and estimates for facilities consolidation costs. During the years ended December 31, 2008 and December 31, 2007, we recorded $0.5 million and $1.5 million of additional charges reflecting revisions in our estimates and present value adjustments for our remaining net facilities consolidation costs. Our revision in December 2007 was primarily related to executing our sublease agreement with a subtenant in October 2007. All expense amounts are included within selling, general and administrative expenses.
Interest and other income, net
Interest income on cash and short term investments was $1.0 million for the year ended December 31, 2008 compared to $3.9 million for the year ended December 31, 2007 primarily due to lower average cash and investment balances during 2008.
89
Table of Contents
Interest expense
Interest expense was $9.8 million, net of $6.2 million in capitalized interest for the demonstration facility, for the year ended December 31, 2008 compared to $5.7 million for the year ended December 31, 2007, net of $0.7 million in capitalized interest for the demonstration facility. The increase was attributed to interest on the 2007 Notes we issued in March and April 2007 combined with the 2008 Notes issued in February 2008. We recorded aggregate interest expense related to the 2008 Notes of $8.8 million for the year ended December 31, 2008, representing the following (in thousands):
| 2008 | |||
| 8% coupon interest, payable in cash |
$ | 4,340 | |
| Non-cash accretion of debt discount |
4,009 | ||
| Non-cash amortization of debt issuance costs |
449 | ||
| $ | 8,798 | ||
Loss on exchange of convertible notes
In connection with the issuance of the 2008 Notes, we exchanged $18.5 million in aggregate principal amount of the 2007 Notes for approximately $16.7 million in aggregate principal amount of the 2008 Notes. Pursuant to current accounting rules, we recorded a non-cash loss on the exchange of $3.6 million, equal to the difference between the carrying value of the 2007 Notes and the fair value of the 2008 Notes and warrants issued.
Gain on net change in fair value of derivative assets and liabilities
The fair value of the compound embedded derivative, warrants, and the convertible hedge transaction in connection with our 2008 Notes are recorded as a derivative asset or liability and marked-to-market each balance sheet date. The change in fair value is recorded in the statement of operations as “Change in fair value of derivative assets and liabilities.” During the year ended December 31, 2008, we recorded a net gain of $3.5 million related to the change in fair value of our recorded derivative asset and liabilities between the closing date of February 27, 2008 and December 31, 2008.
Loss on debt extinguishment upon conversion of convertible debt
During the year ended December 31, 2008, pursuant to current accounting rules, we recorded a loss on debt extinguishment of $0.1 million, calculated as the difference between the carrying value of the converted 2008 Notes and the fair value of the shares of common stock delivered to the noteholders upon conversion. The carrying value of the converted 2008 Notes was equal to $8.9 million which represented the difference between the principal converted of $12.1 million and the unamortized debt discount and issuance costs. During the year, we issued a total of 3.7 million shares with a total market value as of the dates of conversion of $9.0 million to settle the converted 2008 Notes and related “make-whole” payments.
Loss attributed to noncontrolling interest in Galaxy Biofuels LLC
In connection with the initial phase of our strategic partnership with BP, we formed Galaxy as a special purpose entity. We are considered the primary beneficiary of Galaxy and consolidate its financial results. Pursuant to current accounting rules, the transaction fees and joint development fees are accounted for as follows:
| • | The license to technology we granted to Galaxy and ongoing joint development work we perform for Galaxy are considered capital contributions to Galaxy; |
| • | Transaction fees and joint development fees paid by BP are considered capital contributions to Galaxy, which are subsequently distributed to us as a reduction to our capital account; |
90
Table of Contents
| • | Ongoing joint development is considered a monthly expense of Galaxy. |
As a result, our consolidated financial statements include a line item called “Noncontrolling Interest in Galaxy Biofuels LLC.” On our consolidated balance sheet, this line reflects BP’s ownership of Galaxy’s equity. This line item is reduced by BP’s 50% share of Galaxy’s profits and losses, and increased by cash distributions made by BP to us on behalf of Galaxy. BP’s share of Galaxy’s losses is reflected in our consolidated statement of operations as “Loss attributed to noncontrolling interest in Galaxy Biofuels LLC.” Galaxy has incurred approximately $25 million in losses through December 31, 2008, 50% of which have been allocated to BP.
Liquidity and Capital Resources
Since inception, we have financed our business primarily through the sale of common and preferred stock, funding from strategic partners and government grants, the issuance of convertible debt, and product sales. As of December 31, 2009 our strategic partners, including BP, have provided us with more than $375 million in funding since inception, including more than $40 million from various government agencies, and are committed to additional funding of more than $27 million through 2012, subject to our performance under existing agreements, excluding milestone payments, license and commercialization fees, and royalties or profit sharing. Our committed funding includes $7.5 million from our Vercipia joint venture with BP, announced in February 2009, which is to be paid during the first quarter of 2010. Vercipia operates as a separate commercial entity, with the $7.5 million in committed BP funding used solely for this entity.
Our future committed funding is subject to our performance under existing agreements, and is concentrated within a limited number of collaborators. Our failure to successfully maintain our relationships with these collaborators could have a material adverse impact on our operating results and financial condition.
Capital Requirements
As of December 31, 2009, we had available cash and cash equivalents of approximately $32.1 million, including approximately $7.2 million which relates to Vercipia and is to be used solely for its operations. Historically, we have funded our capital requirements through available cash, issuances of debt and equity, product, collaboration and grant revenue, capital leases and equipment financing, and line of credit agreements. Since March 2007, we have raised approximately $158.8 million in net cash proceeds from convertible debt issuances to fund our cellulosic ethanol pilot and demonstration-scale facilities and other working capital requirements, and in October 2009 we raised approximately $12.2 million in net cash proceeds from an underwritten public offering of shares of our common stock and warrants to purchase shares of our common stock. As of December 31, 2009, we had an accumulated deficit of approximately $630.0 million.
We will require additional capital to fund our operations. Our independent registered public accounting firm has included an explanatory paragraph in its report on our 2009 financial statements related to the substantial doubt in our ability to continue as a going concern. Our cash at December 31, 2009, along with anticipated cash from grants, revenue, our commitment from BP and other sources is not sufficient to meet cash requirements to fund our operating expenses, capital expenditures, required and potential payments under our 2007 Notes, 2008 Notes and 2009 Notes, and working capital requirements through 2010 without additional sources of cash and/or the deferral, reduction or elimination of significant planned expenditures.
We are dependent upon BP’s financial and technical contributions to our joint ventures in order to realize the benefits of the strategic partnership with BP. The efforts under the first phase of our partnership have been co-funded by BP under an 18-month initial agreement was scheduled to expire on January 31, 2010 and was extended through March 1, 2010 and then again recently to April 1, 2010. We and BP are currently in discussions to extend this partnership. If BP were to discontinue its participation, we would need to continue the efforts on our own or identify and enter into arrangements with one or more other partners. If we were required to fund all
91
Table of Contents
of the technology development efforts contemplated under this partnership, we would need to raise additional funds to do so, which may be difficult in the current financing environment. Alternatively, it may be difficult for us to find a different partner that is a good strategic fit and to enter into a new strategic relationship on terms that are favorable to us. If we are unable to find an additional partner or raise additional funds, we may be required to discontinue our biofuels business or dispose of certain assets related to it.
Through our Vercipia joint venture with BP, we will also need to raise sufficient capital to fund the construction of our first commercial cellulosic ethanol plant to be located in Highlands County, Florida. We estimate that the total costs of construction for this first commercial plant will be approximately $300 million, which we anticipate will be funded from a combination of non-recourse debt and equity capital. In February 2009, we and BP filed a joint application for a Department of Energy (“DOE”) loan guarantee program. On June 25, 2009, we announced our application had been selected by the DOE to enter the due diligence phase of its Title XVII Loan Guarantee Program. If awarded, funding from this program could cover a substantial portion of the total cost of construction of the project We expect the remaining portion to be funded by project equity investments from BP and us. This may require us to raise project financing in addition to the cash required to fund our ongoing operations. Pending the timing of project financining, we anticpate that Vercipia could break ground on this facility as early as 2010.
We believe that we will be successful in generating additional cash to fund our operations through a combination of additional corporate partnerships and collaborations, federal, state and local grant funding, incremental product sales, selling or financing assets, and, if necessary and available, the sale of equity or debt securities. If we are unsuccessful in raising additional capital from any of these sources, we will need to defer, reduce or eliminate certain planned expenditures.
There can be no assurance that we will be able to obtain any sources of financing on acceptable terms, or at all. If we are not able to defer, reduce or eliminate our expenditures, secure additional sources of revenue or otherwise secure additional funding, we may need to restructure or significantly curtail our operations, divest all or a portion of our business, file for bankruptcy or cease operations.
Convertible Debt Obligations
The following table summarizes our principal and interest obligations for the 2007, 2008 and 2009 Notes as of December 31, 2009, assuming such obligations are not converted prior to maturity (in thousands):
| Payments due by Period | |||||||||||||||
| Total | Less than 1 Year |
1 - 3 Years | 3 - 5 Years | More than 5 Years | |||||||||||
| 2007 Notes (1) |
$ | 135,478 | $ | 3,797 | $ | 7,594 | $ | 7,594 | $ | 116,493 | |||||
| 2008 Notes (2) |
18,241 | 1,216 | 17,025 | — | — | ||||||||||
| 2009 Notes (3) |
35,397 | 1,336 | 2,467 | 2,467 | 29,127 | ||||||||||
| Total Principal and Interest Obligations |
$ | 189,116 | $ | 6,349 | $ | 27,086 | $ | 10,061 | $ | 145,620 | |||||
| (1) | The holders of the 2007 Notes have the right to require us to purchase the 2007 Notes for cash (including any accrued and unpaid interest) on April 1, 2012, April 1, 2017 and April 1, 2022. |
| (2) | Total obligations under the 2008 Notes include approximately $3.0 million (including $1.2 million due within one year) in interest through maturity of the 2008 Notes. Interest payments on the 2008 Notes may be made, at our option and subject to the satisfaction of certain conditions, in shares of common stock, or interest shares, valued at a 5% discount to the average of the volume weighted stock price during a measurement period prior to the applicable interest payment date. |
| (3) | The holders of the 2009 Notes have the right to require us to purchase the 2009 Notes for cash (including any accrued and unpaid interest) on April 1, 2012, April 1, 2017 and April 1, 2022. Total obligations under the 2009 Notes include approximately $21.7 million (including $1.3 million due within one year) in interest through maturity of the 2009 Notes. Interest payments on the 2009 Notes may be made, at our option and |
92
Table of Contents
| subject to the satisfaction of certain conditions, in shares of common stock, or interest shares, valued at the greater of the applicable conversion price in effect, which was $9.60 as of December 31, 2009, or the average of the volume weighted stock price during a measurement period prior to the applicable interest payment date. |
Balance Sheet
Our consolidated assets have increased by $14.3 million, to $167.9 million at December 31, 2009 from $153.6 million at December 31, 2008, attributable primarily to the increase in cash from payments received under our collaboration with BP and our equity offering in October.
Our consolidated liabilities have decreased by $43.6 million, to $137.7 million at December 31, 2009 from $181.3 million at December 31, 2008, primarily attributable to a decrease in our carrying value of debt, due to additional conversions of the 2008 Notes during 2009, which resulted in the issuance of 3.7 million shares of our common stock.
Cash Flows Related to Operating, Investing and Financing Activities
Our operating activities used cash of $58.8 million for the year ended December 31, 2009. Our cash used in operating activities consisted primarily of cash used to fund our efforts in cellulosic ethanol technology process development and commercialization, which was partially offset by proceeds from BP’s capital contributions to Galaxy and Vercipia which are included in financing activities described below.
Our investing activities used cash of $5.8 million for the year ended December 31, 2009. Our investing activities included purchases of property, plant and equipment primarily for the start-up and commissioning of our demonstration-scale facility.
During 2007, 2008, and 2009, we (including expenditures by Celunol Corp., with which we merged in June 2007) have spent in excess of $100 million in capital expenditures for further modifications and improvements to our pilot facility and the construction, start-up, commissioning and optimization of our 1.4 million gallon per year demonstration-scale cellulosic ethanol facility in Jennings, Louisiana. In 2009, we achieved a key development milestone when our demonstration-scale facility was commissioned and produced our first gallons of cellulosic ethanol out of the plant. Work to optimize the facility and make process improvements has continued throughout 2009 and into early 2010 to ensure reliable and cost-effective operation. We will require additional capital and operating expenditures to complete the optimization of our demonstration-scale facility throughout 2010. We do not have fixed-priced arrangements with our major engineering and construction firms; as such, most of our engineering and construction costs related to our demonstration-facility are incurred and paid on a time and materials basis. Since 2007, we have incurred significant costs in excess of our projected expenditures for the improvements to our pilot plant and construction, commissioning and optimization of our demonstration-scale facility.
Our financing activities generated net cash of $89.2 million for the year ended December 31, 2009, consisting primarily of capital contributions by BP into Galaxy and Vercipia, our two consolidated variable interest entities, as well as our equity financing which closed in October 2009.
93
Table of Contents
Contractual Obligations
The following table summarizes our contractual obligations at December 31, 2009, excluding the principal and interest payments for our 2009 Notes, 2008 Notes and 2007 Notes shown above (in thousands):
| Payments due by Period | ||||||||||||||||||||
| Total | Less than 1 Year |
1 - 3 Years | 3 - 5 Years | More than 5 Years |
||||||||||||||||
| Contractual Obligations |
||||||||||||||||||||
| Verenium: |
||||||||||||||||||||
| Operating leases gross |
$ | 41,053 | $ | 6,084 | $ | 12,893 | $ | 12,824 | $ | 9,252 | ||||||||||
| Sublease income (1) |
(5,491 | ) | (987 | ) | (2,083 | ) | (2,231 | ) | (190 | ) | ||||||||||
| Operating leases, net |
35,562 | 5,097 | 10,810 | 10,593 | 9,062 | |||||||||||||||
| Manufacturing costs to Fermic (2) |
35,891 | 13,833 | 22,058 | — | — | |||||||||||||||
| License and research agreements |
2,240 | 295 | 590 | 565 | 790 | |||||||||||||||
| Vercipia (3): |
||||||||||||||||||||
| Operating leases |
154,534 | 1,312 | 5,342 | 6,368 | 141,512 | |||||||||||||||
| Total Contractual Obligations |
$ | 228,227 | $ | 20,537 | $ | 38,800 | $ | 17,526 | $ | 151,364 | ||||||||||
| 1 | Sublease rental income is expected to be received through February 2015, pursuant to a facilities sublease agreement we entered into during the fourth quarter of 2007. |
| 2 | Pursuant to our manufacturing agreement with Fermic, we are obligated to reimburse monthly costs related to manufacturing activities. These costs scale up as our projected manufacturing volume increases. |
| 3 | Vercipia is 50% owned with operating lease agreements in Florida for 16,200 net plantable acres and 142.2 acres of improved and irrigated farmland being used by Vercipia as a seed farm, intended for the growth of energy cane to be used as agricultural bio-mass for our first cellulosic ethanol plant. |
Manufacturing and Supply Agreements
During 2002, we entered into a manufacturing agreement with Fermic to provide us with the capacity to produce commercial quantities of enzyme products. Based on actual and projected increased product requirements, the agreement was amended in 2006 to provide for additional capacity to be installed over the next two years. Under the terms of the agreement, we can cancel the committed purchases with thirty months’ notice provided that the term of the agreement, including the termination notice period, aggregates four years. Pursuant to our agreement with Fermic, we are also obligated to reimburse monthly costs related to manufacturing activities. These costs scale up as our projected manufacturing volume increases. As of December 31, 2009, under this agreement we have made minimum commitments to Fermic of approximately $35.9 million over the next two and a half years.
During 2010, we anticipate funding as much as $2.5 million in additional equipment costs related to our manufacturing agreement with Fermic. As we continue to develop our commercial manufacturing platforms, we may decide to purchase additional capital equipment under this agreement. Since inception through December 31, 2009, we had incurred costs of approximately $20.9 million for property and equipment related to this agreement.
Due to capacity constraints at Fermic in 2008, we were not able to supply adequate quantities of Phyzyme necessary to meet the demand from Danisco. As a result, we contracted with Genencor, a subsidiary of Danisco, to serve as a second-source manufacturer for Phyzyme. Our supply agreement with Danisco for Phyzyme contains provisions which allow Danisco, with six months advance notice, to assume the right to manufacture Phyzyme. If Danisco were to exercise this right, we may experience excess capacity at Fermic. If Danisco assumed the right to manufacture Phyzyme and we were unable to absorb or otherwise reduce the excess capacity at Fermic with other products, our results of operations and financial condition would be adversely affected.
94
Table of Contents
Letter of Credit
Pursuant to our facilities leases for our office and laboratory space in San Diego, we are required to maintain a letter of credit on behalf of our landlord in lieu of a cash deposit. The total amount required under the letter of credit is based on minimum required working capital and market capitalization. As of December 31, 2009, we had a letter of credit in place pursuant to this agreement for approximately $10.4 million, representing the $100,000 minimum and approximately 24 months’ current rent. The letter of credit is issued under our existing bank agreement. We are required by the bank to secure this obligation with cash, which is reflected as restricted cash on our consolidated balance sheet as of December 31, 2009 and 2008.
Off-Balance Sheet Arrangements
We do not have any off-balance sheet arrangements that would give rise to additional material contractual obligations as of December 31, 2009.
Critical Accounting Policies
Our discussion and analysis of our financial condition and results of operations is based upon our consolidated financial statements, which have been prepared in accordance with U.S. generally accepted accounting principles. The preparation of these consolidated financial statements requires management to make estimates and judgments that affect the reported amounts of assets, liabilities, revenue and expenses, and related disclosures. On an ongoing basis, we evaluate these estimates, including those related to revenue recognition, long-lived assets, accrued liabilities, convertible senior notes, and income taxes. These estimates are based on historical experience, information received from third parties, and on various other assumptions that are believed to be reasonable under the circumstances, the results of which form the basis for making judgments about the carrying values of assets and liabilities that are not readily apparent from other sources. Actual results may differ from these estimates under different assumptions or conditions.
We believe the following critical accounting policies affect the significant judgments and estimates used in the preparation of our consolidated financial statements.
Revenue Recognition
We follow the provisions as set forth by authoritative accounting guidance.
We generally recognize revenue when we have satisfied all contractual obligations and we are reasonably assured of collecting the resulting receivable. We are often entitled to bill our customers and receive payment from our customers in advance of recognizing the revenue under current accounting rules. In those instances where we have billed our customers or received payment from our customers in advance of recognizing revenue, we include the amounts in deferred revenue on our balance sheet.
We generate revenue from research collaborations generally through funded research, up-front fees to initiate research projects, fees for exclusivity in a field, and milestones. We recognize revenue from research funding on a “proportional performance” basis, as research hours are incurred under each agreement. We recognize fees to initiate research over the life of the project. We recognize revenue from exclusivity fees over the period of exclusivity. Our collaborations often include contractual milestones. When we achieve these milestones, we are entitled to payment, as defined by the underlying agreements. We recognize revenue for milestone payments when earned, as evidenced by written acknowledgement from the collaborator, provided that (i) the milestone event is substantive and its achievability was not reasonably assured at the inception of the agreement, (ii) the milestone represents the culmination of an earnings process, (iii) the milestone payment is non-refundable and (iv) our past research and development services, as well as our ongoing commitment to provide research and development services under the collaboration, are charged at fees that are comparable to the fees that the we customarily charge for similar research and development services.
95
Table of Contents
We recognize revenue from grants as related costs are incurred, as long as such costs are within the funding limits specified by the underlying grant agreements.
We recognize revenue related to the sale of our inventory as we ship or deliver products, provided all other revenue recognition criteria have been met. We recognize revenue from products sold through distributors or other third-party arrangements upon shipment of the products, if the distributor has a right of return, provided that (a) the price is substantially fixed and determinable at the time of sale; (b) the distributor’s obligation to pay us is not contingent upon resale of the products; (c) title and risk of loss passes to the distributor at time of shipment; (d) the distributor has economic substance apart from that provided by us; (e) we have no significant obligation to the distributor to bring about resale of the products; and (f) future returns can be reasonably estimated. For any sales that do not meet all of the above criteria, revenue is deferred until all such criteria have been met. We include revenue from our royalty on operating profit in product revenues on the statement of operations. We recognize royalty on operating profit during the quarter in which such revenues are earned based on calculations provided by our partner. To date, we have generated a substantial portion of our product revenues, including royalty on operating profit, through our agreements with Danisco. We may record our quarterly royalty on operating profit based on estimates from Danisco, and the final calculation of the royalty is sometimes finalized in the subsequent quarter; accordingly, we are subject to potential adjustments to our actual royalty on operating profit from quarter-to-quarter.
We have contracted with Genencor, a subsidiary of Danisco, to serve as a second-source manufacturer of Phyzyme. Under current accounting guidance, product manufactured for us by Genencor is recognized on a net basis equal to the royalty on operating profit received from Danisco, as all the following indicators of net revenue reporting are met: i) the third party is the obligor; ii) the amount earned is fixed; and iii) the third party maintains inventory risk, as compared to the full value of the manufacturing costs plus royalty on operating profit we currently recognize for Phyzyme we manufacture.
We sometimes enter into revenue arrangements that include the delivery of more than one product or service. In these cases, we recognize revenue from each element of the arrangement as long as we are able to determine a separate value for each element, we have completed our obligation to deliver or perform on that element and we are reasonably assured of collecting the resulting receivable.
Share-based Compensation
Effective January 1, 2006, we calculate the fair value of all share-based payments to employees and non-employee directors, including grants of stock options, non-restricted and restricted shares, and awards issued under the employee stock purchase plan, and amortize these fair values to share-based compensation in the income statement over the respective vesting periods of the underlying awards.
Share-based compensation related to stock options includes the amortization of the fair value of options at the date of grant determined using Black-Scholes Merton (“BSM”) valuation model. We amortize the fair value of options to expense over the vesting periods of the underlying options.
Share-based compensation related to awards issued under our employee stock purchase plan, or ESPP, after December 31, 2005 are based on calculations of fair value under the BSM valuation model which are similar to how stock option valuations are made. We amortize the fair value of ESPP awards to expense over the vesting periods of the underlying awards.
We estimate the fair value of stock option awards and awards under the ESPP on the date of grant using assumptions about volatility, expected life of the awards, risk-free interest rate, and dividend yield rate. The expected volatility in this model is based on the historical volatility of our common stock and an analysis of our peers. The risk-free interest rate is based on the U.S. Treasury yield curve in effect at the time awards are granted, based on maturities which approximate the expected life of the options. The expected life of the options
96
Table of Contents
granted is estimated using the historical exercise behavior of employees and an analysis of our peers. The expected dividend rate takes into account the absence of any historical payments and management’s intention to retain all earnings for future operations and expansion.
We estimate the fair value of non-restricted and restricted stock awards based upon the closing market price of our common stock at the date of grant. We charge the fair value of non-restricted awards to share-based compensation upon grant. We amortize the fair value of restricted awards to share-based compensation expense over the vesting period of the underlying awards.
Convertible Debt and Derivative Accounting
We adopted new guidance as issued on January 1, 2009 which significantly impacted the accounting for our 2008 Notes by requiring us to account separately for the liability and equity components of the convertible debt. The liability component is measured so the effective interest expense associated with the convertible debt reflects the issuer’s borrowing rate at the date of issuance for similar debt instruments without the conversion feature. The difference between the cash proceeds associated with the convertible debt and this estimated fair value is recorded as a debt discount and amortized to interest expense over the life of the convertible debt.
Determining the fair value of the liability component requires the use of accounting estimates and assumptions. These estimates and assumptions are judgmental in nature and could have a significant impact on the determination of the liability component and, in effect, the associated interest expense. According to the guidance, the carrying amount of the liability component is determined by measuring the fair value of a similar liability that does not have an associated equity component. If no similar liabilities exist, estimates of fair value are primarily determined using assumptions that market participants would use in pricing the liability component, including market interest rates, credit standing, yield curves and volatilities.
At inception, we perform an assessment of all embedded features of a debt instrument to determine if 1) such features should be bifurcated and separately accounted for, and, 2) if bifurcation requirements are met, whether such features should be classified and accounted for as equity or liability. The fair value of the embedded feature is measured initially, included as a liability on the balance sheet, and remeasured each reporting period. Any changes in fair value are recorded in the statement of operations. We monitor, on an ongoing basis, whether events or circumstances could give rise to a change in our classification of embedded features.
We account for the conversion of our 2008 Notes in accordance with authoritative accounting guidance, which states that upon conversion the difference between the carrying value of the converted 2008 Notes and the fair value of the common stock delivered to the noteholders is recorded as a gain (loss) on debt extinguishment in our Consolidated Statement of Operations.
Variable Interest Entities
We have implemented the provisions of authoritative accounting guidance, which addresses consolidation by business enterprises of variable interest entities either: (1) that do not have sufficient equity investment at risk to permit the entity to finance its activities without additional subordinated financial support, or (2) in which the equity investors lack an essential characteristic of a controlling financial interest.
We have entered into a strategic collaboration with BP which includes two special purpose entities, Galaxy and Vercipia, both of which are jointly owned by BP and us.
We have determined that both Galaxy and Vercipia qualify as variable interest entities and that we are the primary beneficiary of both entities. Because we are the primary beneficiary, Galaxy and Vercipia are therefore subject to consolidation by us. As a result, BP’s capital contributions are recorded as noncontrolling interests in
97
Table of Contents
consolidated entities on our Consolidated Balance Sheets. We consolidate the operating results of Galaxy and Vercipia, and record an adjustment to the noncontrolling interests in consolidated entities for BP’s share of profits and/or losses in these entities.
Long-Lived Assets
We review long-lived assets, including leasehold improvements, property and equipment, and acquired intangible assets for impairment whenever events or changes in business circumstances indicate that the carrying amount of the assets may not be fully recoverable. This requires us to estimate future cash flows related to these assets. Actual results could differ from those estimates, which may affect the carrying amount of assets and the related amortization expense.
Income Taxes
Effective in 2007, we account for income taxes pursuant to authoritative accounting guidance, which prescribes a recognition threshold and measurement attributes for financial statement disclosure of tax positions taken or expected to be taken on our tax return. We do not recognize an uncertain tax position as a deferred tax asset if it has less than a 50% likelihood of being sustained.
We adopted the updated authoritative guidance on January 1, 2007, and commenced analyzing filing positions in all of the federal and state jurisdictions where we are required to file income tax returns, as well as all open tax years in these jurisdictions. As a result of adoption, we have recorded no additional tax liability. As of December 31, 2009 we have not yet completed our analysis of our deferred tax assets for net operating losses and research and development credits. As such, we have removed these amounts and the offsetting valuation allowance from our deferred tax assets. We are in the process of completing a Section 382 analysis regarding the limitation of the net operating loss and research and development credits.
We record a valuation allowance to reduce our deferred tax assets to the amount that is more likely than not to be realized. While we have considered future taxable income and ongoing tax planning strategies in assessing the need for the valuation allowance, in the event we were to determine that we would be able to realize our deferred tax assets in the future in excess of their net recorded amounts, an adjustment to the deferred tax assets would increase our income in the period such determination was made. Likewise, should we determine that we would not be able to realize all or part of our net deferred tax assets in the future, an adjustment to the deferred tax assets would be charged to income in the period such determination was made. Our deferred tax assets at December 31, 2009 were fully offset by a valuation allowance.
Inventories
We value inventory at the lower of cost (first in, first out) or market value and, if necessary, reduce the value by an estimated allowance for excess and obsolete inventories. The determination of the need for an allowance is based on our review of inventories on hand compared to estimated future usage and sales, as well as judgments, quality control testing data, and assumptions about the likelihood of obsolescence.
Recently Issued Accounting Standards
Information with respect to recent accounting standards is included in Note 1 of the Notes to Consolidated Financial Statements.
| ITEM 7A. | QUANTITATIVE AND QUALITATIVE DISCLOSURES ABOUT MARKET RISK. |
Our exposure to market risk is limited to interest rate risk and, to a lesser extent, foreign currency risk.
98
Table of Contents
Interest Rate Exposure
As of December 31, 2009, all outstanding debt obligations of the Company are comprised of fixed rate interest and, therefore, there is minimal interest rate exposure.
Foreign Currency Exposure
We engage third parties, including Fermic, our contract manufacturing partner in Mexico City, to provide various services. From time to time certain of these services result in obligations that are denominated in other than U.S. dollars. Foreign currency risk is minimized because the amount of such obligations is not material.
99
Table of Contents
| ITEM 8. | FINANCIAL STATEMENTS AND SUPPLEMENTARY DATA. |
REPORT OF INDEPENDENT REGISTERED PUBLIC ACCOUNTING FIRM
To the Board of Directors and Stockholders
Verenium Corporation
We have audited the accompanying consolidated balance sheets of Verenium Corporation as of December 31, 2009 and 2008, and the related consolidated statements of operations, stockholders’ equity (deficit) and cash flows for each of the three years in the period ended December 31, 2009. These financial statements are the responsibility of the Company’s management. Our responsibility is to express an opinion on these financial statements based on our audits.
We conducted our audits in accordance with the standards of the Public Company Accounting Oversight Board (United States). Those standards require that we plan and perform the audit to obtain reasonable assurance about whether the financial statements are free of material misstatement. An audit includes examining, on a test basis, evidence supporting the amounts and disclosures in the financial statements. An audit also includes assessing the accounting principles used and significant estimates made by management, as well as evaluating the overall financial statement presentation. We believe that our audits provide a reasonable basis for our opinion.
In our opinion, the financial statements referred to above present fairly, in all material respects, the consolidated financial position of Verenium Corporation at December 31, 2009 and 2008, and the consolidated results of its operations and its cash flows for each of the three years in the period ended December 31, 2009, in conformity with U.S. generally accepted accounting principles.
The accompanying consolidated financial statements have been prepared assuming that the Company will continue as a going concern. As more fully described in Note 1, the Company has incurred recurring operating losses and has an accumulated deficit of $630.0 million at December 31, 2009. These factors as discussed in Note 1 to the consolidated financial statements, raise substantial doubt about the Company’s ability to continue as a going concern. Management’s plans in regard to these matters are also described in Note 1. The December 31, 2009 consolidated financial statements do not include any adjustments to reflect the possible future effects on the recoverability and classification of assets or the amounts and classifications of liabilities that may result from the outcome of this uncertainty.
As discussed in Note 1 to the consolidated financial statements, the Company adopted FASB ASC 470-20, Debt with Conversion and Other Options, effective as of January 1, 2009 and retroactively adjusted all periods presented in the consolidated financial statements for this change. In addition, as discussed in Note 1 to the consolidated financial statements, effective January 1, 2009, the Company adopted ASC 810-10, Consolidation, and ASC 805-10, Business Combinations, respectively.
We also have audited, in accordance with the standards of the Public Company Accounting Oversight Board (United States), the effectiveness of Verenium Corporation’s internal control over financial reporting as of December 31, 2009, based on criteria established in Internal Control-Integrated Framework issued by the Committee of Sponsoring Organizations of the Treadway Commission and our report dated March 15, 2010 expressed an unqualified opinion thereon.
/s/ Ernst & Young LLP
San Diego, California
March 15, 2010
100
Table of Contents
VERENIUM CORPORATION
(in thousands, except par value)
| December 31, | ||||||||
| 2009 | 2008 | |||||||
| ASSETS |
||||||||
| Current assets: |
||||||||
| Cash and cash equivalents |
$ | 32,055 | $ | 7,458 | ||||
| Accounts receivable, net of allowance for doubtful accounts of $1,325 and $1,760 at December 31, 2009 and 2008 |
7,209 | 8,051 | ||||||
| Inventories, net |
2,653 | 2,432 | ||||||
| Prepaid expenses and other current assets |
4,657 | 2,938 | ||||||
| Total current assets |
46,574 | 20,879 | ||||||
| Property, plant and equipment, net |
108,399 | 117,271 | ||||||
| Restricted cash |
10,400 | 10,040 | ||||||
| Debt issuance costs and other assets |
2,549 | 5,433 | ||||||
| Total assets |
$ | 167,922 | $ | 153,623 | ||||
| LIABILITIES AND STOCKHOLDERS’ EQUITY (DEFICIT) |
||||||||
| Current liabilities: |
||||||||
| Accounts payable |
$ | 10,695 | $ | 15,921 | ||||
| Accrued expenses |
12,254 | 16,130 | ||||||
| Deferred revenue (including $0 and $1,428 from a related party at December 31, 2009 and 2008) |
2,199 | 3,397 | ||||||
| Derivative liability—warrants |
— | 359 | ||||||
| 8% Senior Convertible Notes due April 1, 2012, compound embedded derivative |
— | 7,769 | ||||||
| Equipment loans payable, current portion |
18 | 1,068 | ||||||
| Total current liabilities |
25,166 | 44,644 | ||||||
| 5.5% Convertible Senior Notes due April 1, 2027 (“2007 Notes”), at face value |
69,033 | 100,500 | ||||||
| 8% Senior Convertible Notes due April 1, 2012 (“2008 Notes”), at carrying value (face value of $15,201 and $58,883 at December 31, 2009 and 2008) |
10,906 | 29,891 | ||||||
| 9% Convertible Senior Secured Notes due April 1, 2027 (“2009 Notes”), at carrying value (face value of $13,707 at December 31, 2009) |
25,817 | — | ||||||
| Derivative liability—warrants |
692 | — | ||||||
| Restructuring reserve, less current portion |
4,694 | 5,175 | ||||||
| Other long term liabilities |
1,412 | 1,105 | ||||||
| Total liabilities |
137,720 | 181,315 | ||||||
| Stockholders’ equity (deficit): |
||||||||
| Preferred stock—$0.001 par value; 5,000 shares authorized, no shares issued and outstanding at December 31, 2009 and 2008 |
— | — | ||||||
| Common stock—$0.001 par value; 245,000 shares and 170,000 shares authorized at December 31, 2009 and 2008, 11,821 and 5,649 shares issued and outstanding at December 31, 2009 and 2008 |
12 | 6 | ||||||
| Additional paid-in capital |
604,571 | 573,863 | ||||||
| Accumulated deficit |
(630,032 | ) | (613,561 | ) | ||||
| Total Verenium Corporation stockholders’ deficit |
(25,449 | ) | (39,692 | ) | ||||
| Noncontrolling interests in consolidated entities |
55,651 | 12,000 | ||||||
| Total stockholders’ equity (deficit) |
30,202 | (27,692 | ) | |||||
| Total liabilities, noncontrolling interest and stockholders’ equity (deficit) |
$ | 167,922 | $ | 153,623 | ||||
See accompanying notes.
101
Table of Contents
VERENIUM CORPORATION
CONSOLIDATED STATEMENTS OF OPERATIONS
(in thousands, except per share data)
| Years Ended December 31, | ||||||||||||
| 2009 | 2008 | 2007 | ||||||||||
| Revenues (including related party revenue of $747, $9,382 and $12,716 in 2009, 2008 and 2007): |
||||||||||||
| Product |
$ | 43,956 | $ | 49,083 | $ | 25,975 | ||||||
| Grant |
16,837 | 6,920 | 2,717 | |||||||||
| Collaborative |
5,118 | 13,656 | 17,581 | |||||||||
| Total revenue |
65,911 | 69,659 | 46,273 | |||||||||
| Operating expenses: |
||||||||||||
| Cost of product revenue (including related party costs of $0, $189 and $3,406 in 2009, 2008 and 2007) |
27,929 | 35,153 | 19,815 | |||||||||
| Research and development |
63,961 | 63,438 | 52,296 | |||||||||
| Selling, general and administrative |
38,356 | 44,822 | 37,497 | |||||||||
| Goodwill impairment charge |
— | 106,134 | — | |||||||||
| Acquired in-process research and development |
— | — | 42,400 | |||||||||
| Total operating expenses |
130,246 | 249,547 | 152,008 | |||||||||
| Loss from operations |
(64,335 | ) | (179,888 | ) | (105,735 | ) | ||||||
| Interest and other income, net |
130 | 960 | 3,802 | |||||||||
| Interest expense |
(11,105 | ) | (9,823 | ) | (5,652 | ) | ||||||
| Gain on contract settlement |
870 | — | — | |||||||||
| Loss on exchange of 2007 Notes |
— | (3,599 | ) | — | ||||||||
| Gain on amendment of 2008 Notes |
3,977 | — | — | |||||||||
| Gain (loss) on debt extinguishment upon conversion of convertible debt |
8,946 | (118 | ) | — | ||||||||
| Gain on net change in fair value of derivative assets and liabilities |
5,277 | 3,478 | — | |||||||||
| Net loss |
(56,240 | ) | (188,990 | ) | (107,585 | ) | ||||||
| Less: Loss attributed to noncontrolling interests in consolidated entities |
34,349 | 12,500 | — | |||||||||
| Net loss attributed to Verenium Corporation |
$ | (21,891 | ) | $ | (176,490 | ) | $ | (107,585 | ) | |||
| Basic and diluted net loss per share |
$ | (2.58 | ) | $ | (33.03 | ) | $ | (23.65 | ) | |||
| Weighted average shares used in computing basic and diluted net loss per share |
8,470 | 5,344 | 4,550 | |||||||||
See accompanying notes.
102
Table of Contents
VERENIUM CORPORATION
CONSOLIDATED STATEMENTS OF STOCKHOLDERS’ EQUITY (DEFICIT)
(in thousands)
| Common Stock | Additional Paid-In Capital |
Accumulated Deficit |
Accumulated Other Comprehensive Income (Loss) |
Noncontrolling Interests in Consolidated Entities |
Total Stockholders’ (Deficit) Equity |
||||||||||||||||||||
| Shares | Amount | ||||||||||||||||||||||||
| Balance at January 1, 2007 |
4,022 | 4 | 372,459 | (329,486 | ) | (61 | ) | 42,916 | |||||||||||||||||
| Net loss |
— | — | — | (107,585 | ) | — | — | (107,585 | ) | ||||||||||||||||
| Change in unrealized gain (loss) on available-for-sale securities |
— | — | — | — | 111 | — | 111 | ||||||||||||||||||
| Comprehensive loss |
— | — | — | — | — | — | (107,474 | ) | |||||||||||||||||
| Issuance of common stock under stock plans, net of stock award forfeitures |
59 | — | 1,797 | — | — | — | 1,797 | ||||||||||||||||||
| Issuance of shares in merger |
1,178 | 1 | 142,899 | — | — | — | 142,900 | ||||||||||||||||||
| Valuation of options and warrants assumed in merger |
— | — | 4,110 | — | — | — | 4,110 | ||||||||||||||||||
| Share-based compensation |
— | — | 10,966 | — | — | — | 10,966 | ||||||||||||||||||
| Balance at December 31, 2007 |
5,259 | 5 | 532,231 | (437,071 | ) | 50 | — | 95,215 | |||||||||||||||||
| Net loss |
— | — | — | (176,490 | ) | — | (12,500 | ) | (188,990 | ) | |||||||||||||||
| Change in unrealized gain (loss) on available-for-sale securities |
— | — | — | — | (50 | ) | — | (50 | ) | ||||||||||||||||
| Comprehensive loss |
— | — | — | — | — | — | (189,040 | ) | |||||||||||||||||
| Capital contributions for noncontrolling interest in consolidated entities |
— | — | — | — | — | 24,500 | 24,500 | ||||||||||||||||||
| Issuance of common stock under stock plans, net of stock award forfeitures |
65 | — | 1,432 | — | — | — | 1,432 | ||||||||||||||||||
| Issuance of common stock from convertible senior notes |
325 | 1 | 10,037 | — | — | — | 10,038 | ||||||||||||||||||
| Recognition of debt premium for 2008 Notes exchange |
— | — | 4,790 | — | — | — | 4,790 | ||||||||||||||||||
| Recognition of equity component of 2008 Notes |
— | — | 3,579 | — | — | — | 3,579 | ||||||||||||||||||
| Derecognition of equity component of 2008 Notes upon conversion |
— | — | (2,060 | ) | — | — | — | (2,060 | ) | ||||||||||||||||
| Recognition of issuance costs of 2008 Notes related to equity component |
— | — | (2,057 | ) | — | — | — | (2,057 | ) | ||||||||||||||||
| Reclassification of 2008 Notes compound embedded derivative liability |
— | — | 14,678 | — | — | 14,678 | |||||||||||||||||||
| Share-based compensation |
— | — | 11,233 | — | — | 11,233 | |||||||||||||||||||
| Balance at December 31, 2008 |
5,649 | 6 | 573,863 | (613,561 | ) | — | 12,000 | (27,692 | ) | ||||||||||||||||
| Net Loss |
— | — | — | (21,891 | ) | — | (34,349 | ) | (56,240 | ) | |||||||||||||||
| Capital contributions for noncontrolling interests in consolidated entities |
— | — | — | — | — | 78,000 | 78,000 | ||||||||||||||||||
| Issuance of common stock under stock plans, net of stock award forfeitures |
124 | — | 570 | — | — | — | 570 | ||||||||||||||||||
| Issuance of common stock, net of issuance costs of $1.3 million, net of warrants of $780 classified as a derivative liability |
2,250 | 2 | 11,397 | — | — | — | 11,399 | ||||||||||||||||||
| Issuance of common stock from convertible senior notes |
3,798 | 4 | 25,502 | — | — | — | 25,506 | ||||||||||||||||||
| Derecognition of equity component of 2008 Notes related to the adoption of new convertible debt authoritative guidance |
— | — | (18,554 | ) | 5,420 | — | — | (13,134 | ) | ||||||||||||||||
| Recognition of debt premium for 2009 Notes exchange |
— | — | 4,105 | — | — | — | 4,105 | ||||||||||||||||||
| Share-based compensation |
— | — | 7,688 | — | — | — | 7,688 | ||||||||||||||||||
| Balance at December 31, 2009 |
11,821 | $ | 12 | $ | 604,571 | $ | (630,032 | ) | $ | — | $ | 55,651 | $ | 30,202 | |||||||||||
See accompanying notes.
103
Table of Contents
VERENIUM CORPORATION
CONSOLIDATED STATEMENTS OF CASH FLOWS
(in thousands)
| Years Ended December 31, | ||||||||||||
| 2009 | 2008 | 2007 | ||||||||||
| Operating activities: |
||||||||||||
| Net loss attributed to Verenium Corporation |
$ | (21,891 | ) | $ | (176,490 | ) | $ | (107,585 | ) | |||
| Adjustments to reconcile net loss to net cash used in operating activities: |
||||||||||||
| Acquired in-process research and development |
— | — | 42,400 | |||||||||
| Goodwill impairment |
— | 106,134 | — | |||||||||
| Depreciation and amortization |
13,638 | 9,219 | 8,875 | |||||||||
| Provision (reduction) for doubtful accounts |
(385 | ) | 1,686 | (155 | ) | |||||||
| Share-based compensation |
7,688 | 11,233 | 10,966 | |||||||||
| Loss on exchange of 2007 Notes |
— | 3,599 | — | |||||||||
| Gain on 2008 Notes amendment |
(3,977 | ) | — | — | ||||||||
| Gain (loss) on debt extinguishment upon conversion of convertible senior notes |
(8,946 | ) | 118 | — | ||||||||
| Gain on net change in fair value of derivative assets and liabilities |
(5,277 | ) | (3,478 | ) | — | |||||||
| Loss attributed to noncontrolling interest in nonconsolidated entities |
(34,349 | ) | (12,500 | ) | — | |||||||
| Accretion of debt discount from convertible senior notes |
2,931 | 4,009 | — | |||||||||
| Non-cash restructuring charges |
525 | 549 | 1,481 | |||||||||
| Net loss on disposals of property, plant and equipment |
— | — | 80 | |||||||||
| Change in operating assets and liabilities: |
||||||||||||
| Accounts receivable |
1,227 | 1,381 | (2,117 | ) | ||||||||
| Inventories |
(221 | ) | 3,472 | (1,806 | ) | |||||||
| Other assets |
(676 | ) | (275 | ) | 2,768 | |||||||
| Accounts payable and accrued liabilities |
(7,238 | ) | (4,187 | ) | 3,413 | |||||||
| Restructuring reserve |
(931 | ) | (1,471 | ) | (2,263 | ) | ||||||
| Deferred revenue |
(1,198 | ) | (2,081 | ) | (700 | ) | ||||||
| Net cash used in operating activities |
(59,080 | ) | (59,082 | ) | (44,643 | ) | ||||||
| Investing activities: |
||||||||||||
| Purchases of property, plant and equipment, net |
(5,418 | ) | (46,634 | ) | (34,230 | ) | ||||||
| Purchases of short-term investments |
— | (132,127 | ) | (309,376 | ) | |||||||
| Sales and maturities of short-term investments |
— | 141,311 | 313,624 | |||||||||
| Cash acquired in merger with Celunol Corp., net of transaction costs |
— | — | 1,029 | |||||||||
| Restricted cash |
(360 | ) | (10,040 | ) | — | |||||||
| Advances made to Celunol Corp. |
— | — | (27,500 | ) | ||||||||
| Net cash used in investing activities |
(5,778 | ) | (47,490 | ) | (56,453 | ) | ||||||
| Financing activities: |
||||||||||||
| Proceeds from issuance of convertible senior notes, net of issuance costs |
— | 50,365 | 114,741 | |||||||||
| Net cash paid for convertible hedge transaction |
— | (6,194 | ) | — | ||||||||
| Conversion of notes, including “make-whole” payments |
(140 | ) | (2,116 | ) | — | |||||||
| Principle payments on debt obligations |
(1,154 | ) | (2,700 | ) | (5,240 | ) | ||||||
| Proceeds from sale of common stock and warrants |
12,749 | 1,432 | 1,797 | |||||||||
| Proceeds from capital contributions for noncontrolling interest in consolidated entities |
78,000 | 24,500 | — | |||||||||
| Net cash provided by financing activities |
89,455 | 65,287 | 111,298 | |||||||||
| Net increase (decrease) in cash and cash equivalents |
24,597 | (41,285 | ) | 10,202 | ||||||||
| Cash and cash equivalents at beginning of year |
7,458 | 48,743 | 38,541 | |||||||||
| Cash and cash equivalents at end of year |
$ | 32,055 | $ | 7,458 | $ | 48,743 | ||||||
| Supplemental disclosure of cash flow information: |
||||||||||||
| Interest paid |
$ | 4,838 | $ | 8,947 | $ | 4,735 | ||||||
| Supplemental disclosure of non-cash operating and financing activities: |
||||||||||||
| Conversions of convertible senior notes to common stock |
$ | 44,682 | $ | 13,117 | $ | — | ||||||
| Value of common shares issued in connection with the Celunol Corp. merger |
$ | — | $ | — | $ | 142,900 | ||||||
| Fair value of warrants and options issued in connection with the Celunol Corp. merger |
$ | — | $ | — | $ | 4,110 | ||||||
| Restricted common stock issued to settle employee bonus liabilities |
$ | 304 | $ | — | $ | — | ||||||
| Restricted common stock issued to settle employee termination costs |
$ | — | $ | — | $ | 990 | ||||||
See accompanying notes.
104
Table of Contents
VERENIUM CORPORATION
NOTES TO CONSOLIDATED FINANCIAL STATEMENTS
| 1. | Organization and Summary of Significant Accounting Policies |
The Company
Verenium Corporation (“Verenium” or the “Company”), was incorporated in Delaware in 1992. The Company operates in two business segments, biofuels and specialty enzymes. Its biofuels business segment is focused on developing unique technical and operational capabilities designed to enable the production and commercialization of biofuels, in particular ethanol from cellulosic biomass. Its specialty enzymes business segment develops customized enzymes for use within the alternative fuels, specialty industrial processes, and animal nutrition and health markets to enable higher throughput, lower costs, and improved environmental outcomes.
Recent Developments
Extension of BP Collaboration
As more fully described in Note 5, on February 1, 2010, the Company announced the extension of its initial 18-month joint development program established in August 2008 with partner BP Biofuels North America LLC, or BP, which was scheduled to expire on February 1, 2010, until March 1, 2010. Further, on March 1, 2010, the Company announced a second one-month extension through April 1, 2010, for which an additional $2.5 million was funded by BP for the additional month.
Public Offering of Common Stock and Warrants
As more fully described in Note 11, in October 2009, the Company issued 2,250,000 shares of its common stock and warrants to purchase an additional 900,000 shares of common stock in an underwritten public offering at a price of $6.00 per unit, raising net cash proceeds of approximately $12.2 million.
Reverse Stock Split
As more fully described in Note 11, in September 2009, the Company effected a reverse stock split of the outstanding shares of its common stock, with a par value of $0.001 per share, on the basis of one (1) new share of common stock for each 12 shares of common stock then outstanding. Share and per share amounts have been retroactively adjusted to reflect the impact of the reverse split for all periods presented.
Convertible Debt Amendments and Exchange
As more fully described in Note 2, in July 2009, the Company entered into agreements to amend the remaining $29.5 million outstanding of its 2008 Notes.
As more fully described in Note 2, in September 2009, pursuant to privately negotiated exchange agreements with certain holders of its 2007 Notes, the Company exchanged approximately $30.5 million in aggregate principal amount of the 2007 Notes for approximately $13.7 million in aggregate principal amount of new 2009 Notes.
Basis of Presentation and Going Concern
The Company has incurred a net loss of $21.9 million for the year ended December 31, 2009 and has an accumulated deficit of $630.0 million as of December 31, 2009. Based on the Company’s current operating plan, its existing working capital may not be sufficient to meet the cash requirements to fund the Company’s planned
105
Table of Contents
VERENIUM CORPORATION
NOTES TO CONSOLIDATED FINANCIAL STATEMENTS—(Continued)
operating expenses, capital expenditures, required and potential payments under the 2007 Notes, the 2008 Notes, and the 2009 Notes, and working capital requirements through 2010 without additional sources of cash and/or the deferral, reduction or elimination of significant planned expenditures.
These factors raise substantial doubt about the Company’s ability to continue as a going concern. The accompanying consolidated financial statements have been prepared assuming that the Company will continue as a going concern. This basis of accounting contemplates the recovery of the Company’s assets and the satisfaction of liabilities in the normal course of business.
The Company plans to address the expected shortfall of working capital through one or a combination of actions, including, but not limited to, securing additional corporate partnerships and collaborations, federal, state and local grant funding, selling and financing of assets, incremental product sales, and if necessary and available, the sale of additional debt or equity securities. If the Company is unsuccessful in raising additional capital from any of these sources, it will defer, reduce, or eliminate certain planned expenditures. The Company will continue to consider other financing alternatives. There can be no assurance that the Company will be able to obtain any sources of financing on acceptable terms, or at all.
If the Company cannot obtain sufficient additional financing in the short-term, it may be forced to restructure or significantly curtail its operations, file for bankruptcy or cease operations. The consolidated financial statements do not include any adjustments relating to the recoverability and classification of recorded asset amounts and classification of liabilities that might be necessary should the Company be forced to take any such actions.
Basis of Consolidation
The consolidated financial statements include the accounts of the Company and its wholly-owned subsidiaries, including Verenium Biofuels Corporation, as well as its jointly owned subsidiaries Galaxy Biofuels LLC (“Galaxy”), and Highlands Ethanol, LLC (dba Vercipia Biofuels) (“Vercipia”), both determined to be variable interest entities of which the Company is the primary beneficiary as defined by authoritative guidance. As of December 31, 2009, Vercipia had total assets of $8.4 million included in the Company’s consolidated financial statements of which $7.2 million was cash and cash equivalents to be used solely for this entity and is included in the Company’s consolidated cash and cash equivalents. In accordance with authoritative guidance, Galaxy assets were contributed and continue to be held at a zero carrying value. All intercompany accounts have been eliminated in consolidation.
Use of Estimates
The preparation of financial statements in conformity with U.S. generally accepted accounting principles requires management to make estimates and judgments that affect the reported amounts of assets, liabilities, revenue and expenses, and related disclosures. On an ongoing basis, the Company evaluates these estimates, including those related to revenue recognition, long-lived assets, accrued liabilities, its convertible debt instruments and income taxes. These estimates are based on historical experience, on information received from third parties, and on various other assumptions that are believed to be reasonable under the circumstances, the results of which form the basis for making judgments about the carrying values of assets and liabilities that are not readily apparent from other sources. Actual results may differ from these estimates under different assumptions or conditions.
106
Table of Contents
VERENIUM CORPORATION
NOTES TO CONSOLIDATED FINANCIAL STATEMENTS—(Continued)
Convertible Debt Instruments
On January 1, 2009, the Company adopted new authoritative guidance, which clarifies the accounting for convertible debt instruments. The adoption of the new guidance affects the accounting for the 2008 Notes. The Company now accounts separately for the liability and equity components of the convertible debt in a manner that reflects the Company’s nonconvertible debt (unsecured debt) borrowing rate when interest expense is recognized. The authoritative guidance requires bifurcation of a component of the debt, classification of that component in equity and the accretion of the resulting discount on the debt to be recognized as part of interest expense in the Consolidated Statement of Operations. On September 21, 2009, the Company filed a Current Report of Form 8-K to reflect the adjustments and reclassifications with respect to the financial information contained in the Company’s Annual Report on Form 10-K and Form 10-K/A for the year ended December 31, 2008 filed on March 16, 2009 and April 30, 2009 as required in connection with the retrospective application of authoritative guidance.
The authoritative accounting guidance required retroactive application to the terms of instruments as if they existed for all periods presented. The following table sets forth the effect of the retroactive application on certain previously reported line items (in thousands, except per share data):
Consolidated Statements of Operations:
| December 31, 2008 | ||||||||||||
| Originally Reported |
Effect of Change | As Adjusted | ||||||||||
| Interest expense (1) |
$ | (18,990 | ) | $ | 9,167 | $ | (9,823 | ) | ||||
| Loss on debt extinguishment (2) |
— | (118 | ) | (118 | ) | |||||||
| Net loss |
(185,542 | ) | 9,052 | (176,490 | ) | |||||||
| Basic and diluted net loss per share |
(34.68 | ) | 1.65 | (33.03 | ) | |||||||
| (1) | Represents the decrease in non-cash interest expense of $7.3 million primarily due to the change in accounting for conversions. During 2008, in accordance with authoritative guidance at that time, unamortized debt discounts and debt issuance costs upon conversion were written off to interest expense. Under the new authoritative guidance, conversions are accounted for as gains or losses on debt extinguishment which is accounted for as the difference between the fair value of the debt liability and the carrying value on conversion (principal less unamortized discounts and debt issuance costs). Additionally, non-cash interest expense decreased $1.6 million as result of the increase in capitalized interest for the demonstration-scale facility due to the increase in the effective interest rate of the 2008 Notes. |
| (2) | Represents the recognition of loss upon conversion of $12.1 million of principal during the year ended December 31, 2008. Loss on debt extinguishment is accounted for as the difference between the fair value of the debt liability and the carrying value on the conversion date. |
Consolidated Balance Sheet:
| December 31, 2008 | ||||||||||||
| Originally Reported |
Effect of Change | As Adjusted | ||||||||||
| Property, plant and equipment, net (3) |
$ | 115,711 | $ | 1,560 | $ | 117,271 | ||||||
| Debt issuance costs and other assets (4) |
6,851 | (1,418 | ) | 5,433 | ||||||||
| Convertible senior notes, at face value, net of discounts (5) |
129,092 | 1,299 | 130,391 | |||||||||
| Additional paid-in capital (6) |
584,020 | (10,157 | ) | 573,863 | ||||||||
| Accumulated deficit (7) |
(622,613 | ) | 9,052 | (613,561 | ) | |||||||
| (3) | Represents increase in capitalized interest for the demonstration-scale facility as a result of the increase in the effective interest rate of the 2008 Notes. |
107
Table of Contents
VERENIUM CORPORATION
NOTES TO CONSOLIDATED FINANCIAL STATEMENTS—(Continued)
| (4) | Represents the reclassification of debt issuance costs of $2.1 million related to the equity component (conversion option) to additional paid-in capital in stockholders’ equity, partially offset by a decrease in amortization and write-off of debt discount to interest expense upon conversions aggregating approximately $12.1 million in face value due to lower issuance costs related to the debt component. |
| (5) | Represents the increase in carrying value of the 2008 Notes to reflect the fair value of the debt liability at issuance. |
| (6) | Represents the adjustment to record the equity component debt discount, offset by the repurchase of the equity component upon conversions and issuance costs related to the equity component. |
| (7) | Represents the decrease in non-cash interest expense partially offset by the loss on debt extinguishment described above. |
Additionally, on January 1, 2009, the Company adopted authoritative guidance which provides that an entity should use a two-step approach to evaluate whether an equity-linked financial instrument (or embedded feature) is indexed to its own stock, including evaluating the instrument’s contingent exercise and settlement provisions. The adoption of this guidance required the Company to perform additional analysis on both its freestanding equity derivatives and embedded equity derivative features. The adoption of the guidance revised the Company’s accounting for the 2008 Notes conversion rights, resulting in the Company recording a derivative liability of $13.1 million representing the fair value of the conversion rights as of January 1, 2009. The recording of the derivative liability resulted in the reclassification of the equity component previously included in stockholders’ equity. Further, the Company recognized the cumulative effect of the change in accounting principle as an adjustment to the opening balance of accumulated deficit.
The cumulative adjustment to accumulated deficit related to the 2008 Notes was $5.4 million, which represents the gains on remeasurement that would have been recognized if the new authoritative guidance had been applied from the issuance date of the debt on February 27, 2008.
Cash and Cash Equivalents
The Company considers cash equivalents to be only those investments which are highly liquid, readily convertible to cash and which mature within three months from the date of purchase.
Inventories
Inventories are valued at the lower of cost or market value. Cost is determined by the first-in, first-out method, and includes material, labor, and factory overhead. If necessary, the Company adjusts its inventories by an estimated allowance for excess and obsolete inventories. The determination of the need for an allowance is based on management’s review of inventories on hand compared to estimated future usage and sales, as well as judgments, quality control testing data, and assumptions about the likelihood of obsolescence. The Company maintained a valuation allowance of $200,000 and $240,000 at December 31, 2009 and 2008.
Concentration of Credit Risk
Financial instruments that potentially subject the Company to concentrations of credit risk consist primarily of cash and cash equivalents. The Company limits its exposure to credit risk by placing its cash with high credit quality financial institutions. The Company generally invests its excess cash in U.S. Treasury and government agency obligations and investment-grade corporate securities.
108
Table of Contents
VERENIUM CORPORATION
NOTES TO CONSOLIDATED FINANCIAL STATEMENTS—(Continued)
The Company’s accounts receivable consist of amounts due from customers for the sale of products, amounts due from governmental agencies for costs incurred under funded projects, and amounts due from corporate partners under various collaboration agreements. The Company regularly assesses the need for an allowance for potentially uncollectible accounts receivable arising from its customers’ inability to make required payments. The Company has a limited number of accounts receivable and uses the specific identification method as a basis for determining this estimate. The Company maintained an allowance for doubtful accounts of $1.3 million and $1.8 million at December 31, 2009 and 2008, primarily for receivables related to a discontinued product.
Property, Plant and Equipment
Property, plant and equipment are stated at cost and depreciated over the estimated useful lives of the assets (generally three to ten years) using the straight-line method. Amortization of leasehold improvements is computed over the shorter of the lease term or the estimated useful life of the related assets. For the years ended December 31, 2009, 2008 and 2007, the Company recorded depreciation expense of $13.6 million, $9.2 million and $8.9 million, which includes the depreciation of assets under capital leases.
Pursuant to authoritative accounting guidance the Company capitalizes interest on capital projects. Capitalization commences with the first expenditure for the project and continues until the project is substantially complete and ready for its intended use. The Company amortizes the capitalized interest to depreciation expense using the straight-line method over the same lives as the related assets. Included in the costs of its demonstration facility as of December 31, 2009 and 2008 is $7.8 million and $6.9 million in capitalized interest, which was determined by applying the Company’s effective interest rate to the average amount of accumulated expenditures on its demonstration facility.
Long-Lived Assets
Long-lived assets are reviewed for impairment whenever events or changes in circumstances indicate that the carrying amount of the assets might not be recoverable. Conditions that would necessitate an impairment assessment include a significant decline in the observable market value of an asset, a significant change in the extent or manner in which an asset is used, or a significant adverse change that would indicate that the carrying amount of an asset or group of assets is not recoverable. For long-lived assets to be held and used, the Company recognizes an impairment loss only if its carrying amount is not recoverable through its undiscounted cash flows and measures the impairment loss based on the difference between the carrying amount and fair value.
Derivative Financial Instruments
The Company’s 2008 and 2009 Notes (see Note 2) and certain warrants have been accounted for in accordance with applicable authoritative guidance for derivative instruments which requires identification of certain embedded features to be bifurcated from debt instruments and accounted for as derivative assets or liabilities. The derivative assets and liabilities are initially recorded at fair value and then at each reporting date, the change in fair value is recorded in the statement of operations.
Fair Value of Financial Instruments
Effective January 1, 2009, the Company adopted authoritative guidance for fair value measurements and the fair value option for financial assets and financial liabilities. The Company did not record an adjustment to accumulated deficit as a result of the adoption of the guidance for fair value measurements, and the adoption did not have a
109
Table of Contents
VERENIUM CORPORATION
NOTES TO CONSOLIDATED FINANCIAL STATEMENTS—(Continued)
material effect on the Company’s results of operations. The guidance for the fair value option for financial assets and financial liabilities provides companies the irrevocable option to measure many financial assets and liabilities at fair value with changes in fair value recognized in earnings. The Company has not elected to measure any financial assets or liabilities at fair value that were not previously required to be measured at fair value.
Fair value is defined as the exit price, or the amount that would be received to sell an asset or paid to transfer a liability in an orderly transaction between market participants as of the measurement date. The guidance also establishes a hierarchy for inputs used in measuring fair value that maximizes the use of observable inputs and minimizes the use of unobservable inputs by requiring that the most observable inputs be used when available. Observable inputs are inputs market participants would use in valuing the asset or liability and are developed based on market data obtained from sources independent of the Company. Unobservable inputs are inputs that reflect the Company’s assumptions about the factors market participants would use in valuing the asset or liability. The guidance establishes three levels of inputs that may be used to measure fair value:
Level 1—Quoted prices in active markets for identical assets or liabilities.
Level 2—Inputs other than Level 1 that are observable, either directly or indirectly, such as quoted prices for similar assets or liabilities; quoted prices in markets that are not active; or other inputs that are observable or can be corroborated by observable market data for substantially the full term of the assets or liabilities.
Level 3—Unobservable inputs that are supported by little or no market activity and that are significant to the fair value of the assets or liabilities.
Assets and liabilities are classified in their entirety based on the lowest level of input that is significant to the fair value measurements. The Company reviews the fair value hierarchy classification on a quarterly basis. Changes in the observability of valuation inputs may result in a reclassification of levels for certain securities within the fair value hierarchy.
The following table presents the Company’s fair value hierarchy for assets and liabilities measured at fair value on a recurring basis as of December 31, 2009 (in thousands):
| December 31, 2009 | December 31, 2008 | |||||||||||||||||||||||
| Level 1 | Level 2 | Level 3 | Total | Level 1 | Level 2 | Level 3 | Total | |||||||||||||||||
| Assets: |
||||||||||||||||||||||||
| Cash equivalents (1) |
$ | 32,055 | $ | — | $ | — | $ | 32,055 | $ | 7,458 | $ | — | $ | — | $ | 7,458 | ||||||||
| Derivative – convertible hedge, net (2) |
— | — | — | — | — | — | 163 | 163 | ||||||||||||||||
| $ | 32,055 | $ | — | $ | — | $ | 32,055 | $ | 7,458 | $ | — | $ | 163 | $ | 7,621 | |||||||||
| Liabilities: |
||||||||||||||||||||||||
| Derivative – warrants (3) |
$ | — | $ | — | $ | 762 | $ | 762 | $ | — | $ | — | $ | 359 | $ | 359 | ||||||||
| Derivative – 2008 Notes compound embedded derivative (4)(6) |
— | — | 1,682 | 1,682 | — | — | 7,769 | 7,769 | ||||||||||||||||
| Derivative – 2009 Notes Compound Embedded Derivative (5)(6) |
— | — | 2,298 | 2,298 | — | — | — | — | ||||||||||||||||
| $ | — | $ | — | $ | 4,742 | $ | 4,742 | $ | — | $ | — | $ | 8,128 | $ | 8,128 | |||||||||
| (1) | Included in cash and cash equivalents on the accompanying Consolidated Balance Sheet. |
110
Table of Contents
VERENIUM CORPORATION
NOTES TO CONSOLIDATED FINANCIAL STATEMENTS—(Continued)
| (2) | Represents the net fair value of the purchased call option and written call option entered into in connection with the issuance of the Company’s 2008 Notes (see Note 2). The net fair value of the purchased call option and written call option was $0 and $163,000 as of December 31, 2009 and 2008 and classified as a net asset, using significant unobservable inputs (Level 3). |
| (3) | Represents warrants issued in conjunction with the Company’s 2008 Notes in February 2008 (see Note 2) and the Company’s public offering in October 2009 (see Note 11). The warrants issued in conjunction with the 2008 Notes have a value of $70,000 and $359,000 at December 31, 2009 and 2008. Classified as a current liability at December 31, 2008 and in long-term liabilities as part of the 2008 Notes carrying value at December 31, 2009, using significant unobservable inputs (Level 3). The warrants issued in conjunction with the Company’s public offering have a value of $692,000 and are classified as a long-term liability at December 31, 2009, using significant unobservable inputs (Level 3). |
| (4) | Represents the compound embedded derivative included in the Company’s 2008 Notes (see Note 2). The compound embedded derivative includes, among other rights, the noteholders’ right to receive “make-whole” amounts. The “make-whole” provision provides that, upon any noteholder’s conversion of the 2008 Notes for common stock, the Company is obligated to pay such holder an amount in cash or, subject to certain limitations, shares of common stock equal in value to the interest foregone over the life of the 2008 Notes as a result of such conversion, discounted back to the date of conversion using the published yield on two-year U.S. Treasury notes as the discount rate, and, if applicable, valuing the shares of stock at a 5% discount to the applicable stock price at the time of conversion. The compound embedded derivative is included in current liabilities as of December 31, 2008 and long term liabilities as part of the 2008 Notes carrying value at December 31, 2009 on the accompanying Consolidated Balance Sheet. |
| (5) | Represents the compound embedded derivative included in the Company’s 2009 Notes (see Note 2). The compound embedded derivative includes, among other rights, the noteholders right to receive “make-whole” amounts. The “make-whole” provision provides that, upon any noteholder’s conversion of the 2009 Notes for common stock, the Company is obligated to pay such holder an amount in cash or, subject to certain limitations, shares of common stock equal to the remaining scheduled interest payments attributable to such 2009 Notes from the applicable last interest payment date through April 5, 2012, discounted back to the date of conversion using the published yield on two-year U.S. Treasury notes as the discount rate, and, if applicable, valuing the shares of stock at the greater of $9.60 or the applicable stock price at the time of conversion. The embedded derivative is included in long term liabilities as part of the 2009 Notes carrying value on the accompanying Consolidated Balance Sheet. |
| (6) | The Company’s compound embedded derivatives are valued using a “lattice” model. The Company’s “lattice” valuation models assume the noteholders’ exercise patterns will follow risk-neutral conversion behavior throughout the term of the instruments consistent with maximizing the expected present value of the 2008 and 2009 Notes (collectively, the “Notes”). Because the maximizing condition reflects the expected present value of the Notes as a whole and not the “make-whole” amount, the fair value of the “make-whole” provisions do not reflect the maximum potential obligation due under such provisions. As such, the potential “make-whole” obligation was $3.0 million under the 2008 Notes and $3.0 million under the 2009 Notes, assuming all of the outstanding Notes as of December 31, 2009 converted at that time. |
111
Table of Contents
VERENIUM CORPORATION
NOTES TO CONSOLIDATED FINANCIAL STATEMENTS—(Continued)
The following table presents a reconciliation of the assets and liabilities measured at fair value using significant unobservable inputs (Level 3) from January 1, 2009 to December 31, 2009 (in thousands):
| Derivative Liability – Warrants |
Derivative Liability – 2008 Notes Compound Embedded Derivative |
Derivative Liability – 2009 Notes Compound Embedded Derivative |
Derivative Asset – Convertible Hedge Transaction |
||||||||||||
| Balance at January 1, 2009 |
$ | 359 | $ | 7,769 | $ | — | $ | 163 | |||||||
| Issuance of derivative instruments (1) |
780 | — | 2,016 | — | |||||||||||
| Adjustment to fair value included in earnings (2) |
(377 | ) | (5,345 | ) | 282 | (163 | ) | ||||||||
| Adjustment related to amendment of 2008 Notes included in earnings (3) |
— | (3,977 | ) | — | — | ||||||||||
| Other adjustments (4) |
— | 3,235 | — | — | |||||||||||
| Balance at December 31, 2009 |
$ | 762 | $ | 1,682 | $ | 2,298 | $ | — | |||||||
| (1) | Represents the recognition of compound embedded derivative related to the 2009 Notes exchange in September 2009. (see Note 2) and warrants issued in conjunction with the Company’s public offering which closed in October 2009 (see Note 11). |
| (2) | The derivatives are revalued at the end of each reporting period and the resulting difference is included in the results of operations. The fair value of the 2008 Notes compound embedded derivative, detachable warrants, convertible hedge transaction and 2009 Notes compound embedded derivative are primarily affected by the Company’s stock price, but are also affected by the Company’s stock price volatility, expected life, interest rates and the passage of time as it relates to the “make-whole” amount. For the year ended December 31, 2009, the net adjustment to fair value resulted in a gain of $5.3 million and is included in “gain on net change in fair value of derivative assets and liabilities” on the accompanying Consolidated Statement of Operations (see Note 2). |
| (3) | Represents the decrease in fair value of the 2008 Notes compound embedded derivative as a result of the amendment in July 2009 (see Note 2). |
| (4) | Represents increase in derivative liability of $13.1 million related to the 2008 Notes’ conversion rights to be recorded as a derivative liability, partially offset by “make-whole” payments related to the conversion of $43.7 million in face value of the 2008 Notes (see Note 2). |
Revenue Recognition
The Company recognizes revenue when the following criteria have been met: i) persuasive evidence of an arrangement exists; ii) services have been rendered or product has been delivered; iii) price to the customer is fixed and determinable; and iv) collection of the underlying receivable is reasonably assured.
Billings to customers or payments received from customers are included in deferred revenue on the balance sheet until all revenue recognition criteria are met. As of December 31, 2009, the Company had $2.2 million in deferred revenue, of which $1.5 million was related to funding from collaborative partners and $0.7 million was related to product sales.
Product Revenue
The Company recognizes product revenue at the time of shipment to the customer, provided all other revenue recognition criteria have been met. The Company recognizes product revenues upon shipment to distributors, provided that (i) the price is substantially fixed and determinable at the time of sale; (ii) the distributor’s obligation to pay the Company is not contingent upon resale of the products; (iii) title and risk of
112
Table of Contents
VERENIUM CORPORATION
NOTES TO CONSOLIDATED FINANCIAL STATEMENTS—(Continued)
loss passes to the distributor at time of shipment; (iv) the distributor has economic substance apart from that provided by the Company; (v) the Company has no significant obligation to the distributor to bring about resale of the products; and (vi) future returns can be reasonably estimated. For any sales that do not meet all of the above criteria, revenue is deferred until all such criteria have been met.
The Company recognizes revenue from royalties onoperating profit during the quarter in which such revenue is earned, generally upon shipment by Danisco of product to their customer, based on information provided by Danisco. Revenue from royalties on operating profit is included in product revenue in the Consolidated Statement of Operations.
The Company records revenue equal to the full value of the manufacturing costs plus royalties on operating profit for product it manufactures through its contract manufacturing agreement with Fermic S.A. in Mexico City. The Company has contracted with Genencor, a subsidiary of Danisco, to serve as a second-source manufacturer of one of its enzyme products. Revenue associated with product manufactured for the Company by Genencor is recognized on a net basis equal to the royalty on operating profit received from Danisco, as all the following conditions of reporting net revenue are met: i) the third party is the obligor; ii) the amount earned is fixed; and iii) the third party maintains inventory risk.
Grant Revenue
The Company recognizes revenue from grants as related costs are incurred, as long as such costs are within the funding limits specified by the underlying grant agreements.
Collaborative Revenue
The Company recognizes revenue from research funding under collaboration agreements when earned on a “proportional performance” basis as research hours are incurred. The Company performs services as specified in each respective agreement on a best-efforts basis, and is reimbursed based on labor hours incurred on each contract. The Company initially defers revenue for any amounts billed or payments received in advance of the services being performed and recognizes revenue pursuant to the related pattern of performance, based on total labor hours incurred relative to total labor hours estimated under the contract.
The Company recognizes fees received to initiate research projects over the life of the project. The Company recognizes fees received for exclusivity in a field over the period of exclusivity.
The Company recognizes milestone payments when earned, as evidenced by written acknowledgement from the collaborator, provided that (i) the milestone event is substantive and its achievability was not reasonably assured at the inception of the agreement, (ii) the milestone represents the culmination of an earnings process, (iii) the milestone payment is non-refundable and (iv) the Company’s past research and development services, as well as its ongoing commitment to provide research and development services under the collaboration, are charged at fees that are comparable to the fees that the Company customarily charges for similar research and development services.
Revenue Arrangements with Multiple Deliverables
The Company sometimes enters into revenue arrangements that contain multiple deliverables. In these cases, the Company recognizes revenue from each element of the arrangement as long as separate value for each element can be determined, the Company has completed its obligation to deliver or perform on that element, and collection of the resulting receivable is reasonably assured.
113
Table of Contents
VERENIUM CORPORATION
NOTES TO CONSOLIDATED FINANCIAL STATEMENTS—(Continued)
Variable Interest Entities
As more fully described in Note 5, the Company and BP have entered into a strategic collaboration which includes two special purpose entities, Galaxy and Vercipia, both of which are jointly owned by BP and the Company.
The Company has determined that both Galaxy and Vercipia qualify as variable interest entities and that the Company is the primary beneficiary of both entities. Because the Company is the primary beneficiary, Galaxy and Vercipia are therefore subject to consolidation by the Company. As a result, BP’s capital contributions are recorded as “Noncontrolling interests in consolidated entities” on the Company’s Consolidated Balance Sheet. The Company consolidates the operating results of Galaxy and Vercipia, and records an adjustment to the “Noncontrolling interests in consolidated entities” for BP’s share of profits and/or losses in these entities.
On January 1, 2009, the Company adopted recently issued authoritative guidance which recharacterizes the accounting and reporting for minority interests as noncontrolling interests and classifies them as a component of stockholders’ equity (deficit). The Company reclassified the noncontrolling interests as stockholders’ equity, including the net loss attributable to noncontrolling interests as part of the Company’s consolidated net loss and provided additional disclosures as part of the Company’s financial statements. The Company implemented the presentation and disclosure requirements of this new standard retrospectively to all periods presented.
The following table presents the changes in stockholders’ equity attributed to noncontrolling interests in consolidated entities for the year ended December 31, 2009 (in thousands):
| Balance at January 1, 2009 |
$ | 12,000 | ||
| Net loss |
(34,349 | ) | ||
| Capital contributions |
78,000 | |||
| Balance at December 31, 2009 |
$ | 55,651 | ||
As of December 31, 2009, the Company had total assets of $8.4 million pertaining to Vercipia included in the Company’s Consolidated Balance Sheets. Galaxy assets were contributed and continue to be held at a zero carrying value.
Research and Development
Research and development expenses, including direct and allocated expenses, consist of independent research and development costs, as well as costs associated with sponsored research and development. Research and development costs are expensed as incurred.
Cost of Product Revenue
Cost of product revenue includes both internal and third-party fixed and variable costs including materials and supplies, labor, facilities and other overhead costs associated with its product revenues. The Company expenses the cost of idle manufacturing capacity to cost of product revenue as incurred. Shipping and handling costs are included in cost of product revenue.
Share-Based Compensation
The Company’s share-based compensation policy requires all share-based payments to employees, including grants of employee stock options, to be recognized in the income statement based on their fair values.
114
Table of Contents
VERENIUM CORPORATION
NOTES TO CONSOLIDATED FINANCIAL STATEMENTS—(Continued)
Income Taxes
Current income tax expense (benefit) is the amount of income taxes expected to be payable (receivable) for the current year. A deferred income tax asset or liability is computed for the expected future impact of differences between the financial reporting and tax bases of assets and liabilities, as well as the expected future tax benefit to be derived from tax loss and credit carry-forwards. Deferred income tax expense is generally the net change during the year in the deferred income tax assets and liabilities. Valuation allowances are established unless, based upon the available evidence, it is more likely than not that the deferred tax assets will be realized. The effect of tax rate changes is reflected in income tax expense (benefit) during the period in which such changes are enacted. The Company has provided a full valuation allowance against any deferred tax assets.
The Company’s policy is to recognize of the impact of a tax position in the Company’s financial statements only if that position is more likely than not of being sustained upon examination by taxing authorities, based on the technical merits of the position. Any interest and penalties related to uncertain tax positions will be reflected in income tax expense.
Comprehensive Loss
Comprehensive loss is defined as the change in equity of a business enterprise during a period from transactions and other events and circumstances from non-owner sources, including unrealized gains and losses on marketable securities. The Company presents comprehensive loss in its consolidated statements of stockholders’ equity (deficit).
Computation of Net Loss per Share
Basic and diluted net loss per share has been computed using the weighted-average number of shares of common stock outstanding during the period. The Company had approximately 8,000, 22,000 and 62,000 unvested restricted shares outstanding as of December 31, 2009, 2008 and 2007. Additionally, pursuant to the merger agreement with Celunol, 126,000 shares of the Company’s common stock issued to former Celunol stockholders were placed in an escrow account until June 20, 2008 to satisfy the indemnification obligations of Celunol for breaches of the representations and warranties contained in the merger agreement or any legal proceedings related thereto. On June 20, 2008, these shares were released to the former Celunol stockholders.
For purposes of the computation of net loss per share, the unvested restricted shares and the shares held in escrow are considered contingently returnable shares and are not considered outstanding common shares for purposes of computing net loss per share until all necessary conditions are met that no longer cause the shares to be contingently returnable. The impact of these contingently returnable shares on weighted average shares outstanding has been excluded for purposes of computing net loss per share.
115
Table of Contents
VERENIUM CORPORATION
NOTES TO CONSOLIDATED FINANCIAL STATEMENTS—(Continued)
The following table presents the calculation of basic and diluted net loss per share (in thousands, except per share data):
| Years Ended December 31, | ||||||||||||
| 2009 | 2008 | 2007 | ||||||||||
| Weighted average shares outstanding during the period |
8,478 | 5,426 | 4,671 | |||||||||
| Less: Weighted average unvested restricted and merger escrow shares outstanding |
(8 | ) | (82 | ) | (121 | ) | ||||||
| Weighted average shares used in computing basic and diluted net loss per share |
8,470 | 5,344 | 4,550 | |||||||||
| Net loss |
$ | (21,891 | ) | $ | (176,490 | ) | $ | (107,585 | ) | |||
| Net loss per share, basic and diluted |
$ | (2.58 | ) | $ | (33.03 | ) | $ | (23.65 | ) | |||
The Company has excluded all outstanding stock options and warrants from the calculation of diluted net loss per share because all such securities are anti-dilutive for all applicable periods presented. The total number of shares excluded from the calculations of diluted net loss per share, prior to application of the treasury stock method for options and warrants, was 3.0 million, 1.6 million and 0.8 million for the years ended December 31, 2009, 2008 and 2007. Such securities, had they been dilutive, would have been included in the computation of diluted earnings per share.
Segment Reporting
Effective with the merger of Celunol in June 2007, the Company operates in two reportable segments, biofuels and specialty enzymes. Its biofuels segment is focused on developing unique technical and operational capabilities designed to enable the production and commercialization of biofuels, in particular ethanol from cellulosic biomass. Its specialty enzymes segment develops customized enzymes for use within the alternative fuels, specialty industrial processes, and animal nutrition and health markets to enable higher throughput, lower costs, and improved environmental outcomes.
The Company provides segment financial information and results for biofuels and specialty enzymes based on total revenues, product revenue, product gross profit, total operating expenses, capital expenditures, and total identifiable assets used in management’s assessment of operating performance and operating decisions. Expenses shared by the segments require the use of judgments and estimates in determining the allocation of expenses to the two segments. Different assumptions or allocation methods could result in materially different results by segment. Further, expenses allocated to each of the two segments may not be indicative of the expenses of each operating segment if such segments operated on a stand-alone basis.
Effect of New Accounting Standards
Accounting Standards Codification
The Financial Accounting Standards Board (“FASB”) established the FASB Accounting Standards Codification™ (“Codification”) as the source of authoritative U.S. generally accepted accounting principles (“GAAP”) recognized by the FASB to be applied by nongovernmental entities in the preparation of financial statements issued for interim and annual periods ending after September 15, 2009. The Codification has changed the manner in which U.S. GAAP guidance is referenced, but did not have an impact on the Company’s consolidated financial position, results of operations or cash flows.
116
Table of Contents
VERENIUM CORPORATION
NOTES TO CONSOLIDATED FINANCIAL STATEMENTS—(Continued)
Business Combinations
On January 1, 2009, the Company adopted the revised FASB authoritative guidance for business combinations, which establishes principles and requirements for how the acquirer in a business combination (i) recognizes and measures in its financial statements the identifiable assets acquired, the liabilities assumed and any noncontrolling interest in the acquiree, (ii) recognizes and measures the goodwill acquired in the business combination or a gain from a bargain purchase and (iii) determines what information to disclose to enable users of the financial statements to evaluate the nature and financial effects of the business combination. The provisions of the revised guidance were applied in valuing the assets in the Vercipia joint venture. Pursuant to the provisions, as the Company is consolidating the entity as prescribed by the variable interest authoritative guidance, the assets contributed by Verenium are carried on the Company’s balance sheet at their respective carrying values. Accordingly, the adoption of the revised business combination guidance did not have a material impact on the Company’s consolidated financial statements.
In April 2009, the FASB amended authoritative guidance which addresses the initial recognition, measurement and subsequent accounting for assets and liabilities arising from contingencies in a business combination, and requires that such assets acquired or liabilities assumed be initially recognized at fair value at the acquisition date if fair value can be determined during the measurement period. If the fair value as of the acquisition date cannot be determined, the asset acquired or liability assumed arising from a contingency is recognized only if certain criteria are met. This guidance also requires that a systematic and rational basis for subsequently measuring and accounting for the assets or liabilities be developed depending on their nature. This guidance is effective for assets or liabilities arising from contingencies in business combinations for which the acquisition date is during or after 2010. The Company does not anticipate the adoption of this guidance to have a material impact on its future consolidated financial statements, absent any material business combinations.
Noncontrolling Interests in Consolidated Financial Statements
In December 2007, the FASB issued authoritative guidance for Noncontrolling Interests in Consolidated Financial Statements. For consolidated subsidiaries that are less than wholly owned, the third party holdings of equity interests are referred to as noncontrolling interests. The portion of net loss attributable to noncontrolling interests for such subsidiaries is presented as net loss applicable to noncontrolling interest on the consolidated statement of operation, and the portion of stockholders’ equity of such subsidiaries is presented as noncontrolling interest on the consolidated balance sheet. Effective January 1, 2009, the Company adopted this guidance. The adoption did not have a material impact on the Company’s financial condition, results of operations or cash flows. However, it did impact the presentation and disclosure of noncontrolling interests in the Company’s consolidated financial statements and notes to the consolidated financial statements. As a result of the retrospective presentation and disclosure requirements, the Company was required to reflect the change in presentation and disclosure for the period ending March 31, 2009 and all periods presented in future filings.
Accounting for Convertible Debt Instruments
On January 1, 2009, the Company adopted the cash conversion subsections of new authoritative literature, which clarify the accounting for convertible debt instruments that may be settled in cash (including partial cash settlement) upon conversion. The cash conversion subsections require issuers to account separately for the liability and equity components of certain convertible debt instruments in a manner that reflects the issuer’s nonconvertible debt (unsecured debt) borrowing rate when interest cost is recognized. The cash conversion subsections require bifurcation of a component of the debt, classification of that component in equity and the accretion of the resulting discount on the debt to be recognized as part of interest expense in our consolidated statements of operations.
117
Table of Contents
VERENIUM CORPORATION
NOTES TO CONSOLIDATED FINANCIAL STATEMENTS—(Continued)
The cash conversion subsections require retrospective application to the terms of instruments as they existed for all periods presented. The adoption of the cash conversion subsections affects the accounting for our 2008 Notes.
Fair Value Accounting
On February 6, 2008, the FASB issued guidance for all non-financial assets and liabilities, except those that are recognized or disclosed at fair value in issued financial statements on a recurring basis. This guidance is effective for financial statements issued for fiscal years beginning after November 15, 2008. The adoption of this guidance did not have a material impact on the Company’s consolidated financial statements.
In April 2009, the FASB amended existing guidance on determining whether an impairment for investments in debt securities is other than temporary. The Company adopted the revised guidance on a prospective basis beginning April 1, 2009. The application of the revised guidance did not have an impact on the Company’s consolidated financial statements.
In August 2009, the FASB issued authoritative guidance that provides clarification for circumstances in which a quoted price in an active market for an identical liability is not available. The guidance is intended to reduce potential ambiguity in financial reporting when measuring the fair value of liabilities. The guidance is effective for the first interim reporting period beginning after issuance. The Company does not anticipate the adoption of this guidance to have a material impact on the Company’s future consolidated financial statements.
Subsequent Events
In June 2009, the Company adopted a new accounting pronouncement which establishes general standards of accounting for and disclosures of events that occur after the balance sheet date but before the financial statements are issued or available to be issued. It is effective for interim and annual periods ending after June 15, 2009. The Company applied the provisions and determined no reportable subsequent events exists.
Joint Venture Accounting
In June 2009, the FASB issued authoritative guidance which changes the approach to determine the primary beneficiary of a variable interest entity (“VIE”) and requires companies to more frequently assess whether they must consolidate VIEs. This new standard is effective for the Company beginning on January 1, 2010. The Company is currently assessing the impact of this new guidance on its consolidated financial statements.
Revenue Recognition
In October 2009, the FASB issued authoritative guidance for arrangements with multiple deliverables. The guidance will allow companies to allocate arrangement consideration in multiple deliverable arrangements in a manner that better reflects the transaction’s economics. The new guidance requires expanded qualitative and quantitative disclosures and is effective for fiscal years beginning on or after June 15, 2010. Early adoption of the guidance is permitted. The Company is currently evaluating the impact of adopting this guidance on the Company’s future consolidated financial statements.
118
Table of Contents
VERENIUM CORPORATION
NOTES TO CONSOLIDATED FINANCIAL STATEMENTS—(Continued)
2. Convertible Debt
Carrying value of the Company’s convertible debt is set forth below (in thousands):
| December 31, 2009 | December 31, 2008 | |||||||||||||||||||
| 2009 Notes | 2008 Notes | 2007 Notes | 2009 Notes | 2008 Notes | 2007 Notes | |||||||||||||||
| Principal value |
$ | 13,707 | $ | 15,201 | $ | 69,033 | $ | — | $ | 58,883 | $ | 100,500 | ||||||||
| Debt premium (discount), net |
9,812 | (6,047 | ) | — | — | (28,992 | ) | — | ||||||||||||
| Derivative liabilities (1) |
2,298 | 1,752 | — | — | 8,128 | — | ||||||||||||||
| Total carrying value |
25,817 | 10,906 | 69,033 | — | 38,019 | 100,500 | ||||||||||||||
| Less: Current portion (representing the fair value of the 2008 Notes compound embedded derivative and warrants being accounted for as derivative liabilities) (1) |
— | — | — | — | (8,128 | ) | — | |||||||||||||
| Carrying value, noncurrent portion |
$ | 25,817 | $ | 10,906 | $ | 69,033 | $ | — | $ | 29,891 | $ | 100,500 | ||||||||
| (1) | Represents the 2008 Notes detachable warrants, compound embedded derivative and 2009 Notes compound embedded derivative. As a result of the amendment of the 2008 Notes, the Company has the intent and the ability to settle the warrants, 2008 conversion rights and “make-whole” provisions in shares of common stock as of December 31, 2009. As such, the asserted derivative liability was reclassed to a long-term liability and is included in the 2008 Notes carrying value on its consolidated financial statements at December 31, 2009. |
2007 Notes
In March and April 2007, the Company completed an offering of $120 million aggregate principal amount of 2007 Notes in a private placement. The 2007 Notes have been registered under the Securities Act of 1933, as amended, to permit registered resale of the 2007 Notes and of the common stock issuable upon conversion of the 2007 Notes. As more fully described below, $18.5 million and $30.5 million in face value of the 2007 Notes were exchanged in February 2008 and September 2009, respectively, for new debt pursuant to the Company’s issuance of its 2008 and 2009 Notes. As of December 31, 2009, the Company had $69 million in face value outstanding under the 2007 Notes.
The 2007 Notes bear interest at 5.5% per year, payable in cash semi-annually, and are convertible at the option of the holders at any time prior to maturity, redemption or repurchase into shares of the Company’s common stock at a conversion rate of 13.02 shares per $1,000 principal amount of 2007 Notes (subject to adjustment in certain circumstances), which represents a conversion price of $76.80 per share. The total common shares that would be issued assuming conversion of the entire $69 million in 2007 Notes is 0.9 million shares.
On or after April 5, 2012, the Company may, at its option, redeem the 2007 Notes, in whole or in part, for cash at a redemption price equal to 100% of the principal amount of the 2007 Notes to be redeemed plus any accrued and unpaid interest to the redemption date. On each of April 1, 2012, April 1, 2017 and April 1, 2022, holders may require the Company to purchase all or a portion of their 2007 Notes at a purchase price in cash equal to 100% of the principal amount of the 2007 Notes to be purchased plus any accrued and unpaid interest to the purchase date. Holders may also require the Company to repurchase all or a portion of their 2007 Notes upon a “fundamental change” at a repurchase price in cash equal to 100% of the principal amount of 2007 Notes to be repurchased plus any accrued and unpaid interest to the repurchase date. Pursuant to the terms of the 2007 Notes, a “fundamental change” is broadly defined as 1) a change in control, or 2) a termination of trading of the Company’s common stock.
119
Table of Contents
VERENIUM CORPORATION
NOTES TO CONSOLIDATED FINANCIAL STATEMENTS—(Continued)
In connection with the 2007 Notes offering, the Company paid $5.2 million in financing charges, which is reflected in other long-term assets on the accompanying Consolidated Balance Sheets, and is being amortized to interest expense over the initial five-year term of the 2007 Notes using the effective interest method.
2008 Notes
On February 27, 2008, the Company completed a private placement of the 2008 Notes and warrants to purchase shares of Verenium common stock. Concurrent with entering into the purchase agreement for the 2008 Notes, the Company also entered into senior notes exchange agreements with certain existing holders of the 2007 Notes pursuant to which such noteholders exchanged approximately $18.5 million in aggregate principal amount of the 2007 Notes for approximately $16.7 million in aggregate principal amount of the 2008 Notes and for warrants to purchase common stock. Including the 2008 Notes issued in exchange for the 2007 Notes, the Company issued $71.0 million in aggregate principal amount of the 2008 Notes and warrants to purchase approximately 0.7 million shares of common stock. As of December 31, 2009, the outstanding principal balance on the 2008 Notes was $15.2 million.
On July 1, 2009, the Company entered into amendment agreements with required holders (as defined below) of its 2008 Notes to modify certain terms of all of the 2008 Notes. The amendments became effective on July 6, 2009. Pursuant to their original terms, the 2008 Notes may be amended and restated with the written consent of the holders representing at least 66.67% of the 2008 Notes outstanding (the “Required Holders”). As of July 1, 2009, there was approximately $29.5 million aggregate principal amount of the 2008 Notes outstanding. The Company entered into the amendment agreements with holders of approximately $25.6 million, or 86.8%, of the 2008 Notes.
In connection with the amendment, the conversion price for the 2008 Notes was reduced from $25.56 to $20.88 and the anti-dilution protection included in the 2008 Notes was changed from full ratchet anti-dilution protection to, in most cases, a version of broad-based weighted average anti-dilution protection, subject to certain limitations. The 2008 Notes are subject to automatic conversion at the Company’s option if the Company’s closing stock price exceeds $41.76 (formerly $98.16 prior to the amendment) per share over a 30-trading day period ending prior to the date the Company provides notice of the automatic conversion to investors, the average daily trading volume of the Company’s stock over that 30-trading day period equals or exceeds $3 million, and certain other conditions are met. In connection with the amendment, the Company paid $1.5 million in advisory fees which is included in selling, general and administrative expense on the accompanying Consolidated Statement of Operations.
As disclosed in Note 8, one holder of 2008 Notes that currently no longer holds any principal amount is a party to a pending lawsuit against the Company, whereby that holder also seeks declaratory judgment that its 2008 Notes may not be amended by the Required Holders without that holder’s consent. This holder has not signed the amendment agreement as of March 12, 2010.
The 2008 Notes are secured by a first priority lien (subject to certain exceptions and permitted liens) on certain of the Company’s assets including, subject to certain limitations, present and future receivables, inventory, general intangibles, equipment, investment property, stock of subsidiaries, and certain other assets and proceeds relating thereto. The collateral securing 2008 Notes is subject to certain carve-outs, including without limitation, cash and cash equivalents and intellectual property.
Periodic interest payments on the 2008 Notes are approximately $0.3 million every three months, assuming an outstanding balance of $15.2 million, payable on January 1, April 1, July 1 and October 1, of each year.
120
Table of Contents
VERENIUM CORPORATION
NOTES TO CONSOLIDATED FINANCIAL STATEMENTS—(Continued)
Subject to the satisfaction of certain conditions, the Company may pay interest amounts with shares of common stock at a 5% discount to the applicable stock price at the time of the interest payment.
The 2008 Notes contain several embedded features, which are required to be bifurcated and accounted separately as derivative liabilities in accordance with authoritative guidance. These embedded features are described in two categories: 1) detachable warrants; and 2) a compound embedded derivative, as set forth below.
Detachable Warrants. In connection with the 2008 Notes, the Company issued warrants to purchase up to approximately 666,000 shares of the Company’s common stock. The warrants are exercisable at an initial exercise price of $53.28 per share. The exercise price and the number of shares of the Company’s common stock issuable upon exercise of the warrants are subject to weighted average anti-dilution protection. As a result of anti-dilution provisions triggered by the 2009 Notes exchange in September 2009 and public offering of common stock and warrants in October 2009, the warrants increased to purchase approximately 968,000 shares of the Company’s common stock at an exercise price of $36.62.
Compound embedded derivative. The compound embedded derivative includes certain features of the 2008 Notes, with its major components consisting of: 1) the base conversion rights, including a version of broad-based weighted average anti-dilution provisions, subject to certain limitations; 2) rights upon an event of default or change in control; and, 3) the “make-whole” provision.
Broad-based weighted average anti-dilution protection, subject to certain limitation. In the event that the Company subsequently issues options (excluding options issued under an approved stock plan by the Board of Directors) or convertible securities or other equity or equity-linked securities at a price-per-share which is below the current conversion price of the 2008 Notes, the holders of the 2008 Notes will be entitled to antidilution protection, such that the conversion price will re-set to a price-per share equal to the product of the conversion price in effect and the weighted average impact of the issuance. As a result of the public offering of common stock and warrants in October 2009, the conversion price of the 2008 Notes decreased to $17.89.
Rights upon an event of default or change in control. If the Company were to trigger an event of default, as defined, holders of the 2008 Notes may require the Company to redeem all or portion of the 2008 Notes at a premium to their face value. In the event of a change of control, as defined, the conversion rate may be subject to adjustment, or the holders may require the Company to redeem all or a portion of the 2008 Notes at a premium to their face value.
“Make-whole” provision. The 2008 Notes also include a “make-whole” provision whereby, upon any holder’s conversion of the 2008 Notes for common stock, the Company is obligated to pay such holder an amount equal to the interest foregone over the life of the 2008 Notes based on such conversion, discounted back to the date of conversion using the published yield on two-year U.S. Treasury notes as the discount rate. The 2008 Notes provide that the Company may, subject to the satisfaction of certain conditions, pay interest or “make-whole” amounts with shares of its common stock at a 5% discount to the applicable stock price at the time of the interest payment or conversion.
In addition, concurrent with the issuance of the 2008 Notes, the Company entered into a convertible hedge transaction with a counterparty, which is intended to reduce the potential dilution upon conversion of the 2008 Notes. The convertible hedge transaction is composed of two separate call options. Under the first call option, on April 1, 2012 (or earlier upon conversion of the 2008 Notes), the Company is entitled to purchase approximately 1.1 million shares of the Company’s common stock from the counterparty at a price per share equal to the initial conversion price of $49.08 (or a proportion of such number of shares based on the proportion of the 2008 Notes being converted). Under the second call option, on three exercise dates staggered in six month intervals beginning on October 1, 2013, the counterparty is entitled to purchase an aggregate of approximately 1.1 million
121
Table of Contents
VERENIUM CORPORATION
NOTES TO CONSOLIDATED FINANCIAL STATEMENTS—(Continued)
shares of the Company’s common stock at a price per share of $61.92. The cash cost of the convertible hedge transaction was approximately $6.2 million. The convertible hedge transaction has been separately valued and accounted for as a derivative under authoritative guidance.
Valuation of Debt Liability and Embedded Features of the 2008 Notes
2008 Notes Debt Liability and Equity Component
Prior to the adoption of recent authoritative guidance, the value assigned to the debt host was based on the residual value of the debt proceeds after allocating the fair value of the compound embedded derivative and detachable warrants. As a result of the adoption, as described under Note 1, the Company was required to separately account for the debt and equity components of the 2008 Notes in a manner that reflects the Company’s nonconvertible debt (unsecured debt) borrowing rate.
The recent authoritative guidance requires that the carrying amount of the liability component be estimated by measuring the fair value of a similar liability that does not have an associated conversion feature. As a result, the Company determined that its effective interest rate was 32.6% and, in the absence of comparable market data, determined that, given the features of the 2008 Notes, this derived effective interest rate was a fair approximation of a market rate of interest for a similar instrument. As a result, the 32.6% rate was applied to the 2008 Notes and coupon interest to calculate the fair value of the liability component. The difference between the cash proceeds associated with the convertible debt and the estimated fair value of the liability component is recorded as an equity component.
2008 Notes Detachable Warrants
At inception, as originally reported and as adjusted for the adoption of recent accounting guidance, the fair value of the detachable warrants of $4.7 million was separated from the debt liability and recorded as a derivative liability which resulted in a reduction of the initial notional carrying amount of the 2008 Notes, and as unamortized discount, which is being accreted over the term of the 2008 Notes using the effective interest method.
At inception, the derivative liability attributed to the warrants could require cash settlement within one year from the balance sheet date since the warrants became exercisable in August 2008. Based upon this, the Company reported the derivative liability related to the warrants as a current liability on its Consolidated Balance Sheet. As a result of the amendment of the 2008 Notes, the Company has the intent and the ability to settle the warrants in shares of common stock as of December 31, 2009. As such, the asserted derivative liability was reclassed to a long-term liability and is included in the 2008 Notes carrying value on its Consolidated Balance Sheet at December 31, 2009. The derivative liability is marked-to-market at the end of each reporting period, with any change in value reported as a non-operating expense or income in the Consolidated Statement of Operations. The fair value of the warrants was determined using the Black-Scholes Merton methodology.
2008 Notes Compound Embedded Derivative
At inception, as originally reported and as adjusted for the adoption of recent accounting guidance, the fair value of the compound embedded derivative of $31.1 million was separated from the debt liability and recorded as a derivative liability which resulted in a reduction of the initial notional carrying amount of the 2008 Notes, and as unamortized discount, which is being accreted over the term of the 2008 Notes using the effective interest method.
122
Table of Contents
VERENIUM CORPORATION
NOTES TO CONSOLIDATED FINANCIAL STATEMENTS—(Continued)
At inception, the derivative liability arising from the compound embedded derivative could require cash settlement within one year of any balance sheet date under certain conditions outside of the Company’s control, including, but not limited to, payments in connection with a conversion at the option of the noteholder. Furthermore, the amount of the “make-whole” payment upon conversion is not indexed to the Company’s stock, and therefore would not qualify as an equity instrument. Based upon this, the Company initially recorded a derivative liability related to the holders’ rights to a “make-whole” payment upon conversion, the portion of the embedded conversion rights that may be settled in cash due to the certain NASDAQ limits, and a derivative liability related to certain other rights. The Company recorded this compound embedded derivative liability as a component of the current portion of convertible debt on its Consolidated Balance Sheets. On June 4, 2008, in connection with shareholder approval of issuance of shares in excess of certain NASDAQ limits that required shareholder approval before shares in excess of such limits could be issued, $14.7 million of the compound embedded derivative value was reclassified into stockholders’ equity.
However, on January 1, 2009, upon adoption of new authoritative guidance, as described under Note 1, the entire conversion rights were required to be accounted for as a derivative liability. As a result, the fair value of the conversion rights on January 1, 2009 of $13.1 million was reclassified from stockholders’ equity into current liabilities. As a result of the amendment of the 2008 Notes, the Company has the intent and the ability to settle the warrants, 2008 conversion rights and “make-whole” provisions in shares of common stock as of December 31, 2009. As such, the asserted derivative liability was reclassed to a long-term liability and is included in the 2008 Notes carrying value on its Consolidated Balance Sheet at December 31, 2009. The compound embedded derivative liability, consisting of the “make-whole” and the conversion rights, will be marked-to-market at the end of each reporting period, with any change in value reported as a non-operating expense or income in the Consolidated Statement of Operations. The fair value of the compound embedded derivative was determined using a “lattice” valuation methodology.
The Company’s lattice valuation model assumes the noteholders’ exercise patterns will follow risk-neutral conversion behavior throughout the term of the instrument consistent with maximizing the expected present value of the 2008 Notes. Because the maximizing condition reflects the expected present value of the 2008 Notes as a whole and not the “make-whole” amount, the fair value of the compound embedded derivative does not reflect the maximum potential obligation due under the “make-whole” provision. As such, the potential “make-whole” obligation is $3.0 million if all of the outstanding 2008 Notes as of December 31, 2009 converted on that date.
Valuation of Convertible Hedge Transaction
The Company recorded a derivative asset of $6.2 million, representing the net cash paid by the Company to the counterparty of the two separate call options that comprise the convertible hedge transaction. The convertible hedge transaction does not qualify for equity classification under authoritative guidance, as there are potential circumstances, where cash settlement may be required. As such, the net fair value of the convertible hedge transaction has been reported as a noncurrent derivative asset on the Consolidated Balance Sheets and is marked-to-market at the end of each reporting period, with any change in value reported as a non- operating expense or income in the Consolidated Statement of Operations. The Company has determined that the initial cash paid for each of the two separate call options that comprise the convertible hedge transaction approximated fair value. The fair values of the two call options subsequent to the initial issuance date have been determined using the Black-Scholes Merton methodology and were determined to be zero as of December 31, 2009.
123
Table of Contents
VERENIUM CORPORATION
NOTES TO CONSOLIDATED FINANCIAL STATEMENTS—(Continued)
Impact of 2008 Notes Fair Value Remeasurements
The fair value of the compound embedded derivative, warrants, and the two separate call options that comprise the convertible hedge transaction are recorded as a derivative asset or liability and marked-to-market each balance sheet date. The change in fair value is recorded in the Consolidated Statement of Operations as non-operating expense or income. Upon conversion or exercise of a derivative instrument, the instrument will be marked to fair value at the conversion date and then that fair value will be reclassified to equity if settled in the Company’s common stock.
The fair value of the compound embedded derivative, detachable warrants and convertible hedge transaction are primarily affected by the Company’s stock price, but are also affected by the Company’s stock price volatility, expected life, interest rates and the passage of time as it relates to the “make-whole” amount. For the year ended December 31, 2009, the net change in fair value measurements impacting all 2008 Notes derivative assets and liabilities resulted in a gain of $5.5 million and $3.5 million for the year ended December 31, 2008.
Loss on Exchange of 2007 Notes
In connection with the issuance of the 2008 Notes, the Company exchanged $18.5 million in aggregate principal amount of the 2007 Notes for approximately $16.7 million in aggregate principal amount of the 2008 Notes and related warrants. Pursuant to authoritative guidance, an exchange of debt instruments with substantially different terms is a debt extinguishment and requires the recognition of a gain or loss on exchange. The Company determined that the exchange qualified as a debt extinguishment, and recorded a loss on the exchange of $3.6 million, equal to the difference between the carrying value of the 2007 Notes and the fair value of the 2008 Notes and warrants issued.
The fair value of the 2008 Notes issued in the exchange was determined using a “lattice” model, consistent with the methodology used to derive the fair value of the compound embedded derivative.
Gain on Amendment of 2008 Notes
As amended, the conversion price of the 2008 Notes was reduced from $25.56 to $20.88 and the anti-dilution protection included in the 2008 Notes was changed from full ratchet anti-dilution protection to, in most cases, a version of broad-based weighted average anti-dilution protection, subject to certain limitations. Pursuant to authoritative guidance, the Company determined that the amendment qualified as a liability extinguishment, and recorded a gain on the amendment of $4.0 million, equal to the difference between the fair value of the 2008 Notes compound embedded derivative before and after the amendment.
The fair value of the 2008 Notes compound embedded derivative was determined using a “lattice” model.
Conversion of 2008 Notes
Since inception through December 31, 2009, holders of the 2008 Notes have converted principal in the amount of $55.8 million into approximately 4.0 million shares of the Company’s common stock, including approximately 1.9 million shares to satisfy a portion of the related “make-whole” obligations.
During the year ended December 31, 2009, the Company recorded a gain on conversion of $8.9 million, calculated as the difference between the carrying value of the converted 2008 Notes and the fair value of the shares of common stock delivered to the noteholders upon conversion. The carrying value of the converted 2008 Notes for the year ended December 31, 2009 was equal to the $43.7 million of principal less the unamortized
124
Table of Contents
VERENIUM CORPORATION
NOTES TO CONSOLIDATED FINANCIAL STATEMENTS—(Continued)
debt discount and issuance costs, which totaled $32.7 million, as of the conversion date. During the year ended December 31, 2009, the Company issued a total of 3.7 million shares with a total market value as of the dates of conversion of $23.8 million to settle the 2008 Notes that were converted and related “make-whole” payments.
Between January 1, 2010 and March 12, 2010, holders of the 2008 Notes converted an additional principal amount of $2.2 million into approximately 0.2 million shares of the Company’s common stock, including approximately 0.1 million shares to satisfy the related “make-whole” obligations.
2009 Notes
On September 1, 2009 and September 25, 2009, the Company completed privately negotiated exchanges with certain existing holders of its 2007 Notes. Pursuant to the exchange agreements, certain existing holders of the 2007 Notes agreed to exchange $30.5 million in aggregate principal for the 2007 Notes, for $13.7 million in aggregate principal amount of the 2009 Notes.
The 2009 Notes are secured by a first priority lien (subject to certain exceptions and permitted liens) on certain of the Company’s assets including, subject to certain limitations, present and future receivables, inventory, general intangibles, equipment, investment property, stock of subsidiaries, and certain other assets and proceeds relating thereto. The collateral securing 2009 Notes is subject to certain carve-outs, including without limitation, cash and cash equivalents and intellectual property.
The 2009 Notes bear interest at 9% per year, payable in cash, or at the option of the Company, in shares of common stock or a combination thereof, semi-annually, and are convertible at the option of the holders any time prior to maturity, redemption or repurchase into shares of the Company’s common stock at a conversion rate of 104.17 shares per $1,000 principal amount of 2009 Notes (subject to adjustment in certain circumstances), which represents a conversion price of $9.60 per share, provided that upon conversion the holders make certain certifications. A holder that surrenders 2009 Notes for conversion in connection with a “make- whole fundamental change” that occurs before April 5, 2012 may in certain circumstances be entitled to an increased conversion rate. In no event will the conversion price of the 2009 Notes be less than $7.32 per share. The total common shares that would be issued assuming conversion of the entire $13.7 million in 2009 Notes is 1.4 million shares, excluding common shares to be issued for potential “make-whole” payments.
If the Company’s closing stock price exceeds $19.20 (which represents 200% of the conversion price in effect) per share for at least 20-trading days over a 30-trading day period, the Company may, at its option, elect to terminate the right of the holders to convert their 2009 Notes.
On or after April 5, 2012, the Company may, at its option, redeem the 2009 Notes, in whole or in part, for cash at a redemption price equal to 100% of the principal amount of the 2009 Notes to be redeemed plus any accrued and unpaid interest to the redemption date. On each of April 1, 2012, April 1, 2017 and April 1, 2022, holders may require the Company to purchase all or a portion of their 2009 Notes at a purchase price in cash equal to 100% of the principal amount of the 2009 Notes to be purchased plus any accrued and unpaid interest to the purchase date. Holders may also require the Company to repurchase all or a portion of their 2009 Notes upon a “fundamental change” at a repurchase price in cash equal to 100% of the principal amount of 2009 Notes to be repurchased plus any accrued and unpaid interest to the repurchase date. Pursuant to the terms of the 2009 Notes, a “fundamental change” is broadly defined as 1) a change in control, or 2) a termination of trading of the Company’s common stock.
125
Table of Contents
VERENIUM CORPORATION
NOTES TO CONSOLIDATED FINANCIAL STATEMENTS—(Continued)
Periodic interest payments on the 2009 Notes are approximately $0.6 million every six months, assuming an outstanding balance of $13.7 million, payable on April 1 and October 1, of each year, with the first payment due April 1, 2010. Subject to the satisfaction of certain conditions, the Company may pay interest with shares of common stock at a 5% discount to the applicable stock price at the time of the interest payment.
The 2009 Notes also include a “make-whole” provision whereby, upon any holder’s conversion of the 2009 Notes for common stock, the Company is obligated to pay such holder an amount equal to the remaining scheduled interest payments attributable to such 2009 Notes from the applicable last interest payment date through April 5, 2012, discounted back to the date of conversion using the published yield on two-year U.S. Treasury notes as the discount rate. The 2009 Notes provide that the Company may, subject to the satisfaction of certain conditions, pay “make-whole” amounts with shares of its common stock valued at the greater of (i) the conversion price then in effect or (ii) the 10 day volume weighted average price for the 10-days immediately preceding the conversion notice.
In connection with the 2009 Notes offering, the Company paid $0.6 million in financing charges, which was expensed to selling, general and administrative on the accompanying Consolidated Statement of Operations.
Valuation of Compound Embedded Derivative of the 2009 Notes
The compound embedded derivative includes the “make-whole” provision and the put features of the 2009 Notes. The “make-whole” payment upon conversion is not indexed to the Company’s stock, and therefore would not qualify as an equity instrument. The put features of the 2009 Notes allow for the holders to require the Company to purchase the Notes at 100% principal on each April 1, 2012, 2017, and 2022 or upon a fundamental change. The put features are contingently exercisable and the 2009 Notes were issued at a discount, as such, the authoritative guidance requires the put features to be bifurcated and accounted for as a derivative liability. Based upon this, the Company recorded a derivative liability of $2.0 million equal to the fair value of the “make-whole” provision and put features. The compound embedded derivative liability was separated from the debt liability and recorded as a derivative liability which resulted in a reduction of the initial notional carrying amount of the 2009 Notes, and as unamortized discount, which is being accreted through April 1, 2012, the first date the holders can require the Company to purchase the 2009 Notes using the effective interest method. The Company recorded this derivative liability as a component of the 2009 Notes carrying value on its Consolidated Balance Sheet. The compound embedded derivative liability will be marked-to-market at the end of each reporting period, with any change in value reported as a non-operating expense or income in the Consolidated Statement of Operations. The fair value of the compound embedded derivative was determined using a “lattice” valuation methodology.
The Company’s lattice valuation model assumes the noteholders’ exercise patterns will follow risk-neutral conversion behavior throughout the term of the instrument consistent with maximizing the expected present value of the 2009 Notes. Because the maximizing condition reflects the expected present value of the 2009 Notes as a whole and not the “make-whole” amount, the fair value of the “make-whole” derivative does not reflect the maximum potential obligation due under the “make-whole” provision. As such, the potential “make-whole” obligation would have been $3.0 million if all of the outstanding 2009 Notes as of December 31, 2009 had converted on that date.
Impact of 2009 Notes Fair Value Remeasurements
The fair value of the compound embedded derivative is marked-to-market each balance sheet date. The change in fair value is recorded in the Consolidated Statement of Operations as non-operating expense or income. Upon conversion or exercise of a derivative instrument, the instrument will be marked to fair value at the conversion date and then that fair value will be reclassified to equity if settled in the Company’s common stock.
126
Table of Contents
VERENIUM CORPORATION
NOTES TO CONSOLIDATED FINANCIAL STATEMENTS—(Continued)
The fair value of the compound embedded derivative is primarily affected by the Company’s stock price, but is also affected by the Company’s stock price volatility, expected life, interest rates and the passage of time as it relates to the “make-whole” amount. For the year ended December 31, 2009, the net change in fair value measurements impacting the 2009 Notes compound embedded derivative liability resulted in a loss of $0.3 million.
Exchange of 2007 Notes
In connection with the issuance of the 2009 Notes, the Company exchanged $30.5 million in aggregate principal amount of the 2007 Notes for approximately $13.7 million in aggregate principal amount of the 2009 Notes. Pursuant to authoritative guidance, it was determined that the noteholders of the 2007 Notes exchanged granted a concession to the Company primarily as a result of the reduction in principal of 2009 Notes issued as part of the exchange. As a result, the Company, in accordance with authoritative guidance, accounted for the exchange as a troubled debt restructuring and recorded the 2009 Notes at the 2007 Notes carrying value. This resulted in a debt premium of $16.1 million, of which $12.0 million will be amortized through the April 1, 2027 maturity of the 2009 Notes, as an offset to interest expense, and $4.1 million was recorded as additional paid in capital. The carrying value of the 2007 Notes was equal to the $30.5 million of principal less the unamortized issuance costs, which totaled $29.8 million, as of the exchange date.
Interest Expense on Convertible Debt
The Company recorded interest expense related to convertible debt, as follows for the years ended December 31, 2009, 2008 and 2007 (in thousands):
| 2009 | 2008 | 2007 | ||||||||
| 5.5% coupon interest, payable in cash |
$ | 4,902 | $ | 5,734 | $ | 5,004 | ||||
| Non-cash amortization of debt issuance costs |
831 | 938 | 808 | |||||||
| 2007 Notes Total |
5,733 | 6,672 | 5,812 | |||||||
| 8% coupon interest, payable in cash or common stock |
2,573 | 4,340 | — | |||||||
| Non-cash accretion of debt discount(1) |
3,067 | 4,009 | — | |||||||
| Non-cash amortization of debt issuance costs |
247 | 449 | — | |||||||
| 2008 Notes Total |
5,887 | 8,798 | — | |||||||
| 9% coupon interest, payable in cash or common stock |
411 | — | — | |||||||
| Non-cash amortization of debt premium(2) |
(136 | ) | — | — | ||||||
| 2009 Notes Total |
275 | — | — | |||||||
| (1) | The initial debt discount relates to the 2008 Notes compound embedded derivative, detachable warrants, and the equity component related to the conversion rights not included in the compound embedded derivative at issuance. The unamortized value of the debt discount is included in the carrying value of the 2008 Notes on the accompanying Consolidated Balance Sheets and is being amortized into interest expense over the term of the 2008 Notes, or approximately four years. |
| (2) | The initial debt premium relates to the 2009 Notes being recorded at 2007 Notes carrying value in accordance with authoritative guidance partially offset by the debt discount recorded for the compound embedded derivative. The unamortized value of the debt premium is included in the carrying value of the 2009 Notes on the accompanying Consolidated Balance Sheets and is being amortized into interest expense through maturity of the 2009 Notes, April 1, 2027. |
127
Table of Contents
VERENIUM CORPORATION
NOTES TO CONSOLIDATED FINANCIAL STATEMENTS—(Continued)
3. Goodwill
During 2008, the Company determined that the market value of common stock and convertible debt was not adequate to support the carrying value of goodwill resulting from the June 2007 merger between Diversa and Celunol. As a result, pursuant to authoritative accounting guidance the Company recorded a non-cash charge of $106.1 million in September 2008, representing full impairment of the carrying value of previously recorded goodwill.
4. Balance Sheet Details
Accounts Receivable
Accounts receivable consist of the following (in thousands):
| December 31, | ||||||
| 2009 | 2008 | |||||
| Trade, net of allowance for doubtful accounts |
$ | 5,714 | $ | 6,969 | ||
| Grants |
986 | 590 | ||||
| Collaborators |
509 | 492 | ||||
| $ | 7,209 | $ | 8,051 | |||
Inventories
Inventories are recorded at standard cost on a first-in, first-out (FIFO) basis. Inventories consist of the following (in thousands):
| December 31, | ||||||||
| 2009 | 2008 | |||||||
| Inventories: |
||||||||
| Raw materials |
$ | 438 | $ | 607 | ||||
| Work in process |
319 | 241 | ||||||
| Finished goods |
2,096 | 1,824 | ||||||
| 2,853 | 2,672 | |||||||
| Reserve |
(200 | ) | (240 | ) | ||||
| $ | 2,653 | $ | 2,432 | |||||
The Company reviews inventory periodically and reduces the carrying value of items considered to be slow moving or obsolete to their estimated net realizable value. The Company considers several factors in estimating the net realizable value, including shelf life of raw materials, demand for its enzyme products and historical write-offs.
Property and equipment
Property and equipment is stated at cost and depreciated over the estimated useful lives of the assets (generally three to ten years) using the straight-line method.
128
Table of Contents
VERENIUM CORPORATION
NOTES TO CONSOLIDATED FINANCIAL STATEMENTS—(Continued)
Property, plant and equipment consists of the following (in thousands):
| December 31, | ||||||||
| 2009 | 2008 | |||||||
| Laboratory, machinery and equipment |
$ | 44,029 | $ | 50,477 | ||||
| Computer equipment |
9,451 | 12,838 | ||||||
| Furniture and fixtures |
5,607 | 6,325 | ||||||
| Leasehold improvements |
5,672 | 9,194 | ||||||
| Land |
1,560 | 1,560 | ||||||
| Pilot facility |
18,725 | 18,904 | ||||||
| Demonstration facility |
95,521 | 90,996 | ||||||
| Property, plant and equipment, gross |
180,565 | 190,294 | ||||||
| Less: Accumulated depreciation and amortization |
(72,166 | ) | (73,023 | ) | ||||
| Property, plant and equipment, net |
$ | 108,399 | $ | 117,271 | ||||
Included in the costs of its demonstration facility as of December 31, 2009 and December 31, 2008 is $7.8 million and $6.9 million in capitalized interest, which was determined by applying the Company’s effective interest rate to the average amount of accumulated expenditures for its demonstration facility. The demonstration facility was placed in service in February 2009, and as such, the Company ceased capitalizing interest on that date.
Depreciation of property, plant and equipment is provided on the straight-line method over estimated useful lives as follows:
| Laboratory equipment |
3-5 years | |
| Computer equipment |
3 years | |
| Furniture and fixtures |
5 years | |
| Machinery and equipment |
3-5 years | |
| Office equipment |
3 years | |
| Software |
3 years | |
| Pilot facility |
10 years | |
| Demonstration facility |
10 years |
Leasehold improvements are depreciated using the shorter of the estimated useful life or remaining lease term.
Depreciation related to the pilot and demonstration facilities begins in the period that such assets are placed in service. The pilot facility was placed in service in January 2007, and the demonstration facility was placed in service in February 2009. Subsequent modifications to the pilot and demonstration facilities which do not extend its useful life but meet the criteria for capitalization are considered immediately placed in service when incurred, and depreciated over the remainder of the facility’s useful life. During the year ended December 31, 2009, the demonstration facility is being depreciated using an estimated 10-year life. The Company is in the process of performing an evaluation to determine the final useful lives for the demonstration-scale facility and each of its components.
129
Table of Contents
VERENIUM CORPORATION
NOTES TO CONSOLIDATED FINANCIAL STATEMENTS—(Continued)
Accrued Liabilities
Accrued expenses consists of the following (in thousands):
| December 31, | ||||||
| 2009 | 2008 | |||||
| Employee compensation |
$ | 2,850 | $ | 6,050 | ||
| Professional and outside services |
2,520 | 2,608 | ||||
| Accrued taxes |
2,474 | 2,851 | ||||
| Accrued interest on convertible notes |
1,671 | 1,382 | ||||
| Royalties |
1,499 | 1,233 | ||||
| Restructuring reserve, current portion |
992 | 917 | ||||
| Other |
248 | 1,089 | ||||
| $ | 12,254 | $ | 16,130 | |||
| 5. | Significant Agreements |
The Company has a number of strategic alliances and relationships, the more significant of which include the following:
BP Biofuels North America LLC
The Company has a strategic partnership with BP, a related party, which through December 31, 2009 has provided approximately $102.5 million in funding. BP is committed to additional funding of $15 million through the second quarter 2010, subject to the Company’s performance under its existing joint ventures, Galaxy Biofuels LLC and Vercipia Biofuels. The Company has determined that these joint ventures are subject to consolidation by the Company, in accordance with current authoritative guidance.
Galaxy Biofuels LLC
Effective August 1, 2008, the Company entered into a Joint Development and License Agreement (“JDA”) with BP focused on the development and commercialization of cellulosic ethanol technologies. As part of the transaction, Galaxy Biofuels LLC, a special purpose entity, was formed, equally owned by the Company and BP. Pursuant to the JDA, the Company granted to Galaxy a worldwide, royalty-free license and sublicense to the Company’s existing background technology related to the production of cellulosic ethanol, which will continue to be owned by the Company. Galaxy owns new intellectual property relating to cellulosic ethanol production developed through the joint development program under the JDA and is responsible for administering the licensing of the technology package resulting from the joint development program. Future profits and losses related to the licensing of these technologies will be shared equally by the Company and BP.
The financial terms of the JDA include a transaction fee of $45 million paid to the Company by BP on behalf of Galaxy, in exchange for broad access to the Company’s cellulosic ethanol technology platform, production facilities, and employee scientific knowledge and expertise. The transaction fee has been paid in full and in accordance with the terms of the JDA as follows: $24.5 million was paid within ten days of the closing; $6.5 million was paid on January 2, 2009; and $14.0 million was paid on July 1, 2009.
The Company and BP are conducting joint development efforts within the cellulosic ethanol field under the JDA, the initial term of which is 18 months. Pursuant to the JDA, BP committed to pay the Company $45 million in non refundable joint development fees to co-fund the Company’s various scientific and technical initiatives
130
Table of Contents
VERENIUM CORPORATION
NOTES TO CONSOLIDATED FINANCIAL STATEMENTS—(Continued)
within the field. The joint development fees represent approximately 50% of the estimated costs of these initiatives through January 2010, and are payable as follows: $15 million was paid on January 2, 2009, and $2.5 million per month is payable from February 2009 through and including January 2010. The Company is responsible for the performance of substantially all of the activities under the joint development program. If the Company is not successful in achieving the objectives of the joint development program, BP may terminate the joint development program, and the Company would no longer be entitled to receive any payments from BP for the performance of the joint development program.
The transaction fees and joint development fees are accounted for as follows:
| • | The license to technology granted by the Company and ongoing joint development performed by the Company are accounted for as capital contributions to Galaxy; |
| • | Transaction fees and joint development fees paid by BP are accounted for as capital contributions to Galaxy. All transaction fees are subsequently distributed to the Company and treated as a reduction to the Company’s capital account; |
| • | Ongoing joint development fees are accounted for as a monthly expense of Galaxy. |
As a result, the Company’s Consolidated Balance Sheets include a line item called “Noncontrolling interests in consolidated entities,” which reflects BP’s ownership of Galaxy’s equity. This line item is adjusted by BP’s 50% share of Galaxy’s profits and losses, and increased by cash distributions made by BP to the Company on behalf of Galaxy. BP’s share of Galaxy’s losses is reflected in the Consolidated Statement of Operations as “Loss attributed to noncontrolling interests in consolidated entities.” Since inception, Galaxy has incurred approximately $85 million in losses through December 31, 2009, 50% of which have been allocated to BP.
On February 1, 2010, the Company announced the extension of its initial 18-month joint development program established in August 2008 with partner BP, which was scheduled to expire on February 1, 2010, until March 1, 2010. The Company received an additional $2.5 million from BP to co-fund various scientific and technical initiatives for the month of February 2010. Further, on March 1, 2010, the Company announced a second one-month extension through April 1, 2010, for which an additional $2.5 million will be paid.
Vercipia Biofuels
On February 18, 2009, the Company announced the second phase of its strategic partnership with BP through the formation of a joint venture to focus on the commercial development of facilities for the production of cellulosic ethanol from non-food feedstocks. The joint venture company, Vercipia is owned equally by the Company and BP. Vercipia will act as the commercial entity for the deployment of cellulosic ethanol technology being developed and proven under the Galaxy joint development program. Vercipia will be led and supported by a team comprised of employees from both BP and the Company and will be governed with equal representation from both parent companies. This collaboration is intended to develop one of the nation’s first commercial-scale cellulosic ethanol facilities, located in Highlands County, Florida and to create future opportunities for commercial implementation of cellulosic ethanol technologies.
The Company originally formed the Vercipia entity in October 2007 as a wholly-owned subsidiary of Verenium Corporation. The entity was fully consolidated by the Company as a subsidiary for the years ended December 31, 2007 and 2008. BP’s consideration was used to acquire a 50% ownership interest in the existing entity. The Company has determined the joint venture is a variable interest entity, and that the Company is the primary beneficiary which requires consolidation of the entity.
131
Table of Contents
VERENIUM CORPORATION
NOTES TO CONSOLIDATED FINANCIAL STATEMENTS—(Continued)
In return for its 50% interest in Vercipia, BP agreed to pay Vercipia $22.5 million in an initial cash commitment and the Company agreed to contribute development assets related to its Highlands County, Florida development project and another commercial project site in early stages of development in the Gulf Coast region. BP’s contribution is payable in four installments: $7.0 million was paid on April 1, 2009, $5.0 was paid on July 1, 2009, $3.0 million was paid on October 1, 2009, and $7.5 million was deferred until the second quarter of 2010. As of December 31, 2009, $7.2 million of the Company’s consolidated cash and cash equivalents is limited for use in Vercipia operations.
Vercipia will initially focus on developing and securing financing for a commercial-scale cellulosic ethanol facility in Highlands County, Florida and expects to break ground on that site as early as 2010. The estimated construction cost for this facility, which is expected to produce 36 million gallons-per-year, is estimated to be approximately $300 million. Production from this plant is expected to begin as early as 2012.
All intercompany amounts have been properly eliminated upon consolidation, and the noncontrolling interest is presented in accordance with authoritative guidance, on the Company’s Consolidated Balance Sheet and Statement of Operations.
Research and Development Collaborations
Bunge Oils, Inc.
In February 2006, the Company entered into an agreement with Bunge Oils, Inc. (“Bunge”), a part of Bunge North America, to discover and develop novel enzymes optimized for the production of edible oil products with enhanced nutritional or health benefits. Under the terms of the agreement, the Company is responsible for discovering, optimizing, and manufacturing enzymes, and Bunge is responsible for commercializing oils using new enzyme-enabled processes. Under the terms of the agreement, the Company received an upfront technology access fee, is receiving research funding for its enzyme discovery and development activities under the project, and is also eligible to receive milestone payments for successful enzyme development activities as well as royalties on any products that are commercialized.
In November 2007, the Company entered into an agreement with Bunge to promote the commercialization of Purifine and the product development and commercialization of next-generation enzyme products for seed oil processing. Pursuant to the agreement, Bunge will supply process scale-up expertise for the development of the Purifine degumming process at plant scale. In addition, Bunge will contribute to the funding of R&D projects to develop next generation enzyme products for seed oil processing. Bunge and the Company will also share profits on sales of Purifine enzyme.
Collaborative revenue recognized under the Bunge agreements was $3.3 million, $2.1 million and $3.6 million for the years ended December 31, 2009, 2008 and 2007. Total Purifine product revenue was $0.4 million, $0.9 million, and $0.2 million for the years ended December 31, 2009, 2008 and 2007.
Syngenta
The Company had ongoing research collaboration with Syngenta since 1999, which previously owned more than 10% of the Company’s common stock. On October 28, 2009, the Company entered into an agreement with Syngenta in connection with the completion of previously defined programs under their joint research collaboration. Pursuant to the agreement, the Company gained additional exclusive rights to an array of proprietary biomolecules expressed microbially, as well as non-exclusive rights to the same biomolecules expressed through other non-plant means. As a result of this transaction, the Company will receive license fees,
132
Table of Contents
VERENIUM CORPORATION
NOTES TO CONSOLIDATED FINANCIAL STATEMENTS—(Continued)
including royalties, for a commercial enzyme candidate that Syngenta formerly licensed to a third party. In addition, the Company obtained broad rights to several late-stage enzyme development candidates. As of the separation date, the Company had approximately $1.4 million outstanding in deferred revenue related to Syngenta consisting of $0.9 million in research overfunding under the previous agreement and $0.5 million pertaining to the remaining balance for an exclusivity fee. The research overfunding was recognized as a gain on contract settlement for the year ended December 31, 2009 since the earning process was not completed as proscribed under authoritative accounting guidance. The remaining exclusivity fee balance was recognized into revenue for the year ended December 31, 2009, as the separation agreement did not require any additional services to be provided by the Company and Syngenta maintained all rights outlined in the exclusivity agreement. As of December 31, 2009, Syngenta no longer is a related party of the Company.
Total collaborative revenue recognized under the Syngenta agreements was $0.7 million, $8.7 million, and $9.3 million for the years ended December 31, 2009, 2008, and 2007. Total Quantum phytase (the first product the Company commercialized with Syngenta) product revenue was $0, $0.7 million, and $3.4 million for the year ended December 31, 2009, 2008 and 2007. Deferred revenue associated with Syngenta was $1.4 million at December 31, 2008.
Cargill Health and Food Technologies
In 2005, the Company signed a collaboration agreement with Cargill Health and Food Technologies to discover and develop novel enzymes for the cost-effective production of a proprietary Cargill product involving multiple enzyme steps. In 2006, this collaboration agreement was expanded to include additional enzymes beyond the initial targeted set. In 2007, this agreement was further extended through May 2008. Under the terms of the agreement, the Company received upfront payments and research funding, and is entitled to receive milestone payments, license fees, and royalties on products that may be developed under the agreement. In May 2008, Cargill exercised an early option to license one of the enzymes under the agreement.
Revenue recognized under the Cargill collaboration was $20,000, $0.8 million and $0.9 million for the years ended December 31, 2009, 2008 and 2007.
BASF
In December 2005, the Company entered into a master collaboration agreement with BASF under which the Company is responsible for the discovery and optimization of new enzymes, and BASF is responsible for process and product development and commercialization. Under the agreement, the Company has received technology access fees and research support payments, and is entitled to receive milestone payments and royalties based on sales of products resulting from the collaboration. During the fourth quarter 2008, the Company received a milestone from BASF under the agreement. Revenue recognized under the BASF agreement was $0.5 million $1.6 million and $2.6 million for the years ended December 31, 2009, 2008 and 2007.
Government Grants and Contracts
The Company has received grants and contracts from a number of government agencies, including the U.S. Department of Defense, the U.S. Department of Energy, and the National Institutes of Health. Revenue related to government grants and contracts was $16.8 million, $6.9 million, and $2.7 million for the years ended December 31, 2009, 2008, and 2007. As of December 31, 2009, the Company had approximately $12.7 million in funding committed from various government agencies through 2012.
133
Table of Contents
VERENIUM CORPORATION
NOTES TO CONSOLIDATED FINANCIAL STATEMENTS—(Continued)
Verenium Grants
In September 2008, the Department of Energy (“DOE”) awarded the Company a $10 million grant for the commencement of the commissioning of the demonstration-scale facility in Jennings, Louisiana. Upon completion of plant commissioning, the Company proceeded to optimize and validate its first generation technology process performance milestones in two phases. Phase 1 will encompass validation of discreet unit operation performance on sugar cane bagasse feedstocks. Phase 2 will demonstrate sustained integrated operational performance with sugar cane bagasse, and energy cane. The Company utilized the entire grant during 2009 and recognized $10 million in grant revenue.
During 2008, the DOE announced the recipients of an $8.5 million federal grant to further develop commercially viable renewable fuels. The Company was announced as one of four recipients of the grant. The Company’s grant relates to the commercialization of customized cellulase solutions for biomass saccharification. This project will leverage the Company’s advanced enzyme development capabilities to commercialize a cellulase enzyme system to produce a more cost-effective enzyme solution for biomass saccharification processes that will also tolerate conditions that enable more efficient process economics in producing ethanol from cellulosics. During 2009 and 2008, the Company recognized $3.2 million and $3.0 million in revenue relating to this grant.
During 2007, the Company was selected as one of five recipients of a DOE project focused on developing highly efficient fermentative organisms to convert biomass material to ethanol. With the $5.4 million grant, the Company continues to advance the ethanologen platform licensed from the University of Florida. Further development of the fermentation organisms is focused on optimizing the ability to ferment sugars produced from a wide variety of feedstocks and to increase robustness in a commercial-scale fermentation process, while simultaneously reducing costs and increasing product yields. During 2009 and 2008, the Company recognized $1.4 million in revenue relating to this grant. As work did not start on this grant until 2008, the Company did not recognize any revenue during 2007.
Vercipia Grants
In conjunction with the planned commercial facility as part of the Vercipia joint venture, a $2.5 million grant was awarded to Vercipia in June 2009 for the successful development of the planned facility, including all required permits, to complete the conceptual design of the facility, and the detailed design and engineering of the facility. The grant was awarded by the State of Florida. During the year ended December 31, 2009, $0.3 million was recognized as revenue for this grant.
In January 2009, Vercipia was awarded $7.5 million from the State of Florida for further commercialization of the first commercial scale cellulosic energy in the state. The award will also be used for the design and layout for the facility, as well as harvesting activities. Total revenue of $0.8 million was recognized during the year ended December 31, 2009. The grant is expected to continue through February 2011.
Manufacturing, Supply and Distribution Agreements
Danisco Animal Nutrition
In May 1996, the Company entered into a collaboration agreement with Danisco Animal Nutrition (formerly Finnfeeds International Ltd) to jointly identify and develop a novel phytase enzyme that, when used as an additive in animal feed applications, allows higher utilization of phytic acid phosphates from the feed, thereby increasing its nutritional value. The addition of phytase to animal feed reduces the need for inorganic phosphorus supplementation and lowers the level of harmful phosphates that are introduced in the environment through
134
Table of Contents
VERENIUM CORPORATION
NOTES TO CONSOLIDATED FINANCIAL STATEMENTS—(Continued)
animal waste, resulting in inorganic phosphate cost savings and a significant reduction in environmental pollution. Following the completion of the initial objectives of the agreement with Danisco, in December 1998 the Company entered into a license agreement with Danisco to commercialize an enzyme developed under the collaboration agreement. Under the terms of the license agreement, the Company granted Danisco an exclusive license to manufacture, use, and sell the developed enzyme. In consideration for the license, the Company is paid a royalty equal to 50% of operating profit generated by Danisco on such sales. The Company also has a manufacturing agreement with Danisco to supply commercial quantities of Phyzyme XP at the Company’s cost to manufacture such quantities. In March 2003, the FDA approved Phyzyme XP Animal Feed Enzyme, which the Company developed in collaboration with Danisco. In September 2006, the EU Commission granted permanent authorization for the use of Phyzyme XP in broiler poultry feed in Europe.
During 2008, due to capacity constraints at Fermic, the Company was not able to supply adequate quantities of Phyzyme necessary to meet increased demand from Danisco. As a result, the Company contracted with Genencor, a subsidiary of Danisco, to serve as a second-source manufacturer for Phyzyme. Pursuant with authoritative accounting guidance, revenue from Phyzyme that is supplied to the Company by Genencor is recognized in an amount equal to the royalty on operating profit received from Danisco, as compared to the full value of the manufacturing costs plus royalty on operating profit the Company recognizes for Phyzyme it manufactures at Fermic. This is due to the fact that Genencor bears inventory risk before the product is ordered by Danisco. While this revenue recognition treatment should have little or no negative impact on the gross margin recognized for every sale of Phyzyme, it would have a negative impact on the gross product revenue recognized for Phyzyme as the volume of Phyzyme manufactured by Genencor increases.
Revenue recognized from transactions with Danisco was $32.8 million, or 50% of total revenue, $37.0 million, or 53% of total revenue, and $16.2 million, or 35% of total revenue, for the years ended December 31, 2009, 2008, and 2007.
| 6. | Bank and Commercial Debt |
On September 30, 2005, the Company entered into a $14.6 million Loan and Security Agreement (the “Bank Agreement”) with a commercial bank (the “Bank”). The Bank Agreement provides for a one-year credit facility for up to $10.0 million in financing for qualified equipment purchases in the United States and Mexico (the “Equipment Advances”) and a $4.6 million letter of credit sub-facility (the “Letter of Credit Sublimit”). The Bank Agreement was amended in October 2006 to increase the Letter of Credit Sublimit to $4.7 million. Borrowings under the Equipment Advances are structured as promissory notes which are secured by qualified equipment purchases and repaid over 36 to 48 months, depending on the location of the equipment financed.
On February 22, 2008, the Company executed an amendment to the Bank Agreement. Pursuant to the amendment, in exchange for the Bank’s consent to the private placement of the 2008 Notes and the related warrants, the Company agreed to expand the scope of the security interest under the Bank Agreement to include substantially all of its assets excluding intellectual property. In return, the Bank modified the minimum cash covenant to reduce the required minimum liquidity from $25 million to an amount equal to 150% of the total amount of the Company’s obligations to the Bank under the Bank Agreement.
The Bank Agreement also provides for an event of default upon the occurrence of a material adverse effect on i) the business operations, condition (financial or otherwise) or prospects of the Company, ii) the ability of the Company to repay its obligations due to the Bank or otherwise perform its obligations under the Bank Agreement, or iii) the Company’s interest in, or the value of, perfection or priority of the Bank’s security interest in the collateral. In the event of non compliance or a material adverse effect, the Company would be required to cash-secure its existing obligations under the Bank Agreement.
135
Table of Contents
VERENIUM CORPORATION
NOTES TO CONSOLIDATED FINANCIAL STATEMENTS—(Continued)
All loan amounts were paid in full and are no longer available to borrow as of December 31, 2009, although a letter of credit for approximately $10.4 million remains which is secured by cash, as required under the Company’s facilities leases (see Note 8). As of December 31, 2009 the Company was in compliance with all debt covenants.
| 7. | Related Party Transactions |
The Company has a strategic partnership with BP including two joint ventures as previously defined. (see Note 5).
The Company had ongoing research collaborations with Syngenta since 1999, which previously owned more than 10% of the Company’s common stock. On October 28, 2009, the Company entered into an agreement with Syngenta in connection with the completion of previously defined programs under their joint research collaboration (see Note 5). As of December 31, 2009, Syngenta no longer is a related party of the Company as it is no longer a significant shareholder.
| 8. | Commitments and Contingencies |
Leases
At December 31, 2009, the Company’s minimum commitments under non-cancelable operating leases were as follows (in thousands):
| Gross Rental Payments |
Sublease Income |
Net Rental Payments | ||||||||
| Year ending December 31: |
||||||||||
| Verenium: |
||||||||||
| 2010 |
$ | 6,084 | $ | (987 | ) | $ | 5,097 | |||
| 2011 |
6,356 | (1,023 | ) | 5,333 | ||||||
| 2012 |
6,537 | (1,060 | ) | 5,477 | ||||||
| 2013 |
6,762 | (1,097 | ) | 5,665 | ||||||
| 2014 |
6,062 | (1,134 | ) | 4,928 | ||||||
| Thereafter |
9,252 | (190 | ) | 9,062 | ||||||
| Vercipia: |
||||||||||
| 2010 |
1,312 | — | 1,312 | |||||||
| 2011 |
2,573 | — | 2,573 | |||||||
| 2012 |
2,769 | — | 2,769 | |||||||
| 2013 |
3,043 | — | 3,043 | |||||||
| 2014 |
3,325 | — | 3,325 | |||||||
| Thereafter |
141,512 | — | 141,512 | |||||||
| Total minimum lease payments |
$ | 195,587 | $ | (5,491 | ) | $ | 190,096 | |||
Verenium
The Company’s executive offices are currently located in a 21,000 square foot office in Cambridge, Massachusetts leased through December 2013. The Company’s research and development facilities are currently located in adjacent 75,000 and 61,000 square foot buildings in San Diego, California. The facilities are leased
136
Table of Contents
VERENIUM CORPORATION
NOTES TO CONSOLIDATED FINANCIAL STATEMENTS—(Continued)
through November 2015 and March 2017, respectively. In October 2007 the Company entered into a sublease agreement with a subtenant to occupy approximately 52,000 square feet of its 61,000 square-foot facility commencing March 1, 2008. The sublease agreement expires in February 2015.
Vercipia
As part of the planned commercial facility in Highlands County, Florida, Vercipia entered into an agreement which includes a facility site option and two farm leases. The first farm lease agreement was entered into on June 6, 2008 for a thirteen month term for 16,200 net plantable acres. An extension was exercised during 2009 which extended the initial lease term through September 30, 2010. Upon termination of the first least term, a secondary lease term will commence and will run through September 30, 2031. The secondary lease term may be cancelled at any time by written notice, although an amount equal to the amount that would have been paid in rent over the subsequent three years would be due at that time. As the Company has the intent to hold the lease through maturity, the entire lease term was included in the commitments table above. The second farm lease agreement is for 192.4 net plantable acres for a term of one year to be automatically renewed for five years. The site option agreement for 142.2 acres of land was entered into on November 1, 2007 for a five year term, with an option to extend for 20 years.
For the years ended December 31, 2009, 2008, and 2007, rent and administrative service expense under all operating leases was approximately $5.0 million, $4.7 million, and $4.5 million, net of rental income and restructuring charges. All rent expense is recorded on a straight line basis. As more fully described in Note 9, the Company recorded a restructuring charge and related restructuring liability based on space vacated in its 61,000 square foot facility during 2006. During 2009, approximately 85% of the idle building was rented to a subtenant. Accordingly, the rent payments from the sublease of approximately $6.4 million over the term of the sublease agreement related to the subleased space are not accounted for as rental income, but rather recorded against the restructuring reserve to offset the Company’s rent payments with the landlord.
Letter of Credit
Pursuant to its facilities leases for office and laboratory space in San Diego, the Company is required to maintain a letter of credit on behalf of its landlord in lieu of a cash deposit. As of December 31, 2009, the Company had a letter of credit in place pursuant to this agreement for approximately $10.4 million, representing the $100,000 minimum and approximately 24 months’ current rent. The letter of credit is issued under the Company’s existing Bank Agreement previously described in Note 6. The Company is required by the Bank to secure this obligation with cash, which is reflected as restricted cash on the Company’s consolidated balance sheet as of December 31, 2009. Any increases to the letter of credit resulting from increases in rent or changes in working capital or market capitalization are effective upon notice to the Company by the landlord.
| Working Capital |
Market Capitalization |
Required Letter of Credit | ||||
| Greater than $75 million | N/A | $100,000 | ||||
| $50 million to $75 million | or | $350 million | $100,000 plus 12 months’ rent | |||
| Less than $50 million | and | Less than $350 million | $100,000 plus 24 months’ rent |
Manufacturing Commitments
During 2002, the Company entered into a manufacturing agreement with Fermic to provide it with the capacity to produce commercial quantities of certain enzyme products. Based on actual and projected increased product requirements, the agreement was amended in 2006 to provide for additional capacity to be installed over
137
Table of Contents
VERENIUM CORPORATION
NOTES TO CONSOLIDATED FINANCIAL STATEMENTS—(Continued)
the next two years. Under the terms of the agreement, the Company can cancel the committed purchases with thirty months’ notice provided that the term of the agreement, including the termination notice period, aggregates four years. Pursuant to the agreement with Fermic, the Company is also obligated to reimburse monthly costs related to manufacturing activities. These costs scale up as our projected manufacturing volume increases. As of December 31, 2009, under this agreement the Company has made minimum commitments to Fermic of approximately $35.9 million, over the next two and a half years.
In addition, under the terms of the agreement, the Company is required to purchase certain equipment required for fermentation and downstream processing of the products. During 2009, the Company had incurred costs of approximately $0.6 million for equipment related to this agreement. Since inception through December 31, 2009, we have incurred costs of approximately $20.9 million for property and equipment related to this agreement. During 2010, the Company anticipates spending as much as $2.5 million in additional equipment costs related to the manufacturing agreement. As the Company continues to develop its commercial manufacturing platforms, it will be required to purchase additional capital equipment under this agreement.
The Company relies on Fermic and Genencor as its manufacturers for large volumes of commercial enzymes.
Litigation
Class Action Shareholder Lawsuit
In June 2004, the Company executed a formal settlement agreement with the plaintiffs in a class action lawsuit filed in December 2002 in a U.S. federal district court (the “Court”). This lawsuit is part of a series of related lawsuits in which similar complaints were filed by plaintiffs against hundreds of other public companies that conducted an Initial Public Offering (“IPO”) of their common stock in 2000 and the late 1990s (the “IPO Cases”). On February 15, 2005, the Court issued a decision certifying a class action for settlement purposes and granting preliminary approval of the settlement subject to modification of certain bar orders contemplated by the settlement. On August 31, 2005, the Court reaffirmed class certification and preliminary approval of the modified settlement. On April 24, 2006, the Court held a Final Fairness Hearing to determine whether to grant final approval of the settlement. On December 5, 2006, the Second Circuit Court of Appeals vacated the lower Court’s earlier decision certifying as class actions the six IPO Cases designated as “focus cases.” The Company is not one of the six focus cases. Thereafter, the District Court ordered a stay of all proceedings in all of the IPO Cases pending the outcome of the plaintiffs’ petition to the Second Circuit for rehearing en banc and resolution of the class certification issue. On April 6, 2007, the Second Circuit denied plaintiffs’ rehearing petition, but clarified that the plaintiffs may seek to certify a more limited class in the District Court. Accordingly, the settlement as originally negotiated was terminated pursuant to stipulation of the parties and will not be finally approved. On or about August 14, 2007, Plaintiffs filed amended complaints in the six focus cases, and thereafter moved for certification of the classes and appointment of lead plaintiffs and lead counsel in those cases. The six focus case issuers filed motions to dismiss the claims against them in November 2007 and an opposition to plaintiffs’ motion for class certification in December 2007. The Court denied the motions to dismiss on March 16, 2008. On October 2, 2008, the plaintiffs withdrew their class certification motion. On February 25, 2009, liaison counsel for plaintiffs informed the district court that a settlement of the IPO Cases had been agreed to in principle, subject to formal approval by the parties and preliminary and final approval by the court. On April 2, 2009, the parties submitted a tentative settlement agreement to the court and moved for preliminary approval thereof. On June 11, 2009, the Court granted preliminary approval of the tentative settlement and ordered that notice of the settlement to be published and mailed. The District Court held a final fairness hearing on September 10, 2009. On October 6, 2009, the District Court certified the settlement class in each IPO Case and granted final approval to the settlement. On or about October 23, 2009, three shareholders filed a Petition for Permission To Appeal Class Certification Order, objecting to the District Court’s final approval order and, in particular, asserting that the
138
Table of Contents
VERENIUM CORPORATION
NOTES TO CONSOLIDATED FINANCIAL STATEMENTS—(Continued)
District Court’s certification of the settlement classes violates the Second Circuit’s earlier class certification decisions in the IPO Cases. Beginning on October 29, 2009, a number of shareholders also filed direct appeals, objecting to final approval of the settlement. Similar petitions and direct appeals may be filed by other shareholders. If the settlement is affirmed on appeal, the settlement will result in the dismissal of all claims against the Company and its officers and directors with prejudice, and the Company’s pro rata share of the settlement fund will be fully funded by insurance.
The Company is covered by a claims-made liability insurance policy which it believes will satisfy any potential liability of the Company under this settlement. Due to the inherent uncertainties of litigation, and because the objecting shareholders are seeking to challenge the settlement on appeal, the ultimate outcome of this matter cannot be predicted.
Noteholder Lawsuit
On April 30, 2009, Capital Ventures International (“CVI”), a holder of the 2008 Notes, filed a lawsuit against the Company in the United States District Court for the Southern District of New York alleging that the Company breached the terms of the 2008 Notes by processing certain conversion notices submitted to the Company by CVI at $2.13 per share (now $25.56 per share on a reverse split-adjusted basis) or, following the amendment of the 2008 Notes, $1.74 per share (now $20.88 on a reverse-split adjusted basis) rather than $1.47 per share (now $17.64 per share on a reverse-split adjusted basis) and asserting that CVI is entitled to additional shares based on its asserted conversion price, as well as damages, and requesting a declaratory judgment that $1.47 per share (now $17.64 per share on a reverse-split adjusted basis) is the conversion price for the 2008 Notes. On June 3, 2009, CVI amended its complaint to also request a declaratory judgment that the Company cannot amend the 2008 Notes, pursuant to their terms, without the consent of each affected noteholder, including CVI. The Company filed its answer to CVI’s amended complaint on June 30, 2009, denying all material allegations of the complaint, as amended. An initial pre-trial conference was held on August 11, 2009 and the case is presently in the discovery phase.
On October 6, 2009, in response to the Company’s exchange of approximately $30.5 million of 2007 Notes, the granting of security interest in certain assets of the Company to exchanging holders and holders of the 2008 Notes and the public offering of common stock and warrants, CVI filed a Motion to Amend First Amended Complaint (the “Motion”). CVI’s proposed amended pleading alleges that the Company further breached the Note by both amending the terms of the 2008 Notes without CVI’s express consent and then undertaking various transactions authorized by the amendment. The amended pleading also alleges that as a result of these transactions the conversion rate should have adjusted to $4.27 per share rather than $17.89 per share. On February 25, 2010, the Court granted CVI’s Motion and CVI filed its Second Amended Complaint. The Company intends to file a response to the Second Amended Complaint by March 15, 2010.
Between February 27, 2009 and January 19, 2010, CVI converted all of their 2008 Notes, or approximately $14.5 million in face value, and the Company has issued approximately 1.3 million shares on a reverse-split adjusted basis, to settle these conversions and related “make-whole” obligations. Assuming the conversion prices asserted by CVI of $17.64 from February 27, 2009 through October 5, 2009 and $4.27 for conversions subsequent to October 6, 2009, 1.1 million additional shares would be issuable in connection with CVI’s conversions. The Company does not believe that this lawsuit will have a material impact on its financial statements. The Company believes any contingent liabilities related to these claims are not probable or estimable and therefore no amounts have been accrued for these matters.
139
Table of Contents
VERENIUM CORPORATION
NOTES TO CONSOLIDATED FINANCIAL STATEMENTS—(Continued)
Royalty Dispute
On August 31, 2009, the Company initiated an arbitration proceeding against Asahi Glass Co., Ltd. (“Asahi”) in the ICC International Court of Arbitration. The arbitration relates to a license agreement with Asahi whereby the Company obtained the right to use Asahi technology in connection with the manufacture of a product sold by the Company. In the arbitration, the Company seeks determinations that historical royalty payments made to Asahi were properly calculated and paid, reflecting all amounts properly subject to royalty obligations, and that Asahi has wrongfully interfered with advantageous business relations of the Company, as well as reimbursement of its damages, costs and expenses. In response to the Company’s Request for Arbitration, Asahi has claimed entitlement to additional royalties, breach of contract, patent infringement, misappropriation of trade secrets, breach of a covenant of good faith and fair dealing, and, if the Company is not found to have breached any of its obligations, seeks to set aside the contract. The Company believes it has valid defenses to Asahi’s claims, and intends to pursue those defenses, as well as its pending claims against Asahi, vigorously.
In addition to the matters noted above, from time to time, the Company is subject to legal proceedings, asserted claims and investigations in the ordinary course of business, including commercial claims, employment and other matters, which management considers to be immaterial, individually and in the aggregate. In accordance with generally accepted accounting principles, the Company makes a provision for a liability when it is both probable that a liability has been incurred and the amount of the loss can be reasonably estimated. These provisions are reviewed at least quarterly and adjusted to reflect the impacts of negotiations, settlements, rulings, advice of legal counsel and other information and events pertaining to a particular case. Litigation is inherently unpredictable. However, the Company believes that it has valid defenses with respect to the legal matters pending against the Company. It is possible, nevertheless, that the Company’s consolidated financial position, cash flows or results of operations could be negatively affected by an unfavorable resolution of one or more of such proceedings, claims or investigations.
| 9. | Impairment Charges and Restructuring Activities |
In connection with the January 2006 decision to reorganize and refocus the Company’s resources, management commenced several cost containment measures, including a reduction in workforce of 83 employees and the consolidation of its facilities. Pursuant to authoritative guidance requiring accrual of all exit related costs, the Company recorded net charges of $12.0 million in 2006 related to these activities. The following table sets forth the activity in the restructuring reserves through December 31, 2009 (in thousands):
| Balance at January 1, 2007 |
$ | 7,796 | ||
| Charged against accrual |
(2,263 | ) | ||
| Adjustments and revisions |
1,481 | |||
| Balance at December 31, 2007 |
7,014 | |||
| Charged against the accrual |
(1,471 | ) | ||
| Adjustments and revisions |
549 | |||
| Balance at December 31, 2008 |
6,092 | |||
| Charged against accrual |
(929 | ) | ||
| Adjustments and revisions |
525 | |||
| Balance at December 31, 2009 |
$ | 5,688 | ||
| Restructuring reserve liability: |
||||
| Current portion |
$ | 994 | ||
| Long-term portion |
4,694 | |||
| $ | 5,688 | |||
140
Table of Contents
VERENIUM CORPORATION
NOTES TO CONSOLIDATED FINANCIAL STATEMENTS—(Continued)
The facility consolidation costs are based on estimates, representing the discounted cash flow of lease payments (net of anticipated sublease income) on the vacated space through its contractual lease term in 2016.
Pursuant to authoritative guidance, the Company is required to re-assess these estimates on a periodic basis. Accordingly, the Company may revise these estimates in future periods, which could give rise to additional charges or adjustments. For the year ended December 31, 2009, 2008 and 2007, the restructuring reserve was adjusted by $0.5 million, $0.5 million and $1.5 million representing the net present value adjustment for the period, for a total gross obligation of $8.0 million, net of sublease income, as of December 31, 2009.
For the year ended December 31, 2009 and 2008, the adjustments and revisions related to restructuring activities were immaterial, and are included in “Selling, general and administrative expenses” on the Company’s Consolidated Statement of Operations.
| 10. | Segment Information and Concentration of Business Risk |
Segment Information
The Company operates in two segments identified as biofuels and specialty enzymes. The biofuels segment is focused on developing unique technical and operational capabilities designed to enable the production and commercialization of biofuels, in particular ethanol from cellulosic biomass. The specialty enzymes segment develops high performance enzymes for use within the alternative fuels, specialty industrial processes, and animal nutrition and health markets to enable higher throughput, lower costs, and improved environmental outcomes.
Management assesses performance and allocates resources based on discrete financial information for the biofuels and specialty enzymes business segments. For the biofuels segment, performance is assessed based on total operating expenses and capital expenditures. For the specialty enzymes segment, performance is assessed based on total revenues, product revenues, product gross margin, total operating expenses and capital expenditures. Operating expenses for each segment include direct and allocated research and development and selling, general and administrative expenses. In management’s evaluation of performance, certain corporate operating expenses are excluded from the business segments such as: non-cash share-based compensation, restructuring charges, severance, depreciation and amortization, and other corporate expenses, which are not allocated to either business segment. In addition, management evaluates segment performance based upon capital expenditures and other assets that are specifically identified to the business segment and excludes certain corporate assets that can be attributed to, or utilized by, both business segments. Expenses and assets shared by the segments require the use of judgments and estimates in determining the allocation of expenses to the two segments. Different assumptions or allocation methods could result in materially different results by segment. Further, expenses allocated to each of the two segments may not be indicative of the expenses of each operating segment if such segment operated on a stand-alone basis.
141
Table of Contents
VERENIUM CORPORATION
NOTES TO CONSOLIDATED FINANCIAL STATEMENTS—(Continued)
Selected operating results for each of the Company’s business segments are set forth below (in thousands):
| 2009 | 2008 | 2007 | ||||||||||||||||||||||||||||||||||||||||||||
| Biofuels | Specialty Enzymes |
Corporate | Total | Biofuels | Specialty Enzymes |
Corporate | Total | Biofuels | Specialty Enzymes |
Corporate | Total | |||||||||||||||||||||||||||||||||||
| Product revenue |
$ | — | $ | 43,956 | $ | — | $ | 43,956 | $ | — | $ | 49,083 | $ | — | $ | 49,083 | $ | — | $ | 25,975 | $ | — | $ | 25,975 | ||||||||||||||||||||||
| Collaborative and grant revenue |
15,978 | 5,977 | — | 21,955 | 1,635 | 18,941 | — | 20,576 | — | 20,298 | — | 20,298 | ||||||||||||||||||||||||||||||||||
| Total revenues |
15,978 | 49,933 | — | 65,911 | 1,635 | 68,024 | — | 69,659 | — | 46,273 | — | 46,273 | ||||||||||||||||||||||||||||||||||
| Product gross profit |
— | 16,027 | — | 16,027 | — | 13,930 | — | 13,930 | — | 6,160 | — | 6,160 | ||||||||||||||||||||||||||||||||||
| Operating expenses* (excluding cost of goods sold) |
65,903 | 13,122 | 23,292 | 102,317 | 54,865 | 32,196 | 127,333 | 214,394 | 20,499 | 53,480 | 58,214 | $ | 132,193 | |||||||||||||||||||||||||||||||||
| Total operating income (loss) |
(49,925 | ) | 8,882 | (23,292 | ) | (64,335 | ) | (53,230 | ) | 675 | (127,333 | ) | (179,888 | ) | $ | (20,499 | ) | $ | (27,022 | ) | $ | (58,214 | ) | $ | (105,735 | ) | ||||||||||||||||||||
| Loss attributed to noncontrolling interests in consolidated entities |
34,349 | — | — | 34,349 | 12,500 | — | — | 12,500 | — | — | — | — | ||||||||||||||||||||||||||||||||||
| Operating income (loss) attributed to Verenium |
$ | (15,576 | ) | $ | 8,882 | $ | (23,292 | ) | $ | (29,986 | ) | $ | (40,730 | ) | $ | 675 | $ | (127,333 | ) | $ | (167,388 | ) | $ | (20,499 | ) | $ | (27,022 | ) | $ | (58,214 | ) | $ | (105,735 | ) | ||||||||||||
| Capital expenditures |
$ | 4,891 | $ | 527 | $ | — | $ | 5,418 | $ | 43,319 | $ | 3,121 | $ | 194 | $ | 46,634 | $ | 26,991 | $ | 2,636 | $ | 4,603 | $ | 34,230 | ||||||||||||||||||||||
| * | Corporate operating expenses include $106.1 million in a non-cash goodwill impairment charge for the year ending December 31, 2008 and $42.2 million non-cash acquired in-process research and development charge for the year ended December 31, 2007. |
142
Table of Contents
VERENIUM CORPORATION
NOTES TO CONSOLIDATED FINANCIAL STATEMENTS—(Continued)
Identifiable assets by operating segment are set forth below (in thousands):
| As of December 31, 2009 | ||||||||||||
| Biofuels | Specialty Enzymes |
Corporate | Total | |||||||||
| Property, plant and equipment, net |
$ | 102,810 | $ | 2,430 | $ | 3,159 | $ | 108,399 | ||||
| Cash and other assets (1) |
8,190 | 10,109 | 41,224 | 59,523 | ||||||||
| Total identifiable assets |
$ | 111,000 | $ | 12,539 | $ | 44,383 | $ | 167,922 | ||||
| As of December 31, 2008 | ||||||||||||
| Biofuels | Specialty Enzymes |
Corporate | Total | |||||||||
| Property, plant and equipment, net |
$ | 109,030 | $ | 3,502 | $ | 4,739 | $ | 117,271 | ||||
| Cash and other assets |
702 | 11,101 | 24,549 | 36,352 | ||||||||
| Total identifiable assets |
$ | 109,732 | $ | 14,603 | $ | 29,288 | $ | 153,623 | ||||
| (1) | As of December 31, 2009, Biofuels cash and other assets includes $7.2 million of Vercipia cash and cash equivalents which is limited to Vercipia operations. |
Concentrations of Business Risk
A relatively small number of customers and collaboration partners historically have accounted for a significant percentage of the Company’s revenue. Revenue from the Company’s largest customer, Danisco Animal Nutrition, represented 50%, 53% and 35% of total revenue for the years ended December 31, 2009, 2008 and 2007. Accounts receivable from this one customer comprised approximately 58% and 68%of accounts receivable at December, 2009 and 2008.
Revenue by geographic area was as follows (in thousands):
| For the years ended December 31, | |||||||||
| 2009 | 2008 | 2007 | |||||||
| North America |
$ | 30,999 | $ | 22,507 | $ | 15,284 | |||
| South America |
5,872 | 13,826 | 1,458 | ||||||
| Europe |
27,766 | 32,024 | 29,214 | ||||||
| Asia |
1,274 | 1,302 | 225 | ||||||
| Middle East |
— | — | 92 | ||||||
| $ | 65,911 | $ | 69,659 | $ | 46,273 | ||||
For the years ended December 31, 2009, 2008 and 2007, 68%, 81% and 84% of the Company’s product revenue has come from one focus area, animal nutrition and health. The Company derived, directly or indirectly, approximately 27%, 10%, and 7%, of its revenue from agencies of the United States government in 2009, 2008, and 2007.
The Company manufactures most of its enzyme products through a manufacturing facility in Mexico City, owned by Fermic S.A., or Fermic. The carrying value of assets held at Fermic reported on the Company’s Consolidated Balance Sheets at December 31, 2009 totaled approximately $2.4 million.
143
Table of Contents
VERENIUM CORPORATION
NOTES TO CONSOLIDATED FINANCIAL STATEMENTS—(Continued)
| 11. | Stockholders’ Equity |
Shareholder Rights Plan
On December 13, 2000, the Board of Directors of the Company approved the adoption of a shareholder rights plan (the “Rights Plan”). Under the Rights Plan, the Board of Directors declared a dividend of one right to purchase one one-hundredth of a share of Series A junior participating preferred stock (a “Right”) for each share of Company common stock outstanding as of December 22, 2000. The exercise price of each Right is $125.00.
Initially, the Rights trade with the Company’s common stock and are not separately transferable. However, subject to certain exceptions, the Rights will become exercisable (i) at such time that a person (or group of affiliated persons) acquires beneficial ownership of 15% or more of the Company’s outstanding common stock (an “Acquiring Person”) or (ii) on the tenth business day after a person or entity commences, or expresses an intention to commence, a tender or exchange offer that would result in such person acquiring 15% or more of the outstanding Company common stock. In December 2002, in connection with the Company’s entering into a series of agreements with Syngenta and Torrey Mesa Research Institute, the Company amended the Rights Plan to provide that, with respect to Syngenta and its affiliates and associates, the threshold will be 22% rather than 15% for the aggregate beneficial ownership of the Company’s common stock that their holdings may not exceed without the Rights becoming exercisable.
In the event a person becomes an Acquiring Person, each Right held by all persons other than the Acquiring Person will become the right to acquire one share of Company common stock at a price equal to 50% of the then-current market value of the Company’s common stock. Furthermore, in the event an Acquiring Person effects a merger of the Company, each Right will entitle the holder thereof to purchase one share of common stock of the Acquiring Person or the Acquiring Person’s ultimate parent at a price equal to 50% of the then-current market value of the Acquiring Person’s or the Acquiring Person’s ultimate parent’s common stock.
The Board of Directors can redeem the Rights at any time prior to a person becoming an Acquiring Person at a redemption price of $0.01 per Right. In addition, the Board of Directors may, after any time a person becomes an Acquiring Person, exchange each Right for one share of common stock of the Company. The Rights will expire on December 12, 2010 if not redeemed prior to such date.
Reverse Stock Split
On September 9, 2009, the Company filed an amendment to its Certificate of Incorporation establishing a 1-for-12 reverse split of common stock. Every 12 shares of (old) common stock which were held as of September 9, 2009, the effective date, were converted into one share of (new) common stock. Share and per share amounts have been retroactively adjusted to reflect the impact of the reverse split for all periods presented.
Public Offering of Common Stock and Warrants
On October 6, 2009, the Company entered into an agreement to issue 2,250,000 shares of its common stock and warrants to purchase an additional 900,000 shares of common stock in an underwritten public offering at a price of $6.00 per unit. Each unit consists of one share of common stock and a warrant to purchase 0.40 of a share of common stock. The shares of common stock and warrants are immediately separable and will be issued separately. The warrants have a five-year term and an exercise price of $7.59. The warrants were recorded as a derivative liability on the Company’s balance sheet and are required to be revalued based on current fair value at each reporting date. The liability balance was $0.8 million at issuance and decreased to $0.7 million as of
144
Table of Contents
VERENIUM CORPORATION
NOTES TO CONSOLIDATED FINANCIAL STATEMENTS—(Continued)
December 31, 2009, using the Black Scholes Merton valuation model. Net proceeds after underwriting discounts and commissions and estimated expenses, were approximately $12.2 million. The offering closed on October 9, 2009.
| 12. | Equity Incentive Plans and Warrants |
Equity Incentive Plans
Celunol Equity Incentive Plan
As a part of the merger on June 20, 2007, each outstanding and unexercised option to purchase shares of Celunol common stock, whether vested or unvested, was assumed by Verenium and became an option to acquire shares of Verenium common stock, under the same terms and conditions that existed in the Celunol plan prior to the merger. Options granted under this plan generally vest over a four year period and expire 10 years from the date of the grant. The number of shares of Celunol common stock that was subject to each option prior to the effective time was converted into Verenium common stock based on the exchange ratio determined pursuant to the merger agreement. The Company’s stockholders approved the Celunol Equity Incentive Plan on June 20, 2007. A total of 42,275 shares of Verenium common stock are reserved for issuance under the Celunol Equity Incentive Plan and 16,518 options to purchase shares remain outstanding as of December 31, 2009.
2007 Equity Incentive Plan
In March 2007, the Board of Directors adopted the 2007 Equity Incentive Plan (the “2007 Plan”), and effective May 7, 2007, amended the 2007 Plan. The 2007 Equity Incentive Plan is the successor to the Diversa Corporation 1997 Equity Incentive Plan (the “1997 Plan”). The 2007 Plan provides for the grant of incentive stock options, non-statutory stock options, restricted stock awards, restricted stock unit awards, stock appreciation rights, performance stock awards, performance cash awards and other forms of equity compensation. Stock awards granted under this plan generally vest over a four year period and expire 10 years from the date of the grant. The Company’s stockholders approved the 2007 Plan, as amended, on June 20, 2007. A total of 812,500 shares are reserved for issuance under the 2007 Plan and 671,043 options to purchase shares remain outstanding as of December 31, 2009.
2005 Non-Employee Directors’ Equity Incentive Plan
In March 2005, the Board of Directors of the Company (“Board”) adopted the Company’s 2005 Non-Employee Directors’ Equity Incentive Plan (“Directors’ Plan”), and reserved a total of 50,000 shares for issuance thereunder. The number of shares available for issuance under the Directors’ Plan will automatically increase on the first trading day of each calendar year, beginning with the 2006 calendar year and continuing through and including calendar year 2015, by an amount equal to the excess of (i) the number of shares subject to stock awards granted during the preceding calendar year, over (ii) the number of shares added back to the share reserve during the preceding calendar year pursuant to expirations, terminations, cancellations, forfeitures and repurchases of previously granted awards. However this automatic annual increase shall not exceed 20,833 shares in any calendar year. As of December 31, 2009, a total of 80,482 shares of the Company’s common stock have been reserved for issuance under the Directors’ Plan.
The Board adopted the Directors’ Plan as the primary equity incentive program for the Company’s non-employee directors in order to secure and retain the services of such individuals, and to provide incentives for such persons to exert maximum efforts for the success of the Company. Stock awards granted under this plan generally vest monthly over a three year period and expire 10 years from the date of the grant. The Directors’
145
Table of Contents
VERENIUM CORPORATION
NOTES TO CONSOLIDATED FINANCIAL STATEMENTS—(Continued)
Plan replaced the 1999 Non-Employee Directors’ Stock Option Plan. As of December 31, 2009, there were approximately 77,000 options to purchase shares outstanding under the Directors’ Plan and no shares outstanding under the 1999 Non-Employee Directors’ Stock Option Plan.
Employee Stock Option and Stock Purchase Plans
1999 Employee Stock Purchase Plan
In December 1999, the Board of Directors adopted the 1999 Employee Stock Purchase Plan (the “Purchase Plan”). The plan was suspended effective the first quarter of 2009.
1997 Equity Incentive Plan
In August 1997, the Company adopted the 1997 Equity Incentive Plan (the “1997 Plan”), which provides for the granting of incentive or non-statutory stock options, stock bonuses, and rights to purchase restricted stock to employees, directors, and consultants as administered by the Board of Directors. The 1997 Plan was terminated by the Board of Directors at the time of the merger on June 20, 2007.
The incentive and non-statutory stock options were granted with an exercise price of not less than 100% and 85%, respectively, of the estimated fair value of the underlying common stock as determined by the Board of Directors. The 1997 Plan allowed the purchase of restricted stock at a price that is not less than 85% of the estimated fair value of the Company’s common stock as determined by the Board of Directors.
Options granted under the 1997 Plan vest over periods ranging up to four years and are exercisable over periods not exceeding ten years. As of December 31, 2009, the aggregate number of shares awarded under the 1997 Plan is approximately 1,183,000, with no shares available for grant. A total of 22,888 options to purchase shares remain outstanding as of December 31, 2009 for the plan.
Share-Based Compensation Expense
The Company recognized $7.7 million, $11.2 million and $11.0 million in share-based compensation expense for its share-based awards for years ended December 31, 2009, 2008 and 2007. Share-based compensation expense was allocated among the following expense categories (in thousands):
| For the Years Ended December 31, | |||||||||
| 2009 | 2008 | 2007 | |||||||
| Research and development |
$ | 2,285 | $ | 4,391 | $ | 3,669 | |||
| Selling, general and administrative |
5,403 | 6,842 | 7,297 | ||||||
| $ | 7,688 | $ | 11,233 | $ | 10,966 | ||||
During 2009, the Board of Directors approved to accelerate the vesting of a group of performance-based options held by certain Company executives. The acceleration reduced the vesting term from seven to four years for approximately 70% of the total grants, as well as fully accelerated two additional executive grants, resulting in additional stock compensation expense of approximately $1.6 million. Further during 2009, the Board of Directors approved to accelerate the vesting of all non-officer employee restricted stock awards outstanding, resulting in additional compensation expense of approximately $0.3 million. As described below, the Company also completed a stock option exchange program, which resulted in $0.9 million of additional expense for the year ended December 31, 2009.
146
Table of Contents
VERENIUM CORPORATION
NOTES TO CONSOLIDATED FINANCIAL STATEMENTS—(Continued)
The Company has determined its share-based compensation expense for the years ended December 31, 2009, 2008 and 2007 as follows:
Valuation of Stock Options
Share-based compensation related to stock options includes the amortization of the fair value of options determined using the multiple option approach under the Black-Scholes Merton (“BSM”) valuation model. The fair value of options determined under authoritative accounting guidance is amortized to expense over the vesting periods of the underlying options, generally four years.
The fair value of stock option awards for the years ended December 31, 2009, 2008 and 2007 was estimated on the date of grant using the assumptions in the following table. The expected volatility in this model is based on the historical volatility of the Company’s stock since the merger date along with the historical volatility of peer companies due to the limited Company history since the merger date. The risk-free interest rate is based on the U.S. Treasury yield curve in effect at the time awards are granted, based on maturities which approximate the expected life of the options. The expected life of the options granted is estimated using the historical exercise behavior of employees along with peer companies. The expected dividend rate takes into account the absence of any historical dividends paid by the Company and management’s intention to retain all earnings for future operations and expansion.
| December 31, | |||||||||
| 2009 | 2008 | 2007 | |||||||
| Risk-free interest rate |
1.7% to 3.3 | % | 1.5% to 3.7 | % | 3.6% to 5.0 | % | |||
| Dividend Yield |
0 | % | 0 | % | 0 | % | |||
| Volatility |
98% to 135 | % | 62% to 98 | % | 61% to 64 | % | |||
| Expected Life |
5 to 6 years | 5 years | 5 years | ||||||
Valuation of Employee Stock Purchase Plan (“ESPP”) Awards
Share-based compensation related to awards issued under the ESPP after December 31, 2005 are based on calculations of fair value under the BSM valuation model which are similar to how stock option valuations are made. The fair value of ESPP awards is amortized to expense over the vesting periods of the underlying awards, ranging from six months to two years. The Company’s ESPP plan was suspended effective March 2009 with no new purchase periods during 2009. All unamortized expense relating to future periods were recognized at that time. The fair value for previous year purchase periods was based on the following assumptions for the years ended:
| December 31, | ||||||
| 2008 | 2007 | |||||
| Risk-free interest rate |
1.6% to 2.3 | % | 3.7% to 4.4 | % | ||
| Dividend Yield |
0 | % | 0 | % | ||
| Volatility |
62 | % | 53% to 63 | % | ||
| Expected Life |
6 months to 2 years |
|
6 months to 2 years |
| ||
147
Table of Contents
VERENIUM CORPORATION
NOTES TO CONSOLIDATED FINANCIAL STATEMENTS—(Continued)
Valuation of Non-Restricted and Restricted Stock Awards
The fair value of non-restricted and restricted stock awards is equal to the closing market price of the Company’s common stock at the date of grant. The fair value of non-restricted awards is charged to share-based compensation upon grant. The fair value of restricted awards is amortized to share-based compensation expense over the vesting period of the underlying awards, ranging from two years to four years.
Forfeiture Rate for Options and Restricted Stock Awards
The Company is required to estimate forfeitures at the time of grant and revise those estimates in subsequent periods on a cumulative basis in the period the estimated forfeiture rate changes for all share-based awards. The Company considers its historical experience of pre-vesting option forfeitures and peers as the basis to arrive at its estimated pre-vesting option forfeiture rate. The forfeiture rate for 2009, 2008 and 2007 was 10%, 10% and 5% for all share-based awards as a result of an analysis of peer companies in the specialty enzyme and biofuels industries and the Company’s historical rate.
Unrecognized Share-Based Compensation Expense
As of December 31, 2009, there was approximately $2.5 million of total unrecognized compensation expense related to nonvested share-based compensation arrangements granted under the equity incentive plans. This expense is expected to be recognized over a weighted-average period of 2.1 years as follows (in thousands):
| Fiscal Year 2010 |
$ | 1,253 | |
| Fiscal Year 2011 |
325 | ||
| Fiscal Year 2012 |
527 | ||
| Fiscal Year 2013 |
442 | ||
| $ | 2,547 | ||
148
Table of Contents
VERENIUM CORPORATION
NOTES TO CONSOLIDATED FINANCIAL STATEMENTS—(Continued)
Equity Incentive Awards Activity
Stock Options
Information with respect to all of the Company’s stock option plans is as follows (in thousands, except per share data):
| Shares | Weighted Average Exercise Price per Share |
Weighted Average Remaining Contractual Term |
Aggregate Intrinsic Value | ||||||||
| Outstanding at January 1, 2007 |
311 | $ | 144.89 | ||||||||
| Granted |
367 | $ | 73.86 | ||||||||
| Assumed in merger with Celunol Corp. |
66 | $ | 29.47 | ||||||||
| Exercised |
(8 | ) | $ | 54.59 | |||||||
| Cancelled |
(94 | ) | $ | 105.43 | |||||||
| Outstanding at December 31, 2007 |
642 | $ | 99.35 | ||||||||
| Granted |
254 | $ | 31.43 | ||||||||
| Exercised |
(7 | ) | $ | 0.81 | |||||||
| Cancelled |
(97 | ) | $ | 109.37 | |||||||
| Outstanding at December 31, 2008 |
792 | $ | 77.18 | ||||||||
| Granted |
800 | $ | 4.37 | ||||||||
| Exercised |
(9 | ) | $ | 0.79 | |||||||
| Cancelled |
(796 | ) | $ | 65.64 | |||||||
| Outstanding at December 31, 2009 |
787 | $ | 15.75 | 9.4 | $ | 435 | |||||
| Exercisable at December 31, 2009 |
173 | $ | 56.66 | 8.0 | $ | 133 | |||||
The weighted-average estimated fair values of options granted, as determined by the BSM valuation model, were $2.18, $18.44 and $51.03 per share for the years ended December 31, 2009, 2008 and 2007. The total intrinsic value of options exercised during the years ended December 31, 2009, 2008 and 2007 was $0.1 million, $0.1 million and $0.4 million, respectively, which was determined as of the date of exercise. The amount of cash received from the exercise of stock options was $14,000, $0 and $0.5 million for the years ended December 31, 2009, 2008 and 2007, respectively.
At December 31, 2009, options to purchase 0.2 million shares with an aggregate intrinsic value of approximately $0.1 million were exercisable, and approximately 67,000 shares remain available for grant. At December 31, 2008, options to purchase 0.3 million shares with an aggregate intrinsic value of approximately $0.1 million were exercisable, and approximately 0.3 million shares remained available for grant.
149
Table of Contents
VERENIUM CORPORATION
NOTES TO CONSOLIDATED FINANCIAL STATEMENTS—(Continued)
Non-Restricted and Restricted Share Awards
Information with respect to all of the Company’s non-restricted and restricted share awards is as follows (in thousands, except per share data):
| Shares | Weighted Average Fair Value | |||||
| Non-vested awards outstanding at January 1, 2007 |
93 | $ | 76.87 | |||
| Granted |
32 | $ | 86.76 | |||
| Assumed in merger with Celunol Corp |
18 | $ | 121.32 | |||
| Vested |
(73 | ) | $ | 82.61 | ||
| Forfeited and cancelled |
(8 | ) | $ | 79.15 | ||
| Non-vested awards outstanding at December 31, 2007 |
62 | $ | 87.85 | |||
| Granted |
8 | $ | 14.64 | |||
| Vested |
(45 | ) | $ | 90.14 | ||
| Forfeited and cancelled |
(3 | ) | $ | 79.43 | ||
| Non-vested awards outstanding at December 31, 2008 |
22 | $ | 57.17 | |||
| Granted |
48 | $ | 7.04 | |||
| Vested |
(60 | ) | $ | 21.45 | ||
| Forfeited and cancelled |
(2 | ) | $ | 83.88 | ||
| Non-vested awards outstanding at December 31, 2009 |
8 | $ | 15.62 | |||
Tender Offer
In May 2009, the Company’s Board of Directors authorized a stock option exchange program to allow eligible employees the opportunity to exchange certain options granted under the Company’s equity incentive plans. The Company’s shareholders approved the stock option exchange program at the 2009 Annual Meeting of Shareholders on September 1, 2009, and on October 13, 2009, the Company issued a Tender Offer to all holders of eligible options. Pursuant to the Tender Offer, options to purchase common stock that have an exercise price greater than $5.01 per share were eligible for replacement options with lower exercise prices. Fifty percent of all exchanged options will be subject to two additional years added to the existing vesting terms. The exchange was accounted for as a modification to the existing options in accordance with authoritative guidance. Total compensation expense to be recognized over the modified vesting period related to the repriced options of $3.7 million includes the previous grants unamortized expense of $3.3 million and the incremental value to the option holders created as a result of the modification of $0.4 million. Total compensation expense recognized during the year ended December 31, 2009 related to the exchange was $0.9 million. A total of 615,000 options were exchanged as part of the offer, with a total of 474,000 new options issued.
Warrants
In connection with the closing of a series of transactions with Syngenta Participations AG in February 2003, the Company issued to Syngenta a warrant to purchase 0.1 million shares of common stock at $264 per share that is exercisable for ten years starting in 2008. The exercise price per share of the warrant is subject to downward adjustment in the event of certain dilutive issuances or deemed issuances of stock by the Company, and is currently exercisable at $184.96 per share.
In connection with the completion of the June 20, 2007 merger transaction with Celunol, the Company assumed 28,000 warrants to purchase common stock at $22.44 per share that expire in December 2016. In
150
Table of Contents
VERENIUM CORPORATION
NOTES TO CONSOLIDATED FINANCIAL STATEMENTS—(Continued)
connection with the issuance of the 2008 Notes, the Company issued to the noteholders warrants to purchase 666,000 shares of common stock at $53.28 per share that are exercisable for five years starting August 27, 2008. The exercise price and the number of shares of the Company’s common stock issuable upon exercise of the warrants are subject to weighted average anti-dilution protection. As a result of anti-dilution provisions triggered by the 2009 Notes exchange in September 2009 and public offering of common stock and warrants in October 2009, the warrants increased to purchase approximately 968,000 shares of the Company’s common stock at an exercise price of $36.62. Additionally, the Company entered into a convertible hedge transaction (see Note 2), whereby the Company issued warrants to purchase 1.1 million shares of common stock at $61.92 per share. The warrants are exercisable on three dates staggered in six month intervals beginning on October 1, 2013.
As noted in Note 11, in connection with our October issuance of 2,250,000 shares of our common stock, warrants to purchase an additional 900,000 shares of common stock were also issued. Each unit consists of one share of common stock and a warrant to purchase 0.40 of a share of common stock. The warrants have an exercise price of $7.59 per share that are exercisable for five years starting October 9, 2009.
As of December 31, 2009, none of the above warrants have been exercised.
Common Stock Reserved for Future Issuance
At December 31, 2009, the Company has reserved shares of common stock for future issuance as follows (in thousands):
| Shares | ||
| Equity Incentive Plans |
854 | |
| Warrants (including shares issuable under the convertible hedge transaction) |
2,213 | |
| 2007 Notes |
899 | |
| 2008 Notes |
1,427 | |
| 2009 Notes |
1,769 | |
| 7,162 | ||
| 13. | Benefit Plan |
The Company has a 401(k) plan which allows participants to defer a portion of their income through contributions. Such deferrals are fully vested and are not taxable to the participant until distributed from the plan upon termination, retirement, permanent disability, or death. The Company matches a portion of the employee contributions and may, at its discretion, make additional contributions. The Company made cash contributions of approximately $1.0 million, $0.9 million and $0.8 million for the years ended December 31, 2009, 2008 and 2007.
151
Table of Contents
VERENIUM CORPORATION
NOTES TO CONSOLIDATED FINANCIAL STATEMENTS—(Continued)
| 14. | Income Taxes |
The reconciliation of income tax computed at the Federal statutory tax rate to the provision for income taxes is as follows (in thousands):
| December 31, | ||||||||||||
| 2009 | 2008 | 2007 | ||||||||||
| Tax at statutory rate |
$ | (7,662 | ) | $ | (61,772 | ) | $ | (37,655 | ) | |||
| State taxes, net of Federal benefit |
(1,258 | ) | (10,141 | ) | (6,182 | ) | ||||||
| In-process research and development |
— | — | 17,278 | |||||||||
| Goodwill impairment |
— | 43,245 | — | |||||||||
| Gain/(loss) on debt extinguishment |
(5,266 | ) | 1,467 | — | ||||||||
| Gain on BP capital contribution to Galaxy Biofuels LLC |
8,353 | 9,983 | — | |||||||||
| Change in valuation allowance/true-up of NOL’s |
(6,094 | ) | 15,350 | 19,476 | ||||||||
| Write-off of research and development credits |
— | — | 5,058 | |||||||||
| Cancellation of debt income |
6,908 | — | — | |||||||||
| Non deductible interest expense |
2,511 | — | — | |||||||||
| Non deductible loss on partnership interest |
1,772 | — | — | |||||||||
| Share-based compensation expense |
(825 | ) | 2,357 | 2,474 | ||||||||
| Permanent differences and other |
1,561 | (489 | ) | (449 | ) | |||||||
| $ | — | $ | — | $ | — | |||||||
On July 13, 2006, the FASB issued authoritative guidance which clarifies the accounting for uncertainty in income taxes recognized in an entity’s financial statements. A recognition threshold is prescribed and measurement attributes for financial statement disclosure of tax positions taken or expected to be taken on a tax return. The impact of an uncertain income tax position on the income tax return must be recognized at the largest amount that is more-likely–than-not to be sustained upon audit by the relevant taxing authority. An uncertain income tax position will not be recognized if it has less than a 50% likelihood of being sustained. Additionally, the authoritative guidance provides guidance on derecognition, classification, interest and penalties, accounting in interim periods, disclosure and transition. The guidance is effective for fiscal years beginning after December 15, 2006.
The Company adopted the provisions on January 1, 2007, and has commenced analyzing filing positions in all of the federal and state jurisdictions where it is required to file income tax returns, as well as all open tax years in these jurisdictions. As a result of adoption, the Company has recorded no additional tax liability. As of December 31, 2009 the Company has not yet completed its analysis of the deferred tax assets for net operating losses of $132.5 million and research and development credits of $3.7 million generated in years prior to 2009 and net operating losses of $16.4 million generated in 2009. As such, these amounts and the offsetting valuation allowance have been removed from the Company’s deferred tax assets. As noted below, the Company is in the process of completing a Section 382 analysis regarding the potential limitations on the use of the net operating loss and research and development credits.
The Company is subject to taxation in the U.S. and state jurisdictions. The Company’s tax years for 1996 and forward are subject to examination by the U.S. and California tax authorities due to the carryforward of unutilized net operating losses and research and development credits. The Company is currently not under examination by any taxing authorities.
152
Table of Contents
VERENIUM CORPORATION
NOTES TO CONSOLIDATED FINANCIAL STATEMENTS—(Continued)
The Company’s practice is to recognize interest and/or penalties related to income tax matters in income tax expense. During the twelve months ended December 31, 2009, the Company did not recognize any interest or penalties.
The adoption of the authoritative guidance did not impact the Company’s financial condition, results of operations or cash flows. At December 31, 2009, the Company had deferred tax assets of $33.2 million. These deferred tax assets are primarily composed of depreciation and amortization, capitalized research and development costs, deferred revenue and stock compensation expense. Due to uncertainties surrounding the Company’s ability to generate future taxable income to realize these assets, a full valuation has been established to offset the net deferred tax asset. Additionally, the future utilization of the company’s net operating loss and research and development credit carryforwards to offset future taxable income may be subject to an annual limitation as a result of ownership changes that may have occurred previously or that could occur in the future. The Company has not yet determined whether such an ownership change has occurred; however the Company is in the process of completing a Section 382 analysis regarding the limitation of the net operating loss and research and development credits. Until this analysis has been completed the Company has removed the deferred tax assets associated with these carryforwards from its deferred tax asset schedule and has recorded a corresponding decrease to their valuation allowance. When the Section 382 analysis is completed, the Company plans to update its unrecognized tax benefits. The Company expects the Section 382 analysis to be completed within the next twelve months.
Significant components of the Company’s deferred tax assets are shown below. A valuation allowance of $23.0 million and $32.1 million has been recognized to offset the deferred tax assets at December 31, 2009 and 2008 as realization of such assets is uncertain.
The following table sets forth the detail of the Company’s deferred taxes (in thousands):
| As of December 31, | ||||||||
| 2009 | 2008 | |||||||
| Deferred tax assets: |
||||||||
| Depreciation and amortization |
$ | 15,871 | $ | 20,608 | ||||
| Stock option expense |
7,424 | 3,696 | ||||||
| Allowance and accrued liabilities |
5,289 | 8,660 | ||||||
| Capitalized research and development |
3,737 | 4,713 | ||||||
| Deferred revenue |
896 | 1,384 | ||||||
| Total deferred tax assets |
33,217 | 39,061 | ||||||
| Valuation allowance |
(23,034 | ) | (32,113 | ) | ||||
| Net deferred tax assets |
$ | 10,183 | $ | 6,948 | ||||
| Deferred tax liabilities: |
||||||||
| Depreciation |
$ | 9,761 | $ | — | ||||
| Convertible debt basis difference |
422 | 6,948 | ||||||
| Total deferred tax liabilities |
10,183 | 6,948 | ||||||
| Net deferred tax assets |
$ | — | $ | — | ||||
At December 31, 2009, the Company has federal and state net operating loss carry-forwards of approximately $400.9 million and $198.9 million, respectively, which includes $31.1 million and $9.3 million, respectively, from Celunol pre-merger financial results which are currently under evaluation by the Company to
153
Table of Contents
VERENIUM CORPORATION
NOTES TO CONSOLIDATED FINANCIAL STATEMENTS—(Continued)
determine if these NOL’s can ever be realized. The federal net operating loss carry-forwards will begin to expire in 2011 unless utilized. The state net operating loss carry-forwards will begin to expire in 2012 unless utilized. The Company also has federal research credits of approximately $5.3 million which begin to expire in 2011, California research credits of approximately $4.3 million which will carryover indefinitely, and California manufacturer’s investment credits of approximately $0.7 million, which will begin to expire in 2010.
Pursuant to Sections 382 and 383 of the Internal Revenue Code, annual use of the Company’s net operating loss and credit carry-forwards may be limited due to cumulative changes in ownership of more than 50%.
As a result of certain realization requirements of authoritative guidance, the company recognizes windfall tax benefits associated with the exercise of stock options directly to stockholders’ equity only when realized. Accordingly, deferred tax assets are not recognized for net operating loss carryforwards resulting from windfall tax benefits occurring from January 1, 2006 onward. At December 31, 2009, deferred tax assets do not include $2.5 million of excess tax benefits from share based compensation
| 15. | Selected Quarterly Data (Unaudited) |
The following tables set forth certain unaudited quarterly information for each of the eight fiscal quarters in the two year period ended December 31, 2009. This quarterly information has been prepared on a consistent basis with the audited consolidated financial statements and, in the opinion of management, includes all adjustments which management believes are necessary for a fair presentation of the information for the periods presented. The Company’s quarterly operating results may fluctuate significantly as a result of a variety of factors, and operating results for any quarter are not necessarily indicative of results for a full fiscal year or future quarters.
| 2009 Quarter Ended |
Dec. 31 | Sep. 30 | June 30 | Mar. 31 | ||||||||||||
| (in thousands, except per share data) | ||||||||||||||||
| Total revenue |
$ | 16,619 | $ | 18,610 | $ | 16,291 | $ | 14,391 | ||||||||
| Operating expenses |
27,817 | 35,240 | 34,447 | 32,742 | ||||||||||||
| Net income (loss) |
(2,958 | ) | (2,292 | ) | (19,964 | ) | 3,323 | |||||||||
| Basic net income (loss) per common share |
(0.26 | ) | (0.25 | ) | (2.65 | ) | 0.58 | |||||||||
| Diluted net income (loss) per common share |
(0.26 | ) | (0.25 | ) | (2.65 | ) | 0.57 | |||||||||
| 2008 Quarter Ended |
Dec. 31 | Sep. 30 | June 30 | Mar. 31 | ||||||||||||
| (in thousands, except per share data) | ||||||||||||||||
| Total revenue |
$ | 19,745 | $ | 16,376 | $ | 18,303 | $ | 15,235 | ||||||||
| Operating expenses (1) |
38,875 | 144,690 | 33,561 | 32,421 | ||||||||||||
| Net loss (2) |
(11,850 | ) | (126,140 | ) | (15,383 | ) | (23,117 | ) | ||||||||
| Basic and diluted net loss per common share |
(2.11 | ) | (22.98 | ) | (2.98 | ) | (4.53 | ) | ||||||||
| (1) | Includes goodwill charge of $106.1 million recorded in the third quarter of 2008. |
154
Table of Contents
| ITEM 9. | CHANGES IN AND DISAGREEMENTS WITH ACCOUNTANTS ON ACCOUNTING AND FINANCIAL DISCLOSURE. |
None
| ITEM 9A. | CONTROLS AND PROCEDURES. |
Evaluation of Disclosure Controls and Procedures
We maintain disclosure controls and procedures that are designed to ensure that information required to be disclosed in our Exchange Act reports is recorded, processed, summarized and reported within the timelines specified in the SEC’s rules and forms, and that such information is accumulated and communicated to our management, including our Chief Executive Officer and Chief Financial Officer, as appropriate, to allow timely decisions regarding required disclosure.
Under the supervision and with the participation of our management, including our Chief Executive Officer and our Chief Financial Officer, we carried out an evaluation of the effectiveness of our disclosure controls and procedures (as such term is defined in SEC Rules 13a-15(e) and 15d-15(e)) as of December 31, 2009. Based on such evaluation, such officers have concluded that, as of December 31, 2009, our disclosure controls and procedures were effective.
There were no changes in our internal controls over financial reporting (as defined in Rule 13a-15(f) of the Exchange Act) that occurred during our most recent fiscal quarter that have materially affected, or are reasonably likely to materially affect, our internal controls over financial reporting.
Management’s Report on Internal Control over Financial Reporting
Management is responsible for establishing and maintaining adequate internal control over our financial reporting. Internal control over financial reporting refers to the process designed by, or under the supervision of, our Chief Executive Officer and Chief Financial Officer, and effected by our board of directors, management and other personnel, to provide reasonable assurance regarding the reliability of financial reporting and the preparation of financial statements for external purposes in accordance with generally accepted accounting principles, and includes those policies and procedures that:
| (1) | Pertain to the maintenance of records that, in reasonable detail, accurately and fairly reflect the transactions and dispositions of our assets; |
| (2) | Provide reasonable assurance that transactions are recorded as necessary to permit preparation of financial statements in accordance with generally accepted accounting principles, and that our receipts and expenditures are being made only in accordance with authorizations of our management and directors; and |
| (3) | Provide reasonable assurance regarding prevention or timely detection of unauthorized acquisition, use or disposition of our assets that could have a material effect on the financial statements. |
Because of its inherent limitations, internal control over financial reporting cannot provide absolute assurance of achieving financial reporting objectives. Internal control over financial reporting is a process that involves human diligence and compliance and is subject to lapses in judgment and breakdowns resulting from human failures. Internal control over financial reporting also can be circumvented by collusion or improper management override. Because of such limitations, there is a risk that material misstatements may not be prevented or detected on a timely basis by internal control over financial reporting. However, these inherent limitations are known features of the financial reporting process. Therefore, it is possible to design into the process safeguards to reduce, though not eliminate, this risk. Also, projections of any evaluation of effectiveness to future periods are subject to the risk that controls may become ineffective because of changes in conditions or that the degree of compliance with established policies or procedures may deteriorate.
155
Table of Contents
Management has used the framework set forth in the report entitled Internal Control-Integrated Framework published by the Committee of Sponsoring Organizations of the Treadway Commission, known as COSO, to evaluate the effectiveness of our internal control over financial reporting. Based on this assessment, management has concluded that our internal control over financial reporting was effective as of December 31, 2009.
Ernst & Young LLP, our independent registered public accounting firm, has issued an attestation report on our internal control over financial reporting which is included below.
Report of Independent Registered Public Accounting Firm
To the Board of Directors and Stockholders
Verenium Corporation
We have audited Verenium Corporation’s (the “Company”) internal control over financial reporting as of December 31, 2009, based on criteria established in Internal Control-Integrated Framework issued by the Committee of Sponsoring Organizations of the Treadway Commission (the “COSO criteria”). The Company’s management is responsible for maintaining effective internal control over financial reporting and for its assessment of the effectiveness of internal control over financial reporting included in the accompanying Management’s Report on Internal Control over Financial Reporting. Our responsibility is to express an opinion on the Company’s internal control over financial reporting based on our audit.
We conducted our audit in accordance with the standards of the Public Company Accounting Oversight Board (United States). Those standards require that we plan and perform the audit to obtain reasonable assurance about whether effective internal control over financial reporting was maintained in all material respects. Our audit included obtaining an understanding of internal control over financial reporting, assessing the risk that a material weakness exists, testing and evaluating the design and operating effectiveness of internal control based on the assessed risk, and performing such other procedures as we considered necessary in the circumstances. We believe that our audit provides a reasonable basis for our opinion.
A company’s internal control over financial reporting is a process designed to provide reasonable assurance regarding the reliability of financial reporting and the preparation of financial statements for external purposes in accordance with generally accepted accounting principles. A company’s internal control over financial reporting includes those policies and procedures that (1) pertain to the maintenance of records that, in reasonable detail, accurately and fairly reflect the transactions and dispositions of the assets of the company; (2) provide reasonable assurance that transactions are recorded as necessary to permit preparation of financial statements in accordance with generally accepted accounting principles, and that receipts and expenditures of the company are being made only in accordance with authorizations of management and directors of the company; and (3) provide reasonable assurance regarding prevention or timely detection of unauthorized acquisition, use, or disposition of the company’s assets that could have a material effect on the financial statements.
Because of its inherent limitations, internal control over financial reporting may not prevent or detect misstatements. Also, projections of any evaluation of effectiveness to future periods are subject to the risk that controls may become inadequate because of changes in conditions, or that the degree of compliance with the policies or procedures may deteriorate.
In our opinion, Verenium Corporation maintained, in all material aspects, effective internal control over financial reporting as of December 31, 2009, based on the COSO criteria.
We have also audited, in accordance with the standards of the Public Company Accounting Oversight Board (United States), the consolidated balance sheets of the Company as of December 31, 2009 and 2008 and the related consolidated statements of operations, stockholders’ (deficit) equity and cash flows for each of the
156
Table of Contents
three years in the period ended December 31, 2009, and our report dated March 15, 2010 expressed an unqualified opinion thereon that included an explanatory paragraph regarding Verenium Corporation’s ability to continue as a going concern.
/s/ Ernst & Young LLP
San Diego, California
March 15, 2010
| ITEM 9B. | OTHER INFORMATION. |
Not applicable.
PART III
| ITEM 10. | DIRECTORS, EXECUTIVE OFFICERS AND CORPORATE GOVERNANCE. |
Incorporated by reference to our Proxy Statement for our 2009 Annual Meeting of Stockholders to be filed with the Securities and Exchange Commission within 120 days after the close of the year ended December 31, 2009.
| ITEM 11. | EXECUTIVE COMPENSATION. |
Incorporated by reference to our Proxy Statement for our 2009 Annual Meeting of Stockholders to be filed with the Securities and Exchange Commission within 120 days after the close of the year ended December 31, 2009.
| ITEM 12. | SECURITY OWNERSHIP OF CERTAIN BENEFICIAL OWNERS AND MANAGEMENT AND RELATED STOCKHOLDER MATTERS. |
Incorporated by reference to our Proxy Statement for our 2009 Annual Meeting of Stockholders to be filed with the Securities and Exchange Commission within 120 days after the close of the year ended December 31, 2009.
| ITEM 13. | CERTAIN RELATIONSHIPS AND RELATED TRANSACTIONS, AND DIRECTOR INDEPENDENCE. |
Incorporated by reference to our Proxy Statement for our 2009 Annual Meeting of Stockholders to be filed with the Securities and Exchange Commission within 120 days after the close of the year ended December 31, 2009.
| ITEM 14. | PRINCIPAL ACCOUNTING FEES AND SERVICES. |
Incorporated by reference to our Proxy Statement for our 2009 Annual Meeting of Stockholders to be filed with the Securities and Exchange Commission within 120 days after the close of the year ended December 31, 2009.
157
Table of Contents
PART IV
| ITEM 15. | EXHIBITS AND FINANCIAL STATEMENT SCHEDULES. |
(a)(1) Index to Consolidated Financial Statements
| Page | ||
| 100 | ||
| 101 | ||
| 102 | ||
| 103 | ||
| 104 | ||
| 105 | ||
(a)(2) Financial Statement Schedules: All schedules have been omitted because they are not applicable or required, or the information required to be set forth therein is included in the Consolidated Financial Statements or notes thereto included in Item 8 (“Financial Statements and Supplementary Data”).
(a)(3) Index to Exhibits—See (b) below.
(b) Exhibits
| Exhibit |
Description of Exhibit | |
| 3.1 | Amended and Restated Certificate of Incorporation—filed as an exhibit to the Company’s Quarterly Report on Form 10-Q for the quarter ended March 31, 2000, filed with the Securities and Exchange Commission on May 12, 2000, and incorporated herein by reference. | |
| 3.2 | Certificate of Amendment of Restated Certificate of Incorporation—filed as an exhibit to the Company’s Annual Report on Form 10-K, filed with the Securities and Exchange Commission on March 16, 2007, and incorporated herein by reference. | |
| 3.3 | Certificate of Amendment of Restated Certificate of Incorporation—filed as an exhibit to the Company’s Current Report on Form 8-K, filed with the Securities and Exchange Commission on June 26, 2007, and incorporated herein by reference. | |
| 3.4 | Certificate of Amendment of Restated Certificate of Incorporation—filed as an exhibit to the Company’s Annual Report on Form 10-K for the year ended December 31, 2008, filed with the Securities and Exchange Commission on March 16, 2009, and incorporated herein by reference. | |
| 3.5 | Certificate of Amendment of Restated Certificate of Incorporation—filed as an exhibit to the Company’s Current Report on Form 8-K, filed with Securities and Exchange Commission on September 9, 2009, and incorporated herein by reference. | |
| 3.6 | Amended and Restated Bylaws—filed as an exhibit to the Company’s Quarterly Report on Form 10-Q for the quarter ended March 31, 2000 (File No. 000-29173), filed with the Securities and Exchange Commission on May 12, 2000, and incorporated herein by reference. | |
| 3.7 | Amendment to Bylaws of Verenium Corporation—filed as an exhibit to the Company’s Current Report on Form 8-K, filed with the Securities and Exchange Commission on March 27, 2007, and incorporated herein by reference. | |
158
Table of Contents
| Exhibit |
Description of Exhibit | |
| 4.1 | Form of Common Stock Certificate of the Company—filed as an exhibit to the Company’s Registration Statement on Form S-1 (No. 333-92853) filed with the Securities and Exchange Commission, as amended, and incorporated herein by reference. | |
| 4.2 | Rights Agreement by and between the Company and American Stock Transfer and Trust Company, as Rights Agent, dated as of December 13, 2000 (including the Form of Certificate of Designation of Series A Junior Participating Preferred Stock attached thereto as Exhibit A, the Form of Right Certificate attached thereto as Exhibit B, and the Summary of Rights to Purchase Preferred Shares attached thereto as Exhibit C)—filed as an exhibit to the Company’s Current Report on Form 8-K, filed with the Securities and Exchange Commission on December 15, 2000, and incorporated herein by reference. | |
| 4.3 | Amendment to Rights Agreement by and between the Company and American Stock Transfer and Trust Company, as Rights Agent, dated as of December 2, 2002—filed as an exhibit to the Company’s Current Report on Form 8-K, filed with the Securities and Exchange Commission on December 4, 2002, and incorporated herein by reference. | |
| 4.4 | Certificate of Designation of Series A Junior Participating Preferred Stock—filed as an exhibit to the Company’s Current Report on Form 8-K, filed with the Securities and Exchange Commission on December 15, 2000, and incorporated herein by reference. | |
| 4.5 | Second Amendment to Rights Agreement by and between the Company and American Stock Transfer and Trust Company, as Rights Agent, dated as of February 12, 2007—filed as an exhibit to the Company’s Current Report on Form 8-K, filed with the Securities and Exchange Commission on February 12, 2007, and incorporated herein by reference. | |
| 10.1 | Form of Indemnity Agreement entered into between the Company and its directors and executive officers—filed Filed as an exhibit to the Company’s Current Report on Form 8-K, filed with the Securities and Exchange Commission on November 7, 2007, and incorporated herein by reference. | |
| 10.2* | 1994 Diversa Employee Incentive and Non-Qualified Stock Option Plan, as amended—filed as an exhibit to the Company’s Registration Statement on Form S-1 (No. 333-92853) filed with the Securities and Exchange Commission, as amended, and incorporated herein by reference. | |
| 10.3* | Form of Stock Option Agreement under the 1994 Diversa Employee Incentive and Non-Qualified Stock Option Plan—filed as an exhibit to the Company’s Registration Statement on Form S-1 (No. 333-92853) filed with the Securities and Exchange Commission, as amended, and incorporated herein by reference. | |
| 10.4* | 1997 Equity Incentive Plan—filed as an exhibit to the Company’s Registration Statement on Form S-1 (No. 333-92853) filed with the Securities and Exchange Commission, as amended, and incorporated herein by reference. | |
| 10.5* | Form of Stock Option Grant Notice and Stock Option Agreement under the 1997 Equity Incentive Plan—filed as an exhibit to the Company’s Registration Statement on Form S-1 (No. 333-92853) filed with the Securities and Exchange Commission, as amended, and incorporated herein by reference. | |
| 10.6* | 1999 Non-Employee Directors’ Stock Option Plan—filed as an exhibit to the Company’s Registration Statement on Form S-1 (No. 333-92853) filed with the Securities and Exchange Commission, as amended, and incorporated herein by reference. | |
| 10.7* | Form of Stock Option Grant Notice and Related Stock Option Agreement under the 1999 Non-Employee Directors’ Stock Option Plan—filed as an exhibit to the Company’s Registration Statement on Form S-1 (No. 333-92853) filed with the Securities and Exchange Commission, as amended, and incorporated herein by reference. | |
159
Table of Contents
| Exhibit |
Description of Exhibit | |
| 10.8* | 2005 Non-Employee Directors’ Equity Incentive Plan—filed as an exhibit to the Company’s Proxy Statement on Form 14-A filed with the Securities and Exchange Commission on April 15, 2005, and incorporated herein by reference. | |
| 10.9* | 1999 Employee Stock Purchase Plan—filed as an exhibit to the Company’s Registration Statement on Form S-1 (No. 333-92853) filed with the Securities and Exchange Commission, as amended, and incorporated herein by reference. | |
| 10.10* | Verenium 2007 Equity Incentive Plan—filed as an exhibit to the Company’s Registration Statement on Form S-8 (File No. 333-145062), filed with the Securities and Exchange Commission on August 2, 2007, and incorporated herein by reference. | |
| 10.11* | Form of Executive Officer 2007 Equity Incentive Plan Option Agreement—filed as an exhibit to the Company’s Current Report on Form 8-K, filed with the Securities and Exchange Commission on July 25, 2007, and incorporated herein by reference. | |
| 10.12* | Form of Non-Executive Employee and Consultant 2007 Equity Incentive Plan Option Agreement—filed as an exhibit to the Company’s Current Report on Form 8-K, filed with the Securities and Exchange Commission on July 25, 2007, and incorporated herein by reference. | |
| 10.13* | Form of Stock Option Grant Notice and Form of Exercise for use in connection with Executive Officer 2007 Equity Incentive Plan Option Agreement and Non-Executive Employee and Consultant 2007 Equity Incentive Plan Option Agreement—filed as an exhibit to the Company’s Current Report on Form 8-K, filed with the Securities and Exchange Commission on July 25, 2007, and incorporated herein by reference. | |
| 10.14* | Form of Executive Officer 2007 Equity Incentive Plan Restricted Stock Bonus Agreement—filed as an exhibit to the Company’s Current Report on Form 8-K, filed with the Securities and Exchange Commission on July 25, 2007, and incorporated herein by reference. | |
| 10.15* | Form of Non-Executive Employee and Consultant 2007 Equity Incentive Plan Restricted Stock Bonus Agreement—filed as an exhibit to the Company’s Current Report on Form 8-K, filed with the Securities and Exchange Commission on July 25, 2007, and incorporated herein by reference. | |
| 10.16* | Form of Restricted Stock Bonus Grant Notice for use in connection with Executive Officer 2007 Equity Incentive Plan Restricted Stock Bonus Agreement and Non-Executive Employee and Consultant 2007 Equity Incentive Plan Restricted Stock Bonus Agreement—filed as an exhibit to the Company’s Current Report on Form 8-K, filed with the Securities and Exchange Commission on July 25, 2007, and incorporated herein by reference. | |
| 10.17* | Celunol Corp. (formerly known as BC International Corporation) 2006 Equity Incentive Plan—filed as an exhibit to the Company’s Registration Statement on Form S-8 (File No. 333-145062), filed with the Securities and Exchange Commission on August 2, 2007, and incorporated herein by reference. | |
| 10.18* | Celunol Corp. (formerly known as BC International Corporation) 2004 Equity Incentive Plan—filed as an exhibit to the Company’s Registration Statement on Form S-8 (File No. 333-145062), filed with the Securities and Exchange Commission on August 2, 2007, and incorporated herein by reference. | |
| 10.19* | Celunol Corp. (formerly known as BC International Corporation) 1998 Stock Plan—filed as an exhibit to the Company’s Registration Statement on Form S-8 (File No. 333-145062), filed with the Securities and Exchange Commission on August 2, 2007, and incorporated herein by reference. | |
160
Table of Contents
| Exhibit |
Description of Exhibit | |
| 10.20* | Celunol Corp. (formerly known as BC International Corporation) Stock Option Plan for Non-Employee Directors—filed as an exhibit to the Company’s Registration Statement on Form S-8 (File No. 333-145062), filed with the Securities and Exchange Commission on August 2, 2007, and incorporated herein by reference. | |
| 10.21† | Amended and Restated Stockholders’ Agreement by and among the Company and the Stockholders identified therein, dated January 25, 1999—filed as an exhibit to the Company’s Registration Statement on Form S-1 (No. 333-92853) filed with the Securities and Exchange Commission, as amended, and incorporated herein by reference. | |
| 10.22† | License Agreement by and between the Company and Finnfeeds International Limited (now Danisco Animal Nutrition), dated December 1, 1998—filed as an exhibit to the Company’s Registration Statement on Form S-1 (No. 333-92853) filed with the Securities and Exchange Commission, as amended, and incorporated herein by reference. | |
| 10.23 | Lease Agreement, dated February 11, 2000, by and between the Company and KR—Gateway Partners, LLC—filed as an exhibit to the Company’s Quarterly Report on Form 10-Q for the quarter ended March 31, 2000, filed with the Securities and Exchange Commission on May 12, 2000, and incorporated herein by reference. | |
| 10.24 | Lease Agreement, dated February 11, 2000, by and between the Company and KR—Gateway Partners, LLC—filed as an exhibit to the Company’s Quarterly Report on Form 10-Q for the quarter ended March 31, 2000, filed with the Securities and Exchange Commission on May 12, 2000, and incorporated herein by reference. | |
| 10.25† | Amended and Restated Research Collaboration Agreement dated as of January 3, 2003 between the Company and Syngenta Participations AG—filed as an exhibit to the Company’s Current Report on Form 8-K, filed with the Securities and Exchange Commission on January 6, 2003, and incorporated herein by reference. | |
| 10.26† | License Agreement dated December 29, 2003 by and between Xoma Ireland Limited and the Company—filed as an exhibit to the Company’s Current Report on Form 8-K, filed with the Securities and Exchange Commission on March 12, 2004, and incorporated herein by reference. | |
| 10.27† | Transition Agreement dated May 28, 2004 by and between the Company, Zymetrics, Inc., Syngenta Seeds AG, and Syngenta Participations AG—filed as an exhibit to the Company’s Quarterly Report on Form 10-Q for the quarter ended June 30, 2004, filed with the Securities and Exchange Commission on August 6, 2004, and incorporated herein by reference. | |
| 10.28† | Amendment dated May 28, 2004 to Amended and Restated Research Collaboration Agreement between the Company and Syngenta Participations AG—filed as an exhibit to the Company’s Quarterly Report on Form 10-Q for the quarter ended June 30, 2004, filed with the Securities and Exchange Commission on August 6, 2004, and incorporated herein by reference. | |
| 10.29 | Loan and Security Agreement by and between the Company and Comerica Bank dated September 30, 2005—filed as an exhibit to the Company’s Current Report on Form 8-K, filed with the Securities and Exchange Commission on October 6, 2005, and incorporated herein by reference. | |
| 10.30 | Purchase Agreement, dated March 22, 2007, among the Company and the Initial Purchasers identified therein—filed as an exhibit to the Company’s Current Report on Form 8-K, filed with the Securities and Exchange Commission on March 28, 2007, and incorporated herein by reference. | |
| 10.31* | Employee Invention, Non-Competition and Confidentiality Agreement, dated July 1, 2006, by and between Celunol Corp. and Carlos A. Riva—filed as an exhibit to the Company’s registration statement on Form S-4 (No. 333-141392), originally filed on March 19, 2007, as amended, and incorporated herein by reference. | |
161
Table of Contents
| Exhibit |
Description of Exhibit | |
| 10.32* | Employee Invention, Non-Competition and Confidentiality Agreement, dated May 17, 2006, by and between Celunol Corp. and John R. Malloy, Jr.—filed as an exhibit to the Company’s registration statement on Form S-4 (No. 333-141392), originally filed on March 19, 2007, as amended, and incorporated herein by reference. | |
| 10.33 | Indemnification Agreement, dated July 1, 2006, by and between Celunol Corp. and Carlos A. Riva—filed as an exhibit to the Company’s registration statement on Form S-4 (No. 333-141392), originally filed on March 19, 2007, as amended, and incorporated herein by reference. | |
| 10.34 | Indemnification Agreement, dated December, 2004, by and between Celunol Corp. and Joshua Ruch —filed as an exhibit to the Company’s registration statement on Form S-4 (No. 333-141392), originally filed on March 19, 2007, as amended, and incorporated herein by reference. | |
| 10.35 | Indemnification Agreement, dated December, 2004, by and between Celunol Corp. and Michael Zak—filed as an exhibit to the Company’s registration statement on Form S-4 (No. 333-141392), originally filed on March 19, 2007, as amended, and incorporated herein by reference. | |
| 10.36† | Consulting Agreement, dated December 20, 2004, by and between Celunol Corp. and Dr. Lonnie Ingram—filed as an exhibit to the Company’s registration statement on Form S-4 (No. 333-141392), originally filed on March 19, 2007, as amended, and incorporated herein by reference. | |
| 10.37† | Amended and Restated License Agreement by and between Celunol Corp. and University of Florida Research Foundation, Inc., dated October 26, 1995 with First Amendment, dated January 25, 2000, and Second Amendment, dated June 29, 2001—filed as an exhibit to the Company’s Amendment No. 2 to Registration Statement on Form S-4 (No. 333-141392), filed with the Securities and Exchange Commission on May 8, 2007, and incorporated herein by reference. | |
| 10.38† | Letter Agreement dated December 15, 2004 by and between Celunol Corp. and University of Florida Research Foundation, Inc.—filed as an exhibit to the Company’s Amendment No. 2 to Registration Statement on Form S-4 (No. 333-141392), filed with the Securities and Exchange Commission on May 8, 2007, and incorporated herein by reference. | |
| 10.39† | Research Agreement dated December 20, 2004 by and between Celunol Corp. and University of Florida Board of Trustees, as amended by Amendment No. 1 to the Research Agreement—filed as an exhibit to the Company’s Amendment No. 2 to Registration Statement on Form S-4 (No. 333-141392), filed with the Securities and Exchange Commission on May 8, 2007, and incorporated herein by reference. | |
| 10.40† | Joint Development and Technology Transfer Agreement, dated July 10, 2001 by and between Celunol Corp. and Marubeni Corporation and Tsukishima Kikai Co., Ltd., as amended by that certain memorandum dated July 10, 2001 and those certain letters dated January 9, 2006, January 24, 2006 and February 24, 2006—filed as an exhibit to the Company’s Amendment No. 2 to Registration Statement on Form S-4 (No. 333-141392), filed with the Securities and Exchange Commission on May 8, 2007, and incorporated herein by reference. | |
| 10.41† | Exclusive License Agreement, dated July 7, 2006, by and between Celunol Corp. and Kerry Group Services International Limited (KGSI)—filed as an exhibit to the Company’s Amendment No. 2 to Registration Statement on Form S-4 (No. 333-141392), filed with the Securities and Exchange Commission on May 8, 2007, and incorporated herein by reference. | |
| 10.42 | Office Lease Agreement for space at 55 Cambridge Parkway, Cambridge, MA, between 55 Cambridge Parkway, Inc. as landlord and Celunol Corp. as tenant, dated April 5, 2007—filed as an exhibit to the Company’s Amendment No. 2 to Registration Statement on Form S-4 (No. 333-141392), filed with the Securities and Exchange Commission on May 8, 2007, and incorporated herein by reference. | |
162
Table of Contents
| Exhibit |
Description of Exhibit | |
| 10.43† | Amended and Restated Fermentation Services Agreement between Diversa Corporation, and Fermic, S.A. de C.V., dated February 17, 2004—filed as an exhibit to the Company’s Annual Report on Form 10-K for the year ended December 31, 2007, filed with the Securities and Exchange Commission on March 17, 2008, and incorporated herein by reference. | |
| 10.44† | Amendment to Amended and Restated Fermentation Services Agreement between Diversa Corporation, and Fermic, S.A. de C.V., dated August 1, 2006—filed as an exhibit to the Company’s Annual Report on Form 10-K for the year ended December 31, 2007, filed with the Securities and Exchange Commission on March 17, 2008, and incorporated herein by reference. | |
| 10.45 | Fifth Amendment to Loan and Security Agreement dated as of February 22, 2008 by and between the Company and Comerica Bank—filed as an exhibit to the Company’s Current Report on Form 8-K, filed with the Securities and Exchange Commission on February 27, 2008, and incorporated herein by reference. | |
| 10.46 | Securities Purchase Agreement dated February 22, 2008, by and among the Company and the parties listed therein—filed as an exhibit to the Company’s Current Report on Form 8-K, filed with the Securities and Exchange Commission on February 25, 2008, and incorporated herein by reference. | |
| 10.47 | Upper Call Option Transaction—filed as an exhibit to the Company’s Current Report on Form 8-K, filed with the Securities and Exchange Commission on February 25, 2008, and incorporated herein by reference. | |
| 10.48 | Lower Call Option Transaction—filed as an exhibit to the Company’s Current Report on Form 8-K, filed with the Securities and Exchange Commission on February 25, 2008, and incorporated herein by reference. | |
| 10.49* | Employment Agreement, dated September 24, 2008, by and between the Company and Carlos A. Riva—filed as an exhibit to the Company’s Quarterly Report on Form 10-Q for the quarter ended September 30, 2008, filed with the Securities and Exchange Commission on November 10, 2008, and incorporated herein by reference. | |
| 10.50* | Employment Agreement, dated September 24, 2008, by and between the Company and William H. Baum—filed as an exhibit to the Company’s Quarterly Report on Form 10-Q for the quarter ended September 30, 2008, filed with the Securities and Exchange Commission on November 10, 2008, and incorporated herein by reference. | |
| 10.51* | Employment Agreement, dated September 24, 2008, by and between the Company and Gerald M. Haines II—filed as an exhibit to the Company’s Quarterly Report on Form 10-Q for the quarter ended September 30, 2008, filed with the Securities and Exchange Commission on November 10, 2008, and incorporated herein by reference. | |
| 10.52* | Employment Agreement, dated September 24, 2008, by and between the Company and Mary Ellen Jones—filed as an exhibit to the Company’s Quarterly Report on Form 10-Q for the quarter ended September 30, 2008, filed with the Securities and Exchange Commission on November 10, 2008, and incorporated herein by reference. | |
| 10.53* | Employment Agreement, dated September 24, 2008, by and between the Company and John R. Malloy, Jr.—filed as an exhibit to the Company’s Quarterly Report on Form 10-Q for the quarter ended September 30, 2008, filed with the Securities and Exchange Commission on November 10, 2008, and incorporated herein by reference. | |
| 10.54* | Employment Agreement, dated September 24, 2008, by and between the Company and Janet Roemer —filed as an exhibit to the Company’s Quarterly Report on Form 10-Q for the quarter ended September 30, 2008, filed with the Securities and Exchange Commission on November 10, 2008, and incorporated herein by reference. | |
163
Table of Contents
| Exhibit |
Description of Exhibit | |
| 10.55* | Employment Agreement, dated September 4, 2008, by and between the Company and Gregory L. Powers—filed as an exhibit to the Company’s Quarterly Report on Form 10-Q for the quarter ended September 30, 2008, filed with the Securities and Exchange Commission on November 10, 2008, and incorporated herein by reference. | |
| 10.56† | Joint Development and License Agreement, dated as of August 1, 2008, by and among Verenium Biofuels Corporation, BP Biofuels North America LLC and Galaxy Biofuels LLC—filed as an exhibit to the Company’s Quarterly Report on Form 10-Q for the quarter ended September 30, 2008, filed with the Securities and Exchange Commission on November 10, 2008, and incorporated herein by reference. | |
| 10.57* | Employment Agreement, dated January 13, 2009, by and between the Company and Jeffrey G. Black —filed as an exhibit to the Company’s Annual Report on Form 10-K for the year ended December 31, 2008, filed with the Securities and Exchange Commission on March 16, 2009, and incorporated herein by reference. | |
| 10.58† | Amended and Restated Liability Operating Agreement of Highlands Ethanol, LLC, dated February 18, 2009, by and between BP Biofuels North America, LLC, Verenium Biofuels Corporation and Highlands Ethanol, LLC—filed as an exhibit to the Company’s Quarterly Report on Form 10-Q for the quarter ended March 31, 2009, filed with the Securities and Exchange Commission on May 18, 2009, and incorporated herein by reference. | |
| 10.59* | Employment Agreement, dated April 24, 2009, by and between the Company and James E. Levine—filed as an exhibit to the Company’s Quarterly Report on Form 10-Q for the quarter ended March 31, 2009, filed with the Securities and Exchange Commission on May 18, 2009, and incorporated herein by reference. | |
| 10.60 | Form of Convertible Note Amendment Agreement, dated July 1, 2009, among the Company and certain holders of the Company’s 8% Senior Convertible Notes due April 1, 2012—filed as an exhibit to the Company’s Current Report on Form 8-K, filed with the Securities and Exchange Commission on July 1, 2009, and incorporated herein by reference. | |
| 10.61 | Form of Amended and Restated 8% Senior Convertible Note due April 1, 2012—filed as an exhibit to the Company’s Current Report on Form 8-K, filed with the Securities and Exchange Commission on July 1, 2009, and incorporated herein by reference. | |
| 10.62 | Form of Exchange Agreement, dated August 28, 2009, among the Company and certain holders of the Company’s 5.50% Convertible Senior Notes due 2027—filed as an exhibit to the Company’s Current Report on Form 8-K, filed with the Securities and Exchange Commission on September 4, 2009, and incorporated herein by reference. | |
| 10.63 | Pledge and Security Agreement, dated September 1, 2009, between the Company and Wells Fargo Bank, National Association, as collateral agent—filed as an exhibit to the Company’s Current Report on Form 8-K, filed with the Securities and Exchange Commission on September 4, 2009, and incorporated herein by reference. | |
| 10.64 | Intercreditor and Collateral Agency Agreement, dated September 1, 2009, among the Company, Wells Fargo Bank, National Association, as trustee, Wells Fargo Bank, National Association, as collateral agent, and the joined secured parties from time to time party thereto—filed as an exhibit to the Company’s Current Report on Form 8-K, filed with the Securities and Exchange Commission on September 4, 2009, and incorporated herein by reference. | |
164
Table of Contents
| Exhibit |
Description of Exhibit | |
| 10.65 | Indenture, dated September 1, 2009, between the Company and Wells Fargo Bank, National Association, a national banking association, as trustee, including the Form of 9.00% Convertible Senior Secured Note due 2027—filed as an exhibit to the Company’s Current Report on Form 8-K, filed with the Securities and Exchange Commission on September 4, 2009, and incorporated herein by reference. | |
| 10.66 | First Supplemental Indenture, dated September 25, 2009, between the Company and Wells Fargo Bank, National Association, a national banking association, as trustee—filed as an exhibit to the Company’s Quarterly Report on Form 10-Q for the quarter ended September 30, 2009, filed with the Securities and Exchange Commission on November 9, 2009, and incorporated herein by reference. | |
| 10.67 | Registration Rights Agreement dated as of December 3, 2002 among Syngenta Participations AG, Torrey Mesa Research Institute, Syngenta Seeds AG and the Company—filed as an exhibit to the Company’s Current Report on Form 8-K, filed with the Securities and Exchange Commission on January 6, 2003, and incorporated herein by reference. | |
| 10.68† | Registration Rights Agreement, dated as of July 18, 2003, by and between GlaxoGroup Limited and the Company—filed as an exhibit to the Company’s Quarterly Report on Form 10-Q for the quarter ended June 30, 2003, filed with the Securities and Exchange Commission on August 14, 2003, and incorporated herein by reference. | |
| 10.69 | Indenture, dated March 28, 2007, between the Company and Wells Fargo Bank, National Association, a national banking association, as trustee, including Form of 5.50% Convertible Senior Note due 2027—filed as an exhibit to the Company’s Current Report on Form 8-K, filed with the Securities and Exchange Commission on March 28, 2007, and incorporated herein by reference. | |
| 10.70 | Registration Rights Agreement, dated March 28, 2007, among the Company and the Initial Purchasers identified therein—filed as an exhibit to the Company’s Current Report on Form 8-K, filed with the Securities and Exchange Commission on March 28, 2007, and incorporated herein by reference. | |
| 10.71 | Senior Debt Indenture, dated November 14, 2007, between the Company and Wells Fargo Bank, National Association, a national banking association, as trustee—filed as an exhibit to the Company’s Registration Statement on Form S-3 (No. 333-147403) filed with the Securities and Exchange Commission on November 15, 2007, and incorporated herein by reference. | |
| 10.72 | Subordinated Debt Indenture, dated November 14, 2007, between the Company and Wells Fargo Bank, National Association, a national banking association, as trustee—filed as an exhibit to the Company’s Registration Statement on Form S-3 (No. 333-147403) filed with the Securities and Exchange Commission on November 15, 2007, and incorporated herein by reference. | |
| 10.73 | Form of Registration Rights Agreement—filed as an exhibit to the Company’s Current Report on Form 8-K, filed with the Securities and Exchange Commission on February 25, 2008, and incorporated herein by reference. | |
| 10.74 | Form of Warrant—filed as an exhibit to the Company’s Current Report on Form 8-K, filed with the Securities and Exchange Commission on February 25, 2008, and incorporated herein by reference. | |
| 10.75 | Form of Senior Convertible Note—filed as an exhibit to the Company’s Current Report on Form 8-K, filed with the Securities and Exchange Commission on February 25, 2008, and incorporated herein by reference. | |
| 10.76 | Form of Warrant issued by the Company to Syngenta Participations AG—filed as an exhibit to the Company’s Current Report on Form 8-K, filed with the Securities and Exchange Commission on January 6, 2003, and incorporated herein by reference. | |
165
Table of Contents
| Exhibit |
Description of Exhibit | |
| 10.77 | Form of Warrant—filed as an exhibit to the Company’s Current Report on Form 8-K, filed with the Securities and Exchange Commission on October 6, 2009 and incorporated herein by reference. | |
| 10.78†† | Separation Agreement, dated October 28, 2009, between the Company and Syngenta Participations AG.—filed herewith. | |
| 21.1 | Subsidiaries of the Company—filed herewith. | |
| 23.1 | Consent of Independent Registered Public Accounting Firm—filed herewith. | |
| 24.1 | Power of Attorney (included as part of the signature page). | |
| 31.1 | Certification of Chief Executive Officer pursuant to Rules 13a-14(a) and 15d-14(a) promulgated under the Securities and Exchange Act of 1934, as amended—filed herewith. | |
| 31.2 | Certification of Chief Financial Officer pursuant to Rules 13a-14(a) and 15d-14(a) promulgated under the Securities and Exchange Act of 1934, as amended—filed herewith. | |
| 32 | Certification of Chief Executive Officer and Chief Financial Officer pursuant to 18 U.S.C. Section 1350, as adopted pursuant to Section 906 of the Sarbanes-Oxley Act of 2002—filed herewith. | |
| * | Indicates management or compensatory plan or arrangement. |
| † | Confidential treatment has been granted with respect to portions of this exhibit. A complete copy of the agreement, including the redacted terms, has been separately filed with the Securities and Exchange Commission. |
| †† | Confidential treatment has been requested with respect to portions of this exhibit. A complete copy of the agreement, including redacted terms, has been separately filed with the Securities and Exchange Commission. |
166
Table of Contents
Pursuant to the requirements of Section 13 or 15(d) of the Securities Exchange Act of 1934, the Registrant has duly caused this Report to be signed on its behalf by the undersigned, thereunto duly authorized.
| VERENIUM CORPORATION | ||
| By: |
/s/ JAMES E. LEVINE | |
| James E. Levine | ||
| Executive Vice President and Chief Financial Officer | ||
Date: March 12, 2010
POWER OF ATTORNEY
KNOW ALL PERSONS BY THESE PRESENTS, that each person whose signature appears below constitutes and appoints Carlos A. Riva and Jamie E. Levine, and each of them, as his or her true and lawful attorneys-in-fact and agents, with full power of substitution and re-substitution, for him or her and in his or her name, place, and stead, in any and all capacities, to sign any and all amendments to this Report, and to file the same, with all exhibits thereto, and other documents in connection therewith, with the Securities and Exchange Commission, granting unto said attorneys-in-fact and agents, and each of them, full power and authority to do and perform each and every act and thing requisite and necessary to be done in connection therewith, as fully to all intents and purposes as he or she might or could do in person, hereby ratifying and confirming all that said attorneys-in-fact and agents, or any of them or their or his substitute or substituted, may lawfully do or cause to be done by virtue hereof.
Pursuant to the requirements of the Securities Exchange Act of 1934, this Report has been signed below by the following persons on behalf of the Registrant and in the capacities and on the dates indicated.
| Signature |
Title |
Date | ||
| /s/ CARLOS A. RIVA Carlos A. Riva |
President, Chief Executive Officer and Director (Principal Executive Officer) |
March 12, 2010 | ||
| /s/ JAMES E. LEVINE James E. Levine |
Executive Vice President and Chief Financial Officer (Principal Financial Officer) | March 12, 2010 | ||
| /s/ JEFFREY G. BLACK Jeffrey G. Black |
Senior Vice President and Chief Accounting Officer (Principal Accounting Officer) | March 12, 2010 | ||
| /s/ JAMES H. CAVANAUGH James H. Cavanaugh, Ph.D. |
Chairman of the Board of Directors | March 12, 2010 | ||
| /s/ JOHN F. DEE John F. Dee |
Director | March 12, 2010 | ||
| /s/ FERNAND J. KAUFMANN Fernand J. Kaufmann, Ph.D. |
Director | March 12, 2010 | ||
167
Table of Contents
| Signature |
Title |
Date | ||
| /s/ PETER JOHNSON Peter Johnson |
Director | March 12, 2010 | ||
| /s/ SIMON RICH Simon Rich |
Director | March 12, 2010 | ||
| /s/ JOSHUA RUCH Joshua Ruch |
Director | March 12, 2010 | ||
| /s/ CHERYL WENZINGER Cheryl Wenzinger |
Director | March 12, 2010 | ||
| /s/ MICHAEL ZAK Michael Zak |
Director | March 12, 2010 | ||
168