Attached files
| file | filename |
|---|---|
| 8-K - FORM 8K - PACIFIC OFFICE PROPERTIES TRUST, INC. | form8k.htm |
| EX-99.1 - PRESS RELEASE - PACIFIC OFFICE PROPERTIES TRUST, INC. | exh99_1.htm |
Pacific
Office Properties Trust, Inc.
Supplemental
Operating and Financial Information
For the
three months ended December 31, 2009
Pacific
Office Properties Trust, Inc.
2
Pacific
Office Properties Trust, Inc.
Corporate
Profile
Pacific
Office Properties Trust, Inc. (“The Company”) is a real estate investment trust
that acquires, owns, and operates office properties in the western U.S.,
focusing initially on the long-term growth sub-markets of Honolulu, San Diego,
Los Angeles, and Phoenix. The Company is externally managed by Pacific Office
Management, Inc., an affiliate of The Shidler Group. The Company
acquires, often in partnership with institutional co-investors, value-added
office buildings whose potential can be maximized through improvements,
repositioning, and superior leasing and management. The Company continues in the
tradition of The Shidler Group’s proven institutional joint-venture strategy,
which focuses on acquiring opportunistic and value-added commercial real estate
in partnership with institutional co-investors. More
information can be found on Pacific Office at www.pacificofficeproperties.com.
Investor
Information
|
Board
of Directors
|
Management
|
|||
|
Jay
H. Shidler
Chairman
of the Board,
Chair
of Investment Committee
Paul
M. Higbee
Director,
Chair of Audit Committee
Robert
L. Denton
Director
Thomas
R. Hislop
Director
|
Michael
W. Brennan
Director,
Chair of Compensation Committee
Clay
W. Hamlin
Director,
Chair of Nominating Committee
|
Pacific
Office Properties Trust, Inc.
|
Pacific
Office Management, Inc.
|
|
|
Jay
H. Shidler
President
and Chief Executive Officer
|
Jay
H. Shidler
President
and Chief Executive Officer
|
James
R. Ingebritsen
Executive
Vice President, Capital Markets/Operations
|
||
|
Lawrence
J. Taff
Chief
Financial Officer
|
Lawrence
J. Taff
Chief
Financial Officer
|
Tamara
G. Edwards
Corporate
Secretary
|
||
|
Matthew J. Root
Chief
Investment Officer
|
||||
Company
Information
|
Corporate
Headquarters
233
Wilshire Blvd., Suite 310
Santa
Monica, CA 90401
(T)
(310) 395-2083
(F)
(310) 395-2741
|
Trading
Symbol
PCE
Stock
Exchange Listing
NYSE
Amex
|
Inquiries
For
investor relations or media inquiries, contact:
|
|
|
Stacey
Feit, CFA
Vice
President
Financial
Relations Board
sfeit@mww.com
(T)
(213) 486-6549
(F)
(213) 233-3499
|
Lawrence
J. Taff
Chief
Financial Officer
ltaff@pacificofficeproperties.com
(T)
(808) 544-1219
|
||
3
Pacific
Office Properties Trust, Inc.
Note Regarding Forward-Looking
Statements
This
Supplemental Operating and Financial Information contains forward-looking
statements within the meaning of Section 21E of the Exchange Act, which include
information relating to future events, future financial performance, strategies,
expectations, risks and uncertainties. From time to time, we also
provide forward-looking statements in other materials we release to the public
as well as oral forward-looking statements. These forward-looking
statements include, without limitation, statements regarding: projections,
predictions, expectations, estimates or forecasts as to our business, financial
and operational results and future economic performance; statements regarding
strategic transactions such as mergers or acquisitions or a possible dissolution
of the Company; and statements of management’s goals and objectives and other
similar expressions.
We cannot
guarantee that any forward-looking statement will be realized, although we
believe we have been prudent in our plans and
assumptions. Achievement of future results is subject to risks,
uncertainties and potentially inaccurate assumptions. Should known or
unknown risks or uncertainties materialize, or should underlying assumptions
prove inaccurate, actual results could differ materially from past results and
those anticipated, estimated or projected. These factors include the
risks and uncertainties described in “Risk Factors” in our Annual Report on Form
10-K and our Quarterly Report on Form 10-Q. You should bear this in mind as you
consider forward-looking statements.
We
undertake no obligation to publicly update forward-looking statements, whether
as a result of new information, future events or otherwise. You are
advised, however, to consult any further disclosures we make on related subjects
in our other public filings made with the Securities and Exchange
Commission.
4
Pacific
Office Properties Trust, Inc.
|
Common
Stock and Unit Data
|
For
the three months ended
|
|||||||||||||||||||
|
December
31, 2009
|
September
30, 2009
|
June
30, 2009
|
March
31, 2009
|
December
31, 2008
|
||||||||||||||||
|
High
Closing Price
|
$ | 4.34 | $ | 4.38 | $ | 5.00 | $ | 5.50 | $ | 6.65 | ||||||||||
|
Low
Closing Price
|
$ | 3.03 | $ | 3.50 | $ | 3.65 | $ | 4.30 | $ | 2.52 | ||||||||||
|
Average
Closing Price
|
$ | 3.80 | $ | 3.85 | $ | 4.39 | $ | 4.89 | $ | 4.75 | ||||||||||
|
Closing
Price, at end of quarter
|
$ | 3.89 | $ | 4.34 | $ | 3.72 | $ | 5.00 | $ | 4.44 | ||||||||||
|
Common
shares and common units outstanding (in thousands)
|
18,150 | 18,150 | 17,360 | 17,330 | 17,330 | |||||||||||||||
|
Preferred
units - as-converted basis (in thousands)
|
32,598 | 32,598 | 32,598 | 32,598 | 32,598 | |||||||||||||||
|
Total
common shares and units outstanding - as-converted basis
(in
thousands)
|
50,747 | 50,747 | 49,958 | 49,928 | 49,928 | |||||||||||||||
|
Total
dividends per share, annualized
|
$ | 0.20 | $ | 0.20 | $ | 0.20 | $ | 0.20 | $ | 0.20 | ||||||||||
|
Annual
Dividend Yield – On Closing Price
|
5.14 | % | 4.61 | % | 5.38 | % | 4.00 | % | 4.50 | % | ||||||||||
Highlights
of Current Period Performance
Financial
Results
During
the quarter ended December 31, 2009, the Company changed the redemption features
of its Common and Preferred Units. The change to the Preferred Units
resulted in a one-time non-cash fair value adjustment charge of $58.6 million,
which represents the increase of the book value of the units to their fair
market value. The change also resulted in a reclassification of the
Non-Controlling Interests from the mezzanine equity section of the Company’s
balance sheet to permanent equity, thus increasing total equity.
Funds
from Operations, or FFO, totaled $(57.6) million, or $(3.17) per common
share/common unit – basic and diluted, for the fourth quarter of
2009. FFO excluding the fair value adjustment of the Preferred Units
totaled $1.1 million or $0.06 per common share/common unit – basic and diluted
for the fourth quarter of 2009. Net loss attributable to stockholders totaled
$12.2 million, or $3.17 net loss per basic and diluted common share, for the
fourth quarter of 2009.
Financing and Capital
Activity
|
Ø
|
On
December 3, 2009, our Board of Directors declared a cash dividend of $0.05
per share of our common stock for the fourth quarter of 2009. The dividend
was paid on January 15, 2010 to holders of record of common stock on
December 31, 2009. Commensurate with our declaration of a quarterly cash
dividend, we paid distributions to holders of record of Common Units at
December 31, 2009 in the amount of $0.05 per Common Unit, on January 15,
2010. In addition, we paid 2% distributions, or $.125 per unit, to holders
of record of Preferred Units at December 31, 2009, on January 15,
2010.
|
|
Ø
|
As
of December 31, 2009, the Company’s current total market capitalization is
$625.0 million, including approximately $197.4 million in equity on a
fully diluted basis, based on our closing price on the NYSE
Amex.
|
5
Pacific
Office Properties Trust, Inc.
Financial and Portfolio
Highlights
(unaudited
and in thousands, except property portfolio data, share price data and
percentages)
|
December
31, 2009
|
September
30, 2009
|
June
30, 2009
|
March
31, 2009
|
December
31, 2008
|
||||||||||||||||
|
Property Portfolio
|
||||||||||||||||||||
|
Number of
|
||||||||||||||||||||
|
Consolidated
Properties
|
8 | 8 | 8 | 8 | 8 | |||||||||||||||
|
Unconsolidated
Joint Venture Properties
|
16 | 15 | 15 | 15 | 15 | |||||||||||||||
| 24 | 23 | 23 | 23 | 23 | ||||||||||||||||
|
Square
Footage
|
||||||||||||||||||||
|
Consolidated
Properties
|
2,265,339 | 2,265,339 | 2,265,339 | 2,265,339 | 2,265,339 | |||||||||||||||
|
Unconsolidated
Joint Venture Properties
|
2,417,359 | 2,060,855 | 2,060,855 | 2,060,855 | 2,065,052 | |||||||||||||||
| 4,682,698 | 4,326,194 | 4,326,194 | 4,326,194 | 4,330,391 | ||||||||||||||||
|
Capitalization Summary
|
||||||||||||||||||||
|
Common
Shares
|
3,851 | 3,851 | 3,061 | 3,031 | 3,031 | |||||||||||||||
|
Common
Units
|
14,299 | 14,299 | 14,299 | 14,299 | 14,299 | |||||||||||||||
| 18,150 | 18,150 | 17,360 | 17,330 | 17,330 | ||||||||||||||||
|
Convertible
Preferred Units as converted to Common Units
|
||||||||||||||||||||
|
(4,545,300
Preferred Units converted at a 7.1717x conversion ratio)
|
32,598 | 32,598 | 32,598 | 32,598 | 32,598 | |||||||||||||||
| 50,748 | 50,748 | 49,958 | 49,928 | 49,928 | ||||||||||||||||
|
Valuation
|
||||||||||||||||||||
|
Closing
Common Share Price
|
$ | 3.89 | $ | 4.34 | $ | 3.72 | $ | 5.00 | $ | 4.44 | ||||||||||
|
Market
Value of Common Shares
|
$ | 14,980 | $ | 16,713 | $ | 11,387 | $ | 15,155 | $ | 13,457 | ||||||||||
|
Market
Value of Common Shares and Equivalents (as converted)
|
$ | 182,429 | $ | 203,533 | $ | 174,457 | $ | 234,485 | $ | 208,223 | ||||||||||
|
Total
Equity Market Capitalization
|
$ | 197,410 | $ | 220,246 | $ | 185,844 | $ | 249,640 | $ | 221,680 | ||||||||||
|
Total
Consolidated Debt
|
$ | 427,543 | $ | 424,451 | $ | 424,280 | $ | 423,856 | $ | 423,884 | ||||||||||
|
Total
Market Capitalization
|
$ | 624,953 | $ | 644,697 | $ | 610,124 | $ | 673,496 | $ | 645,564 | ||||||||||
|
Total
Consolidated Debt to Total Market Capitalization
|
68.41 | % | 65.84 | % | 69.54 | % | 62.93 | % | 65.66 | % | ||||||||||
6
Pacific
Office Properties Trust, Inc.
Financial and Portfolio
Highlights, continued
(unaudited
and in thousands, except share/unit data, ratios and percentages)
|
For
the three months ended
|
||||||||||||||||||||
|
December
31, 2009
|
September
30, 2009
|
June
30, 2009
|
March
31, 2009
|
December
31, 2008
|
||||||||||||||||
|
Income Items
|
||||||||||||||||||||
|
Total
Revenues
|
$ | 18,106 | $ | 17,744 | $ | 18,019 | $ | 18,770 | $ | 19,848 | ||||||||||
|
Equity
in Net Earnings (Loss) of Unconsolidated Joint Ventures
|
$ | (93 | ) | $ | 189 | $ | 163 | $ | 54 | $ | (63 | ) | ||||||||
|
Net
Loss Attributable to Stockholders
|
$ | (12,200 | ) | $ | (1,241 | ) | $ | (1,116 | ) | $ | (1,056 | ) | $ | (1,163 | ) | |||||
|
FFO(1)
|
$ | (57,575 | ) | $ | 862 | $ | 1,240 | $ | 1,164 | $ | 764 | |||||||||
|
FFO
(per common share/common unit)
(1)
|
$ | (3.17 | ) | $ | 0.05 | $ | 0.07 | $ | 0.07 | $ | 0.04 | |||||||||
|
FFO(1)
excluding the fair value adjustment of
Preferred Units
|
$ | 1,070 | $ | 862 | $ | 1,240 | $ | 1,164 | $ | 764 | ||||||||||
|
FFO
excluding the fair value adjustment of Preferred Units (per common
share/unit)
(2)
|
$ | 0.06 | $ | 0.05 | $ | 0.07 | $ | 0.07 | $ | 0.04 | ||||||||||
|
AFFO(1)
|
$ | 1,433 | $ | 1,821 | $ | 1,952 | $ | 2,164 | $ | 1,201 | ||||||||||
|
AFFO(1)(per
common share/common unit)
|
$ | 0.08 | $ | 0.10 | $ | 0.11 | $ | 0.12 | $ | 0.07 | ||||||||||
|
Ratios
|
||||||||||||||||||||
|
FFO
Payout Ratio (per common share/common unit)
(2)
|
(5) | 105.3 | % | 70.0 | % | 74.4 | % | 113.4 | % | |||||||||||
|
FFO
Payout Ratio excluding the fair value adjustment of the Preferred Units
(per common share/common unit)
(5)
|
84.8 | % | 105.3 | % | 70.0 | % | 74.4 | % | 113.4 | % | ||||||||||
|
AFFO
Payout Ratio (per common share/common unit)
(3)
|
63.3 | % | 49.8 | % | 44.5 | % | 40.0 | % | 72.1 | % | ||||||||||
|
Interest
Coverage Ratio
(4)
|
1.22 | x | 1.19 | x | 1.25 | x | 1.24 | x | 1.17 | x | ||||||||||
1 A
description of these non-GAAP measures and reconciliations is provided on pages
10 through 11 .
2
Calculated as dividends for the respective quarters accrued to common
stockholders and unitholders divided by Funds from Operations
(FFO).
3
Calculated as dividends for the respective quarters accrued to common
stockholders and unitholders divided by Adjusted Funds from Operations
(AFFO).
4
Calculated as EBITDA divided by total interest expense.
5
Management believes that this calculation that includes the one-time non-cash
charge related to the Preferred Unit Valuation is not indicative of past or
future performance.
7
Pacific
Office Properties Trust, Inc.
Consolidated Balance
Sheets1
(unaudited
and in thousands)
|
December
31, 2009
|
September
30, 2009
|
June
30, 2009
|
March
31, 2009
|
December
31, 2008
|
||||||||||||||||
|
ASSETS
|
||||||||||||||||||||
|
Investments
in real estate
|
$ | 418,980 | $ | 417,873 | $ | 416,211 | $ | 414,435 | $ | 413,914 | ||||||||||
|
Less:
accumulated depreciation
|
(36,030 | ) | (32,442 | ) | (28,646 | ) | (24,859 | ) | (21,257 | ) | ||||||||||
|
Investments
in real estate, net
|
382,950 | 385,431 | 387,565 | 389,576 | 392,657 | |||||||||||||||
|
Cash
and cash equivalents
|
3,195 | 3,405 | 6,881 | 6,537 | 4,463 | |||||||||||||||
|
Restricted
cash
|
6,507 | 5,444 | 5,055 | 5,266 | 7,267 | |||||||||||||||
|
Rents
and other receivables, net
|
6,471 | 6,004 | 5,729 | 5,387 | 6,342 | |||||||||||||||
|
Intangible
assets, net
|
33,228 | 35,079 | 36,875 | 38,925 | 41,379 | |||||||||||||||
|
Other
assets, net
|
5,055 | 5,822 | 5,080 | 5,383 | 4,680 | |||||||||||||||
|
Goodwill
|
62,019 | 62,019 | 62,019 | 62,019 | 61,519 | |||||||||||||||
|
Investment
in unconsolidated joint ventures
|
10,911 | 10,016 | 10,376 | 11,149 | 11,590 | |||||||||||||||
|
Total
Assets
|
$ | 510,336 | $ | 513,220 | $ | 519,580 | $ | 524,242 | $ | 529,897 | ||||||||||
|
LIABILITIES
AND EQUITY
|
||||||||||||||||||||
|
Mortgage
and other collateralized loans, net
|
$ | 406,439 | $ | 403,347 | $ | 400,504 | $ | 400,080 | $ | 400,108 | ||||||||||
|
Unsecured
notes payable to related parties
|
21,104 | 21,104 | 23,776 | 23,776 | 23,776 | |||||||||||||||
|
Accounts
payable and other liabilities
|
22,000 | 20,257 | 21,692 | 18,970 | 17,088 | |||||||||||||||
|
Acquired
below market leases, net
|
9,512 | 9,997 | 10,578 | 11,186 | 11,817 | |||||||||||||||
|
Total
Liabilities
|
459,055 | 454,705 | 456,550 | 454,012 | 452,789 | |||||||||||||||
|
EQUITY:
|
||||||||||||||||||||
|
Preferred
Stock (including Proportionate Voting Preferred Stock)
|
- | - | - | - | - | |||||||||||||||
|
Common
Stock (including Class B Common Stock)
|
185 | 185 | 185 | 185 | 185 | |||||||||||||||
|
Additional
paid-in capital
|
- | - | - | - | - | |||||||||||||||
|
Retained
deficit
|
(132,511 | ) | (72,349 | ) | (58,965 | ) | (70,072 | ) | (56,327 | ) | ||||||||||
|
Total
shareholders’ equity
|
(132,326 | ) | (72,164 | ) | (58,780 | ) | (69,887 | ) | (56,142 | ) | ||||||||||
|
Non-controlling
interests
|
183,607 | 130,679 | 121,810 | 140,117 | 133,250 | |||||||||||||||
|
Total
equity
|
51,281 | 58,515 | 63,030 | 70,230 | 77,108 | |||||||||||||||
|
Total
liabilities and equity
|
$ | 510,336 | $ | 513,220 | $ | 519,580 | $ | 524,242 | $ | 529,897 | ||||||||||
1 During the fourth quarter of 2009, the
Company made changes to the redemption features of the Common and Preferred
Units which allowed the Non-Controlling Interests to be classified as permanent
equity as of December 31, 2009. For comparative purposes, the Company
is presenting the Non-Controlling Interests as part of permanent equity even
though they were not classified as such until December
2009.
8
Pacific
Office Properties Trust, Inc.
Consolidated Statements of
Operations
(unaudited
and in thousands, except share and per share data)
|
For
the three months ended
|
||||||||||||||||||||
|
December
31, 2009
|
September
30, 2009
|
June
30, 2009
|
March
31, 2009
|
December
31, 2008
|
||||||||||||||||
|
Revenue:
|
||||||||||||||||||||
|
Rental
|
$ | 10,463 | $ | 10,486 | $ | 10,607 | $ | 10,906 | $ | 11,046 | ||||||||||
|
Tenant
reimbursements
|
5,478 | 5,163 | 5,299 | 5,722 | 6,635 | |||||||||||||||
|
Parking
|
2,070 | 2,012 | 2,011 | 2,057 | 2,035 | |||||||||||||||
|
Other
|
95 | 83 | 102 | 85 | 49 | |||||||||||||||
|
Total
revenue
|
18,106 | 17,744 | 18,019 | 18,770 | 19,765 | |||||||||||||||
|
Expenses:
|
||||||||||||||||||||
|
Rental
property operating
|
10,124 | 9,781 | 9,660 | 9,915 | 11,302 | |||||||||||||||
|
General
and administrative
|
652 | 351 | 497 | 1,149 | 740 | |||||||||||||||
|
Depreciation
and amortization
|
6,770 | 6,913 | 7,030 | 6,527 | 6,792 | |||||||||||||||
|
Interest
|
6,703 | 6,823 | 6,806 | 6,719 | 7,110 | |||||||||||||||
|
Loss
on extinguishment of debt
|
- | 171 | - | - | - | |||||||||||||||
|
Total
expenses
|
24,249 | 24,039 | 23,993 | 24,310 | 25,944 | |||||||||||||||
|
Loss
before equity in net earnings (loss) of unconsolidated joint ventures and
non-operating income
|
(6,143 | ) | (6,295 | ) | (5,974 | ) | (5,540 | ) | (6,179 | ) | ||||||||||
|
Equity
in net earnings (loss) of unconsolidated joint ventures
|
(93 | ) | 189 | 163 | 54 | (63 | ) | |||||||||||||
|
Non-operating
income
|
428 | 2 | 1 | 3 | 85 | |||||||||||||||
|
Net
loss
|
(5,808 | ) | (6,104 | ) | (5,810 | ) | (5,483 | ) | (6,157 | ) | ||||||||||
|
Fair
value adjustment of Preferred Units
|
(58,645 | ) | - | - | - | - | ||||||||||||||
|
Net
loss attributable to non-controlling interests
|
52,253 | 4,863 | 4,694 | 4,427 | 4,994 | |||||||||||||||
|
Net
loss attributable to common stockholders
|
$ | (12,200 | ) | $ | (1,241 | ) | $ | (1,116 | ) | $ | (1,056 | ) | (1,163 | ) | ||||||
|
Net
loss per common share - basic and diluted
|
$ | (3.17 | ) | $ | (0.40 | ) | $ | (0.37 | ) | $ | (0.35 | ) | (0.38 | ) | ||||||
|
Weighted
average number of common shares outstanding - basic and
diluted
|
3,850,520 | 3,112,888 | 3,034,122 | 3,031,125 | 3,031,125 | |||||||||||||||
9
Pacific
Office Properties Trust, Inc.
Funds From Operations (FFO)
and Adjusted Funds From Operations(AFFO)
(unaudited
and in thousands, except share and per share data)
|
December
31, 2009
|
September
30, 2009
|
June
30, 2009
|
March
31, 2009
|
December
31, 2008
|
||||||||||||||||
|
Reconciliation of Net Loss to FFO
(1):
|
||||||||||||||||||||
|
Net
loss attributable to stockholders
|
$ | (12,200 | ) | $ | (1,241 | ) | $ | (1,116 | ) | $ | (1,056 | ) | $ | (1,163 | ) | |||||
|
Add: Depreciation
and amortization of real estate assets
|
6,770 | 6,913 | 7,030 | 6,527 | 6,792 | |||||||||||||||
|
Add: Depreciation
and amortization of real estate assets – unconsolidated joint
ventures
|
676 | 621 | 588 | 688 | 697 | |||||||||||||||
|
Less: Distributions
to preferred unit holders
|
(568 | ) | (568 | ) | (568 | ) | (568 | ) | (568 | ) | ||||||||||
|
Less: Net
loss attributable to non-controlling interests
|
(52,253 | ) | (4,863 | ) | (4,694 | ) | (4,427 | ) | (4,994 | ) | ||||||||||
|
FFO
|
$ | (57,575 | ) | $ | 862 | $ | 1,240 | $ | 1,164 | $ | 764 | |||||||||
|
Reconciliation
of FFO to FFO excluding fair value
adjustment
of Preferred Units:
|
||||||||||||||||||||
|
FFO
|
$ | (57,575 | ) | $ | 862 | $ | 1,240 | $ | 1,164 | $ | 764 | |||||||||
|
Add: Fair
value adjustment of Preferred Units
|
58,645 | - | - | - | - | |||||||||||||||
|
FFO
excluding fair value adjustment of Preferred Units
|
$ | 1,070 | $ | 862 | $ | 1,240 | $ | 1,164 | $ | 764 | ||||||||||
|
Reconciliation of FFO to AFFO(2):
|
||||||||||||||||||||
|
FFO
|
$ | (57,575 | ) | $ | 862 | $ | 1,240 | $ | 1,164 | $ | 764 | |||||||||
|
Fair
value adjustment of Preferred Units
|
58,645 | - | - | - | - | |||||||||||||||
|
Straight-line
rent adjustments, net
|
150 | 281 | 84 | 226 | (147 | ) | ||||||||||||||
|
Amortization
of interest rate contracts, loan premiums and prepaid
financings
|
286 | 368 | 435 | 411 | 426 | |||||||||||||||
|
Recurring
capital expenditures, tenant improvements and leasing
commissions
|
(533 | ) | (193 | ) | (299 | ) | (114 | ) | (319 | ) | ||||||||||
|
Non-cash
compensation expense
|
50 | 50 | 49 | 40 | 40 | |||||||||||||||
|
Interest
expense deferred on unsecured notes payable
|
410 | 453 | 443 | 437 | 437 | |||||||||||||||
|
AFFO
|
$ | 1,433 | $ | 1,821 | $ | 1,952 | $ | 2,164 | $ | 1,201 | ||||||||||
|
Weighted
average number of common shares and common share equivalents
outstanding - basic and diluted
|
18,150 | 17,412 | 17,333 | 17,330 | 17,330 | |||||||||||||||
|
FFO
per share/unit – basic and diluted
|
$ | (3.17 | ) | $ | 0.05 | $ | 0.07 | $ | 0.07 | $ | 0.04 | |||||||||
|
FFO
excluding fair value adjustment of Preferred Units
per share/unit – basic and diluted
|
$ | 0.06 | $ | 0.05 | $ | 0.07 | $ | 0.07 | $ | 0.04 | ||||||||||
|
AFFO
per share/unit – basic and diluted
|
$ | 0.08 | $ | 0.10 | $ | 0.11 | $ | 0.12 | $ | 0.07 | ||||||||||
10
Pacific
Office Properties Trust, Inc.
Funds From Operations and
Adjusted Funds From Operations (continued)
|
|
(unaudited
and in thousands, except share and per share
data)
|
|
|
|
1
|
Funds
from Operations, or FFO, is a widely recognized measure of REIT
performance. We calculate FFO as defined by the National Association of
Real Estate Investment Trusts, or NAREIT. FFO represents net income (loss)
attributable to stockholders (as computed in accordance with accounting
principles generally accepted in the United States of America, or GAAP),
excluding gains (or losses) from dispositions of property, extraordinary
items, real estate-related depreciation and amortization (including
capitalized leasing expenses, tenant allowances or improvements and
excluding amortization of deferred financing costs) and after adjustments
for unconsolidated partnerships and joint ventures. Management uses FFO as
a supplemental performance measure because, in excluding real
estate-related depreciation and amortization, gains (or losses) from
property dispositions and extraordinary items, it provides a performance
measure that, when compared year over year, captures trends in occupancy
rates, rental rates and operating costs. We also believe that, as a widely
recognized measure of the performance of REITs, FFO will be used by
investors as a basis to compare our operating performance with that of
other REITs.
|
However,
because FFO excludes depreciation and amortization and captures neither the
changes in the value of our properties that result from use or market conditions
nor the level of capital expenditures and leasing commissions necessary to
maintain the operating performance of our properties, all of which have real
economic effect and could materially impact our results from operations, the
utility of FFO as a measure of our performance is limited. Other Equity REITs
may not calculate FFO in accordance with the NAREIT definition and, accordingly,
our FFO may not be comparable to such other Equity REITs' FFO. As a result, FFO
should be considered only as a supplement to net income (loss) as a measure of
our performance. FFO should not be used as a measure of our liquidity, nor is it
indicative of funds available to fund our cash needs, including our ability to
pay dividends or make distributions. FFO also should not be used as a supplement
to or substitute for cash flow from operating activities (computed in accordance
with GAAP).
The
weighted average number of common shares and common share equivalents
outstanding – basic and diluted includes common unit limited partnership
interests in our Operating Partnership.
Our
outstanding preferred unit interests in our Operating Partnership are
convertible into common unit limited partnership interests in our Operating
Partnership, but no earlier than the later of March 19, 2010 and the date an
underwritten public equity offering of our common stock in an amount equal to or
greater than $75 million is consummated, which is a contingent event as of
December 31, 2009. These common unit interests will become exchangeable for
shares of our common stock one year after such conversion. Our outstanding
preferred unit interests at December 31, 2009 represent 32,597,528 common share
equivalents, on an as-if converted basis, and any impact related to these
outstanding limited preferred interests have not been included in our
calculation of diluted earnings per share or FFO per share, including our
calculation of the weighted average number of common and common equivalent
shares outstanding, in accordance with GAAP. Assuming the full conversion of our
outstanding preferred unit interests at December 31, 2009, September 30, 2009,
June 30, 2009, March 31, 2009, December 31, 2008, our FFO per share/unit, on a
fully diluted basis, would have been $(1.13), $0.02, $0.02, $0.02 and $0.02,
respectively. Assuming the full conversion of our outstanding preferred unit
interests at December 31, 2009, our FFO excluding the fair value adjustment for
the Preferred Units per share/unit would have been $0.02 for the three months
then ended.
|
2
|
AFFO
is a non-GAAP financial measure we believe is a useful supplemental
measure of our performance. We compute AFFO by subtracting from
FFO the straight-line rent adjustments and recurring capital expenditures,
tenant improvements and leasing commissions, and then adding the
amortization of interest rate contracts, loan premium and prepaid
financing costs, non-cash compensation expense, and interest expense
deferred on unsecured notes. AFFO is not intended to represent
cash flow for the period, and it only provides an additional perspective
on our ability to fund cash needs and make distributions to shareholders
by adjusting the effect of the non-cash items included in FFO, as well as
recurring capital expenditures and leasing costs. We believe
that net income or loss is the most directly comparable GAAP financial
measure to AFFO. We also believe that AFFO provides useful
information to the investment community about the Company’s financial
position as compared to other REITs since AFFO is a widely reported
measure used by other REITs. However, other REITs may use
different methodologies for calculating AFFO and, accordingly, our AFFO
may not be comparable to other REITs. Assuming the full conversion of our
outstanding preferred unit interests at December 31, 2009, September 30,
2009, June 30, 2009, March 31, 2009 and December 31, 2008, our AFFO per
share/unit, on a fully diluted basis, would have been $0.03, $0.04, $0.04,
$0.04 and $0.02, respectively.
|
11
Pacific
Office Properties Trust, Inc.
Earnings Before Interest,
Taxes and Depreciation and Amortization (EBITDA)
(unaudited
and in thousands)
|
For
the three months ended
|
||||||||||||||||||||
|
December
31, 2009
|
September
30, 2009
|
June
30, 2009
|
March
31, 2009
|
December
31, 2008
|
||||||||||||||||
|
Reconciliation
of net loss to earnings before interest
|
||||||||||||||||||||
|
taxes
and depreciation and amortization (EBITDA) (1)
(2):
|
||||||||||||||||||||
|
Net
loss attributable to common stockholders
|
$ | (12,200 | ) | $ | (1,241 | ) | $ | (1,116 | ) | $ | (1,056 | ) | $ | (1,163 | ) | |||||
|
Interest
expense
|
6,703 | 6,823 | 6,806 | 6,719 | 7,110 | |||||||||||||||
|
Interest
expense – unconsolidated joint ventures
|
611 | 558 | 530 | 527 | 588 | |||||||||||||||
|
Depreciation
and amortization of real estate assets
|
6,770 | 6,913 | 7,030 | 6,527 | 6,792 | |||||||||||||||
|
Depreciation
and amortization of real estate assets – unconsolidated joint
ventures
|
676 | 621 | 588 | 688 | 697 | |||||||||||||||
|
Net
loss attributable to non-controlling interests
|
(52,253 | ) | (4,863 | ) | (4,694 | ) | (4,427 | ) | (4,994 | ) | ||||||||||
|
Fair
value adjustment of Preferred Units
|
58,645 | - | - | - | - | |||||||||||||||
|
EBITDA
|
$ | 8,952 | $ | 8,811 | $ | 9,144 | $ | 8,978 | $ | 9,030 | ||||||||||
|
|
|
1
|
Management
believes that earnings before interest expense, depreciation and
amortization, and net loss attributable to non-controlling interests
(EBITDA) is a useful supplemental measure of our
performance. We believe that EBITDA provides useful information
to the investment community about the Company’s financial position before
the impact of investing and financing transactions and facilitates
comparisons with other REITs. Accordingly, EBITDA should not be
considered as an alternative to cash flows from operating activities (as
computed in accordance with GAAP) as a measure of
liquidity. EBITDA should not be considered as an alternative to
net income (loss) as an indicator of our operating
performance. Other REITs may use different methodologies for
calculating EBITDA and accordingly, our EBITDA may not be comparable to
other REITs.
|
|
2
|
Management
has excluded the one-time non-cash fair value adjustment of the Preferred
Units from EBITDA because it is a non-operating
charge.
|
12
Pacific
Office Properties Trust, Inc.
Condensed Combined Balance
Sheets - Unconsolidated Joint Ventures(4)
(unaudited
and in thousands)
|
December
31, 2009
|
September
30, 2009
|
June
30, 2009
|
March
31, 2009
|
December
31, 2008
|
||||||||||||||||
|
ASSETS
|
||||||||||||||||||||
|
Investment
in real estate
|
$ | 428,014 | $ | 354,899 | $ | 354,896 | $ | 353,516 | $ | 353,181 | ||||||||||
|
Less:
accumulated depreciation
|
(27,314 | ) | (26,142 | ) | (24,215 | ) | (20,619 | ) | (16,772 | ) | ||||||||||
|
Investment
in real estate, net
|
400,700 | 328,757 | 330,681 | 332,897 | 336,409 | |||||||||||||||
|
Cash
and cash equivalents, including restricted cash
|
22,177 | 18,202 | 17,638 | 19,986 | 17,800 | |||||||||||||||
|
Rents
and other receivables, net
|
7,513 | 7,081 | 6,238 | 6,024 | 5,285 | |||||||||||||||
|
Intangible
assets, net
|
26,568 | 28,214 | 29,943 | 30,325 | 32,879 | |||||||||||||||
|
Other
assets
|
4,967 | 4,744 | 5,299 | 5,708 | 5,604 | |||||||||||||||
|
Total
assets
|
$ | 461,925 | $ | 386,998 | $ | 389,799 | $ | 394,940 | $ | 397,321 | ||||||||||
|
LIABILITIES
AND MEMBERS’ EQUITY
|
||||||||||||||||||||
|
Mortgage
and other secured loans
|
$ | 366,543 | $ | 318,091 | $ | 318,134 | $ | 318,177 | $ | 314,324 | ||||||||||
|
Accounts
payable and other liabilities
|
10,298 | 7,958 | 7,334 | 9,320 | 11,380 | |||||||||||||||
|
Acquired
below market leases, net
|
4,558 | 5,146 | 5,659 | 6,183 | 6,737 | |||||||||||||||
|
Total
liabilities
|
381,399 | 331,195 | 331,127 | 333,680 | 332,441 | |||||||||||||||
|
Members'
equity
|
80,526 | 55,803 | 58,672 | 61,260 | 64,880 | |||||||||||||||
|
Total
liabilities and members' equity
|
$ | 461,925 | $ | 386,998 | $ | 389,799 | $ | 394,940 | $ | 397,321 | ||||||||||
13
Pacific
Office Properties Trust, Inc.
Condensed Combined
Statements of Operations - Unconsolidated Joint Ventures
(unaudited
and in thousands)
|
For
three months ended
|
||||||||||||||||||||
|
December
31, 2009
|
September
30, 2009
|
June
30,2009
|
March
31, 2009
|
December
31, 2008
|
||||||||||||||||
|
Revenue:
|
||||||||||||||||||||
|
Rental
|
$ | 9,314 | $ | 9,513 | $ | 9,433 | $ | 9,309 | $ | 9,208 | ||||||||||
|
Tenant
reimbursements
|
1,345 | 1,689 | 1,581 | 1,651 | 1,625 | |||||||||||||||
|
Parking
|
353 | 390 | 379 | 401 | 370 | |||||||||||||||
|
Interest
and other
|
48 | 81 | 67 | 113 | 129 | |||||||||||||||
|
Total revenue
|
$ | 11,060 | $ | 11,673 | $ | 11,460 | $ | 11,474 | $ | 11,332 | ||||||||||
|
Expenses:
|
||||||||||||||||||||
|
Rental
property operating
|
5,229 | 4,768 | 4,934 | 4,765 | 5,159 | |||||||||||||||
|
Depreciation
and amortization
|
4,818 | 4,486 | 4,211 | 4,745 | 5,065 | |||||||||||||||
|
Interest
|
5,007 | 3,972 | 3,967 | 3,938 | 4,760 | |||||||||||||||
|
Total expenses
|
15,054 | 13,226 | 13,112 | 13,448 | 14,984 | |||||||||||||||
|
Net
loss
|
$ | (3,994 | ) | $ | (1,553 | ) | $ | (1,652 | ) | $ | (1,974 | ) | $ | (3,652 | ) | |||||
|
Equity
in net earnings (loss) of unconsolidated joint ventures
|
$ | (93 | ) | $ | 189 | $ | 163 | $ | 54 | $ | (63 | ) | ||||||||
|
|
4 We own managing
interests in six of seven joint ventures, consisting of 16 office
properties, including 34 office buildings, comprising approximately 2.42
million leasable square feet. Our ownership interest
percentages in these joint ventures range from approximately 5.00% to
32.17%. In exchange for our managing ownership interest and
related equity investment in these joint ventures, we are entitled to
preferential allocations of earnings and cash flows from each respective
joint venture. We are also entitled to incentive interests in
excess of our ownership percentages ranging from approximately 21.41% to
36.00%, subject to returns on invested
capital.
|
14
Pacific
Office Properties Trust, Inc.
Debt Analysis(1)
(unaudited
and in thousands)
|
December
31, 2009
|
September
30, 2009
|
June
30, 2009
|
March
31, 2009
|
December
31, 2008
|
||||||||||||||||
|
Debt
Outstanding
|
||||||||||||||||||||
|
Consolidated Debt
|
||||||||||||||||||||
|
Mortgage
Loans
|
$ | 408,418 | $ | 405,422 | $ | 402,675 | $ | 402,347 | $ | 402,471 | ||||||||||
|
Unsecured
Loans
|
21,104 | 21,104 | 23,776 | 23,776 | 23,776 | |||||||||||||||
|
Total
|
429,522 | 426,526 | 426,451 | 426,123 | 426,247 | |||||||||||||||
|
Unamortized
Debt Discount
|
(1,980 | ) | (2,075 | ) | (2,171 | ) | (2,267 | ) | (2,363 | ) | ||||||||||
|
Total
Consolidated Debt, Net
|
$ | 427,542 | $ | 424,451 | $ | 424,280 | $ | 423,856 | $ | 423,884 | ||||||||||
|
Company portion of Unconsolidated Joint
Venture Debt(2)
|
||||||||||||||||||||
|
Mortgage
Loans
|
$ | 42,196 | $ | 39,795 | $ | 39,804 | $ | 39,145 | $ | 39,171 | ||||||||||
|
Unsecured
Loans
|
1,367 | 1,367 | 1,367 | 1,367 | 1,367 | |||||||||||||||
|
Total
Company portion of Unconsolidated Joint Venture
Debt
|
$ | 43,563 | $ | 41,162 | $ | 41,171 | $ | 40,512 | $ | 40,538 | ||||||||||
|
Debt
Structure
|
||||||||||||||||||||
|
Consolidated Debt
|
||||||||||||||||||||
|
Fixed
Rate Mortgage Loans
|
$ | 372,454 | $ | 372,558 | $ | 372,658 | $ | 372,735 | $ | 372,859 | ||||||||||
|
Fixed
Rate Unsecured Loans
|
21,104 | 21,104 | 23,776 | 23,776 | 23,776 | |||||||||||||||
|
Total
Fixed Rate Debt
|
393,558 | 393,662 | 396,434 | 396,511 | 396,635 | |||||||||||||||
|
Variable
Rate Loans (3) (subject
to interest rate protection)
|
35,964 | 32,864 | 30,017 | 29,612 | 29,612 | |||||||||||||||
|
Unamortized
Debt Discount
|
(1,980 | ) | (2,075 | ) | (2,171 | ) | (2,267 | ) | (2,363 | ) | ||||||||||
|
Total
Consolidated Debt, Net
|
$ | 427,542 | $ | 424,451 | $ | 424,280 | $ | 423,856 | $ | 423,884 | ||||||||||
|
Company portion of Unconsolidated Joint Venture
Debt
|
||||||||||||||||||||
|
Fixed
Rate Mortgage Loans
|
$ | 29,013 | $ | 29,037 | $ | 29,046 | $ | 29,070 | $ | 29,096 | ||||||||||
|
Fixed
Rate Unsecured Loans
|
1,367 | 1,367 | 1,367 | 1,367 | 1,367 | |||||||||||||||
|
Total
Fixed Rate Debt
|
30,380 | 30,404 | 30,413 | 30,437 | 30,463 | |||||||||||||||
|
Variable
Rate Loans (subject to interest rate protection)
|
13,183 | 10,758 | 10,758 | 10,075 | 10,075 | |||||||||||||||
|
Total
Company portion of Unconsolidated Joint Venture Debt
|
$ | 43,563 | $ | 41,162 | $ | 41,171 | $ | 40,512 | $ | 40,538 | ||||||||||
|
1
Amounts included herein represent the outstanding principal balances as of
the respective dates presented and, accordingly, do not include any
amounts attributable to discounts or premiums on our outstanding debt
obligations, which are not material. The amounts of mortgage
and other collateralized loans reflected in our consolidated balance
sheets represent the outstanding principal balances of those loans,
adjusted for applicable discounts or premiums, in accordance with GAAP for
the respective dates
presented.
|
2
Company portion of Unconsolidated Joint Venture Debt is derived based on the
outstanding principal balances of mortgage and unsecured loans of our
unconsolidated joint ventures multiplied by our ownership interest percentage in
each respective unconsolidated joint venture as of the respective dates
presented. Primarily the entire Company portion of Joint Venture Debt
is non-recourse to the Company, except for approximately $0.47 million at
December 31, 2009 attributable to Scripps Ranch Center.
3
Variable rate loans include amount borrowed under the revolving credit facility
at a fluctuating interest rate equal to the effective rate of interest paid by
First Hawaiian Bank on a time certificate of deposit, plus one
percent.
15
Pacific
Office Properties Trust, Inc.
Equity
Analysis
(unaudited
and in thousands, except share/unit price, ratios and percentages)
|
December
31, 2009
|
September
30, 2009
|
June
30, 2009
|
March
31, 2009
|
December
31, 2008
|
||||||||||||||||
|
Common
Equity
|
||||||||||||||||||||
|
Common
Shares
|
3,851 | 3,851 | 3,061 | 3,031 | 3,031 | |||||||||||||||
|
Common
Units(1)
|
14,299 | 14,299 | 14,299 | 14,299 | 14,299 | |||||||||||||||
|
Total
|
18,150 | 18,150 | 17,360 | 17,330 | 17,330 | |||||||||||||||
|
Common
Share Price
|
$ | 3.89 | $ | 4.34 | $ | 3.72 | $ | 5.00 | $ | 4.44 | ||||||||||
|
Market
Value of Common Shares/Common Units
|
$ | 70,604 | $ | 78,771 | $ | 64,579 | $ | 86,650 | $ | 76,945 | ||||||||||
|
Convertible
Preferred Equity
|
||||||||||||||||||||
|
Convertible
Preferred Units(2)
|
4,545 | 4,545 | 4,545 | 4,545 | 4,545 | |||||||||||||||
|
Conversion
Ratio
|
7.1717 | x | 7.1717 | x | 7.1717 | x | 7.1717 | x | 7.1717 | x | ||||||||||
|
Common
Shares Issued (assuming full conversion)
|
32,598 | 32,598 | 32,598 | 32,598 | 32,598 | |||||||||||||||
|
Market
Value of Convertible Preferred Units (as converted)
|
$ | 126,806 | $ | 141,475 | $ | 121,265 | $ | 162,990 | $ | 144,735 | ||||||||||
|
Capitalization
|
||||||||||||||||||||
|
Market
Value of Common Shares/Common Units
|
$ | 70,604 | $ | 78,771 | $ | 64,579 | $ | 86,650 | $ | 76,945 | ||||||||||
|
Market
Value of Convertible Preferred Units (as converted)
|
126,806 | 141,475 | 121,265 | 162,990 | 144,735 | |||||||||||||||
|
Total
Equity Market Capitalization (assuming full conversion)
|
197,410 | 220,246 | 185,844 | 249,640 | 221,680 | |||||||||||||||
|
Total
Consolidated Debt
|
427,543 | 424,451 | 424,280 | 423,856 | 423,884 | |||||||||||||||
|
Total
Market Capitalization
|
$ | 624,953 | $ | 644,697 | $ | 610,124 | $ | 673,496 | $ | 645,564 | ||||||||||
1
Common Units are exchangeable on a one-for-one basis for shares of our common
stock, but no earlier than March 19, 2010.
2 Each
Convertible Preferred Unit is convertible into 7.1717 Common Units, but no
earlier than the later of March 19, 2010, and the date an underwritten public
offering (of at least $75 million) by us of our common stock is
consummated. Upon conversion of the Preferred Units to Common Units,
the Common Units are exchangeable on a one-for-one basis for shares of our
common stock, but no earlier than one year after the date of their conversion
from a Preferred Unit to a Common Unit.
16
Pacific
Office Properties Trust, Inc.
(as of
December 31, 2009)
Consolidated Debt
Summary
(unaudited
and in thousands, except for percentages)
|
Property/Loan
|
Maturity
Date
|
Interest
Rate
|
Outstanding
Principal Balance at
December
31, 2009
|
%
of Total Consolidated Debt
|
|||||||||
|
Fixed
Rate Secured Debt:
|
|||||||||||||
|
Clifford
Center
(1)
|
8/15/2011
|
6.00 | % | $ | 3,501 | 0.82 | % | ||||||
|
Davies
Pacific Center
|
11/11/2016
|
5.86 | % | 95,000 | 22.12 | % | |||||||
|
First
Insurance Center
|
1/1/2016
|
5.74 | % | 38,000 | 8.85 | % | |||||||
|
First
Insurance Center
|
1/6/2016
|
5.40 | % | 14,000 | 3.26 | % | |||||||
|
Pacific
Business News Building
|
4/6/2010
|
6.98 | % | 11,653 | 2.71 | % | |||||||
|
Pan
Am Building
|
8/11/2016
|
6.17 | % | 60,000 | 13.97 | % | |||||||
|
Waterfront
Plaza
|
9/11/2016
|
6.37 | % | 100,000 | 23.28 | % | |||||||
|
Waterfront
Plaza
|
9/11/2016
|
6.37 | % | 11,000 | 2.56 | % | |||||||
|
City
Square
|
9/1/2010
|
5.58 | % | 27,500 | 6.40 | % | |||||||
|
Sorrento
Technology Center
|
1/11/2016
|
5.75 | % | 11,800 | 2.75 | % | |||||||
|
Subtotal
Fixed Rate Secured Debt
|
372,454 | 86.71 | % | ||||||||||
|
|
|||||||||||||
|
Fixed
Rate Unsecured Debt:
|
|||||||||||||
|
Unsecured
notes payable to related parties
|
Varying
dates from
3/19/2013
to 8/31/2013
|
7.00 | % | 21,104 | 4.91 | % | |||||||
|
Floating
Rate Secured Debt :
|
|||||||||||||
|
City
Square (2)
|
9/1/2010
|
LIBOR
+ 2.35%
|
27,017 | 6.29 | % | ||||||||
|
Revolving
line of credit(3)
|
9/2/2011
|
1.85 | % | 8,947 | 2.08 | % | |||||||
|
Subtotal
Floating Rate Secured Debt
|
35,964 | 8.37 | % | ||||||||||
|
Total
Consolidated Debt
|
429,522 | 100.00 | % | ||||||||||
|
Less
Unamortized Debt Discount
|
(1,979 | ) | |||||||||||
|
Total
Consolidated Debt, Net of Unamortized Debt Discount
|
$ | 427,543 | |||||||||||
1 The
initial maturity date is August 15, 2011. The Company has the option
to extend the maturity date to August 15, 2014.
2 The
Company has an interest rate cap on this loan for the notional amount of $28.5
million, which effectively limits the LIBOR rate on this loan to
7.45%. The interest rate cap expires on September 1,
2010.
17
Pacific
Office Properties Trust, Inc.
(as of
December 31, 2009)
Consolidated Debt
Maturities
(unaudited
and in thousands)
|
Property/Loan
|
2010
|
2011
|
2012
|
2013
|
2014
|
Thereafter
|
Total
|
|||||||||||||||||||||
|
Fixed
Rate Secured Debt:
|
||||||||||||||||||||||||||||
|
Clifford Center1
|
$ | 275 | 2 | $ | 292 | 2 | $ | 310 | 2 | $ | 329 | 2 | $ | 2,295 | 2 | $ | - | $ | 3,501 | |||||||||
|
Davies Pacific
Center
|
- | - | - | - | - | 95,000 | 95,000 | |||||||||||||||||||||
|
First Insurance
Center
|
- | - | - | - | - | 52,000 | 52,000 | |||||||||||||||||||||
|
Pacific Business News
Building
|
11,653 | - | - | - | - | - | 11,653 | |||||||||||||||||||||
|
Pan Am Building
|
- | - | - | - | - | 60,000 | 60,000 | |||||||||||||||||||||
|
Waterfront Plaza
|
- | - | - | - | - | 111,000 | 111,000 | |||||||||||||||||||||
|
City Square
|
27,500 | - | - | - | - | - | 27,500 | |||||||||||||||||||||
|
Sorrento Technology
Center
|
- | - | - | - | - | 11,800 | 11,800 | |||||||||||||||||||||
|
Fixed
Rate Unsecured Debt:
|
||||||||||||||||||||||||||||
|
Unsecured notes payable
to
|
||||||||||||||||||||||||||||
|
related
Parties
|
- | - | - | 21,104 | - | - | 21,104 | |||||||||||||||||||||
|
Floating
Rate Secured Debt:
|
||||||||||||||||||||||||||||
|
City Square
|
27,017 | - | - | - | - | - | 27,017 | |||||||||||||||||||||
|
Revolving line of
credit
|
- | 8,947 | - | - | - | - | 8,947 | |||||||||||||||||||||
|
Total
|
$ | 66,445 | $ | 9,239 | $ | 310 | $ | 21,433 | $ | 2,295 | $ | 329,800 | $ | 429,522 | ||||||||||||||
1 The initial maturity date
is August 15, 2011. The Company has the option to extend the maturity
date to August 15, 2014. Accordingly, the related debt maturity
reflected herein is scheduled using an amortization schedule based on the
extended maturity date, as if the Company had exercised its option to extend the
original maturity date.
2 Amounts represent scheduled principal
amortization pursuant to the respective loan
agreement.
18
Pacific
Office Properties Trust, Inc.
(as of
December 31, 2009)
Unconsolidated Joint Venture
Debt Summary
(unaudited
and in thousands, except for percentages)
|
Property/Loan
|
Maturity
Date
|
Interest
Rate
|
Ownership
Interest %
|
Outstanding
Principal Balance at
December
31, 2009
|
Company
Portion of Outstanding Principal Balance at December 31,
2009
|
%
of Total Company Portion of Outstanding Principal
Balance
|
|||||||||||||
|
Fixed
Rate Secured Debt:
|
|||||||||||||||||||
|
Seville
Plaza - Note A
|
1/1/2011
|
6.05 | % | 7.50 | % | $ | 21,650 | $ | 1,624 | 3.73 | % | ||||||||
|
Seville
Plaza - Note B
|
1/1/2011
|
9.19 | % | 7.50 | % | 3,000 | 225 | 0.52 | % | ||||||||||
|
SoCal
II Joint Venture
|
1/6/2012
|
5.75 | % | 10.00 | % | 133,500 | 13,350 | 30.64 | % | ||||||||||
|
Bank
of Hawaii Waikiki Center
|
3/11/2017
|
5.99 | % | 17.50 | % | 26,900 | 4,708 | 10.81 | % | ||||||||||
|
POP
San Diego – Palomar Heights Plaza
|
4/30/2011
|
6.25 | % | 32.17 | % | 10,796 | 3,473 | 7.97 | % | ||||||||||
|
POP
San Diego – Palomar Heights Plaza
|
4/1/2014
|
5.58 | % | 32.17 | % | 1,880 | 605 | 1.39 | % | ||||||||||
|
POP
San Diego – Palomar Heights Corporate Center
|
4/1/2014
|
5.58 | % | 32.17 | % | 10,479 | 3,371 | 7.74 | % | ||||||||||
|
POP
San Diego – Scripps Ranch Center
|
12/1/2014
|
5.44 | % | 32.17 | % | 5,152 | 1,657 | 3.80 | % | ||||||||||
|
Subtotal
Fixed Rate Secured Debt
|
213,357 | 29,013 | 66.60 | % | |||||||||||||||
|
Fixed
Rate Unsecured Debt:
|
|||||||||||||||||||
|
POP
San Diego Mezzanine Loan
|
4/30/2011
|
12.00 | % | 32.17 | % | 4,250 | 1,367 | 3.13 | % | ||||||||||
|
Floating
Rate Secured Debt :
|
|||||||||||||||||||
|
US
Bank Center
|
5/9/2010( )
|
LIBOR
+ 1.53%(1)
|
7.50 | % | 56,800 | 4,260 | 9.78 | % | |||||||||||
|
SoCal
II Joint Venture - Senior Loan
|
1/1/2011(1)
|
LIBOR
+ 2.95%(2)
|
10.00 | % | 16,500 | 1,650 | 3.79 | % | |||||||||||
|
Black
Canyon Corporate Center - Note A
|
2/9/2012(1)
|
LIBOR
+ 2.50%(2)
|
17.50 | % | 27,700 | 4,848 | 11.13 | % | |||||||||||
|
Seaview
Corporate Center
|
1/1/2015(3)
|
Adjusted
LIBOR + 3.25%(3)
|
5.00 | % | 48,500 | 2,425 | 5.57 | % | |||||||||||
|
Subtotal
Floating Rate Secured Debt
|
149,500 | 13,183 | 30.26 | % | |||||||||||||||
|
Total
Unconsolidated Joint Venture Debt
|
$ | 367,107 | $ | 43,563 | 100.00 | % | |||||||||||||
1 The
initial maturity dates for the floating rate secured debt attributable to US
Bank Center, SoCal II Joint Venture – Senior Loan and Black Canyon Corporate
Center – Note A are May 9, 2010, January 1, 2010, and February 9, 2010,
respectively. Subsequent to December 31, 2009, the maturity dates for the debt
attributable to SoCal II Joint Venture – Senior Loan and Black Canyon have been
extended to January 1, 2011 and February 9, 2012, respectively. The
US Bank Center joint venture has the option to, and expects to, extend the
maturity dates of its floating rate secured debt to May 9, 2011, subject to
nominal fees and requirements.
2
Interest rate cap agreements are in place on floating rate secured debt
attributable to US Bank Center, SoCal II Joint Venture – Senior Loan and Black
Canyon Corporate Center – Note A in the notional amounts of $56.8 million, which
effectively limits the LIBOR rate on this loan to 4.98%, $16.5 million, which
effectively limits the LIBOR rate on this loan to 6.25%, and $23.8 million,
which effectively limits the LIBOR rate on this loan to 3.00% and is also
subject to a 1% LIBOR floor, respectively.
3 An
interest rate swap is in place on floating rate secured debt attributable to
Seaview Corporate Center in the notional amount of $48.5 million, which
effectively limits the rate on this loan to 6.49%.
19
Pacific
Office Properties Trust, Inc.
(as of
December 31, 2009)
Company Portion of
Unconsolidated Joint Venture Debt Maturities (1)
(unaudited
and in thousands)
|
Property/Loan
|
2010
|
2011
|
2012
|
2013
|
2014
|
Thereafter
|
Total
|
|||||||||||||||||||||
|
Fixed
Rate Secured Debt:
|
||||||||||||||||||||||||||||
|
Seville
Plaza – Notes A&B
|
$ | - | $ | 1,849 | $ | - | $ | - | $ | - | $ | - | $ | 1,849 | ||||||||||||||
|
SoCal
II Joint Venture
|
- | - | 13,350 | - | - | - | 13,350 | |||||||||||||||||||||
|
Bank
of Hawaii Waikiki Center
|
- | - | - | - | - | 4,708 | 4,708 | |||||||||||||||||||||
|
POP
San Diego – Palomar Heights Plaza
|
- | 3,473 | - | - | - | - | 3,473 | |||||||||||||||||||||
|
POP
San Diego – Palomar Heights Plaza
|
- | - | - | - | 605 | - | 605 | |||||||||||||||||||||
|
POP
San Diego – Palomar Heights Corporate Center
|
- | - | - | - | 3,371 | - | 3,371 | |||||||||||||||||||||
|
POP
San Diego – Scripps Ranch Center
|
- | - | - | - | 1,657 | - | 1,657 | |||||||||||||||||||||
|
Fixed
Rate Unsecured Debt:
|
||||||||||||||||||||||||||||
|
POP
San Diego Mezzanine Loan
|
- | 1,367 | - | - | - | - | 1,367 | |||||||||||||||||||||
|
Floating
Rate Secured Debt:
|
||||||||||||||||||||||||||||
|
US
Bank Center(2)
|
- | 4,260 | - | - | - | - | 4,260 | |||||||||||||||||||||
|
SoCal
II Joint Venture - Senior Loan(2)
|
- | - | 1,650 | - | - | - | 1,650 | |||||||||||||||||||||
|
Black
Canyon Corporate Center- Note A(2)
|
- | - | 4,848 | - | - | - | 4,848 | |||||||||||||||||||||
|
Seaview
Corporate Center
|
- | - | - | - | - | 2,425 | 2,425 | |||||||||||||||||||||
|
Total
|
$ | - | $ | 10,949 | $ | 19,848 | $ | - | $ | 5,633 | $ | 7,133 | $ | 43,563 | ||||||||||||||
|
1
Company portion of Unconsolidated Joint Venture Debt Maturities amounts
were derived based on the outstanding principal balances of mortgage and
unsecured loans of our unconsolidated joint ventures multiplied by our
ownership interest percentage in each respective unconsolidated joint
venture.
|
2 The
initial maturity dates for the floating rate secured debt attributable to US
Bank Center, SoCal II Joint Venture – Senior Loan and Black Canyon Corporate
Center – Note A are May 9, 2010, January 1, 2010, and February 9, 2010,
respectively. Subsequent to December 31, 2009, the maturity dates for the debt
attributable to SoCal II Joint Venture – Senior Loan and Black Canyon have been
extended to January 1, 2011 and February 9, 2012, respectively. The
US Bank Center joint venture has the option to, and expects to, extend the
maturity date of its floating rate secured debt to May 9, 2011, subject to
nominal fees and requirements. The SoCal II Joint Venture – Senior
Loan has an option to, and expects to, further extend the maturity date of its
floating rate secured debt to January 1, 2012, subject to nominal fees and
requirements. Accordingly, the unconsolidated joint venture debt
maturities herein are scheduled using the expected maturity date, as if the
Company had exercised all available options to extend the maturity
date.
20
Pacific
Office Properties Trust, Inc.
(as of
December 31, 2009)
Portfolio
Leasing Statistics
Portfolio
Summary
Through
our Operating Partnership, we own whole interests in eight office properties,
and managing ownership interests in seven joint ventures holding sixteen office properties,
comprising approximately 4.7 million square feet of leasable area in Honolulu,
Southern California and Phoenix metropolitan areas (the “Property
Portfolio”). As of December 31, 2009, the portion of our Property
Portfolio, which was effectively owned by us (representing the leasable square
feet of our consolidated properties and our respective ownership interests in
the leasable square feet of our unconsolidated joint venture properties) (the
“Effective Portfolio”) comprised approximately 2.5 million leasable square
feet. Our property statistics as of December 31, 2009, were as
follows:
|
Property
|
Effective
|
|||||||||||||||
|
Number
of
|
Portfolio
|
Portfolio
|
||||||||||||||
|
|
Properties
|
Buildings
|
Square
Feet
|
Square
Feet
|
||||||||||||
|
Consolidated
properties
|
8 | 11 | 2,265,339 | 2,265,339 | ||||||||||||
|
Unconsolidated
joint ventures properties
|
16 | 34 | 2,417,359 | 279,223 | ||||||||||||
|
Total
|
24 | 45 | 4,682,698 | 2,544,562 | ||||||||||||
21
Pacific
Office Properties Trust, Inc.
(as of
December 31, 2009)
Portfolio Leasing
Summary
|
Submarket
|
Market
Rentable Square Feet
|
Effective
Market Rentable Square Feet
|
Percent
Leased
|
Annualized
Rent per Square Foot(1)
|
|||||||||||||
|
Honolulu, Hawaii
|
|||||||||||||||||
|
Waterfront
Plaza
|
Downtown
(CBD)
|
534,475 | 534,475 | 94.01 | % | $ | 37.12 | ||||||||||
|
Davies
Pacific Center
|
Downtown
(CBD)
|
353,224 | 353,224 | 86.48 | % | 35.12 | |||||||||||
|
Pan
Am Building
|
Kapiolani
|
209,889 | 209,889 | 93.17 | % | 38.57 | |||||||||||
|
First
Insurance Center
|
Kapiolani/Ward
|
202,992 | 202,992 | 99.06 | % | 34.61 | |||||||||||
|
Pacific
Business News Building
|
Kapiolani
|
90,559 | 90,559 | 72.91 | % | 32.33 | |||||||||||
|
Clifford
Center
|
Downtown
(CBD)
|
72,415 | 72,415 | 82.67 | % | 31.95 | |||||||||||
|
Bank
of Hawaii Waikiki Center
|
Waikiki
|
152,288 | 26,650 | 85.59 | % | 52.25 | |||||||||||
|
Subtotal
|
1,615,842 | 1,490,204 | 90.41 | % | $ | 37.52 | |||||||||||
|
Phoenix, Arizona
|
|||||||||||||||||
|
City
Square
|
(CBD)/North
Central
|
738,422 | 738,422 | 71.89 | % | $ | 20.64 | ||||||||||
|
U.S.
Bank Center
|
(CBD)/South
Central
|
372,676 | 27,951 | 79.71 | % | 22.26 | |||||||||||
|
Black
Canyon Corporate Center
|
Deer
Valley/Airport
|
218,694 | 38,271 | 64.66 | % | 17.85 | |||||||||||
|
Subtotal
|
1,329,792 | 804,644 | 72.89 | % | $ | 20.73 | |||||||||||
|
San Diego, California
|
|||||||||||||||||
|
Sorrento
Technology Center
|
Sorrento
Mesa
|
63,363 | 63,363 | 100.00 | % | $ | 24.47 | ||||||||||
|
Seville
Plaza
|
Kearny
Mesa
|
138,576 | 10,393 | 75.25 | % | 27.04 | |||||||||||
|
Seaview
Corporate Center
|
Sorrento
Mesa
|
356,504 | 17,826 | 92.15 | % | 31.05 | |||||||||||
|
Scripps
Ranch Center
|
Scripps
Ranch
|
47,248 | 15,198 | 44.11 | % | 26.20 | |||||||||||
|
Torrey
Hills Corporate Center
|
Del
Mar Heights
|
24,066 | 7,742 | 88.83 | % | 41.81 | |||||||||||
|
Palomar
Heights Corporate Center
|
Carlsbad
|
64,812 | 20,848 | 86.51 | % | 28.85 | |||||||||||
|
Palomar
Heights Plaza
|
Carlsbad
|
45,538 | 14,648 | 70.48 | % | 23.07 | |||||||||||
|
Via
Frontera Business Park
|
Rancho
Bernardo
|
78,819 | 7,882 | 100.00 | % | 18.68 | |||||||||||
|
Poway
Flex
|
Poway
|
112,000 | 11,200 | 100.00 | % | 9.36 | |||||||||||
|
Carlsbad
Corporate Center
|
Carlsbad
|
121,528 | 12,153 | 95.46 | % | 17.60 | |||||||||||
|
Subtotal
|
1,052,454 | 181,253 | 88.69 | % | $ | 24.62 | |||||||||||
|
Orange County, California
|
|||||||||||||||||
|
South
Coast Executive Center
|
Costa
Mesa
|
61,025 | 6,102 | 51.22 | % | $ | 25.82 | ||||||||||
|
Savi
Tech Center
|
Yorba
Linda
|
372,327 | 37,233 | 96.98 | % | 19.26 | |||||||||||
|
Yorba
Linda Business Park
|
Yorba
Linda
|
166,042 | 16,604 | 93.88 | % | 11.66 | |||||||||||
|
Subtotal
|
599,394 | 59,939 | 91.47 | % | $ | 17.47 | |||||||||||
|
Los Angeles, California
|
|||||||||||||||||
|
Gateway
Corporate Center
|
San
Gabriel Valley
|
85,216 | 8,522 | 90.54 | % | $ | 26.65 | ||||||||||
|
Total
Portfolio
|
4,682,698 | 2,544,562 | 85.18 | % | $ | 27.33 | |||||||||||
1
Annualized Rent per Square Foot represents annualized gross rent divided by
occupied square feet excluding leases signed but not commenced as of December
31, 2009. The gross rent amount used in the calculation of Annualized
Rent per Square Foot was derived using monthly base rental revenue and tenant
reimbursements as of December 31, 2009.
22
Pacific
Office Properties Trust, Inc.
(for the
three months ended, December 31, 2009)
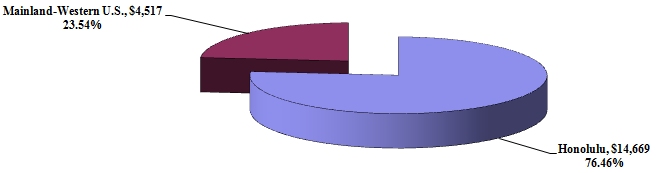
Total Revenue (1)
(unaudited
and in thousands, except percentages)
|
1
Total revenue amounts used herein are comprised of rental revenue, tenant
reimbursements, parking, interest and other revenue of the Company and of
the Company’s unconsolidated joint ventures multiplied by the Company’s
ownership interest in each respective joint venture for the three months
ended December 31, 2009.
|
23
Pacific
Office Properties Trust, Inc.
(for the
three months ended, December 31, 2009)
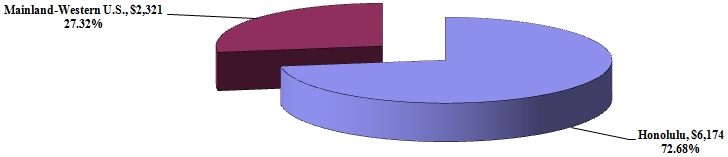
Total Net Operating Income
(1)
(unaudited
and in thousands, except percentages)
|
1
Total net operating income amounts used herein were derived
using the combined rental revenue, tenant reimbursements, parking,
interest and other revenue less operating expenses of the Company and of
the Company’s unconsolidated joint ventures multiplied by the Company’s
ownership interest in each respective joint venture for the three months
ended December 31, 2009.
|
24
Pacific
Office Properties Trust, Inc.
(as of,
and for the three months ended, December 31,
2009)
Leasing Activity
Reconciliation
|
Total
|
Consolidated
|
Unconsolidated
Joint
|
||||||||||
|
Property
Portfolio
|
Properties
|
Venture
Properties
|
||||||||||
|
Occupancy
(as of December 31, 2009)
|
||||||||||||
|
%
Leased
|
85.18 | % | 84.96 | % | 85.39 | % | ||||||
|
%
Occupied
|
83.66 | % | 82.67 | % | 84.59 | % | ||||||
|
Cash
Rent Growth
|
||||||||||||
|
Expiring
Rate
|
$ | 26.65 | $ | 26.02 | $ | 28.11 | ||||||
|
New/Renewal
Rate
|
$ | 25.49 | $ | 24.67 | $ | 27.38 | ||||||
|
Change
|
-4.37 | % | -5.19 | % | -2.62 | % | ||||||
|
Gross
New Leasing Activity
|
||||||||||||
|
Rentable
square feet
|
66,178 | 46,595 | 19,583 | |||||||||
|
Number
of leases
|
22 | 16 | 6 | |||||||||
|
Gross
Renewal Leasing Activity
|
||||||||||||
|
Rentable
square feet
|
93,984 | 55,060 | 38,924 | |||||||||
|
Number
of leases
|
23 | 12 | 11 | |||||||||
|
Average
Lease Term in Months
|
||||||||||||
|
New
leases
|
65 | 74 | 46 | |||||||||
|
Renewal
leases
|
46 | 54 | 36 | |||||||||
|
Blended
|
54 | 63 | 40 | |||||||||
|
Weighted
Average Tenant Improvements per square foot
|
||||||||||||
|
New
leases
|
$ | 24.18 | $ | 25.07 | $ | 22.07 | ||||||
|
Renewal
leases
|
$ | 1.36 | $ | 1.55 | $ | 1.09 | ||||||
|
Blended
|
$ | 10.79 | $ | 12.33 | $ | 8.11 | ||||||
25
Pacific
Office Properties Trust, Inc.
(as of
December 31, 2009)
Top Tenants by Rental
Revenue – Consolidated Properties
(unaudited
and in thousands, except square feet)
|
Tenant
|
Lease
Expiration
|
Market
Rentable
Square
Feet
|
Annualized
Rental
Revenue(1)
|
Property
|
Industry
|
||||||
|
First
Insurance Company of Hawaii Ltd.
|
02/28/18
|
109,755 | $ | 3,976 |
First
Insurance Center
|
Insurance
|
|||||
|
Hawaii
Insurance Consultants, Ltd
|
12/31/12
|
79,159 | 3,231 |
Waterfront
Plaza
|
Insurance
|
||||||
|
AZ
Dept of Economic Security
|
12/31/12
|
104,059 | 1,975 |
City
Square
|
Government
|
||||||
|
Straub
Clinic & Hospital
|
01/31/13
|
55,986 | 1,727 |
First
Insurance Center
|
Healthcare
|
||||||
|
AT&T
Corp.
|
06/30/10
|
26,160 | 1,097 |
Waterfront
Plaza
|
Communications
|
||||||
|
McCorriston,
Miho, Miller, Mukai, LLP
|
12/31/11
|
35,828 | 1,026 |
Waterfront
Plaza
|
Legal
Services
|
||||||
|
Oahu
Publications, Inc.
|
01/31/13
|
25,691 | 1,007 |
Waterfront
Plaza
|
Journalism
|
||||||
|
Fujitsu
Transaction Solutions, Inc.
|
12/31/10
|
37,886 | 912 |
Sorrento
Technology Center
|
Technology
|
||||||
|
Royal
State Financial Corp.
|
10/31/11
|
22,119 | 855 |
Pan
Am Building
|
Insurance
|
||||||
|
AZ
DES- Social Security
|
05/31/14
|
39,524 | 821 |
City
Square
|
Government
|
||||||
|
Total
Annualized Rental Revenue for Top Ten Tenants – Consolidated
Properties
|
$ | 16,627 | |||||||||
|
Total
Annualized Rental Revenue – Consolidated Properties(2)
|
$ | 58,550 | |||||||||
1
Annualized Rental Revenue represents monthly base rental revenue and tenant
reimbursements as of December 31, 2009, on an annualized
basis.
2 Total
Annualized Rental Revenue – Consolidated Properties was derived based on
annualizing the rental revenues and tenant reimbursements of the Company for the
three months ended December 31, 2009.
26
Pacific
Office Properties Trust, Inc.
(as of
December 31, 2009)
Top Tenant Industry
Diversification by Rental Revenue – Consolidated Properties
(1)
(unaudited and in thousands, except percentages)
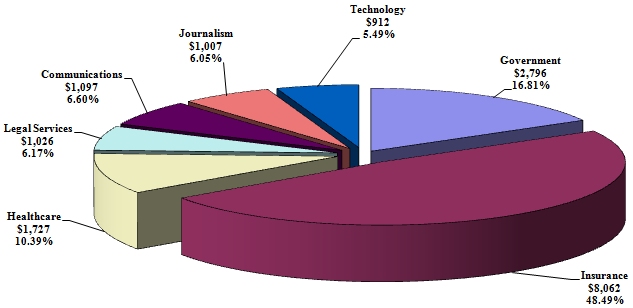
|
1
Rental Revenue amounts used herein were derived using base rental revenue
and tenant reimbursements of the Company for the three months ended
December 31, 2009.
|
27
Pacific
Office Properties Trust, Inc.
(as of
December 31, 2009)
Top Tenants by Rental
Revenue – Unconsolidated Joint Venture Properties
(unaudited
and in thousands, except square feet and percentages)
|
Tenant
|
Lease
Expiration
|
Market
Rentable
Square
Feet
|
Ownership
Interest %
|
Annualized
Rental Revenue(1)
|
Property
|
Industry
|
|||||||||
|
CareFusion
Corp.
|
02/28/15
|
130,000 | 10.00 | % | $ | 2,679 |
Savi
Tech Center
|
Healthcare
|
|||||||
|
Nobel
Biocare USA, Inc.
|
10/31/17
|
122,361 | 10.00 | % | 2,402 |
Savi
Tech Center
|
Healthcare
|
||||||||
|
The
Active Network, Inc.
|
10/31/11
|
61,587 | 5.00 | % | 2,080 |
Seaview
Corporate Center
|
Technology
|
||||||||
|
Pfizer,
Inc.
|
07/31/13
|
61,211 | 5.00 | % | 1,988 |
Seaview
Corporate Center
|
Healthcare
|
||||||||
|
Bank
of Hawaii
|
01/31/38
|
6,971 | 17.50 | % | 1,947 |
Bank
of Hawaii Waikiki Center
|
Financial
Services
|
||||||||
|
Adobe
Systems, Inc.
|
01/31/13
|
61,211 | 5.00 | % | 1,870 |
Seaview
Corporate Center
|
Technology
|
||||||||
|
High-Tech
Institute, Inc.
|
04/04/18
|
92,974 | 17.50 | % | 1,584 |
Black
Canyon Corporate Center
|
Education
|
||||||||
|
JTB
Hawaii, Inc.
|
12/31/12
|
35,623 | 17.50 | % | 1,261 |
Bank
of Hawaii Waikiki Center
|
Tourism
|
||||||||
|
Valley
Metro Rail, Inc.
|
06/30/16
|
57,007 | 7.50 | % | 1,257 |
U.S.
Bank Center
|
Transportation
|
||||||||
|
Jacobs
Engineering Group, Inc.
|
10/31/11
|
53,717 | 7.50 | % | 1,220 |
U.S.
Bank Center
|
Engineering
|
||||||||
|
Total
Annualized Rental Revenue for Top Ten Tenants –
Unconsolidated
Joint Venture Properties
|
$ | 18,288 | |||||||||||||
|
Total
Annualized Rental Revenue – Unconsolidated Joint Venture Properties(2)
|
$ | 48,524 | |||||||||||||
1 Annualized Rental Revenue represents
monthly aggregate base rental revenue and tenant reimbursements per property as
of December 31, 2009, on an annualized basis.
2 Total
Annualized Rental Revenue – Unconsolidated Joint Venture Properties was derived
based on annualizing the rental revenues and tenant reimbursements of the
Company’s unconsolidated joint venture properties for the three months ended
December 31, 2009.
28
Pacific
Office Properties Trust, Inc.
(as of
December 31, 2009)
Top Tenant Industry
Diversification by Rental Revenue – Unconsolidated Joint Venture
Properties(1)
(unaudited
and in thousands, except percentages)
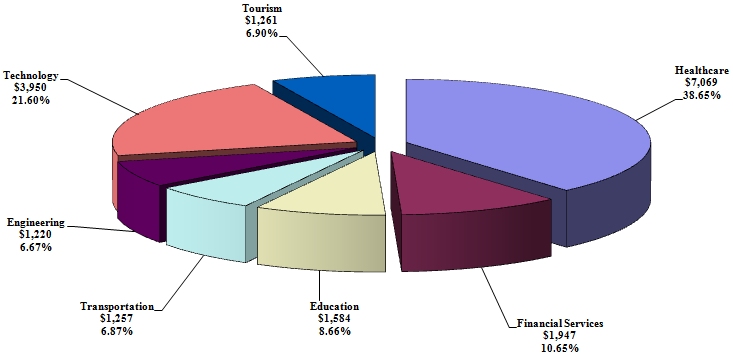
|
1
Rental Revenue amounts used herein were derived using base rental revenue
and tenant reimbursements of the Company’s unconsolidated joint ventures
for the three months ended December 31,
2009.
|
29
Pacific
Office Properties Trust, Inc.
(as of
December 31, 2009)
Lease Expirations –
Consolidated Properties(1)
|
Year
of Lease Expiration
|
Number
of Leases Expiring
|
Market
Rentable Square Feet
|
Expiring
Square Feet as a % of Total
|
Annualized Rent(1)(2)
|
Annualized
Rent as a % of Total
|
Annualized Rent Per Leased
Square Foot(3)
|
Annualized
Rent at Expiration
|
Annualized Rent per Square Foot
at Expiration(4)
|
||||||||||||||||||||||||
|
2010
|
185 | 331,929 | 14.65 | % | $ | 11,116,097 | 18.99 | % | $ | 33.49 | $ | 11,187,348 | $ | 33.70 | ||||||||||||||||||
|
2011
|
158 | 336,115 | 14.84 | % | 10,333,896 | 17.65 | % | 30.75 | 10,648,584 | 31.68 | ||||||||||||||||||||||
|
2012
|
137 | 408,023 | 18.01 | % | 12,582,903 | 21.49 | % | 30.84 | 13,112,907 | 32.14 | ||||||||||||||||||||||
|
2013
|
89 | 274,135 | 12.10 | % | 8,215,129 | 14.03 | % | 29.97 | 8,758,326 | 31.95 | ||||||||||||||||||||||
|
2014
|
58 | 170,222 | 7.51 | % | 5,131,380 | 8.76 | % | 30.15 | 5,419,356 | 31.84 | ||||||||||||||||||||||
|
2015
|
25 | 111,263 | 4.91 | % | 2,667,612 | 4.56 | % | 23.98 | 2,927,844 | 26.31 | ||||||||||||||||||||||
|
2016
|
17 | 52,717 | 2.33 | % | 1,844,364 | 3.15 | % | 34.99 | 2,087,736 | 39.60 | ||||||||||||||||||||||
|
2017
|
5 | 20,733 | 0.92 | % | 670,896 | 1.15 | % | 32.36 | 849,840 | 40.99 | ||||||||||||||||||||||
|
2018
|
17 | 125,992 | 5.56 | % | 4,573,248 | 7.81 | % | 36.30 | 5,380,728 | 42.71 | ||||||||||||||||||||||
|
2019
|
6 | 10,517 | 0.46 | % | 365,076 | 0.62 | % | 34.71 | 434,832 | 41.35 | ||||||||||||||||||||||
|
Thereafter
|
16 | 31,072 | 1.38 | % | 1,048,908 | 1.79 | % | 33.76 | 1,181,508 | 38.02 | ||||||||||||||||||||||
|
Available
For Lease
|
- | 340,658 | 15.04 | % | - | - | - | - | - | |||||||||||||||||||||||
|
Signed
Leases Not Commenced
|
11 | 51,963 | 2.29 | % | - | - | - | - | - | |||||||||||||||||||||||
|
Consolidated
Properties Total/Weighted Average
|
724 | 2,265,339 | 100.00 | % | $ | 58,549,509 | 100.00 | % | $ | 31.26 | $ | 61,989,009 | $ | 33.10 | ||||||||||||||||||
1
Annualized Rent represents gross rental revenue which consists of monthly
aggregate base rental revenue and tenant reimbursements per property as of
December 31, 2009, on an annualized basis.
2 The
following table summarizes the lease expirations for leases in place as of
December 31, 2009 for all of our consolidated properties. The information set
forth in the table assumes that tenants exercise no renewal options or early
termination rights.
30
Pacific
Office Properties Trust, Inc.
(as of
December 31, 2009)
Lease Expirations –
Unconsolidated Joint Venture Properties(1)
|
Year
of Lease Expiration
|
Number
of Leases Expiring
|
Market
Rentable Square Feet
|
Expiring
Square Feet as a % of Total
|
Annualized Rent(1)(2)
|
Annualized
Rent as a % of Total
|
Annualized Rent Per Leased
Square Foot(3)
|
Annualized
Rent at Expiration
|
Annualized Rent per Square Foot
at Expiration(4)
|
Effective
Annualized Rent
|
Effective
Annualized Rent at Expiration
|
||||||||||||||||||||||||||||||
|
2010
|
102 | 253,530 | 10.49 | % | $ | 6,300,192 | 12.98 | % | $ | 24.85 | $ | 6,349,212 | $ | 25.04 | $ | 1,072,374 | $ | 1,084,074 | ||||||||||||||||||||||
|
2011
|
65 | 251,153 | 10.39 | % | 7,177,680 | 14.79 | % | 28.58 | 7,511,412 | 29.91 | 560,166 | 583,023 | ||||||||||||||||||||||||||||
|
2012
|
40 | 248,874 | 10.30 | % | 5,849,964 | 12.06 | % | 23.51 | 6,578,628 | 26.43 | 778,190 | 906,026 | ||||||||||||||||||||||||||||
|
2013
|
43 | 363,494 | 15.04 | % | 10,089,864 | 20.79 | % | 27.76 | 10,999,812 | 30.26 | 968,400 | 1,053,228 | ||||||||||||||||||||||||||||
|
2014
|
28 | 187,054 | 7.73 | % | 3,692,829 | 7.61 | % | 19.74 | 4,117,152 | 22.01 | 343,325 | 383,093 | ||||||||||||||||||||||||||||
|
2015
|
12 | 328,246 | 13.58 | % | 5,464,296 | 11.26 | % | 16.65 | 6,432,672 | 19.60 | 616,795 | 718,583 | ||||||||||||||||||||||||||||
|
2016
|
13 | 148,851 | 6.16 | % | 3,002,256 | 6.19 | % | 20.17 | 3,426,948 | 23.02 | 300,509 | 341,507 | ||||||||||||||||||||||||||||
|
2017
|
3 | 129,558 | 5.36 | % | 2,577,468 | 5.31 | % | 19.89 | 3,055,200 | 23.58 | 253,371 | 300,288 | ||||||||||||||||||||||||||||
|
2018
|
3 | 92,974 | 3.85 | % | 1,583,832 | 3.26 | % | 17.04 | 1,971,144 | 21.20 | 277,171 | 344,950 | ||||||||||||||||||||||||||||
|
2019
|
4 | 24,854 | 1.02 | % | 617,568 | 1.28 | % | 24.85 | 680,232 | 27.37 | 108,075 | 119,041 | ||||||||||||||||||||||||||||
|
Thereafter
|
7 | 16,212 | 0.67 | % | 2,168,448 | 4.47 | % | 133.76 | 3,606,480 | 222.46 | 379,479 | 631,134 | ||||||||||||||||||||||||||||
|
Available
For Lease
|
- | 353,158 | 14.61 | % | - | - | - | - | - | - | - | |||||||||||||||||||||||||||||
|
Signed
Leases Not Commenced
|
3 | 19,401 | 0.80 | % | - | - | - | - | - | - | - | |||||||||||||||||||||||||||||
|
Unconsolidated
Joint Venture Properties Total/Weighted Average
|
323 | 2,417,359 | 100.00 | % | $ | 48,524,397 | 100.00 | % | $ | 23.73 | $ | 54,728,892 | $ | 26.76 | $ | 5,657,855 | $ | 6,464,947 | ||||||||||||||||||||||
1
Annualized Rent represents gross rental revenue which consists of monthly
aggregate base rental revenue and tenant reimbursements per property as of
December 31, 2009, on an annualized basis.
2 The
following table summarizes the lease expirations for leases in place as of
December 31, 2009 for all of our unconsolidated joint venture properties. The
information set forth in the table assumes that tenants exercise no renewal
options or early termination rights.
31
Pacific
Office Properties Trust, Inc.
(as of
December 31, 2009)
Lease Distribution by Square
Footage –Consolidated Properties
|
Square
Feet Under Lease
|
Number
of Leases
|
Leases
as a % of Total
|
Market
Rentable Square Feet
|
Square
Feet as a % of Total
|
Annualized
Rent(1)(2)
|
Annualized
Rent as a % of Total
|
||||||||||||||||||||
|
2,500 or less
|
555 | 76.66 | % | 344,136 | 15.19 | % | $ | 11,443,086 | 19.54 | % | ||||||||||||||||
| 2,501-10,000 | 115 | 15.88 | % | 542,183 | 23.93 | % | 16,790,388 | 28.68 | % | |||||||||||||||||
| 10,001-20,000 | 31 | 4.28 | % | 429,428 | 18.96 | % | 13,600,020 | 23.23 | % | |||||||||||||||||
| 20,001-40,000 | 9 | 1.24 | % | 267,916 | 11.83 | % | 7,566,360 | 12.92 | % | |||||||||||||||||
| 40,001-100,000 | 1 | 0.14 | % | 76,828 | 3.39 | % | 3,230,859 | 5.52 | % | |||||||||||||||||
|
Greater
than 100,000
|
2 | 0.28 | % | 212,227 | 9.37 | % | 5,918,796 | 10.11 | % | |||||||||||||||||
|
Subtotal
|
713 | 98.48 | % | 1,872,718 | 82.67 | % | $ | 58,549,509 | 100.00 | % | ||||||||||||||||
|
Available
|
- | - | 340,658 | 15.04 | % | - | - | |||||||||||||||||||
|
Signed
Leases Not Commenced
|
11 | 1.52 | % | 51,963 | 2.29 | % | - | - | ||||||||||||||||||
|
Consolidated
Properties Total/Weighted Average
|
724 | 100.00 | % | 2,265,339 | 100.00 | % | $ | 58,549,509 | 100.00 | % | ||||||||||||||||
1
Represents annualized monthly rent under commenced leases as of December 31,
2009 reflects total cash rent before abatements. Abatements committed to as of
December 31, 2009 for the twelve months ending December 31, 2010 were
$213,090.
2
Existing net rents are converted to gross rent by adding estimated annualized
operating expense reimbursements to base rents.
32
Pacific
Office Properties Trust, Inc.
(as of
December 31, 2009)
Lease Distribution by Square
Footage –Unconsolidated Joint Venture Properties
|
Square
Feet Under Lease
|
Number
of Leases
|
Leases
as a % of Total
|
Market
Rentable
Square Feet
|
Square
Feet as a % of Total
|
Annualized Rent(1)(2)
|
Annualized
Rent as a % of Total
|
Effective
Annualized Rent(1)(2)
|
Effective
Annualized
Rent as a % of Total
|
||||||||||||||||||||||||||
|
2,500
or less
|
190 | 58.82 | % | 154,294 | 6.38 | % | $ | 3,832,929 | 7.90 | % | $ | 480,366 | 8.49 | % | ||||||||||||||||||||
| 2,501-10,000 | 86 | 26.63 | % | 398,578 | 16.49 | % | 12,106,092 | 24.95 | % | 1,626,289 | 28.74 | % | ||||||||||||||||||||||
| 10,001-20,000 | 18 | 5.57 | % | 246,558 | 10.20 | % | 6,498,036 | 13.39 | % | 882,551 | 15.60 | % | ||||||||||||||||||||||
| 20,001-40,000 | 11 | 3.41 | % | 309,024 | 12.78 | % | 7,357,464 | 15.16 | % | 969,237 | 17.13 | % | ||||||||||||||||||||||
| 40,001-100,000 | 13 | 4.02 | % | 694,346 | 28.72 | % | 15,002,340 | 30.92 | % | 1,326,659 | 23.45 | % | ||||||||||||||||||||||
|
Greater
than 100,000
|
2 | 0.62 | % | 242,000 | 10.02 | % | 3,727,536 | 7.68 | % | 372,753 | 6.59 | % | ||||||||||||||||||||||
|
Subtotal
|
320 | 99.07 | % | 2,044,800 | 84.59 | % | $ | 48,524,397 | 100.00 | % | $ | 5,657,855 | 100.00 | % | ||||||||||||||||||||
|
Available
|
- | - | 353,158 | 14.61 | % | - | - | - | - | |||||||||||||||||||||||||
|
Signed
Leases Not Commenced
|
3 | 0.93 | % | 19,401 | 0.80 | % | - | - | - | - | ||||||||||||||||||||||||
|
Unconsolidated
Joint Venture Properties Total/Weighted Average
|
323 | 100.00 | % | 2,417,359 | 100.00 | % | $ | 48,524,397 | 100.00 | % | $ | 5,657,855 | 100.00 | % | ||||||||||||||||||||
1 Represents annualized monthly rent
under commenced leases as of December 31, 2009. This amount reflects
total cash rent before abatements. Abatements committed to as of December 31,
2009 for the twelve months ending December 31, 2010 were
$67,770.
2 Existing net rents are
converted to gross rent by adding estimated annualized operating expense
reimbursements to base rents.
33
Supplemental
Operating and Financial Information