Attached files
| file | filename |
|---|---|
| 8-K - FORM 8-K - BANCORPSOUTH INC | g22503e8vk.htm |
| EX-99.1 - EX-99.1 - BANCORPSOUTH INC | g22503exv99w1.htm |
Exhibit 99.2


| Certain statements contained in this presentation and the accompanying slides may not be based on historical facts and are "forward-looking statements" within the meaning of Section 27A of the Securities Act of 1933, as amended, and Section 21E of the Securities Exchange Act of 1934, as amended. These forward-looking statements may be identified by reference to a future period or by the use of forward-looking terminology, such as "anticipate," "believe," "estimate," "expect," "foresee," "may," "might," "will," "intend," "could," "would" or "plan," or future or conditional verb tenses, and variations or negatives of such terms. These forward-looking statements include, without limitation, statements about real estate values, long-term prospects for shareholder value, the impact of the prevailing economy, long-term growth objectives, results of operations and financial condition. We caution you not to place undue reliance on the forward-looking statements contained in this presentation, in that actual results could differ materially from those indicated in such forward-looking statements as a result of a variety of factors. These factors include, but are not limited to, the ability of BancorpSouth to provide and market competitive products and services, the ability of BancorpSouth to manage growth and effectively serve an expanding customer and market base, changes in economic conditions, the ability of BancorpSouth to identify and enter new markets, changes in BancorpSouth's operating or expansion strategy, changes in the national economy and in the economy in BancorpSouth's market areas, the ability of BancorpSouth to attract, train and retain qualified personnel, changes in consumer preferences, geographic concentrations of BancorpSouth's assets, the ability of BancorpSouth to implement and integrate new technologies, changes in business conditions, including, for example, changes in interest rates and regulatory changes, and other factors detailed from time to time in BancorpSouth's press releases and filings with the Securities and Exchange Commission. BancorpSouth does not undertake any obligation to update or revise forward-looking statements to reflect events or circumstances after the date of this presentation. Certain tabular presentations may not reconcile due to rounding. Unless otherwise noted, any quotes in this presentation can be attributed to company management. Forward Looking Information 2 |

| Financial Highlights 3 Dollars in millions, except per share amounts |

| Summary of Revisions 4 As a result of a subsequent review by management, preliminary earnings issued on January 21, 2010 were adjusted as follows: $27.6 million increase in provision for credit losses $0.6 million reversal of interest income related to additions to TDRs and non-accrual loans $4.5 million increase in foreclosed property expense related to OREO write-downs including establishing a $3.8 million valuation reserve for OREO losses $2.3 million addition to litigation reserve $41.3 million increase in non-accrual loans and leases $6.5 million increase in net charge-offs |

| Non-Performing Assets Dollars in millions 5 As of December 31, 2009 |

| Net Charge-Offs Dollars in millions 6 |

| 2009 Operating Results Dollars in millions, except per share amounts 7 Year ended December 31, 2009 |

| 4th Quarter 2009 Operating Results 8 Dollars in millions, except per share amounts Quarter ended December 31, 2009 |

| Net interest margin effect of interest income reversal related to loans placed on non-accrual: 9 |

| Net Interest Margin Peer Data from SNL Financial as of 3/11/2010 The SNL Bank peer group includes a number of publicly traded banks and bank holding companies, as compiled by SNL Financial LC. The aggregate amounts are size-weighted, calculated by consolidating all companies into a single entity. 10 3.81% 3.18% |
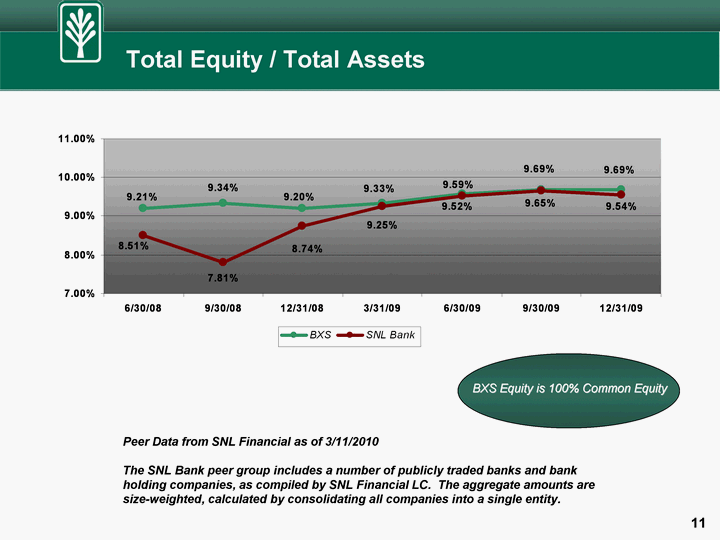
| BXS Equity is 100% Common Equity Total Equity / Total Assets Peer Data from SNL Financial as of 3/11/2010 The SNL Bank peer group includes a number of publicly traded banks and bank holding companies, as compiled by SNL Financial LC. The aggregate amounts are size-weighted, calculated by consolidating all companies into a single entity. 11 |

| Tangible Common Equity / Tangible Assets Peer Data from SNL Financial as of 3/11/2010 The SNL Bank peer group includes a number of publicly traded banks and bank holding companies, as compiled by SNL Financial LC. The aggregate amounts are size-weighted, calculated by consolidating all companies into a single entity. 12 133% of the Peer Group Average |

| Non-Performing Assets / Assets Peer Data from SNL Financial as of 3/11/2010 The SNL Bank peer group includes a number of publicly traded banks and bank holding companies, as compiled by SNL Financial LC. The aggregate amounts are size-weighted, calculated by consolidating all companies into a single entity. (NPAs include non-accruing loans, restructured loans, loans 90+ days past due, and OREO) 13 46% of the Peer Group Average |
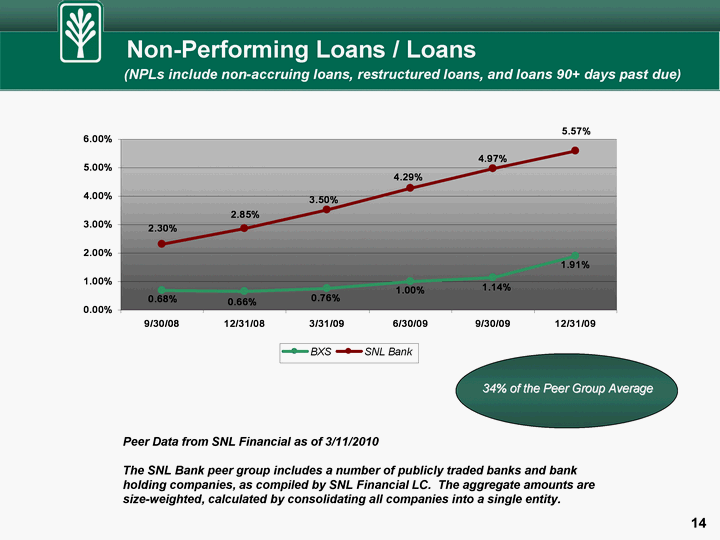
| Non-Performing Loans / Loans Peer Data from SNL Financial as of 3/11/2010 The SNL Bank peer group includes a number of publicly traded banks and bank holding companies, as compiled by SNL Financial LC. The aggregate amounts are size-weighted, calculated by consolidating all companies into a single entity. (NPLs include non-accruing loans, restructured loans, and loans 90+ days past due) 14 34% of the Peer Group Average |

| Net Charge-Offs / Average Loans Peer Data from SNL Financial as of 3/11/2010 The SNL Bank peer group includes a number of publicly traded banks and bank holding companies, as compiled by SNL Financial LC. The aggregate amounts are size-weighted, calculated by consolidating all companies into a single entity. 15 40% of the Peer Group Average |

| Reserve Coverage of Non-Performing Loans Peer Data from SNL Financial as of 3/11/2010 The SNL Bank peer group includes a number of publicly traded banks and bank holding companies, as compiled by SNL Financial LC. The aggregate amounts are size-weighted, calculated by consolidating all companies into a single entity. (NPLs include non-accruing loans, restructured loans, and loans 90+ days past due) 16 143% of the Peer Group Average |
Reconciliation of Non-GAAP Measures
| (Period End Balances, Dollars in Thousands) | As of | As of | As of | As of | As of | As of | As of | |||||||||||||||||||||
| 6/30/2008 | 9/30/2008 | 12/31/2008 | 3/31/2009 | 6/30/2009 | 9/30/2009 | 12/31/2009 | ||||||||||||||||||||||
Shareholders’ Equity —> A |
$ | 1,233,775 | $ | 1,242,719 | $ | 1,240,260 | $ | 1,255,659 | $ | 1,274,947 | $ | 1,286,218 | $ | 1,276,296 | ||||||||||||||
Assets —> B |
13,399,151 | 13,300,728 | 13,480,218 | 13,458,364 | 13,297,819 | 13,271,873 | 13,167,866 | |||||||||||||||||||||
Intangibles —> C |
301,896 | 300,624 | 297,131 | 295,867 | 295,639 | 294,444 | 293,629 | |||||||||||||||||||||
Tangible Equity —> D=A-C |
931,879 | 942,095 | 943,129 | 959,792 | 979,308 | 991,774 | 982,667 | |||||||||||||||||||||
Tangible Assets —> E=B-C |
13,097,255 | 13,000,104 | 13,183,087 | 13,162,497 | 13,002,180 | 12,977,429 | 12,874,236 | |||||||||||||||||||||
Total Equity / Total Assets (%) — > F=A/B |
9.21 | % | 9.34 | % | 9.20 | % | 9.33 | % | 9.59 | % | 9.69 | % | 9.69 | % | ||||||||||||||
Tangible Equity / Tangible Assets (%) — > G=D/E |
7.12 | % | 7.25 | % | 7.15 | % | 7.29 | % | 7.53 | % | 7.64 | % | 7.63 | % | ||||||||||||||
Tangible Common Equity / Tangible Assets (%) — > G=D/E |
7.12 | % | 7.25 | % | 7.15 | % | 7.29 | % | 7.53 | % | 7.64 | % | 7.63 | % | ||||||||||||||