Attached files
| file | filename |
|---|---|
| EX-10.4 - EX-10.4 - ENERNOC INC | a2196609zex-10_4.htm |
| EX-10.3 - EX-10.3 - ENERNOC INC | a2196609zex-10_3.htm |
| EX-10.18 - EX-10.18 - ENERNOC INC | a2196609zex-10_18.htm |
| EX-10.20 - EX-10.20 - ENERNOC INC | a2196609zex-10_20.htm |
| EX-10.19 - EX-10.19 - ENERNOC INC | a2196609zex-10_19.htm |
| EX-32.1 - EX-32.1 - ENERNOC INC | a2196609zex-32_1.htm |
| EX-23.1 - EX-23.1 - ENERNOC INC | a2196609zex-23_1.htm |
| EX-21.1 - EX-21.1 - ENERNOC INC | a2196609zex-21_1.htm |
| EX-31.2 - EX-31.2 - ENERNOC INC | a2196609zex-31_2.htm |
| EX-31.1 - EX-31.1 - ENERNOC INC | a2196609zex-31_1.htm |
| EX-10.23 - EX-10.23 - ENERNOC INC | a2196609zex-10_23.htm |
Use these links to rapidly review the document
Table of Contents
APPENDIX A EnerNOC, Inc.
UNITED STATES
SECURITIES AND EXCHANGE COMMISSION
Washington, D.C. 20549
FORM 10-K
| (Mark One) | ||
ý |
ANNUAL REPORT PURSUANT TO SECTION 13 OR 15(d) OF THE SECURITIES EXCHANGE ACT OF 1934 |
|
For the fiscal year ended December 31, 2009 |
||
or |
||
o |
TRANSITION REPORT PURSUANT TO SECTION 13 OR 15(d) OF THE SECURITIES EXCHANGE ACT OF 1934 |
|
For the transition period from to |
||
Commission file number 001-33471
EnerNOC, Inc.
(Exact Name of Registrant as Specified in its Charter)
| Delaware (State or Other Jurisdiction of Incorporation or Organization) |
87-0698303 (IRS Employer Identification No.) |
|
101 Federal Street Suite 1100 Boston, Massachusetts (Address of Principal Executive Offices) |
02110 (Zip Code) |
|
Registrant's telephone number, including area code: (617) 224-9900 |
||
Securities registered pursuant to Section 12(b) of the Act:
| Title of Each Class | Name of Each Exchange on Which Registered | |
|---|---|---|
| Common Stock, $0.001 par value | The NASDAQ Stock Market LLC | |
| (The NASDAQ Global Market) |
Securities
registered pursuant to Section 12(g) of the Act:
None
Indicate by check mark if the Registrant is a well-known seasoned issuer, as defined in Rule 405 of the Securities Act. Yes o No ý
Indicate by check mark if the Registrant is not required to file reports pursuant to Section 13 or Section 15(d) of the Act. Yes o No ý
Indicate by check mark whether the Registrant (1) has filed all reports required to be filed by Section 13 or 15(d) of the Securities Exchange Act of 1934 during the preceding 12 months (or for such shorter period that the Registrant was required to file such reports), and (2) has been subject to such filing requirements for the past 90 days. Yes ý No o
Indicate by check mark whether the registrant has submitted electronically and posted on its corporate Web site, if any, every Interactive Data File required to be submitted and posted pursuant to Rule 405 of Regulation S-T (§ 232.405 of this chapter) during the preceding 12 months (or for such shorter period that the registrant was required to submit and post such files). Yes o No o
Indicate by check mark if disclosure of delinquent filers pursuant to Item 405 of Regulation S-K (section 229.405 of this chapter) is not contained herein, and will not be contained, to the best of Registrant's knowledge, in definitive proxy or information statements incorporated by reference in Part III of this Form 10-K or any amendment to this Form 10-K. o
Indicate by check mark whether the Registrant is a large accelerated filer, an accelerated filer, a non-accelerated filer or a smaller reporting company. See definitions of "large accelerated filer," "accelerated filer" and "smaller reporting company" in Rule 12b-2 of the Exchange Act. (Check one).
| Large accelerated filer o | Accelerated filer ý | Non-accelerated filer o (Do not check if a smaller reporting company) |
Smaller reporting company o |
Indicate by check mark whether the Registrant is a shell company (as defined in Rule 12b-2 of the Exchange Act). Yes o No ý
The aggregate market value of the Registrant's common stock held by non-affiliates of the Registrant as of June 30, 2009, the last business day of the Registrant's second quarter of fiscal 2009, was approximately $267.4 million based upon the last sale price reported for such date on The NASDAQ Global Market.
The number of shares of the Registrant's common stock (the Registrant's only outstanding class of stock) outstanding as of March 8, 2010 was 24,459,170.
DOCUMENTS INCORPORATED BY REFERENCE
Portions of the Registrant's definitive proxy statement for its 2010 Annual Meeting of Stockholders, to be filed with the Securities and Exchange Commission pursuant to Regulation 14A not later than 120 days after the end of the Registrant's fiscal year ended December 31, 2009, are incorporated by reference into this Annual Report on Form 10-K.
EnerNOC, Inc.
ANNUAL REPORT ON FORM 10-K
FOR THE FISCAL YEAR ENDED DECEMBER 31, 2009
This Annual Report on Form 10-K includes forward-looking statements within the meaning of Section 21E of the Securities Exchange Act of 1934, as amended, and Section 27A of the Securities Act of 1933, as amended. For this purpose, any statements contained herein regarding our strategy, future operations, financial condition, future revenues and profit margins, projected costs, market position, prospects, plans and objectives of management, other than statements of historical facts, are forward-looking statements. The words "anticipates," "believes," "estimates," "expects," "intends," "may," "plans," "projects," "will," "would" and similar expressions are intended to identify forward-looking statements, although not all forward-looking statements contain these identifying words. We cannot guarantee that we actually will achieve the plans, intentions or expectations expressed or implied in our forward-looking statements. Matters subject to forward-looking statements involve known and unknown risks and uncertainties, including economic, regulatory, competitive and other factors, which may cause actual results, levels of activity, performance or the timing of events to be materially different than those exposed or implied by forward-looking statements. Important factors that could cause or contribute to such differences include the factors set forth under the caption "Risk Factors" in Item 1A of Part I of this Annual Report on Form 10-K. Although we may elect to update forward-looking statements in the future, we specifically disclaim any obligation to do so, even if our estimates change, and readers should not rely on those forward-looking statements as representing our views as of any date subsequent to March 12, 2010.
Our trademarks include: EnerNOC, ENERBLOG, Get More from Energy, Energy for Education, Capacity on Demand, PowerTrak, PowerTalk, Celerity Energy, The Cleanest kWh is the One Never Used, The Greenest Kilowatt-hour is the One Never Used, One-Click Curtailment, Clean Green California and CarbonTrak.
Other trademarks or service marks appearing in this Annual Report on Form 10-K are the property of their respective holders.
We use the terms "EnerNOC," the "Company," "we," "us" and "our" in this Annual Report on Form 10-K to refer to the business of EnerNOC, Inc. and its subsidiaries.
Company Overview
We are a leading provider of clean and intelligent energy solutions, which include demand response services, energy efficiency, or monitoring-based commissioning, services, energy procurement services and emissions tracking and trading support services. These solutions help optimize the balance of electric supply and demand, provide cost-efficient alternatives to traditional power generation, transmission and distribution resources, and drive significant cost-savings for our customers. Our customers are commercial, institutional and industrial end-users of energy, as well as electric power grid operators and utilities.
We believe that we are the largest demand response service provider in the United States for commercial, institutional and industrial customers. As of December 31, 2009, we managed over 3,550 megawatts, or MW, of demand response capacity across an end-use customer base of approximately 2,800 accounts and 6,500 customer sites throughout multiple electric power grids. Demand response is an alternative to traditional power generation and transmission infrastructure projects that enables grid operators and utilities to reduce the likelihood of service disruptions, such as brownouts and blackouts, during periods of peak electricity demand, and otherwise manage the electric power grid during short-term imbalances of supply and demand. We use our Network Operations Center, or NOC, and PowerTrak enterprise software platform to remotely manage and reduce electricity consumption across a growing network of commercial, institutional and industrial customer sites, making demand response capacity available to grid operators and utilities on demand while helping end-users of electricity achieve energy savings, environmental benefits and improved financial results. To date, we have received substantially all of our revenues from grid operators and utilities, who make recurring payments to us for managing demand response capacity that we share with end-users of electricity in exchange for such end-users reducing their power consumption when called upon.
We build on our position as a leading demand response services provider by using our NOC and scalable PowerTrak technology platform to sell additional energy management solutions to new and existing end-use customers. These additional solutions include our monitoring-based commissioning services, energy procurement services and emissions tracking and trading support services. Our monitoring-based commissioning services combine advanced metering, building management systems, and energy analytics software applications to identify energy efficiency opportunities in large buildings. Our energy procurement services provide our commercial, institutional and industrial customers located in restructured or deregulated markets throughout the United States with the ability to more effectively manage the energy supplier selection process, including energy supply product procurement and implementation. Our emissions tracking and trading support services include a comprehensive, software-based accounting system for our commercial, institutional and industrial customers to effectively monitor, mitigate and monetize their greenhouse gas emissions in response to existing and pending greenhouse gas reporting requirements.
Since inception, our business has grown substantially. We began by providing demand response services in one state in 2003 and expanded nationally to 31 states and the District of Columbia in eight regions, as well as internationally in Canada and the United Kingdom, by December 31, 2009. From our start in one open market in 2003 to our current contracts and open market programs with grid operators and utilities, we have continually increased our demand response capacity under management with commercial, institutional and industrial customers from approximately 1,112 MW at the end of 2007 to 2,050 MW at the end of 2008 and over 3,550 MW at the end of 2009. Our total revenues
1
increased from $60.8 million to $106.1 million to $190.7 million for the years ended December 31, 2007, 2008 and 2009, respectively.
Significant Recent Developments
In February 2010, Dr. Susan F. Tierney was elected to serve as a member of our board of directors.
In December 2009, we acquired all of the outstanding capital stock of Cogent Energy, Inc., or Cogent, a company specializing in comprehensive energy consulting, engineering and building commissioning solutions for commercial, institutional and industrial customers. The purchase price was equal to approximately $11.2 million consisting of both cash and shares of our common stock. By integrating Cogent's extensive commissioning and engineering experience into our monitoring-based commissioning energy efficiency application, we believe that we will be able to deliver even more value to our rapidly growing customer base.
In November 2009, we appointed Kevin J. Bligh as our chief accounting officer. Prior to his appointment, Mr. Bligh served as our vice president of finance from October 2007 to November 2009.
In August 2009, we completed an underwritten public offering of an aggregate of 3,963,889 shares of our common stock at an offering price of $27.00 per share, which included the sale of 709,026 shares by certain selling stockholders. After deducting underwriting discounts and commissions and offering expenses payable by us, we received net proceeds of approximately $83.4 million from the offering.
In July 2009, we and Neal C. Isaacson, our then-current chief financial officer and treasurer, agreed that Mr. Isaacson would resign as chief financial officer and treasurer effective as of the close of business on July 30, 2009. Also in July 2009, we entered into an employment offer letter to hire and retain Timothy Weller as our chief financial officer and treasurer. Mr. Weller's employment with us commenced on July 31, 2009.
In June 2009, we acquired substantially all of the assets of eQuilibrium Solutions Corporation, or eQ, a software company specializing in the development of enterprise sustainability management products and services. The purchase price was equal to approximately $0.8 million consisting of both cash and shares of our common stock. We believe that the acquisition of eQ strengthens our position in a nascent yet growing market committed to helping energy and sustainability leaders develop their own plans to achieve energy efficiency and emissions goals.
In May 2009, the United States District Court for the District of Massachusetts dismissed without leave to replead the consolidated securities class action lawsuit filed against us and certain of our officers and directors. In June 2009, following dismissal of the securities class action lawsuit, the plaintiff in a derivative lawsuit filed against certain of our officers and directors and certain of the underwriters of our November 2007 follow-on public offering voluntarily dismissed the lawsuit without prejudice.
Industry Background
The Electric Power Industry
Historically, electric utility companies were formed in North America as regulated monopolies to manage the capital intensive, mission critical service of delivering electricity to end-use customers. Each local utility was vertically integrated, with responsibility for owning, managing and delivering all components of the electric power industry: generation, transmission, distribution and retail sales. Each utility was also responsible for maintaining reliability standards based on avoiding service disruptions, commonly known as blackouts. In about half of North America, the industry continues to operate in this vertically integrated fashion.
2
In the rest of North America, including New England, New York, the Mid-Atlantic, the Midwest, Texas, California and Canada, the electric power industry has been restructured to foster a competitive environment. In these restructured markets, utilities continue to operate and maintain transmission and distribution lines, delivering electricity to consumers as they had before, but power generators and electricity suppliers are now allowed to openly compete for business. Independent system operators, referred to as ISOs, or regional transmission organizations, referred to as RTOs, have been formed in these restructured markets to take control of the operation of the regional power system, coordinate the supply of electricity, and establish fair and efficient markets. ISOs and RTOs are collectively referred to as grid operators. These grid operators are responsible for maintaining Federal reliability standards designed to avoid service disruptions.
Increasingly, grid operators and utilities in both restructured markets and in traditionally regulated markets are challenged to reliably provide electricity during periods of peak demand. Clean and intelligent energy solutions can provide a lower cost, reliable and environmentally sound alternative to building additional supply infrastructure in both traditionally regulated and restructured markets.
Challenges Facing the Electric Power Industry
The electric power industry in North America faces enormous challenges to keep pace with the expected increase in demand for electricity and to manage the increased amount of intermittent renewable energy resources that are expected to be connected to the power grid in the future. Because electricity cannot be economically stored using commercially available technology today, it must be generated, delivered and consumed at the moment that it is needed by end-use customers. Maintaining a reliable electric power grid therefore requires real-time balancing between supply and demand. Power generation, transmission and distribution facilities are built to capacity levels that can service the maximum amount of anticipated demand plus a reserve margin intended to serve as a buffer to protect the system in critical periods of peak demand or unexpected events such as failure of a power plant or major transmission line. However, under-investment in generation, transmission and distribution infrastructure in recent years in key regions, coupled with a dramatic growth in electricity consumption over that same time period, has led to an increased frequency of voltage reductions—commonly known as brownouts—and blackouts, which are collectively estimated to cost the United States $80 billion per year, primarily in lost productivity, according to a United States Department of Energy 2005 study. These challenges are exacerbated by environmental concerns and stringent regulatory environments that make it increasingly difficult to find suitable sites, obtain permits, and construct generation, transmission and distribution facilities where they are needed most, often in densely populated areas. Although the economic slowdown in the United States in late 2008 and 2009 has resulted in declining industrial demand for electricity, mid-range and longer-term expectations of capacity shortfalls continue. In addition, existing power generation facility construction has slowed.
According to the North American Electric Reliability Corporation, demand for electricity is expected to increase over the next 10 years by approximately 19% in the United States, but generation capacity is expected to increase by only approximately 12% in the United States during that same period. As a result, in North America, the margin between electric supply and demand is projected to drop below minimum target levels in certain regions in the next two to three years. According to the International Energy Agency, North America is expected to add 698,000 MW of additional capacity at a cost of $2.4 trillion between 2008 and 2030 to reliably meet expected annual growth in demand. Worldwide, the International Energy Agency expects 4,799,000 MW of additional capacity to be required over the same period at a total cost of $13.7 trillion. This presents enormous economic, environmental and logistical challenges.
In addition to the challenges arising from the need to build additional generation capacity in North America, under-investment in the transmission and distribution infrastructure required to deliver power from centralized power plants to end-use customers has resulted in an overburdened electric power
3
grid. This periodically prevents the transport of power to constrained areas during periods of peak demand, which can affect reliability and cause significant economic impacts.
As the electric power industry confronts these challenges, demand response has emerged as an important solution to help address the imbalance in electric supply and demand. For example, the Energy Policy Act of 2005 declared it the official policy of the United States to encourage demand response and the adoption of devices that enable it. In addition, the Energy Independence and Security Act of 2007 ordered the Federal Energy Regulatory Commission, or FERC, to conduct a nationwide assessment of demand response potential and create a national action plan to promote demand response at the federal level and support individual states in their own demand response initiatives. As more renewable energy sources come on line, we believe that our demand side management offerings to grid operators and utilities will provide additional value as grid operators and utilities seek additional means to manage fluctuations in the amount of power generated by intermittent power generation sources, such as wind and solar.
Our Market Opportunity
According to the International Energy Agency, electric power infrastructure expenditures in North America are expected to exceed $2.4 trillion between 2008 and 2030. Worldwide, the International Energy Agency expects 4,799,000 MW of additional capacity to be required over the same period at a total cost of $13.7 trillion. We estimate that over 10% of the electric power infrastructure in North America has been constructed in order to meet peaks in electricity demand that occur less than 1% of the time, or approximately 88 hours per year. Based on these estimates, we believe that the market in North America for reducing demand during these critical peak hours, in place of building supply infrastructure, is $10.6 billion per year, if the need to build-out infrastructure were to occur on an equal annual basis. Using the same assumptions, we estimate that the market for eliminating the top 1% of peak demand hours for electricity worldwide during this same period could be over $59.4 billion per year.
We are a pioneer in the development, implementation and broader adoption of technology-enabled demand response solutions. Our technology enables us to send control signals to, and receive bi-directional communications from, an Internet-enabled network of broadly dispersed end-use customer sites in order to initiate, monitor and terminate demand response activity. Our robust and scalable technology and proprietary operational processes have the ability to automate demand response and simplify end-use customer participation. These solutions are designed for the commercial, institutional and industrial market, which represents approximately 60% of the United States electricity consumption. We provide demand response capacity by contracting with these end-use customers of grid operators and utilities to reduce their electricity usage on demand. We receive most of our revenues from grid operators and utilities and we make payments to end-users of electricity for both contracting to reduce electricity usage and actually doing so when called upon.
Our demand response technology enables us to remotely reduce electricity usage in a matter of minutes, or send curtailment instructions to our end-use customers to be implemented on site. We believe that our solutions address extreme peaks in demand for electricity more efficiently than building additional electric generation, transmission and distribution infrastructure because over 10% of this supply-side infrastructure is typically built to meet peaks in demand that occur less than 1% of the time. We believe that we are well positioned as a market leader to address this substantial market opportunity for demand response. In addition, our PowerTrak enterprise software platform enables us to deliver to our end-use customer base an expanding portfolio of additional energy management solutions, including our monitoring-based commissioning services, energy procurement services and emissions tracking and trading support services. We believe that the market opportunity for our monitoring-based commissioning services, energy procurement services and emissions tracking and trading support services is significant and will remain so as operational efficiency and energy savings
4
are given increased priority by commercial, institutional and industrial end-users of electricity, and as energy market prices remain volatile.
We provide our demand response solutions to grid operators and utilities under long-term contracts and pursuant to open market bidding programs. Our long-term contracts generally have terms of three to 10 years and predetermined capacity commitment and payment levels. In open market programs, grid operators and utilities generally seek bids from companies such as ours to provide demand response capacity based on prices offered in competitive bidding. These opportunities are generally characterized by energy and capacity obligations with shorter commitment periods and prices that may vary by hour, day, month or bidding period.
In our demand response business we match obligation, in the form of MW that we agree to deliver to our utility and grid operator customers, with supply, in the form of MW that we are able to curtail from the electric power grid. We increase, and occasionally decrease, our obligation through open market programs, supplemental demand response programs, auctions or other similar capacity arrangements, open program registrations and bilateral contracts to account for changes in supply and demand forecasts in order to achieve more favorable pricing opportunities. We increase our ability to curtail demand from the electric power grid by deploying a sales team to contract with our commercial, institutional and industrial customers and by installing our equipment at these customers' sites to connect them to our network. When we are called upon by our utility or grid operator customers to deliver MW, we use our software application to dispatch this network to meet the demands of these utility and grid operator customers. We refer to the above activities as managing our portfolio of demand response capacity.
We began providing demand response services in one state in 2003 and expanded nationally to 31 states and the District of Columbia in eight regions, as well as internationally in Canada and the United Kingdom by December 31, 2009. From our start in one open market in 2003 to our current contracts and open market programs with grid operators and utilities, we have increased our demand response capacity under management with commercial, institutional and industrial customers to over 3,550 MW as of December 31, 2009. As indicated in the table below, we have substantial opportunities to continue expanding our MW under management in the regions in which we already provide our demand response services, as well as in other regions. The table depicts, as of December 31, 2009, each of our geographic markets currently served, the length of time we have operated in that region, the contracts and programs in each region from which we generate revenues, the demand response capacity in MW that we currently manage in the region, and our estimate of the market potential in MW for our demand response services. We expect to increase over time our MW under management, and thereby increase our revenues, in most of the geographic regions we serve.
5
Our Geographic Regions, Contracts and Markets
As of December 31, 2009
Region(1) (Years of Operation In Region) |
Type of Contract/Open Market Program (OMP) |
Date of Contract/ Initial Enrollment IN OMP |
Contract/OMP Expiration Date |
Demand Response Capacity Under Management 12/31/2009 (MW) |
Regional All-Time Peak Demand (MW)(1) |
Demand Response Potential Market Opportunity (MW)(2) |
|||||||||||
|---|---|---|---|---|---|---|---|---|---|---|---|---|---|---|---|---|---|
| New England | Reliability-Based OMP | Mar 2003 | Open-Ended | ||||||||||||||
| (7 Years) | Price-Based OMP | Jul 2003 | May 2010 | ||||||||||||||
| Price-Based OMP | Jul 2006 | May 2010 | 933 | 28,130 | 2,813 | ||||||||||||
| Reliability-Based Contract | Jun 2008 | Dec 2012 | |||||||||||||||
| Ancillary Services OMP | Oct 2006 | May 2010 | |||||||||||||||
|
|
|||||||||||||||||
| New York | Reliability-Based OMP | Aug 2004 | Open-Ended | 235 | 33,939 | 3,394 | |||||||||||
| (5.5 Years) | Reliability-Based OMP | Aug 2007 | Open-Ended | ||||||||||||||
|
|
|||||||||||||||||
| California | Reliability-Based Contract | May 2006 | Dec 2017 | ||||||||||||||
| (5 Years) | Reliability-Based OMP | Mar 2007 | Open-Ended | ||||||||||||||
| Reliability-Based OMP | May 2007 | Open-Ended | |||||||||||||||
| Reliability-Based Contract | Feb 2007 | Dec 2011 | 215 | 50,270 | 5,027 | ||||||||||||
| Reliability-Based Contract | Feb 2007 | Dec 2012 | |||||||||||||||
| Reliability-Based Contract | Oct 2009 | Sep 2019 | |||||||||||||||
| Reliability-Based Contract | Sep 2009 | Oct 2024 | |||||||||||||||
|
|
|||||||||||||||||
| PJM | Ancillary Services OMP | Aug 2006 | Open-Ended | ||||||||||||||
| (3.5 Years) | Price-Based OMP | Aug 2006 | Open-Ended | 1,598 | 144,644 | 14,464 | |||||||||||
| Reliability-Based OMP | Jun 2007 | Open-Ended | |||||||||||||||
|
|
|||||||||||||||||
| Southwest | Reliability-Based Contract | Feb 2007 | Dec 2017 | 63 | 36,519 | 3,652 | |||||||||||
| (3 Years) | Reliability-Based Contract | Dec 2008 | May 2012 | ||||||||||||||
|
|
|||||||||||||||||
| Southeast | Reliability-Based Contract | Aug 2007 | Dec 2011 | 251 | 237,100 | 23,710 | |||||||||||
| (2.5 Years) | Reliability-Based Contract | Jun 2008 | Sept 2011 | ||||||||||||||
|
|
|||||||||||||||||
| Northwest | Reliability-Based Contract | Nov 2007 | Apr 2011 | ||||||||||||||
| (2 Years) | Reliability-Based Contract | May 2009 | Feb 2014 | 68 | 40,298 | 4,030 | |||||||||||
| Reliability-Based Contract | Jan 2009 | Dec 2016 | |||||||||||||||
|
|
|||||||||||||||||
| Texas | Reliability-Based OMP | Feb 2008 | Open-Ended | 114 | 62,500 | 6,250 | |||||||||||
| (2 Years) | |||||||||||||||||
|
|
|||||||||||||||||
| Ontario | Reliability-Based Contract | Mar 2008 | May 2013 | 74 | 27,005 | 2,701 | |||||||||||
| (2 Years) | |||||||||||||||||
|
|
|||||||||||||||||
| United Kingdom | Ancillary Services OMP | Oct 2009 | Open-Ended | 15 | 59,880 | 5,988 | |||||||||||
| (.5 Years) | |||||||||||||||||
| Total | 3,566 | 720,285 | 72,029 | ||||||||||||||
- (1)
- US
Regions and Regional All-Time Peak Demands based on FERC Electric Power Market Classifications and Data. UK All-Time Peak Demand
based on National Grid's Operational Demand Data.
- (2)
- Calculated as 10% of regional peak demand, estimated to occur during 1% of annual hours.
The column above labeled Demand Response Capacity Under Management reflects demand response capacity under our management pursuant to definitive contracts with our commercial, institutional and industrial customers.
The column above labeled Type of Contract/Open Market Program (OMP) describes, on a region by region basis, how we provide our demand response solutions to electric power grid operators and utilities under long-term contracts and in open market programs. Our long-term contracts generally have terms of three to 10 years and predetermined capacity commitment and payment levels. Our open market program opportunities are generally characterized by flexible capacity commitments and prices
6
that vary by hour, day, month, bidding period or supplemental, new or modified demand response programs. Within these contracts and open market programs we offer the following solutions to serve the needs of grid operators and utilities:
- •
- reliability-based demand response, which requires a level of demand response capacity to be available for dispatch on call
by grid operators and utilities;
- •
- price-based demand response, which enables commercial, institutional and industrial customers to monitor and respond to
electricity market price signals by reducing electricity usage; and
- •
- ancillary services, which include resources utilized as a reserve pool of quick-start resources to provide short-term support for grid operators and utilities, including operating reserves, called upon by grid operators and utilities during short-term events such as the loss of a transmission line or a power plant.
The EnerNOC Solution
We have developed a proprietary suite of technology applications and operational processes that enable us to make demand response capacity and energy available to grid operators and utilities on demand and remotely manage electricity consumption at commercial, institutional and industrial customer sites. Our solution provides the following benefits:
Compelling Value Proposition to Grid Operators and Utilities. On the supply side, grid operators and utilities deploy our technology-enabled demand response solutions to supplement, avoid or defer costly investments in generation, transmission and distribution facilities and to enhance the reliability of the electric power grid system. Our demand response solutions help grid operators and utilities achieve their capacity and capacity reserve margin goals quickly and economically and allow them to diversify their portfolio of resources, without requiring the installation of any hardware or software at their facilities. Whereas it typically takes years to site, permit and construct a power plant and the associated transmission and distribution infrastructure, demand response capacity can generally be enabled within months, in densely populated, constrained areas, exactly where the new capacity is needed most and with no need for new transmission or distribution infrastructure. We either enter into long-term contracts to sell our demand response capacity to grid operators and utilities, or participate in the open market opportunities for demand response that they establish. Together with these demand response solutions, our energy management solutions enhance the reliability of regional electric power grids by providing grid operators and utilities the ability to measure, manage, shift and reduce energy consumption in specific distribution areas within minutes.
Compelling Value Proposition To End-Use Customers. On the demand side, our turnkey, outsourced demand response and energy management solutions create new streams of recurring cash flows, reduce energy costs and simplify energy management for our commercial, institutional and industrial customers. Our offerings typically involve no up-front capital investment on the part of our end-use customer. We share demand response payments, called capacity payments, that we receive from grid operators and utilities with our end-use customers for agreeing to reduce their electrical consumption whether or not they are actually called upon to do so. We also generally make additional payments, called energy payments, when they actually reduce their consumption from the electric power grid.
Energy Management Solutions for End-Use Customers. Our demand response solutions position us to deliver additional energy management solutions to our commercial, institutional and industrial customers. These end-use customers are increasingly focused on efficiently managing their energy consumption and reducing costs. The real-time energy consumption data that we gather in our PowerTrak enterprise software platform empowers our monitoring-based commissioning services to identify savings opportunities in our end-use customers' energy costs across departments and throughout those customers' operations on an enterprise-wide basis. The devices that we have installed
7
in connection with our demand response solutions enable us to implement our monitoring-based commissioning services. In addition, the data that we gather in our CarbonTrak enterprise software platform enables our end-use customers to track their greenhouse gas emissions and develop carbon management plans to achieve reduction targets. Overall, by delivering a recurring cash stream for our end-use customers, we are often viewed by them as a trusted partner who can help address their increasingly complex energy challenges.
Open, Scalable and Secure Architecture. Our NOC is supported by our PowerTrak enterprise software platform, which is built on an open and scalable Web services architecture. PowerTrak is able to interface with energy management and building automation systems at commercial, institutional and industrial customer sites, thereby enabling us to cost-effectively leverage existing technology for remote monitoring and control from our NOC. PowerTrak's analytical tools enable a single NOC operator to supervise hundreds of end-use metering and control points and simultaneously optimize demand response performance and energy savings measures across numerous end-use customer sites and geographic regions. We have built a comprehensive security infrastructure, including firewalls, intrusion detection systems and data encryption, and have established fail-over redundancy for our information technology systems.
Reduced Environmental Impact. By reducing electricity consumption during periods of peak demand and other system emergencies, our demand response solutions can displace older, inefficiently-used power plants, and defer new generation, transmission and distribution development, resulting in reduced emissions and land use benefits. These environmental benefits are particularly clear when demand response capacity qualifies under regional regulations as operating reserves. In these areas, grid operators and utilities call on demand response when contingencies such as power plant or transmission outages occur, which can offset the need to keep centralized peaking power plants running on idle for thousands of hours per year. Dispatchable demand response capacity therefore allows grid operators and utilities to meet reserve requirements with significantly less environmental impact than conventional supply-side alternatives. In addition, we believe that growing participation in demand response by commercial, institutional and industrial organizations will lead to an increased focus on energy management efforts, including energy efficiency and conservation, through which end-use customers can significantly reduce air emissions.
Management of Intermittent Renewable Power Source Shortfalls. We expect that the electric power industry in North America will face challenges in managing an increased amount of intermittent renewable energy resources that are expected to be connected to the power grid in the future. Although these numbers will be smaller initially, as grid operators and utilities move to meet increased regulatory requirements for renewable energy sources at the state level and look ahead to possible Federal renewable energy portfolio standards, we believe our demand response solutions will offer additional value to grid operators and utilities trying to address some of the risks inherent in renewable energy sources that are less predictable than traditional baseload energy generation sources. Some of the primary current candidates for large-scale renewable energy sources such as wind and solar power provide fluctuating amounts of power based on external factors such as weather and atmospheric conditions. Accordingly, grid operators and utilities must plan for the risk that these kinds of renewable resources will not be available on a consistent basis. This means that reserve margins, or excess capacity available during normal operations, must be higher. We believe that our demand response solutions offer a more cost-effective solution for providing a wide variety of reserve capacity than traditional peaking power plants, which require significant infrastructure expenditures for capacity that is infrequently used, and that this cost benefit gives us an additional competitive advantage when pursuing demand response opportunities from grid operators and utilities.
Competitive Strengths
Our competitive strengths position us for continued leadership and rapid expansion in the clean and intelligent energy solutions sector.
8
Leading Provider with a Diversified Product Suite and Nationwide Presence. We are a pioneer in the development, implementation and broader adoption of technology-enabled demand response solutions to commercial, institutional and industrial customers on a national scale. With over 3,550 MW under management as of December 31, 2009 and an end-use customer base of approximately 2,800 accounts across 6,500 customer sites throughout multiple electric power grids as of December 31, 2009, we believe that we are the largest demand response service provider in the United States for commercial, institutional and industrial customers. We leverage our leadership role in the demand response market to cross-sell additional energy management solutions to our end-use customers, including our monitoring-based commissioning services, energy procurement services and emissions tracking and trading support services. In addition, we believe our national presence is a key differentiator that enables us to offer a single platform for our customers who have national operations to participate in our diversified suite of solutions across different geographic regions with different market rules and conditions.
Established Track Record of Reliable Performance and Demonstrated Growth. We have an established track record of reliably delivering demand response capacity when called to do so by grid operators and utilities. Specifically, in 2008 and 2009, we delivered performance that averaged over 100%, based on nominated versus delivered capacity. Our substantial base of operating experience in successfully delivering demand response solutions has enabled us to rapidly and significantly grow our base of grid operator and utility customers. In 2009, we increased our MW under management by 1,500 MW to more than 3,550 MW as of December 31, 2009. For the year ended December 31, 2009, our revenues increased by 80% as compared to revenues for the year ended December 31, 2008.
Highly Scalable Business Model with Increasing Operating Leverage. The dynamics of the commercial, institutional and industrial market enable us to rapidly scale our business in existing and new geographies. Once a demand response market is established in a region, the marginal cost of acquiring and servicing commercial, institutional and industrial customers is relatively low compared to traditional supply-side capacity resources. In addition, the large size of our target end-use customers significantly lowers our acquisition cost per unit of capacity compared to the acquisition cost of residential customers. Commercial, institutional and industrial customers also often have one decision maker who controls multiple sites, thereby accelerating our acquisition of new capacity under management, lowering our cost to expand our network of managed sites and providing more opportunities to cross-sell our suite of energy management solutions. In addition, our NOC and scalable PowerTrak technology platform create operating leverage, enabling us to significantly grow MW under management and revenue without adding significant employee resources. For example, since inception, our productivity has improved with MW under management per full time employee increasing from 4.1 MW as of December 31, 2006 to 8.5 MW as of December 31, 2009.
Recurring and Visible Revenues. We enter into long-term contracts and participate in open market bidding programs with grid operators and utilities under which we are paid recurring payments, typically on a monthly basis, for the capacity that we make available, whether or not we are called upon to reduce our end-use customers' electricity consumption from the electric power grid. These long-term contracts generally range between three and 10 years in duration and these recurring payments significantly increase the visibility and predictability of our future revenues. In addition, we enter into long-term contracts that generally range between three and five years in duration with commercial, institutional and industrial customers who provide us with demand response capacity.
Differentiated Technology Platform. Our scalable, proprietary technology platform, in addition to our established track record and experience, creates a significant competitive advantage for us. We communicate via the Internet using advanced metering applications and automation equipment that we or third parties install at end-use customer sites to make demand response participation viable for a wide range of commercial, institutional and industrial organizations. The open architecture design of
9
our proprietary technology platform enables us to interface with existing and new energy management and building automation systems which use a variety of protocol languages. Once an end-use customer is enabled in our network, we collect real-time energy consumption data. This data enables our software to perform demand response measurement and verification, and also provides the underlying information to conduct further energy management analysis and provide decision-making support. We further strengthened our differentiated technology platform in 2009 by successfully launching and deploying PowerTalk, the industry's first standards-based presence-enabled smart grid communications technology, at over 750 customer sites. In addition, rather than being limited to curtailing electricity used by a specific type of equipment, such as air-conditioning units, our platform enables us to manage a wide array of equipment and systems to implement appropriate demand response solutions on an end-user by end-user basis.
Strategy
Our strategy is to capitalize on our established track record, substantial operating experience and scalable and proprietary technology platform, as well as our leading market position in the United States, to continue providing clean and intelligent energy solutions to commercial, institutional and industrial customers, grid operators, and utilities. Our aim is to become the leading outsourced demand response and energy management solutions provider for commercial, institutional and industrial customers worldwide. Key elements of our strategy include:
Strengthen Presence by Growing in Existing and New Regions in the United States. We will continue to pursue opportunities to provide demand response capacity to grid operators and utilities in markets in the United States through additional long-term contracts and open market opportunities for demand response capacity. To provide this demand response capacity, we expect to enter into contracts with new commercial, institutional and industrial customers. We will also seek to cross-sell additional energy management solutions, such as our monitoring-based commissioning services, energy procurement services and emissions tracking and trading support services, to these end-use customers. Our sales force will primarily focus their efforts on the following seven vertical markets: technology, education, food sales and storage, government, healthcare, manufacturing/industrial and commercial real estate. We believe that our full-service demand response and energy management solutions, the recurring payments that we provide and our national presence will enable us to continue to pursue rapid growth of our end-use customer base.
Expand Sales of our Growing Portfolio of Technology-Enabled Energy Management Solutions. We believe that our demand response solutions have uniquely positioned us to deliver additional energy management solutions to our growing network of commercial, institutional and industrial customers. We will continue to develop our technology, including our PowerTrak enterprise software platform. This platform enables us to measure, manage, benchmark and optimize end-use customers' energy consumption and facility operations. We will continue through our monitoring-based commissioning services to use real-time and historical energy data to help end-use customers analyze and reduce their consumption of electricity, forecast demand, continuously monitor building management equipment to optimize system operation, model rates and tariffs and create energy scorecards to benchmark similar facilities. In addition, we offer our energy procurement services to our end-use customers, which enable them to mitigate risk through competitive energy supply contracts and achieve energy cost savings. We also offer our end-use customers emissions tracking and trading support services through our CarbonTrak enterprise software platform, which enables them to more effectively monitor, mitigate and monetize their greenhouse gas emissions in response to existing and pending greenhouse gas reporting requirements. We believe that our end-use customers will become increasingly aware of their energy costs and consumption and will look to advanced analytics and trusted third-party providers to help them better manage their overall energy expenditures.
10
Actively Pursue Targeted Strategic Acquisitions. We intend to actively pursue selective acquisitions to reinforce our leadership position in the expanding clean and intelligent energy solutions sector. This sector consists of a number of companies with technology offerings or customer relationships that present attractive acquisition opportunities. We intend to look for opportunities to acquire technologies that would support and enhance our current technology platform with a particular focus on growing our energy management solutions. Customer relationship acquisitions will focus on expansion into new geographic regions both in the United States and internationally. We have a strong track record of successfully integrating acquired companies to increase our customer base, entering new geographic regions, improving our product offering and enhancing our technology. In June 2009, we acquired substantially all of the assets of eQ, a software company specializing in the development of enterprise sustainability management products and services, to strengthen our position in a nascent yet growing market committed to helping energy and sustainability leaders develop their own plans to achieve energy efficiency and emissions goals. In December 2009, we acquired Cogent, a company specializing in comprehensive energy consulting, engineering and building commissioning solutions to commercial, institutional and industrial customers.
Target Expansion by Entering International Markets. We also intend to expand our addressable market by pursuing demand response and energy management opportunities in international markets. We are a pioneer in the development, implementation and broader adoption of clean and intelligent energy solutions and have built a national footprint in the United States We believe we can achieve a similar significant first mover advantage internationally, principally in Canada, the United Kingdom and Europe. We believe that our scalable technology platform and proprietary operational processes are readily adaptable to the international markets we are targeting. We believe that entering new international markets will provide a significant opportunity to grow our customer base and provide a differentiated offering to customers with international operations. For example, during the third quarter of 2009, we commenced operations in the United Kingdom by enrolling MW in National Grid's Short-Term Operating Reserve program.
Our Clean and Intelligent Energy Solutions
Demand Response Solutions
Demand response is achieved when end-use customers reduce their consumption of electricity from the electric power grid in response to a market signal. End-use customers can reduce their consumption of electricity by reducing demand (for example, by dimming lights, resetting air conditioning set-points or shutting down production lines) or they can self-generate electricity with onsite generation (for example, by means of a back-up generator or onsite cogeneration). Our demand response capacity provides a more timely, cost-effective and environmentally sound alternative to building conventional supply-side resources, such as natural gas-fired peaking power plants, to meet infrequent periods of peak demand.
Although electric power utilities have offered less technology-enabled forms of demand response to their largest electricity consumers for decades in the form of interruptible tariffs—a mechanism that allows utilities to call on customers to reduce consumption during periods of peak demand in exchange for lower rates—these programs typically lack an affordable means of real-time data communication and adequate automation technologies to make demand response participation viable for most commercial, institutional and industrial organizations. We believe that the widespread adoption of the Internet, as well as cost-effective and robust metering and control technologies, have created a new opportunity for technology-enabled demand response solutions to drive significant benefits for all stakeholders.
We have pursued this opportunity by building our proprietary technologies and operational processes that make demand response participation possible for a wider range of electricity consumers.
11
The devices that we install at our commercial, institutional and industrial customer sites transmit to us via the Internet electrical consumption data on a 1-minute, 5-minute, 15-minute and hourly basis, which is referred to in the electric power industry as near real-time data. Our proprietary software applications analyze the data from individual sites and aggregate data for specific regions. When a demand response event occurs, our NOC automatically processes the notification coming from the grid operator or utility. Our NOC operators then begin activating procedures to curtail demand from the grid at our commercial, institutional and industrial customer sites. Our one-click curtailment activation sends signals to all registered sites in the targeted geography where the event is occurring. Upon activation of remote demand reduction, our technology, which is receiving near real-time data from each site, is able to determine on a near real-time basis whether the location is performing as expected. Signals are relayed to our NOC operators when further steps are needed to achieve demand reductions at any given location. Each end-use customer site is monitored for the duration of the demand response event and operations are restored to normal when the event ends.
We offer the following three distinct demand response solutions to serve the needs of grid operators and utilities: (i) reliability-based demand response, (ii) price-based demand response, and (iii) short-term reserve resources referred to in the electric power industry as ancillary services.
Reliability-Based Demand Response. We receive recurring capacity payments from grid operators and utilities for being on call, which means having available previously registered demand response capacity that we have aggregated from our commercial, institutional and industrial customers, regardless of whether we receive a signal to reduce consumption. When we receive a signal from a grid operator or utility customer, which we refer to as a dispatch signal, our proprietary software applications automatically notify our end-use customers that a demand reduction is needed and initiate processes that reduce electrical consumption by certain of our commercial, institutional and industrial customers in the targeted area. When we are called to implement a demand reduction, we typically receive an additional payment for the energy that we reduce. Our commercial, institutional and industrial customers will then receive a payment from us. We are called upon to perform by grid operators and utilities during periods of high demand or supply shortfalls, otherwise known as capacity deficiency events. By aggregating a large number of end-use customers to participate in these reliability-based programs, we believe that we have played a significant role over the past several years in helping to prevent brownouts and blackouts in some of the most capacity constrained regions in the United States. We currently provide reliability-based demand response solutions to ISO New England, Inc., or ISO-NE, PJM Interconnection, or PJM, the New York Independent System Operator, or New York ISO, San Diego Gas and Electric Company, or SDG&E, Southern California Edison Company, Electric Reliability Council of Texas, or ERCOT, and Pacific Gas and Electric Company, among others.
Price-Based Demand Response. Our price-based demand response solutions enable commercial, institutional and industrial customers to monitor and respond to wholesale electricity market price signals when it is cost-effective for them to do so. We register a "strike price" with respect to each end-use customer using this solution, above which it may be economical for that customer to reduce its consumption of electricity. We receive an energy payment in the amount of the wholesale market price for the electricity that the end-use customer does not consume and share this payment with that customer. If prices in a given market approach a given strike price, our solutions automatically notify the end-use customer and initiate processes that reduce electrical consumption from the electric power grid. We currently participate in price response programs in the Mid-Atlantic and New England.
Ancillary Services. Demand response is utilized for short-term reserve requirements, referred to in the electric power industry as ancillary services, including operating reserves. This solution is called upon by grid operators and utilities during short-term contingency events such as the loss of a transmission line or large power plant. Through our technology, certain end-use customers are able to
12
provide near instantaneous response for these numerous short-term system events, and often do so with negligible impact on their business operations. Grid operators and utilities rely on a reserve pool of these quick-start resources to step in and provide short-term support as needed during these contingency events. The goal of grid operators and utilities is to get these resources back into standby mode as quickly as possible after they are dispatched so that the reserve pool of available capacity is replenished. Examples of ancillary services markets in which we participate include PJM's Synchronized Reserves Market, in which we were the first provider of demand response capacity, and ISO-NE's Demand Response Reserves Pilot program.
Energy Management Solutions
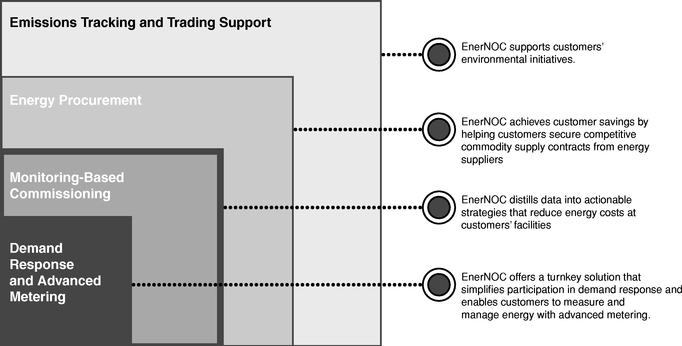
We have an expanding portfolio of additional energy management solutions. We believe that our demand response solutions have positioned us to deliver additional energy management solutions to our growing network of commercial, institutional and industrial customers. By collecting and reporting real-time energy consumption data and by delivering a stream of recurring payments to our end-use customers through demand response solutions, we hope to be viewed as a trusted partner who can help address their increasingly complex energy challenges. Our energy management solutions are aimed at helping address these challenges and at expanding our customer relationships. The diagram below provides an overview of these solutions.
In September 2007, we acquired Mdenergy, LLC, or MDE, an energy procurement services provider, to augment our expanding portfolio of additional energy management solutions. The MDE acquisition included the addition of hundreds of new commercial, institutional and industrial customers to whom we were providing energy procurement services as of December 31, 2009. In May 2008, we acquired South River Consulting, LLC, or SRC, an energy procurement and risk management services provider, which acquisition strengthened our position in a growing energy procurement services market and provides a local presence for us in the PJM service region. In June 2009, we acquired eQ, a software company specializing in the development of enterprise sustainability management products and services. In December 2009, we acquired Cogent, a company specializing in comprehensive energy consulting, engineering and building commissioning solutions to commercial, institutional and industrial customers. We intend to pursue and have pursued opportunities to provide demand response solutions to a substantial number of the new end-use customers derived from these acquisitions.
13
We currently offer the following technology-enabled energy management solutions to our commercial, institutional and industrial customers:
- •
- Monitoring-Based Commissioning
Services. Our monitoring-based commissioning services are a technology-based energy analytics service designed to help optimize the way
buildings operate, measure the impact of key energy and environmental decisions, and enhance the comfort of occupants. Our PowerTrak application integrates data from disparate energy management
systems with utility metering to gather data on an end-use customer's overall energy usage. Our analysts then use analysis tools, filters, and applications to monitor and review this data, and provide
distilled information and recommendations designed to optimize performance; reduce energy consumption; reduce carbon emissions; prioritize maintenance needs; and enhance occupant comfort.
- •
- Energy Procurement
Services. We offer to our end-use commercial, institutional and industrial customers various services related to procuring
and managing commodity supply contracts from competitive energy suppliers. We use our market knowledge and industry relationships, along with actual customer energy usage data that we track and manage
through PowerTrak, to achieve savings for customers. We bring customers strategic advice to help them capture favorable energy procurement contracts from competitive electricity and natural gas
suppliers. We take no position in the commodities market and assume no associated risk.
- •
- Emissions Tracking and Trading Support Services. Our emissions tracking and trading support services include a comprehensive, software-based accounting system for our commercial, institutional and industrial customers to effectively monitor, mitigate and monetize their greenhouse gas emissions in response to existing and pending greenhouse gas reporting requirements.
Technology and Operations
Technology
Since inception, we have focused on delivering industry-leading, technology-enabled demand response and energy management solutions. Our proprietary technology has been developed to be highly reliable and scalable and to provide a platform on which to design, customize, and implement demand response and energy management solutions. Our proprietary technology infrastructure is built on Linux, Java and Oracle and supports an open web services architecture. Our PowerTrak enterprise software platform enables us to efficiently scale our demand response offerings in new geographic regions and rapidly grow the end-use customers in our network. PowerTrak leverages web services that connect applications directly with other applications. They do this through a form of "loose coupling" which allows connections to be established across applications without customization. As a result, these connections can be established without regard to technology platform or programming language, making it easy to share technology across a broad range of users and companies. Web services enable business collaboration at the process level. Process-level collaboration requires software that is architected for communication across firewalls. We believe that business process collaboration over the Internet has wide-reaching implications for the ways in which energy transactions will be performed.
Our technology can be broken down into five primary components: the Network Operations Center, the EnerNOC Site Server, PowerTrak, PowerTalk and CarbonTrak.
Network Operations Center
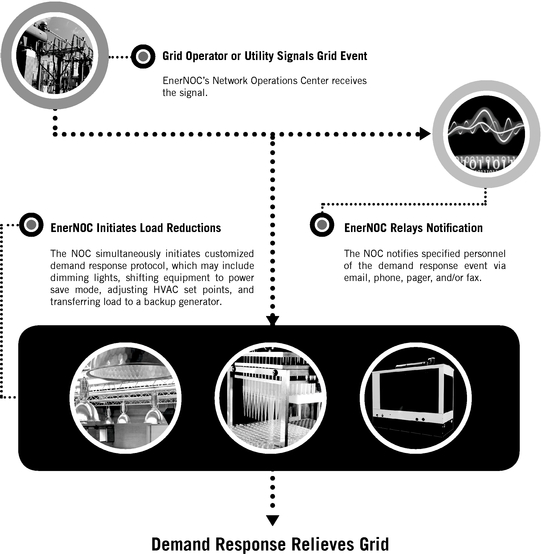
Our technology enables our NOC to automatically respond to signals sent by grid operators and utilities to deliver demand reductions within targeted geographic regions. We can customize our technology to receive and interpret many types of dispatch signals sent directly from a grid operator or
14
utility to our NOC. Following the receipt of such a signal, our NOC automatically notifies specified end-use customer personnel of the demand response event. After relaying this notification to our commercial, institutional and industrial customers, we initiate processes that reduce their electricity consumption from the electric power grid. These processes may include dimming lights, shifting equipment to power save mode, adjusting heating and cooling set points and activating a back-up generator. Demand reduction is monitored remotely with real-time data feeds, the results of which are displayed in our NOC through various data presentment screens. Each end-use customer site is monitored for the duration of the demand response event and operations are restored to normal when the event ends. We currently participate in demand response programs across North America and in the United Kingdom, some of which require demand reductions within 10 minutes or less. We have built a comprehensive security infrastructure, including firewalls, intrusion detection systems, and encryption for transmissions over the Internet, and have established fail-over redundancy for the information technology systems that support our NOC. The following diagram illustrates how we use our NOC to reduce electricity consumption from the electric power grid.
Our Technology Platform and Operational Processes
15
The EnerNOC Site Server
We work directly with end-use customers to ensure that they are able to respond quickly and completely to demand reduction instructions. We install a hardware device, called an EnerNOC Site Server, or ESS, at each end-use customer site to collect and communicate real-time electricity consumption data and, in many cases, enable remote control. The ESS communicates to our NOC through the customer's LAN or other internet connection. The ESS is an open, integrated system consisting of a central hardware device residing inside a standard electrical box.
The ESS serves as a gateway to connect our NOC with a variety of data collection systems and equipment at end-use customer sites. The ESS is typically installed in the electrical room at an end-use customer's site and is equipped to read and record voltage, current, power and other power quality electrical data of certain customer-owned electrical equipment, along with other important energy usage parameters, including natural gas, chilled water, steam and compressed air. It includes PowerTalk software which enables the secure, bi-directional transfer of data across firewalls and over the Internet. The ESS is used to locally connect into many types of building management equipment and systems that support a range of communications protocols and interfaces such as LonWorks, BACnet/IP, Modbus RTU, Modbus TCP/IP, and SNMP. The ESS also provides protocol translation so that data from legacy building management systems can be connected directly to our NOC. This advanced connectivity allows us to use a customer's existing infrastructure investment, lowering our overall cost of enablement and making data available to corporate networks and the Internet through industry standard communication protocols.
PowerTrak
PowerTrak is our web-based enterprise software platform used for power measurement, load control and energy analysis, and is the underlying software that runs our NOC. It utilizes a modular web services architecture that is designed to allow application modules to be easily integrated into the platform. We believe that a key factor to successfully offering clean and intelligent energy solutions is integrating data from disparate sources and utilizing it to deliver customer-focused solutions utilizing open protocols. The following diagram and description provide an overview of our system architecture.
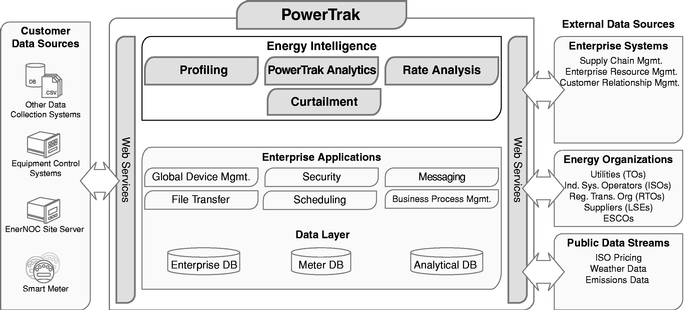
- •
- Energy Intelligence. This proprietary suite of web-enabled modules delivers demand response and energy management capabilities by processing near real-time and historical data from our data warehouse. Energy intelligence provides actionable energy information to users and offers a way
16
- •
- Enterprise
Applications. This Java-based middle layer of the application is where we have defined and implemented our business
processes, business rules, and business logic that pertain to global device management, security, messaging, file transfer, scheduling and business process management. These enterprise components
provide the core web services that coordinate the near real-time exchange of data between devices, people, external data sources, and other enterprise applications.
- •
- Data Layer. The data layer is a relational database that is designed for query, analysis and transaction processing and data collection, processing, aggregation and validation. It contains historical energy data and data from other sources. It separates analysis workload from transaction workload and enables us to consolidate data from several sources. These records include customer demographics, interval energy information (for example, 1-minute, 5-minute and 15-minute), as well as weather, emissions, pricing and aggregated summary data.
for users to view and manipulate this data. Modules include: Profiling, which enables usage tracking; PowerTrak Analytics, which enables users to conduct asset performance and emissions tracking, load forecasting, benchmarking and scorecard reporting; Rate Analysis, which enables users to compare utility tariffs with competitive supply offers; and Curtailment, which enables us to curtail electricity consumption and dispatch generators based on signals from grid operators.
Currently, PowerTrak collects facility consumption data on a 1-minute, 5-minute, 15-minute and hourly basis and integrates that data with near real-time, historical and forecasted market variables. We use PowerTrak to measure, manage, benchmark and optimize end-use customers' energy consumption and facility operations. We use this data to help end-use customers analyze consumption patterns, forecast demand, measure real-time performance during demand response events, continuously monitor building management equipment to optimize system operation, model rates and tariffs and create energy scorecards to benchmark similar facilities. In addition, CarbonTrak enables us to track each end-use customer's greenhouse gas emissions by mapping their energy consumption with the fuel mix used for generation in their location, such as the proportion of coal, nuclear, natural gas, fuel oil and other sources used.
We have generally provided basic PowerTrak functionality as part of the overall service offering to the end-use customers who participate in our demand response programs. As part of our monitoring-based commissioning services, we use PowerTrak to identify and deliver energy efficiency strategies for our customers. We believe that end-use customers will become increasingly aware of their energy costs and consumption and will look to advanced analytics and trusted third-party providers to help them better manage their overall energy expenditures.
PowerTalk
In 2009, we announced the deployment of PowerTalk, the industry's first presence-enabled smart grid technology, at certain of our commercial, institutional, and industrial customer sites. PowerTalk enables real-time communication through open, standards-based presence technology between most Internet-enabled smart meters or devices and our NOC. The always-on, two-way presence-based connection created by PowerTalk significantly enhances visibility into our demand response network. PowerTalk also streamlines the site enablement process, allowing us to more efficiently equip end-use customers to participate in demand response programs. PowerTalk-enabled devices are "firewall friendly" and can leverage existing end-use customer networks to facilitate secure, authenticated and encrypted communication, without the need to establish a virtual private network.
CarbonTrak
CarbonTrak is our web-based enterprise software platform used to enable end-use customers to track their greenhouse gas emissions and develop carbon management plans to achieve reduction targets. CarbonTrak utilizes a highly flexible and scalable data model, which allows the end-use
17
customer to input a variety of fuel and emissions sources and automatically translate the resulting data in light of the requirements of various mandatory and voluntary carbon accounting and carbon reporting programs. In addition, CarbonTrak provides templates for common energy efficiency measures, such as lighting upgrades, allowing end-use customers to model potential energy savings projects and examine cost effectiveness and margin carbon cost. As a result of existing and pending greenhouse gas reporting requirements, we believe that end-use customers will become increasingly aware of their greenhouse gas emissions and will look to third-party providers to help them better calculate, track, report and manage their carbon emissions.
Sales and Marketing
As of December 31, 2009, our sales team consisted of 113 employees. We organize our sales efforts by customer type. Our utility sales group sells to grid operators and utilities, while our commercial and industrial sales group sells to commercial, institutional and industrial customers. Our utility sales group is responsible for securing additional long-term contracts from grid operators and utilities for our demand response and energy management solutions. These sales typically take 12 to 18 months to complete and, when successful, typically result in multi-million dollar contracts with terms that generally range between three and 10 years. We actively pursue long-term contracts in both restructured markets and in traditionally regulated markets. Our commercial and industrial sales group sells our demand response and energy management solutions to commercial, institutional and industrial customers. These sales typically take two to four months to complete and have terms that generally range between three and five years. Our commercial and industrial sales group is located in major electricity regions throughout North America, including New England, New York, the Mid-Atlantic, Texas, Florida, California, and internationally in Canada and the United Kingdom.
Our marketing organization consisted of 33 employees as of December 31, 2009. This group is responsible for influencing all market stakeholders including customers, energy users and policymakers, attracting prospects to our business, enabling the sales engagement process with messaging, training and sales tools, and sustaining and expanding relationships with existing customers through renewal and retention programs and by identifying cross-selling opportunities. This group researches our current and future markets and leads our strategies for growth, competitiveness, profitability and increasing market share.
Customers
End-Use Customers
As of December 31, 2009, we managed over 3,550 MW of technology-enabled demand response capacity from over 2,800 commercial, institutional and industrial customers in our demand response network across approximately 6,500 customer sites. The following table lists some of our end-use customers as of December 31, 2009 in each of the seven key vertical markets that our commercial and industrial sales group primarily targets for demand response and energy management opportunities:
| Technology | Education | Food Sales and Storage | Commercial Real Estate | |||
|---|---|---|---|---|---|---|
| AT&T | University of San Diego | Albertsons | Beacon Properties | |||
| Level 3 Communications | The California State University | Raley's | Morguard Investments Limited | |||
| General Electric | Southern Connecticut State University | Pathmark | Washington Realty Investment Trust | |||
| Adobe Systems | Western Connecticut State University | Stop & Shop | Westcor | |||
| New Haven Public Schools | Shop Rite |
| Government | Healthcare | Manufacturing/Industrial | |
|||
|---|---|---|---|---|---|---|
| State of Vermont | Partners Healthcare | O&G Industries | ||||
| State of Connecticut | Stamford Hospital | Pfizer | ||||
| City of Boston, MA | Greenwich Hospital | Verso Paper | ||||
| State of Rhode Island | Hartford Hospital | Cascades | ||||
| City of New Haven, CT | UMass Memorial Health Care |
18
Supermarkets are a good example of how our technology and solutions function to deliver demand response capacity to grid operators and utilities while delivering significant value to the end-use customer. Supermarkets operate with thin margins, and energy savings can significantly impact financial results. It has been calculated that a 10% reduction in energy costs for the average supermarket is equivalent to increasing net profit margins by 16%. Because the profit margins of supermarkets are so thin, on the order of 1%, the U.S. Environmental Protection Agency estimates that $1.00 in energy savings is equivalent to increasing sales by $59.00.
Supermarkets have a number of measures that can be taken to reduce their electrical demand from the grid. Most supermarkets have a natural gas-fired emergency generator to ensure that shoppers who are in the checkout line can pay for products in the event of a power disruption. In many regions, these can be activated at times when a supermarket is called on to reduce demand. Supermarkets also have the option to curtail non-critical electrical loads that do not interfere with shopping. Lighting in many supermarkets is separated into different circuits and curtailing approximately one-third of the lights does not impact business continuity. Additionally, air handlers, anti-sweat heaters, and other ancillary loads can be curtailed. On average, our supermarket customers are able to achieve 70 kW of demand reduction from the grid for each supermarket location by implementing these types of demand response strategies.
Our demand response solutions enable this demand reduction. Our hardware is typically installed in each store to provide for remote control of devices in certain circumstances and collection and communication of real-time electricity consumption information (i.e., metering). Our hardware communicates through the supermarket's LAN or through a broadband wireless connection. Our hardware has the ability to communicate directly with the physical building management system at many supermarket sites. It also may have the ability to communicate directly with discrete lighting panels and automatic transfer switches coupled to emergency generators in the event that a building management system does not exist. From our NOC, depending on the configuration of our curtailment protocol at each supermarket, we are able to send a command over the Internet to reduce electrical consumption. Demand reduction is monitored remotely with real-time data feeds, the results of which are displayed in our NOC through various data presentment screens. Each supermarket is monitored for the duration of the demand response event and operations are restored to normal when the event ends.
Grid Operator and Utility Customers
We have significantly grown our base of grid operator and utility customers since inception. As of December 31, 2009, our grid operator and utility customer base included ISO-NE, Idaho Power Company, New York ISO, PJM, Pacific Gas and Electric Company, Southern California Edison Company, SDG&E, Public Service Company of Colorado, Public Service Company of New Mexico, Salt River Project, Tampa Electric Company, ERCOT, Ontario Power Authority and Tennessee Valley Authority, among others. We provide reliability-based demand response, price-based demand response and ancillary services for them.
Competition
We face competition from other clean and intelligent energy solutions providers and advanced metering infrastructure service providers, as well as utilities and competitive electricity suppliers who offer their own demand response and energy management solutions. We also compete with traditional supply-side resources, such as peaking power plants.
The clean and intelligent energy solutions sector is fragmented. In the demand response sector, we compete with various providers on a regional basis. When competing for grid operator and utility customers, we believe that the primary factors on which we compete are pricing of the capacity that is made available, as well as the financial stability, historical performance levels and overall experience of
19
the demand response solutions provider. When competing for commercial, institutional and industrial customers, we believe that the primary factors are the level of capacity payments shared with the end-use customer for their demand response capacity, level of sophistication employed by the demand response service provider to identify and optimize demand response capabilities at their facilities and ability of the demand response service provider to service multiple sites across different geographic regions and provide additional technology-enabled energy management solutions. Some providers of advanced metering solutions have added, or may add, demand response products and services to their existing business. Some advanced metering infrastructure service providers are substantially larger and better capitalized than we are and have the ability to combine advanced metering and demand response solutions into an integrated offering to a large existing customer base. We believe that our operational experience, first mover advantage, leadership in the clean and intelligent energy solutions sector and our established base of customers gives us an advantage when competing for commercial, institutional and industrial customers.
Utilities and competitive electricity suppliers could and sometimes do also offer their own demand response solutions, which could decrease our base of potential customers and could decrease our revenues and delay or prevent our profitability. However, demand response programs, as administered by utilities alone, are bound to standard tariffs to which all end-use customers in the utility's service territory must abide. Utilities must treat all rate class customers equally in order to serve them under public utility commission-approved tariffs. In contrast, we have the flexibility to offer customized solutions to different end-use customers. We believe that we also have technology and operational experience at the facility-level, behind the meter, that both utilities and competitive electricity suppliers lack. Furthermore, we believe that our solutions are complementary to utilities and competitive electricity suppliers' demand response efforts because we can help enlist end-use customers to their existing programs, reduce their workload by serving as a single point of contact for an aggregated pool of end-use customers who choose to participate in their programs, and act to uphold or enhance end-use customer satisfaction. However, utilities and competitive electricity suppliers may offer clean and intelligent energy solutions at prices below cost or even for free in order to improve their customer relations or competitive positions, which would decrease our base of potential end-use customers and could decrease our revenues and delay or prevent our profitability.
We also compete with traditional supply-side resources such as natural gas-fired peaking plants. In some cases, utilities have an incentive to invest in these fixed assets rather than develop demand response as they are able to include the cost of fixed assets in their rate base and in turn receive a return on investment. In addition, some utilities have a financial disincentive to invest in demand response and even more so in energy efficiency because reducing demand can have the effect of reducing their sales of electricity. However, we believe that our solutions are gaining substantial regulatory support and will continue to do so as they are faster to market, require no electric power generation, transmission or distribution infrastructure, and are more cost-effective and more environmentally sound than traditional alternatives.
Regulatory
We provide demand response solutions in restructured electricity markets and in traditionally regulated electricity markets. In restructured markets, we often provide our solutions to the regional grid operators that are responsible for the reliability and efficient operation of the bulk electric power system, such as PJM. In traditionally regulated markets, we provide our solutions to utilities, such as Public Service Company of New Mexico and Tampa Electric Company.
Regulations within both types of markets impact how quickly our solutions may be adopted, the prices we can charge and profit margins we can earn, the timing with respect to when we begin earning revenue, and the various ways in which we are permitted or may choose to do business and accordingly, impact our assessments of which potential markets to most aggressively pursue. In addition, certain of
20
our contracts with utilities are subject to regulatory approval, which regulatory approval may not be obtained on a timely basis, if at all.
The prices we can charge and profit margins we can earn can be impacted by market policies, such as program rules that discount the value of demand response resources because they can only be available during a limited number of peak demand hours, unlike other types of capacity resources that may be available 24 hours per day, every day of the week. Similarly, regulations defining what constitutes a demand response event can affect the amount of demand response capacity that we are able to enlist from end-use customers and the amount that we need to pay them for their participation.
The policies regarding the measurement and verification of demand response resources, safety regulations and air quality or emissions regulations, which vary by state, affect how we do business. For example, some state environmental agencies may limit the amount of emissions allowed from back-up generators utilized by end-use customers, even when back-up generators are strictly used to maintain system reliability. For example, in California, demand response capacity is generally not permitted to come from end-use customers who activate back-up generators in order to reduce their electric power grid usage. Therefore, the use of back-up generators is limited under all of our contracts with that state's utilities, with the exception of a contract that our subsidiary, Celerity Energy Partners San Diego, LLC, or Celerity, entered into with SDG&E, which allows use of back-up generators on which we install emissions control equipment. Measurement and verification policies of various markets influence how we modify the metering and control devices we install and data we record at each end-use customer site in those markets. In limited cases, we provide an interconnected demand response resource that exports power to the electric power grid for resale, such as in the case of the contract between Celerity and SDG&E, and under certain circumstances our demand response resources may be used for other ancillary services, such as exporting power to the electric power grid as a short-term reserve resource. The export of power for resale or exporting power to the electric power grid for other ancillary services is subject to the requirements of the Federal Power Act and the direct regulation of FERC.
Intellectual Property
We utilize a combination of intellectual property safeguards, including patents, copyrights, trademarks and trade secrets, as well as employee and third-party confidentiality and proprietary information agreements, to protect our intellectual property. As of December 31, 2009, in the United States we held two patents, one of which expires in 2024 and the other of which expires in 2022, and one published patent application. We also had three pending or published patent applications filed under the Patent Cooperation Treaty for Canada and Australia. Our patent applications, and any future patent applications might not result in a patent being issued with the scope of the claims we seek, or at all; and any patents we may receive may be challenged, invalidated or declared unenforceable. We continually assess appropriate circumstances for seeking patent protection for those aspects of our technology, designs and methodologies and processes that we believe provide significant competitive advantages.
As of December 31, 2009, we held 13 trademarks/service marks in the United States. These are EnerNOC, ENERBLOG, Get More from Energy, Energy for Education, Capacity on Demand, PowerTrak, PowerTalk, Celerity Energy, The Cleanest kWh is the One Never Used, The Greenest Kilowatt-hour is the One Never Used, One-Click Curtailment, Clean Green California and CarbonTrak. Several of these trademarks are also registered in the European Community, Australia and Canada. In addition, we have a number of trademark applications pending in the United States, Canada, South Africa, Australia, Japan and the Peoples Republic of China.
With respect to, among other things, proprietary know-how that is not patentable and processes for which patent protection may not offer the best legal and business protection, we rely on trade secret protection and employ confidentiality and proprietary information agreements to safeguard our
21
interests. Many elements of our demand response and energy management solutions involve proprietary know-how, technology or data that are not covered by patents or patent applications, including technical processes, equipment designs, algorithms and procedures. We have taken security measures to protect these elements. All of our employees have entered into confidentiality and proprietary information agreements with us. These agreements address intellectual property protection issues and require our employees to assign to us all of the inventions, designs, and technologies they develop during the course of employment with us. We also seek confidentiality and proprietary information protection from our customers and business partners before we disclose any sensitive aspects of our demand response and energy management technology or business strategies. We have not been subject to any material intellectual property claims.
Seasonality
Peak demand for electricity and other capacity constraints tend to be seasonal. Peak demand tends to be most extreme in warmer months, which may lead some capacity markets to yield higher prices for capacity or contract for the availability of a greater amount of capacity during these warmer months. As a result, our revenues can fluctuate from quarter to quarter based upon the seasonality of our demand response business in certain of the markets in which we operate, where payments under certain of our long-term capacity contracts and pursuant to certain open market bidding programs in which we participate are higher or concentrated in particular seasons and months. For example, in the PJM forward capacity market, which is a market in which we materially increased our participation beginning in the first quarter of 2008 and in which we expect to continue to increase our participation and derive revenues for the foreseeable future, we recognize capacity-based revenue from PJM over the four-month delivery period of June through September. This typically results in higher revenues in our second and third quarters as compared to our first and fourth quarters.
Employees
As of December 31, 2009, we had 418 full-time employees, including 146 in sales and marketing, 49 in research and development and 223 in general and administrative. Of these full-time employees, 226 were located in New England, 21 were located in New York, 44 were located in the Mid-Atlantic, 77 were located in California, five were located in Canada, ten were located in Texas, eight were located in Illinois, five were located in Tennessee, five were located in the United Kingdom and 17 were located in other areas across the United States. We expect to grow our employee base and our future success will depend in part on our ability to attract, retain and motivate highly qualified personnel, for whom competition is intense. Our employees are not represented by any labor unions or covered by a collective bargaining agreement and we have not experienced any work stoppages. We consider our relations with our employees to be good.
Available Information
We were incorporated in Delaware on June 5, 2003 and have our corporate headquarters at 101 Federal Street, Suite 1100, Boston, Massachusetts 02110. We operated as EnerNOC, LLC, a New Hampshire limited liability company, from December 2001 until June 2003. We conduct operations and maintain a number of subsidiaries in the United States, Canada and the United Kingdom. We also maintain EnerNOC Securities Corporation, a Massachusetts securities corporation, to invest our cash balances on a short-term basis. Our Internet website address is www.enernoc.com. Our Annual Reports on Form 10-K, Quarterly Reports on Form 10-Q, Current Reports on Form 8-K and amendments to those reports filed or furnished pursuant to Section 13(a) or 15(d) of the Securities Exchange Act of 1934, as amended, or the Exchange Act, are available free of charge through the investor relations page of our internet website as soon as reasonably practicable after we electronically file such material with, or furnish it to, the Securities and Exchange Commission, or the SEC.
22
The statements contained in this section, as well as statements described elsewhere in this Annual Report on Form 10-K or in our other SEC filings, describe risks that could materially and adversely affect our business, financial condition and results of operations and the trading price of our securities. These risks are not the only risks that we face. Our business, financial condition and results of operations could also be materially affected by additional factors that are not presently known to us or that we currently consider to be immaterial to our operations.
Risks Related to Our Business
We have incurred net losses since our inception, and we may continue to incur net losses in the future and may never reach profitability.
Our net losses in 2009, 2008 and 2007 were $6.8 million, $36.7 million and $23.6 million, respectively. We have not achieved profitability for any calendar year, although we have for certain quarters, and we may continue to incur operating losses in the future. As of December 31, 2009, we had an accumulated deficit of $77.3 million. Initially, our operating losses were principally driven by start-up costs and the costs of developing our technology, which included research and development expenses. More recently, our net losses have been principally driven by selling and marketing expenses, and general and administrative expenses, including, without limitation, expenses related to increased headcount and the expansion of the number of MW under our management. Although we currently expect to be profitable for the year ending December 31, 2010, as we seek to grow our revenues and customer base, we plan to continue to expand our demand response and energy management solutions, which will require increased operating expenses. These increased operating costs, as well as other factors, may cause us to incur net losses for the foreseeable future, and there can be no assurance that we will be able to grow our revenues, sustain the growth rate of our revenues, expand our customer base, become profitable in 2010 or maintain profitability in any future years. Furthermore, these expenses are not the only factors that may contribute to our net losses. As a result, even if we significantly increase our revenues, we may continue to incur net losses in the future. If we fail to achieve profitability, the market price of our common stock could decline substantially.
We have a limited operating history in an emerging market, which may make it difficult to evaluate our business and prospects, and may expose us to increased risks and uncertainties.
We began operating as a New Hampshire limited liability company in December 2001 and were incorporated as a Delaware corporation in June 2003. We first began generating revenues in 2003. Accordingly, we have only a limited history of generating revenues, and the future revenue potential of our business in the emerging market for clean and intelligent energy solutions is uncertain. As a result of our short operating history, we have limited financial data that can be used to evaluate our business, strategies, performance and prospects or an investment in our common stock. Any evaluation of our business and our prospects must be considered in light of our limited operating history and the risks and uncertainties encountered by companies in an emerging market. To address these risks and uncertainties, we must do the following:
- •
- maintain our current relationships and develop new relationships with grid operators and utilities and the entities that
regulate them;
- •
- maintain and expand our current relationships and develop new relationships with commercial, institutional and industrial
customers;
- •
- maintain and enhance our existing demand response and energy management solutions, and technology systems;
23
- •
- continue to develop clean and intelligent energy solutions that achieve significant market acceptance;
- •
- continue to enhance our information processing systems;
- •
- execute our business and marketing strategies successfully, including accurately nominating demand response capacity to
our grid operator and utility customers, and delivering a high level of performance by assisting our end-use customers to reduce their energy usage during demand response events;
- •
- respond to competitive developments;
- •
- attract, integrate, retain and motivate qualified personnel; and
- •
- continue to participate in shaping the regulatory environment.
We may be unable to accomplish one or more of these objectives, which could cause our business to suffer. In addition, accomplishing many of these goals might be very expensive, which could adversely impact our operating results and financial condition. Any predictions about our future operating results may not be as accurate as they could be if we had a longer operating history and if the market in which we operate was more mature.
A substantial majority of our revenues are and have been generated from contracts with, and open market program sales to, a small number of grid operator and utility customers, and the modification or termination of these open market programs or sales relationships could materially adversely affect our business.
During the years ended December 31, 2007, 2008 and 2009, revenues generated from open market sales to PJM, a grid operator customer, accounted for 4%, 28% and 52%, respectively, of our total revenues. The PJM forward capacity market is a market in which we materially increased our participation beginning in the first quarter of 2008 and in which we expect to continue to increase our participation and derive revenues for the foreseeable future. The modification or termination of our sales relationship with PJM, or the modification or termination of any of PJM's open market programs in which we participate, could significantly reduce our future revenues and profit margins, have a material adverse effect on our results of operations and financial condition, and delay or prevent our future profitability. For example, beginning in June 2012, PJM will discontinue its Interruptible Load for Reliability program, or the ILR program, which is a program in which we have historically been an active participant. The discontinuance of the ILR program by PJM will reduce the flexibility that we currently have to manage our portfolio of demand response capacity in the PJM market and will likely negatively impact our future revenues and profit margins.
Revenues generated from two fixed price contracts with, and open market sales to ISO-NE, a grid operator customer, accounted for 60%, 36% and 29%, respectively, of our total revenues for the years ended December 31, 2007, 2008 and 2009. Our fixed price contracts with ISO-NE expired on May 31, 2008. We have enrolled a significant portion of the MW represented by our expired fixed price contracts with ISO-NE in other available demand response programs. The modification or termination of our sales relationship with ISO-NE, or the modification or termination of any of ISO-NE's open market programs in which we participate, could significantly reduce our future revenues, have a material adverse effect on our results of operations and financial condition, and delay or prevent our future profitability.
24
If we fail to obtain favorable prices in the open market programs in which we currently participate or participate in the future, our revenues and profit margins could be negatively impacted.
In open market programs, grid operators and utilities generally seek bids from companies such as ours to provide demand response capacity based on prices offered in competitive bidding. These prices may be subject to volatility due to certain market conditions or other events, and as a result the prices offered to us for this demand response capacity may be significantly lower than historical prices. For example, recent open market auctions of capacity in the PJM and ISO-NE markets in which we participate have achieved prices that have been significantly lower than those achieved in prior periods. Accordingly, our revenues, gross profits and profit margins will be adversely affected to the extent such lower pricing continues or to the extent we face new price reductions, specifically in 2011 as the lower prices in the PJM market take effect for that year. We also may be subject to reduced capacity prices or be unable to participate in certain open market programs for a period of time to the extent that our bidding strategy fails to produce favorable results. In addition, adverse changes in the general economic and market conditions in the United States may result in a reduced demand for electricity, resulting in lower prices for capacity, both demand-side and supply-side, for the foreseeable future, which could materially and adversely affect our results of operations and financial condition.
Our results of operations could be adversely affected if our operating expenses and cost of sales do not correspond with the timing of our revenues.
Most of our operating expenses, such as employee compensation and rental expense for properties, are either relatively fixed in the short-term or incurred in advance of sales. Moreover, our spending levels are based in part on our expectations regarding future revenues. As a result, if revenues for a particular quarter are below expectations, we may not be able to proportionately reduce operating expenses for that quarter. For example, if a demand response event or metering and verification test does not occur in a particular quarter, we may not be able to recognize revenues for the undemonstrated capacity in that quarter. This shortfall in revenues could adversely affect our operating results for that quarter and could cause the market price of our common stock to decline substantially.
We incur significant up-front costs associated with the expansion of the number of MW under our management and the infrastructure necessary to enable those MW. In most of the markets in which we originally focused our growth, we generally begin earning revenues from our MW under management within approximately one month from enablement of those MW. However, in certain forward capacity markets in which we choose to participate, it may take longer for us to begin earning revenues from MW that we enable, in some cases up to a year after enablement. For example, the PJM forward capacity market, which is a market in which we materially increased our participation beginning in the first quarter of 2008 and in which we expect to continue to increase our participation and derive revenues, operates on a June to May program-year basis, which means that a MW that we enable after June of each year will typically not begin earning revenue until June of the following year. This results in a longer average revenue recognition lag time in our end-use customer portfolio from the point in time when we consider a MW to be under management to when we earn revenues from those MW. The up-front costs we incur to expand our MW under management in PJM and other similar markets, coupled with the delay in receiving revenues from those MW, could adversely affect our operating results and could cause the market price of our common stock to decline substantially.
We operate in highly competitive markets; if we are unable to compete successfully, we could lose market share and revenues.
The market for clean and intelligent energy solutions is fragmented. Some traditional providers of advanced metering solutions have added, or may add, demand response services to their existing business. We face strong competition from clean and intelligent energy solutions providers, both larger and smaller than we are. We also compete against traditional supply-side resources such as natural
25
gas-fired peaking power plants. In addition, utilities and competitive electricity suppliers offer their own demand response solutions, which could decrease our base of potential customers and revenues and could delay or prevent our future profitability.
Many of our competitors have greater financial resources than we do. Our competitors could focus their substantial financial resources to develop a competing business model or develop products or services that are more attractive to potential customers than what we offer. Some advanced metering infrastructure service providers, for example, are substantially larger and better capitalized than we are and have the ability to combine advanced metering and demand response solutions into an integrated offering to a large, existing customer base. Our competitors may offer clean and intelligent energy solutions at prices below cost or even for free in order to improve their competitive positions. Any of these competitive factors could make it more difficult for us to attract and retain customers, cause us to lower our prices in order to compete, and reduce our market share and revenues, any of which could have a material adverse effect on our financial condition and results of operations. In addition, we may also face competition based on technological developments that reduce peak demand for electricity, increase power supplies through existing infrastructure or that otherwise compete with our demand response and energy management solutions.
If we fail to successfully educate existing and potential grid operator and utility customers regarding the benefits of our demand response and energy management solutions or a market otherwise fails to develop for those solutions, our ability to sell our solutions and grow our business could be limited.
Our future success depends on commercial acceptance of our clean and intelligent energy solutions and our ability to enter into additional contracts and new open market bidding programs. We anticipate that revenues related to our demand response solutions will constitute a substantial majority of our revenues for the foreseeable future. The market for clean and intelligent energy solutions in general is relatively new. If we are unable to educate our potential customers about the advantages of our solutions over competing products and services, or our existing customers no longer rely on our demand response solutions, our ability to sell our solutions will be limited. In addition, because the clean and intelligent energy solutions sector is rapidly evolving, we cannot accurately assess the size of the market, and we may have limited insight into trends that may emerge and affect our business. For example, we may have difficulty predicting customer needs and developing clean and intelligent energy solutions that address those needs. Further, we are subject to the risk that the current global economic and market conditions will result in lower overall demand for electricity in the United States and other markets that we are seeking to penetrate over the next few years. Such a reduction in the demand for electricity could create a corresponding reduction in both supply- and demand-side resources being implemented by grid operators and utilities. If the market for our demand response and our energy management solutions does not continue to develop, our ability to grow our business could be limited and we may not be able to achieve profitability.
If the actual amount of demand response capacity that we make available under our capacity commitments is less than required, our committed capacity could be reduced and we could be required to make refunds or pay penalty fees, which could negatively impact our results of operations and financial condition.
We provide demand response capacity to our grid operator and utility customers either under fixed price long-term contracts, or under terms established in open market bidding programs where capacity is purchased. Under the long-term contracts and open market bidding programs, grid operators and utilities make periodic payments to us based on the amount of demand response capacity that we are obligated to make available to them during the contract period, or make periodic payments to us based on the amount of demand response capacity that we bid to make available to them during the relevant period. We refer to these payments as committed capacity payments. Committed capacity is negotiated and established by the contract or set in the open market bidding process and is subject to subsequent
26
confirmation by measurement and verification tests or performance in a demand response event. In our open market bidding programs, we offer different amounts of committed capacity to our grid operator and utility customers based on market rules on a periodic basis. We refer to measured and verified capacity as our demonstrated or proven capacity. Once demonstrated, the proven capacity amounts typically establish a baseline of capacity for each end-use customer site in our portfolio, on which committed capacity payments are calculated going forward and until the next demand response event or measurement and verification test when we are called to make capacity available.
Under some of our contracts and in certain open market bidding programs, any difference between our demonstrated capacity and the committed capacity on which capacity payments were previously made will result in either a refund payment from us to our grid operator or utility customer or an additional payment to us by such customer. Any refund payable by us would reduce our deferred revenues, but would not impact our previously recognized revenues. If there is a refund payment due to a grid operator or utility customer, we generally make a corresponding adjustment in our payments to the end-use customer or customers who failed to make the appropriate level of capacity available, however we are sometimes unable to do so. In addition, some of our contracts with, and open market programs established by, our grid operator and utility customers provide for penalty payments, which can be substantial, in certain circumstances in which we do not meet our capacity commitments, either in measurement and verification tests or in demand response events. Further, because measurement and verification test results for some capacity contracts and in certain open market bidding programs establish capacity levels on which payments will be made until the next test or demand response event, the payments to be made to us under such capacity contracts and open market bidding programs would be reduced until the level of capacity is established at the next test or demand response event. We could experience significant period-to-period fluctuations in our financial results in future periods due to refund payments, penalties, capacity payment adjustments, replacement costs or other payments, which could be substantial. We incurred aggregate net penalty payments of $168,719, $82,639 and $152,913 during the years ended December 31, 2009, 2008 and 2007, respectively.
Our ability to achieve our committed capacity depends on the performance of our commercial, institutional and industrial customers, and the failure of these customers to make the appropriate levels of capacity available when called upon would cause us to make refunds to, or incur penalties imposed by, our grid operator and utility customers.
The capacity level that we are able to achieve is dependent upon the ability of our commercial, institutional and industrial customers to curtail their energy usage when called upon by us during a demand response event or a measurement and verification test. Certain demand response programs in which we currently participate or choose to participate in the future may have rigorous requirements, making it difficult for our end-use customers to perform when called upon by us. For example, the market rules applicable to ISO-NE's forward capacity market, which go into effect beginning with the 2010/2011 capacity commitment period, are rigorous and may result in the failure by some of our end-use customers to make the appropriate levels of capacity available. In addition, if PJM dispatches a measurement and verification test and our end-use customers fail to perform or perform in a deficient manner, we may be subject to substantial penalties given that we have enrolled a significant number of MW in the PJM demand response market. In the event that our end-use customers are unable to perform or perform at levels below which they agreed to perform, we may be unable to achieve our committed capacity levels and may be subject to the refunds or penalties described in the risk factor above, which could have a material adverse effect on our results of operations and financial condition. The capacity level that we are able to achieve also varies with the electricity demand of targeted equipment, such as heating and cooling equipment, at the time an end-use customer is called to perform. Accordingly, our ability to deliver committed capacity depends on factors beyond our control, such as the temperature and humidity, and then-current electricity use by our end-use customers when
27
such end-use customers are called to perform. The correct operation of, and timely communication with, devices used to control equipment are also important factors that affect available capacity.
Our business is subject to government regulation, and may become subject to modified or new government regulation, which may negatively impact our ability to sell and market our clean and intelligent energy solutions.
While the electric power markets in which we operate are regulated, most of our business is not directly subject to the regulatory framework applicable to the generation and transmission of electricity. However, we may become directly subject to the regulation of FERC to the extent we own, operate, or control generation used to make wholesale sales of power or provide ancillary services such as exporting power to the electric power grid as a short-term reserve resource. For example, our subsidiary, Celerity, is subject to direct regulation by FERC because Celerity exports power to the electric power grid for resale pursuant to a contract with SDG&E. In addition, in an order issued in January 2010, FERC clarified that when a demand response resource is used to provide ancillary services that involve a sale of electric energy or capacity for resale, or export power onto the electric power grid, such a transaction may be subject to direct regulation by FERC. We are still assessing the extent to which any of our demand response resources may be subject to direct regulation by FERC, but do not expect FERC's determination that it has jurisdiction over such activity to have a material adverse effect on our consolidated financial condition, results of operations or cash flows.
The installation of devices used in providing our solutions and electric generators sometimes installed or activated when providing demand response solutions may be subject to governmental oversight and regulation under state and local ordinances relating to building codes, public safety regulations pertaining to electrical connections, security protocols, and local and state licensing requirements. In a relatively few instances, we have agreed to own and operate a back-up generator at a commercial, institutional or industrial customer location for a period of time and to activate the generator when capacity is called for dispatch so that the commercial, institutional or industrial customer can reduce its consumption of electricity from the electric power grid. These generators are ineligible to participate in demand response programs in certain regions, and in others they may become ineligible to participate in the future or may be compensated less for such participation, thereby reducing our revenues and adversely affecting our financial condition. In addition, certain of our contracts and expansion of existing contracts with grid operators and utility customers are subject to approval by federal, state, provincial or local regulatory agencies. There can be no assurance that such approvals will be obtained or be issued on a timely basis, if at all.
Additionally, federal, state, provincial or local governmental entities may seek to change existing regulations, impose additional regulations or change their interpretation of the applicability of existing regulations. Any modified or new government regulation applicable to our current or future solutions, whether at the federal, state, provincial or local level, may negatively impact the installation, servicing and marketing of those solutions and increase our costs and the price of our solutions.
We depend on the electric power industry for revenues and, as a result, our operating results have experienced, and may continue to experience, significant variability due to volatility in electric power industry spending and other factors affecting the electric utility industry, such as seasonality of peak demand and overall demand for electricity.
We currently derive substantially all of our revenues from the sale of our demand response solutions, directly or indirectly, to the electric power industry. Purchases of our demand response solutions by grid operators or electric utilities may be deferred, cancelled or otherwise negatively impacted as a result of many factors, including challenging economic conditions, mergers and acquisitions involving electric utilities, changing regulations or program rules, fluctuations in interest rates and increased electric utility capital spending on traditional supply-side resources. For example, in
28
October 2008, ISO-NE requested that FERC approve its modification to the market rules applicable to ISO-NE's forward capacity market that reduces the value placed on demand resources beginning with the 2012/2013 capacity commitment period. This change, ultimately approved by FERC and made effective December 31, 2008, may result in reduced participation by demand resources in the forward capacity market and may negatively impact our future revenues and could delay or prevent our profitability. In addition, sales of capacity in open markets are particularly susceptible to variability based on changes in the spending patterns of our grid operator and utility customers and on associated fluctuating market prices for capacity.
Peak demand for electricity and other capacity constraints tend to be seasonal. Peak demand in the United States tends to be most extreme in warmer months, which may lead some capacity markets to yield higher prices for capacity or contract for the availability of a greater amount of capacity during these warmer months. As a result, our demand response revenues may be seasonal. For example, in the PJM forward capacity market, which is a market in which we materially increased our participation beginning in the first quarter of 2008 and in which we expect to continue to increase our participation and derive revenues for the foreseeable future, we recognize capacity-based revenue from PJM over the four-month delivery period of June through September. This typically results in higher revenues in our second and third quarters as compared to our first and fourth quarters. As a result of this seasonality, we believe that quarter to quarter comparisons of our operating results are not necessarily meaningful and that these comparisons cannot be relied upon as indicators of future performance.
Further, occasional events, such as a spike in natural gas prices or potential decreases in availability, can lead grid operators and utilities to implement short-term calls for demand response capacity to respond to these events, but we cannot be sure that such calls will continue or that we will be in a position to generate revenues when they do occur. In addition, given the current economic slowdown and the related potential reduction in demand for electricity, there can be no assurance that there will not be a corresponding reduction in the implementation of both supply and demand-side resources by grid operators and utilities. We have experienced, and may in the future experience, significant variability in our revenues, on both an annual and a quarterly basis, as a result of these and other factors. Pronounced variability or an extended period of reduction in spending by grid operators and utilities, or continued requests from grid operators and utilities to pay for demand response capacity at prices that are not equal on a monthly or quarterly basis over the course of a contract year, could negatively impact our business and make it difficult for us to accurately forecast our future sales, which could lead to increased spending by us that does not result in increases in revenues.
The expiration of our existing long-term contracts with utilities and grid operators without obtaining renewal or replacement contracts could negatively impact our business by reducing our revenues and profit margins, thereby having a material adverse effect on our results of operations and financial condition.
We have entered into long-term contracts with our utility and grid operator customers in different geographic regions in the United States, as well as in Canada and the United Kingdom, and are regularly in discussions to enter into new long-term contracts with utilities and grid operators. However, there can be no assurance that we will be able to renew or extend our existing contracts with our utility and grid operator customers or enter into new long-term contracts with utilities and grid operators on favorable terms, if at all. If, upon expiration, we are unable to renew or extend our existing long-term contracts and are unable to enter into new long-term contracts with utilities and grid operators, our future revenues and profit margins could be significantly reduced, thereby having a material adverse effect on our results of operations and financial condition.
29
Failure of third parties to manufacture quality products or provide reliable services in a timely manner could cause delays in the delivery of our solutions, which could damage our reputation, cause us to lose customers and negatively impact our growth.
Our success depends on our ability to provide quality, reliable, secure demand response and energy management solutions in a timely manner, which in part requires the proper functioning of facilities and equipment owned, operated or manufactured by third parties upon which we depend. For example, our reliance on third parties includes:
- •
- utilizing components that we or third parties install or have installed at commercial, institutional and industrial
customer locations;
- •
- outsourcing email notification and cellular and paging wireless communications that are used to notify our
end-use customers of their need to reduce electricity consumption at a particular time and to execute instructions to devices installed at our end-use customer locations and
which are programmed to automatically reduce consumption on receipt of such secure communications; and
- •
- outsourcing certain installation and maintenance operations to third-party providers.
Any delays, malfunctions, inefficiencies or interruptions in these products, services or operations could adversely affect the reliability or operation of our demand response and energy management solutions, which could cause us to experience difficulty monitoring or retaining current customers and attracting new customers. Such delays could also result in our making refunds or paying penalty fees to our grid operator and utility customers. In addition, our brand, reputation and growth could be negatively impacted.
If we lose key personnel upon whom we are dependent, we may not be able to manage our operations and meet our strategic objectives.
Our continued success depends upon the continued availability, contributions, vision, skills, experience and effort of our senior management, sales and marketing, research and development, and operations teams. We do not maintain "key person" insurance on any of our employees. We have entered into employment agreements with certain members of our senior management team, but none of these agreements guarantees the services of the individual for a specified period of time. All of the employment arrangements with our key personnel, including the members of our senior management team, provide that employment is at-will and may be terminated by the employee at any time and without notice. Although we do not have any reason to believe that we may lose the services of any of these persons in the foreseeable future, the loss of the services of any of these persons might impede our operations or the achievement of our strategic and financial objectives. We rely on our research and development team to research, design and develop new and enhanced demand response and energy management solutions. We rely on our operations team to install, test, deliver and manage our demand response and energy management solutions. We rely on our sales and marketing team to sell our solutions to our customers, build our brand and promote our company. The loss or interruption of the service of members of our senior management, sales and marketing, research and development, or operations teams, or our inability to attract or retain other qualified personnel or advisors could have a material adverse effect on our business, financial condition and results of operations and could significantly reduce our ability to manage our operations and implement our strategy.
We expect to continue to expand our sales and marketing, operations, and research and development capabilities, as well as our financial and reporting systems, and as a result, we may encounter difficulties in managing our growth, which could disrupt our operations.
We expect to experience growth in the number of our employees and significant growth in the scope of our operations. To manage our anticipated future growth, we must continue to implement and
30
improve our managerial, operational, financial and reporting systems, expand our facilities, and continue to recruit and train additional qualified personnel. All of these measures will require significant expenditures and will demand the attention of management. Due to our limited resources, we may not be able to effectively manage the expansion of our operations or recruit and adequately train additional qualified personnel. The physical expansion of our operations may lead to significant costs and may divert our management and business development resources. Any inability to manage growth could delay the execution of our business plans or disrupt our operations.
We compete for personnel and advisors with other companies and other organizations, many of which are larger and have greater name recognition and financial and other resources than we do. If we are not able to hire, train and retain the necessary personnel, or if these managerial, operational, financial and reporting improvements are not implemented successfully, we could lose customers and revenues.
We allocate our operations, sales and marketing, research and development, general and administrative, and financial resources based on our business plan, which includes assumptions about current and future contracts and open market programs with grid operator and utility customers, current and future contracts with commercial, institutional and industrial customers, variable prices in open markets for demand response capacity, the development of ancillary services markets which enable demand response as a revenue generating resource and a variety of other factors relating to electricity markets, and the resulting demand for our demand response and energy management solutions. However, these factors are uncertain. If our assumptions regarding these factors prove to be incorrect or if alternatives to those offered by our solutions gain further acceptance, then actual demand for our demand response and energy management solutions could be significantly less than the demand we anticipate and we may not be able to sustain our revenue growth or achieve profitability.
An oversupply of electric generation capacity and varying regulatory structures, program rules and program designs in certain regional power markets could negatively affect our business and results of operations.
A buildup of new electric generation facilities or reduced demand for electric capacity could result in excess electric generation capacity in certain regional power markets. In addition, the electric power industry is highly regulated. The regulatory structures in regional electricity markets are varied and some regulatory requirements make it more difficult for us to provide some or all of our demand response and energy management solutions in those regions. For instance, in some markets, regulated quantity or payment levels for demand response capacity or energy make it more difficult for us to cost-effectively enroll and manage many commercial, institutional and industrial customers in demand response programs. Further, some markets, such as New York, have regulatory structures that do not yet include demand response as a qualifying resource for purposes of short-term reserve requirements known as ancillary services. As part of our business strategy, we intend to expand into additional regional electricity markets. However, the combination of excess electric generation capacity and unfavorable regulatory structures could limit the number of regional electricity markets available to us for expansion. In addition, unfavorable regulatory decisions in markets where we currently operate could also negatively affect our business. For example, regulators could modify market rules in certain areas to further limit the use of back-up generators in demand response markets or could implement bidding floors or caps that could lower our revenue opportunities. A limit on back-up generators would mean that some of the capacity reductions we aggregate from end-use customers willing to reduce consumption from the grid by activating their own back-up generators during demand response events would not qualify as capacity, and we would have to find alternative sources of capacity from end-use customers willing to reduce load by curtailing consumption rather than by generating electricity themselves. Market rules could also be modified to change the design of a particular demand response program, which design may adversely affect our participation in that program, or a demand response program in which we currently participate could be eliminated in its entirety. Any elimination or
31
change in the design of a demand response program, including any supplemental program, in which we participate, especially in the PJM or ISO-NE markets, could adversely impact our ability to successfully provide our demand response solutions or manage our portfolio of MW under management in that program, thereby reducing our revenues and profit margins and having a material adverse effect on our results of operations and financial condition.
We face pricing pressure relating to electric capacity made available to grid operators and utilities and in the percentage or fixed amount paid to commercial, institutional and industrial customers for making capacity available, which could adversely affect our results of operations and financial condition and delay or prevent our future profitability.
The rapid growth of the clean and intelligent energy solutions sector is resulting in increasingly aggressive pricing, which could cause the prices for clean and intelligent energy solutions to decrease over time. Our grid operator and utility customers may switch to other clean and intelligent energy solutions providers based on price, particularly if they perceive the quality of our competitors' products or services to be equal or superior to ours. Continued decreases in the price of capacity by our competitors could result in a loss of grid operator and utility customers or a decrease in the growth of our business, or it may require us to lower our prices for capacity to remain competitive, which would result in reduced revenues and lower profit margins and would adversely affect our results of operations and financial condition and delay or prevent our future profitability. Continued increases in the percentage or fixed amount paid to commercial, institutional and industrial customers by our competitors for making capacity available could result in a loss of commercial, institutional and industrial customers or a decrease in the growth of our business and could delay or prevent our profitability. It also may require us to increase the percentage or fixed amount we pay to our commercial, institutional and industrial customers to remain competitive, which would result in increases in the cost of revenues and lower profit margins and would adversely affect our results of operations and financial condition and delay or prevent our future profitability.
An inability to protect our intellectual property could negatively affect our business and results of operations.
Our ability to compete effectively depends in part upon the maintenance and protection of the intellectual property related to our clean and intelligent energy solutions. We hold two issued patents, 13 registered trademarks and numerous copyrights. Patent protection is unavailable for certain aspects of the technology and operational processes that are important to our business. Any patent held by us or to be issued to us, or any of our pending patent applications, could be challenged, invalidated, unenforceable or circumvented. Moreover, some of our trademarks which are not in use may become available to others. To date, we have relied principally on patent, copyright, trademark and trade secrecy laws, as well as confidentiality and proprietary information agreements and licensing arrangements, to establish and protect our intellectual property. However, we have not obtained confidentiality and proprietary information agreements from all of our customers and vendors, and although we have entered into confidentiality and proprietary information agreements with all of our employees, we cannot be certain that these agreements will be honored. Some of our confidentiality and proprietary information agreements are not in writing, and some customers are subject to laws and regulations that require them to disclose information that we would otherwise seek to keep confidential. Policing unauthorized use of our intellectual property is difficult and expensive, as is enforcing our rights against unauthorized use. The steps that we have taken or may take may not prevent misappropriation of the intellectual property on which we rely. In addition, effective protection may be unavailable or limited in jurisdictions outside the United States, as the intellectual property laws of foreign countries sometimes offer less protection or have onerous filing requirements. From time to time, third parties may infringe our intellectual property rights. Litigation may be necessary to enforce or protect our rights or to determine the validity and scope of the rights of others. Any litigation could be unsuccessful, cause us to incur substantial costs, divert resources away from our daily operations and result in the impairment of our intellectual property. Failure to adequately enforce our rights could cause us to lose rights in our intellectual property and may negatively affect our business.
32
We may be subject to damaging and disruptive intellectual property litigation related to allegations that our demand response or energy management solutions infringe on intellectual property held by others, which could result in the loss of use of those solutions.
Third-party patent applications and patents may relate to our clean and intelligent energy solutions. As a result, third-parties may in the future make infringement and other allegations that could subject us to intellectual property litigation relating to our solutions, which litigation could be time-consuming and expensive, divert attention and resources away from our daily operations, impede or prevent delivery of our solutions, and require us to pay significant royalties, licensing fees and damages. In addition, parties making infringement and other claims may be able to obtain injunctive or other equitable relief that could effectively block our ability to provide our solutions and could cause us to pay substantial damages. In the event of a successful claim of infringement, we may need to obtain one or more licenses from third parties, which may not be available at a reasonable cost, or at all.
If our information technology systems fail to adequately gather, assess and protect data used in providing our clean and intelligent energy solutions, or if we experience an interruption in their operation, our business, financial condition and results of operations could be adversely affected.
The efficient operation of our business is dependent on our information technology systems. We rely on our information technology systems to effectively control the devices which enable our demand response solutions; gather and assess data used in providing our energy management solutions; manage relationships with our customers; and maintain our research and development data. The failure of our information technology systems to perform as we anticipate could disrupt our business and product development and make us unable, or severely limit our ability, to respond to demand response events. In addition, our information technology systems are vulnerable to damage or interruption from:
- •
- earthquake, fire, flood and other natural disasters;
- •
- terrorist attacks and attacks by computer viruses or hackers;
- •
- power loss; and
- •
- computer systems, Internet, telecommunications or data network failure.
Any interruption in the operation of our information technology systems could result in decreased revenues under our demand response and energy management contracts and commitments, reduced profit margins on revenues where fixed payments are due to our commercial, institutional and industrial customers, reductions in our demonstrated capacity levels going forward, customer dissatisfaction and lawsuits and could subject us to penalties, any of which could have a material adverse effect on our business, financial condition and results of operations.
Global economic and credit market conditions, and any associated impact on spending by utilities or grid operators or on the continued operations of our commercial, institutional and industrial customers, could have a material adverse effect on our business, operating results, and financial condition.
Volatility and disruption in the global capital and credit markets in 2008 and 2009 have led to a significant reduction in the availability of business credit, decreased liquidity, a contraction of consumer credit, business failures, higher unemployment, and declines in consumer confidence and spending in the United States and internationally. If global economic and financial market conditions deteriorate or remain weak for an extended period of time, numerous economic and financial factors could have a material adverse effect on our business, operating results, and financial condition, including:
- •
- decreased spending by utilities or grid operators, or by commercial, institutional or industrial end-users of electricity, may result in reduced demand for our clean and intelligent energy solutions;
33
- •
- consumer demand for electricity may be reduced, which could result in lower prices for both demand-side and
supply-side capacity in open market programs and pursuant to long-term contracts with utilities and grid operators;
- •
- if commercial, institutional and industrial customers in our demand response network experience financial difficulty, some
may cease or reduce business operations, or reduce their electricity usage, all of which could reduce the number of MW of demand response capacity under our management;
- •
- we may be unable to find suitable investments that are safe, liquid, and provide a reasonable return, which could result
in lower interest income or longer investment horizons, and disruptions to capital markets or the banking system may also impair the value of investments or bank deposits we currently consider safe or
liquid;
- •
- if our commercial, institutional and industrial customers to whom we provide our monitoring-based commissioning services
experience financial difficulty, it could result in their inability to timely meet their payment obligations to us, extended payment terms, higher accounts receivable, reduced cash flows, greater
expense associated with collection efforts, and an increase in charges for uncollectable receivables; and
- •
- due to stricter lending standards, commercial, institutional and industrial end-users of electricity to whom we offer our energy procurement services may be unable to obtain adequate credit ratings acceptable to electricity suppliers, resulting in increased costs, which might make our solutions less attractive or result in their inability to contract with us for our energy procurement services.
Uncertainty about current global economic conditions could also continue to increase the volatility of our stock price.
Electric power industry sales cycles can be lengthy and unpredictable and require significant employee time and financial resources with no assurances that we will realize revenues.
Sales cycles with grid operator and utility customers are generally long and unpredictable. The grid operators and utilities that are our potential customers generally have extended budgeting, procurement and regulatory approval processes. They also tend to be risk averse and tend to follow industry trends rather than be the first to purchase new products or services, which can extend the lead time for or prevent acceptance of new products or services such as our demand response and energy management solutions. Accordingly, our potential utility and grid operator customers may take longer to reach a decision to purchase services. This extended sales process requires the dedication of significant time by our personnel and our use of significant financial resources, with no certainty of success or recovery of our related expenses. It is not unusual for a grid operator or utility customer to go through the entire sales process and not accept any proposal or quote. Long and unpredictable sales cycles with grid operator and utility customers could have a material adverse effect on our business, financial condition and results of operations.
An increased rate of terminations by our commercial, institutional and industrial customers, or their failure to renew contracts when they expire, would negatively impact our business by reducing our revenues, delaying or preventing our profitability and requiring us to spend more money to maintain and grow our commercial, institutional and industrial customer base.
Our ability to provide demand response capacity under our long-term contracts and in open market bidding programs depends on the amount of MW that we manage across commercial, institutional and industrial customers who enter into contracts with us to reduce electricity consumption on demand. A significant portion of our contracts with our existing commercial, institutional and
34
industrial customers are scheduled for renewal in 2010 and annually thereafter. If these customers do not renew their contracts as they expire, we will need to acquire MW from additional commercial, institutional and industrial customers or expand our relationships with existing commercial, institutional and industrial customers in order to maintain our revenues and grow our business. The loss of revenues resulting from contract terminations could be significant, and limiting customer terminations is an important factor in our ability to achieve future profitability. If we are unsuccessful in limiting our commercial, institutional and industrial customer terminations, we may be unable to acquire a sufficient amount of MW or we may incur significant costs to replace MW, which could cause our revenues to decrease and our cost of revenues to increase, and delay or prevent our profitability.
We may incur significant penalties and fines if found to be in non-compliance with any applicable State or Federal regulation.
While the electric power markets in which we operate are regulated, most of our business is not directly subject to the regulatory framework applicable to the generation and transmission of electricity. However, regulations by FERC related to market design, market rules, tariffs, and bidding rules impact how we can interact with our grid operator and utility customers. For example, our subsidiary Celerity exports some power to the electric power grid and is thus subject to direct regulation by FERC and its regulations related to the sale of wholesale power at market based rates. In addition, to the extent our demand response resources are used to provide ancillary services that involve a sale of electric energy or capacity for resale, or the export of power onto the electric power grid, such activities are also subject to direct regulation by FERC. Despite our efforts to manage compliance with such regulations, we may be found to be in non-compliance with such regulations and therefore subject to penalties or fines, which could have a material adverse effect on our business, financial condition and results of operations.
The success of our business depends in part on our ability to develop new clean and intelligent energy solutions and increase the functionality of our current demand response and energy management solutions.
The market for demand response and energy management solutions is characterized by rapid technological changes, frequent new software introductions, Internet-related technology enhancements, uncertain product life cycles, changes in customer demands and evolving industry standards and regulations. We may not be able to successfully develop and market new clean and intelligent energy solutions that comply with present or emerging industry regulations and technology standards. Also, any new regulation or technology standard could increase our cost of doing business.
From time to time, our customers have expressed a need for increased functionality in our solutions. In response, and as part of our strategy to enhance our clean and intelligent energy solutions and grow our business, we plan to continue to make substantial investments in the research and development of new technologies. Our future success will depend in part on our ability to continue to design and sell new, competitive clean and intelligent energy solutions, enhance our existing demand response and energy management solutions and provide new, value-added services to our customers. Initiatives to develop new solutions will require continued investment, and we may experience unforeseen problems in the performance of our technologies and operational processes, including new technologies and operational processes that we develop and deploy, to implement our solutions. In addition, software addressing the procurement and management of energy assets is complex and can be expensive to develop, and new software and software enhancements can require long development and testing periods. If we are unable to develop new clean and intelligent energy solutions or enhancements to our existing demand response and energy management solutions on a timely basis, or if the market does not accept such solutions, we will lose opportunities to realize revenues and obtain customers, and our business and results of operations will be adversely affected.
35
Any internal or external security breaches involving our demand response and energy management solutions, and even the perception of security risks of our solutions or the transmission of data over the Internet, whether or not valid, could harm our reputation and inhibit market acceptance of our solutions and cause us to lose customers.
We use our demand response and energy management solutions to compile and analyze sensitive or confidential information related to our customers. In addition, some of our demand response and energy management solutions allow us to remotely control equipment at commercial, institutional and industrial customer sites. Our demand response and energy management solutions rely on the secure transmission of proprietary data over the Internet for some of this functionality. Well-publicized compromises of Internet security could have the effect of substantially reducing confidence in the Internet as a medium of data transmission. The occurrence or perception of security breaches in our demand response and energy management solutions or our customers' concerns about Internet security or the security of our solutions, whether or not they are warranted, could have a material adverse effect on our business, harm our reputation, inhibit market acceptance of our demand response and energy management solutions and cause us to lose customers, any of which could have a material adverse effect on our financial condition and results of operations.
We may come into contact with sensitive consumer information or data when we perform operational, installation or maintenance functions for our customers. Even the perception that we have improperly handled sensitive, confidential information could have a negative effect on our business. If, in handling this information, we fail to comply with privacy or security laws, we could incur civil liability to government agencies, customers and individuals whose privacy is compromised. In addition, third parties may attempt to breach our security or inappropriately use our demand response and energy management solutions, particularly as we grow our business, through computer viruses, electronic break-ins and other disruptions. We may also face a security breach or electronic break-in by one of our employees or former employees. If a breach is successful, confidential information may be improperly obtained, and we may be subject to lawsuits and other liabilities.
We may require significant additional capital to pursue our growth strategy, but we may not be able to obtain additional financing on acceptable terms or at all.
The growth of our business will depend on substantial amounts of additional capital for posting financial assurances in order to enter into contracts and open market bidding programs with utilities and grid operators, and marketing and product development of our demand response and energy management solutions. Our capital requirements will depend on many factors, including the rate of our revenue and sales growth, our introduction of new solutions and enhancements to existing solutions, and our expansion of sales and marketing and product development activities. In addition, we may consider strategic acquisitions of complementary businesses or technologies to grow our business, such as our acquisitions of SRC in May 2008, eQ in June 2009 and Cogent in December 2009, which could require significant capital and could increase our capital expenditures related to future operation of the acquired business or technology. Because of our historical losses, we do not fit traditional credit lending criteria. Moreover, the current financial turmoil affecting the banking system and financial markets and the possibility that financial institutions may consolidate or go out of business have resulted in a reduction in the availability of credit in the credit markets, which will likely adversely affect our ability to obtain additional funding. We may not be able to obtain loans or additional capital on acceptable terms or at all. Moreover, we and one of our subsidiaries entered into a loan and security agreement with Silicon Valley Bank, or SVB, in August 2008, which was subsequently amended in May 2009 and which we refer to as the SVB credit facility. The SVB credit facility contains restrictions on our ability to incur additional indebtedness, which, if not waived, could prevent us from obtaining needed capital. Any future credit facilities would likely contain similar restrictions. In the event additional funding is required, we may not be able to obtain bank credit arrangements or effect an equity or debt financing
36
on terms acceptable to us or at all. A failure to obtain additional financing when needed could adversely affect our ability to maintain and grow our business.
Our SVB credit facility contains financial and operating restrictions that may limit our access to credit. If we fail to comply with covenants in the SVB credit facility, we may be required to repay our indebtedness thereunder, which may have an adverse effect on our liquidity.
Provisions in the SVB credit facility impose restrictions on our ability to, among other things:
- •
- incur additional indebtedness;
- •
- create liens;
- •
- enter into transactions with affiliates;
- •
- transfer assets;
- •
- pay dividends or make distributions on, or repurchase, EnerNOC stock; or
- •
- merge or consolidate.
In addition, we are required to meet certain financial covenants customary with this type of credit facility, including maintaining a minimum specified tangible net worth and a minimum specified ratio of current assets to current liabilities. The SVB credit facility also contains other customary covenants. We may not be able to comply with these covenants in the future. Our failure to comply with these covenants may result in the declaration of an event of default and could cause us to be unable to borrow under the SVB credit facility. In addition to preventing additional borrowings under the SVB credit facility, an event of default, if not cured or waived, may result in the acceleration of the maturity of indebtedness outstanding under the SVB credit facility, which would require us to pay all amounts outstanding. If an event of default occurs, we may not be able to cure it within any applicable cure period, if at all. If the maturity of our indebtedness is accelerated, we may not have sufficient funds available for repayment or we may not have the ability to borrow or obtain sufficient funds to replace the accelerated indebtedness on terms acceptable to us, or at all.
Our ability to use our net operating loss carryforwards may be subject to limitation.
Generally, a change of more than 50% in the ownership of a company's stock, by value, over a three-year period constitutes an ownership change for United States federal income tax purposes. An ownership change may limit a company's ability to use its net operating loss carryforwards attributable to the period prior to such change. The number of shares of our common stock that we issued in our initial public offering, or IPO, and follow-on public offerings, together with any subsequent shares of stock we issue, may be sufficient, taking into account prior or future shifts in our ownership over a three-year period, to cause us to undergo an ownership change. As a result, if we earn net taxable income, our ability to use our pre-change net operating loss carryforwards to offset United States federal taxable income may become subject to limitations, which could potentially result in increased future tax liability for us.
We may not be able to identify suitable acquisition candidates or complete acquisitions successfully, which may inhibit our rate of growth, and acquisitions that we complete may expose us to a number of unanticipated operational and financial risks.
In addition to organic growth, we intend to continue to pursue growth through the acquisition of companies or assets that may enable us to enhance our technology and capabilities, expand our geographic market, add experienced management personnel and increase our service offerings. However, we may be unable to implement this growth strategy if we cannot identify suitable acquisition candidates, reach agreement on potential acquisitions on acceptable terms, successfully integrate
37
personnel or assets that we acquire or for other reasons. Our acquisition efforts may involve certain risks, including:
- •
- we may have difficulty integrating operations and systems;
- •
- key personnel and customers of the acquired company may terminate their relationships with the acquired company as a
result of the acquisition;
- •
- we may experience additional financial and accounting challenges and complexities in areas such as tax planning and
financial reporting;
- •
- we may assume or be held liable for risks and liabilities, including for environmental-related costs, as a result of our
acquisitions, some of which we may not discover during our due diligence;
- •
- we may incur significant additional operating expenses;
- •
- our ongoing business may be disrupted or receive insufficient management attention; and
- •
- we may not be able to realize the cost savings or other financial and operational benefits we anticipated.
The process of negotiating acquisitions and integrating acquired products, services, technologies, personnel or businesses might result in operating difficulties and expenditures and might require significant management attention that would otherwise be available for ongoing development of our business, whether or not any such transaction is ever consummated. Moreover, we might never realize the anticipated benefits of any acquisition. Future acquisitions could result in potentially dilutive issuances of equity securities, the incurrence of debt, contingent liabilities, or impairment expenses related to goodwill, and impairment or amortization expenses related to other intangible assets, which could harm our financial condition. In addition, if we are unable to integrate any acquired businesses, products or technologies effectively, our business, financial condition and results of operations may be materially adversely affected. In June and December 2009, we acquired eQ and Cogent, respectively, and there can be no assurance that we will be able to successfully integrate them or any other companies, products or technologies that we acquire.
Our ability to provide security deposits or letters of credit is limited and could negatively affect our ability to bid on or enter into significant long-term agreements or arrangements with utilities or grid operators.
We are increasingly required to provide security deposits in the form of cash to secure our performance under long-term contracts or open market bidding programs with our grid operator and utility customers. In addition, some of our utility or grid operator customers require collateral in the form of letters of credit to secure our performance or to fund possible damages or true-up payments resulting from our failure to make available capacity at agreed levels or any other event of default by us. Our ability to obtain such letters of credit primarily depends upon our capitalization, working capital, past performance, management expertise and reputation and external factors beyond our control, including the overall capacity of the credit market. Events that affect credit markets generally may result in letters of credit becoming more difficult to obtain in the future, or being available only at a significantly greater cost. As of December 31, 2009, we had $30.4 million of letters of credit outstanding under the SVB credit facility, leaving $4.6 million available under this facility for additional letters of credit. We may be required, from time to time, to seek alternative sources of security deposits or letters of credit, which may be expensive and difficult to obtain, if available at all. For example, because we had no additional credit available under the SVB credit facility in May 2009, we entered into a credit arrangement with a third-party in connection with bidding capacity into a certain open market bidding program. The arrangement included an up-front payment of $2.0 million, and we will be required to pay the third party an additional contingent fee, up to a maximum of $3.0 million, based
38
on the revenue that we expect to earn and recognize in 2012 in connection with the bid. Our inability to obtain letters of credit and, as a result, to bid or enter into significant long-term agreements or arrangements with utilities or grid operators, could have a material adverse effect on our future revenues and business prospects. In addition, in the event that we default under long-term contracts or open market bidding programs with our grid operator and utility customers pursuant to which we have posted collateral, we may lose a portion or all of such collateral, which could have a material adverse effect on our financial condition and results of operations.
If the software we use in providing our demand response and energy management solutions produces inaccurate information or is incompatible with the systems used by our customers, it could make us unable to provide our solutions, which could lead to a loss of revenues and trigger penalty payments.
Our software is complex and, accordingly, may contain undetected errors or failures when introduced or subsequently modified. Software defects or inaccurate data may cause incorrect recording, reporting or display of information about the level of demand reduction at a commercial, institutional and industrial customer location, which could cause us to fail to meet our commitments to have capacity available. Any such failures could cause us to be subject to penalty payments to our grid operator and utility customers or reduce revenue in the period the adjustment is identified and result in reductions in capacity payments under contracts and in open market bidding programs in subsequent periods. In addition, such defects and inaccurate data may prevent us from successfully providing our energy management solutions, which would result in lost revenues. Software defects or inaccurate data may lead to customer dissatisfaction and our customers may seek to hold us liable for any damages incurred. As a result, we could lose customers, our reputation could be harmed and our financial condition and results of operations could be materially adversely affected.
We currently serve a commercial, institutional and industrial customer base that uses a wide variety of constantly changing hardware, software applications and operating systems. Building control, process control and metering systems frequently reside on non-standard operating systems. Our demand response and energy management solutions need to interface with these non-standard systems in order to gather and assess data and to implement changes in electricity consumption. Our business depends on the following factors, among others:
- •
- our ability to integrate our technology with new and existing hardware and software systems, including metering, building
control, process control, and distributed generation systems;
- •
- our ability to anticipate and support new standards, especially Internet-based standards and building control and metering
system protocol languages; and
- •
- our ability to integrate additional software modules under development with our existing technology and operational processes.
If we are unable to adequately address any of these factors, our results of operations and prospects for growth and profitability could be materially adversely effected.
We may face certain product liability or warranty claims if we disrupt our customers' networks or applications.
For some of our current and planned solutions, our software and hardware is integrated with our commercial, institutional and industrial customers' networks and software applications. The integration of our software and hardware may entail the risk of product liability or warranty claims based on disruption or security breaches to these networks or applications. In addition, the failure of our software and hardware to perform to customer expectations could give rise to warranty claims against us. Any of these claims, even if without merit, could result in costly litigation or divert management's attention and resources. Although we carry general liability insurance, our current insurance coverage
39
could be insufficient to protect us from all liability that may be imposed under these types of claims. A material product liability claim may seriously harm our results of operations.
We face risks related to our potential expansion into international markets.
We intend to expand our addressable market by pursuing opportunities to provide demand response and energy management solutions in international markets. For example, during the third quarter of 2009, we commenced operations in the United Kingdom by enrolling MW in National Grid's Short-Term Operating Reserve program. Prior to this, we had no experience operating in markets outside of the United States and Canada. Accordingly, new markets may require us to respond to new and unanticipated regulatory, marketing, sales and other challenges. There can be no assurance that we will be successful in responding to these and other challenges we may face as we enter and attempt to expand in international markets. International operations also entail a variety of other risks, including:
- •
- unexpected changes in legislative or regulatory requirements of foreign countries;
- •
- currency exchange fluctuations;
- •
- longer payment cycles and greater difficulty in accounts receivable collection; and
- •
- significant taxes or other burdens of complying with a variety of foreign laws.
International operations are also subject to general geopolitical risks, such as political, social and economic instability and changes in diplomatic and trade relations. One or more of these factors could adversely affect any international operations and result in lower revenue than we expect and could significantly affect our profitability.
A failure to maintain adequate internal control over financial reporting in accordance with Section 404 of the Sarbanes-Oxley Act of 2002 or prevent or detect material misstatements in our annual or interim consolidated financial statements in the future could materially harm our business and cause our stock price to decline.
As a public company, our internal control over financial reporting is required to comply with the standards adopted by the Public Company Accounting Oversight Board in compliance with the requirements of Section 404 of the Sarbanes-Oxley Act of 2002. Accordingly, we are currently required to document and test our internal controls and procedures to assess the effectiveness of our internal control over financial reporting. In addition, our independent registered public accounting firm is currently required to report on management's assessment of the effectiveness of our internal control over financial reporting and the effectiveness of our internal control over financial reporting. If we are unable to maintain effective control over financial reporting, such conclusion would be disclosed in this and/or subsequent Annual Reports on Form 10-K. In the future, we may identify material weaknesses and deficiencies which we may not be able to remediate in a timely manner. If we fail to maintain effective internal control over financial reporting in accordance with Section 404, we will not be able to conclude that we have and maintain effective internal control over financial reporting or our independent registered accounting firm may not be able to issue an unqualified report on the effectiveness of our internal control over financial reporting. As a result, our ability to report our financial results on a timely and accurate basis may be adversely affected, we may be subject to sanctions or investigation by regulatory authorities, including the SEC or The NASDAQ Global Market, or NASDAQ, and investors may lose confidence in our financial information, which in turn could cause the market price of our common stock to decrease. We may also be required to restate our financial statements from prior periods. In addition, testing and maintaining internal control in accordance with Section 404 requires increased management time and resources. Any failure to maintain effective internal control over financial reporting could impair the success of our business and harm our financial results.
40
Risks Related to Our Common Stock
We expect our quarterly revenues and operating results to fluctuate. If we fail to meet the expectations of market analysts or investors, the market price of our common stock could decline substantially.
Our quarterly revenues and operating results have fluctuated in the past and may vary from quarter to quarter in the future. Accordingly, we believe that period-to-period comparisons of our results of operations may be misleading. The results of one quarter should not be used as an indication of future performance. Our revenues and operating results may fall below the expectations of securities analysts or investors in some future quarter or quarters. Our failure to meet these expectations could cause the market price of our common stock to decline substantially.
Our quarterly revenues and operating results may vary depending on a number of factors, including:
- •
- demand for and acceptance of our clean and intelligent energy solutions;
- •
- the seasonality of our demand response business in certain of the markets in which we operate, where revenues recognized
under certain long-term capacity contracts and pursuant to certain open market bidding programs can be higher or concentrated in particular seasons and months;
- •
- changes in open market bidding program rules and reductions in pricing for demand response capacity;
- •
- delays in the implementation and delivery of our clean and intelligent energy solutions, which may impact the timing of
our recognition of revenues;
- •
- delays or reductions in spending for clean and intelligent energy solutions by our grid operator or utility customers and
potential customers;
- •
- the long lead time associated with securing new customer contracts;
- •
- the structure of any forward capacity market in which we participate, which may impact the timing of our recognition of
revenues related to that market;
- •
- the mix of our revenues during any period, particularly on a regional basis, since local fees recognized as revenues for
demand response capacity tend to vary according to the level of available capacity in given regions;
- •
- the termination or expiration of existing contracts with grid operator and utility customers and commercial, institutional
and industrial customers;
- •
- the potential interruptions of our customers' operations;
- •
- development of new relationships and maintenance and enhancement of existing relationships with customers and strategic
partners;
- •
- temporary capacity programs that could be implemented by grid operators and utilities to address short-term
capacity deficiencies;
- •
- the imposition of penalties or the reversal of deferred revenue due to our failure to meet a capacity commitment;
- •
- flaws in the design or the elimination of any demand response program in which we participate;
- •
- global economic and credit market conditions; and
- •
- increased expenditures for sales and marketing, software development and other corporate activities.
41
Our stock price has been and is likely to continue to be volatile and the market price of our common stock may fluctuate substantially.
Prior to our IPO, there was not a public market for our common stock. There is a limited history on which to gauge the volatility of our stock price; however, since our common stock began trading on NASDAQ on May 18, 2007 through December 31, 2009, our stock price has fluctuated from a low of $4.80 to a high of $50.50. Furthermore, the stock market has recently experienced significant volatility. The volatility of stocks for companies in the energy industry often does not relate to the operating performance of the companies represented by the stock. Some of the factors that may cause the market price of our common stock to fluctuate include:
- •
- demand for and acceptance of our clean and intelligent energy solutions;
- •
- our ability to develop new relationships and maintain and enhance existing relationships with customers and strategic
partners;
- •
- changes in open market bidding program rules and reductions in pricing for demand response capacity;
- •
- the termination or expiration of existing contracts with grid operator and utility customers and commercial, institutional
and industrial customers;
- •
- general market conditions and overall fluctuations in equity markets in the United States;
- •
- flaws in the design or the elimination of any demand response program in which we participate;
- •
- introduction of technological innovations or new products or services by us or our competitors;
- •
- changes in estimates or recommendations by securities analysts, if any cover our common stock;
- •
- delays in the implementation and delivery of our clean and intelligent energy solutions, which may impact the timing of
our recognition of revenues;
- •
- litigation or regulatory enforcement actions;
- •
- changes in the regulations affecting the energy industry in the United States and internationally;
- •
- the way in which we recognize revenues and the timing associated with our recognition of revenues;
- •
- developments or disputes concerning patents or other proprietary rights;
- •
- period-to-period fluctuations in our financial results;
- •
- the potential interruptions of our customers' operations;
- •
- the seasonality of our demand response business in certain of the markets in which we operate;
- •
- failure to secure adequate capital to fund our operations, or the future sale or issuance of equity securities at prices
below fair market price or in general; and
- •
- economic and other external factors or other disasters or crises.
These and other external factors may cause the market price and demand for our common stock to fluctuate substantially, which may limit or prevent investors from readily selling their shares of common stock and may otherwise negatively affect the liquidity of our common stock. In addition, in the past, when the market price of a stock has been volatile, holders of that stock have instituted securities class action litigation against the company that issued the stock. If any of our stockholders brought a lawsuit against us, we could incur substantial costs defending the lawsuit. Such a lawsuit could also divert the time and attention of our management.
42
We do not intend to pay dividends on our common stock.
We have not declared or paid any cash dividends on our common stock to date, and we do not anticipate paying any dividends on our common stock in the foreseeable future. We currently intend to retain all available funds and any future earnings for use in the development, operation and growth of our business. In addition, the SVB credit facility prohibits us from paying dividends and future loan agreements may also prohibit the payment of dividends. Any future determination relating to our dividend policy will be at the discretion of our board of directors and will depend on our results of operations, financial condition, capital requirements, business opportunities, contractual restrictions and other factors deemed relevant. To the extent we do not pay dividends on our common stock, investors must look solely to stock appreciation for a return on their investment in our common stock.
Provisions of our charter, bylaws and Delaware law, and of some of our employment arrangements, may make an acquisition of us or a change in our management more difficult and could discourage acquisition bids or merger proposals, which may adversely affect the market price of our common stock.
Certain provisions of our certificate of incorporation and bylaws could discourage, delay or prevent a merger, acquisition or other change of control that stockholders may consider favorable, including transactions in which we may have otherwise received a premium on our shares of common stock. These provisions also could limit the price that investors might be willing to pay in the future for shares of our common stock, thereby depressing the market price of our common stock. Stockholders who wish to participate in these transactions may not have the opportunity to do so. Furthermore, these provisions could prevent or frustrate attempts by our stockholders to replace or remove our management. These provisions:
- •
- allow the authorized number of directors to be changed only by resolution of our board of directors;
- •
- require that vacancies on the board of directors, including newly-created directorships, be filled only by a majority vote
of directors then in office;
- •
- establish a classified board of directors, providing that not all members of the board be elected at one time;
- •
- authorize our board of directors to issue, without stockholder approval, blank check preferred stock that, if issued,
could operate as a "poison pill" to dilute the stock ownership of a potential hostile acquirer to prevent an acquisition that is not approved by our board of directors;
- •
- require that stockholder actions must be effected at a duly called stockholder meeting and prohibit stockholder action by
written consent;
- •
- prohibit cumulative voting in the election of directors, which would otherwise allow holders of less than a majority of
stock to elect some directors;
- •
- establish advance notice requirements for stockholder nominations to our board of directors or for stockholder proposals
that can be acted on at stockholder meetings;
- •
- limit who may call stockholder meetings; and
- •
- require the approval of the holders of 75% of the outstanding shares of our capital stock entitled to vote in order to amend certain provisions of our certificate of incorporation and bylaws.
Some of our employment arrangements and equity agreements provide for severance payments and accelerated vesting of benefits, including accelerated vesting of equity awards, upon a change of control. These provisions may discourage or prevent a change of control. In addition, because we are incorporated in Delaware, we are governed by the provisions of Section 203 of the Delaware General
43
Corporation Law, which may, unless certain criteria are met, prohibit large stockholders, in particular those owning 15% or more of our outstanding voting stock, from merging or combining with us for a proscribed period of time.
If securities or industry analysts do not publish research or publish inaccurate or unfavorable research about our business, our stock price and trading volume could decline.
The trading market for our common stock will continue to depend in part on the research and reports that securities or industry analysts publish about us or our business. If these analysts do not continue to provide adequate research coverage or if one or more of the analysts who covers us downgrades our stock or publishes inaccurate or unfavorable research about our business, our stock price would likely decline. If one or more of these analysts ceases coverage of our company or fails to publish reports on us regularly, demand for our stock could decrease, which could cause our stock price and trading volume to decline.
The requirements of being a public company, including compliance with the reporting requirements of the Exchange Act and NASDAQ, require significant resources, increase our costs and distract our management, and we may be unable to comply with these requirements in a timely or cost-effective manner.
As a public company with equity securities listed on NASDAQ, we must comply with statutes and regulations of the SEC and the requirements of NASDAQ. Complying with these statutes, regulations and requirements occupies a significant amount of the time of our board of directors and management and significantly increases our costs and expenses. In addition, as a public company we incur substantially higher costs to obtain director and officer liability insurance policies than we did as a private company. These factors could make it more difficult for us to attract and retain qualified members of our board of directors, particularly to serve on our audit committee.
Our directors and management may be able to exercise significant control over our company, which will limit your ability to influence corporate matters.
As of December 31, 2009, our directors and executive officers and their affiliates collectively beneficially owned approximately 18% of our outstanding common stock. As a result, these stockholders, if they act together, may be able to influence our management and affairs and all matters requiring stockholder approval, including the election of directors and approval of significant corporate transactions. This concentration of ownership may have the effect of delaying or preventing a change in control of our company and might negatively affect the market price of our common stock.
Item 1B. Unresolved Staff Comments
Not applicable.
Our corporate headquarters and principal office is located in Boston, Massachusetts, where we lease approximately 57,034 square feet under a sublease agreement expiring in June 2014. We also lease approximately 8,766 square feet in San Francisco, California under a sublease agreement expiring in February 2012, approximately 6,603 square feet in New York, New York under a lease agreement expiring in December 2011, and approximately 6,132 square feet in Baltimore, Maryland under a lease agreement expiring in December 2012. In addition, we lease space in various locations throughout the United States, Canada and the United Kingdom for local sales, marketing, and field operations personnel. We do not own any real property. We believe that our leased facilities will be adequate to meet our needs for the foreseeable future.
44
We are subject to legal proceedings, claims and litigation arising in the ordinary course of business. We do not expect the ultimate costs to resolve these matters to have a material adverse effect on our consolidated financial condition, results of operations or cash flows.
45
Item 5. Market for Registrant's Common Equity, Related Stockholder Matters and Issuer Purchases of Equity Securities
Price Range of Our Common Stock
Our common stock has been listed on NASDAQ under the symbol "ENOC" since May 18, 2007. Prior to this time, there was no public market for our common stock. The following table sets forth the high and low sales prices per share of our common stock as reported by NASDAQ for the periods indicated.
Fiscal 2009
|
High | Low | |||||
|---|---|---|---|---|---|---|---|
First Quarter |
$ | 15.61 | $ | 7.50 | |||
Second Quarter |
$ | 25.00 | $ | 14.42 | |||
Third Quarter |
$ | 34.37 | $ | 17.65 | |||
Fourth Quarter |
$ | 35.55 | $ | 24.10 | |||
Fiscal 2008
|
High | Low | |||||
|---|---|---|---|---|---|---|---|
First Quarter |
$ | 48.92 | $ | 9.29 | |||
Second Quarter |
$ | 19.25 | $ | 9.26 | |||
Third Quarter |
$ | 24.10 | $ | 9.06 | |||
Fourth Quarter |
$ | 10.52 | $ | 4.80 | |||
Stockholders
As of March 8, 2010, we had approximately 187 stockholders of record. This number does not include stockholders for whom shares are held in a "nominee" or "street" name.
Dividend Policy
We have never paid or declared any cash dividends on our common stock. We currently intend to retain all available funds and any future earnings to fund the development and expansion of our business, and we do not anticipate paying any cash dividends in the foreseeable future. Any future determination to pay dividends will be at the discretion of our board of directors and will depend on our financial condition, results of operations, capital requirements, and other factors that our board of directors deems relevant. The terms of the SVB credit facility preclude us, and the terms of any future debt or credit facility may preclude us, from paying dividends.
Unregistered Sales of Equity Securities
We offered, issued and/or sold the following unregistered securities during the three months ended December 31, 2009: on December 4, 2009, in connection with our acquisition of all of the capital stock of Cogent, we issued 114,281 shares of our common stock.
The issuance of the securities described above was deemed to be exempt from registration under the Securities Act of 1933, as amended, or the Securities Act, in reliance on Section 4(2) of the Securities Act as transactions by an issuer not involving any public offering. The recipients of these securities in such transaction represented their intention to acquire the securities for investment only and not with a view to or for sale in connection with any distribution thereof. Such recipients received written disclosures that the securities have not been registered under the Securities Act and that any resale must be made pursuant to a registration or an available exemption from such registration. All of these securities are deemed restricted securities for the purposes of the Securities Act. The sales of these securities were made without general solicitation or advertising.
46
Item 6. Selected Financial Data
Our selected consolidated financial data set forth below is derived from our audited financial statements contained elsewhere in this Annual Report on Form 10-K. The following selected consolidated financial data should be read in conjunction with "Management's Discussion and Analysis of Financial Condition and Results of Operations" and our consolidated financial statements and accompanying notes thereto included in Item 7 and Appendix A, respectively, to this Annual Report on Form 10-K.
| |
Year Ended December 31, | ||||||||||||||||
|---|---|---|---|---|---|---|---|---|---|---|---|---|---|---|---|---|---|
| |
2009(1) | 2008(1) | 2007(1) | 2006(1) | 2005 | ||||||||||||
| |
(In thousands, except per share data) |
||||||||||||||||
Selected Balance Sheet Data: |
|||||||||||||||||
Cash and cash equivalents |
$ | 119,739 | $ | 60,782 | $ | 70,242 | $ | 9,184 | $ | 9,719 | |||||||
Marketable securities |
— | 2,000 | 15,500 | — | — | ||||||||||||
Working capital |
124,857 | 59,137 | 72,836 | 1,431 | 3,763 | ||||||||||||
Total assets |
255,022 | 136,694 | 155,584 | 29,950 | 19,651 | ||||||||||||
Total long-term debt, including current portion |
73 | 4,563 | 6,091 | 5,200 | 1,989 | ||||||||||||
Redeemable convertible preferred stock warrant liability |
— | — | — | 606 | — | ||||||||||||
Total redeemable convertible preferred stock and stockholders' equity |
194,975 | 99,220 | 122,417 | 8,608 | 6,101 | ||||||||||||
Selected Statement of Operations Data: |
|||||||||||||||||
Revenues |
$ | 190,675 | $ | 106,115 | $ | 60,838 | $ | 26,100 | $ | 9,826 | |||||||
Cost of revenues |
104,215 | 64,819 | 38,949 | 16,839 | 4,190 | ||||||||||||
Gross profit |
86,460 | 41,296 | 21,889 | 9,261 | 5,636 | ||||||||||||
Selling and marketing expenses |
39,502 | 30,789 | 18,695 | 5,932 | 2,228 | ||||||||||||
General and administrative expenses |
44,407 | 41,582 | 25,866 | 8,000 | 4,211 | ||||||||||||
Research and development expenses |
7,601 | 6,123 | 3,598 | 955 | 981 | ||||||||||||
Loss from operations |
(5,050 | ) | (37,198 | ) | (26,270 | ) | (5,626 | ) | (1,784 | ) | |||||||
Interest and other (expense) income, net |
(1,446 | ) | 798 | 2,788 | (145 | ) | 78 | ||||||||||
Loss before income taxes |
(6,496 | ) | (36,400 | ) | (23,482 | ) | (5,771 | ) | (1,706 | ) | |||||||
Provision for income taxes |
(333 | ) | (262 | ) | (100 | ) | — | — | |||||||||
Net loss |
$ | (6,829 | ) | $ | (36,662 | ) | $ | (23,582 | ) | $ | (5,771 | ) | $ | (1,706 | ) | ||
Net loss per share, basic and diluted(2) |
$ | (0.32 | ) | $ | (1.88 | ) | $ | (1.80 | ) | $ | (1.60 | ) | $ | (0.56 | ) | ||
Weighted average number of basic and diluted shares(2) |
21,466,813 | 19,505,065 | 13,106,114 | 3,607,822 | 3,071,733 | ||||||||||||
- (1)
- Includes
the results of operations from the date of acquisition relating to our acquisitions of Cogent in December 2009, eQ in June 2009, SRC in May 2008,
MDE in September 2007, and eBidenergy, Inc. and Celerity in 2006. See Note 2 of our accompanying consolidated financial statements contained in Appendix A to this Annual Report on
Form 10-K. Commencing on January 1, 2006, we began to record stock-based compensation expense associated with the fair value of stock options in accordance with accounting
principles generally accepted in the United States, or GAAP.
- (2)
- On May 1, 2007, we effected a 2.831 for one split of our common stock. All amounts reflect the impact of that split.
47
Item 7. Management's Discussion and Analysis of Financial Condition and Results of Operations
You should read the following discussion and analysis of our financial condition and results of operations together with our "Selected Financial Data" and consolidated financial statements and accompanying notes thereto included elsewhere in this Annual Report on Form 10-K. In addition to the historical information, the discussion contains certain forward-looking statements that involve risks and uncertainties. Our actual results could differ materially from those expressed or implied by the forward-looking statements due to applications of our critical accounting policies and factors including, but not limited to, those set forth under the caption "Risk Factors" in Item 1A of Part I of this Annual Report on Form 10-K.
Overview
We are a leading provider of clean and intelligent energy solutions, which include demand response services, energy efficiency, or monitoring-based commissioning, services, energy procurement services and emissions tracking and trading support services. These solutions help optimize the balance of electric supply and demand, provide cost-efficient alternatives to traditional power generation, transmission and distribution resources, and drive significant cost-savings for our customers. Our customers are commercial, institutional and industrial end-users of energy, as well as electric power grid operators and utilities.
We believe that we are the largest demand response service provider in the United States for commercial, institutional and industrial customers. As of December 31, 2009, we managed over 3,550 MW of demand response capacity across an end-use customer base of approximately 2,800 accounts and 6,500 customer sites throughout multiple electric power grids. Demand response is an alternative to traditional power generation and transmission infrastructure projects that enables grid operators and utilities to reduce the likelihood of service disruptions, such as brownouts and blackouts, during periods of peak electricity demand, and otherwise manage the electric power grid during short-term imbalances of supply and demand. We use our NOC and PowerTrak enterprise software platform to remotely manage and reduce electricity consumption across a growing network of commercial, institutional and industrial customer sites, making demand response capacity available to grid operators and utilities on demand while helping end-users of electricity achieve energy savings, environmental benefits and improved financial results. To date, we have received substantially all of our revenues from grid operators and utilities, who make recurring payments to us for managing demand response capacity that we share with end-users of electricity in exchange for such end-users reducing their power consumption when called upon.
We build on our position as a leading demand response services provider by using our NOC and scalable PowerTrak technology platform to sell additional energy management solutions to new and existing end-use customers. These additional solutions include our monitoring-based commissioning services, energy procurement services and emissions tracking and trading support services. Our monitoring-based commissioning services combine advanced metering, building management systems, and energy analytics software applications to identify energy efficiency opportunities in large buildings. Our energy procurement services provide our commercial, institutional and industrial customers located in restructured or deregulated markets throughout the United States with the ability to more effectively manage the energy supplier selection process, including energy supply product procurement and implementation. Our emissions tracking and trading support services include a comprehensive, software-based accounting system for our commercial, institutional and industrial customers to effectively monitor, mitigate and monetize their greenhouse gas emissions in response to existing and pending greenhouse gas reporting requirements.
We continue to devote substantially all of our efforts toward the sale of our demand response and energy management solutions. We have incurred net losses from inception to December 31, 2009. Our
48
net loss was $6.8 million, $36.7 million and $23.6 million for the years ended December 31, 2009, 2008 and 2007, respectively. As of December 31, 2009, our accumulated deficit was $77.3 million.
Significant Recent Developments
In December 2009, we acquired all of the outstanding capital stock of Cogent, a company specializing in comprehensive energy consulting, engineering and building commissioning solutions to commercial, institutional and industrial customers. The purchase price was equal to approximately $11.2 million consisting of both cash and shares of our common stock. By integrating Cogent's extensive commissioning and engineering experience into our monitoring-based commissioning energy efficiency application, we believe that we will be able to deliver even more value to our rapidly growing customer base.
In August 2009, we completed an underwritten public offering of an aggregate of 3,963,889 shares of our common stock at an offering price of $27.00 per share, which included the sale of 709,026 shares by certain selling stockholders. After deducting underwriting discounts and commissions and offering expenses payable by us, we received net proceeds of approximately $83.4 million from the offering.
In July 2009, we and Neal C. Isaacson, our then-current chief financial officer and treasurer, agreed that Mr. Isaacson would resign as chief financial officer and treasurer effective as of the close of business on July 30, 2009. Also in July 2009, we entered into an employment offer letter to hire and retain Timothy Weller as our chief financial officer and treasurer. Mr. Weller's employment with us commenced on July 31, 2009.
In June 2009, we acquired substantially all of the assets of eQ, a software company specializing in the development of enterprise sustainability management products and services, for a purchase price equal to approximately $0.8 million consisting of both cash and shares of our common stock. We believe that the acquisition of eQ strengthens our position in a nascent yet growing market committed to helping energy and sustainability leaders plan their own response to reach energy efficiency and emissions goals.
Revenues and Expense Components
Revenues
We derive recurring revenues from the sale of our demand response and energy management solutions. Our revenues from our demand response services primarily consist of capacity and energy payments. We derive revenues from demand response capacity that we make available in open market programs, which are open market bidding opportunities established by grid operators and utilities. In these open market programs, grid operators and utilities generally seek bids from companies such as ours to provide demand response capacity based on prices offered in competitive bidding. These opportunities are generally characterized by flexible capacity commitments and prices that vary by hour, day, month, bidding period or supplemental, new or modified programs. In certain markets, we enter into long-term capacity contracts with grid operators and utilities, generally ranging from three to 10 years in duration, to deploy our demand response solutions. Our revenues have historically been higher in our second and third fiscal quarters compared to other quarters in our fiscal year due to seasonal demand related to the demand response market.
Where we operate in open market programs, our revenues from demand response capacity payments generally vary month-to-month based upon our enrolled capacity and the market payment rate. Where we have a long-term contract, we receive periodic capacity payments, which may vary monthly or seasonally, based upon enrolled capacity and predetermined payment rates. Under both long-term contracts and open market programs, we receive capacity payments regardless of whether we are called upon to reduce demand for electricity from the electric power grid and we recognize revenue
49
over the applicable delivery period, even where payments are made over a different period. We generally demonstrate our capacity either through a demand response event or a measurement and verification test. This demonstrated capacity is typically used to calculate the continuing periodic capacity payments to be made to us until the next demand response event or test establishes a new demonstrated capacity amount. In most cases, we also receive an additional payment for the amount of energy usage that we actually curtail from the grid during a demand response event; we call this an energy payment.
We do not recognize any revenues until we can determine that persuasive evidence of an arrangement exists, delivery has occurred, the fee is fixed or determinable, and we deem collection to be reasonably assured. As program rules may differ for each contract and/or region where we operate, we assess whether or not we have met the specific service requirements under the program rules and recognize or defer revenues as necessary. We recognize demand response revenues when we have provided verification to the grid operator or utility of our ability to deliver the committed capacity under the contract or open market program. Committed capacity is verified through the results of an actual demand response event or a measurement and verification test. Once the capacity amount has been verified, the revenues are recognized and future revenues become fixed or determinable and are recognized monthly over the performance period until the next verification event. In subsequent verification events, if our verified capacity is below the previously verified amount, the grid operator or utility customer will reduce future payments based on the adjusted verified capacity amounts.
We defer incremental direct costs incurred related to the acquisition or origination of a contract or open market program in a transaction that results in the deferral or delay of revenue recognition. As of December 31, 2009 and 2008, the incremental direct costs deferred were approximately $0.9 million and $0.1 million, respectively. During the years ended December 31, 2009, 2008 and 2007, we deferred contract origination costs of approximately $0.8 million, $0.1 million and $0.0 million, respectively. These deferred expenses would not have been incurred without our participation in a certain open market program and will be expensed in proportion to the related revenue being recognized. In addition, we capitalize the costs of our production and generation equipment utilized in the delivery of our demand response services and expense such equipment over the lesser of its useful life or the term of the contractual arrangement. These capitalized costs are included in property and equipment in our consolidated balance sheets. We believe that this accounting treatment appropriately matches expenses with the associated revenue.
As of December 31, 2009, we had over 3,550 MW under management in our demand response network, meaning that we had entered into definitive contracts with our commercial, institutional and industrial customers with respect to over 3,550 MW of demand response capacity. We generally begin earning revenues from our MW under management within approximately one month from the date on which we "enable" the MW, or the date on which we can reduce the MW from the electricity grid if called upon to do so. An exception is the PJM forward capacity market, which is a market in which we materially increased our participation beginning in the first quarter of 2008 and in which we expect to continue to increase our participation and derive revenues for the foreseeable future. Because PJM operates on a June to May program-year basis, a MW that we enable after June of each year may not begin earning revenue until June of the following year. This results in a longer average revenue recognition lag time in our end-use customer portfolio from the point in time when we consider a MW to be under management to when we earn revenues from the MW. Certain other markets in which we currently participate or choose to participate in the future may operate in a manner similar to the PJM forward capacity market, which would create a delay in recognizing revenue from the MW that we enable in those markets.
Our portfolio of additional energy management solutions includes our monitoring-based commissioning services, energy procurement services, and emissions tracking and trading support services. Our monitoring-based commissioning services combine advanced metering, building
50
management systems, and energy analytics software applications to identify energy efficiency opportunities in large buildings. Our energy procurement services provides our end-use customers located in restructured or deregulated markets throughout the United States with the ability to more effectively manage the energy supplier selection process, including energy supply product procurement and implementation. We also use our CarbonTrak platform to deliver emissions tracking and trading support services, which include a comprehensive, software-based accounting system for our commercial, institutional and industrial customers to enable them to more effectively monitor, mitigate and monetize their greenhouse gas emissions in response to existing and pending greenhouse gas reporting requirements. We generally receive either a subscription-based or consulting fee or a percentage savings fee for these energy management solutions. Revenues derived from our energy management solutions were $6.8 million, $6.7 million and $1.6 million, respectively, for the years ended December 31, 2009, 2008 and 2007.
Revenues generated from open market sales to PJM, a grid operator customer, accounted for 52%, 28% and 4%, respectively, of our total revenues for the years ended December 31, 2009, 2008, and 2007. Under certain contracts and programs, such as PJM's Emergency Load Response Program, or ELRP, the period during which we are required to perform may be shorter than the period over which we receive payments under that contract or program. In these cases, we record revenue over the mandatory performance obligation period, and a portion of the revenues that have been earned is recorded and accrued as unbilled revenue. Our unbilled revenue of $40.4 million at December 31, 2009 will be billed and collected through May 31, 2010. Our unbilled revenue of $11.6 million as of December 31, 2008 was collected through May 31, 2009.
Revenues generated from two fixed price contracts with, and open market sales to, ISO-NE, a grid operator customer, accounted for 29%, 36% and 60%, respectively, of our total revenues for the years ended December 31, 2009, 2008 and 2007. Our two fixed price contracts with ISO-NE expired on May 31, 2008. In addition, 0%, 15% and 21%, respectively, of our total revenues for the years ended December 31, 2009, 2008 and 2007 were generated under a fixed price contract with The Connecticut Light and Power Company, or CL&P, which expired on December 31, 2008. We have enrolled a significant portion of the MW represented by our expired fixed price contracts with ISO-NE and CL&P in other available demand response programs.
Cost of Revenues
Cost of revenues for our demand response solutions consists primarily of payments that we make to our commercial, institutional and industrial customers for their participation in our demand response network. We generally enter into three to five year contracts with our commercial, institutional and industrial customers under which we deliver recurring cash payments to them for the capacity they commit to make available on demand. We also generally make an additional payment when a commercial, institutional or industrial customer reduces consumption of energy from the electric power grid. The equipment and installation costs for our devices, which monitor energy usage, communicate with sites and, in certain instances, remotely control energy usage to achieve committed capacity, at our commercial, institutional and industrial customer sites are capitalized and depreciated over the lesser of the remaining estimated customer relationship period or the estimated useful life of the equipment, and this depreciation is reflected in cost of revenues. We also include in cost of revenues the monthly telecommunications and data costs we incur as a result of being connected to commercial, institutional and industrial customer sites and our internal payroll and related costs allocated to a commercial, institutional and industrial customer site. Cost of revenues for energy management solutions include third party services, equipment depreciation and the wages and associated benefits that we pay to our project managers for the performance of their services.
51
Gross Profit and Gross Margin
Gross profit consists of our total revenues less our cost of revenues. Our gross profit has been, and will be, affected by many factors, including (a) the demand for our demand response and energy management solutions, (b) the selling price of our solutions, (c) our cost of revenues, (d) the way in which we manage our portfolio of demand response capacity, as described under the caption "Business—Industry Background—Our Market Opportunity" in Item 1 of Part I of this Annual Report on Form 10-K, (e) the introduction of new clean and intelligent energy solutions, (f) our demand response event performance and (g) our ability to open and enter new markets and regions and expand deeper into markets we already serve. Our outcomes in negotiating favorable contracts with our commercial, institutional and industrial customers, as well as with our utility and grid operator customers, the effective management of our portfolio of demand response capacity and our demand response event performance are the primary determinants of our gross profit and gross margin.
Operating Expenses
Operating expenses consist of selling and marketing, general and administrative, and research and development expenses. Personnel-related costs are the most significant component of each of these expense categories. We grew from 345 full-time employees at December 31, 2008 to 418 full-time employees at December 31, 2009. We expect to continue to hire employees to support our growth for the foreseeable future. In addition, we incur significant up-front costs associated with the expansion of the number of MW under our management, which we expect to continue for the foreseeable future. Although we expect our overall operating expenses to increase in absolute dollar terms for the foreseeable future as we grow our MW under management and further increase our headcount, we expect our overall annual operating expenses to decrease as a percentage of total annual revenues as we leverage our existing employee base and continue generating revenues from our MW under management.
Selling and Marketing
Selling and marketing expenses consist primarily of (a) salaries and related personnel costs, including costs associated with share-based payment awards, (b) commissions, (c) travel, lodging and other out-of-pocket expenses, (d) marketing programs such as trade shows and (e) other related overhead. Commissions are recorded as an expense when earned by the employee. We expect increases in selling and marketing expenses in absolute dollar terms for the foreseeable future as we further increase the number of sales professionals and, to a lesser extent, increase our marketing activities. We expect annual selling and marketing expenses to decrease as a percentage of total annual revenues as we leverage our current sales and marketing personnel.
General and Administrative
General and administrative expenses consist primarily of (a) salaries and related personnel costs, including costs associated with share-based payment awards, related to our executive, finance, human resource, information technology and operations organizations, (b) facilities expenses, (c) accounting and legal professional fees, (d) depreciation and amortization and (e) other related overhead. We expect general and administrative expenses to continue to increase in absolute dollar terms for the foreseeable future as we invest in infrastructure to support our continued growth. We expect general and administrative expenses to decrease as a percentage of total annual revenues as we leverage our current infrastructure and employee base.
Research and Development
Research and development expenses consist primarily of (a) salaries and related personnel costs, including costs associated with share-based payment awards, related to our research and development organization, (b) payments to suppliers for design and consulting services, (c) costs relating to the
52
design and development of new solutions and enhancement of existing solutions, (d) quality assurance and testing and (e) other related overhead. During the years ended December 31, 2009, 2008 and 2007, we capitalized internal software development costs of $2.1 million, $1.3 million and $0.7 million, respectively, and the amount is included as software in property and equipment at December 31, 2009. We expect research and development expenses to increase in absolute dollar terms for the foreseeable future and to decrease as a percentage of total revenues in the long term as we leverage our existing technology and develop new technologies.
Stock-Based Compensation
Effective as of January 1, 2006, we adopted the requirements of Accounting Standards Codification, or ASC, 718, Stock Compensation (formerly Financial Accounting Standards Board, or FASB, Statement of Financial Accounting Standard, or SFAS, No. 123(R), Share-Based Payments). As such, all share-based payments to employees, including grants of stock options, restricted stock and restricted stock units, are recognized in the statement of operations based on their fair values as of the date of grant. We adopted ASC 718 using the "modified prospective" transition method, in which compensation cost is recognized beginning with the effective date (a) based on the requirements of ASC 718 for all share-based payments granted after the effective date and (b) based on the requirements of ASC 718 for all awards granted to employees prior to the effective date of ASC 718 that remain unvested on the effective date. As a result, we are recognizing compensation for the fair value of the unvested portion of option grants issued prior to the adoption of ASC 718, whose fair value was calculated utilizing a Black-Scholes option pricing model. In accordance with the modified-prospective transition method of ASC 718, results for prior periods have not been restated. For stock options granted prior to January 1, 2009, the fair value for these options was estimated at the date of grant using a Black-Scholes option-pricing model, and for stock options granted on or after January 1, 2009, the fair value of each award is and has been estimated on the date of grant using a trinomial valuation model. If we had continued using the Black-Scholes option pricing model in 2009, stock-based compensation expense would not have been materially different for the year ended December 31, 2009. For the years ended December 31, 2009, 2008 and 2007, we recorded expenses of approximately $13.1 million, $10.4 million and $7.6 million, respectively, in connection with share-based payment awards to employees and non-employees. With respect to grants through December 31, 2009, a future expense of non-vested options of approximately $16.5 million is expected to be recognized over a weighted average period of 2.2 years and a future expense of restricted stock and restricted stock unit awards of approximately $4.9 million is expected to be recognized over a weighted average period of 2.4 years.
Other Income and Expense, Net
Other income and expense consist primarily of interest income earned on cash balances, gain or loss on foreign currency transactions and other non-operating income. We historically have invested our cash in money market funds, treasury funds, commercial paper, municipal bonds and auction rate securities. We do not currently hold any auction rate securities.
Interest Expense
Interest expense consists of interest and fees on the SVB credit facility and fees associated with issuing letters of credit and other financial assurances.
Net Loss
Net loss for the year ended December 31, 2009 was $6.8 million, or $0.32 per basic and diluted share, compared to a net loss of $36.7 million, or $1.88 per basic and diluted share, for the year ended December 31, 2008. Excluding stock-based compensation charges and amortization of expenses related to acquisition-related assets, non-GAAP net income for the year ended December 31, 2009 was
53
$7.0 million, or $0.33 per basic share and $0.30 per diluted share, compared to a non-GAAP net loss of $25.2 million, or $1.29 per basic and diluted share, for the year ended December 31, 2008. Please refer to the section below entitled "Use of Non-GAAP Financial Measures" for a reconciliation of non-GAAP measures to the most directly comparable measure calculated and presented in accordance with GAAP.
Consolidated Results of Operations
Year Ended December 31, 2009 Compared to Year Ended December 31, 2008
Revenues
The following table summarizes our revenues for the years ended December 31, 2009 and 2008 (dollars in thousands):
| |
Year Ended December 31, |
|
|
||||||||||
|---|---|---|---|---|---|---|---|---|---|---|---|---|---|
| |
Dollar Change |
Percentage Change |
|||||||||||
| |
2009 | 2008 | |||||||||||
Revenues: |
|||||||||||||
Demand response solutions |
$ | 183,861 | $ | 99,394 | $ | 84,467 | 85.0 | % | |||||
Energy management solutions |
6,814 | 6,721 | 93 | 1.4 | % | ||||||||
Total revenues |
$ | 190,675 | $ | 106,115 | $ | 84,560 | 79.7 | % | |||||
For the year ended December 31, 2009, our demand response solutions revenues increased by $84.5 million, or 85%, as compared to the year ended December 31, 2008. This increase in our demand response solutions revenues was primarily attributable to an increase in our MW under management, which increased from over 2,050 as of December 31, 2008 to over 3,550 as of December 31, 2009. The increase in our MW under management was primarily due to increased selling of our demand response solutions in the following existing operating areas and our expansion into new markets and programs (dollars in thousands):
| |
Revenue Increase: December 31, 2008 to December 31, 2009 |
|||
|---|---|---|---|---|
PJM |
$ | 68,404 | ||
TECO |
1,515 | |||
Tennessee Valley Authority |
5,747 | |||
California |
2,451 | |||
New York ISO |
1,843 | |||
Other |
4,507 | |||
Total increased demand response solutions revenues |
$ | 84,467 | ||
The increase in our demand response solutions revenues was also attributable to more favorable pricing in certain operating areas, including PJM and ISO-NE, and our effective management of our portfolio of demand response capacity. The increase in our demand response solutions revenues was offset by the expiration of our two fixed price contracts with ISO-NE and our fixed priced contract with CL&P, as well as a reduction in energy payments due to lower real-time demand response prices that affected our participation in certain economic demand response programs, including the day-ahead program with ISO-NE.
For the year ended December 31, 2009, our energy management solutions revenues were flat compared to the year ended December 31, 2008. Revenues related to our energy procurement services for the year ended December 31, 2009 increased approximately $0.4 million compared to the same period in 2008 primarily due to a full year of recognized revenue related to our acquisition of SRC, which
54
occurred in May 2008. This increase was offset by a $0.3 million reduction in revenue related to the discontinuation of our energy efficiency audits, which we ceased conducting at the beginning of 2009.
We currently expect our revenues to increase in 2010 compared to 2009 as we seek to further increase our MW under management in all operating regions, enroll new end-use customers in our demand response programs, continue to sell our energy management solutions to our new and existing demand response customers and pursue more favorable pricing opportunities.
Gross Profit and Gross Margin
The following table summarizes our gross profit and gross margin percentages for our demand response and energy management solutions for the years ended December 31, 2009 and 2008 (dollars in thousands):
| Year Ended December 31, | |||||||||||
|---|---|---|---|---|---|---|---|---|---|---|---|
| 2009 | 2008 | ||||||||||
| Gross Profit | Gross Margin | Gross Profit | Gross Margin | ||||||||
| $ | 86,460 | 45.3 | % | $ | 41,296 | 38.9 | % | ||||
Our gross profit increased during the year ended December 31, 2009 as compared to the year ended December 31, 2008 primarily due to the substantial increase in our revenues in 2009, as well as the effective management of our portfolio of demand response capacity and our strong demand response event performance, particularly in the PJM region from which we derive a substantial portion of our revenues. Also contributing to the increase in gross profit was our ability to achieve favorable contract terms with our commercial, institutional and industrial customers.
Our gross margin increased during the year ended December 31, 2009 as compared to the year ended December 31, 2008 primarily due to the effective management of our portfolio of demand response capacity, as well as our strong demand response event performance, particularly in the PJM region from which we derive a substantial portion of our revenues. Also contributing to the increase in gross margin was our ability to achieve favorable contract terms with our commercial, institutional and industrial customers.
We currently expect that our gross margin for the year ending December 31, 2010 will be relatively flat as compared to the year ended December 31, 2009, and that our gross margin for the third quarter of 2010 will be the highest gross margin among our four quarterly reporting periods in 2010, consistent with our gross margin pattern in 2009. Further, for the year ended December 31, 2009 we were able to derive significant profits from MW in the PJM incremental auctions, which may not occur at similar levels beyond 2010.
Operating Expenses
The following table summarizes our operating expenses for the years ended December 31, 2009 and 2008 (dollars in thousands):
| |
Year Ended December 31, |
|
||||||||
|---|---|---|---|---|---|---|---|---|---|---|
| |
Percentage Change |
|||||||||
| |
2009 | 2008 | ||||||||
Operating Expenses: |
||||||||||
Selling and marketing |
$ | 39,502 | $ | 30,789 | 28.3 | % | ||||
General and administrative |
44,407 | 41,582 | 6.8 | % | ||||||
Research and development |
7,601 | 6,123 | 24.1 | % | ||||||
Total |
$ | 91,510 | $ | 78,494 | 16.6 | % | ||||
In certain forward capacity markets in which we choose to participate, such as PJM, we may enable our commercial, institutional and industrial customers up to twelve months in advance of
55
enrolling them in a particular program. This market feature creates a longer average revenue recognition lag time across our end-use customer portfolio from the point in time when we consider a MW to be under management to when we earn revenues from that MW. Because we incur operational expenses, including salaries and related personnel costs, at the time of enablement, we believe there may be a trend of higher up-front costs than we have incurred historically.
Selling and Marketing Expenses
| |
Year Ended December 31, |
|
||||||||
|---|---|---|---|---|---|---|---|---|---|---|
| |
Percentage Change |
|||||||||
| |
2009 | 2008 | ||||||||
| |
(In thousands) |
|
||||||||
Payroll and related costs |
$ | 26,241 | $ | 20,850 | 25.9 | % | ||||
Stock-based compensation |
3,989 | 3,692 | 8.0 | % | ||||||
Other |
9,272 | 6,247 | 48.4 | % | ||||||
Total |
$ | 39,502 | $ | 30,789 | 28.3 | % | ||||
The increase in selling and marketing expenses for the year ended December 31, 2009 compared to the same period in 2008 was primarily driven by the payroll and related costs associated with an increase in the number of selling and marketing full-time employees from 118 at December 31, 2008 to 146 at December 31, 2009. The increase in payroll and related costs for the year ended December 31, 2009 compared to the same period in 2008 was primarily attributable to an increase in sales commissions payable to certain members of our sales force of $3.0 million, as well as the timing associated with our hiring new full-time employees during 2009 as compared to 2008. The increase in stock-based compensation for the year ended December 31, 2009 compared to the same period in 2008 was primarily due to costs related to equity awards granted to certain existing and newly-hired employees. The increase in other selling and marketing expenses for the year ended December 31, 2009 as compared to the same period in 2008 was primarily due to increases in professional services of $0.2 million, third party marketing and selling costs of $0.3 million, other marketing materials, conferences and seminars of $0.5 million, facility costs of $1.3 million and technology and communication costs of $0.5 million.
General and Administrative Expenses
| |
Year Ended December 31, |
|
||||||||
|---|---|---|---|---|---|---|---|---|---|---|
| |
Percentage Change |
|||||||||
| |
2009 | 2008 | ||||||||
| |
(In thousands) |
|
||||||||
Payroll and related costs |
$ | 23,059 | $ | 21,227 | 8.6 | % | ||||
Stock-based compensation |
8,471 | 6,201 | 36.6 | % | ||||||
Other |
12,877 | 14,154 | (9.0 | )% | ||||||
Total |
$ | 44,407 | $ | 41,582 | 6.8 | % | ||||
The increase in general and administrative expenses for the year ended December 31, 2009 compared to the same period in 2008 was primarily driven by payroll and related costs due to an increase in executive compensation and severance payments made to our former chief financial officer. The increase in payroll and related costs for the year ended December 31, 2009 compared to the same period in 2008 was also attributable to an increase in full-time employees from 182 at December 31, 2008 to 223 at December 31, 2009. The increase in stock-based compensation for the year ended December 31, 2009 compared to the same period in 2008 was primarily due to stock-based compensation expenses associated with our current and former chief financial officer and other officers and directors, including the costs related to accelerating the vesting of a certain portion of our former chief financial officer's options to purchase shares of our common stock. The decrease in other general and administrative expenses for the year ended December 31, 2009 compared to the same period in 2008 was primarily due to a reduction in professional services of $1.5 million, as a result of the voluntary dismissal of the class action complaint against us, offset by an increase in facility costs of $0.3 million.
56
Research and Development Expenses
| |
Year Ended December 31, |
|
||||||||
|---|---|---|---|---|---|---|---|---|---|---|
| |
Percentage Change |
|||||||||
| |
2009 | 2008 | ||||||||
| |
(In thousands) |
|
||||||||
Payroll and related costs |
$ | 4,214 | $ | 3,850 | 9.5 | % | ||||
Stock-based compensation |
674 | 546 | 23.4 | % | ||||||
Other |
2,713 | 1,727 | 57.1 | % | ||||||
Total |
$ | 7,601 | $ | 6,123 | 24.1 | % | ||||
The increase in research and development expenses for the year ended December 31, 2009 compared to the same period in 2008 was primarily driven by the costs associated with an increase in the number of research and development full-time employees from 45 at December 31, 2008 to 49 at December 31, 2009. This increase was partially offset by capitalized internal software development costs of $2.1 million at December 31, 2009 and $1.3 million at December 31, 2008. The increase in other research and development expenses for the year ended December 31, 2009 compared to the same period in 2008 was primarily due to an increase in professional services of $0.3 million, facility costs of $0.3 million, and technology and communication costs of $0.3 million due to continued growth in our business and our investments in technology.
Other Income, Net
Other income for the year ended December 31, 2009 was $0.1 million as compared to $1.9 million for the year ended December 31, 2008. The decrease in other income for the year ended December 31, 2009 as compared to the same period in 2008 was primarily due to the global decrease in interest rates, which has affected the yields on our investments and, to a lesser extent, lower average investment balances and the recognition of net foreign currency transactions.
Interest Expense
Interest expense for years ended December 31, 2009 and 2008 was $1.5 million and $1.2 million, respectively. Interest expense includes interest on our outstanding debt, letters of credit origination fees, and amortization of deferred financing fees.
The increase in interest expense for the year ended December 31, 2009 compared to the same period in 2008 was due to a $1.1 million increase in fees associated with outstanding letters of credit, primarily attributable to the arrangement that we entered into with a third party in May 2009 in connection with bidding capacity into a certain open market bidding program. This was offset by a $0.4 million decrease in fees associated with our outstanding debt due to the replacement of our debt facility with BlueCrest Capital Finance, L.P., or BlueCrest, with the SVB credit facility, which occurred in August 2008.
Income Taxes
We had a provision for income taxes of $0.3 million for each of the years ended December 31, 2009 and 2008. The provision for income taxes primarily related to the amortization of tax deductible goodwill, which generated a deferred tax liability that cannot be offset by net operating losses or other deferred tax assets since its reversal is considered indefinite in nature. We provided a full valuation allowance for our deferred tax assets because the realization of any future tax benefits could not be sufficiently assured as of December 31, 2009 and 2008.
57
Year Ended December 31, 2008 Compared to Year Ended December 31, 2007
Revenues
The following table summarizes our revenues for the years ended December 31, 2008 and 2007 (dollars in thousands):
| |
Year Ended December 31, |
|
|
||||||||||
|---|---|---|---|---|---|---|---|---|---|---|---|---|---|
| |
Dollar Change |
Percentage Change |
|||||||||||
| |
2008 | 2007 | |||||||||||
Revenues: |
|||||||||||||
Demand response solutions |
$ | 99,394 | $ | 59,197 | $ | 40,197 | 67.9 | % | |||||
Energy management solutions |
6,721 | 1,641 | 5,080 | 309.6 | % | ||||||||
Total revenues |
$ | 106,115 | $ | 60,838 | $ | 45,277 | 74.4 | % | |||||
For the year ended December 31, 2008, our demand response solutions revenues increased by $40.2 million, or 67.9%, as compared to the year ended December 31, 2007, of which $27.5 million resulted from our participation in PJM's demand response programs. For the year ended December 31, 2007, we recognized revenues of $2.5 million from our participation in PJM's demand response programs. We had over 500 MW enrolled in PJM's demand response programs as of December 31, 2008 as compared to 81 MW as of December 31, 2007, and we recognize capacity-based revenue from PJM's demand response programs over the four-month delivery period of June through September. The remainder of the increase in our demand response solutions revenues for the year ended December 31, 2008 resulted from an increase in our MW under management in certain other operating areas, our expansion into new markets and programs, and energy payments in connection with a certain demand response event, offset by the expiration of our fixed price contracts with ISO-NE and a reduction in energy payments due to fewer demand response events being called as compared to the year ended December 31, 2007.
For the year ended December 31, 2008, our energy management solutions revenues increased by $5.1 million, or 309.6%, as compared to the year ended December 31, 2007. Approximately $2.6 million and $2.0 million, respectively, of this increase resulted from our acquisitions of MDE and SRC. The remainder of the increase in our energy management solutions revenues for the year ended December 31, 2008 resulted from end-use customers continuing to utilize our energy procurement services and from revenues we received from providing our monitoring-based commissioning services.
Gross Profit and Gross Margin
The following table summarizes our gross profit and gross margin percentages for our demand response and energy management solutions for the years ended December 31, 2008 and 2007 (dollars in thousands):
| Year Ended December 31, | |||||||||||
|---|---|---|---|---|---|---|---|---|---|---|---|
| 2008 | 2007 | ||||||||||
| Gross Profit | Gross Margin | Gross Profit | Gross Margin | ||||||||
| $ | 41,296 | 38.9 | % | $ | 21,889 | 36.0 | % | ||||
Our gross profit increased during the year ended December 31, 2008 when compared to the year ended December 31, 2007 primarily due to our increased participation in PJM's demand response programs, under which we recognize capacity-based revenue over the four-month delivery period of June through September, as well as to the increase in our MW under management in other operating regions and more favorable contract terms with our commercial, institutional and industrial customers. A significant portion of the increase in gross margin for the year ended December 31, 2008 as
58
compared to the year ended December 31, 2007 was attributable to the way in which we managed our portfolio of demand response capacity in certain supplemental demand response programs in which we participate. The remainder of the increase in gross margin for the year ended December 31, 2008 as compared to the year ended December 31, 2007 was due to our higher gross margin energy management solutions business comprising a greater percentage of our overall revenues.
Operating Expenses
The following table summarizes our operating expenses for the years ended December 31, 2008 and 2007 (dollars in thousands):
| |
Year Ended December 31, |
|
||||||||
|---|---|---|---|---|---|---|---|---|---|---|
| |
Percentage Change |
|||||||||
| |
2008 | 2007 | ||||||||
Operating Expenses: |
||||||||||
Selling and marketing |
$ | 30,789 | $ | 18,695 | 64.7 | % | ||||
General and administrative |
41,582 | 25,866 | 60.8 | % | ||||||
Research and development |
6,123 | 3,598 | 70.2 | % | ||||||
Total |
$ | 78,494 | $ | 48,159 | 63.0 | % | ||||
Personnel-related costs are the most significant component of each of our operating expense categories, including costs associated with share-based payment awards. We grew from 253 full-time employees at December 31, 2007 to 345 full-time employees at December 31, 2008.
Selling and Marketing Expenses
| |
Year Ended December 31, |
|
||||||||
|---|---|---|---|---|---|---|---|---|---|---|
| |
Percentage Change |
|||||||||
| |
2008 | 2007 | ||||||||
| |
(In thousands) |
|
||||||||
Payroll and related costs |
$ | 20,850 | $ | 12,463 | 67.3 | % | ||||
Stock-based compensation |
3,692 | 2,150 | 71.7 | % | ||||||
Other |
6,247 | 4,082 | 53.0 | % | ||||||
Total |
$ | 30,789 | $ | 18,695 | 64.7 | % | ||||
The increase in selling and marketing expenses for the year ended December 31, 2008 compared to the same period in 2007 was primarily driven by the payroll and related costs associated with an increase in the number of selling and marketing full-time employees from 90 at December 31, 2007 to 118 at December 31, 2008. The increase in payroll and related costs for the year ended December 31, 2008 compared to the same period in 2007 was primarily attributable to an increase in sales commissions payable to certain members of our sales force of $1.3 million, which commissions are reflective of the increase in our revenues for the year ended December 31, 2008, as well as the timing associated with our hiring new full-time employees during 2008 as compared to 2007. The increase in stock-based compensation expense for the year ended December 31, 2008 compared to the same period in 2008 was primarily due to an increase in the number of selling and marketing full-time employees. The increase in other for the year ended December 31, 2008 compared to December 31, 2007 was primarily related to an increase in marketing expenses of $0.7 million and facility costs of $1.7 million.
59
General and Administrative Expenses
| |
Year Ended December 31, |
|
||||||||
|---|---|---|---|---|---|---|---|---|---|---|
| |
Percentage Change |
|||||||||
| |
2008 | 2007 | ||||||||
| |
(In thousands) |
|
||||||||
Payroll and related costs |
$ | 21,227 | $ | 12,294 | 72.7 | % | ||||
Stock-based compensation |
6,201 | 5,098 | 21.6 | % | ||||||
Other |
14,154 | 8,474 | 67.0 | % | ||||||
Total |
$ | 41,582 | $ | 25,866 | 60.8 | % | ||||
The increase in general and administrative expenses was primarily due to costs associated with an increase in the number of general and administrative full-time employees from 127 at December 31, 2007 to 182 at December 31, 2008. The increase in payroll and related costs for the year ended December 31, 2008 compared to the same period in 2007 was primarily attributable to the timing associated with our hiring new full-time employees during 2008 as compared to 2007. Stock-based compensation expense related to general and administrative employees for the year ended December 31, 2008 increased from $5.1 million to $6.2 million, or $1.1 million, when compared to the same period in 2007. Included in stock-based compensation during 2007 is $2.3 million related to stock granted to certain of our executives, which was recognized in full as compensation expense. The increase in other was primarily due to increases in telecommunication costs of $0.7 million, facilities costs of $1.9 million and professional services of $2.9 million, as a result of a class action complaint filed against us.
Research and Development Expenses
| |
Year Ended December 31, |
|
||||||||
|---|---|---|---|---|---|---|---|---|---|---|
| |
Percentage Change |
|||||||||
| |
2008 | 2007 | ||||||||
| |
(In thousands) |
|
||||||||
Payroll and related costs |
$ | 3,850 | $ | 2,452 | 57.0 | % | ||||
Stock-based compensation |
546 | 349 | 56.4 | % | ||||||
Other |
1,727 | 797 | 116.7 | % | ||||||
Total |
$ | 6,123 | $ | 3,598 | 70.2 | % | ||||
The increase in research and development expenses for the year ended December 31, 2008 compared to the same period in 2007 was primarily due to costs associated with an increase in the number of research and development full-time employees from 36 at December 31, 2007 to 45 at December 31, 2008, partially offset by capitalized internal software development costs of $1.3 million in 2008 as compared to $0.7 million in 2007. Stock-based compensation expense related to research and development employees for the year ended December 31, 2008 increased from $0.3 million to $0.5 million when compared to the same period in 2007. The increase in other for the year ended December 31, 2008 compared to December 31, 2007 was due to an increase in professional services of $0.1 million, technology and communication costs of $0.1 million and facility costs of $0.6 million as a result of growth in our business.
Other Income, Net
Interest and other income for the year ended December 31, 2008 was $1.9 million as compared to $3.2 million for the year ended December 31, 2007. The decrease in interest and other income for the year ended December 31, 2008 as compared to the year ended December 31, 2007 was primarily due to
60
the global decrease in interest rates, which has reduced the yields on our investments and, to a lesser extent, lower average investment balances.
Interest Expense
Interest expense for the years ended December 31, 2008 and 2007 was $1.2 million and $0.4 million, respectively. Interest expense for the year ended December 31, 2008 included the write off of $0.4 million in deferred financing fees associated with our BlueCrest debt, which was replaced in August 2008 with the SVB credit facility, and interest expense on outstanding debt during 2008. For the year ended December 31, 2007, interest expense was reduced by capitalized interest related to construction in progress projects totaling approximately $0.7 million.
Income Taxes
We had a provision for income taxes of $0.3 million and $0.1 million, respectively, for the years ended December 31, 2008 and December 31, 2007. The provision for income taxes relates to the amortization of tax deductible goodwill, which generates a deferred tax liability that cannot be offset by net operating losses or other deferred tax assets since its reversal is considered indefinite in nature. We provided a full valuation allowance for our deferred tax assets because the realization of any future tax benefits could not be sufficiently assured as of December 31, 2008 and 2007.
Net Loss
Net loss for the year ended December 31, 2008 was $36.7 million, or $1.88 per basic and diluted share, compared to a net loss of $23.6 million, or $1.80 per basic and diluted share, for the year ended December 31, 2007. Excluding stock-based compensation charges and amortization of expenses related to acquisition-related assets, non-GAAP net loss for the year ended December 31, 2008 was $25.2 million, or $1.29 per basic and diluted share, compared to a non-GAAP net loss of $13.7 million, or $1.05 per basic and diluted share, for the year ended December 31, 2007. Please refer to the section below entitled "Use of Non-GAAP Financial Measures" for a reconciliation of non-GAAP measures to the most directly comparable measure calculated and presented in accordance with GAAP.
Use of Non-GAAP Financial Measures
In this Annual Report on Form 10-K, we provide certain "non-GAAP financial measures." A non-GAAP financial measure refers to a numerical financial measure that excludes (or includes) amounts that are included in (or excluded from) the most directly comparable financial measure calculated and presented in accordance with GAAP in our financial statements. In this Annual Report on Form 10-K, we provide non-GAAP net income (loss) and non-GAAP net income (loss) per share data as additional information relating to our operating results. These non-GAAP measures exclude expenses related to stock-based compensation and amortization expense related to acquisition-related assets. Management uses these non-GAAP measures for internal reporting and forecasting purposes. We have provided these non-GAAP financial measures in addition to GAAP financial results because we believe that these non-GAAP financial measures provide useful information to certain investors and financial analysts in assessing our operating performance due to the following factors:
- •
- we believe that the presentation of non-GAAP measures that adjust for the impact of stock-based compensation
expenses and amortization expense related to acquisition-related assets provides investors and financial analysts with a consistent basis for comparison across accounting periods and, therefore, are
useful to investors and financial analysts in helping them to better understand our operating results and underlying operational trends;
- •
- although stock-based compensation is an important aspect of the compensation of our employees and executives, stock-based compensation expense is generally fixed at the time of
61
- •
- we do not acquire intangible assets on a predictable cycle. Our intangible assets relate solely to business acquisitions. Amortization costs are fixed at the time of an acquisition, are then amortized over a period of several years after the acquisition and generally cannot be changed or influenced by management after the acquisition.
grant, then amortized over a period of several years after the grant of the stock-based instrument, and generally cannot be changed or influenced by management after the grant; and
Pursuant to the requirements of the SEC, we have provided below a reconciliation of each non-GAAP financial measure used to the most directly comparable financial measure prepared in accordance with GAAP. These non-GAAP financial measures are not prepared in accordance with GAAP. These measures may differ from the non-GAAP information, even where similarly titled, used by other companies and therefore should not be used to compare our performance to that of other companies. The presentation of this additional information is not meant to be considered in isolation or as a substitute for net income (loss) or net income (loss) per share prepared in accordance with GAAP.
| |
Year Ended December 31, | ||||||||||
|---|---|---|---|---|---|---|---|---|---|---|---|
| |
2009 | 2008 | 2007 | ||||||||
| |
(In thousands, except share and per share data) |
||||||||||
GAAP net loss |
$ | (6,829 | ) | $ | (36,662 | ) | $ | (23,582 | ) | ||
ADD: Stock-based compensation |
13,134 | 10,439 | 7,597 | ||||||||
ADD: Amortization expense of acquired intangible assets |
692 | 1,019 | 2,287 | ||||||||
Non-GAAP net income (loss) |
$ | 6,997 | $ | (25,204 | ) | $ | (13,698 | ) | |||
GAAP net loss per basic share |
$ |
(0.32 |
) |
$ |
(1.88 |
) |
$ |
(1.80 |
) |
||
ADD: Stock-based compensation |
0.61 | 0.54 | 0.58 | ||||||||
ADD: Amortization expense of acquired intangible assets |
0.04 | 0.05 | 0.17 | ||||||||
Non-GAAP net income (loss) per basic share |
$ | 0.33 | $ | (1.29 | ) | $ | (1.05 | ) | |||
GAAP net loss per diluted share |
$ |
(0.32 |
) |
$ |
(1.88 |
) |
$ |
(1.80 |
) |
||
ADD: Stock-based compensation |
0.61 | 0.54 | 0.58 | ||||||||
ADD: Amortization expense of acquired intangible assets |
0.04 | 0.05 | 0.17 | ||||||||
LESS: Dilutive impact of weighted average common stock equivalents |
(0.03 | ) | — | — | |||||||
Non-GAAP net income (loss) per diluted share |
$ | 0.30 | $ | (1.29 | ) | $ | (1.05 | ) | |||
Weighted average number of common shares outstanding |
|||||||||||
Basic |
21,466,813 | 19,505,065 | 13,106,114 | ||||||||
Diluted |
23,021,435 | 19,505,065 | 13,106,114 | ||||||||
Liquidity and Capital Resources
Overview
Since inception, we have generated significant losses. As of December 31, 2009, we had an accumulated deficit of $77.3 million. As of December 31, 2009, our principal sources of liquidity were cash and cash equivalents totaling $119.7 million, an increase of $58.9 million from the December 31, 2008 balance of $60.8 million. We are contingently liable for $30.4 million in connection with outstanding letters of credit under the SVB credit facility. As of December 31, 2009 and 2008, we had restricted cash balances of $7.9 million and $1.4 million, respectively, which relate to amounts to
62
collateralize unused outstanding letters of credit and cover financial assurance requirements in certain of the programs in which we participate.
As of December 31, 2009, we no longer have investments in marketable securities. This is a result of a bond that matured in the second quarter of 2009. Our holdings of marketable securities as of December 31, 2008 were $2.0 million, of which $1.5 million was invested in commercial paper and $0.5 million was invested in government securities. At December 31, 2009, our excess cash was primarily invested in money market funds.
We believe our existing cash and cash equivalents at December 31, 2009 and our anticipated net cash flows from operating activities will be sufficient to meet our anticipated cash needs, including investing activities, for at least the next 12 months. Our future working capital requirements will depend on many factors, including, without limitation, the rate at which we sell our demand response solutions to utilities and grid operators and the increasing rate at which letters of credit or security deposits are required by those utilities and grid operators, the introduction and market acceptance of new demand response and energy management solutions, the expansion of our sales and marketing and research and development activities, and the geographic expansion of our business operations. To the extent that our cash and cash equivalents and our anticipated cash flows from operating activities, as well as the SVB credit facility, are insufficient to fund our future activities or planned future acquisitions, we may be required to raise additional funds through bank credit arrangements or public or private equity or debt financings. We also may raise additional funds in the event we determine in the future to effect one or more acquisitions of businesses, technologies or products. In addition, we may elect to raise additional funds even before we need them if the conditions for raising capital are favorable. Accordingly, we have filed a shelf registration statement with the SEC to register shares of our common stock and other securities for sale, giving us the opportunity to raise funding when needed or otherwise considered appropriate at prices and on terms to be determined at the time of any such offerings. We currently have the ability to sell approximately $62.1 million of our securities under the shelf registration statement. Any equity or equity-linked financing could be dilutive to existing stockholders. In the event we require additional cash resources, we may not be able to obtain bank credit arrangements or effect any equity or debt financing on terms acceptable to us or at all.
Cash Flows
The following table summarizes our cash flows for the years ended December 31, 2009, 2008 and 2007 (dollars in thousands):
| |
Year Ended December 31, | |||||||||
|---|---|---|---|---|---|---|---|---|---|---|
| |
2009 | 2008 | 2007 | |||||||
Cash flows provided by (used in) operating activities |
$ | 8,086 | $ | (15,207 | ) | $ | (7,163 | ) | ||
Cash flows (used in) provided by investing activities |
(29,172 | ) | 6,894 | (57,019 | ) | |||||
Cash flows provided by (used in) financing activities |
80,013 | (1,070 | ) | 125,240 | ||||||
Effects of exchange rate changes on cash |
30 | (77 | ) | — | ||||||
Net change in cash and cash equivalents |
$ | 58,957 | $ | (9,460 | ) | $ | 61,058 | |||
Cash Flows Provided by (Used in) Operating Activities
Cash provided by (used in) operating activities primarily consists of net loss adjusted for certain non-cash items including depreciation and amortization, stock-based compensation expenses, and the effect of changes in working capital and other activities.
Cash provided by operating activities for the year ended December 31, 2009 was $8.1 million and consisted of a net loss of $6.8 million and $12.1 million of net cash used for working capital and other
63
activities, offset by $27.0 million of non-cash items, primarily consisting of depreciation and amortization, unrealized foreign exchange transaction loss, deferred tax provision, stock-based compensation charges and other miscellaneous items. Cash used for working capital and other activities consisted of an increase of $28.6 million in unbilled revenues relating to the PJM demand response market, an increase in accounts receivable of $4.9 million due to the timing of cash receipts under the demand response programs in which we participate, an increase in prepaid expenses and other assets of $3.4 million, and a decrease of $2.2 million in accounts payable and accrued expenses due to the timing of payments. These amounts were partially offset by cash provided by working capital and other activities, which reflected a $1.0 million increase in deferred revenue, a $21.9 million increase in accrued capacity payments, the majority of which was related to the PJM demand response market, a $3.9 million increase in accrued payroll and related expenses, and an increase of $0.2 million in other noncurrent liabilities.
Cash used in operating activities for the year ended December 31, 2008 was $15.2 million and consisted of a $36.7 million net loss, which was offset by approximately $0.7 million of net cash provided by working capital and other activities and by $20.7 million of non-cash items, primarily consisting of depreciation and amortization, interest expense, impairment of fixed assets and stock-based compensation charges. Cash provided by working capital consisted of an increase of $2.0 million in accounts payable and accrued expenses due to our relative size compared to the prior period, an increase in accrued capacity payments of $9.6 million, an increase in accrued payroll and related expenses of $1.4 million, an increase in other noncurrent liabilities of $0.5 million, and a decrease in prepaid expenses and other current assets of $0.7 million. These amounts were partially offset by cash used for working capital and other activities, which reflected a $0.9 million increase in accounts receivable due to increased revenues, an increase of unbilled revenues relating to the PJM demand response market of $11.6 million, an increase in other noncurrent assets of $0.1 million and a decrease of deferred revenue of $0.9 million.
Cash used in operating activities for the year ended December 31, 2007 was $7.2 million and consisted of a $23.6 million net loss, which was offset by approximately $3.1 million of net cash provided by working capital and other activities and by $13.3 million of non-cash items, primarily consisting of depreciation and amortization, interest expense and stock-based compensation charges. Cash provided by working capital consisted of an increase of $0.8 million in accounts payable and accrued expenses, an increase in accrued capacity payments of $3.9 million, an increase in accrued payroll and related expenses of $3.6 million, an increase in other noncurrent liabilities of $0.8 million, an increase of deferred revenue of $0.9 million and a decrease in other noncurrent assets of $0.4 million. These amounts were partially offset by cash used for working capital and other activities, which reflected a $5.7 million increase in accounts receivable due to increased revenues and an increase in prepaid and other current assets of $1.6 million.
Cash Flows (Used in) Provided by Investing Activities
Cash used in investing activities was $29.2 million for the year ended December 31, 2009. Our principal cash investments during the year related to installation services used to build out and expand our demand response and energy management solutions and purchases of property and equipment. Cash provided by the sales of available-for-sale securities during this period was $2.0 million, and we had an increase in restricted cash and deposits resulting in a reduction of cash of $7.1 million primarily as a result of our cash deposits made in connection with demand response programs in which we participate. During the year ended December 31, 2009, we also incurred $16.9 million in capital expenditures primarily related to the purchase of office equipment and demand response equipment and other miscellaneous expenditures. Additionally, our cash investments included $0.7 million, $0.3 million and $6.6 million, respectively, related to the cash portion of the earn-out payment due in connection with our acquisition of SRC, cash used for our acquisition of eQ and cash used for our
64
acquisition of Cogent, net of $0.4 million of cash acquired in connection with our acquisition of Cogent.
Cash provided by investing activities was $6.9 million for the year ended December 31, 2008. For the year ended December 31, 2007, cash used in investing activities was $57.0 million. In 2008, our principal cash investments related to installation services used to build out and expand our demand response programs, purchases of property and equipment of $12.5 million, a cash earn-out payment in connection with our acquisition of MDE of $3.4 million, $3.8 million of cash used for our acquisition of SRC and $0.4 million of the deferred acquisition payment made to Pinpoint Power DR, LLC, or PPDR. For the year ended December 31, 2008, purchases of available-for-sale securities were approximately $13.6 million and sales of available-for-sale securities were $27.1 million. Also in 2008, we had a decrease of restricted cash and deposits of $13.4 million primarily as a result of our entering into the SVB credit facility.
In 2007, we made a payment of approximately $3.3 million and $1.9 million, respectively, in connection with our purchases of MDE and PPDR. For the year ended December 31, 2007, purchases of available-for-sale securities were approximately $35.4 million and sales of available-for-sale securities were $19.9 million. In addition, we incurred $19.9 million in capital expenditures for generating equipment, office equipment, leasehold improvements, and furniture and fixtures.
Cash Flows Provided by (Used in) Financing Activities
Cash provided by financing activities was $80.0 million for the year ended December 31, 2009. Cash used in financing activities was $1.1 million for the year ended December 31, 2008 and cash provided by financing activities was $125.2 million for the year ended December 31, 2007. Cash provided by (used in) financing activities consisted of the following:
Equity Financing Activities
In August 2009, we completed an underwritten public offering of an aggregate of 3,963,889 shares of our common stock at an offering price of $27.00 per share, which included the sale of 709,026 shares by certain selling stockholders. Net proceeds to us from the offering were approximately $83.4 million.
In November 2007, we completed an underwritten public offering of an aggregate of 2,500,000 shares of our common stock at an offering price of $43.00 per share. Of the 2,500,000 shares, we sold 500,000 shares and selling stockholders sold 2,000,000 shares. This offering resulted in net proceeds to us of approximately $19.4 million. In May 2007, we completed our IPO of 4,312,500 shares of common stock at an offering price of $26.00 per share, which included the exercise of the underwriters' over-allotment option to purchase 562,500 shares and the sale of 225,000 shares by certain of our stockholders. Net proceeds to us from our IPO were approximately $95.2 million.
In February 2007, we repurchased 104,392 shares of our common stock for $0.4 million.
In January 2007, we received $10.0 million related to proceeds from the issuance of our series C redeemable convertible preferred stock.
In addition, we received approximately $1.1 million, $0.5 million and $0.2 million, respectively, from exercises of options to purchase shares of our common stock during the years ended December 31, 2009, 2008 and 2007.
Credit Facility Borrowings
In August 2008, we and one of our subsidiaries entered into a $35.0 million secured revolving credit and term loan facility with SVB pursuant to a loan and security agreement, which was subsequently amended in May 2009. We refer to this as the SVB credit facility. Pursuant to the terms
65
of the SVB credit facility, SVB will, among other things, make revolving credit and term loan advances and issue letters of credit for our account. The SVB credit facility replaced our credit facility with BlueCrest. All unpaid principal and accrued interest is due and payable in full on August 5, 2010, which is the maturity date. Our obligations under the SVB credit facility are secured by all of our assets and the assets of our subsidiaries, excluding any intellectual property. The SVB credit facility contains customary terms and conditions for credit facilities of this type. In addition, we are required to meet certain financial covenants customary with this type of facility, including maintaining a minimum specified tangible net worth and a minimum modified quick ratio. The SVB credit facility contains customary events of default. If a default occurs and is not cured within any applicable cure period or is not waived, our obligations under the SVB credit facility may be accelerated. We were in compliance with all financial covenants under the SVB credit facility at December 31, 2009 and, as of that date, we had repaid the outstanding borrowings thereunder of $4.4 million. We continue to have an aggregate of $30.4 million in letters of credit issued for our account under the SVB credit facility. For additional information regarding the SVB credit facility, see Note 8 to our consolidated financial statements contained in Appendix A to this Annual Report on Form 10-K.
During the year ended December 31, 2009, we made scheduled payments on our outstanding debt and capital lease obligations of $4.5 million. During the year ended December 31, 2008, we made scheduled payments on our outstanding debt and capital lease obligations of $1.5 million and refinanced $4.4 million of our debt through borrowings of $4.4 million under the SVB credit facility. During the year ended December 31, 2007, we incurred an additional $2.5 million of debt obligations and made scheduled payments on our outstanding debt and capital lease obligations of $1.6 million.
Contingent Earn-Out Payments
In connection with our acquisition of Cogent, we agreed to make a single contingent earn-out payment equal to $1.5 million in cash, to be paid, if at all, based on the business achieving certain performance targets from the date of acquisition on December 4, 2009 through December 31, 2010. This earn-out payment, if any, will be payable upon the final measurement of the performance targets. We believe that it is remote that this earn-out payment will not be made. As of December 31, 2009, we have recorded approximately $1.5 million related to the contingent earn-out payment as additional purchase price as this represents the fair value of the payment as of December 31, 2009. Any changes to the fair value of this liability will be recorded within our consolidated statements of operations.
In connection with our acquisition of SRC, we incurred a contingent obligation to pay to the former holders of SRC membership interests an earn-out amount equal to 50% to 60% of the revenues of SRC's business during each twelve-month period from May 1, 2008 through April 30, 2010, which would be recognized as additional purchase price when earned. The earn-out payments are based on the achievement of certain minimum revenue-based milestones of SRC and are paid in a combination of cash and shares of our common stock. These additional earn-out payments, if any, are recorded as additional purchase price. The additional purchase price recorded in the second quarter of 2009, which was related to the May 1, 2008 to April 30, 2009 earn-out period, totaled approximately $1.5 million, of which $0.7 million was paid in cash during the second quarter of 2009 and the remainder of which was paid by the issuance of 44,776 shares of our common stock during the third quarter of 2009. The final earn-out payment, if any, related to the May 1, 2009 through April 30, 2010 earn-out period will be determined during the second quarter of 2010.
Capital Spending
We have made capital expenditures primarily for general corporate purposes to support our growth and for equipment installation related to our business. Our capital expenditures totaled $16.9 million in 2009, $12.5 million in 2008 and $19.9 million in 2007. As we continue to grow, we expect our capital expenditures for 2010 to increase as compared to 2009.
66
Contractual Obligations
Information regarding our significant contractual obligations of the types described below as of December 31, 2009 is set forth in the following table (dollars in thousands):
| |
Payments Due By Period | |||||||||||||||
|---|---|---|---|---|---|---|---|---|---|---|---|---|---|---|---|---|
Contractual Obligations
|
Total | Less than 1 Year |
1 - 3 Years | 3 - 5 Years | More than 5 Years |
|||||||||||
Debt obligations |
$ | — | $ | — | $ | — | $ | — | $ | — | ||||||
Capital lease obligations |
82 | 43 | 39 | — | — | |||||||||||
Operating lease obligations |
15,449 | 4,155 | 9,905 | 1,389 | — | |||||||||||
Total |
$ | 15,531 | $ | 4,198 | $ | 9,944 | $ | 1,389 | $ | — | ||||||
As of December 31, 2009, we no longer have debt obligations under the SVB credit facility as we repaid the outstanding borrowings of $4.4 million during the fourth quarter of 2009. However, we have $30.4 million of standby letters of credit outstanding under the SVB credit facility in connection with financial assurance requirements under certain demand response programs in which we participate. We are not aware of any events of default under the SVB credit facility.
Our capital lease obligation consists of a telephone system we lease for which we have a bargain purchase option at the end of the five-year term.
Our operating lease obligations relate primarily to the lease of our corporate headquarters in Boston, Massachusetts and our offices in New York, New York, San Francisco and Concord, California, Baltimore, Maryland and Dallas, Texas, as well as certain property and equipment.
As part of our acquisition of SRC, we may be obligated to pay the former holders of SRC membership interests an earn-out amount equal to 50% to 60% of the revenues of SRC's business during each twelve-month period from May 1, 2008 through April 30, 2010. The earn-out payments, if any, will be based on the achievement of certain minimum revenue-based milestones of SRC and will be paid in a combination of cash and shares of our common stock.
As part of our acquisition of Cogent, we may be obligated to pay the former holders of Cogent an earn-out amount equal to $1.5 million. The earn-out payment, if any, will be based on the achievement of a certain minimum revenue-based milestone and a certain earnings-based milestone of Cogent for the year ended December 31, 2010 and will be paid in cash. Both of these milestones need to be achieved in order for the earn-out payment to occur and there will be no partial payment if the milestones are not fully achieved.
In May 2009, because we had no additional credit available under the SVB credit facility, we entered into a credit arrangement with a third-party in connection with bidding capacity into a certain open market bidding program. The arrangement included an up-front payment of $2.0 million, and we will be required to pay the third party an additional contingent fee, up to a maximum of $3.0 million, based on the revenue that we expect to earn and recognize in 2012 in connection with the bid.
Off-Balance Sheet Arrangements
As of December 31, 2009, we did not have any off-balance sheet arrangements, as defined in Item 303(a)(4)(ii) of Regulation S-K, that have or are reasonably likely to have a current or future effect on our financial condition, changes in our financial condition, revenues or expenses, results of operations, liquidity, capital expenditures or capital resources that is material to investors. We have issued letters of credit in the ordinary course of our business in order to participate in certain demand response programs. As of December 31, 2009, we had outstanding letters of credit totaling
67
$30.4 million. For information on these commitments and contingent obligations, see Note 13 to our consolidated financial statements contained in Appendix A to this Annual Report on Form 10-K.
Critical Accounting Policies and Use of Estimates
The discussion and analysis of our financial condition and results of operations are based upon our consolidated financial statements, which have been prepared in accordance with GAAP. The preparation of these consolidated financial statements requires us to make estimates and judgments that affect the reported amounts of assets, liabilities, revenues and expenses, and related disclosure of contingent assets and liabilities. On an on-going basis, we evaluate our estimates, including those related to revenue recognition for multiple element arrangements, allowance for doubtful accounts, valuations and purchase price allocations related to business combinations, expected future cash flows including growth rates, discount rates, terminal values and other assumptions and estimates used to evaluate the recoverability of long-lived assets and goodwill, estimated fair values of intangible assets and goodwill, amortization methods and periods, certain accrued expenses and other related charges, stock-based compensation, contingent liabilities, tax reserves and recoverability of our net deferred tax assets and related valuation allowance. We base our estimates on historical experience and various other assumptions that are believed to be reasonable under the circumstances. Actual results could differ from these estimates if past experience or other assumptions do not turn out to be substantially accurate. Any differences may have a material impact on our financial condition and results of operations.
We believe that of our significant accounting policies, which are described in Note 1 to our consolidated financial statements contained in Appendix A to this Annual Report on Form 10-K, the following accounting policies involve a greater degree of judgment and complexity. Accordingly, these are the policies we believe are the most critical to aid in fully understanding and evaluating our financial condition and results of operations.
Revenue Recognition
We recognize revenues in accordance with ASC 605, Revenue Recognition (formerly Staff Accounting Bulletin No. 104, Revenue Recognition in Financial Statements, and Emerging Issues Task Force, or EITF, Issue No. 00-21, Accounting for Revenue Arrangements with Multiple Deliverables). In all of our arrangements, we do not recognize any revenues until we can determine that persuasive evidence of an arrangement exists, delivery has occurred, the fee is fixed or determinable, and we deem collection to be reasonably assured. In making these judgments, we evaluate these criteria as follows:
- •
- Evidence of an
arrangement. We consider a definitive agreement signed by the customer and us or an arrangement enforceable under the rules of an open
market bidding program to be representative of persuasive evidence of an arrangement.
- •
- Delivery has
occurred. We consider delivery to have occurred when service has been delivered to the customer and no post-delivery
obligations exist. In instances where customer acceptance is required, delivery is deemed to have occurred when customer acceptance has been achieved.
- •
- Fees are fixed or
determinable. We consider the fee to be fixed or determinable unless the fee is subject to refund or adjustment or is not payable within
normal payment terms. If the fee is subject to refund or adjustment and we cannot reliably estimate this amount, we recognize revenues when the right to a refund or adjustment lapses. If offered
payment terms exceed our normal terms, we recognize revenues as the amounts become due and payable or upon the receipt of cash.
- •
- Collection is reasonably assured. We conduct a credit review at the inception of an arrangement to determine the creditworthiness of the customer. Collection is reasonably assured if, based
68
upon our evaluation, we expect that the customer will be able to pay amounts under the arrangement as payments become due. If we determine that collection is not reasonably assured, revenues are deferred and recognized upon the receipt of cash.
We enter into agreements and open market bidding programs to provide demand response solutions. Demand response revenues are earned based on our ability to deliver committed capacity. Energy event revenue, which reflects additional payments made to us for the amount of energy usage actually curtailed from the grid, is contingent revenue earned based upon the actual amount of energy provided during the demand response event.
We recognize demand response revenue when we have provided verification to the grid operator or utility of our ability to deliver the committed capacity which entitles us to payments under the contract or open market program. Committed capacity is generally verified through the results of an actual demand response event or a measurement and verification test. Once the capacity amount has been verified, the revenue is recognized and future revenue becomes fixed or determinable and is recognized monthly until the next demand response event or test. In subsequent verification events, if our verified capacity is below the previously verified amount, the grid operator or utility customer will reduce future payments based on the adjusted verified capacity amounts. Ongoing demand response revenue recognized between demand response events or tests that are not subject to penalty or customer refund are recognized in revenue. If the revenue is subject to refund and the amount of refund cannot be reliably estimated, the revenue is deferred until the right of refund lapses.
Certain of the forward capacity programs in which we participate may be deemed derivative contracts under ASC 815, Derivatives and Hedging (formerly SFAS No. 133, Accounting for Derivative and Hedging Activities). In such situations, we believe we meet the scope exception under ASC 815 as a normal purchase, normal sale as that term is defined in ASC and, accordingly, the arrangement is not treated as a derivative contract.
Revenue from energy events is recognized when earned. Energy event revenue is deemed to be substantive and represents the culmination of a separate earnings process and is recognized when the energy event is initiated by the grid operator or utility customer.
As described above, grid operator or utility customer contracts or open market programs may include performance guarantees. If we are unable to reliably estimate our ability to meet these guarantees, we do not recognize any revenue prior to the successful completion of the performance requirement.
Allowance for Doubtful Accounts
We maintain allowances for doubtful accounts for estimated losses resulting from the inability of our customers to make required payments. We regularly evaluate the collectibility of our trade receivables based on a combination of factors, including a dialogue with the customer to determine the cause of non-payment, and evaluation of the customer's current financial situation. In the event it is determined that the customer may not be able to meet its full obligation to us, we record a specific allowance to reduce the receivable to the amount that we expect to recover given all information present. Provisions for allowance for doubtful accounts are recorded in general and administrative expense. We perform ongoing credit evaluations of our customers and adjust credit limits based upon payment history and our assessment of the customer's current creditworthiness. We continuously monitor collections from our customers and maintain a provision for estimated credit losses based upon our historical experience and any specific customer collection issues that we have identified. While such credit losses have not been significant to date and have historically been within our expectations and the provisions established, we cannot guarantee that we will continue to experience the same credit loss rates in the future. If the financial condition of our customers were to deteriorate, for example as a result of the recent financial and economic turmoil or otherwise, resulting in an impairment of their
69
ability to make payments, additional allowances may be required. As of December 31, 2009, the allowance for doubtful accounts was $57,000.
Business Combinations
We record tangible and intangible assets acquired and liabilities assumed in business combinations under the purchase method of accounting. Amounts paid for each acquisition are allocated to the assets acquired and liabilities assumed based on their fair values at the dates of acquisition. The fair value of identifiable intangible assets is based on detailed valuations that use information and assumptions provided by management. We estimate the fair value of contingent consideration at the time of the acquisition using all pertinent information known to us at the time to assess the probability of payment of contingent amounts. We allocate any excess purchase price over the fair value of the net tangible and intangible assets acquired and liabilities assumed to goodwill.
We use the income approach to determine the estimated fair value of identifiable intangible assets, including customer contracts, customer relationships, non-compete agreements and trade names. This approach determines fair value by estimating the after-tax cash flows attributable to an in-process project over its useful life and then discounting these after-tax cash flows back to a present value. We base our revenue assumptions on estimates of relevant market sizes, expected market growth rates and expected trends, including introductions by competitors of new services and products. We base the discount rate used to arrive at a present value as of the date of acquisition on the time value of money and market participant investment risk factors. The use of different assumptions could materially impact the purchase price allocation and our financial condition and results of operations.
Customer contracts represent contractual arrangements to provide ongoing services. Customer relationships represent established relationships with customers, which provide a ready channel for the sale of additional products and services. Non-compete agreements represent arrangements with certain employees that limit or prevent their ability to take employment at a competitor for a fixed period of time. Tradenames represent acquired product names that we intend to continue to utilize.
Impairment of Intangible Assets and Goodwill
Intangible Assets
We amortize our intangible assets that have finite lives using either the straight-line method or, if reliably determinable, based on the pattern in which the economic benefit of the asset is expected to be consumed utilizing expected undiscounted future cash flows. Amortization is recorded over the estimated useful lives ranging from one to ten years. We review our intangible assets subject to amortization to determine if any adverse conditions exist or a change in circumstances has occurred that would indicate impairment or a change in the remaining useful life. If the carrying value of an asset exceeds its undiscounted cash flows, we will write-down the carrying value of the intangible asset to its fair value in the period identified. In assessing recoverability, we must make assumptions regarding estimated future cash flows and discount rates. If these estimates or related assumptions change in the future, we may be required to record impairment charges. We generally calculate fair value as the present value of estimated future cash flows to be generated by the asset using a risk-adjusted discount rate. If the estimate of an intangible asset's remaining useful life is changed, we will amortize the remaining carrying value of the intangible asset prospectively over the revised remaining useful life. During the year ended December 31, 2009, as a result of a change in the expected period of economic benefit of the trade name acquired in the acquisition of Cogent, we determined that an impairment indicator existed. Based on the analysis performed, we determined that this trade name was partially impaired and recorded an impairment charge of $135,000 during the year ended December 31, 2009, which is included in general and administrative expenses in the accompanying consolidated statements of operations. The fair market value of approximately $65,000
70
was determined using Level 3 inputs, as defined by ASC 820, Fair Value Measurements and Disclosures (formerly SFAS No. 157, Fair Value Measurement), based on the projected future cash flows over the revised period of economic benefit discounted based on our weighted average cost of capital of 17%.
Goodwill
In accordance with ASC 350, Intangibles—Goodwill and Other (formerly FASB SFAS No. 142, Goodwill and Other Intangible Assets), we test goodwill at the reporting unit level for impairment on an annual basis and between annual tests if events and circumstances indicate it is more likely than not that the fair value of a reporting unit is less than its carrying value. We have determined that the reporting unit level is the entity level as discrete financial information is not available at a lower level and our chief operating decision maker, which is our chief executive officer and executive management team, collectively, make business decisions based on the evaluation of financial information at the entity level. Events that would indicate impairment and trigger an interim impairment assessment include, but are not limited to, current economic and market conditions, including a decline in market capitalization, a significant adverse change in legal factors, business climate or operational performance of the business, and an adverse action or assessment by a regulator. Our annual impairment test date is November 30.
In performing the test, we utilize the two-step approach prescribed under ASC 350. The first step requires a comparison of the carrying value of the reporting units, as defined, to the fair value of these units. We consider a number of factors to determine the fair value of a reporting unit, including an independent valuation to conduct this test. The valuation is based upon expected future discounted operating cash flows of the reporting unit as well as analysis of recent sales or offerings of similar companies. We base the discount rate used to arrive at a present value as the date of the impairment test on our weighted average cost of capital. If the carrying value of its reporting unit exceeds its fair value, we will perform the second step of the goodwill impairment test to measure the amount of impairment loss, if any. The second step of the goodwill impairment test compares the implied fair value of a reporting unit's goodwill to its carrying value.
We conducted our annual impairment test as of November 30, 2009. In order to complete the annual impairment test, we performed detailed analyses estimating the fair value of our reporting unit utilizing our fiscal 2010 forecast with updated long-term growth assumptions.
As a result of completing the first step, the fair value exceeded the carrying value, and as such the second step of the impairment test was not required. To date, we have not been required to perform the second step of the impairment test.
The fair value of the entity is determined by use of a market approach based on the quoted market price of our common stock and the number of shares outstanding and a discounted cash flow analysis, or the DCF, under the income approach. The key assumptions that drive the fair value in the DCF model are the discount rates (i.e., weighted average cost of capital, or WACC), terminal values, growth rates, and the amount and timing of expected future cash flows. If the current worldwide financial markets and economic environment were to deteriorate, this would likely result in a higher WACC because market participants would require a higher rate of return. In the DCF, as the WACC increases, the fair value decreases. The other significant factor in the DCF is our projected financial information (i.e., amount and timing of expected future cash flows and growth rates) and if our assumptions were to be adversely impacted, this could result in a reduction of the fair value of the entity. We believe that we are not at risk of failing the first step of the goodwill impairment test.
The estimate of fair value requires significant judgment. Any loss resulting from an impairment test would be reflected in operating loss in our consolidated statements of operations. The annual impairment testing process is subjective and requires judgment at many points throughout the analysis.
71
If these estimates or their related assumptions change in the future, we may be required to record impairment charges for these assets not previously recorded.
Impairment of Property and Equipment
We review property and equipment for impairment whenever events or changes in circumstances indicate that the carrying amount of assets may not be recoverable. If these assets are considered to be impaired, the impairment is recognized in earnings and equals the amount by which the carrying value of the assets exceeds their fair market value determined by either a quoted market price, if any, or a value determined by utilizing a discounted cash flow technique. If these assets are not impaired, but their useful lives have decreased, the remaining net book value is amortized over the revised useful life. For the year ended December 31, 2009, the carrying value of a portion of our demand response and generation equipment exceeded the undiscounted future cash flows based upon their anticipated retirement dates. As a result, we recognized an impairment charge of $1.2 million representing the difference between the carrying value and fair market value of demand response equipment and generation equipment, which is included in cost of revenues in the accompanying consolidated statements of operations. The fair market value of approximately $0.2 million was determined utilizing Level 3 inputs, as defined by ASC 820, based on the projected future cash flows discounted using the estimated market participant rate of return for this type of asset. We recognized an impairment charge of $0.7 million and $0.0 million for the years ended December 31, 2008 and 2007, respectively, which is included in cost of revenues in the accompanying consolidated statements of operations. As of December 31, 2009, approximately $3.7 million of our generation equipment is enrolled in open market demand response programs. The recoverability of this generation equipments' carrying value is largely dependent on the rates that we are compensated for our committed capacity within these programs. These rates represent market rates and can fluctuate based on the supply and demand of capacity. Although, these market rates are established up to three years in advance of the service delivery, these market rates have not yet been established for the entire remaining useful life of this generation equipment. In performing its impairment analysis, we estimate the expected future market rates based on current existing market rates and trends. A decline in the expected future market rates of greater than 10% could result in an impairment charge related to this generation equipment.
Software Development Costs
We capitalize eligible costs associated with software developed or obtained for internal use. We capitalize the payroll and payroll-related costs of employees who devote time to the development of internal-use computer software. We amortize these costs on a straight-line basis over the estimated useful life of the software, which is generally two to three years. Our judgment is required in determining the point at which various projects enter the stages at which costs may be capitalized, in assessing the ongoing value and impairment of the capitalized costs, and in determining the estimated useful lives over which the costs are amortized. Software development costs of $2.1 million, $1.3 million and $0.7 million for the years ended December 31, 2009, 2008 and 2007, respectively, have been capitalized.
Stock-Based Compensation
Effective as of January 1, 2006, we adopted the requirements of ASC 718. As such, all share-based payments to employees, including grants of stock options, restricted stock and restricted stock units, are recognized in the statement of operations based on their fair values as of the date of grant. We adopted ASC 718 using the "modified prospective" transition method, in which compensation cost is recognized beginning with the effective date (a) based on the requirements of ASC 718 for all share-based payments granted after the effective date and (b) based on the requirements of ASC 718 for all awards granted to employees prior to the effective date of ASC 718 that remain unvested on the
72
effective date. As a result, we are recognizing compensation for the fair value of the unvested portion of option grants issued prior to the adoption of ASC 718, whose fair value was calculated utilizing a Black-Scholes option pricing model. In accordance with the modified-prospective transition method of ASC 718, results for prior periods have not been restated. For stock options granted prior to January 1, 2009, the fair value for these options was estimated at the date of grant using a Black-Scholes option-pricing model, and for stock options granted on or after January 1, 2009, the fair value of each award is and has been estimated on the date of grant using a trinomial valuation model. If we had continued using the Black-Scholes option pricing model in 2009, stock-based compensation expense would not have been materially different for the year ended December 31, 2009.
As there was no public market for our common stock prior to the effective date of our IPO, we determined the volatility for options granted in 2009, 2008 and 2007 based on an analysis of reported data for a peer group of companies that issued options with substantially similar terms. The expected volatility of options granted has been determined using an average of the historical volatility measures of this peer group, as well as the historical volatility of our common stock beginning January 1, 2008. The expected volatility for options granted during 2009 was 86%. The risk-free interest rate is based on a treasury instrument whose term is consistent with the expected life of the stock options. For 2009, the weighted-average risk free interest rate used was 3.2%. We have not paid and do not anticipate paying cash dividends on our shares of common stock and are contractually precluded from doing so under the SVB credit facility; therefore, the expected dividend yield is assumed to be zero.
The amount of stock-based compensation expense recognized during a period is based on the value of the portion of the awards that are ultimately expected to vest. ASC 718 requires forfeitures to be estimated at the time of grant and revised, if necessary, in subsequent periods if actual forfeitures differ from those estimates. The term "forfeitures" is distinct from "cancellations" or "expirations" and represents only the unvested portion of the surrendered option. We have determined a forfeiture rate of 4.88% as of December 31, 2009. Ultimately, the actual expense recognized over the vesting period will only be for those awards that vest.
For the years ended December 31, 2009, 2008 and 2007, we recorded expenses of approximately $13.1 million, $10.4 million and $7.6 million, respectively, in connection with share-based payment awards to employees and non-employees. With respect to grants through December 31, 2009, a future expense of non-vested options of approximately $16.5 million is expected to be recognized over a weighted average period of 2.2 years and a future expense of restricted stock and restricted stock units of approximately $4.9 million is expected to be recognized over a weighted average period of 2.4 years.
For awards with graded vesting, we allocate compensation costs on a straight-line basis over the requisite service period. Accordingly, we amortized the fair value of each option over each option's service period, which is generally the vesting period.
Our accounting for stock options issued to non-employees requires valuing and remeasuring such stock options to the current fair value until the performance date has been reached.
Accounting for Income Taxes
We use the asset and liability method for accounting for income taxes. Under this method, we determine deferred tax assets and liabilities based on the difference between financial reporting and taxes bases of our assets and liabilities. We measure deferred tax assets and liabilities using enacted tax rates and laws that will be in effect when we expect the differences to reverse.
We have incurred consolidated net losses since our inception and as a result, we have not recognized net United States deferred taxes as of December 31, 2009 or December 31, 2008. Our deferred tax liabilities primarily relate to deferred taxes associated with our acquisitions and property and equipment. Our deferred tax assets relate primarily to net operating loss carryforwards, accruals
73
and reserves, and stock-based compensation. We record a valuation allowance to reduce our deferred tax assets to the amount that is more likely than not to be realized. While we have considered future taxable income and ongoing prudent and feasible tax planning strategies in assessing the need for the valuation allowance, in the event we were to determine that we would be able to realize our deferred tax assets in the future in excess of the net recorded amount, an adjustment to the deferred tax asset would increase income in the period such determination was made.
In accordance with ASC 740, Income Taxes, we are required to evaluate uncertainty in income taxes recognized in our financial statements (formerly FASB Interpretation No. 48, or FIN 48, Accounting for Uncertainty in Income Taxes—an interpretation of FASB Statement No. 109). ASC 740 prescribes a recognition threshold and measurement criteria for the financial statement recognition and measurement of a tax position taken or expected to be taken in a tax return. ASC 740 also provides guidance on derecognition, classification, interest and penalties, accounting in interim periods, disclosure, and transition and defines the criteria that must be met for the benefits of a tax position to be recognized.
We had no gross unrecognized tax benefits as of December 31, 2009 and 2008.
In the ordinary course of global business, there are many transactions and calculations where the ultimate tax outcome is uncertain. Judgment is required in determining our worldwide income tax provision. In our opinion, it is not required that we have a provision for income taxes for any years subject to audit. Although we believe our estimates are reasonable, no assurance can be given that the final tax outcome of matters will not be different than that which is reflected in our historical income tax provisions and accruals. In the event our assumptions are incorrect, the differences could have a material impact on our income tax provision and operating results in the period in which such determination is made.
Recent Accounting Pronouncements
In September 2009, the FASB ratified ASC Update No. 2009-13, Multiple-Deliverable Revenue Arrangements, or ASU 2009-13. ASU 2009-13 amends existing revenue recognition accounting pronouncements that are currently within the scope of ASC Subtopic 605-25 (previously included within EITF Issue No. 00-21, Revenue Arrangements with Multiple Deliverables, or EITF 00-21). This consensus provides for two significant changes to the existing multiple element revenue recognition guidance. First, this guidance deletes the requirement to have objective and reliable evidence of fair value for undelivered elements in an arrangement and will result in more deliverables being treated as separate units of accounting. The second change modifies the manner in which the transaction consideration is allocated across the separately identified deliverables. These changes may result in entities recognizing more revenue up-front, and entities will no longer be able to apply the residual method and defer the fair value of undelivered elements. Upon adoption of these new rules, each separate unit of accounting must have a selling price, which can be based on management's estimate when there is no other means to determine the fair value of that undelivered item, and the arrangement consideration is allocated based on the elements' relative selling price. This accounting guidance is effective no later than fiscal years beginning on or after June 15, 2010 but may be adopted early as of the first quarter of an entity's fiscal year. Entities may elect to adopt this accounting guidance either through prospective application to all revenue arrangements entered into or materially modified after the date of adoption or through a retrospective application to all revenue arrangements for all periods presented in the financial statements. We are currently evaluating the impact of this revised accounting guidance, including the period in which we will adopt this guidance.
In April 2009, the FASB issued FASB Staff Positions, or FSP, FAS 115-2 and FAS 124-2, Recognition and Presentation of Other-Than-Temporary Impairment, or FSP 115-2/124-2 (codified within ASC 320, Investments—Debt and Equity Securities). FSP 115-2/124-2 amends the requirements for the
74
recognition and measurement of other-than-temporary impairments for debt securities by modifying the pre-existing "intent and ability" indicator. Under this FSP, an other-than-temporary impairment is triggered when there is an intent to sell the security, it is more likely than not that the security will be required to be sold before recovery, or the security is not expected to recover the entire amortized cost basis of the security. Additionally, this FSP changes the presentation of an other-than-temporary impairment in the income statement for those impairments involving credit losses. The credit loss component will be recognized in earnings and the remainder of the impairment will be recorded in other comprehensive income. FSP 115-2/124-2 was effective for us beginning with the second quarter of fiscal 2009. The adoption of this FSP did not have a significant impact on our consolidated financial statements.
In December 2007, the FASB issued ASC 805, Business Combinations (formerly SFAS No. 141 (Revised 2007), Business Combinations, or SFAS 141(R). SFAS 141(R) retains the fundamental requirements in SFAS 141 that the acquisition method of accounting, which SFAS 141 referred to as the purchase method, be used for all business combinations and for an acquirer to be identified for each business combination. ASC 805 requires an acquirer to recognize the assets acquired, the liabilities assumed, and any non-controlling interest in the acquiree at the acquisition date, measured at their fair values as of that date, with limited exceptions specified in SFAS 141(R). ASC 805 replaces SFAS 141's cost-allocation process, which required the cost of an acquisition to be allocated to the individual assets acquired and liabilities assumed based on their estimated fair values. SFAS 141(R) retains the guidance in SFAS 141 for identifying and recognizing intangible assets separately from goodwill. ASC 805 will now require acquisition costs to be expensed as incurred, and changes in deferred tax asset valuation allowances and income tax uncertainties after the acquisition date generally to affect income tax expense. ASC 805 applies prospectively to business combinations for which the acquisition date is on or after the beginning of the first annual reporting period beginning on or after December 15, 2008, which was our 2009 fiscal year. Early adoption is prohibited. The adoption of this standard did not have a significant impact on our consolidated financial statements.
In April 2008, the FASB issued FASB FSP No. 142-3, Determination of the Useful Life of Intangible Assets (codified within ASC 350, Intangibles—Goodwill and Other), which amends the factors that must be considered in developing renewal or extension assumptions used to determine the useful life over which to amortize the cost of a recognized intangible asset under ASC 350. The objective of this FSP is to improve the consistency between the useful life of a recognized intangible asset under ASC 350 and the period of expected cash flows used to measure the fair value of the asset under ASC 805. The FSP is effective for financial statements for fiscal years beginning after December 15, 2008, which was the beginning of fiscal 2009 for us. The adoption of this standard did not have a significant impact on our consolidated financial statements.
In June 2009, the FASB issued SFAS No. 168, The FASB Accounting Standards Codification and the Hierarchy of Generally Accepted Accounting Principles (codified within ASC 105, Generally Accepted Accounting Principles), which establishes the FASB ASC as the single source of authoritative accounting principles generally accepted in the United States. We refer to this as the codification. The codification will supersede all existing non-SEC accounting and reporting standards. As a result, upon adoption, all references to accounting literature in our SEC filings will conform to the appropriate reference within the codification. The adoption of the codification did not have any impact on our financial condition or results of operations.
In May 2009, ASC 855, Subsequent Events (formerly SFAS No. 165, Subsequent Events), was issued and was amended in February 2010. ASC 855 does not require significant changes regarding recognition or disclosure of subsequent events. ASC 855 is effective for financial statements issued after June 15, 2009. The implementation of ASC 855 did not have a significant impact on our financial statements. Subsequent events have been evaluated for disclosure and recognition.
75
Selected Quarterly Financial Data (Unaudited)
The table below sets forth selected unaudited quarterly financial information. The information is derived from our unaudited consolidated financial statements and includes, in the opinion of management, all normal and recurring adjustments that management considers necessary for a fair statement of results for such periods. The operating results for any quarter are not necessarily indicative of results for any future period.
Year Ended December 31, 2009
|
1st Qtr | 2nd Qtr | 3rd Qtr | 4th Qtr | ||||||||||
|---|---|---|---|---|---|---|---|---|---|---|---|---|---|---|
| |
(In thousands, except per share data) |
|||||||||||||
Revenues |
$ | 18,423 | $ | 42,402 | $ | 103,117 | $ | 26,733 | ||||||
Gross profit |
7,898 | 18,135 | 51,677 | 8,750 | ||||||||||
Operating expenses |
19,906 | 22,483 | 25,868 | 23,253 | ||||||||||
(Loss) Income from operations |
(12,008 | ) | (4,348 | ) | 25,809 | (14,503 | ) | |||||||
Net (loss) income |
(12,534 | ) | (5,729 | ) | 26,637 | (15,203 | ) | |||||||
Basic net (loss) income per share: |
$ | (0.63 | ) | $ | (0.29 | ) | $ | 1.21 | $ | (0.64 | ) | |||
Diluted net (loss) income per share: |
$ | (0.63 | ) | $ | (0.29 | ) | $ | 1.12 | $ | (0.64 | ) | |||
Year Ended December 31, 2008
|
1st Qtr | 2nd Qtr | 3rd Qtr | 4th Qtr | ||||||||||
|---|---|---|---|---|---|---|---|---|---|---|---|---|---|---|
| |
(In thousands, except per share data) |
|||||||||||||
Revenues |
$ | 18,612 | $ | 23,686 | $ | 44,152 | $ | 19,665 | ||||||
Gross profit |
6,471 | 8,871 | 18,360 | 7,594 | ||||||||||
Operating expenses |
18,168 | 19,492 | 21,133 | 19,701 | ||||||||||
Loss from operations |
(11,697 | ) | (10,621 | ) | (2,773 | ) | (12,107 | ) | ||||||
Net loss |
(11,000 | ) | (10,436 | ) | (3,060 | ) | (12,166 | ) | ||||||
Basic and diluted net loss per share: |
$ | (0.57 | ) | $ | (0.54 | ) | $ | (0.16 | ) | $ | (0.61 | ) | ||
Item 7A. Quantitative and Qualitative Disclosure About Market Risk
Financial Instruments, Other Financial Instruments, and Derivative Commodity Instruments
ASC 825, Financial Instruments (formerly SFAS No. 107, Disclosure of Fair Value of Financial Instruments), requires disclosure about fair value of financial instruments. Financial instruments principally consist of cash equivalents, marketable securities, accounts receivable, and debt obligations. The fair value of these financial instruments approximates their carrying amount.
Foreign Exchange Risk
We face minimal exposure to adverse movements in foreign currency exchange rates.
Interest Rate Risk
As of December 31, 2009, we had no outstanding debt under the SVB credit facility. This is a result of repaying our outstanding borrowings of approximately $4.4 million under the SVB credit facility during the fourth quarter of 2009.
The recent market events have not required us to materially modify or change our financial risk management strategies with respect to our exposure to interest rate risk.
We manage our cash and cash equivalents portfolio considering investment opportunities and risks, tax consequences and overall financing strategies. Our investment portfolio consists primarily of cash and cash equivalents, money market funds, and commercial paper. We have, in the past, held municipal auction rate securities that have since been redeemed. As our investments are made with highly rated securities, we are not anticipating any significant impact in the short term from a change in interest rates.
76
Item 8. Financial Statements and Supplementary Data
All financial statements and schedules required to be filed hereunder are included as Appendix A hereto and incorporated into this Annual Report on Form 10-K by reference.
Item 9. Changes in and Disagreements With Accountants on Accounting and Financial Disclosure
Not applicable.
Item 9A. Controls and Procedures
Disclosure Controls and Procedures.
Our principal executive officer and principal financial officer, after evaluating the effectiveness of our disclosure controls and procedures (as defined in Exchange Act Rules 13a-15(e) and 15d-15(e)) as of the end of the period covered by this Annual Report on Form 10-K, have concluded that, based on such evaluation, our disclosure controls and procedures were effective to ensure that information required to be disclosed by us in the reports that we file or submit under the Exchange Act is recorded, processed, summarized and reported, within the time periods specified in the SEC's rules and forms, and is accumulated and communicated to our management, including our principal executive and principal financial officers, or persons performing similar functions, as appropriate to allow timely decisions regarding required disclosure.
Management's Annual Report on Internal Control Over Financial Reporting
Our management is responsible for establishing and maintaining adequate internal control over financial reporting. Internal control over financial reporting is defined in Rule 13a-15(f) and 15d-15(f) under the Exchange Act as a process designed by, or under the supervision of, our principal executive and principal financial officers and effected by our board of directors, management and other personnel, to provide reasonable assurance regarding the reliability of financial reporting and the preparation of financial statements for external purposes in accordance with generally accepted accounting principles, and includes those policies and procedures that:
- •
- pertain to the maintenance of records that in reasonable detail accurately and fairly reflect the transactions and
dispositions of our assets;
- •
- provide reasonable assurance that transactions are recorded as necessary to permit preparation of financial statements in
accordance with generally accepted accounting principles, and that our receipts and expenditures are being made only in accordance with authorization of our management and directors: and
- •
- provide reasonable assurance regarding prevention or timely detection of unauthorized acquisition, use or disposition of our assets that could have a material effect on the financial statements.
Because of its inherent limitations, internal control over financial reporting may not prevent or detect misstatements. Projections of any evaluation of effectiveness to future periods are subject to the risk that controls may become inadequate because of changes in conditions, or that the degree of compliance with the policies and procedures may deteriorate.
Our management assessed the effectiveness of our internal control over financial reporting as of December 31, 2009. In making this assessment, management used the criteria set forth by the Internal Control—Integrated Framework issued by the Committee of Sponsoring Organizations of the Treadway Commission (the COSO criteria).
77
Our assessment of and conclusion regarding the effectiveness of our internal control over financial reporting did not include the internal controls of Cogent, a business we acquired on December 4, 2009. Cogent's results of operations are included in our consolidated financial statements from the date of acquisition through December 31, 2009 and constituted approximately $11.5 million and $9.7 million of total and net assets, respectively, as of December 31, 2009, and approximately $0.3 million and $0.2 million of revenues and net income, respectively, for the year ended December 31, 2009.
Based on this assessment, management believes that, as of December 31, 2009, our internal control over financial reporting was effective at a reasonable assurance level based on these criteria.
Ernst & Young LLP, the independent registered public accounting firm that audited our consolidated financial statements included elsewhere in this Annual Report on Form 10-K, has issued an attestation report on our internal control over financial reporting. That report appears in this Item 9A under the heading "Report of Independent Registered Public Accounting Firm."
Changes in Internal Control Over Financial Reporting
No change in our internal control over financial reporting (as defined in Rules 13a-15(f) and 15d-15(f) under the Exchange Act) occurred during the fiscal quarter ended December 31, 2009 that has materially affected, or is reasonably likely to materially affect, our internal control over financial reporting.
78
REPORT OF INDEPENDENT REGISTERED PUBLIC ACCOUNTING FIRM
The Board of Directors and Stockholders of EnerNOC, Inc.
We have audited EnerNOC, Inc.'s internal control over financial reporting as of December 31, 2009, based on criteria established in Internal Control—Integrated Framework issued by the Committee of Sponsoring Organizations of the Treadway Commission (the COSO criteria). EnerNOC, Inc.'s management is responsible for maintaining effective internal control over financial reporting, and for its assessment of the effectiveness of internal control over financial reporting included in the accompanying Management's Annual Report on Internal Control Over Financial Reporting. Our responsibility is to express an opinion on the Company's internal control over financial reporting based on our audit.
We conducted our audit in accordance with the standards of the Public Company Accounting Oversight Board (United States). Those standards require that we plan and perform the audit to obtain reasonable assurance about whether effective internal control over financial reporting was maintained in all material respects. Our audit included obtaining an understanding of internal control over financial reporting, assessing the risk that a material weakness exists, testing and evaluating the design and operating effectiveness of internal control based on the assessed risk, and performing such other procedures as we considered necessary in the circumstances. We believe that our audit provides a reasonable basis for our opinion.
A company's internal control over financial reporting is a process designed to provide reasonable assurance regarding the reliability of financial reporting and the preparation of financial statements for external purposes in accordance with generally accepted accounting principles. A company's internal control over financial reporting includes those policies and procedures that (1) pertain to the maintenance of records that, in reasonable detail, accurately and fairly reflect the transactions and dispositions of the assets of the company; (2) provide reasonable assurance that transactions are recorded as necessary to permit preparation of financial statements in accordance with generally accepted accounting principles, and that receipts and expenditures of the company are being made only in accordance with authorizations of management and directors of the company; and (3) provide reasonable assurance regarding prevention or timely detection of unauthorized acquisition, use, or disposition of the company's assets that could have a material effect on the financial statements.
Because of its inherent limitations, internal control over financial reporting may not prevent or detect misstatements. Also, projections of any evaluation of effectiveness to future periods are subject to the risk that controls may become inadequate because of changes in conditions, or that the degree of compliance with the policies or procedures may deteriorate.
As indicated in the accompanying Management's Annual Report on Internal Control Over Financial Reporting, management's assessment of and conclusion on the effectiveness of internal control over financial reporting did not include the internal controls of Cogent, Inc., which is included in the 2009 consolidated financial statements of EnerNOC, Inc. and constituted $11.5 million and $9.7 million of total and net assets, respectively, as of December 31, 2009 and $0.3 million and $0.2 million of revenues and net income, respectively, for the year then ended. Our audit of internal control over financial reporting of EnerNOC, Inc. also did not include an evaluation of the internal control over financial reporting of Cogent, Inc.
In our opinion, EnerNOC, Inc. maintained, in all material respects, effective internal control over financial reporting as of December 31, 2009, based on the COSO criteria.
79
We also have audited, in accordance with the standards of the Public Company Accounting Oversight Board (United States), the consolidated balance sheets of EnerNOC, Inc. as of December 31, 2009 and 2008, and the related consolidated statements of operations, changes in stockholders' (deficit) equity and comprehensive loss, and cash flows for each of the three years in the period ended December 31, 2009 of EnerNOC, Inc. and our report dated March 12, 2010 expressed an unqualified opinion thereon.
| /s/ Ernst & Young LLP | ||
Boston, Massachusetts March 12, 2010 |
80
Not applicable.
Item 10. Directors, Executive Officers and Corporate Governance
The information required by this Item will be contained in our definitive proxy statement for our 2010 Annual Meeting of Stockholders under the captions "Directors and Executive Officers," "Corporate Governance and Board Matters," "Corporate Code of Conduct and Ethics" and "Section 16(a) Beneficial Ownership Reporting Compliance" and is incorporated by reference herein.
Item 11. Executive Compensation
The information required by this Item will be contained in our definitive proxy statement for our 2010 Annual Meeting of Stockholders under the captions "Compensation Discussion and Analysis," "Corporate Governance and Board Matters" and "Compensation Committee Report" and is incorporated by reference herein.
Item 12. Security Ownership of Certain Beneficial Owners and Management and Related Stockholder Matters
The information required by this Item will be contained in our definitive proxy statement for our 2010 Annual Meeting of Stockholders under the captions "Compensation Discussion and Analysis," "Equity Compensation Plan Information" and "Security Ownership of Certain Beneficial Owners and Management" and is incorporated by reference herein.
Item 13. Certain Relationships and Related Transactions, and Director Independence
The information required by this Item will be contained in our definitive proxy statement for our 2010 Annual Meeting of Stockholders under the captions "Certain Relationships and Related Transactions" and "Corporate Governance and Board Matters" and is incorporated by reference herein.
Item 14. Principal Accountant Fees and Services
The information required by this Item will be contained in our definitive proxy statement for our 2010 Annual Meeting of Stockholders under the caption "Proposal Three—Ratification of Appointment of Independent Registered Public Accounting Firm" and is incorporated by reference herein.
Item 15. Exhibits, Financial Statement Schedules
- (a)
- The following are filed as part of this Annual Report on Form 10-K:
1. Financial Statements
The following consolidated financial statements beginning on page F-1 are included in this Annual Report on Form 10-K:
- •
- Report of Independent Registered Public Accounting Firm
- •
- Consolidated Balance Sheets as of December 31, 2009 and 2008
- •
- Consolidated Statements of Operations for the Years ended December 31, 2009, 2008 and 2007
81
- •
- Consolidated Statements of Changes in Stockholders' (Deficit) Equity and Comprehensive Loss for the Years ended
December 31, 2009, 2008 and 2007
- •
- Consolidated Statements of Cash Flows for the Years ended December 31, 2009, 2008 and 2007
- •
- Notes to the Consolidated Financial Statements
(b) Exhibits
The exhibits listed in the Exhibit Index immediately preceding the exhibits are filed with or incorporated by reference in this Annual Report on Form 10-K.
(c) Financial Statement Schedules
All other schedules have been omitted since the required information is not present, or not present in amounts sufficient to require submission of the schedule, or because the information required is included in the consolidated financial statements or the Notes thereto.
82
Pursuant to the requirements of Section 13 or 15(d) of the Securities Exchange Act of 1934, the registrant has duly caused this report to be signed on its behalf by the undersigned, thereunto duly authorized.
| EnerNOC, Inc. | ||||||
Date: March 12, 2010 |
By: |
/s/ TIMOTHY G. HEALY |
||||
| Name: | Timothy G. Healy | |||||
| Title: | Chairman of the Board and Chief Executive Officer |
|||||
Pursuant to the requirements of the Securities Exchange Act of 1934, this report has been signed below by the following persons on behalf of the registrant and in the capacities and on the dates indicated.
Signature
|
Title
|
Date
|
||
|---|---|---|---|---|
| /s/ TIMOTHY G. HEALY Timothy G. Healy |
Chairman of the Board, Chief Executive Officer and Director (principal executive officer) |
March 12, 2010 | ||
/s/ TIMOTHY WELLER Timothy Weller |
Chief Financial Officer and Treasurer (principal financial officer) |
March 12, 2010 |
||
/s/ KEVIN J. BLIGH Kevin J. Bligh |
Chief Accounting Officer (principal accounting officer) |
March 12, 2010 |
||
/s/ DAVID B. BREWSTER David B. Brewster |
Director and President |
March 12, 2010 |
||
/s/ ARTHUR W. COVIELLO, JR. Arthur W. Coviello, Jr. |
Director |
March 12, 2010 |
||
/s/ RICHARD DIETER Richard Dieter |
Director |
March 12, 2010 |
||
/s/ TJ GLAUTHIER TJ Glauthier |
Director |
March 12, 2010 |
||
/s/ ADAM GROSSER Adam Grosser |
Director |
March 12, 2010 |
||
/s/ SUSAN F. TIERNEY Susan F. Tierney, Ph.D. |
Director |
March 12, 2010 |
||
/s/ JAMES L. TURNER James L. Turner |
Director |
March 12, 2010 |
83
INDEX TO CONSOLIDATED FINANCIAL STATEMENTS
F-1
Report of Independent Registered Public Accounting Firm
The Board of Directors and Stockholders of EnerNOC, Inc.
We have audited the accompanying consolidated balance sheets of EnerNOC, Inc. as of December 31, 2009 and 2008, and the related consolidated statements of operations, changes in stockholders' (deficit) equity and comprehensive loss, and cash flows for each of the three years in the period ended December 31, 2009. These financial statements are the responsibility of the Company's management. Our responsibility is to express an opinion on these financial statements based on our audits.
We conducted our audits in accordance with the standards of the Public Company Accounting Oversight Board (United States). Those standards require that we plan and perform the audit to obtain reasonable assurance about whether the financial statements are free of material misstatement. An audit includes examining, on a test basis, evidence supporting the amounts and disclosures in the financial statements. An audit also includes assessing the accounting principles used and significant estimates made by management, as well as evaluating the overall financial statement presentation. We believe that our audits provide a reasonable basis for our opinion.
In our opinion, the financial statements referred to above present fairly, in all material respects, the consolidated financial position of EnerNOC, Inc. at December 31, 2009 and 2008, and the consolidated results of its operations and its cash flows for each of the three years in the period ended December 31, 2009, in conformity with U.S. generally accepted accounting principles.
We also have audited, in accordance with the standards of the Public Company Accounting Oversight Board (United States), EnerNOC, Inc.'s internal control over financial reporting as of December 31, 2009, based on criteria established in the Internal Control-Integrated Framework issued by the Committee of Sponsoring Organizations of the Treadway Commission and our report dated March 12, 2010 expressed an unqualified opinion thereon.
| /s/ Ernst & Young LLP | ||
Boston, Massachusetts March 12, 2010 |
F-2
EnerNOC, Inc.
CONSOLIDATED BALANCE SHEETS
(in thousands, except share data)
| |
December 31, | ||||||||
|---|---|---|---|---|---|---|---|---|---|
| |
2009 | 2008 | |||||||
Assets |
|||||||||
Current assets |
|||||||||
Cash and cash equivalents |
$ | 119,739 | $ | 60,782 | |||||
Restricted cash |
177 | 1,419 | |||||||
Marketable securities |
— | 2,000 | |||||||
Trade accounts receivable, net allowance for doubtful accounts of $57 and $37 at December 31, 2009 and 2008, respectively |
17,708 | 11,150 | |||||||
Unbilled revenue |
40,388 | 11,585 | |||||||
Prepaid expenses, deposits and other current assets |
4,438 | 3,250 | |||||||
Total current assets |
182,450 | 90,186 | |||||||
Property and equipment, net |
31,344 | 26,975 | |||||||
Goodwill |
22,553 | 13,395 | |||||||
Intangible assets, net |
7,075 | 5,140 | |||||||
Deposits and other assets |
3,903 | 998 | |||||||
Restricted cash |
7,697 | — | |||||||
Total assets |
$ | 255,022 | $ | 136,694 | |||||
Liabilities and Stockholders' Equity |
|||||||||
Current liabilities |
|||||||||
Accounts payable |
$ | 55 | $ | 1,171 | |||||
Accrued capacity payments |
40,534 | 18,643 | |||||||
Accrued payroll and related expenses |
9,688 | 6,309 | |||||||
Accrued expenses and other current liabilities |
3,706 | 3,822 | |||||||
Accrued acquisition contingent consideration |
1,455 | — | |||||||
Deferred revenue |
2,119 | 1,057 | |||||||
Current portion of long-term debt |
36 | 47 | |||||||
Total current liabilities |
57,593 | 31,049 | |||||||
Long-term liabilities |
|||||||||
Long-term debt, net of current portion |
37 | 4,516 | |||||||
Deferred tax liability |
654 | 362 | |||||||
Other liabilities |
1,763 | 1,547 | |||||||
Total long-term liabilities |
2,454 | 6,425 | |||||||
Commitments and contingencies (Note 8 and Note 13) |
— | — | |||||||
Stockholders' equity |
|||||||||
Undesignated preferred stock, $0.001 par value; 5,000,000 shares authorized; no shares issued |
— | — | |||||||
Common stock, $0.001 par value; 50,000,000 shares authorized, 24,233,448 and 20,254,548 shares issued and outstanding at December 31, 2009 and 2008, respectively |
24 | 20 | |||||||
Additional paid-in capital |
272,350 | 169,800 | |||||||
Accumulated other comprehensive loss |
(56 | ) | (86 | ) | |||||
Accumulated deficit |
(77,343 | ) | (70,514 | ) | |||||
Total stockholders' equity |
194,975 | 99,220 | |||||||
Total liabilities and stockholders' equity |
$ | 255,022 | $ | 136,694 | |||||
The accompanying notes are an integral part of these consolidated financial statements.
F-3
EnerNOC, Inc.
CONSOLIDATED STATEMENTS OF OPERATIONS
(in thousands, except share and per share data)
| |
Year Ended December 31, | |||||||||||
|---|---|---|---|---|---|---|---|---|---|---|---|---|
| |
2009 | 2008 | 2007 | |||||||||
Revenue |
$ | 190,675 | $ | 106,115 | $ | 60,838 | ||||||
Cost of revenues |
104,215 | 64,819 | 38,949 | |||||||||
Gross profit |
86,460 | 41,296 | 21,889 | |||||||||
Operating expenses: |
||||||||||||
Selling and marketing |
39,502 | 30,789 | 18,695 | |||||||||
General and administrative |
44,407 | 41,582 | 25,866 | |||||||||
Research and development |
7,601 | 6,123 | 3,598 | |||||||||
Total operating expenses |
91,510 | 78,494 | 48,159 | |||||||||
Loss from operations |
(5,050 | ) | (37,198 | ) | (26,270 | ) | ||||||
Other income |
98 | 1,949 | 3,161 | |||||||||
Interest expense |
(1,544 | ) | (1,151 | ) | (373 | ) | ||||||
Loss before income tax |
(6,496 | ) | (36,400 | ) | (23,482 | ) | ||||||
Provision for income tax |
(333 | ) | (262 | ) | (100 | ) | ||||||
Net loss |
$ | (6,829 | ) | $ | (36,662 | ) | $ | (23,582 | ) | |||
Basic and diluted net loss per share |
$ | (0.32 | ) | $ | (1.88 | ) | $ | (1.80 | ) | |||
Weighted average number of basic and diluted shares |
21,466,813 | 19,505,065 | 13,106,114 | |||||||||
The accompanying notes are an integral part of these consolidated financial statements.
F-4
EnerNOC, Inc.
CONSOLIDATED STATEMENTS OF CHANGES IN
STOCKHOLDERS' (DEFICIT) EQUITY AND COMPREHENSIVE LOSS
(in thousands, except share data)
| |
Common Stock | |
|
|
|
|
||||||||||||||||
|---|---|---|---|---|---|---|---|---|---|---|---|---|---|---|---|---|---|---|---|---|---|---|
| |
|
Accumulated Other Comprehensive Loss |
|
|
|
|||||||||||||||||
| |
Number of Shares |
Amount | Additional Paid in Capital |
Accumulated Deficit |
Total | Comprehensive Loss |
||||||||||||||||
Balances as of December 31, 2006 |
4,245,324 | $ | 4 | $ | 771 | $ | — | $ | (10,059 | ) | $ | (9,284 | ) | $ | — | |||||||
Issuance of common stock upon exercise of stock options |
437,321 | — | 150 | — | — | 150 | — | |||||||||||||||
Issuance of restricted stock |
45,500 | — | — | — | — | — | — | |||||||||||||||
Exercise of warrant |
160,287 | — | 606 | — | — | 606 | — | |||||||||||||||
Conversion of Preferred Stock |
9,499,565 | 10 | 28,080 | — | — | 28,090 | — | |||||||||||||||
Vesting of restricted stock |
— | — | 24 | — | — | 24 | — | |||||||||||||||
Accretion of issuance costs |
— | — | — | — | (211 | ) | (211 | ) | — | |||||||||||||
Purchase and subsequent reissuance of treasury stock |
— | — | (395 | ) | — | — | (395 | ) | — | |||||||||||||
Issuance of common stock in connection with the initial public offering |
4,087,500 | 4 | 95,155 | — | — | 95,159 | — | |||||||||||||||
Issuance of common stock in connection with the secondary offering |
500,000 | 1 | 19,445 | — | — | 19,446 | — | |||||||||||||||
Issuance of common stock in connection with the acquisition of Pinpoint Power DR LLC |
65,951 | — | 66 | — | — | 66 | — | |||||||||||||||
Issuance of common stock in connection with the acquisition of Mdenergy, LLC |
139,056 | — | 4,751 | — | — | 4,751 | — | |||||||||||||||
Stock-based compensation expense |
— | — | 7,597 | — | — | 7,597 | — | |||||||||||||||
Net loss |
— | — | — | — | (23,582 | ) | (23,582 | ) | (23,582 | ) | ||||||||||||
Balances as of December 31, 2007 |
19,180,504 | 19 | 156,250 | — | (33,852 | ) | 122,417 | (23,582 | ) | |||||||||||||
Issuance of common stock upon exercise of stock options |
706,823 | 1 | 456 | — | — | 457 | — | |||||||||||||||
Issuance of restricted stock |
177,500 | — | — | — | — | — | — | |||||||||||||||
Vesting of restricted stock |
— | — | 20 | — | — | 20 | — | |||||||||||||||
Cancellation of restricted stock |
(1,500 | ) | — | — | — | — | — | — | ||||||||||||||
Issuance of common stock in satisfaction of bonuses |
26,961 | — | 845 | — | — | 845 | — | |||||||||||||||
Issuance of common stock in connection with the acquisition of Pinpoint Power DR LLC |
44,260 | — | 44 | — | — | 44 | — | |||||||||||||||
Issuance of common stock in connection with the acquisition of South River Consulting, LLC |
120,000 | — | 1,746 | — | — | 1,746 | — | |||||||||||||||
Stock-based compensation expense |
— | — | 10,439 | — | — | 10,439 | — | |||||||||||||||
Unrealized gain on marketable securities |
— | — | — | 5 | — | 5 | 5 | |||||||||||||||
Foreign currency translation loss |
— | — | — | (91 | ) | — | (91 | ) | (91 | ) | ||||||||||||
Net loss |
— | — | — | — | (36,662 | ) | (36,662 | ) | (36,662 | ) | ||||||||||||
Balances as of December 31, 2008 |
20,254,548 | 20 | 169,800 | (86 | ) | (70,514 | ) | 99,220 | (36,748 | ) | ||||||||||||
Issuance of common stock upon exercise of stock options |
426,744 | — | 1,078 | — | — | 1,078 | — | |||||||||||||||
Issuance of restricted stock |
81,750 | — | — | — | — | — | — | |||||||||||||||
Vesting of restricted stock |
— | — | 20 | — | — | 20 | — | |||||||||||||||
Cancellation of restricted stock |
(10,063 | ) | — | — | — | — | — | |||||||||||||||
Issuance of common stock in satisfaction of bonuses |
45,085 | — | 500 | — | — | 500 | — | |||||||||||||||
Issuance of common stock in connection with the acquisition of Cogent Energy, Inc. |
114,281 | — | 3,162 | — | — | 3,162 | — | |||||||||||||||
Issuance of common stock in connection with the acquisition of eQuilibrium Solutions Corporation |
21,464 | — | 501 | — | — | 501 | — | |||||||||||||||
Issuance of common stock in connection with the public offering, net of issuance costs of $4,468 |
3,254,863 | 4 | 83,421 | — | — | 83,425 | — | |||||||||||||||
Earn-out payment of common stock to South River Consulting, LLC |
44,776 | — | 734 | — | — | 734 | — | |||||||||||||||
Stock-based compensation expense |
— | — | 13,134 | — | — | 13,134 | — | |||||||||||||||
Foreign currency translation gain |
— | — | — | 30 | — | 30 | 30 | |||||||||||||||
Net loss |
— | — | — | — | (6,829 | ) | (6,829 | ) | (6,829 | ) | ||||||||||||
Balances as of December 31, 2009 |
24,233,448 | $ | 24 | $ | 272,350 | $ | (56 | ) | $ | (77,343 | ) | $ | 194,975 | $ | (6,799 | ) | ||||||
The accompanying notes are an integral part of these consolidated financial statements.
F-5
EnerNOC, Inc.
CONSOLIDATED STATEMENTS OF CASH FLOWS
(in thousands)
| |
Year Ended December 31, | ||||||||||
|---|---|---|---|---|---|---|---|---|---|---|---|
| |
2009 | 2008 | 2007 | ||||||||
Cash flow from operating activities |
|||||||||||
Net loss |
$ | (6,829 | ) | $ | (36,662 | ) | $ | (23,582 | ) | ||
Adjustments to reconcile net loss to net cash used in operating activities: |
|||||||||||
Depreciation |
11,357 | 8,035 | 3,218 | ||||||||
Amortization of acquired intangible assets |
692 | 1,019 | 2,287 | ||||||||
Write-down of intangible assets |
135 | — | — | ||||||||
Stock-based compensation expense |
13,134 | 10,439 | 7,597 | ||||||||
Impairment of property and equipment |
1,191 | 701 | — | ||||||||
Unrealized foreign exchange transaction loss |
86 | — | — | ||||||||
Deferred tax liability |
292 | 262 | 100 | ||||||||
Non-cash interest expense |
60 | 520 | 175 | ||||||||
Loss on disposal of equipment |
26 | — | — | ||||||||
Other, net |
33 | — | — | ||||||||
Changes in operating assets and liabilities, net of effects of acquisitions: |
|||||||||||
Accounts receivable, trade |
(4,868 | ) | (887 | ) | (5,686 | ) | |||||
Unbilled revenue |
(28,622 | ) | (11,585 | ) | — | ||||||
Prepaid expenses and other current assets |
(2,492 | ) | 657 | (1,577 | ) | ||||||
Other assets |
(940 | ) | (103 | ) | 387 | ||||||
Other noncurrent liabilities |
254 | 247 | 742 | ||||||||
Deferred revenue |
997 | (884 | ) | 898 | |||||||
Accrued capacity payments |
21,871 | 9,579 | 3,859 | ||||||||
Accrued payroll and related expenses |
3,873 | 1,408 | 3,627 | ||||||||
Accounts payable and accrued expenses |
(2,164 | ) | 2,047 | 792 | |||||||
Net cash provided by (used in) operating activities |
8,086 | (15,207 | ) | (7,163 | ) | ||||||
Cash flows from investing activities |
|||||||||||
Purchase of marketable securities |
— | (13,637 | ) | (35,449 | ) | ||||||
Sales and maturities of marketable securities |
2,000 | 27,142 | 19,949 | ||||||||
Payments made for acquisitions of businesses, net of cash acquired |
(7,203 | ) | (7,523 | ) | (5,215 | ) | |||||
Purchases of property and equipment |
(16,901 | ) | (12,459 | ) | (19,866 | ) | |||||
Change in restricted cash and deposits |
(7,068 | ) | 13,371 | (16,438 | ) | ||||||
Net cash (used in) provided by investing activities |
(29,172 | ) | 6,894 | (57,019 | ) | ||||||
Cash flows from financing activities |
|||||||||||
Proceeds from public offerings of common stock, net of issuance costs |
83,425 | — | 114,605 | ||||||||
Proceeds from exercises of stock options |
1,078 | 457 | 152 | ||||||||
Proceeds from borrowings |
— | 4,352 | 2,500 | ||||||||
Repayment of borrowings and payments under capital leases |
(4,490 | ) | (5,879 | ) | (1,610 | ) | |||||
Proceeds from issuance of redeemable preferred stock, net of issuance costs |
— | — | 9,988 | ||||||||
Repurchase and reissuance of treasury stock |
— | — | (395 | ) | |||||||
Net cash provided by (used in) financing activities |
80,013 | (1,070 | ) | 125,240 | |||||||
Effects of exchange rate changes on cash |
30 | (77 | ) | — | |||||||
Net change in cash and cash equivalents |
58,957 | (9,460 | ) | 61,058 | |||||||
Cash and cash equivalents at beginning of period |
60,782 | 70,242 | 9,184 | ||||||||
Cash and cash equivalents at end of period |
$ | 119,739 | $ | 60,782 | $ | 70,242 | |||||
Supplemental disclosure of cash flow information |
|||||||||||
Cash paid for interest |
$ | 1,536 | $ | 524 | $ | 789 | |||||
Non-cash financing and investing activities |
|||||||||||
Conversion and net exercise into common stock of preferred stock warrant |
$ | — | $ | — | $ | 606 | |||||
Deferred related party stock issuance for Pinpoint Power DR LLC |
$ | — | $ | 44 | $ | 66 | |||||
Issuance of common stock in connection with acquisitions |
$ | 4,397 | $ | 1,746 | $ | 4,571 | |||||
Issuance of common stock in satisfaction of bonuses |
$ | 500 | $ | 845 | $ | — | |||||
Accretion of preferred stock issuance costs |
$ | — | $ | — | $ | 211 | |||||
The accompanying notes are an integral part of these consolidated financial statements.
F-6
EnerNOC, Inc.
NOTES TO CONSOLIDATED FINANCIAL STATEMENTS
(in thousands, except share and per share data)
1. Description of Business, Basis of Presentation and Summary of Significant Accounting Policies
Description of Business
EnerNOC, Inc. (the Company) is a service company that was incorporated in Delaware on June 5, 2003. The Company operates in a single segment providing full-service demand response services, energy efficiency, or monitoring-based commissioning, services, energy procurement services and emissions tracking and trading support services. The Company uses its Network Operations Center (NOC) and PowerTrak enterprise software platform to remotely manage and reduce electricity consumption across a network of commercial, institutional and industrial customer sites, making demand response capacity available to grid operators and utilities on demand while helping end-users of electricity achieve energy savings, environmental benefits and improved financial results. The Company builds upon its position as a leading demand response services provider by using its NOC and scalable PowerTrak technology platform to also deliver a portfolio of additional energy management services to its customers, including cross-selling these energy management services to existing end-use customers. These additional services include the Company's monitoring-based commissioning services, energy procurement services and emissions tracking and trading support services. The Company's demand response and energy management services deliver immediate bottom-line benefits to end-use customers and energy suppliers while helping to create a more reliable and efficient electricity grid for system operators and utilities.
Reclassifications
Certain reclassifications have been made to the December 31, 2008 and 2007 statements of operations to conform to the December 31, 2009 presentation. The reclassifications primarily consist of costs related to facilities, information technology, human resources and certain employee-related expenses, such as employee benefits. These reclassifications were determined on a headcount-based allocation. These amounts, which were previously included in general and administrative expenses, have been allocated among selling and marketing expenses and research and development expenses. The Company believes that by allocating these costs in this manner it better represents the expenses associated with each of these activities.
Basis of Consolidation
The consolidated financial statements of the Company include the accounts of its wholly-owned subsidiaries and have been prepared in conformity with accounting principles generally accepted in the United States (GAAP). Intercompany transactions and balances are eliminated upon consolidation.
On December 4, 2009, the Company acquired all of the outstanding capital stock of Cogent Energy, Inc. (Cogent) in a purchase business combination. Accordingly, the results of Cogent subsequent to that date are included in the Company's consolidated statements of operations.
On June 11, 2009, the Company acquired all of the assets eQuilibrium Solutions Corporation (eQ) in a purchase business combination. Accordingly, the results of eQ subsequent to that date are included in the Company's consolidated statements of operations.
On May 1, 2008, the Company acquired 100% of the membership interests of South River Consulting, LLC (SRC) in a purchase business combination. Accordingly, the results of SRC subsequent to that date are included in the Company's consolidated statements of operations.
F-7
EnerNOC, Inc.
NOTES TO CONSOLIDATED FINANCIAL STATEMENTS (Continued)
(in thousands, except share and per share data)
1. Description of Business, Basis of Presentation and Summary of Significant Accounting Policies (Continued)
On September 13, 2007, the Company purchased all of the outstanding membership interests of Mdenergy, LLC (MDE) in a purchase business combination. Accordingly, the results of MDE subsequent to that date are included in the Company's consolidated statements of operations.
Subsequent Events Consideration
The Company considers events or transactions that occur after the balance sheet date but prior to the issuance of the financial statements to provide additional evidence relative to certain estimates or to identify matters that require additional disclosure. Subsequent events have been evaluated and there were no material recognizable subsequent events recorded in the December 31, 2009 consolidated financial statements.
Use of Estimates in Preparation of Financial Statements
The preparation of these consolidated financial statements requires us to make estimates and judgments that affect the reported amounts of assets, liabilities, revenues and expenses, and related disclosure of contingent assets and liabilities. On an on-going basis, the Company evaluates its estimates, including those related to revenue recognition for multiple element arrangements, allowance for doubtful accounts, valuations and purchase price allocations related to business combinations, expected future cash flows including growth rates, discount rates, terminal values and other assumptions and estimates used to evaluate the recoverability of long-lived assets and goodwill, estimated fair values of intangible assets and goodwill, amortization methods and periods, certain accrued expenses and other related charges, stock-based compensation, contingent liabilities, tax reserves and recoverability of our net deferred tax assets and related valuation allowance.
Although the Company regularly assesses these estimates, actual results could differ materially from these estimates. Changes in estimates are recorded in the period in which they become known. The Company bases its estimates on historical experience and various other assumptions that it believes to be reasonable under the circumstances. Actual results may differ from management's estimates if these results differ from historical experience or other assumptions prove not to be substantially accurate, even if such assumptions are reasonable when made.
The Company is subject to a number of risks similar to those of other companies of similar size in its industry, including, but not limited to, rapid technological changes, competition from substitute products and services from larger companies, customer concentration, government regulations, protection of proprietary rights and dependence on key individuals.
Significant Accounting Policies
Restricted Cash and Cash Equivalents
Restricted cash is comprised of certificates of deposit and cash held to collateralize the Company's outstanding letters of credit. Cash equivalents are highly liquid investments with insignificant interest rate risk and maturities of three months or less at the time of acquisition. Investments qualifying as cash equivalents consist of investments in money market funds, which have no withdrawal restrictions or penalties, which totaled $100,520 and $44,504 at December 31, 2009 and 2008, respectively.
F-8
EnerNOC, Inc.
NOTES TO CONSOLIDATED FINANCIAL STATEMENTS (Continued)
(in thousands, except share and per share data)
1. Description of Business, Basis of Presentation and Summary of Significant Accounting Policies (Continued)
Disclosure of Fair Value of Financial Instruments
The Company's financial instruments mainly consist of cash and cash equivalents, restricted cash, accounts receivable, and accounts payable and debt obligations. The carrying amounts of the Company's cash equivalents, restricted cash, accounts receivable and accounts payable approximate their fair value due to the short-term nature of these instruments. Amounts outstanding under the $35,000 secured revolving credit and term loan facility that the Company and one of its subsidiaries entered into with Silicon Valley Bank (SVB) of $0 and $4,442 at December 31, 2009 and 2008, respectively, are subject to variable rates of interest based on current market rates; as such, the Company believes the carrying amounts of this obligation approximate its fair value. For additional information regarding this credit facility with SVB see Note 8.
Concentrations of Credit Risk
Financial instruments that potentially subject the Company to significant concentrations of credit risk principally consist of cash and cash equivalents, marketable securities, restricted cash and accounts receivable. The Company maintains its cash and cash equivalent balances with highly rated financial institutions and, consequently, such funds are subject to minimal credit risk. As of December 31, 2009, the Company no longer had investments in marketable securities.
The Company's customers are principally located in the northeastern and PJM Interconnection (PJM) regions of the United States. The Company performs ongoing credit evaluations of the financial condition of its customers and generally does not require collateral. Although the Company is directly affected by the overall financial condition of the energy industry as well as global economic conditions, management does not believe significant credit risk exists as of December 31, 2009. The Company generally has not experienced any material losses related to receivables from individual customers or groups of customers in the energy industry. The Company maintains an allowance for doubtful accounts based on accounts past due and historical collection experience. The Company's losses related to collection of trade receivables have consistently been within management's expectations. Due to these factors, no additional credit risk beyond amounts provided for collection losses is believed by management to be probable.
The following table presents the Company's significant customers. With respect to PJM Interconnection and ISO-New England, Inc., these customers are regional grid operators, which are
F-9
EnerNOC, Inc.
NOTES TO CONSOLIDATED FINANCIAL STATEMENTS (Continued)
(in thousands, except share and per share data)
1. Description of Business, Basis of Presentation and Summary of Significant Accounting Policies (Continued)
comprised of multiple utilities and were formed to control the operation of a regional power system, coordinate the supply of electricity, and establish fair and efficient markets.
| |
Year Ended December 31, | ||||||||||||||||||
|---|---|---|---|---|---|---|---|---|---|---|---|---|---|---|---|---|---|---|---|
| |
2009 | 2008 | 2007 | ||||||||||||||||
| |
Revenues | % of Total Revenues |
Revenues | % of Total Revenues |
Revenues | % of Total Revenues |
|||||||||||||
PJM Interconnection |
$ | 98,416 | 52 | % | $ | 30,012 | 28 | % | $ | 2,487 | 4 | % | |||||||
ISO-New England, Inc. |
56,107 | 29 | % | 38,638 | 36 | % | 36,617 | 60 | % | ||||||||||
Connecticut Light and Power |
— | — | 16,118 | 15 | % | 12,666 | 21 | % | |||||||||||
Total |
$ | 154,523 | 81 | % | $ | 84,768 | 79 | % | $ | 51,770 | 85 | % | |||||||
Accounts receivable from these customers was approximately $9,788 and $9,121 at December 31, 2009 and 2008, respectively. Unbilled revenue from these customers was $40,388 and $11,585 at December 31, 2009 and 2008, respectively.
Deposits and restricted cash consist of funds to secure performance under certain customer contracts and open market bidding programs. Deposits held by customers were $3,024 and $2,648 at December 31, 2009 and 2008, respectively. Restricted cash to secure letters of credit were $7,874 and $1,419 at December 31, 2009 and 2008, respectively.
Property and Equipment
Property and equipment is stated at cost and depreciated using the straight-line method over the estimated useful lives of the respective assets, ranging from three to ten years. Demand response equipment is depreciated over the lesser of its useful life or the estimated commercial, institutional and industrial customer relationship period, which historically has been approximately three years. Leasehold improvements are amortized over their useful life or the life of the lease, whichever is shorter. The amortization of capital lease amounts is included in depreciation expense. Expenditures that improve or extend the life of a respective asset are capitalized while repairs and maintenance expenditures are expensed as incurred.
The Company capitalizes interest on projects that qualify for interest capitalization. Capitalized interest is included within construction in progress and is depreciated over the useful life of the assets once the project is complete. No interest was capitalized for the year ended December 31, 2009 and 2008. For the year ended December 31, 2007, the Company capitalized $722 of interest.
Software Development Costs
The Company applies the provisions of Accounting Standard Codification (ASC) 350-40, Internal-Use Software (formerly American Institute of Certified Public Accountants (AICPA) Statement of Position (SOP) 98-1, Software Developed or Obtained for Internal Use). This accounting guidance requires computer software costs associated with internal use software to be expensed as incurred until certain capitalization criteria are met, and it also defines which types of costs should be capitalized and which should be expensed. The Company capitalizes the payroll and payroll-related costs of employees
F-10
EnerNOC, Inc.
NOTES TO CONSOLIDATED FINANCIAL STATEMENTS (Continued)
(in thousands, except share and per share data)
1. Description of Business, Basis of Presentation and Summary of Significant Accounting Policies (Continued)
who devote time to the development of internal-use computer software. The Company amortizes these costs on a straight-line basis over the estimated useful life of the software, which is generally two to three years. The Company's judgment is required in determining the point at which various projects enter the stages at which costs may be capitalized, in assessing the ongoing value and impairment of the capitalized costs, and in determining the estimated useful lives over which the costs are amortized.
Software development costs of $2,068, $1,321 and $677 for the years ended December 31, 2009, 2008 and 2007, respectively, have been capitalized in accordance with SOP 98-1. The capitalized amount is included as software in property and equipment at December 31, 2009, 2008 and 2007. Amortization of capitalized software development costs was $2,311, $1,424 and $437 for the years ended December 31, 2009, 2008 and 2007, respectively. Accumulated amortization of capitalized software development costs was $4,187 and $1,876 as of December 31, 2009 and 2008, respectively.
Impairment of Property and Equipment
The Company reviews property and equipment for impairment whenever events or changes in circumstances indicate that the carrying amount of assets may not be recoverable. If these assets are considered to be impaired, the impairment is recognized in earnings and equals the amount by which the carrying value of the assets exceeds their fair market value determined by either a quoted market price, if any, or a value determined by utilizing a discounted cash flow technique. If these assets are not impaired, but their useful lives have decreased, the remaining net book value is amortized over the revised useful life. For the year ended December 31, 2009, the carrying value of a portion of the Company's demand response and generation equipment exceeded the undiscounted future cash flows based upon the anticipated retirement dates. As a result, the Company recognized an impairment charge of $1,191 representing the difference between the carrying value and fair market value of demand response and generation equipment, which is included in cost of revenues in the accompanying consolidated statements of operations. The fair market value of approximately $210 was determined utilizing Level 3 inputs, as defined by ASC 820, Fair Value Measurements and Disclosures (formerly Statement of Financial Accounting Standard (SFAS) No. 157, Fair Value Measurement), based on the projected future cash flows discounted using the estimated market participant rate of return for this type of asset. The Company recognized an impairment charge of $701 and $0 for the years ended December 31, 2008 and 2007, respectively, which is included in cost of revenues in the accompanying consolidated statements of operations. As of December 31, 2009, approximately $3,674 of the Company's generation equipment is enrolled in open market demand response programs. The recoverability of this generation equipments' carrying value is largely dependent on the rates that the Company is compensated for its committed capacity within these programs. These rates represent market rates and can fluctuate based on the supply and demand of capacity. Although these market rates are established up to three years in advance of the service delivery, these market rates have not yet been established for the entire remaining useful life of this generation equipment. In performing its impairment analysis, the Company estimates the expected future market rates based on current existing market rates and trends. A decline in the expected future market rates of greater than 10% could result in an impairment charge related to this generation equipment.
F-11
EnerNOC, Inc.
NOTES TO CONSOLIDATED FINANCIAL STATEMENTS (Continued)
(in thousands, except share and per share data)
1. Description of Business, Basis of Presentation and Summary of Significant Accounting Policies (Continued)
Business Combinations
The Company records tangible and intangible assets acquired and liabilities assumed in business combinations under the purchase method of accounting. Amounts paid for each acquisition are allocated to the assets acquired and liabilities assumed based on their fair values at the dates of acquisition. The fair value of identifiable intangible assets is based on detailed valuations that use information and assumptions provided by management. The Company estimates the fair value of contingent consideration at the time of the acquisition using all pertinent information known to the Company at the time to assess the probability of payment of contingent amounts. The Company allocates any excess purchase price over the fair value of the net tangible and intangible assets acquired and liabilities assumed to goodwill.
The Company uses the income approach to determine the estimated fair value of identifiable intangible assets, including customer relationships, non-compete agreements and trade names. This approach determines fair value by estimating the after-tax cash flows attributable to an in-process project over its useful life and then discounting these after-tax cash flows back to a present value. The Company bases its revenue assumptions on estimates of relevant market sizes, expected market growth rates and expected trends, including introductions by competitors of new services and products. The Company bases the discount rate used to arrive at a present value as of the date of acquisition on the time value of money and market participant investment risk factors. The use of different assumptions could materially impact the purchase price allocation and the Company's financial condition and results of operations. Customer relationships represent established relationships with customers, which provide a ready channel for the sale of additional products and services. Non-compete agreements represent arrangements with certain employees that limit or prevent their ability to take employment at a competitor for a fixed period of time. Trade names represent acquired product names that the Company intends to continue to utilize.
Impairment of Intangible Assets and Goodwill
Intangible Assets
The Company amortizes its intangible assets that have finite lives using either the straight-line method or, if reliably determinable, based on the pattern in which the economic benefit of the asset is expected to be consumed utilizing expected undiscounted future cash flows. Amortization is recorded over the estimated useful lives ranging from one to ten years. The Company reviews its intangible assets subject to amortization to determine if any adverse conditions exist or a change in circumstances has occurred that would indicate impairment or a change in the remaining useful life. If the carrying value of an asset exceeds its undiscounted cash flows, the Company will write-down the carrying value of the intangible asset to its fair value in the period identified. In assessing recoverability, the Company must make assumptions regarding estimated future cash flows and discount rates. If these estimates or related assumptions change in the future, the Company may be required to record impairment charges. The Company generally calculates fair value as the present value of estimated future cash flows to be generated by the asset using a risk-adjusted discount rate. If the estimate of an intangible asset's remaining useful life is changed, the Company will amortize the remaining carrying value of the intangible asset prospectively over the revised remaining useful life. During the year ended
F-12
EnerNOC, Inc.
NOTES TO CONSOLIDATED FINANCIAL STATEMENTS (Continued)
(in thousands, except share and per share data)
1. Description of Business, Basis of Presentation and Summary of Significant Accounting Policies (Continued)
December 31, 2009, as a result of a change in the expected period of economic benefit of the trade name acquired in the acquisition of Cogent, the Company determined that an impairment indicator existed. Based on the analysis performed, the Company determined that this trade name was partially impaired and recorded an impairment charge of $135 during the year ended December 31, 2009, which is included in general and administrative expenses in the accompanying consolidated statements of operations. The fair market value of approximately $65 was determined using Level 3 inputs, as defined by ASC 820, based on the projected future cash flows over the revised period of economic benefit discounted based on the Company's weighted average cost of capital of 17%.
The following table provides the gross carrying amount and related accumulated amortization of intangible assets as of December 31, 2009 and December 31, 2008:
| |
Weighted Average Amortization Period (in years) |
As of December 31, 2009 | As of December 31, 2008 | |||||||||||||
|---|---|---|---|---|---|---|---|---|---|---|---|---|---|---|---|---|
| |
Gross Carrying Amount |
Accumulated Amortization |
Gross Carrying Amount |
Accumulated Amortization |
||||||||||||
Customer contracts |
7.34 | $ | 4,217 | $ | (1,180 | ) | $ | 4,217 | $ | (767 | ) | |||||
Employment agreements and non-compete agreements |
3.35 | 772 | (118 | ) | 170 | (53 | ) | |||||||||
Software |
2.42 | 120 | (23 | ) | 33 | (31 | ) | |||||||||
Customer relationships |
7.09 | 3,510 | (333 | ) | 1,720 | (149 | ) | |||||||||
Trade name |
0.70 | 115 | (5 | ) | — | — | ||||||||||
Total |
$ | 8,734 | $ | (1,659 | ) | $ | 6,140 | $ | (1,000 | ) | ||||||
The increase in employment agreements and non-compete agreements as well as customer relationships and trade name from December 31, 2008 to December 31, 2009 was due to the allocation of purchase price related to the eQ and Cogent acquisitions. The increase in software from December 31, 2008 to December 31, 2009 was due to the allocation of purchase price related to the eQ acquisition, offset by the write-off of fully amortized intangible assets in the first half of 2009. Amortization expense related to intangible assets amounted to $692, $1,019 and $2,287 for years ended December 31, 2009, 2008 and 2007, respectively, and is included in general and administrative expenses in the accompanying consolidated statements of operations. The intangible asset lives range from one to ten years and the weighted average remaining life was 6.7 years at December 31, 2009. Estimated amortization is $1,399, $1,131, $1,045, $983, $800 and $1,717 for 2010, 2011, 2012, 2013, 2014 and thereafter, respectively.
Goodwill
In accordance with ASC 350, Intangibles—Goodwill and Other (formerly the Financial Accounting Standards Board (FASB) SFAS No. 142, Goodwill and Other Intangible Assets), the Company tests goodwill at the reporting unit level for impairment on an annual basis and between annual tests if events and circumstances indicate it is more likely than not that the fair value of a reporting unit is less than its carrying value. The Company has determined that the reporting unit level is the entity level as discrete financial information is not available at a lower level and its chief operating decision maker,
F-13
EnerNOC, Inc.
NOTES TO CONSOLIDATED FINANCIAL STATEMENTS (Continued)
(in thousands, except share and per share data)
1. Description of Business, Basis of Presentation and Summary of Significant Accounting Policies (Continued)
which is its chief executive officer and executive management team, collectively, make business decisions based on the evaluation of financial information at the entity level. Events that would indicate impairment and trigger an interim impairment assessment include, but are not limited to, current economic and market conditions, including a decline in market capitalization, a significant adverse change in legal factors, business climate or operational performance of the business, and an adverse action or assessment by a regulator. The Company's annual impairment test date is November 30.
In performing the test, the Company utilizes the two-step approach prescribed under ASC 350. The first step requires a comparison of the carrying value of the reporting units, as defined, to the fair value of these units. The Company considers a number of factors to determine the fair value of a reporting unit, including an independent valuation to conduct this test. The valuation is based upon expected future discounted operating cash flows of the reporting unit as well as analysis of recent sales or offerings of similar companies. The Company bases the discount rate used to arrive at a present value as the date of the impairment test on its weighted average cost of capital. If the carrying value of its reporting unit exceeds its fair value, the Company will perform the second step of the goodwill impairment test to measure the amount of impairment loss, if any. The second step of the goodwill impairment test compares the implied fair value of a reporting unit's goodwill to its carrying value.
The Company conducted its annual impairment test as of November 30, 2009. In order to complete the annual impairment test, the Company performed detailed analyses estimating the fair value of its reporting unit utilizing its fiscal 2010 forecast with updated long-term growth assumptions.
As a result of completing the first step, the fair value exceeded the carrying value, and as such the second step of the impairment test was not required. To date, the Company has not been required to perform the second step of the impairment test.
The fair value of the entity is determined by use of a market approach based on the quoted market price of its common stock and the number of shares outstanding and a discounted cash flow analysis (DCF) under the income approach. The key assumptions that drive the fair value in the DCF model are the discount rates (i.e., weighted average cost of capital (WACC)), terminal values, growth rates, and the amount and timing of expected future cash flows. If the current worldwide financial markets and economic environment were to deteriorate, this would likely result in a higher WACC because market participants would require a higher rate of return. In the DCF, as the WACC increases, the fair value decreases. The other significant factor in the DCF is its projected financial information (i.e., amount and timing of expected future cash flows and growth rates) and if its assumptions were to be adversely impacted, this could result in a reduction of the fair value of the entity. The Company believes that it is not at risk of failing the first step of the goodwill impairment test.
The estimate of fair value requires significant judgment. Any loss resulting from an impairment test would be reflected in operating loss in the Company's consolidated statements of operations. The annual impairment testing process is subjective and requires judgment at many points throughout the analysis. If these estimates or their related assumptions change in the future, the Company may be required to record impairment charges for these assets not previously recorded.
F-14
EnerNOC, Inc.
NOTES TO CONSOLIDATED FINANCIAL STATEMENTS (Continued)
(in thousands, except share and per share data)
1. Description of Business, Basis of Presentation and Summary of Significant Accounting Policies (Continued)
The following table shows the change of the carrying amount of goodwill from December 31, 2007 to December 31, 2009:
Balance at December 31, 2007 |
$ | 9,815 | ||
Acquisition of SRC |
3,580 | |||
Balance at December 31, 2008 |
$ | 13,395 | ||
SRC earnout payment |
1,468 | |||
Acquisition of eQ |
153 | |||
Acquisition of Cogent |
7,537 | |||
Balance at December 31, 2009 |
$ | 22,553 | ||
Income Taxes
The Company uses the asset and liability method for accounting for income taxes. Under this method, the Company determines deferred tax assets and liabilities based on the difference between financial reporting and taxes bases of its assets and liabilities. The Company deferred tax assets and liabilities using enacted tax rates and laws that will be in effect when the Company expects the differences to reverse.
The Company has incurred consolidated net losses since its inception and, as a result, the Company has not recognized net United States deferred tax assets as of December 31, 2009 or 2008. The Company's deferred tax liabilities primarily relate to deferred taxes associated with the Company's acquisitions and property and equipment. The Company's deferred tax assets relate primarily to net operating loss carryforwards, accruals and reserves, and stock-based compensation. The Company records a valuation allowance to reduce its deferred tax assets to the amount that is more likely than not to be realized. While the Company has considered future taxable income and ongoing prudent and feasible tax planning strategies in assessing the need for the valuation allowance, in the event the Company were to determine that the Company would be able to realize its deferred tax assets in the future in excess of the net recorded amount, an adjustment to the deferred tax asset would increase income in the period such determination was made.
ASC 740, Income Taxes (formerly FASB Interpretation No. 48 (FIN 48), Accounting for Uncertainty in Income Taxes—an interpretation of FASB Statement No. 109), prescribes a recognition threshold and measurement criteria for the financial statement recognition and measurement of a tax position taken or expected to be taken in a tax return. ASC 740 also provides guidance on derecognition, classification, interest and penalties, accounting in interim periods, disclosure, and transition and defines the criteria that must be met for the benefits of a tax position to be recognized.
The Company had no gross unrecognized tax benefits as of December 31, 2009 and 2008.
F-15
EnerNOC, Inc.
NOTES TO CONSOLIDATED FINANCIAL STATEMENTS (Continued)
(in thousands, except share and per share data)
1. Description of Business, Basis of Presentation and Summary of Significant Accounting Policies (Continued)
In the ordinary course of global business, there are many transactions and calculations where the ultimate tax outcome is uncertain. Judgment is required in determining the Company's worldwide income tax provision. In the Company's opinion, it is not required that the Company has a provision for income taxes for any years subject to audit. Although the Company believes its estimates are reasonable, no assurance can be given that the final tax outcome of matters will not be different than that which is reflected in the Company's historical income tax provisions and accruals. In the event the Company's assumptions are incorrect, the differences could have a material impact on its income tax provision and operating results in the period in which such determination is made.
Industry Segment Information
The Company is required to disclose the standards for reporting information about operating segments in annual financial statements and required selected information of these segments being presented in interim financial reports issued to stockholders. Operating segments are defined as components of an enterprise about which separate financial information is available that is evaluated regularly by the chief operating decision maker, or decision making group, in making decisions on how to allocate resources and assess performance. The Company's chief decision maker is considered to be the team comprised of the chief executive officer and the executive management team. The Company views its operations and manages its business as one operating segment.
For the years ended December 31, 2009, 2008 and 2007, operations related to the Company's international subsidiaries were not material to the accompanying consolidated financial statements taken as a whole. In addition, as of December 31, 2009 and 2008, the long-lived assets related to the Company's international subsidiaries were not material to the accompanying consolidated financial statements taken as a whole.
Revenue Recognition
The Company recognizes revenues in accordance with ASC 605, Revenue Recognition (formerly Staff Accounting Bulletin No. 104, Revenue Recognition in Financial Statements, and Emerging Issues Task Force (EITF) Issue No. 00-21, Accounting for Revenue Arrangements with Multiple Deliverables). In all of the Company's arrangements, it does not recognize any revenues until it can determine that persuasive evidence of an arrangement exists, delivery has occurred, the fee is fixed or determinable, and it deems collection to be reasonably assured. In making these judgments, the Company evaluates these criteria as follows:
- •
- Evidence of an
arrangement. The Company considers a definitive agreement signed by the customer and the Company or an arrangement enforceable under the
rules of an open market bidding program to be representative of persuasive evidence of an arrangement.
- •
- Delivery has occurred. The Company considers delivery to have occurred when service has been delivered to the customer and no post-delivery obligations exist. In instances where customer acceptance is required, delivery is deemed to have occurred when customer acceptance has been achieved.
F-16
EnerNOC, Inc.
NOTES TO CONSOLIDATED FINANCIAL STATEMENTS (Continued)
(in thousands, except share and per share data)
1. Description of Business, Basis of Presentation and Summary of Significant Accounting Policies (Continued)
- •
- Fees are fixed or
determinable. The Company considers the fee to be fixed or determinable unless the fee is subject to refund or adjustment or is not
payable within normal payment terms. If the fee is subject to refund or adjustment and the Company cannot reliably estimate this amount, the Company recognizes revenues when the right to a refund or
adjustment lapses. If offered payment terms exceed its normal terms, the Company recognizes revenues as the amounts become due and payable or upon the receipt of cash.
- •
- Collection is reasonably assured. The Company conducts a credit review at the inception of an arrangement to determine the creditworthiness of the customer. Collection is reasonably assured if, based upon evaluation, the Company expects that the customer will be able to pay amounts under the arrangement as payments become due. If the Company determines that collection is not reasonably assured, revenues are deferred and recognized upon the receipt of cash.
The Company enters into agreements and open market bidding programs to provide demand response services. Demand response revenues are earned based on the Company's ability to deliver committed capacity. Energy event revenue, which reflects additional payments made to the Company for the amount of energy usage it actually curtails from the grid, is contingent revenue earned based upon the actual amount of energy provided during the demand response event.
The Company recognizes demand response revenue when it has provided verification to the grid operator or utility of its ability to deliver the committed capacity which entitles it to payments under the agreement or open market bidding program. Committed capacity is verified through the results of an actual demand response event or a measurement and verification test. Once the capacity amount has been generally verified, the revenue is recognized and future revenue becomes fixed or determinable and is recognized monthly until the next demand response event or test. In subsequent verification events, if the Company's verified capacity is below the previously verified amount, the customer will reduce future payments based on the adjusted verified capacity amounts. Ongoing demand response revenue recognized between demand response events or tests that are not subject to penalty or customer refund are recognized in revenue. If the revenue is subject to refund and the amount of refund cannot be reliably estimated, the revenue is deferred until the right of refund lapses.
Certain of the forward capacity programs in which the Company participates may be deemed derivative contracts under ASC 815, Derivatives and Hedging (formerly SFAS No. 133, Accounting for Derivative and Hedging Activities). In such situations, the Company believes it meets the scope exception under ASC 815 as a normal purchase, normal sale as that term is defined in ASC and, accordingly, the arrangement is not treated as a derivative contract.
Revenue from energy events is recognized when earned. Energy event revenue is deemed to be substantive and represents the culmination of a separate earnings process and is recognized when the energy event is initiated by the customer.
Cost of Revenues
Cost of revenues for demand response services consists primarily of payments made to the Company's commercial, institutional and industrial customers for their participation in the demand response network. The Company generally enters into three to five year contracts with commercial,
F-17
EnerNOC, Inc.
NOTES TO CONSOLIDATED FINANCIAL STATEMENTS (Continued)
(in thousands, except share and per share data)
1. Description of Business, Basis of Presentation and Summary of Significant Accounting Policies (Continued)
institutional and industrial customers under which it delivers recurring cash payments to them for the capacity they commit to make available on demand. The Company also generally makes an additional payment when a commercial, institutional or industrial customer reduces consumption of energy from the electric power grid. The equipment and installation costs for devices, which monitor energy usage, communicate with sites and, in certain instances, remotely control energy usage to achieve committed capacity, at commercial, institutional and industrial customer sites are capitalized and depreciated over the lesser of the remaining estimated customer relationship period, or the estimated useful life of the equipment, and this depreciation is reflected in cost of revenues. The Company also includes in cost of revenues the monthly telecommunications and data costs incurred as a result of being connected to commercial, institutional and industrial customer sites and internal payroll and related costs allocated to a commercial, institutional or industrial customer site. Cost of revenues for energy management services include third party services, equipment depreciation and the wages and associated benefits that the Company pays to its project managers for the performance of their services.
Research and Development Expenses
Research and development expenses consist primarily of (a) salaries and related personnel costs, including costs associated with share-based payment awards, related to the Company's research and development organization, (b) payments to suppliers for design and consulting services, (c) costs relating to the design and development of new services and enhancement of existing services, (d) quality assurance and testing and (e) other related overhead. Costs incurred in research and development are expensed as incurred.
Stock-Based Compensation
As of December 31, 2009, the Company had one stock-based compensation plan, which is more fully described in Note 10 below. Through December 31, 2005, the Company accounted for its stock-based awards to employees using the intrinsic value method. Under the intrinsic value method, compensation expense was measured on the date of grant as the difference between the deemed fair value of the Company's common stock and the stock option exercise price or restricted stock award purchase price multiplied by the number of stock options or restricted stock awards granted. Generally, the Company grants stock-based awards with exercise prices equal to the estimated fair value of its common stock; however, to the extent that the deemed fair value of the common stock exceeded the exercise or purchase price of stock-based awards granted to employees on the date of grant, the Company amortized the expense over the vesting schedule of the awards, generally four years.
Effective as of January 1, 2006, the Company adopted the requirements of ASC 718, Stock Compensation (formerly SFAS 123(R), Share-Based Payments). As such, all share-based payments to employees, including grants of stock options, restricted stock and restricted stock units, are recognized in the statement of operations based on their fair values as of the date of grant. The Company adopted ASC 718 using the "modified prospective" transition method, in which compensation cost is recognized beginning with the effective date (a) based on the requirements of ASC 718 for all share-based payments granted after the effective date and (b) based on the requirements of ASC 718 for all awards granted to employees prior to the effective date of ASC 718 that remain unvested on the effective date.
F-18
EnerNOC, Inc.
NOTES TO CONSOLIDATED FINANCIAL STATEMENTS (Continued)
(in thousands, except share and per share data)
1. Description of Business, Basis of Presentation and Summary of Significant Accounting Policies (Continued)
As a result, the Company is recognizing compensation for the fair value of the unvested portion of option grants issued prior to the adoption of ASC 718, whose fair value was calculated utilizing a Black-Scholes option pricing model. In March 2005, the Securities and Exchange Commission (SEC) issued SAB No. 107, Share-Based Payment, relating to ASC 718. The Company has applied applicable provisions of SAB No. 107 in its adoption of ASC 718. In accordance with the modified-prospective transition method of ASC 718, results for prior periods have not been restated. For stock options granted on or after January 1, 2009, the fair value of each option has been and will be estimated on the date of grant using a trinomial valuation model. The trinomial model considers characteristics of fair value option pricing that are not available under the Black-Scholes model. Similar to the Black-Scholes model, the trinomial model takes into account variables such as expected volatility, dividend yield rate, and risk free interest rate. However, in addition, the trinomial model considers the probability that the option will be exercised prior to the end of its contractual life and the probability of termination or retirement of the option holder in computing the value of the option. For these reasons, the Company believes that the trinomial model provides a fair value that is more representative of actual experience and future expected experience than that value calculated using the Black-Scholes model. Stock-based compensation to employees for the years ended December 31, 2009, 2008 and 2007 was $13,107, $10,377 and $7,318, respectively. For additional information regarding stock-based compensation see Note 10.
The Company accounts for transactions in which services are received from non-employees in exchange for equity instruments based on the fair value of such services received or of the equity instruments issued, whichever is more reliably measured. During the years ended December 31, 2009, 2008 and 2007, the Company recognized $27, $62 and $279, respectively, of stock-based compensation to non-employees.
Foreign Currency Translation
The financial statements of the Company's international subsidiaries are translated in accordance with ASC 830, Foreign Currency Matters (formerly SFAS No. 52, Foreign Currency Translation), into the Company's reporting currency, which is the United States dollar. The functional currencies of the Company's subsidiaries in Canada and the United Kingdom are the Canadian dollar and the British pound, respectively. Assets and liabilities are translated to the United States dollar from the local functional currency at the exchange rate in effect at each balance sheet date. Before translation, the Company re-measures foreign currency denominated assets and liabilities, including inter-company accounts receivable and payable, into the functional currency of the respective entity, resulting in unrealized gains or losses recorded in other (expense) income, net in the consolidated statement of operations. Revenues and expenses are translated using average exchange rates during the respective period. Foreign currency translation adjustments are recorded as a component of other comprehensive loss and included in accumulated other comprehensive loss within stockholders' (deficit) equity. Gains (losses) arising from transactions denominated in foreign currencies are included in other (expense) income, net on the consolidated statements of operations and were $29, $0 and $0 for the years ended December 31, 2009, 2008 and 2007, respectively.
F-19
EnerNOC, Inc.
NOTES TO CONSOLIDATED FINANCIAL STATEMENTS (Continued)
(in thousands, except share and per share data)
1. Description of Business, Basis of Presentation and Summary of Significant Accounting Policies (Continued)
Comprehensive Income (Loss)
Comprehensive income (loss) is defined as the change in equity of a business enterprise during a period from transactions and other events and circumstances from non-owner sources. Comprehensive income (loss) is composed of net income (loss), unrealized gains and losses on marketable securities and cumulative foreign currency translation adjustments. As of December 31, 2009, accumulated other comprehensive loss was comprised solely of cumulative foreign currency translation adjustments. As of December 31, 2008, accumulated other comprehensive loss was comprised of $91 of cumulative foreign translation adjustments offset by $5 of unrealized gain on marketable securities, net of tax.
Recent Accounting Pronouncements
In September 2009, the FASB ratified ASC Update No. 2009-13, Multiple-Deliverable Revenue Arrangements (ASU 2009-13). ASU 2009-13 amends existing revenue recognition accounting pronouncements that are currently within the scope of FASB ASC Subtopic 605-25 (previously included within EITF Issue No. 00-21, Revenue Arrangements with Multiple Deliverables (EITF 00-21)). This consensus provides for two significant changes to the existing multiple element revenue recognition guidance. First, this guidance deletes the requirement to have objective and reliable evidence of fair value for undelivered elements in an arrangement and will result in more deliverables being treated as separate units of accounting. The second change modifies the manner in which the transaction consideration is allocated across the separately identified deliverables. These changes may result in entities recognizing more revenue up-front, and entities will no longer be able to apply the residual method and defer the fair value of undelivered elements. Upon adoption of these new rules, each separate unit of accounting must have a selling price, which can be based on management's estimate when there is no other means to determine the fair value of that undelivered item, and the arrangement consideration is allocated based on the elements' relative selling price. This accounting guidance is effective no later than fiscal years beginning on or after June 15, 2010 but may be adopted early as of the first quarter of an entity's fiscal year. Entities may elect to adopt this accounting guidance either through prospective application to all revenue arrangements entered into or materially modified after the date of adoption or through a retrospective application to all revenue arrangements for all periods presented in the financial statements. The Company is currently evaluating the impact of this revised accounting guidance, including the period in which the Company will adopt this guidance.
In April 2009, the FASB issued FASB Staff Positions (FSP) FAS 115-2 and FAS 124-2, Recognition and Presentation of Other-Than-Temporary Impairment (FSP 115-2/124-2) (codified within ASC 320, Investments—Debt and Equity Securities). FSP 115-2/124-2 amends the requirements for the recognition and measurement of other-than-temporary impairments for debt securities by modifying the pre-existing "intent and ability" indicator. Under this FSP, an other-than-temporary impairment is triggered when there is intent to sell the security, it is more likely than not that the security will be required to be sold before recovery, or the security is not expected to recover the entire amortized cost basis of the security. Additionally, this FSP changes the presentation of an other-than-temporary impairment in the income statement for those impairments involving credit losses. The credit loss component will be recognized in earnings and the remainder of the impairment will be recorded in other comprehensive income. FSP 115-2/124-2 was effective for the Company beginning with the second quarter of fiscal
F-20
EnerNOC, Inc.
NOTES TO CONSOLIDATED FINANCIAL STATEMENTS (Continued)
(in thousands, except share and per share data)
1. Description of Business, Basis of Presentation and Summary of Significant Accounting Policies (Continued)
2009. The adoption of this FSP did not have a significant impact on the Company's consolidated financial statements.
In December 2007, the FASB issued ASC 805, Business Combinations (formerly SFAS No. 141 (Revised 2007), Business Combinations (SFAS 141(R)). SFAS 141(R) retains the fundamental requirements in SFAS 141 that the acquisition method of accounting, which SFAS 141 called the purchase method, be used for all business combinations and for an acquirer to be identified for each business combination. ASC 805 requires an acquirer to recognize the assets acquired, the liabilities assumed, and any non-controlling interest in the acquiree at the acquisition date, measured at their fair values as of that date, with limited exceptions specified in SFAS 141(R). ASC 805 replaces SFAS 141's cost-allocation process, which required the cost of an acquisition to be allocated to the individual assets acquired and liabilities assumed based on their estimated fair values. SFAS 141(R) retains the guidance in SFAS 141 for identifying and recognizing intangible assets separately from goodwill. ASC 805 requires acquisition costs to be expensed as incurred, and changes in deferred tax asset valuation allowances and income tax uncertainties after the acquisition date generally to affect income tax expense. ASC 805 applies prospectively to business combinations for which the acquisition date is on or after the beginning of the first annual reporting period beginning on or after December 15, 2008, which was the Company's 2009 fiscal year. Accordingly, the Company's acquisitions of eQ and Cogent in 2009 were accounted for in accordance with ASC 805.
In April 2008, the FASB issued FASB FSP No. 142-3, Determination of the Useful Life of Intangible Assets (codified within ASC 350, Intangibles—Goodwill and Other), which amends the factors that must be considered in developing renewal or extension assumptions used to determine the useful life over which to amortize the cost of a recognized intangible asset under ASC 350. The objective of FSP No. 142-3 is to improve the consistency between the useful life of a recognized intangible asset under ASC 350 and the period of expected cash flows used to measure the fair value of the asset under ASC 805. FSP No. 142-3 is effective for financial statements for fiscal years beginning after December 15, 2008, which was the beginning of fiscal 2009 for the Company. The adoption of this standard did not have a significant impact on the Company's consolidated financial statements.
In June 2009, the FASB issued SFAS No. 168, The FASB Accounting Standards Codification and the Hierarchy of Generally Accepted Accounting Principles (codified within ASC 105, Generally Accepted Accounting Principles), which establishes the FASB ASC as the single source of authoritative GAAP (the Codification). The Codification will supersede all existing non-SEC accounting and reporting standards. As a result, upon adoption, all references to accounting literature in the Company's SEC filings will conform to the appropriate reference within the Codification.
2. Acquisitions
Cogent Energy, Inc.
In December 2009, the Company acquired all of the outstanding stock of Cogent, a company specializing in comprehensive energy consulting, engineering and building commissioning solutions to commercial, institutional and industrial customers. The total purchase price paid by the Company at closing was approximately $11,172, of which $6,555 was paid in cash and the remainder of which was
F-21
EnerNOC, Inc.
NOTES TO CONSOLIDATED FINANCIAL STATEMENTS (Continued)
(in thousands, except share and per share data)
2. Acquisitions (Continued)
paid by the issuance of 114,281 shares of the Company's common stock that had a fair value of approximately $3,162. These shares were measured as of the acquisition date using the closing price of the Company's common stock, as reported on The NASDAQ Global Market on December 4, 2009. In addition to the amounts paid at closing, the Company may be obligated to pay an earn-out amount of $1,500. The earn-out payment, if any, will be based on the achievement of a certain minimum revenue-based milestone and a certain earnings-based milestone of Cogent for the year ended December 31, 2010 and will be paid in cash. Both of these milestones need to be achieved in order for the earn-out payment to occur and there will be no partial payment if the milestones are not fully achieved. The Company believes that it is remote that the earn-out payment will not be made. The fair value of the earn-out payment of $1,455 is being recorded as additional purchase price as of the acquisition date. As the Company believes that it is remote that the earn-out payment will not be made, the Company determined the fair value of the earn-out payment based on the present value of the $1,500, which will be paid in December 2010. The Company calculated the present value using the Company's short-term borrowing rate of approximately 3%. There was no change in fair value of the contingent consideration from the date of the acquisition through December 31, 2009. By integrating Cogent's commissioning and engineering experience into the Company's monitoring-based commissioning energy efficiency application, the Company believes that it will be able to deliver more value to its rapidly growing customer base.
Transaction costs related to this business combination were not material and have been expensed as incurred, which are included in general and administrative expenses in the accompanying consolidated statements of operations. The Company's consolidated financial statements reflect Cogent's results of operations from December 4, 2009 forward.
The allocation of the purchase price is based upon preliminary estimates of the fair value of assets acquired and liabilities assumed as of December 4, 2009. The Company is in the process of gathering information to finalize its valuation of certain assets and liabilities. The purchase price allocation is preliminary and will be finalized once the Company has all necessary information to complete its estimate, but generally no later than one year from the date of acquisition. The components and initial allocation of the purchase price consists of the following approximate amounts:
Net tangible assets acquired as of December 4, 2009 |
$ | 1,445 | ||
Customer relationships |
1,400 | |||
Non-compete agreements |
590 | |||
Trade name |
200 | |||
Goodwill |
7,537 | |||
Total |
$ | 11,172 | ||
F-22
EnerNOC, Inc.
NOTES TO CONSOLIDATED FINANCIAL STATEMENTS (Continued)
(in thousands, except share and per share data)
2. Acquisitions (Continued)
Net tangible assets acquired in the acquisition of Cogent primarily related to the following:
Cash |
$ | 336 | ||
Accounts receivable |
1,882 | |||
Prepaids and other assets |
55 | |||
Accounts payable |
(320 | ) | ||
Accrued expenses |
(508 | ) | ||
Total |
$ | 1,445 | ||
Identifiable Intangible Assets
As part of the preliminary purchase price allocation, the Company determined that Cogent's identifiable intangible assets include customer relationships, non-compete agreements and trade name.
The Company used the income approach to value the customer relationships and non-compete agreements. This approach calculates fair value by discounting the after-tax cash flows back to a present value. The baseline data for this analysis was the cash flow estimates used to price the transaction. Cash flows were forecasted for each intangible asset then discounted based on an appropriate discount rate. The discount rates applied, which ranged between 17% and 19%, were benchmarked with reference to the implied rate of return from the transaction model as well as a market-participant's weighted average cost of capital based on the capital asset pricing model.
In estimating the useful life of the acquired assets, the Company considered ASC 350-30-35 (formerly paragraph 11 of SFAS No. 142, Goodwill and Other Intangible Assets), which lists the pertinent factors to be considered when estimating the useful life of an intangible asset. These factors included a review of the expected use by the combined company of the assets acquired, the expected useful life of another asset (or group of assets) related to the acquired assets, legal, regulatory or other contractual provisions that may limit the useful life of an acquired asset or may enable the extension of the useful life of an acquired asset without substantial cost, the effects of obsolescence, demand, competition and other economic factors, and the level of maintenance expenditures required to obtain the expected future cash flows from the asset. The Company is amortizing these intangible assets over their estimated useful lives using a method that is based on estimated future cash flows, as the Company believes this will approximate the pattern in which the economic benefits of the assets will be utilized, or on a straight-line basis if it was deemed that the cash flows were not reliably determinable.
Subsequent to the acquisition, the Company concluded that the trade name intangible asset was impaired by $135. This impairment charge was recorded in the fourth quarter of 2009 to general and administrative expenses and has not modified the above noted purchase price allocation.
The factors contributing to the recognition of this amount of goodwill were based upon several strategic and synergistic benefits that were expected to be realized from the combination.
Pro forma information has not been provided for this acquisition since the impact to the consolidated financial statements was not material.
F-23
EnerNOC, Inc.
NOTES TO CONSOLIDATED FINANCIAL STATEMENTS (Continued)
(in thousands, except share and per share data)
2. Acquisitions (Continued)
eQuilibrium Solutions Corporation
In June 2009, the Company acquired substantially all of the assets of eQ, a software company specializing in the development of enterprise sustainability management products and services. The total purchase price paid by the Company at closing was approximately $751, of which $250 was paid in cash and the remainder of which was paid by the issuance of 21,464 shares of the Company's common stock that had a value of approximately $501. These shares were measured as of the acquisition date using the closing price of the Company's common stock, as reported on The NASDAQ Global Market on June 11, 2009.
Transaction costs related to this business combination were not material and have been expensed as incurred, which are included in general and administrative expenses in the accompanying consolidated statements of operations. The Company's consolidated financial statements reflect eQ's results of operations from June 11, 2009 forward.
The financial information below reflects the final allocation of the purchase price.
Property and equipment |
$ | 26 | ||
Customer relationships |
390 | |||
Trade name |
50 | |||
Software |
120 | |||
Non-compete agreements |
12 | |||
Goodwill |
153 | |||
Total |
$ | 751 | ||
South River Consulting, LLC
In May 2008, the Company acquired 100% of the membership interests of SRC, an energy procurement and risk management services provider, for a purchase price equal to $5,524, which consisted of $3,603 in cash, $174 in related expenses and 120,000 shares of the Company's common stock that had a value of approximately $1,747 as of the closing date. In addition to the amounts paid at closing, the Company incurred a contingent obligation to pay to the former holders of SRC membership interests an earn-out amount equal to 50% to 60% of the revenues of SRC's business during each twelve-month period from May 1, 2008 through April 30, 2010, which would be recognized as additional purchase price when earned. The earn-out payments, if any, are based on the achievement of certain minimum revenue-based milestones of SRC, are paid in a combination of cash and shares of the Company's common stock and are recorded as additional purchase price. The additional purchase price recorded in the second quarter of 2009, which was related to the May 1, 2008 to April 30, 2009 earn-out period, totaled $1,468, of which $734 was paid in cash during the second quarter of 2009 and the remainder of which was paid by the issuance of 44,776 shares of the Company's common stock during the third quarter of 2009. The final earn-out payment, if any, related to the May 1, 2009 through April 30, 2010 earn-out period will be determined during the second quarter of 2010.
F-24
EnerNOC, Inc.
NOTES TO CONSOLIDATED FINANCIAL STATEMENTS (Continued)
(in thousands, except share and per share data)
2. Acquisitions (Continued)
Mdenergy, LLC
In September 2007, the Company acquired 100% of the membership interests of MDE, an energy procurement service provider, pursuant to the terms of a merger agreement. The total purchase price paid by the Company at closing was approximately $7,900, of which $3,501 was paid in cash and the remainder of which was paid by the issuance of 139,056 shares of the Company's common stock that had a value of approximately $4,399 as of the closing date. In addition to the amounts paid at closing, the Company was obligated to pay to the former holders of MDE membership interests an earn-out payment equal to two times the revenues of MDE's business during the period from July 1, 2007 through December 31, 2007. The contingent consideration related to the earn-out payment in the amount of approximately $3,357 was paid in January 2008 and was recorded as additional purchase price.
Pursuant to the merger agreement, the Company was also obligated to pay to certain employees of MDE a cash bonus payment of up to $300 in the first quarter of 2008 and up to $600 in the first quarter of 2009 upon the achievement of certain revenue-based milestones during 2007 and 2008, respectively. The amounts actually earned by, and paid to, the MDE employees in connection with the achievement of the revenue-based milestones during 2007 and 2008 were $300 and $500, respectively, and were charged to operations.
3. Net Loss Per Share
A reconciliation of basic and diluted share amounts for fiscal years 2009, 2008, and 2007 are as follows:
| |
Year Ended December 31, | ||||||||||
|---|---|---|---|---|---|---|---|---|---|---|---|
| |
2009 | 2008 | 2007 | ||||||||
Numerator: |
|||||||||||
Net loss |
$ | (6,829 | ) | $ | (36,662 | ) | $ | (23,582 | ) | ||
Denominator: |
|||||||||||
Basic weighted average common shares outstanding |
21,467 | 19,505 | 13,106 | ||||||||
Weighted average common stock equivalents |
— | — | — | ||||||||
Diluted weighted average common shares outstanding |
21,467 | 19,505 | 13,106 | ||||||||
Basic net loss per common share |
$ | (0.32 | ) | $ | (1.88 | ) | $ | (1.80 | ) | ||
Diluted net loss per common share |
$ | (0.32 | ) | $ | (1.88 | ) | $ | (1.80 | ) | ||
Weighted average anti-dilutive shares related to: |
|||||||||||
Stock options |
3,239 | 2,841 | 2,765 | ||||||||
Nonvested restricted stock |
200 | 280 | 167 | ||||||||
Restricted stock units |
106 | — | — | ||||||||
Escrow shares |
129 | 100 | 10 | ||||||||
The Company excludes the shares issued in connection with restricted stock awards from the calculation of basic weighted average common shares outstanding until such time as those shares vest, as the employee does not bear the risks or rewards of ownership until those shares have vested.
F-25
EnerNOC, Inc.
NOTES TO CONSOLIDATED FINANCIAL STATEMENTS (Continued)
(in thousands, except share and per share data)
3. Net Loss Per Share (Continued)
In connection with certain of the Company's business combinations, the Company has issued shares that were held in escrow upon closing of the applicable business combination. The Company excludes shares held in escrow from the calculation of basic weighted average common shares outstanding where the release of such shares is contingent upon an event and not solely subject to the passage of time.
For the years ended December 31, 2009, 2008 and 2007, anti-dilutive shares comprise the impact of those number of shares that would have been dilutive had the Company had net income plus the number of shares that would have been anti-dilutive had the Company had net income.
4. Marketable Securities
As of December 31, 2009, the Company no longer has investments in marketable securities. This is a result of a bond that matured in the second quarter of 2009.
Marketable securities at December 31, 2008 were classified as "available-for-sale." The Company's investments in securities included agency and municipal bonds. Available-for-sale securities are carried at fair value, with the unrealized gains and losses reported in a separate component of accumulated other comprehensive loss in stockholders' (deficit) equity. The cost of debt securities that are deemed available-for-sale securities is adjusted for amortization of premiums and accretion of discounts to maturity. Such amortization and accretion are included in interest and other income. Realized gains and losses and declines in value judged to be other-than-temporary on available-for-sale securities and other investments are included in investment income. For the year ended December 31, 2008, there was $5 of unrealized gains on the Company's marketable securities. The Company periodically evaluates these investments for impairment. When a decline in fair value is deemed to be other-than-temporary, the Company records an impairment adjustment in the statement of operations. As of December 31, 2008, the Company held no securities in an unrealized loss position. Therefore, the Company concluded there was no other-than-temporary impairment on any of its marketable securities as of December 31, 2008.
The cost of securities sold is based on the specific identification method. Interest and dividends on securities classified as available-for-sale are included in interest and other income.
The following is a summary of the Company's available-for-sale marketable securities as of December 31, 2008:
| |
Gross unrealized | |||||||||||||
|---|---|---|---|---|---|---|---|---|---|---|---|---|---|---|
As of December 31, 2008
|
Amortized Cost |
Gains | Losses | Fair value | ||||||||||
Commercial paper |
$ | 1,499 | $ | 1 | $ | — | $ | 1,500 | ||||||
Government securities |
496 | 4 | — | 500 | ||||||||||
Total |
$ | 1,995 | $ | 5 | $ | — | $ | 2,000 | ||||||
F-26
EnerNOC, Inc.
NOTES TO CONSOLIDATED FINANCIAL STATEMENTS (Continued)
(in thousands, except share and per share data)
5. Fair Value Measurements
ASC 820 establishes a fair value hierarchy that requires the use of observable market data, when available, and prioritizes the inputs to valuation techniques used to measure fair value in the following categories:
- •
- Level 1—Valuation is based upon quoted prices for identical instruments traded in active markets.
Level 1 instruments include securities traded on active exchange markets, such as the New York Stock Exchange.
- •
- Level 2—Valuation is based upon quoted prices for similar instruments in active markets, quoted prices
for identical or similar instruments in markets that are not active and model-based valuation techniques for which all significant assumptions are observable in the market.
- •
- Level 3—Valuation is generated from model-based techniques that use significant assumptions not observable in the market. These unobservable assumptions reflect the Company's own estimates of assumptions market participants would use in pricing the asset or liability.
The table below presents the balances of assets and liabilities measured at fair value on a recurring basis at December 31, 2009:
| |
Fair Value Measurement at December 31, 2009 Using | ||||||||||||
|---|---|---|---|---|---|---|---|---|---|---|---|---|---|
| |
Totals | Quoted Prices in Active Markets for Identical Assets (Level 1) |
Significant Other Observable Inputs (Level 2) |
Unobservable Inputs (Level 3) |
|||||||||
Money market funds(1) |
$ | 100,520 | $ | 100,520 | $ | — | $ | — | |||||
|
$ | 100,520 | $ | 100,520 | $ | — | $ | — | |||||
- (1)
- Included in cash and cash equivalents in the accompanying consolidated balance sheets.
With respect to assets measured at fair value on a non-recurring basis, which would be impaired long-lived assets, refer to Note 1 for discussion of the determination of fair value of these assets. With respect to liabilities measured at fair value on a non-recurring basis, which would be contingent consideration liability, refer to Note 2 for discussion of the determination of fair value of this liability.
At December 31, 2009, the Company had restricted cash of approximately $7,874 invested in certificates of deposit. All certificates of deposit have contractual maturities of twelve months or less. The Company's investments in certificates of deposit have a fair value that approximates cost.
The carrying amounts of cash and cash equivalents, restricted cash, trade accounts receivable, accounts payable and accrued expenses included in the consolidated balance sheets approximate fair value given the short-term nature of these financial instruments.
6. Allowance for Doubtful Accounts
The Company reduces gross trade accounts receivable by an allowance for doubtful accounts. The allowance for doubtful accounts is the Company's best estimate of the amount of probable credit losses in the Company's existing accounts receivable. The Company reviews its allowance for doubtful
F-27
EnerNOC, Inc.
NOTES TO CONSOLIDATED FINANCIAL STATEMENTS (Continued)
(in thousands, except share and per share data)
6. Allowance for Doubtful Accounts (Continued)
accounts on a regular basis and all past due balances are reviewed individually for collectibility. Account balances are charged off against the allowance after all means of collection have been exhausted and the potential for recovery is considered remote. Provisions for allowance for doubtful accounts are recorded in general and administrative expenses. Below is a summary of the changes in the Company's allowance for doubtful accounts for the years ended December 31, 2009, 2008 and 2007.
| |
Balance at Beginning of Period |
Additions Charged to Expense |
Deductions—Write- offs, Payments and Other Adjustments |
Balance at End of Period |
|||||||||
|---|---|---|---|---|---|---|---|---|---|---|---|---|---|
Year ended December 31, 2009 |
$ | 37 | $ | 33 | $ | 13 | $ | 57 | |||||
Year ended December 31, 2008 |
$ | 368 | $ | — | $ | 331 | $ | 37 | |||||
Year ended December 31, 2007 |
$ | 7 | $ | 361 | $ | — | $ | 368 | |||||
7. Property and Equipment
Property and equipment as of December 31, 2009 and December 31, 2008 consisted of the following:
| |
Estimated Useful Life (Years) | December 31, 2009 | December 31, 2008 | ||||||
|---|---|---|---|---|---|---|---|---|---|
Computers and office equipment |
3 | $ | 10,549 | $ | 9,244 | ||||
Software |
2 - 3 | 9,874 | 5,712 | ||||||
Demand response equipment |
Lesser of useful life or estimated commercial, institutional and industrial customer relationship period | 17,362 | 9,771 | ||||||
Back-up generators |
5 - 10 | 10,431 | 10,715 | ||||||
Furniture and fixtures |
5 | 1,072 | 840 | ||||||
Leasehold improvements |
Lesser of the useful life or original lease term | 1,952 | 1,398 | ||||||
Assets under capital lease |
Lesser of the useful life or original lease term | 222 | 222 | ||||||
Construction-in-progress |
2,302 | 1,318 | |||||||
|
53,764 | 39,220 | |||||||
Accumulated depreciation |
(22,420 | ) | (12,245 | ) | |||||
Property and equipment, net |
$ | 31,344 | $ | 26,975 | |||||
Depreciation expense was $11,357, $8,035 and $3,218 for the years ended December 31, 2009, 2008 and 2007, respectively. For the years ended December 31, 2009, 2008 and 2007, $5,415, $3,193 and $1,694, respectively, were included in cost of revenues, and $5,942, $4,842 and $1,524, respectively, were included in general and administrative expenses. The amortization expense related to assets under capital leases was included within the Company's depreciation expense for the years ended December 31, 2009, 2008 and 2007. As of December 31, 2009 and 2008, total accumulated amortization expense related to assets under capital leases was $142 and $102, respectively.
F-28
EnerNOC, Inc.
NOTES TO CONSOLIDATED FINANCIAL STATEMENTS (Continued)
(in thousands, except share and per share data)
8. Financing Arrangements
On August 5, 2008, the Company and one of its subsidiaries entered into a $35,000 secured revolving credit and term loan facility with SVB pursuant to a loan and security agreement, which was subsequently amended on May 29, 2009 (the Credit Facility). Pursuant to the terms of the Credit Facility, SVB will, among other things, make revolving credit and term loan advances and issue letters of credit for the Company's account. The interest on loans under the Company's revolving credit loan accrues at interest rates based upon either SVB's prime rate or the 30, 60 or 90-day LIBOR plus 2.25%, at the Company's election. The interest on term loans accrues at SVB's prime rate plus 0.50% or the 30, 60 or 90-day LIBOR plus 2.75%, at the Company's election. The term advance is payable in thirty-six consecutive equal monthly installments of principal, calculated by SVB, based upon the amount of the term advance and an amortization schedule equal to thirty-six months. All unpaid principal and accrued interest is due and payable in full on August 5, 2010, which is the maturity date. In connection with the issuance or renewal of letters of credit for the Company's account, the Company is charged a letter of credit fee of 1.25%. The Company expenses the interest and letter of credit fees, as applicable, in the period incurred.
The Company's obligations under the Credit Facility are secured by all of the assets of the Company and its subsidiaries, excluding any intellectual property. The Credit Facility contains customary terms and conditions for credit facilities of this type, including restrictions on the Company's ability to incur additional indebtedness, create liens, enter into transactions with affiliates, transfer assets, pay dividends or make distributions on, or repurchase, the Company's stock, consolidate or merge with other entities, or suffer a change in control. In addition, the Company is required to meet certain financial covenants customary with this type of credit facility, including maintaining a minimum specified tangible net worth and a minimum specified ratio of current assets to current liabilities. The Credit Facility contains customary events of default, including payment defaults, breaches of representations, breaches of affirmative or negative covenants, cross defaults to other material indebtedness, bankruptcy and failure to discharge certain judgments. If a default occurs and is not cured within any applicable cure period or is not waived, the Company's obligations under the Credit Facility may be accelerated. The Company was in compliance with all financial covenants under the Credit Facility at December 31, 2008 and December 31, 2009.
On October 29, 2009, the Company repaid the outstanding borrowings of $4,442 under the Credit Facility. The Company incurred financing costs of $120 in connection with the Credit Facility, which were deferred and are being amortized to interest expense over the life of the facility, which matures on August 5, 2010. At December 31, 2009, the Company had no borrowings and letters of credit of $30,383 outstanding under the Credit Facility.
In connection with the Company's participation in an open market bidding program, the Company entered into an arrangement with a third party during the second quarter of 2009 to bid capacity into the program and provide the corresponding financial assurance required in connection with the bid. The arrangement included an up-front payment by the Company equal to $2,000, of which $1,100 was expensed as interest expense during the second quarter of 2009 and $900 was deferred and will be recognized ratably as a charge to cost of revenues as revenue is recognized over the 2012/2013 delivery year. In addition, the Company will be required to pay the third party an additional contingent fee, up to a maximum of $3,000, based on the revenue that the Company expects to earn in 2012 in connection with the bid. This additional fee will be recognized as earned as a reduction of revenue.
F-29
EnerNOC, Inc.
NOTES TO CONSOLIDATED FINANCIAL STATEMENTS (Continued)
(in thousands, except share and per share data)
8. Financing Arrangements (Continued)
The Company leases certain of its office equipment under non-cancelable capital leases, which expire through 2011. The majority of the office equipment leases require payments for additional expenses such as taxes. The following is a summary of debt and capital leases as of December 31, 2009 and 2008:
| |
December 31, 2009 |
December 31, 2008 |
|||||
|---|---|---|---|---|---|---|---|
SVB Credit Facility borrowings |
$ | — | $ | 4,442 | |||
Obligations under capital leases |
73 | 121 | |||||
|
73 | 4,563 | |||||
Less—current maturities |
(36 | ) | (47 | ) | |||
|
$ | 37 | $ | 4,516 | |||
The annual maturities of capital lease obligations are as follows (in thousands):
Year
|
Total | |||
|---|---|---|---|---|
2010 |
$ | 43 | ||
2011 |
39 | |||
|
82 | |||
Less interest |
(9 | ) | ||
|
$ | 73 | ||
9. Stockholders' Equity
Follow-On Public Offering
During the third quarter of 2009, the Company completed an underwritten public offering of an aggregate of 3,963,889 shares of common stock at an offering price of $27.00 per share, which included the sale of 709,026 shares by certain selling stockholders. After deducting underwriting discounts and commissions and offering expenses payable by the Company, the Company received net proceeds of approximately $83.4 million from the offering.
Redeemable Convertible Preferred Stock
Prior to the Company's initial public offering (IPO) on May 18, 2007, the Company had outstanding an aggregate of 3,355,551 shares of Series A, Series A-1, Series B, Series B-1 and Series C Redeemable Convertible Preferred Stock (Preferred Stock). The Preferred Stock had certain dividend, voting, liquidation, conversion and redemption rights. In connection with the completion of the IPO, all outstanding shares of Preferred Stock were converted into an aggregate of 9,499,565 shares of common stock.
F-30
EnerNOC, Inc.
NOTES TO CONSOLIDATED FINANCIAL STATEMENTS (Continued)
(in thousands, except share and per share data)
9. Stockholders' Equity (Continued)
Preferred Stock
In May 2007, the Company's board of directors approved an amendment and restatement of the Company's Certificate of Incorporation to increase the authorized number of shares of common stock to 50,000,000, to authorize 5,000,000 shares of undesignated preferred stock, and to eliminate all references to the designated Series Preferred Stock.
Common Stock
At December 31, 2009, the Company has authorized 50,000,000 shares of common stock, of which 24,233,448 shares were outstanding and 2,190,719 shares have been reserved for issuance under the Company's stock option plan.
10. Stock-Based Compensation
Stock Options
The Company's Amended and Restated 2003 Stock Option and Incentive Plan (2003 Plan) and the 2007 Employee, Director and Consultant Stock Plan (the 2007 Plan, and collectively with the 2003 Plan, the Plans) provide for the grant of incentive stock options, nonqualified stock options, restricted and unrestricted stock awards and other stock-based awards to eligible employees, directors and consultants of the Company. Options granted under the Plans are exercisable for a period determined by the Company, but in no event longer than ten years from the date of the grant. Option awards are generally granted with an exercise price equal to the market price of the Company's common stock at the date of grant. Options, restricted stock awards and restricted stock unit awards generally vest ratably over four years, with certain exceptions. The 2003 Plan expired upon the IPO in May 2007. Any forfeitures after May 2007 under the 2003 Plan are available for future grant under the 2007 Plan. During the years ended December 31, 2009 and 2008, the Company issued 45,085 shares of its common stock and 26,961 shares of its common stock, respectively, to certain executives in lieu of cash to satisfy a portion of the Company's compensation obligations to those individuals. As of December 31, 2009, the shares available for future grant under the 2007 Plan were 2,190,719.
For stock options granted prior to January 1, 2009, the fair value of each option was estimated at the date of grant using a Black-Scholes option-pricing model. For stock options granted on or after January 1, 2009, the fair value of each option has been and will be estimated on the date of grant using a trinomial valuation model. The trinomial model considers characteristics of fair value option pricing that are not available under the Black-Scholes model. Similar to the Black-Scholes model, the trinomial model takes into account variables such as expected volatility, dividend yield rate, and risk free interest rate. However, in addition, the trinomial model considers the probability that the option will be exercised prior to the end of its contractual life and the probability of termination or retirement of the option holder in computing the value of the option. For these reasons, the Company believes that the trinomial model provides a fair value that is more representative of actual experience and future expected experience than that value calculated using the Black-Scholes model.
F-31
EnerNOC, Inc.
NOTES TO CONSOLIDATED FINANCIAL STATEMENTS (Continued)
(in thousands, except share and per share data)
10. Stock-Based Compensation (Continued)
The fair value of options granted was estimated at the date of grant using the following weighted average assumptions:
| |
Year Ended December 31, | |||||||||
|---|---|---|---|---|---|---|---|---|---|---|
| |
2009 | 2008 | 2007 | |||||||
Risk-free interest rate |
3.2 | % | 2.9 | % | 4.6 | % | ||||
Expected term of options, in years(1) |
— | 4.25-6.25 | 6.25 | |||||||
Vesting term, in years(1) |
2.16 | — | — | |||||||
Expected annual volatility |
86 | % | 87 | % | 87 | % | ||||
Expected dividend yield |
— | % | — | % | — | % | ||||
Exit rate pre-vesting(1) |
4.88 | % | — | — | ||||||
Exit rate post-vesting(1) |
10.89 | % | — | — | ||||||
- (1)
- Change in assumptions reflects the Company's use of a trinomial valuation model as of January 1, 2009.
If the Company had continued using the Black-Scholes option pricing model in 2009, stock-based compensation expense would not have been materially different for the year ended December 31, 2009.
Volatility measures the amount that a stock price has fluctuated or is expected to fluctuate during a period. As there was no public market for the Company's common stock prior to the effective date of the IPO, the Company determined the volatility based on an analysis of reported data for a peer group of companies that issued options with substantially similar terms. The expected volatility of options granted has been determined using an average of the historical volatility measures of this peer group of companies, as well as the historical volatility of the Company's common stock beginning January 1, 2008. The risk-free interest rate is the rate available as of the option date on zero-coupon United States government issues with a term equal to the expected life of the option. Prior to the adoption of the trinomial model on January 1, 2009, because the Company did not have a sufficient history to estimate the expected term, the Company used the simplified method for estimating expected term. The simplified method is based on vesting-tranches and the contractual life of each grant. The Company has not paid dividends in the past and does not plan to pay any dividends in the foreseeable future. In addition, the terms of the Credit Facility precludes the Company from paying dividends.
The Company accounts for transactions in which services are received from non-employees in exchange for equity instruments based on the fair value of such services received or of the equity instruments issued, whichever is more reliably measured.
F-32
EnerNOC, Inc.
NOTES TO CONSOLIDATED FINANCIAL STATEMENTS (Continued)
(in thousands, except share and per share data)
10. Stock-Based Compensation (Continued)
The components of stock-based compensation expense are disclosed below:
| |
Year Ended December 31, | |||||||||
|---|---|---|---|---|---|---|---|---|---|---|
| |
2009 | 2008 | 2007 | |||||||
Stock option expense (employees) |
$ | 9,754 | $ | 9,336 | $ | 4,723 | ||||
Stock option expense (non-employees) |
27 | 62 | 279 | |||||||
Founders' stock grants |
— | — | 2,300 | |||||||
Restricted stock |
3,353 | 1,041 | 295 | |||||||
Total |
$ | 13,134 | $ | 10,439 | $ | 7,597 | ||||
Stock based compensation is recorded in the accompanying statements of operations, as follows:
| |
Year Ended December 31, | |||||||||
|---|---|---|---|---|---|---|---|---|---|---|
| |
2009 | 2008 | 2007 | |||||||
Selling and marketing expenses |
$ | 3,989 | $ | 3,692 | $ | 2,150 | ||||
General and administrative expenses |
8,471 | 6,201 | 5,098 | |||||||
Research and development expenses |
674 | 546 | 349 | |||||||
Total |
$ | 13,134 | $ | 10,439 | $ | 7,597 | ||||
The Company recognized no income tax benefit from share-based compensation arrangements during the years ended December 31, 2009, 2008 and 2007. In addition, no compensation cost was capitalized during the years ended December 31, 2009, 2008 and 2007.
F-33
EnerNOC, Inc.
NOTES TO CONSOLIDATED FINANCIAL STATEMENTS (Continued)
(in thousands, except share and per share data)
10. Stock-Based Compensation (Continued)
The following is a summary of the Company's stock option activity as of December 31, 2009 and the stock option activity for all stock option plans during the year ended December 31, 2009:
| |
Year Ended December 31, 2009 | ||||||||||||
|---|---|---|---|---|---|---|---|---|---|---|---|---|---|
| |
Number of Shares Underlying Options |
Exercise Price Per Share |
Weighted- Average Exercise Price Per Share |
Aggregate Intrinsic Value(2) |
|||||||||
Outstanding at beginning of period |
2,746,835 | $0.11 - $48.54 | $ | 13.88 | |||||||||
Granted |
1,161,504 | 14.50 | |||||||||||
Exercised |
(426,744 | ) | 2.53 | $ | 8,267 | ||||||||
Cancelled |
(977,620 | ) | 25.96 | ||||||||||
Outstanding at end of period |
2,503,975 | $0.11 - $48.54 | 10.84 | $ | 49,599 | ||||||||
Weighted average remaining contractual life in years: 6.9 |
|||||||||||||
Exercisable at end of period |
901,280 | $0.11 - $48.54 | $ | 7.71 | $ | 20,763 | |||||||
Weighted average remaining contractual life in years: 7.0 |
|||||||||||||
Vested or expected to vest at December 31, 2009(1) |
2,448,979 | $0.11 - $48.54 | $ | 10.69 | $ | 48,897 | |||||||
- (1)
- This
represents the number of vested options as of December 31, 2009 plus the number of unvested options expected to vest as of December 31,
2009 based on the unvested options outstanding at December 31, 2009, adjusted for the estimated forfeiture rate of 10.89%.
- (2)
- The aggregate intrinsic value was calculated based on the positive difference between the estimated fair value of the Company's common stock on December 31, 2009 of $30.39 and the exercise price of the underlying options.
If the Company had continued using the Black-Scholes option pricing model in 2009, stock-based compensation expense would not have been materially different for the year ended December 31, 2009.
In December 2008, the Company's board of directors approved a one-time offer to the Company's employees, including its executive officers, and directors to exchange option grants that had an exercise price per share that was equal to or greater than the higher of $12.00 or the closing price of the Company's common stock as reported on The NASDAQ Global Market on January 21, 2009 (the Exchange). The Exchange closed on January 21, 2009, and the Company exchanged options that had exercise prices equal to or greater than $12.00 per share. As a result, an aggregate of 744,401 options, with exercise prices ranging from $12.27 to $48.54 per share, were exchanged for 424,722 options with an exercise price per share of $8.63 for employees who are not also executive officers of the Company, 142,179 options with an exercise price per share of $11.47 for executive officers who are not also directors of the Company and 45,653 options with an exercise price per share of $12.94 for the Company's directors. On the date of the Exchange, the estimated fair value of the new options did not exceed the fair value of the exchanged stock options calculated immediately prior to the Exchange. As
F-34
EnerNOC, Inc.
NOTES TO CONSOLIDATED FINANCIAL STATEMENTS (Continued)
(in thousands, except share and per share data)
10. Stock-Based Compensation (Continued)
such, there was no incremental fair value of the new options, and the Company will not record additional compensation expense related to the Exchange. The Company will continue to recognize the remaining compensation expense related to the exchanged options over the remaining vesting period of the original options.
Additional Information About Stock Options
| |
Year Ended December 31, | |||||||||
|---|---|---|---|---|---|---|---|---|---|---|
In thousands, except share and per share amounts
|
2009 | 2008 | 2007 | |||||||
Total number of options granted during the year |
1,161,504 | 707,151 | 1,159,647 | |||||||
Weighted-average fair value per share of options granted |
$ | 13.16 | $ | 14.80 | $ | 18.82 | ||||
Total intrinsic value of options exercised(1) |
$ | 8,267 | $ | 4,799 | $ | 17,078 | ||||
- (1)
- Difference between the market price at exercise and the price paid to exercise the options.
Of the stock options outstanding as of December 31, 2009, 2,480,724 options were held by employees and 23,251 options were held by non-employees. Subsequent to the $9,754 of stock-based compensation expense recognized for the year ended December 31, 2009 related to stock options held by employees, the amount of stock-based compensation expense that may be recognized for outstanding, unvested options as of December 31, 2009 was $16,510, which is to be recognized over a weighted average period of 2.2 years. The amount of stock-based compensation for unvested non-employee options to be recognized in future periods was not material as of December 31, 2009.
Restricted Stock and Restricted Stock Units
For non-vested restricted stock and restricted stock units outstanding as of December 31, 2009, the Company had $4,897 of unrecognized stock-based compensation expense, which is expected to be recognized over a weighted average period of 2.4 years.
Restricted Stock
The following table summarizes the Company's restricted stock activity during the year ended December 31, 2009:
| |
Number of Shares |
Weighted Average Grant Date Fair Value Per Share |
|||||
|---|---|---|---|---|---|---|---|
Nonvested at December 31, 2008 |
276,534 | $ | 21.13 | ||||
Granted |
81,750 | 28.06 | |||||
Vested |
(159,603 | ) | 21.34 | ||||
Cancelled |
(10,063 | ) | 31.34 | ||||
Nonvested at December 31, 2009 |
188,618 | $ | 23.42 | ||||
F-35
EnerNOC, Inc.
NOTES TO CONSOLIDATED FINANCIAL STATEMENTS (Continued)
(in thousands, except share and per share data)
10. Stock-Based Compensation (Continued)
All shares underlying awards of restricted stock are restricted in that they are not transferable until they vest. The shares typically vest ratably over a four year period from the date of issuance, with certain exceptions. The fair value of the restricted stock is expensed ratably over the vesting period. The shares of restricted stock have been issued at no cost to the recipients, except for the 152,460 shares of restricted stock granted in 2006 that were purchased for $0.51 per share. The Company records the proceeds received for unvested shares in accrued expenses. The amount is amortized into additional paid-in capital as the shares vest. If the employee who received the restricted stock leaves the Company prior to the vesting date for any reason, the shares of restricted stock will be forfeited and returned to the Company.
Additional Information About Restricted Stock
| |
Year Ended December 31, | |||||||||
|---|---|---|---|---|---|---|---|---|---|---|
In thousands, except share and per share amounts
|
2009 | 2008 | 2007 | |||||||
Total number of shares of restricted stock granted during the year |
81,750 | 177,500 | 45,500 | |||||||
Weighted average fair value per share of restricted stock granted |
$ | 28.06 | $ | 26.41 | $ | 35.20 | ||||
Total number of shares of restricted stock vested during the year |
159,603 | 54,135 | 43,291 | |||||||
Total fair value of shares of restricted stock vested during the year |
$ | 3,088 | $ | 907 | $ | 2,127 | ||||
Restricted Stock Units
The following table summarizes the Company's restricted stock unit activity during the year ended December 31, 2009:
| |
Number of Shares |
Weighted Average Grant Date Fair Value Per Share |
|||||
|---|---|---|---|---|---|---|---|
Nonvested at December 31, 2008 |
— | $ | — | ||||
Granted |
123,000 | 11.55 | |||||
Vested |
— | — | |||||
Cancelled |
(9,000 | ) | 11.55 | ||||
Nonvested at December 31, 2009 |
114,000 | $ | 11.55 | ||||
Prior to 2009, the Company had not granted any restricted stock units.
The Company does not issue the shares related to its restricted stock units until such time as the restricted stock units vest. Through December 31, 2009, no restricted stock units have vested.
F-36
EnerNOC, Inc.
NOTES TO CONSOLIDATED FINANCIAL STATEMENTS (Continued)
(in thousands, except share and per share data)
11. Income Taxes
The Company accounts for income taxes using the liability method as required by ASC 740 (formerly SFAS No. 109, Accounting for Income Taxes). Under this method, deferred income taxes are recognized for the future tax consequences of differences between the tax and financial accounting bases of assets and liabilities at the end of each reporting period. Deferred income taxes are based on enacted tax laws and statutory tax rates applicable to the periods in which the differences are expected to affect taxable income. A valuation allowance is established when necessary to reduce deferred tax assets to the amounts expected to be realized.
Domestic and foreign pre-tax income is as follows:
| |
Year Ended December 31, | |||||||||
|---|---|---|---|---|---|---|---|---|---|---|
| |
2009 | 2008 | 2007 | |||||||
United States |
$ | (5,223 | ) | $ | (36,500 | ) | $ | (23,366 | ) | |
Foreign |
(1,273 | ) | 100 | (116 | ) | |||||
|
$ | (6,496 | ) | $ | (36,400 | ) | $ | (23,482 | ) | |
The provision (benefit) for income taxes is as follows:
| |
Year Ended December 31, |
||||||||||
|---|---|---|---|---|---|---|---|---|---|---|---|
| |
2009 | 2008 | 2007 | ||||||||
Current |
|||||||||||
Federal |
$ | — | $ | — | $ | — | |||||
State |
— | — | — | ||||||||
Foreign |
41 | — | — | ||||||||
|
41 | — | — | ||||||||
Deferred |
|||||||||||
Federal |
248 | 222 | 85 | ||||||||
State |
44 | 40 | 15 | ||||||||
Foreign |
— | — | — | ||||||||
|
292 | 262 | 100 | ||||||||
|
$ | 333 | $ | 262 | $ | 100 | |||||
Amounts due to various states for non-income taxes are included in general and administrative expenses and accrued expenses and other current liabilities as of December 31, 2009, 2008 and 2007.
F-37
EnerNOC, Inc.
NOTES TO CONSOLIDATED FINANCIAL STATEMENTS (Continued)
(in thousands, except share and per share data)
11. Income Taxes (Continued)
A reconciliation of income tax expense (benefit) at the statutory federal income tax rate and income taxes as reflected in the consolidated financial statements is as follows:
| |
Year Ended December 31, |
|||||||||
|---|---|---|---|---|---|---|---|---|---|---|
| |
2009 | 2008 | 2007 | |||||||
Federal income tax at statutory federal rate |
(34.0 | )% | (34.0 | )% | (34.0 | )% | ||||
State taxes |
0.7 | 0.1 | 0.1 | |||||||
Tax-deductible goodwill |
3.8 | 0.6 | 0.4 | |||||||
Stock-based compensation expense |
24.5 | 5.0 | 5.4 | |||||||
Foreign losses not benefited |
6.7 | — | — | |||||||
Other |
1.9 | 0.1 | 0.3 | |||||||
Change in valuation allowance |
1.5 | 28.9 | 28.2 | |||||||
|
5.1 | % | 0.7 | % | 0.4 | % | ||||
Deferred tax assets (liabilities) consisted of the following:
| |
December 31, | |||||||
|---|---|---|---|---|---|---|---|---|
| |
2009 | 2008 | ||||||
Deferred income tax assets: |
||||||||
Net operating loss carryforwards |
$ | 19,919 | $ | 21,431 | ||||
Reserves and accruals |
2,259 | 441 | ||||||
Deferred revenue |
788 | 480 | ||||||
Deferred rent |
226 | 132 | ||||||
Stock options |
3,852 | 1,784 | ||||||
Other |
73 | 26 | ||||||
|
27,117 | 24,294 | ||||||
Deferred tax liabilities: |
||||||||
Property and equipment |
(2,947 | ) | (1,019 | ) | ||||
Intangible assets |
(333 | ) | (545 | ) | ||||
Tax deductible goodwill |
(654 | ) | (362 | ) | ||||
Total deferred tax liabilities |
(3,934 | ) | (1,926 | ) | ||||
Net deferred tax assets before valuation allowance |
23,183 | 22,368 | ||||||
Valuation allowance |
(23,837 | ) | (22,730 | ) | ||||
Net deferred tax liability |
$ | (654 | ) | $ | (362 | ) | ||
Due to the uncertainty related to the ultimate use of the deferred income tax asset, the Company has provided a full valuation allowance for these tax benefits in both 2009 and 2008. The valuation allowance increased $1,107 during 2009, due primarily to the increase in the certain non-deductible reserves and accruals, stock-based compensation, and deferred revenue.
As of December 31, 2009, the Company had federal and state net operating loss carryforwards of $56,275 and $46,705, respectively, to offset future federal and state taxable income, which expires at
F-38
EnerNOC, Inc.
NOTES TO CONSOLIDATED FINANCIAL STATEMENTS (Continued)
(in thousands, except share and per share data)
11. Income Taxes (Continued)
various times through 2029. The net operating loss carryforwards may be subject to the annual limitations under the "Change of Ownership" rules provided in Internal Revenue Code (IRC) Section 382. The Company's net operating loss carryforwards at December 31, 2009 included $6,252 in income tax deductions related to stock options which will be tax effected and the benefit will be reflected as a credit to additional paid-in capital as realized. The Company has tax credits of $50 that are available to reduce future tax liabilities, which expire at various times through 2025. The Company has foreign net operating loss carryforwards of $1,570 available to offset future foreign income, which expire at various times through 2029.
The Company files income tax returns in United States federal and state jurisdictions, the Canadian federal and provincial jurisdictions and the United Kingdom tax jurisdiction. The tax years for 2004 through 2008 remain open for federal and state tax jurisdictions, although carryforward attributes that were generated prior to 2004 may still be subject to examination if they either have been or will be in future periods. The tax years 2007 and 2008 are open for Canadian tax examination. The Company is currently not under examination by any tax jurisdictions for any tax years. The Company recognizes both accrued interest and penalties related to unrecognized benefits in income tax expense. The Company has not recorded any interest and penalties on any unrecognized tax benefits since its inception.
12. Employee Savings and Retirement Plan
The Company has established a 401(k) Profit Sharing Plan and Trust (the 401(k) Plan) covering substantially all employees. Once the employees have met the eligibility and participation requirements under the 401(k) Plan, employees may contribute a portion of their earnings to the 401(k) Plan to be invested in various savings alternatives. Annually, at the discretion of the Company's board of directors, the Company may make matching contributions to the 401(k) Plan, which vest ratably over periods ranging from one to three years. The Company has not made any matching contributions to the 401(k) Plan since inception.
13. Commitments and Contingencies
The Company leases it office facilities and certain equipment under non-cancelable operating leases, which expire through 2014. Certain of the Company's operating leases contain escalating rent payments. The Company has straight-lined its rent expense under these operating lease arrangements. As of December 31, 2009 and 2008, the deferred rent balances are included in other liabilities in the consolidated balance sheets and were not material. The majority of the office leases require payments for additional expenses such as taxes, maintenance, and utilities. Certain of the leases contain renewal options.
F-39
EnerNOC, Inc.
NOTES TO CONSOLIDATED FINANCIAL STATEMENTS (Continued)
(in thousands, except share and per share data)
13. Commitments and Contingencies (Continued)
At December 31, 2009, future minimum lease payments for operating leases with non-cancelable terms of more than one year were as follows:
| |
Operating Leases | |||
|---|---|---|---|---|
2010 |
$ | 4,155 | ||
2011 |
3,998 | |||
2012 |
3,136 | |||
2013 |
2,771 | |||
2014 |
1,389 | |||
Total minimum lease payments |
$ | 15,449 | ||
Rent expense under operating leases amounted to $3,484, $2,008 and $792 during the years ended December 31, 2009, 2008 and 2007, respectively.
The Company is contingently liable under outstanding letters of credit. Restricted cash balances in the amount of $7,874 and $1,419, respectively, collateralize certain outstanding letters of credit and cover financial assurance requirements in certain of the programs in which we participated at December 31, 2009 and December 31, 2008.
The Company is subject to certain performance guarantee requirements under certain customer contracts and open market bidding program participation rules. The Company had deposits held by certain customers of $3,024 and $2,648, respectively, at December 31, 2009 and December 31, 2008. These amounts primarily represent up-front payments required by utility and grid operator customers as a condition of participation in certain demand response programs and to ensure that the Company will deliver its committed capacity amounts in those programs. If the Company fails to meet its minimum enrollment requirements, a portion or all of the deposit may be forfeited. The Company assessed the probability of default under these customer contracts and open market bidding programs and has determined the likelihood of default to be remote.
In connection with the Company's participation in an open market bidding program, the Company entered into an arrangement with a third party during the second quarter of 2009 to bid capacity into the program and provide the corresponding financial assurance required in connection with the bid. The arrangement included an up-front payment by the Company equal to $2,000, of which $1,100 was expensed as interest expense during the second quarter of 2009 and $900 was deferred and will be recognized ratably as a charge to cost of revenues as revenue is recognized over the 2012/2013 delivery year. In addition, the Company will be required to pay the third party an additional contingent fee, up to a maximum of $3,000, based on the revenue that the Company expects to earn in 2012 in connection with the bid. This additional fee will be recognized as earned.
Indemnification Provisions
The Company includes indemnification provisions in certain of its contracts. These indemnification provisions include provisions indemnifying the customer against losses, expenses, and liabilities from damages that could be awarded against the customer in the event that the Company's service and related products are found to infringe upon a patent or copyright of a third party. The Company believes that its internal business practices and policies and the ownership of information limits the Company's risk in paying out any claims under these indemnification provisions.
F-40
| Number | Exhibit Title | ||
|---|---|---|---|
| 2.1 | Agreement and Plan of Merger, dated as of September 12, 2007, by and among EnerNOC, Inc., Mdenergy, LLC, MDE Acquisition LLC, Clifford Sirlin, in his capacity as the Mdenergy, LLC members' representative, Clifford Sirlin and Andrew Appelbaum, filed as Exhibit 2.1 to the Registrants Form 8-K filed September 18, 2007 (File No. 001-33471), is hereby incorporated by reference as Exhibit 2.2. | ||
3.1 |
Amended and Restated Certificate of Incorporation of EnerNOC, Inc., filed as Exhibit 3.2 to the Registrant's Form S-1/A filed May 3, 2007 (File No. 333-140632), is hereby incorporated by reference as Exhibit 3.1. |
||
3.2 |
Amended and Restated Bylaws of EnerNOC, Inc., filed as Exhibit 3.4 to the Registrant's Form S-1/A filed May 3, 2007 (File No. 333-140632), is hereby incorporated by reference as Exhibit 3.2. |
||
4.1 |
Form of Specimen Common Stock Certificate, filed as Exhibit 4.1 to the Registrant's Form S-1/A filed May 3, 2007 (File No. 333-140632), is hereby incorporated by reference as Exhibit 4.1. |
||
4.2 |
Fifth Amended and Restated Investor Rights Agreement, filed as Exhibit 4.1 to the Registrant's Form 10-Q filed November 5, 2007 (File No. 001-33471), is hereby incorporated by reference as Exhibit 4.2. |
||
10.1 |
Loan and Security Agreement by and among EnerNOC, Inc., EnerNOC Securities Corporation and Silicon Valley Bank, dated as of August 5, 2008, filed as Exhibit 10.1 to the Registrant's Current Report on Form 8-K filed August 8, 2008 (File No. 001-33471), is hereby incorporated by reference as Exhibit 10.1. |
||
10.2 |
First Loan Modification Agreement by and among EnerNOC, Inc., EnerNOC Securities Corporation and Silicon Valley Bank, dated as of May 29, 2009, filed as Exhibit 10.2 to the Registrant's Form 10-Q filed July 27, 2009 (File No. 001-33471), is hereby incorporated by reference as Exhibit 10.2. |
||
10.3 |
@* |
Second Amended and Restated Employment Agreement, dated as of March 1, 2010, by and between Timothy G. Healy and EnerNOC, Inc. |
|
10.4 |
@* |
Second Amended and Restated Employment Agreement, dated as of March 1, 2010, by and between David B. Brewster and EnerNOC, Inc. |
|
10.5 |
@ |
Form of Severance Agreement by and between EnerNOC, Inc. and Neal C. Isaacson, Gregg Dixon, Terrence Sick and David Samuels, filed as Exhibit 10.6 to the Registrant's Form S-1 filed February 12, 2007 (File No. 333-140632), is hereby incorporated by reference as Exhibit 10.5. |
|
10.6 |
@ |
Form of Amendment No. 1 to Form of Severance Agreement by and between EnerNOC, Inc, and Neal C. Isaacson, Gregg Dixon, Terrence Sick and David Samuels, filed as Exhibit 10.3 to the Registrant's Form 10-Q filed August 10, 2007 (File No. 001-33471), is hereby incorporated by reference as Exhibit 10.6. |
|
10.7 |
Amended and Restated Office Lease, dated as of August 15, 2008, between Transwestern Federal, L.L.C. and EnerNOC, Inc., filed as Exhibit 10.1 to the Registrant's Current Report on Form 8-K filed August 20, 2008 (File No. 001-33471), is hereby incorporated by reference as Exhibit 10.7. |
||
10.8 |
Sub-Sublease Agreement by and between Prosodie Interactive California and EnerNOC, Inc., dated May 30, 2008, filed as Exhibit 10.1 to the Registrant's Form 10-Q filed August 13, 2008 (File No. 001-33471), is hereby incorporated by reference as Exhibit 10.8. |
||
| Number | Exhibit Title | ||
|---|---|---|---|
| 10.9 | Agreement of Lease, dated as of September 9, 2008, between CRP/Capstone 14W Property Owner, L.L.C. and EnerNOC, Inc., filed as Exhibit 10.1 to the Registrant's Current Report on Form 8-K filed September 12, 2008 (File No. 001-33471), is hereby incorporated by reference as Exhibit 10.9. | ||
10.10 |
@ |
EnerNOC, Inc. Amended and Restated 2003 Stock Option and Incentive Plan, filed as Exhibit 10.9 to the Registrant's Registration Statement on Form S-1, as amended, filed May 3, 2007 (File No. 333-140632), is hereby incorporated by reference as Exhibit 10.10. |
|
10.11 |
@ |
Form of Incentive Stock Option Agreement under the EnerNOC, Inc. 2003 Stock Option and Incentive Plan, filed as Exhibit 10.10 to the Registrant's Form S-1 filed February 12, 2007 (File No. 333-140632), is hereby incorporated by reference as Exhibit 10.11. |
|
10.12 |
@ |
Form of Incentive Stock Option Agreement by and between EnerNOC, Inc. and Timothy G. Healy, David B. Brewster, Neal C. Isaacson, Gregg Dixon, Terrence Sick and David Samuels, filed as Exhibit 10.11 to the Registrant's Registration Statement on Form S-1 filed February 12, 2007 (File No. 333-140632), is hereby incorporated by reference as Exhibit 10.12. |
|
10.13 |
@ |
Form of Amendment to Incentive Stock Option Agreement by and between EnerNOC, Inc. Timothy G. Healy, David B. Brewster, Neal C. Isaacson, Gregg Dixon, Terrence Sick and David Samuels, filed as Exhibit 10.12 to the Registrant's Registration Statement on Form S-1 filed February 12, 2007 (File No. 333-140632), is hereby incorporated by reference as Exhibit 10.13. |
|
10.14 |
@ |
EnerNOC, Inc. 2007 Employee, Director and Consultant Stock Plan, filed as Exhibit 10.14 to the Registrant's Registration Statement on Form S-1, as amended, filed May 3, 2007 (File No. 333-140632), is hereby incorporated by reference as Exhibit 10.14. |
|
10.15 |
@ |
Form of Incentive Stock Option Agreement under the EnerNOC, Inc. 2007 Employee, Director and Consultant Stock Plan, filed as Exhibit 10.15 to the Registrant's Registration Statement on Form S-1, as amended, filed May 3, 2007 (File No. 333-140632), is hereby incorporated by reference as Exhibit 10.15. |
|
10.16 |
@ |
Form of Non-Qualified Stock Option Agreement under the EnerNOC, Inc. 2007 Employee, Director and Consultant Stock Plan, filed as Exhibit 10.16 to the Registrant's Registration Statement on Form S-1, as amended, filed May 3, 2007 (File No. 333-140632), is hereby incorporated by reference as Exhibit 10.16. |
|
10.17 |
@ |
Form of Restricted Stock Agreement under the EnerNOC, Inc. 2007 Employee, Director and Consultant Stock Plan, filed as Exhibit 10.17 to the Registrant's Registration Statement on Form S-1, as amended, filed May 3, 2007 (File No. 333-140632), is hereby incorporated by reference as Exhibit 10.17. |
|
10.18 |
@* |
Form of Restricted Stock Unit Agreement under the EnerNOC, Inc. 2007 Employee, Director and Consultant Stock Plan. |
|
10.19 |
@* |
Form of Executive Incentive Stock Option Agreement under the EnerNOC, Inc. 2007 Employee, Director and Consultant Stock Plan. |
|
10.20 |
@* |
Form of Executive Non-Qualified Stock Option Agreement under the EnerNOC, Inc. 2007 Employee, Director and Consultant Stock Plan. |
|
10.21 |
@ |
Form of Executive Non-Qualified Stock Option Agreement for Exchanged Option Grants under the EnerNOC, Inc. 2007 Employee, Director and Consultant Stock Plan for January 21, 2009 grants, filed as Exhibit 10.1 to the Registrant's Current Report on Form 8-K filed January 26, 2009 (File No. 001-33471), is hereby incorporated by reference as Exhibit 10.21. |
|
| Number | Exhibit Title | ||
|---|---|---|---|
| 10.22 | @ | EnerNOC, Inc. Amended and Restated Non-Employee Director Compensation Policy, filed as Exhibit 10.1 to the Registrant's Form 10-Q filed July 27, 2009 (File No. 001-33471), is hereby incorporated by reference as Exhibit 10.22. | |
10.23 |
@* |
Summary of 2010 Executive Officer Bonus Plan. |
|
10.24 |
@ |
Form of Indemnification Agreement between EnerNOC, Inc. and each of the directors and executive officers thereof, filed as Exhibit 10.21 to the Registrant's Registration Statement on Form S-1, as amended, filed May 3, 2007 (File No. 333-140632), is hereby incorporated by reference as Exhibit 10.24. |
|
10.25 |
@ |
Offer Letter, dated as of December 19, 2007, by and between EnerNOC, Inc. and Darren P. Brady, filed as Exhibit 10.23 to the Registrant's Annual Report on Form 10-K for the year ended December 31, 2007 (File No. 001-33471), is hereby incorporated by reference as Exhibit 10.25. |
|
10.26 |
@ |
Severance Agreement, dated as of January 22, 2008, by and between EnerNOC, Inc. and Darren P. Brady filed as Exhibit 10.1 to the Registrant's Current Report on Form 8-K/A filed January 24, 2008 (File No. 001-33471), is hereby incorporated by reference as Exhibit 10.26. |
|
10.27 |
@ |
Offer Letter, dated as of July 27, 2009, between EnerNOC, Inc. and Timothy Weller, filed as Exhibit 10.1 to the Registrant's Current Report on Form 8-K filed July 31, 2009 (File No. 001-33471), is hereby incorporated by reference as Exhibit 10.27. |
|
10.28 |
@ |
Severance Agreement, dated as of July 27, 2009, by and between EnerNOC, Inc. and Timothy Weller, filed as Exhibit 10.2 to the Registrant's Current Report on Form 8-K filed July 31, 2009 (File No. 001-33471), is hereby incorporated by reference as Exhibit 10.28. |
|
10.29 |
@ |
Offer Letter, dated as of November 4, 2009, by and between EnerNOC, Inc. and Kevin Bligh, filed as Exhibit 10.1 to the Registrant's Current Report on Form 8-K filed November 10, 2009 (File No. 001-33471), is hereby incorporated by reference as Exhibit 10.29. |
|
21.1 |
* |
Subsidiaries of EnerNOC, Inc. |
|
23.1 |
* |
Consent of Ernst & Young LLP, Independent Registered Public Accounting Firm |
|
31.1 |
* |
Certification of Chief Executive Officer of EnerNOC, Inc. pursuant to Rule 13a-14(a) or Rule 15d-14(a) promulgated under the Securities Exchange Act of 1934, as amended. |
|
31.2 |
* |
Certification of Chief Financial Officer of EnerNOC, Inc. pursuant to Rule 13a-14(a) or Rule 15d-14(a) promulgated under the Securities Exchange Act of 1934, as amended. |
|
32.1 |
* |
Certification of the Chief Executive Officer and Chief Financial Officer of EnerNOC, Inc. pursuant to Rule 13a-14(b) promulgated under the Securities Exchange Act of 1934, as amended, and 18 U.S.C. Section 1350, as adopted pursuant to Section 906 of the Sarbanes-Oxley Act of 2002. |
|
- @
- Management
contract, compensatory plan or arrangement.
- *
- Filed herewith