Attached files
Table of Contents
UNITED STATES
SECURITIES AND EXCHANGE COMMISSION
Washington, D.C. 20549
Form 10-K
(Mark One)
| x | ANNUAL REPORT PURSUANT TO SECTION 13 OR 15(d) OF THE SECURITIES EXCHANGE ACT OF 1934 |
For the fiscal year ended December 31, 2009
or
| ¨ | TRANSITION REPORT PURSUANT TO SECTION 13 OR 15(d) OF THE SECURITIES EXCHANGE ACT OF 1934 |
Commission file number: 000-51002
ZIPREALTY, INC.
(Exact name of registrant as specified in its charter)
| DELAWARE | 94-3319956 | |
| (State of incorporation) | (IRS employer identification number) | |
| 2000 POWELL STREET, SUITE 300, EMERYVILLE, CA |
94608 | |
| (Address of principal executive offices) | (Zip Code) | |
(510) 735-2600
(Registrant’s telephone number)
Securities registered pursuant to section 12(b) of the Act:
| Title of Each Class: |
Name of Each Exchanged on Which Registered: | |
| Shares of Common Stock, $0.001 par value | The NASDAQ Stock Market |
Securities registered pursuant to section 12(g) of the Act: None
Indicate by check mark if the registrant is a well-known seasoned issuer, as defined in Rule 405 of the Securities Act. Yes ¨ No x
Indicate by check mark if the registrant is not required to file reports pursuant to Section 13 or Section 15(d) of the Act. Yes ¨ No x
Indicate by check mark whether the registrant: (1) has filed all reports required to be filed by Section 13 or 15(d) of the Securities Exchange Act of 1934 during the preceding 12 months (or for such shorter period that the registrant was required to file such reports), and (2) has been subject to such filing requirements for the past 90 days. Yes x No ¨
Indicate by check mark whether the registrant has submitted electronically and posted on its corporate Web site, if any, every Interactive Data file required to be submitted and posted pursuant to Rule 405 of Regulation S-T during the preceding 12 months (or for such shorter period that the registrant was required to submit and post such files). Yes ¨ No ¨
Indicate by check mark if disclosure of delinquent filers pursuant to Item 405 of Regulation S-K is not contained herein, and will not be contained, to the best of registrant’s knowledge, in definitive proxy or information statements incorporated by reference in Part III of this Form 10-K or any amendment to this Form 10-K. ¨
Indicate by check mark whether the registrant is a large accelerated filer, an accelerated filer, a non-accelerated filer, or a smaller reporting company. See the definitions of “large accelerated filer,” “accelerated filer” and “smaller reporting company” in Rule 12b-2 of the Exchange Act.
| Large accelerated filer ¨ | Accelerated filer ¨ | |||
| Non-accelerated filer ¨ | Smaller reporting company x | |||
| (Do not check if a smaller reporting company) |
Indicate by check mark whether the registrant is a shell company (as defined in Rule 12b-2 of the Exchange Act). Yes ¨ No x
The aggregate market value of the voting and non-voting common equity held by non-affiliates (meaning all shares not beneficially owned by directors or executive officers of the registrant or their known affiliates) was approximately $36.3 million (based on a price of $2.68 per share, which was the closing price of the registrant’s common stock on The NASDAQ Stock Market) on the last business day of the registrant’s most recently completed second fiscal quarter.
We had 20,447,275 shares of common stock outstanding at March 1, 2010.
DOCUMENTS INCORPORATED BY REFERENCE
Pursuant to General Instruction G(3), Part III, Items 10, 11, 12, 13 and 14 incorporate by reference information from the Proxy Statement for the Registrant’s 2010 Annual Meeting of Stockholders, which will be filed with the Securities and Exchange Commission within 120 days of the end of the fiscal year ended December 31, 2009.
Table of Contents
| Page | ||||
| PART I | ||||
| Item 1. |
2 | |||
| Item 1A. |
16 | |||
| Item 1B. |
27 | |||
| Item 2. |
27 | |||
| Item 3. |
27 | |||
| Item 4. |
27 | |||
| PART II | ||||
| Item 5. |
Market for Our Common Stock, Related Stockholder Matters and Issuer Purchases of Equity Securities | 28 | ||
| Item 6. |
30 | |||
| Item 7. |
Management’s Discussion and Analysis of Financial Condition and Results of Operations |
31 | ||
| Item 7A. |
52 | |||
| Item 8. |
53 | |||
| Item 9. |
Changes in and Disagreements with Accountants on Accounting and Financial Disclosure |
75 | ||
| Item 9A. |
75 | |||
| Item 9B. |
76 | |||
| PART III | ||||
| Item 10. |
77 | |||
| Item 11. |
77 | |||
| Item 12. |
Security Ownership of Certain Beneficial Owners and Management and Related Stockholder Matters | 77 | ||
| Item 13. |
Certain Relationships and Related Transactions and Director Independence |
78 | ||
| Item 14. |
78 | |||
| PART IV | ||||
| Item 15. |
79 | |||
| 80 | ||||
Table of Contents
Statement regarding forward-looking statements
This report includes forward-looking statements. Forward-looking statements provide current expectations of future events based on certain assumptions and include any statement that does not directly relate to any historical or current fact. All statements other than statements of historical facts contained in this report, including statements regarding our future financial position, business strategy and operations, and plans and objectives of management are forward-looking statements. The words “believe,” “may,” “will,” “should,” “could,” “estimate,” “continue,” “anticipate,” “intend,” “expect,” “plan,” “potential,” “predict,” “project,” “designed,” “provides,” “facilitates,” “assists,” “helps” and similar expressions, as they relate to us, are intended to identify forward-looking statements. Forward-looking statements contained in this report include, but are not limited to, statements relating to:
| • | trends in the residential real estate market, the market for mortgages, and the general economy; |
| • | our future financial results; |
| • | our future growth and expansion into new markets; |
| • | our future advertising and marketing activities; and |
| • | our future investment in technology. |
We have based these forward-looking statements principally on our current expectations and projections about future events and financial trends that we believe may affect our financial condition, results of operations, business strategy and financial needs. No forward-looking statement is a guarantee of future performance and you should not place undue reliance on any forward-looking statement.
These forward-looking statements are subject to a number of risks, uncertainties and assumptions, including those described in “Risk Factors” in Item 1A of Part I. Readers should carefully review such cautionary statements as they identify certain important factors that could cause actual results to differ materially from those in the forward-looking statements and from historical trends. Those cautionary statements are not exclusive and are in addition to other factors discussed elsewhere in this Form 10-K or in materials incorporated herein by reference.
In light of these risks, uncertainties and assumptions, the forward-looking events and circumstances discussed in this report may not occur and actual results could differ materially from those anticipated or implied in the forward-looking statements. Except as otherwise required by law, we do not intend to update or revise any forward-looking statement contained in this report.
Trademarks
“ZipRealty,” “ZipAgent,” “ZipNotify,” and “Your home is where our heart is” are some of our registered trademarks in the United States. We also own the rights to the domain name “www.Real-Estate.com.” “REALTOR” and “REALTORS” are registered trademarks of the National Association of REALTORS®. All other trademarks, trade names and service marks appearing in this report are the property of their respective owners.
Internet site
Our Internet address is www.ziprealty.com. We make publicly available free of charge on our Internet website our annual report on Form 10-K, quarterly reports on Form 10-Q, current reports on Form 8-K, and amendments to those reports filed or furnished pursuant to Section 13(a) or 15(d) of the Securities Exchange Act of 1934 as soon as reasonably practicable after we electronically file such material with, or furnish it to, the Securities and Exchange Commission. Information contained on our website is not a part of this annual report on Form 10-K.
1
Table of Contents
Where you can find additional information
You may review a copy of this annual report on Form 10-K, including exhibits and any schedule filed therewith, and obtain copies of such materials at prescribed rates, at the Securities and Exchange Commission’s Public Reference at 100 F Street NE, Washington, D.C. 20549. You may obtain information on the operation of the Public Reference Room by calling the Securities and Exchange Commission at 1-800-SEC-0330. The Securities and Exchange Commission maintains a website (http://www.sec.gov) that contains reports, proxy and information statements and other information regarding registrants, such as ZipRealty, that file electronically with the Securities and Exchange Commission.
PART I
| Item 1. | Business: |
OVERVIEW
We are a leading full-service residential real estate brokerage that uses an innovative combination of a comprehensive online presence, robust proprietary technology and knowledgeable local agents in the field to offer our clients fast, responsive and transparent service. Our award-winning, user-friendly website gives our users access to comprehensive local Multiple Listing Services home listings data, as well as other relevant market and neighborhood information and tools. Our proprietary technology, including our agent productivity platform, helps us to increase agent efficiency and reduce costs, allowing us to pass on significant savings to consumers as permitted by law.
We have grown our business rapidly since our inception in 1999. By 2009, we ranked as the 9th largest residential real estate brokerage in the nation by annual transaction volume, accordingly to REAL Trends, an industry research firm. Also in 2009, our website received more traffic than any other residential real estate brokerage in the nation, according to Hitwise, an information services company. As of March 1, 2010, we had wholly owned operations in 35 major markets serviced by our team of over 3,000 local, licensed sales agents, and we had approximately 2.6 million active registered users who had accessed our website within the last year.
Through our website and mobile products, our clients can access a broad range of current real estate information and powerful tools to research and engage in the purchase or sale of a home, including by connecting with one of our local agents. While many websites post home listings, we give our clients direct access to home listings data from local Multiple Listing Services, or MLSs, which is the most comprehensive and updated information on home sales available. We provide our clients with information in addition to MLS data, including neighborhood attributes, newly built home listings, school district information, comparable home sales data, maps and driving directions, and user-generated content. Further, we provide our clients with useful tools such as the ability to chat with agents via the website, personalized searching tool, and tools, to help users make informed pricing choices. We attract users to our website through a variety of marketing channels, including online advertising, word of mouth and social media.
Our proprietary sales system, known as ZAP, automatically matches registered users with our local sales agents, whom we also refer to as ZipAgents. However, some clients prefer to choose their ZipAgents after reviewing the agent profiles and customer service ratings we post on our website. Our ZAP system helps to identify and analyze client website behavior, which helps our agents to provide our clients with faster, more responsive service and with information that is better tailored and more relevant to them.
Our agents show properties to our buyers, list and market properties for our sellers, negotiate transactions and handle closing details. Our agents are typically employees. However, in February 2010, we ceased to employ agents in New York, and instead engaged agents as independent contractors in that state. Through that modified
2
Table of Contents
business model, we hope to deliver excellent customer service and enable independent contractor agents to be productive and efficient with minimal management oversight. We currently do not have plans to make a similar change in other markets, although we continually evaluate all aspects of our business and operational model and could make similar or different changes in other markets in the future.
We typically share a portion of our commissions with our buyer clients in the form of a cash rebate, and typically represent our seller clients at fees below those offered by most traditional brokerage companies in our markets. Generally, our seller clients pay a total brokerage fee of 4.5% to 5.0% of the transaction value, of which 2.5% to 3.0% is paid to agents representing buyers. In the Oregon portion of our Portland market (which serves portions of both Oregon and Washington), the payment of cash rebates is not currently permitted by law, we have adjusted our value proposition for our buyer clients by offering an enhanced client satisfaction guarantee. In New Jersey, the payment cash rebates became permissible in January 2010, and accordingly we have commenced offering cash rebates to our buyer clients in New Jersey.
Our business was incorporated under the laws of the state of California in 1999 and was reincorporated as a Delaware corporation in August 2004. As of December 31, 2009, we operated in 35 major markets in 22 states and the District of Columbia, including Atlanta, Baltimore, Washington D.C., Boston, Chicago, Dallas, Los Angeles, Orange County, Phoenix, Sacramento, San Diego, the San Francisco Bay Area, Seattle, Las Vegas, Houston, Miami, Orlando, Palm Beach, Tampa, Minneapolis/St Paul, Austin, the Greater Philadelphia area, Fresno/Central Valley, Naples, Tucson, Denver, Jacksonville, Richmond, Salt Lake City, Virginia Beach, Charlotte, Raleigh-Durham, Westchester County/ Long Island (which were previously two markets but have been combined into one market), Hartford, and Portland, Oregon. All of our markets were opened prior to 2009 with the exception of Portland, which we opened in April 2009. Depending on market conditions and other criteria, we may consider entering additional markets in the future. We operate in one reportable segment; financial information is included in the consolidated financial statements included in Item 8 of this Annual Report on Form 10-K.
INDUSTRY BACKGROUND
The U.S. residential real estate market
The residential real estate industry is one of the largest industries in the United States. According to the National Association of REALTORS®, or NAR, the dominant trade organization in the residential real estate industry, residential real estate sales totaled over $1.3 trillion in 2008. Also according to NAR, sales of existing homes compose the vast majority of the residential real estate market, accounting for $1.2 trillion of 2008 total home sales. Additionally, REAL Trends reported that total residential real estate brokerage commissions and fees, which are primarily derived from existing home sales, were approximately $49 billion in 2007.
The residential real estate brokerage market is highly fragmented and intensely competitive. According to REAL Trends, the 10 largest brokerage firms accounted for less than 9% of all brokered residential real estate transaction volume in 2007, and the single largest firm accounted for less than 5% of total transaction volume. According to NAR, there were approximately 1.1 million REALTORS® in the United States and its territories as of January 31, 2010. Some brokerage firms are affiliated with national franchise brands, such as Century 21, Coldwell Banker, Prudential and RE/MAX. The franchise brands, which are often large and undifferentiated, license their brand names and trademarks and provide other marketing support to franchisee brokerage firms. These brokerage firms typically engage agents to work for them as independent contractors and as a result franchisors and franchisees have limited direct influence over the client relationship or the quality of client service.
The traditional real estate transaction process centers on real estate agents, who act as the principal intermediary between home buyers and sellers and control the flow of information to both. One of the primary benefits traditionally offered by an agent has been access to MLS home listings data. Because consumers have
3
Table of Contents
not traditionally had direct access to this data, the agent has exercised primary control over the process of searching and filtering the MLS data under this system. Consequently, consumers have not been assured of access to comprehensive and relevant information. Prospective home sellers have had similarly limited opportunities to investigate the current market or to efficiently and effectively market and sell their homes.
Challenges and limitations of the traditional residential real estate process
Challenges for home buyers and sellers. We believe that the traditional residential real estate industry has historically been characterized by low levels of client satisfaction. Some contributing factors include:
| • | limited access to, and lack of transparency of, information; |
| • | limited transparency in, and lack of client control over, the residential real estate sales process; |
| • | low levels of agent responsiveness and accountability; |
| • | the presence of unskilled agents in the market caused by low barriers to entry and poor supervision; and |
| • | high commissions. |
Challenges for agents. Agents often have difficulty generating consistent transaction volume, resulting in inconsistent earnings. Some contributing factors include:
| • | consumer distrust of agents, and skepticism towards the value of their services, created by the lack of transparency, responsiveness and skill that is often associated with their trade; |
| • | the need for agents to spend considerable personal time and money generating business; |
| • | limited resources for agents to manage properly client relationships and transaction processes; and |
| • | agent responsibility for other business expenses and access to personal benefits, such as health insurance. |
Challenges for brokerage firms. Traditional brokerage firms have difficulty differentiating their services and effectively managing agents and ensuring client satisfaction. Some contributing factors include:
| • | the independent contractor nature of the agent relationship, which limits agent accountability and managerial effectiveness, and which also limits broker relationships with clients; and |
| • | low levels of client and agent loyalty. |
OUR BUSINESS MODEL
To address the challenges of the traditional residential real estate industry, we use an innovative combination of a comprehensive online presence, robust proprietary technology and knowledgeable local agents in the field to offer our clients fast, responsive and transparent service. Our business model is designed to help our agents achieve better customer service and higher productivity at an overall lower cost per transaction than the industry average. To do so, we have adopted technologies and practices in most of our markets that differ significantly from most traditional real estate brokerages, such as our innovative use of technology to help our agents, buyers and sellers select and market properties, the employee agent model we typically use, our centralization of functions such as lead acquisitions, marketing and advertising, and our use of rebates and discounts to attract customers. The key attributes of our business model include the following:
Addressing challenges for home buyers and sellers
We use the Internet and related technologies to empower consumers. While many websites post home listings, the rules of the various local Multiple Listing Services, or MLSs, in our markets often limit the home
4
Table of Contents
listings information that can be presented on those websites. In contrast, we have been at the forefront of brokerages in operating a virtual office website, or VOW. Because we operate this password-protected website, MLS rules permit us to provide our clients with direct Internet access to home listings data from local MLSs, which is the most comprehensive and updated information on home sales available. Through our website, www.ziprealty.com, we provide our registered users with convenient, free access to that information, as well as the ability to research and compare homes, without their having to visit an agent. Our MLS data is updated at least once per day in each of our markets. In certain markets, we also provide free access to newly built home listings posted by residential home builders with whom we have entered into agreements. We strive to provide valuable information and useful services to potential home buyers through our website, such as home and neighborhood content, automated screenings and notifications of available homes that meet specified criteria, and the ability to schedule home viewing appointments and make offers online. We offer home sellers online home value estimates and virtual tours, as well as broad marketing distribution through the MLS, Internet and traditional media. Further, we provide our clients with useful tools such as the ability to save personalized searches, automatic email notification, and tools to help users make informed pricing choices, as well as mobile access to comprehensive home listings data on the ZipRealty application for the iPhone.
We focus on delivering high-quality service with a client-centric approach. Our brokerage model is built around the client, not the agent. We acquire a majority of our client leads and have designed our business model to provide ongoing value-added services through the Internet, allowing our brand, in addition to our agents, to service our clients. Most of our employees are agents, not independent contractors, which permits us to hold them accountable for consistently delivering a high level of client service and satisfaction. Also, we use our ZAP sales system to monitor the service provided by our employee ZipAgents to verify a high level of responsiveness and to assist us to address quickly any potential issues. Our ZAP system also helps to identify and analyze client website behavior, which helps our agents to provide our clients with faster, more responsive service and with information that is better tailored and more relevant to them. To back up our commitment to client service, we offer our closed clients a $250 cash refund (more in Oregon) if they are unsatisfied with our services. In addition, our clients can influence the compensation paid to their ZipAgents based upon the results of a client satisfaction survey.
Our business model is designed to offer a compelling consumer value proposition. Our use of the Internet, proprietary technologies and business processes promotes agent productivity and efficiency, which allows us to offer significant cash rebates to our buyers and reduced commissions to our sellers. In a typical market, our business model assumes we will pay each of our home buyers an amount equal to 20% of our commission in cash upon closing and offer our home sellers up to a 25% discount off of standard commissions in their particular market.
Addressing challenges for agents and brokerage firms
Our innovative use of proprietary technologies and practices increases operational efficiencies and promotes excellent client service. We have been at the forefront of brokerages in operating a virtual office website, or VOW, through the Internet. Through our VOW, our clients can access and search real estate listings posted on the MLSs in the markets we serve, as well as related neighborhood information, maps and tools. Our VOW reduces our need for office space and facilitates the transaction of business away from an office. In addition, the attractiveness of our award-winning website brings clients directly to us, thereby increasing our client base and reducing our need to purchase leads from third parties.
We have also been at the forefront of managing lead acquisition costs by employing technology designed to promote efficient lead utilization, as well as by using a centralized lead acquisition and distribution function, thereby increasing agent productivity while leveraging costs. For example, all of our employee agents, and, at their option, our independent contractor agents in New York, use our ZAP sales system to service qualified leads, meaning new clients that have completed the registration process and that have either conducted a home search or indicated that they own property to be sold in one of our markets. ZAP automatically monitors each client’s
5
Table of Contents
searching behavior from the initial search session and assigns that client to a ZipAgent who specializes in the specific territories most frequently searched by that client during that initial session, or in the territory where the property to be sold is located, although some clients may choose to work with another ZipAgent after reviewing the agent profiles and customer ratings we post on our website. ZAP also provides a tool for organizing and prioritizing these leads, valuable customer relationship management, or CRM, tools, and visibility into client website behavior. In addition, ZAP allows our managers to observe and manage how our employee agents are servicing our clients. We also have proprietary transaction support tools that help our ZipAgents close transactions more efficiently.
We believe our integrated consumer website and proprietary ZAP sales system are difficult to replicate and allow us to significantly scale our business to meet client needs while both leveraging costs and providing outstanding client service.
Our business model is designed to offer a compelling value proposition to agents. Other than in New York, our ZipAgents are employees, not independent contractors. We believe our employee-based model and ZAP technology offer a rather unique and attractive proposition to agents compared with that found at traditional brokerages, including the ability to work more efficiently and close more transactions. We design, implement and bear the cost of all marketing programs for our employee ZipAgents, including the delivery of client leads, allowing them to focus on serving clients rather than generating new business. Additionally, all of our employee ZipAgents receive initial orientation training and participate in various ongoing training activities. Subject to plan requirements, all of our employee ZipAgents are eligible for employee benefits including company-sponsored health, welfare, retirement and equity incentive plans. We believe that a number of factors contribute to our employee ZipAgents’ ability to close more transactions than are typically closed in the industry, in particular:
| • | our employee ZipAgents receive qualified leads without individual marketing efforts, allowing them to rapidly develop a good pipeline of clients; |
| • | our ZAP sales system, with its proprietary CRM tools, allows our employee ZipAgents to remain organized and communicate and sell effectively with numerous clients at the same time; and |
| • | our ZAP sales system, as well as our dedicated group of service professionals, allow our employee ZipAgents to spend less time on closing tasks and more time on new clients than would otherwise be possible without this support in place. |
The average monthly productivity of our total agent population was approximately 0.6 transactions per ZipAgent in 2009. Since 2004, the average monthly productivity of our ZipAgents ranged from 0.6 to 1.1 transactions per ZipAgent. We calculate the average monthly productivity of our ZipAgents for a full year by dividing the average monthly number of transactions closed during the year by the average number of ZipAgents employed at the beginning of each month during the year. We do not adjust the denominator for ZipAgents hired, or who leave us during the month. The average productivity level of our ZipAgents who have been with us in excess of six full months is considerably higher than the average level achieved by all our ZipAgents.
OUR STRATEGY
Our objective is to become one of the most recognized, respected and successful full-service companies in the residential real estate industry. To attain this objective, our strategic priorities are focused on growing locally and profitably. Our strategic priorities include the following efforts designed to increase agent productivity and transaction volumes while further leveraging our model and our costs:
Build our listings business
Historically, our clients who are home buyers have represented a substantial majority of our business and revenues. For instance, home sellers represented only 7% of our transactions in 2009. The home listings business represents a significant revenue growth opportunity for us. We plan to pursue this business in a number of ways,
6
Table of Contents
such as by developing more website tools for sellers, by hiring more agents, by implementing additional listings training for our agents, and by using a referral system that encourages ZipAgents and their clients to refer home listings. Through these initiatives, we plan to build our local referral networks, name recognition and reputation for local knowledge and expertise to drive the growth of our home listings business market by market.
Deepen and strengthen our local presence in our current markets
In 2009, our aggregate transaction volume market share in our markets represented less than 1% of the total transaction volume for those markets. We believe that we have a significant opportunity to grow our market share in our current markets, both in terms of our home listings business and in our representation of home buyers, given that competition is largely fragmented. Because the competitive landscape varies market by market, the growth initiatives we use in each market will likely vary as well. Typically, we plan to hire additional agents and to build our local referral networks. We also plan to leverage our increased home listings presence to attract home buyers as clients with nominal additional marketing costs. As we grow our market share in our current markets, we expect to grow our revenues without incurring the costs associated with entering new markets.
Lead the industry in innovation
Since our inception, we have embraced innovative technologies and practices, such as our use of a VOW and of our ZAP sales system, to leverage costs while competing for clients and agents. Continued innovation is critical to our culture, to our ability to differentiate our products and services from our competitors, and ultimately to our success. Our goal is to continuously strengthen our brand by providing exceptional customer service, creating more informed customers through information transparency, and improving the overall real estate process through the adoption of cutting-edge tools and services that consumers will value.
Grow our non-transaction revenues
We plan to deepen and diversify our revenue streams by providing or marketing services that surround our core business of helping clients to become home owners or to sell their homes. We refer to these services as core services. Some of these services may be offered through subsidiaries and other affiliates, while others may be offered through marketing arrangements with independent third parties, such as title, mortgage and insurance companies. For example, we have entered into a marketing agreement with Bank of America, under which we receive a flat monthly fee in exchange for our commitment to market mortgage products and other services to our clients. We also plan to seek opportunities to leverage the benefits of our website. To that end, we have entered into agreements to provide advertising and lead generation services to third parties in exchange for fixed monthly payments and, in some cases, volume-based and performance-based fees. We are exploring additional opportunities to capitalize on the strengths of the advertising and lead generation capacities of our website.
Define and market the ZipRealty brand
We believe that strengthening the ZipRealty brand will increase our presence and our reputation, thereby providing a competitive advantage in attracting agents and clients and, ultimately, increasing the number of transactions that we close. We plan to increase our brand awareness by increasing our word of mouth marketing through such initiatives as increased use of our “refer a friend” feature, by marketing our services through our large and growing base of past clients, and by pursuing continued strong press coverage and media attention. In addition, we believe that we can enhance our brand by continuing to focus on client service, with the objective of creating lifelong relationships with our clients and increasing repeat and referral business. Through these efforts, we plan to promote a differentiated brand known for innovation and fast, excellent customer service. By building our brand, we hope to achieve greater website traffic and thus more effective leveraging of lead acquisition costs, market share growth, development of our listings business, and better agent recruitment and retention.
7
Table of Contents
OUR CONSUMER WEBSITE AND SERVICES
Our real estate services enable consumers to exercise more control over the home buying and selling process. We believe that the combination of an award-winning, information-rich web site and the knowledge and expertise of our local real estate sales professionals provides our customers with fast, responsive and transparent service. Our ZipAgents typically have or are gaining extensive market knowledge of the markets they serve and are active members of their local, state and national real estate and MLS associations. In addition, our website, www.ziprealty.com, provides a step-by-step approach to guide clients through the home buying and selling process. Our website and agent platform software is proprietary to us. We enhance our website by including information such as home listings, neighborhood attributes, newly built home listings, school district information, comparable home sales data, maps and driving directions, and user-generated content that we obtain from local MLSs and other third party providers. We also provide our clients the ability to access comprehensive home listings data on the ZipRealty application for iPhone.
Access to comprehensive MLS home listings data
We offer individuals who register on our website access to comprehensive available home listings data, including pictures, from the local MLSs in the markets in which we operate. As active members of the MLSs in the markets we serve, we organize the data from each MLS database and provide it directly to consumers on our website. Unlike many real estate websites, we show listings from all broker participants in the MLSs, not just our own listings. We update this data frequently, at least once a day and, for most of our markets, multiple times daily. Our website is password protected, so individuals are able to access comprehensive home listing data only if they provide basic registration information, agree to our terms of use and then return to our site to input a code that we email to them at the time of their registration. Consumers can search for homes based upon numerous criteria, including city, zip code, price, square footage, number of bedrooms and bathrooms, map geography, school district, distance from a specified address, and other characteristics and amenities such as lot size, whether a home has a fireplace or central air conditioning, and numerous other features. We do not show information from the MLS databases that relates to homeowners who have opted out of the Internet display of their home listing information, or information that is marked as confidential, such as information relating to home security.
ZipNotify
One of our most popular consumer website tools is called ZipNotify, which allows consumers to receive an automatic email notification each time a property that meets their desired search criteria is made available on the local MLSs. Since we update our listings information at least once per day in each market, our registered users are able to learn about new listings in a timely manner, usually within 24 hours. In markets that are characterized by short supply, we believe this tool provides our clients a competitive advantage over other consumers, who might have to wait for their agent to learn about the listing and then contact them with the information. The ZipNotify tool is also interactive: with one click the consumer can login to see more detailed information on the home, schedule a visit with one of our ZipAgents to see the home, or send an email to one of our ZipAgents requesting more information about the property. Our number of ZipNotify messages has grown steadily, and averaged over 41.2 million per month in 2009 compared to over 30.8 million per month in 2008, over 20.8 million per month in 2007 and over 16.1 million per month in 2006.
Neighborhood data and related compelling content
Our system is designed to provide consumers with access to a broad range of information, in addition to the MLS data, about their potential home without having to rely on an agent or other party to provide that information to them. Consequently, our website includes several tools to help our clients educate themselves during the process, including relevant neighborhood data such as population, comparable home sales, average income, education level, occupation mix, cost of living, crime statistics, weather, school district information, maps and driving directions. The website displays compelling spatial information, including school district boundaries, neighborhood boundaries and parcel boundaries, in addition to mapping contextually relevant information such as schools, transit stations and businesses.
8
Table of Contents
Online images and virtual tours
We believe that one of the principal attractions of the Internet for consumers who are researching homes is the ability for consumers to view images of available homes. For our seller clients, we offer virtual home tours and photos of our home listings at no additional cost. For our buyer clients, in addition to the customary single photo, in select markets we have the ability to post multiple property photos from the local MLSs, giving clients a more robust search experience. This enables home buyers to better research homes before deciding whether to visit them.
Schedule visits
We try to make it as easy and convenient as possible for our buyer clients to schedule visits of properties they would like to see. All our clients need to do is click on a button when viewing information about a home on our website and enter in their phone number and what days and times they would prefer to see the home. We then contact the listing agents and organize the visits. Alternatively, our clients can contact their ZipAgent by telephone or email to schedule a visit.
Home offers
While the vast majority of clients prefer to make offers through their ZipAgent, some clients like the convenience and speed of submitting their offers online. We provide this capability through our website by allowing clients to input all of the relevant information into our offer form. We then fill out the appropriate paperwork and obtain signatures from, and submit the offer on behalf of, our clients.
ZAP SALES SYSTEM
Our sales system, known as ZAP, is used by all of our employee agents, as well as our independent contractor agents in New York who choose to use it. ZAP is our proprietary web-based agent platform and customer relationship management system and it is deeply integrated with our website. This deep integration provides the data and information required to methodically prioritize agent workflow and to drive fast, relevant and responsive service to our clients. ZAP systematically integrates and records consumer contact information and website behavior, ZipAgent behavior and transaction information into a common Oracle-based platform. ZAP records relevant consumer behavior such as logon frequency and times, specific homes viewed and printed, searches made by clients, requested visits to view homes and online offers. The system also records and organizes all relevant agent activities. For example, ZAP records the frequency and length of ZipAgent logins and automatically captures and stores all ZipAgent email communications, organized by client. We require our employee ZipAgents to input into ZAP summary information about all client phone calls, visits conducted and offers submitted and accepted.
We use the data collected by ZAP to manage more effectively our employee ZipAgents to verify each is working diligently, productively and in our clients’ best interests. The system also incorporates proprietary CRM tools that allow ZipAgents to manage their databases of clients. For example, one tool uses predictive behavior to help our ZipAgents identify those clients who are likely to need their services in the near term. ZAP also has an array of real-time management reports, which gives our management detailed visibility into daily business activity. Finally, ZAP includes automated closing checklists and tools that allow our employee ZipAgents and closing service managers (who manage transactional documentation) to efficiently handle the closing of multiple transactions. We believe that ZAP enables our agents who use the system to be more productive and enhances the level of service they provide to our clients.
ZIPAGENTS
We believe that we are one of the few residential real estate brokerages that engages most of its agents as employees rather than as independent contractors. Independent contractors work under minimal management
9
Table of Contents
supervision, including supervision regarding how well they service clients. In contrast, our predominantly employee-based model allows us actively to manage and train our employee ZipAgents and hold them accountable for their activities and client service levels.
In February 2010, we implemented an independent contractor agent model in our New York market. This model is a significant departure from the employee model in our other markets because independent contractor agents are not subject to the management oversight applied to employee agents. We hope to leverage other aspects of our model such as our technology and website to provide excellent customer service to our New York clients, and to enable independent contractor agents in New York to be productive and successful.
Compensation structure
We offer our employee ZipAgents a compensation package that we believe is attractive compared to that offered by traditional brokerage firms. Our employee compensation package includes:
| • | Commissions. As is customary in the real estate brokerage industry, ZipAgents earn a portion of the commissions they generate for us, which is known as their split. Our commission splits to ZipAgents typically vary based on productivity and tenure. In Nevada, in keeping with the laws of that state, we pay our ZipAgents minimum wage offset against future commissions, and overtime subject to prior manager approval. |
| • | Expense reimbursement. All California and other eligible employee ZipAgents (including, where applicable, ZipAgents who have met certain levels of productivity) receive expense reimbursement. This reimbursement covers many expenses typically related to their business, such as automobile usage, cell phone usage and Internet connectivity. |
| • | Company-paid marketing expenses. In the traditional independent contractor model, agents are typically responsible for covering all of their own marketing expenses, including lead generation costs, advertising and marketing costs associated with selling homes, and the costs of producing collateral materials. In our model, we cover these costs for our employee ZipAgents. |
| • | Benefits. One of the advantages of our employee-based model for our ZipAgents is that we provide a broad array of benefits that are uncommon in the real estate brokerage industry, including company-sponsored health, welfare and 401(k) plans, subject to meeting certain tenure requirements. In addition, employee ZipAgents have the ability to earn stock options in connection with certain performance levels. |
Recruiting and training
At December 31, 2009, our recruiting and training team was composed of three corporate office recruiting/training personnel plus 37 recruiters and nine trainers serving our market level operations. Our market level recruiters are dedicated solely to identifying and qualifying prospective ZipAgents and our trainers are involved in comprehensive training programs both for new ZipAgents as they join us and for existing ZipAgents on an on-going basis. Training content is available through multiple channels, including webcasts and live presentations during weekly sales meetings. Employee ZipAgents complete a series of training modules with their manager and other local resources during their first several weeks of employment and are also frequently paired with seasoned ZipAgents for additional in-the-field training. Besides a brief orientation training regarding compliance and document submission, training is optional for independent contractor ZipAgents.
CLIENT ACQUISITION
We want our ZipAgents to focus on providing high-quality client service, rather than finding their next client. Accordingly, for our employee ZipAgents, as well as our independent contractor agents in New York who so desire, we provide leads for clients who are actively searching on our website for properties, or are selling properties in their sales territories. We attract these clients through word of mouth, company press coverage and
10
Table of Contents
advertising. In 2009 we attracted approximately 41% of our leads directly to our website, which involved no direct acquisition costs. We currently have contractual relationships with over 45 Internet publishers. The majority of our lead source agreements are in the form of non-exclusive, short-term agreements (one year or less) that are generally terminable on little or no notice (60 days or less) and with no penalties. In 2009, three independent lead sources generated 10% or more of our leads. HomeGain, Inc. generated approximately 15% of our leads, Google represented approximately 14% of our leads and Trouve represented approximately 10% of our leads during the year. HomeGain competes with us for online customer acquisition.
PRODUCT DEVELOPMENT AND ENGINEERING
At December 31, 2009, our technology team was composed of 41 employees, including a product development team, software engineers, database and data center engineers and a data acquisition team. Our technology team focuses on enhancing and improving our existing technology as well as developing new proprietary tools.
Our technology team is responsible for maintaining property listings data through our over 60 MLS memberships. In order to provide the most comprehensive and timely data available, we download MLS data seven days a week, and for most MLSs, multiple times per day. Currently, we provide information on approximately 1.0 million homes in our searchable database in the markets we serve. To provide our consumers with a more complete understanding of homes and neighborhoods, we combine data from the MLSs with additional local information from other data sources, which we license on a non-exclusive basis.
Our product development team is responsible for fulfilling all product requirements on both our consumer website and the ZAP sales system. This team generally internally releases software updates approximately once per quarter. As part of our development process, the product development team works with users to identify feature enhancements that will provide a better consumer experience, increase ZipAgent productivity and enhance management oversight capabilities. Our system is not dependent on a client’s computer configuration, working with all principal Internet service providers and Internet browsers. Our system is Java-based and uses commercially available hardware and proprietary database technology based on an Oracle platform, making it highly scalable. Our application server is compliant with relevant industry standards.
We serve our clients from a third party co-location facility. In January 2009, we moved our primary facility from Sunnyvale, California, which is operated by Qwest Communications, to Aurora, Colorado, which is operated by ViaWest. The facilities are secured by around-the-clock guards and biometric access screening and are equipped with back-up generators, redundant HVAC and Internet connectivity.
REGULATORY MATTERS
The real estate industry is highly regulated. In the conduct of our business, we must monitor and comply with a wide variety of applicable laws, rules and regulations of both the government and private organizations.
Government regulation
The most extensive regulations applicable to our business are at the state level and are typically overseen by state agencies dedicated to real estate matters. However, the residential real estate industry is also regulated by federal and local authorities.
State regulation. Real estate licensing laws vary from state to state, but generally all individuals and entities acting as real estate brokers or salespersons must be licensed in the state in which they conduct business. A person licensed as a broker may either work independently or may work for another broker in the role of an associate broker, conducting business on behalf of the sponsoring broker. A person licensed as a salesperson must be affiliated with a broker in order to engage in licensed real estate brokerage activities. Generally, a corporation engaged in the real estate brokerage business must obtain a corporate real estate broker license
11
Table of Contents
(although in some states the licenses are personal to individual brokers). In order to obtain this license, most jurisdictions require that an officer of the corporation be licensed individually as a real estate broker in that jurisdiction. If applicable, this officer-broker is responsible for supervising the licensees and the corporation’s real estate brokerage activities within the state. Real estate licensees, whether they are brokers, salespersons, individuals or entities, must follow the state’s real estate licensing laws and regulations. These laws and regulations generally prescribe minimum duties and obligations of these licensees to their clients and the public, as well as standards for the conduct of business, including contract and disclosure requirements, record keeping requirements, requirements for local offices, trust fund handling, agency representation, advertising regulations and fair housing requirements. In each of the 22 states and the District of Columbia where we currently have operations, we have designated one of our officers as the individually licensed broker and, where applicable, we hold a corporate real estate broker’s license.
Payment of rebates or credits to real estate purchasers of the type we offer are permitted in most, but not all, states. In addition, some states have enacted legislation similar to (and in some cases more restrictive than) the federal legislation discussed below.
Federal regulation. In addition to state regulations, several federal laws and regulations govern the real estate brokerage business. The applicable federal regulations include the Real Estate Settlement Procedures Act of 1974, as amended, or RESPA, and federal fair housing laws. RESPA, as applicable to us, is intended to provide for more effective advance disclosures to home buyers and sellers of settlement costs and the elimination of kickbacks or referral fees that tend to increase unnecessarily the costs of certain settlement services. While RESPA has broad-reaching impact on a variety of services associated with the purchase or sale of real estate, including lending, title insurance and other settlement services, its principal application to the real estate brokerage business is to restrict payment of referral fees or the inappropriate splitting of fees (including through arrangements designed to disguise any such illegal payments as legitimate marketing fees), and to require additional consumer disclosures. Generally, it is illegal under RESPA to pay or receive a referral fee or other non-service-related fee, kickback or anything of value in a real estate transaction involving a federally related mortgage loan for the referral of business. RESPA generally restricts us to the receipt of, or payment for, the reasonable market value of services, goods or information actually and permissibly provided in the settlement of such transactions. While RESPA does not prohibit us from entering into legitimate marketing relationships, it does limit the type of business relationships that we can enter into for acquiring client leads or otherwise, as well as the referral of clients to other service providers. RESPA also limits the manner in which we can provide other services to our customers. Federal fair housing laws generally make it illegal to discriminate against protected classes of individuals in housing or brokerage services. Other federal regulations protect the privacy rights of consumers, which affects our opportunities to solicit new clients.
Local regulation. Local regulations also govern the conduct of the real estate brokerage business. Local regulations generally require additional disclosures by the parties to a real estate transaction or their agents, or the receipt of reports or certifications, often from the local governmental authority, prior to the closing or settlement of a real estate transaction.
Federal and state labor regulation. In addition to the real estate regulations discussed above, we are subject to federal and state regulations relating to our employment and compensation practices. For our ZipAgents in New York, who are classified as independent contractors, we are subject to Internal Revenue Service, Fair Labor Standards Act and state law guidelines as they apply to this classification. For our other ZipAgents, who are classified as employees, we are subject to the Fair Labor Standards Act, U.S. Department of Labor regulations and state laws concerning the compensation of employees.
Federal laws and most state laws contain an exemption from their overtime and minimum wage provisions for “outside salespersons.” These exemptions are applied on a case-by-case basis in light of the specific duties performed by an individual, and they are subject to judicial and agency interpretation and legislative change. Where these exemptions are available, we classify our ZipAgents as outside salespersons who meet these exemptions because their duties consist of working in the field selling residential real estate. However, the state
12
Table of Contents
of Nevada has enacted legislation that preempts the outside salesperson exemption that is otherwise available under federal law. Accordingly, we pay our ZipAgents in Nevada minimum wage offset against future commissions, and overtime subject to prior manager approval.
Other states have compensation laws that provide greater benefits to employees than federal law. For example, some states, including California, require the reimbursement of employee expenses regardless of the terms of any employment contract. To address these laws, we have adopted different compensation practices in these states than we use elsewhere.
Third-party rules
In addition to governmental regulations, we are subject to rules established by private real estate trade organizations, including, among others, local MLSs, NAR, state Associations of REALTORS®, and local Associations of REALTORS®. The rules of the various MLSs to which we belong vary, and specify, among other things, how we as a broker member can use MLS listing data, including specifying, in some cases, the use and display of this data on our website.
Additionally, we operate a virtual office website, or VOW, which is a password-protected website that allows us to show comprehensive MLS data directly to consumers without their having to visit an agent. Pursuant to a final settlement agreement approved in November 2008 between NAR, the dominant trade organization in the residential real estate industry, and the U.S. Department of Justice, NAR was required to revise its VOW policy to prohibit NAR, and any NAR-affiliated MLS, from developing policies that unfairly target brokers that operate VOWs. In addition, NAR was required to revise its VOW policy to require that brokers that operate VOWs be treated the same as “traditional” brokerages that do not operate VOWs. Specifically, pursuant to the revised policy, brokers must be permitted to distribute the same listing information on a VOW as “traditional” brokers distribute by hand, fax or email, brokers may not opt-out from showing listings on VOWs, and NAR-affiliated MLSs are prohibited from restricting the listing information provided to VOWs. However, the settlement allows homeowners to opt-out of displaying their home listing information on the Internet, including on VOW and non-VOW websites. While we believe that this settlement and NAR’s new VOW policy have substantially reduced most efforts by the local boards and MLSs to restrict brokers from serving customers through a VOW, there is risk that local boards and MLSs may try to adopt or enforce unreasonable conditions on VOWs such as the one we operate.
NAR, as well as the state and local Associations of REALTORS®, also have codes of ethics and rules governing the actions of members in dealings with other members, clients and the public. We are bound to abide by these codes of ethics and rules by virtue of our membership in these organizations.
COMPETITION
The market for residential real estate brokerage services is highly fragmented at the national level, with no individual brokerage holding more than a 5% share, and the ten largest brokerages holding less than 9% collectively, in 2007, according to REAL Trends. However, the ten largest national brands that franchise individual brokerages accounted for a significant percentage of total brokered transaction volume, providing the potential for significant national and local influence. We compete with these brokerages at the local level to represent home buyers or sellers. Our larger competitors include Prudential Financial, Inc., RE/MAX International Inc. and Realogy Corporation, which owns the Century 21, Coldwell Banker, Better Homes and Gardens and ERA franchise brands, a large corporate relocation business and NRT Incorporated, the largest brokerage in the United States. NRT Incorporated owns and operates brokerages that are typically affiliated with one of the franchise brands owned by Realogy. We are also subject to competition from local or regional firms, as well as individual real estate agents.
We also compete or may in the future compete with various online services, such as LendingTree (which owns RealEstate.com), MarketLeader (formerly HouseValues, Inc.), HomeGain, Inc., Move, Inc. and its Realtor.com affiliate, Zillow and Yahoo! Inc., that also look to attract and service home buyers and sellers using
13
Table of Contents
the Internet. Move is affiliated with NAR, National Association of Home Builders, or NAHB, and a number of major MLSs, which may provide Move with preferred access to listing information and other competitive advantages. While these online services companies are intermediaries providing lead referrals and are not full-service brokerages like us, we compete with these companies to attract consumers to our website.
In addition, the competitive landscape in the residential real estate industry is in the midst of significant changes as new business models enter the marketplace. Also, a growing number of discount firms cater exclusively to clients who are looking for reduced service levels as well as for-sale-by-owner services.
We believe that the key competitive factors in the residential real estate segment include the following:
| • | quality of the home data available to clients; |
| • | quality of the agents, including ability to attract, retain and manage quality agents; |
| • | level of responsiveness to clients; |
| • | client’s ability to control the home purchase and home sale process; |
| • | local knowledge; |
| • | level of commissions charged to sellers or incentives provided to buyers; |
| • | ease of product usability; and |
| • | overall quality client service. |
We believe that our Internet-enabled, employee-based model, our use of rebates (where permitted) and reduced commissions, our proprietary ZAP technology and ZipNotify, our ability to inter-operate with multiple MLSs, and our other technologies position us well relative to our competition to address these competitive factors in our industry.
INTELLECTUAL PROPERTY
We rely on a combination of trademark, copyright, trade secret and patent laws in the United States as well as confidentiality procedures and contractual provisions to protect our proprietary technology and our brand. We currently have trademarks registered or pending in the United States and abroad for our name and certain words and phrases that we use in our business. We also rely on copyright laws to protect computer programs relating to our website, our proprietary database and ZAP. We have registered numerous Internet domain names related to our business in order to protect our proprietary interests, and we hold a patent issued in the United States that covers certain processes and methodologies related to transacting residential real estate on the Internet. We also enter into confidentiality and invention assignment agreements with our employees and consultants and confidentiality agreements with other third parties, and we strictly control access to our proprietary technology.
From time to time, we may encounter disputes over rights and obligations concerning intellectual property. Also, the efforts we have taken to protect our proprietary rights may not be sufficient or effective. Any significant impairment of our intellectual property rights could harm our business, our brand and reputation, or our ability to compete. Also, protecting our intellectual property rights could be costly and time consuming.
SEASONALITY
The residential real estate market traditionally has experienced seasonality; please see Item 1A of this report under “Our operating results are subject to seasonality and vary significantly among quarters during each calendar year, making meaningful comparisons of successive quarters difficult.”
14
Table of Contents
EMPLOYEES
At December 31, 2009, we had 3,346 employees. Of this total, 3,085 were licensed ZipAgents, 144 were district directors or field support personnel and 117 were corporate employees. We consider our employee relations to be good.
EXECUTIVE OFFICERS
The following table sets forth certain information about our executive officers as of March 1, 2010:
| Name |
Age | Position | ||
| Joseph Patrick Lashinsky |
42 | Chief Executive Officer, President and Director | ||
| Charles C. (Lanny) Baker |
43 | Executive Vice President and Chief Financial Officer | ||
| William C. Sinclair |
60 | Executive Vice President, Operations and Business Development | ||
| Genevieve C. Combes |
42 | Senior Vice President, Technology and Operational Strategy | ||
| David A. Rector |
63 | Senior Vice President, Controller and Chief Accounting Officer | ||
| Robert J. Yakominich |
53 | Senior Vice President, Sales | ||
| Joan L. Burke |
57 | Vice President, Human Resources | ||
| Samantha E. Harnett |
34 | Vice President, General Counsel and Secretary |
Joseph Patrick Lashinsky has served as our Chief Executive Officer and a member of our Board of Directors since June 2007. Mr. Lashinsky has also served as our President since January 2007. From September 2006 to January 2007, Mr. Lashinsky served as our Executive Vice President of Product Strategy and Development. From April 2005 to September 2006, Mr. Lashinsky served as our Senior Vice President of Product Strategy and Development. From February 2000 to April 2005, Mr. Lashinsky served as our Vice President in a number of marketing, business development and sales positions. Prior to joining us, from March 1999 to February 2000, Mr. Lashinsky served as Group Marketing Manager at Del Monte Foods Company. Mr. Lashinsky holds a Masters of Business Administration degree from the University of California at Los Angeles and a Bachelor of Arts degree in political economies of industrialized societies from the University of California at Berkeley.
Charles C. (Lanny) Baker has served as our Executive Vice President and Chief Financial Officer since December 2008. From March 2005 to June 2007, Mr. Baker served as Senior Vice President and Chief Financial Officer of Monster Worldwide, Inc., an online recruitment services company. From June 1993 to March 2005, Mr. Baker served in positions of increasing responsibility in the Equity Research department at Smith Barney, a division of Citigroup, Inc., serving as Managing Director from January 2000 to March 2005. Prior to joining Smith Barney, Mr. Baker spent two years as an Equity Research Analyst at Morgan Stanley & Co. and two years in research assistant positions at Donaldson, Lufkin & Jenrette. Mr. Baker is currently the chair of the audit committee and the nominating and corporate governance committee of The Knot, Inc., a lifestages media company targeting couples planning their weddings and future lives together. Mr. Baker holds a Bachelor of Arts degree in history from Yale College.
William C. Sinclair has served as our Executive Vice President of Operations and Business Development since August 2005. From September 2002 to August 2005, Mr. Sinclair served as our Senior Vice President of Sales and Operations. Prior to joining us, from October 1998 to September 2002, Mr. Sinclair served as Executive Vice President and Chief Operating Officer for the Asia Pacific division of Radisson Hotels and Resorts Worldwide. From December 1997 to October 1998, Mr. Sinclair served as Vice President of New Business Development for Promus Hotel Corporation. Mr. Sinclair holds a Bachelor of Arts degree in business from Washington State University.
Genevieve C. Combes has served as our Senior Vice President of Technology and Operational Strategy since December 2008. From December 2006 to December 2008, Ms. Combes served as our Senior Vice President of Planning and Operations. From May 2005 to December 2006, Ms. Combes served as our Vice President of Business Planning and Strategy. From August 2004 to May 2005, Ms. Combes served as our Director of
15
Table of Contents
Strategic Analysis. Prior to joining us, Ms. Combes spent over ten years in various capacities at JP Morgan H&Q’s (previously Hambrecht & Quist) Equity Research Department. Most recently Ms. Combes served as Managing Director of JP Morgan H&Q’s Consumer Research Group. Ms. Combes holds a Bachelor of Arts degree in economics cum laude from the University of California at Santa Cruz.
David A. Rector has served as our Senior Vice President since May 2006 and as our Controller and Chief Accounting Officer since December 2008. Mr. Rector served as our Chief Financial Officer from May 2007 to December 2008, as our Interim Chief Financial Officer from January 2007 until May 2007, as our Chief Accounting Officer from May 2004 to May 2007, as our Controller from April 2002 to May 2007, and as our Vice President from October 2002 to May 2006. Prior to joining us, from June 1999 to January 2002, Mr. Rector worked in various financial positions for several companies as a consultant for Resources Connection Inc., a consulting firm. Prior to that, he held senior financial positions at various companies, including commercial real estate companies Allegiance Realty Group and Fox & Carskadon Financial Corporation and served as an audit manager at Price Waterhouse. Mr. Rector is a Certified Public Accountant and holds a Bachelor of Science degree in business administration from the University of California at Los Angeles.
Robert J. Yakominich has served as our Senior Vice President of Sales since August 2007. From September 2003 to August 2007, Mr. Yakominich served as Vice President of Sales for The Reiser Group, a sales and marketing agency to residential property developers. From December 1997 to May 2003, Mr. Yakominich served as Executive Vice President of Sales for Citysearch.com (a division of InterActive Corporation), an online lifestyle guide that advertises businesses within communities. Mr. Yakominich holds a Masters of Business Administration degree from the University of San Francisco and a Bachelor of Business Administration degree from Bernard Baruch College.
Joan L. Burke has served as our Vice President of Human Resources since September 2008. From October 2007 to August 2008, Ms. Burke served as the Vice President of Human Resources of Shoretel, Inc., a provider of unified communications systems. From March 2004 to September 2007, Ms. Burke served as the Senior Vice President of Human Resources of ZANTAZ Inc., a company specializing in e-mail archiving and e-discovery, which was acquired by Autonomy ZANTAZ in July 2007. From March 2002 to March 2004, Ms. Burke served as the Senior Vice President of Human Resources of American Baptist Homes of the West (ABHOW), a provider of lifestyle and long-term care services to retired individuals. Ms. Burke holds a Bachelor of Arts degree in American studies from Albertus Magnus College.
Samantha E. Harnett has served as our Vice President, General Counsel and Secretary since November 2009. From April 2008 to November 2009, Ms. Harnett served as our Vice President, Assistant General Counsel and Assistant Secretary. From April 2007 to April 2008, Ms. Harnett served as our Assistant General Counsel and Assistant Secretary. From May 2005 to April 2007, Ms. Harnett served as our Legal Counsel. From August 2003 to May 2005, Ms. Harnett practiced in the areas of litigation and employment law at Wilson Sonsini Goodrich & Rosati, P.C. Ms. Harnett holds a Juris Doctor degree from the Santa Clara University School of Law and a Bachelor of Arts degree in psychology from California State University, Chico.
| Item 1A. | Risk Factors: |
RISK FACTORS
Because of the following factors, as well as other variables affecting our operating results and financial condition, past financial performance may not be a reliable indicator of future performance, and historical trends should not be used to anticipate results or trends in future periods.
16
Table of Contents
RISKS RELATED TO OUR BUSINESS AND INDUSTRY
We have experienced net losses in recent quarters and expect to incur losses in the future.
We have had a history of net losses from our inception in January 1999 through the first half of 2003 and at December 31, 2009 had an accumulated deficit of $93.4 million. While we were profitable in several quarters from 2003 through 2006, we have experienced quarterly net losses since then. If we do not become consistently profitable, our accumulated deficit will grow larger, and we could require additional financing to continue operations. If we do not become consistently profitable and additional funding is required to support our business, financing may not be accessible on acceptable terms, if at all. We cannot guarantee that our revenues will increase sufficiently to achieve and maintain profitability on a quarterly or annual basis.
Our profitability is dependent of the health of the residential real estate market, which is subject to macroeconomic forces that are beyond our control and may be difficult to predict.
The success of our business depends to a significant extent on the health of the residential real estate market, which traditionally has been subject to cyclical economic swings as well as other changes in local, regional, national or seasonal economic conditions. The decision to purchase or sell residential real estate can be delayed or terminated based on macroeconomic conditions that, for example, reduce discretionary income. Macroeconomic factors that could adversely affect the demand for residential real estate and harm our business include, among others, economic slowdown or recession, changes in the availability and affordability of mortgages or extensions of credit, a rise in the number of foreclosures and other distressed properties available for sale, rising interest rates, inflation, disruptions in capital markets, declines in the stock market, adverse tax policies or changes in other regulations, increased unemployment, lower consumer confidence, lower wage and salary levels, war or terrorist attacks, natural disaster, energy price spikes, or actions taken by the Federal Reserve Board to regulate the supply of money, or the public perception that any of these events may occur. In addition, federal and state governments, agencies and government-sponsored entities such as Fannie Mae and Freddie Mac could take actions that result in unforeseen consequences or that otherwise could negatively impact our business.
The impact on our business of macroeconomic forces, over which we have no control, can be difficult to predict. For example, demand for housing could decrease, which should reduce the number of completed transactions and, consequently, revenues. Home sales prices could decrease, which should depress revenue and gross margins on completed transactions. Gross margins could decrease through higher costs. These and other consequences could significantly impair our ability to achieve and maintain profitability.
We devote considerable resources to technologies and practices designed to make our agents more productive than the industry average, and if we do not achieve sufficient agent productivity and retention to offset these costs, we likely will not be profitable unless we change our business model.
Our business model is designed to help our agents achieve higher transaction volumes at an overall lower cost per transaction that the industry average. To do so, we have adopted technologies and practices that differ significantly from most traditional real estate brokerages, such as our innovative use of technology to help our agents, buyers and sellers select and market properties, the employee agent model we typically use, our centralization of functions such as lead acquisitions, marketing and advertising, and our use of rebates and discounts to attract customers. Through these practices, we incur costs that most traditional real estate brokerages do not, including costs relating to employee benefits, expense reimbursement, training and transactional support in addition to technology development. We incur some of these costs before our agents have even completed their first transaction and generated any revenues to offset these costs. Consequently, we believe that agent turnover is more costly to us than to traditional real estate brokerages and we therefore must retain our agents longer than the industry average to recoup our investment. Reaching this goal is challenging, given that we are in a high-turnover industry, and most of our agent turnover occurs in the first few months after our agents commence employment. In addition, because our agents tend to become more productive the longer they stay
17
Table of Contents
with us, retention of our more seasoned agents is of special importance to achieving profitability. If we are unable to achieve the necessary level of agent productivity and retention to offset these costs, we likely will not achieve profitability unless we change aspects of our business model.
If we do not remain innovation leaders in our industry, we may not be able to grow our business and leverage our costs to achieve profitability.
Innovation has been critical to our ability to leverage our costs while competing against other brokerages for clients and agents. For example, we have been at the forefront of brokerages in embracing the Internet by operating a virtual office website, or VOW, which reduces our need for office space and facilitates the transaction of business away from an office. We have also been at the forefront of managing lead acquisition costs by employing technology designed to promote efficient lead utilization, by using a centralized lead acquisition and distribution function, and by attracting consumers directly to our site for those areas where we operate. As others follow our practices or develop their own innovative practices, and as customers increasingly gain options for online real estate information and services, our ability to leverage our costs to achieve profitability may erode. For example, certain other brokerages, media companies, Multiple Listing Services, or MLSs, and the National Association of REALTORS®, or NAR, operate competing websites and are increasingly using the Internet to market to potential customers throughout the United States. Customers may not distinguish or value the benefits of our website and technology offerings as compared against these competing offerings. Such organizations could also build applications or offer products, including home listings and related information, that attract online traffic away from our website. In particular, NAR is in the process of developing a nation-wide MLS, which could significantly divert potential customers away from our website. Such organizations could devote substantial resources to dominating social media and online advertising, which would also impair our ability to attract website traffic. If our advantage in attracting website traffic erodes, our need to purchase leads from third parties will increase, thus increasing our costs. If we do not remain on the forefront of innovation to leverage our costs effectively while competing for clients and agents, we may not be able to achieve profitability.
If we do not adapt to changes in technologies and practices relating to the nature and use of information, our operating results could suffer.
We believe that we rely more heavily on technology than traditional “bricks and mortar” brokerages to gather, store, evaluate and communicate information, including our efforts to generate leads via the Internet, to prioritize leads, to communicate with agents via our ZAP agent platform, and to service customers, including by providing online access to comprehensive MLS listings. To continue to perform those functions effectively, we will need to adapt to changes in technologies and practices concerning the nature and use of information. For example, we will need to adapt our website and our ZAP agent platform to be compatible with new Internet and mobile access tools. We may need to adapt our approach for generating website traffic to address evolving customer interests, for example, a greater interest in social websites, in local neighborhood information, or in alternative media. We may need to adapt our technology or change our practices to address new Internet regulations, as well as new “spam” filters that incorrectly treat our emails to clients as unsolicited materials and block them. We must constantly modify our technology to successfully interact with each independent MLS in order to maintain access to that MLS’s home listings information. In addition, if the current practice of listing homes for sale on individual MLSs is challenged or replaced by a competing system, such as nation-wide MLS system being developed by NAR, we will need to adapt to that change to continue operating our business. Some of our competitors may respond more quickly to new or emerging technologies and practices relating to the nature and use of information. If we cannot make such adaptations quickly so as not to erode our competitive advantages in attracting clients and agents, or we do so in a manner that increases our expenses without a related increase in revenues, our operating results could suffer.
18
Table of Contents
Our business practices are heavily regulated, and we may suffer significant financial harm and loss of reputation if we do not comply, cannot comply, or are alleged to have not complied with applicable laws, rules and regulations.
Our business practices are heavily regulated by numerous federal, state and local authorities, as well as the standards of private trade associations to which we belong. These regulations and standards are discussed in more detail in Item I of Part I of this report under “Regulatory Matters.” In addition to the employment and compensation regulations discussed in the following risk factor, the laws, rules and regulations that apply to our business practices include the following:
| • | State real estate brokerage licensing requirements, as well as statutory due diligence, disclosure, record keeping and standard-of-care obligations relating to these licenses; |
| • | The federal Real Estate Settlement Procedures Act, the federal Fair Housing Act, and federal advertising and other laws, as well as comparable state statutes; |
| • | Rules of trade organization such as NAR, local MLSs, and state and local AORs; |
| • | Licensing requirements and related obligations that could arise from our business practices relating to the provision of core services; |
| • | Privacy regulations relating to our use of personal information collected from the registered users of our website; |
| • | The Federal Trade Commission Act and similar state laws that prohibit unfair and deceptive business practices with consumers; |
| • | Laws relating to the use and publication of information through the Internet; and |
| • | State laws that restrict or prohibit our payment of rebates. |
Because our business practices are heavily regulated, maintaining legal compliance is challenging and increases our costs, and we must continually monitor our business practices for compliance with applicable laws, rules and regulations. We may not become aware of all the laws, rules and regulations that govern our business, or be able to comply with all of them, given the rate of regulatory changes, ambiguities in regulations, contradictions in regulations between jurisdictions, and the difficulties in achieving both company-wide and region-specific knowledge and compliance. If we fail, or are alleged to have failed, to comply with any existing or future applicable laws, rules and regulations, we could be subject to lawsuits and administrative complaints and proceedings, and we could incur significant defense costs, settlement costs, damages and penalties for non-compliance. We could also have our business licenses suspended or revoked, have our business practices enjoined, or be required to modify our business practices, which could materially impair, or even prevent, our ability to conduct business in any or all of our markets. Any such events could also damage our reputation and impair our ability to attract clients and agents without increasing our related costs. Although we carry general liability insurance, our insurance may not cover claims of these types or may be inadequate to protect us from all liability that we may incur. In addition, if we cannot in the future obtain and maintain all of the regulatory approvals and licenses we may need to carry on our business as we choose, our ability to conduct business may be harmed. Further, any lobbying or related activities we undertake in response to current or new regulations could substantially increase our operating costs.
We may suffer significant financial harm and loss of reputation if we do not comply, cannot comply, or are alleged to have not complied with applicable laws, rules and regulations concerning our employment and compensation practices.
In addition to the regulations discussed in the previous risk factor, we are subject to laws, rules and regulations relating to our employment and compensation practices. In New York, our agents are independent contractors, and, like most brokerages, we are subject to the Internal Revenue Service regulations and applicable state law guidelines regarding independent contractor classification. Outside of New York, our ZipAgents are employees, and because this practice is rather unusual in our industry, we are subject to related regulations that
19
Table of Contents
may not apply to traditional brokerages. We must reimburse the business expenses of our employee agents, and in some states, including California, this obligation cannot be waived or limited by contract. We classify employee ZipAgents as exempt from federal and state regulations regarding overtime and minimum wage payments because their duties, which consist of working in the field selling residential real estate, are designed to qualify for the “outside sales exemption” under the terms of the Fair Labor Standards Act and various state laws. However, state law in Nevada prohibits application of the federal outside sales exemption for employees in that state and thus, in Nevada, we must pay our employee agents minimum wage and overtime pay.
These employment and compensation regulations are subject to judicial and agency interpretation as well as legislative change. Accordingly, there is no assurance as to how long current regulations will remain in place. In addition, as to any individual ZipAgent, in the event his or her duties become different than those currently assigned and contemplated, it might be determined that the outside sales exemption is inapplicable to that agent, or in the case of independent contractor ZipAgents, that the independent contractor classification is inapplicable. Further, in the event that legal standards for classification of agents as outside salespersons or independent contractors change or appear to be changing, it may be necessary to modify the ZipAgent compensation structure in some or all of our markets, including by paying additional compensation or reimbursing additional expenses. Also, if our compensation, reimbursement or classification policies and practices are challenged, such as through the lawsuit described in Item 3 of Part I of this report, we could incur substantial costs, penalties and damages, including back pay, unpaid employee benefits, taxes, expense reimbursement and attorneys’ fees. For example, when our former agent compensation and expense reimbursement policies were challenged in class action lawsuits filed against us from 2005 through 2007, we incurred material litigation and settlement costs and modified our expense reimbursement policies, as described in our reports filed previously with the Securities and Exchange Commission. Any of these outcomes could result in substantial costs to us, could significantly impair our ability to conduct our business as we choose, and could damage our reputation and impair our ability to attract clients and agents.
Our agent value proposition is uncommon in the industry, and if agents do not understand this proposition or value its attributes, whether in its current form or as we may test or implement changes to it, we may not be able to attract, retain and incentivize agents.
Unlike most of our competitors, our agents are typically employees and not independent contractors. Through this practice, we incur costs for our agents that traditional real estate brokerages do not, including costs relating to employee benefits, expense reimbursement, centralized customer lead acquisition, training and transactional support. Also, as permitted by law, and unlike most of our competitors, we provide rebates and discounts to our clients. Because of these costs, our agents generally earn a lower per transaction commission than traditional agents. Our lower commission split may be particularly unattractive to certain higher performing agents. Also, because our model is uncommon in our industry, agents may not understand or appreciate its value proposition. In addition, agents may not appreciate the modifications to our agent compensation model that we may test and implement from time to time. If agents do not understand our employee compensation model, or do not perceive it to be more valuable than the traditional independent contractor model used by most of our competitors, whether through the provision of leads, training, support, employee benefits, expense reimbursement, more opportunities to close transactions or otherwise, we may not be able to attract, retain and incentivize them to grow our revenues without significantly increasing our commission splits or other costs, which would reduce our gross margins.
Our efforts to grow local market share, including by building our listings business, will face intense competition, and we cannot guarantee that these efforts will be successful or profitable.
The residential real estate industry is intensely competitive and highly fragmented. To capture and retain market share, we must compete successfully against other brokerages not only for large numbers of clients, but also for large numbers of agents in our headcount-intensive growth model. Because the market is highly fragmented and brokerage fees are variable, competitors may reduce fees to attract business. In addition, many of these brokerages have valuable relationships, innovative models, or access to greater resources than we do. Many
20
Table of Contents
of our markets are composed of entrenched brokerages with superior local referral networks, name recognition and perceived local knowledge and expertise. These attributes give these brokerages an advantage in agent recruitment and retention, in attracting clients, and in building their listings business. Many brokerages also have more experience than us in acting as listing agents, as we have traditionally focused on clients looking to buy homes (with buyers representing 93% of our transactions in 2009). Some of our competitors with greater resources may be able to undertake more extensive marketing campaigns or to better withstand price competition in a market. Unless we can develop the relationships, reputation, expertise and personnel to compete with these brokerages without reducing our prices or increasing our agent compensation, we may not be able grow our listings business, attract buyers, or attract and retain agents as needed to grow our market share profitably.
We derive a significant portion of our leads through third parties, and if any of our significant lead generation relationships are terminated, impaired or become more expensive, we may not be able to attract new clients and grow our business without a substantial increase in expenses.
We generate leads for our ZipAgents through many sources, including leads from third parties with which we have only non-exclusive, short-term agreements that are generally terminable on little or no notice and with no penalties. Our largest third-party lead source, HomeGain, Inc., which competes with us for online customer acquisition, generated approximately 15%, 19% and 21% of our leads during 2009, 2008 and 2007, respectively. We could lose a large lead supplier, whether through insolvency or otherwise. Also, state laws or NAR or MLS rules could make it more difficult or expensive for lead generators to provide us with sufficient leads. Should any of these events occur, or should leads otherwise become less available or more costly, we may not be able to obtain a sufficient number of leads to attract new clients and grow our business without a substantial increase in expenses.
Unless we develop, maintain and protect a strong brand identity, we may not be able to grow our business without reducing our gross margins.
We believe a strong brand that expands a company’s presence and builds its reputation is a competitive advantage in attracting both clients and agents. Accordingly, we plan to use our marketing and advertising efforts to promote a differentiated brand known for innovation and fast, excellent customer service. By building our brand, we hope to achieve greater website traffic and thus more effective leveraging of lead acquisition costs, market share growth, development of our listings business, and better agent recruitment and retention. However, our branding efforts may not have a material positive impact on our brand identity. Further, our branding message may not resonate with consumers or agents. In addition, developing a positive brand will depend on our ability to provide a high quality consumer experience and high quality service, which we may not do successfully. If we are unable to develop, maintain and protect our brand, we may not be able to increase our revenues without a disproportionate increase in our client acquisition and agent compensation costs, which would reduce the profitability of our business and negatively impact our financial condition.
If our arrangements for providing access to core services become impaired, our financial condition could suffer.
We have entered into a marketing agreement with Bank of America. Under that agreement, Bank of America pays us a flat monthly fee (which typically represents less than 3% of our monthly net revenues) in exchange for our commitment to market its mortgage products and other services to our clients. We routinely explore additional opportunities to provide or market services related to the purchase, sale and ownership of a home, which we refer to as core services. Some of these services may be offered through subsidiaries and other affiliates, while others may be offered through marketing arrangements with independent third parties, such as title, mortgage and insurance companies. If these relationships are terminated or otherwise become impaired, we could lose sources of revenues that we may not be able to readily replace, and our brand name and client relationships could suffer. Also, upon the termination of an arrangement with an independent third party to provide core services, we or our affiliates may be required to pay certain costs or fees or be precluded from
21
Table of Contents
performing such services for a period of time. In addition, our clients could have a more difficult time obtaining the financing or other services needed to purchase a home through us, which could negatively impact our transaction revenues. Any of these events could negatively impact our financial condition.
Providing online access to comprehensive MLS listings and related information concerning the residential real estate market is a hallmark of our business, and our ability to attract and service clients and to manage lead acquisition costs would be harmed if our ability to provide or advertise this access is impaired.
A key component of our business strategy is to attract clients directly to our website, thereby increasing our client base and reducing our need to purchase leads from third parties. To do so, through our website, we offer clients access to, and the ability to search, real estate listings posted on the MLSs in the markets we serve, as well as related neighborhood information and maps. Our ability to display this information is subject to agreements with third parties, which may or may not be available on acceptable terms in the future. Those third parties operate their own technology platforms, and we may be unable to interoperate with those platforms cost-effectively or at all. Further, we could lose access to that information in the event of a systems failure or a dispute with those information providers. In addition, our ability to provide Internet access to home listings information could be diminished if increasing numbers of homeowners opt-out of providing their home listings information on the Internet, which is permitted by the rules of many MLSs, including those affiliated with NAR. Also, NAR is in the process of developing a nation-wide MLS, which could significantly change the current practice of listing homes for sale on individual MLSs. It is too soon to tell whether this new model will impair the home listings information we make available on our website, or the perceived value of that information. Should any such event occur, we expect that our website and services would become less attractive to potential clients, our ability to attract and service clients would be harmed, and we would likely need to purchase additional, and more costly, leads from third parties, increasing our expenses.
Our customer value proposition includes rebates, and we may lose a competitive advantage in attracting consumers if we cannot or choose not to provide them.
Currently, our clients who are home buyers represent a substantial majority of our business and revenues. Where permitted by law, we provide our home buyer clients a cash rebate at closing. Our willingness to provide rebates is subject to a number of considerations, including their perceived value by our buying clients, which could be impaired by changes in mortgage-related rules, regulations, or practices, including those of state or Federal agencies, government-sponsored agencies, or lenders. Also, the laws of some states restrict or prohibit our ability to provide rebates or share commissions with clients who are not licensed real estate agents. In such states in which we currently operate, we have needed to modify our pricing and rebate model to comply with those laws, and we may need to make additional adjustments should we decide to expand into additional states. We cannot predict whether alternative approaches will be cost effective or attractive to prospective clients. If we determine not to offer rebates in any or all of our markets for these or other reasons, our ability to attract customers may be impaired.
Our efforts to offer advertising and lead generation services to others could detract from our ability to engage in residential real estate transactions with visitors to our website.
We have entered into agreements to provide advertising and lead generation services to third parties in exchange for fixed monthly payments and, in some cases, volume-based and performance-based fees. We are exploring additional opportunities to leverage the advertising and lead generation capacities of our website. These activities may distract visitors to our site. They can also interrupt the registration-to-transaction path of our residential real estate sales business, including by leading potential customers away from our website. In addition, these activities may detract from our perceived commitment to user satisfaction and customer service, or may not be well received by visitors to our site for other reasons. Any of these outcomes could impair our ability to engage in residential real estate transactions with our website visitors.
22
Table of Contents
As we pursue opportunities to increase our revenues, we may reduce our profit margins.
We may implement changes to our business model and operations to improve our revenues that cause a disproportionate increase in our expenses and reduce our profit margins. For example, we may increase the portion of our business that is composed of representing sellers in their home listings, through which we would incur costs that we do not incur when representing buyers, such as marketing costs. We may make further revisions to our agent compensation model or replace it with a different model. We may disproportionately build our business in lower-priced markets or with transactions that comprise lower-priced homes. We may expand into new markets or new businesses, which could involve significant start-up costs that may only be recovered, if ever, after we have been operating in those markets or businesses for some time. Any of these attempts to improve our revenues could result in a disproportionate increase in our expenses and in reduced profit margins.
Our operating results are subject to seasonality and vary significantly among quarters during each calendar year, making meaningful comparisons of successive quarters difficult.
The residential real estate market traditionally has experienced seasonality, with a peak in the spring and summer seasons and a decrease in activity during the fall and winter seasons. Revenues in each quarter are significantly affected by activity during the prior quarter, given the typical 30- to 45-day time lag between contract execution and closing for traditional home purchases. For non-traditional sales, the time lag from contract execution to closing can be a few months. Historically, this seasonality has caused our revenues, operating income, net income and cash flow from operating activities to be lower in the first and fourth quarters and higher in the second and third quarters of each year. However, there can be no assurance that the seasonality pattern for any fiscal year will be consistent with past experience, and macroeconomic changes in the market could mask the impact of seasonality.
Factors affecting the timing of real estate transactions that can cause our quarterly results to fluctuate include the timing of widely observed holidays and vacation periods, decisions to relocate prior to the start of the school year, inclement weather, and the timing of employment compensation changes and events, such as pay raises and bonus payments. We expect our revenues to continue to be subject to these seasonal fluctuations, which, combined with any growth in our business and the effects of macroeconomic market changes, may make it difficult to compare or analyze our financial performance effectively across successive quarters.
Our failure to effectively manage the growth of our technology and control systems to service our clients and agents and maintain legal compliance could adversely affect our financial position.
As our business grows in terms of the number of transactions we service, the number of agents we manage, and the number of markets in which we operate, our success will depend on our ability to expand, maintain and improve the technology that supports our business operations, as well as our financial and management information and control systems, and to maintain effective cost controls. Our ability to manage these efforts and to maintain legal compliance could be thwarted by many factors, including turnover in management and the lack of adequate staffing with the requisite expertise and training. If our operational technology is not sufficient to service our agents or clients, then agent retention could decrease, client service could suffer, and our costs could increase. In addition, if our systems, procedures or controls are not adequate to support our operations and reliable, accurate and timely financial and other reporting, we may not be able to satisfy regulatory scrutiny or contractual obligations with third parties and may suffer a loss of reputation. Any of these events could negatively affect our financial position.
Our business, financial condition and reputation may be substantially harmed by systems interruptions, delays and failures.
The performance and reliability of our technology infrastructure are critical to our reputation and ability to attract and retain clients and agents. Our systems and operations are vulnerable to interruption or malfunction due to certain events beyond our control, including natural disasters, such as earthquakes, fire and flood, power loss, telecommunication failures, break-ins, sabotage, computer viruses, intentional acts of vandalism and similar
23
Table of Contents
events. In addition, we rely on third party vendors to operate our network infrastructure co-locations and to provide additional systems and related support. If we cannot continue to retain these services on acceptable terms, our access to these systems and services could be interrupted. Any systems interruption, delay or failure could result in substantially fewer transactions, increased costs, litigation and other consumer claims and could damage to our reputation, any of which could substantially harm our financial condition.
We need to retain key personnel or our business could be harmed.
Our success depends on the contributions of Mr. J. Patrick Lashinsky, our President and Chief Executive Officer, Mr. Charles C. (Lanny) Baker, our Chief Financial Officer, and other senior level sales, operations, marketing, technology and financial officers. With the exception of Mr. Lashinsky and Mr. Baker, none of our officers or key employees has an employment agreement, and their employment is at will. We do not have “key person” life insurance policies covering any of our executives. The loss of the services of one or more of our key personnel could seriously harm our business.
Our business is geographically concentrated, which makes us more susceptible to business interruption and financial loss due to natural disasters, inclement weather, economic or market conditions or other regional events outside of our control.
To date, our business has been conducted principally in a few states in the western United States, especially California, and along the eastern seaboard. For example, we derived approximately 33% and 37% of our net transaction revenues in the State of California in 2009 and 2008, respectively. Our geographic concentration makes us as a whole more vulnerable to the effects of forces and events beyond our reasonable control, such as regional disasters including earthquakes, harsh weather, economic or market conditions, or other events outside of our control, such as shifts in populations away from markets that we serve, or terrorist attacks. These events could cause us to sustain a business interruption or other financial loss that would be greater than if our business were more dispersed geographically. In addition, our headquarters is located in California in the San Francisco Bay region, which is known for earthquakes. A disaster in this region could interrupt our financial functions and impair access to internal systems, documents and equipment that are critical to the operation of our business.
Our intellectual property rights are valuable and our failure to protect those rights could adversely affect our business.
Our intellectual property rights, including existing and future patents, trademarks, trade secrets and copyrights, are and will continue to be valuable and important assets of our business. We believe that our proprietary ZAP technology and ZipNotify, as well as our ability to interoperate with multiple MLSs and our other technologies and business practices, are competitive advantages and that any duplication by competitors would harm our business. We have taken measures to protect our intellectual property, but these measures may not be sufficient or effective. For example, we seek to avoid disclosure of our intellectual property by requiring employees and consultants with access to our proprietary information to execute confidentiality agreements. We also seek to maintain certain intellectual property as trade secrets. Intellectual property laws and contractual restrictions may not prevent misappropriation of our intellectual property or deter others from developing similar technologies. In addition, others may develop technologies that are similar or superior to our technology, including our patented technology, or that otherwise prevent, limit or interfere with our ability to use our intellectual property. Any significant impairment of our intellectual property rights could harm our business.
We could be subject to intellectual property rights disputes that adversely affect our business.
As noted above, our business depends on the protection and utilization of our intellectual property to provide our products and services. We may bring lawsuits to protect against the potential infringement of our intellectual property rights. In addition, other companies, including our competitors, may make claims against us alleging our infringement of their intellectual property rights. Any intellectual property claims brought by or against us, with or without merit, could be time-consuming and expensive to litigate or settle and could significantly divert management resources and attention. If we are unable to resolve those claims in our favor, we
24
Table of Contents
may be required to pay damages, to stop using any infringing technology, to seek a license for that technology, which may not be available on acceptable terms, or to develop alternative non-infringing technology, which may require significant effort and expense. If we cannot license or develop alternative technology for any infringing aspects of our business on attractive terms, we may be forced to limit our product and service offerings. Any of these results could harm our business.
We intend to evaluate acquisitions or investments in complementary technologies and businesses and we may not realize the anticipated benefits from, and may have to pay substantial costs related to, any acquisitions, mergers, joint ventures or investments that we undertake.
As part of our business strategy, we plan to evaluate acquisitions of, or investments in, complementary technologies and businesses, including acquisitions of our own stock. We may be unable to identify suitable acquisition candidates in the future or to make these acquisitions on a commercially reasonable basis. If we complete an acquisition, merger, joint venture or investment, we may not realize the benefits we expect to derive from the transaction. Any future acquisitions and investments would have several risks, including:
| • | Our inability to successfully integrate acquired business cultures, personnel, systems, technologies or operations; |
| • | Problems integrating and maintaining uniform standards, procedures, controls, policies, books and records, including problems relating to the adequacy of internal controls and to reporting; |
| • | Diversion of management’s attention; |
| • | Loss of key employees of acquired businesses; |
| • | Disruption of existing operations; |
| • | Risks associated with operating a business or in a market in which we have little or no prior experience; |
| • | Our inability to recover the costs of acquisition, merger, joint venture or investment; |
| • | Accounting risks, including risks associated with accounting for acquisitions, potential amortization of intangible assets, and potential write-off of acquired assets; |
| • | Potentially dilutive issuances of equity securities or the incurrence of debt or contingent liabilities; |
| • | Our inability to increase earnings per share; and |
| • | Assumption of liabilities, including unknown and unforeseen liabilities. |
OTHER RISKS RELATED TO OWNERSHIP OF OUR COMMONSTOCK
The trading price of our stock has been, and may continue to be volatile.
The trading price of our common stock may fluctuate widely. For example, our closing stock price on The NASDAQ Stock Market for the 52 weeks ended March 1, 2010 ranged from a low of $2.01 to a high of $5.00. Many factors can cause stock price fluctuation, some of which are beyond our control. These factors include, among others, the risks identified above, as well as the following factors:
| • | Indicia of our financial performance, such as variations in our quarterly results of operations, changes in our financial guidance for future periods, inability to meet quarterly or yearly performance estimates or targets, and changes in performance estimates or recommendations, or termination of coverage, by securities analysts; |
| • | Announcements by us, our competitors or lead source providers, including announcements about strategic alliances; |
| • | The relatively low level of public float and average daily trading volumes of our common stock; |
25
Table of Contents
| • | The sale of substantial amounts of our common stock in the public market, including by investors who still own a significant number of our shares issued before our public offering, or from the perception that these sales could occur; |
| • | Any repurchase by us of our outstanding stock; |
| • | Our adoption of any stockholder rights plan; and |
| • | Broad market and industry factors that are independent of our actual operating performance. |
In addition, following periods of volatility in the overall market and the market price of a company’s securities, securities class action litigation has often been instituted against these companies. Such litigation, if instituted against us, could result in substantial costs and a diversion of our management’s attention and resources and could harm the price of our common stock. Although we carry general liability and errors and omissions insurance, our insurance may not cover claims of these types or may be inadequate to protect us from all liability that we may incur.
Our principal stockholders, executive officers and directors own a significant percentage of our stock, and as a result, the trading price for our shares may be depressed and these stockholders can take actions that may be adverse to your interests.
Our executive officers and directors and entities affiliated with them, in the aggregate, beneficially own a significant percentage of our outstanding common stock, totaling over one-third as of March 1, 2010. This significant concentration of share ownership may adversely affect the trading price for our common stock because investors often perceive disadvantages in owning stock in companies with controlling stockholders. These stockholders, acting together, may have the ability to exert control over all matters requiring approval by our stockholders, including the election and removal of directors and any proposed merger, consolidation or sale of all or substantially all of our assets. In addition, these stockholders who are executive officers or directors, or who have representatives on our Board of Directors, could dictate the management of our business and affairs. This concentration of ownership could have the effect of delaying, deferring or preventing a change in control, or impeding a merger or consolidation, takeover or other business combination that could be favorable to our other stockholders.
Our charter documents and Delaware law could prevent a takeover that stockholders consider favorable and could also reduce the market price of our stock.
Our amended and restated certificate of incorporation and our bylaws contain provisions that could delay or prevent a change in control of our company. These provisions could also make it more difficult for stockholders to elect directors and take other corporate actions. Among other things, these provisions:
| • | Establish a classified board of directors with staggered, three-year terms; |
| • | Do not permit cumulative voting in the election of directors; |
| • | Authorize the board to issue, without stockholder approval, preferred stock with rights senior to those of common stock, including pursuant to a stockholder rights plan; |
| • | Prohibit stockholder action by written consent; |
| • | Limit the persons who may call special meetings of stockholders; and |
| • | Require advance notification of stockholder nominations and proposals. |
In addition, the provisions of Section 203 of Delaware General Corporate Law govern us. These provisions may prohibit large stockholders, in particular those owning 15% or more of our outstanding voting stock, from merging or combining with us for a certain period of time.
26
Table of Contents
These and other provisions in our amended and restated certificate of incorporation, our bylaws and under Delaware law could discourage potential takeover attempts, reduce the price that investors might be willing to pay for shares of our common stock in the future and result in the market price being lower than it would be without these provisions.
| Item 1B. | Unresolved Staff Comments: |
None.
| Item 2. | Properties: |
Our principal executive offices are located in a leased facility in Emeryville, California, consisting of approximately 23,803 square feet of office space, under a lease that expires in January 2012. This facility accommodates our principal administrative and finance operations. We typically occupy a leased facility in each of our operating districts to accommodate offices for our district director and support staff. We generally do not provide office space for our ZipAgent force. We do not own any real property. We believe that our leased facilities are adequate to meet our current needs and that additional facilities will be available for lease to meet our future needs.
| Item 3. | Legal Proceedings: |
On January 22, 2010, the Company was named in a class action lawsuit filed in the Superior Court of California, County of Alameda, Elizabeth Williams v. ZipRealty, Inc., et al., by a former employee agent of the Company. The complaint seeks monetary relief and alleges, among other things, that the Company’s practice of classifying agents as exempt employees pursuant to the “outside salesperson” exemption under California law, and compensating agents accordingly, violates applicable law regarding the payment of minimum wages and overtime. The Company filed a counter claim against Plaintiff Elizabeth Williams alleging, among other things, that Ms. Williams engaged in conduct violating her employment agreement with ZipRealty. While the Company is in the initial stages of investigating the specific allegations in this complaint, it strongly disputes these claims and intends to vigorously oppose this lawsuit.
The Company is not currently subject to any other material legal proceedings. From time to time the Company has been, and it currently is, a party to litigation and subject to claims incident to the ordinary course of the business. The amounts in dispute in these matters are not material to the Company, and management believes that the resolution of these proceedings will not have a material adverse effect on the business, financial position, results of operations or cash flows.
| Item 4. | Reserved |
27
Table of Contents
PART II
| Item 5. | Market for Our Common Stock, Related Stockholder Matters and Issuer Purchases of Equity Securities: |
Market information
Our common stock began trading on The NASDAQ Stock Market under the symbol “ZIPR” on November 10, 2004. We have not listed our stock on any other markets or exchanges. The following table shows the high and low closing prices for our common stock as reported by The NASDAQ Stock Market:
| High | Low | |||||
| 2008 Calendar year |
||||||
| First Quarter |
$ | 6.02 | $ | 4.85 | ||
| Second Quarter |
$ | 5.28 | $ | 3.94 | ||
| Third Quarter |
$ | 4.59 | $ | 3.75 | ||
| Fourth Quarter |
$ | 4.19 | $ | 2.15 | ||
| 2009 Calendar year |
||||||
| First Quarter |
$ | 2.99 | $ | 2.01 | ||
| Second Quarter |
$ | 3.33 | $ | 2.50 | ||
| Third Quarter |
$ | 4.29 | $ | 2.60 | ||
| Fourth Quarter |
$ | 4.18 | $ | 3.42 | ||
As of March 1, 2010, we had approximately 93 common stockholders of record and a substantially greater number of beneficial owners.
Stock Performance Graph
The following performance graph shall not be deemed “filed” for purposes of Section 18 of the Securities Exchange Act of 1934, as amended (the Exchange Act), or incorporated by reference into any filing of ZipRealty under the Securities Act of 1933, as amended, or the Exchange Act, except as shall be expressly set forth by specific reference in such filing.
The following performance graph compares the percentage change in the cumulative total stockholder return on shares of our common stock with the cumulative total return for:
| • | the AmEx Interactive Week Internet Index (our Peer Group Index), and |
| • | the Total Return Index for The NASDAQ Stock Market (U.S. and Foreign). |
This comparison covers the period from November 10, 2004 (the first day of trading after the effectiveness of the registration statement for our initial public offering) to December 31, 2009 (the last trading day in our fiscal year 2009). It assumes $100 was invested on November 10, 2004 in shares of our common stock, our peer corporations and The NASDAQ Stock Market, and assumes reinvestment of dividends, if any.
The Interactive Week Internet Index is a modified-capitalization weighed index designed to measure a cross section of companies involved in providing internet infrastructure and access, developing and marketing internet content and software, and conducting business over the internet. The Interactive Week Internet Index was developed by The American Stock Exchange and Ziff-Davis Publishing. We previously used the Goldman Sachs Internet Index for our peer group comparative return. However, Standard & Poor’s acquired the index from Goldman Sachs Group in February 2007 and the index is no longer available. The Total Return Index for The NASDAQ Stock Market (U.S. and Foreign) comprises all ADRs, domestic shares, and foreign common shares traded on The NASDAQ Global Market and The NASDAQ Capital Market, excluding preferred shares, rights and warrants.
28
Table of Contents
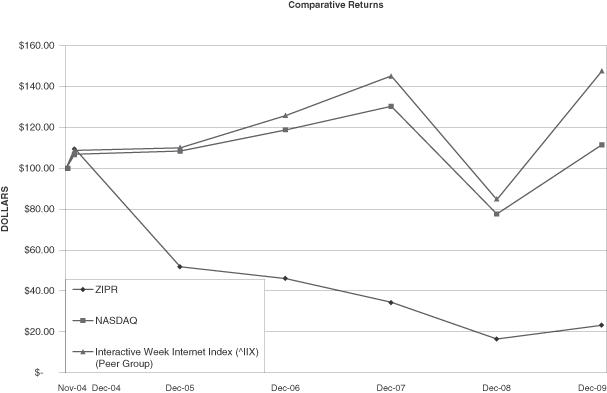
| Date |
ZipRealty | Peer Group |
Total NASDAQ Returns | |||
| November 10, 2004 |
100.00 | 100.00 | 100.00 | |||
| December 31, 2004 |
109.63 | 108.70 | 106.92 | |||
| December 30, 2005 |
51.66 | 110.09 | 108.39 | |||
| December 29, 2006 |
45.95 | 125.80 | 118.71 | |||
| December 31, 2007 |
34.36 | 145.33 | 130.36 | |||
| December 31, 2008 |
16.26 | 84.58 | 77.51 | |||
| December 31, 2009 |
23.07 | 147.86 | 111.53 |
The stock price performance shown on the graph is not necessarily indicative of future price performance. Our closing stock price on March 1, 2010 was $4.93.
Dividend policy
We have never declared or paid dividends on our common stock. We intend to retain our earnings for use in our business and therefore we do not anticipate declaring or paying any cash dividends in the foreseeable future.
29
Table of Contents
| Item 6. | Selected Consolidated Financial Data: |
The following selected financial data should be read in conjunction with “Item 7. Management’s Discussion and Analysis of Financial Condition and Results of Operations” and “Item 8. Financial Statements and Supplementary Data.”
| Year Ended December 31, | ||||||||||||||||||||
| 2009 | 2008 | 2007 | 2006 | 2005 | ||||||||||||||||
| Consolidated Statements of Operations Data |
(In thousands, except per share data) | |||||||||||||||||||
| Net transaction revenues |
$ | 120,738 | $ | 105,427 | $ | 101,100 | $ | 92,659 | $ | 91,082 | ||||||||||
| Marketing and other revenues |
2,392 | 2,023 | 2,762 | 2,728 | 2,323 | |||||||||||||||
| Net revenues |
123,130 | 107,450 | 103,862 | 95,387 | 93,405 | |||||||||||||||
| Operating expenses: |
||||||||||||||||||||
| Cost of revenues |
72,197 | 62,702 | 58,613 | 52,166 | 51,122 | |||||||||||||||
| Product development |
9,429 | 8,678 | 7,320 | 5,775 | 3,034 | |||||||||||||||
| Sales and marketing |
41,881 | 40,571 | 38,256 | 30,910 | 24,855 | |||||||||||||||
| General and administrative |
13,405 | 12,789 | 15,409 | 13,461 | 9,204 | |||||||||||||||
| Litigation (recovery), net |
— | (1,355 | ) | 3,550 | — | 4,164 | ||||||||||||||
| Total operating expenses |
136,912 | 123,385 | 123,148 | 102,312 | 92,379 | |||||||||||||||
| Income (loss) from operations |
(13,782 | ) | (15,935 | ) | (19,286 | ) | (6,925 | ) | 1,026 | |||||||||||
| Other income (expense): |
||||||||||||||||||||
| Interest income |
718 | 2,518 | 4,401 | 3,907 | 2,741 | |||||||||||||||
| Other income (expense), net |
1 | 75 | 1 | (16 | ) | (14 | ) | |||||||||||||
| Total other income (expense), net |
719 | 2,593 | 4,402 | 3,891 | 2,727 | |||||||||||||||
| Income (loss) before income taxes |
(13,063 | ) | (13,342 | ) | (14,884 | ) | (3,034 | ) | 3,753 | |||||||||||
| Provision for (benefit from) income taxes |
(171 | ) | — | — | 17,560 | (16,714 | ) | |||||||||||||
| Net income (loss) |
$ | (12,892 | ) | $ | (13,342 | ) | $ | (14,884 | ) | $ | (20,594 | ) | $ | 20,467 | ||||||
| Net income (loss) per share: |
||||||||||||||||||||
| Basic |
$ | (0.64 | ) | $ | (0.64 | ) | $ | (0.66 | ) | $ | (1.00 | ) | $ | 1.02 | ||||||
| Diluted |
$ | (0.64 | ) | $ | (0.64 | ) | $ | (0.66 | ) | $ | (1.00 | ) | $ | 0.82 | ||||||
| Weighted average common shares outstanding: |
||||||||||||||||||||
| Basic |
20,242 | 20,917 | 22,586 | 20,542 | 20,089 | |||||||||||||||
| Diluted |
20,242 | 20,917 | 22,586 | 20,542 | 25,080 | |||||||||||||||
Effective January 1, 2006, we adopted the provisions of the new accounting standard requiring stock-base compensation to be recognized based on the grant date fair value of the shares awarded.
| December 31, | |||||||||||||||
| 2009 | 2008 | 2007 | 2006 | 2005 | |||||||||||
| Consolidated Balance Sheet Data |
(In thousands) | ||||||||||||||
| Cash, cash equivalents and short-term investments |
$ | 44,134 | $ | 49,389 | $ | 80,467 | $ | 88,808 | $ | 88,909 | |||||
| Working capital |
38,028 | 45,581 | 72,314 | 83,794 | 84,047 | ||||||||||
| Total assets |
52,392 | 59,967 | 90,819 | 98,357 | 113,953 | ||||||||||
| Total long-term liabilities |
327 | 441 | 503 | 513 | 38 | ||||||||||
| Total liabilities |
10,762 | 9,316 | 13,093 | 10,488 | 10,172 | ||||||||||
| Total stockholders’ equity |
$ | 41,630 | $ | 50,651 | $ | 77,726 | $ | 87,869 | $ | 103,781 | |||||
30
Table of Contents
| Item 7. | Management’s Discussion and Analysis of Financial Condition and Results of Operations: |
The following discussion should be read together with our financial statements and related notes appearing elsewhere in this report. This discussion contains forward-looking statements based upon current expectations that involve numerous risks, uncertainties and assumptions. Our actual results could differ materially from those anticipated in these forward-looking statements for many reasons, including but not limited to those described under “Risk Factors” and elsewhere in this report. Except as otherwise required by law, we do not intend to update any information contained in these forward-looking statements.
OVERVIEW
General
We are a leading full-service residential real estate brokerage that uses an innovative combination of a comprehensive online presence, robust proprietary technology and knowledgeable local agents in the field to offer our clients fast, responsive and transparent service. Our award-winning, user-friendly website gives our users access to comprehensive local Multiple Listing Services home listings data, as well as other relevant market and neighborhood information and tools. Our proprietary technology, including our agent productivity platform, helps us to increase agent efficiency and reduce costs, allowing us to pass on significant savings to consumers as permitted by law.
We have grown our business rapidly since our inception in 1999. By 2009, we ranked as the 9th largest residential real estate brokerage in the nation by annual transaction volume, accordingly to REAL Trends. Also in 2009, our website received more traffic than any other residential real estate brokerage in the nation, according to Hitwise. As of March 1, 2010, we had wholly owned operations in 35 major markets serviced by our team of over 3,000 local, licensed sales agents, and we had approximately 2.6 million active registered users who had accessed our website within the last year. All of our markets were opened prior to 2009 with the exception of Portland, which we opened in April 2009. Depending on market conditions and other criteria, we may consider entering additional markets in the future.
We typically share a portion of our commissions with our buyer clients in the form of a cash rebate, and typically represent our seller clients at fees below those offered by most traditional brokerage companies in our markets. Generally, our seller clients pay a total brokerage fee of 4.5% to 5.0% of the transaction value, of which 2.5% to 3.0% is paid to agents representing buyers. In the Oregon portion of our Portland market (which serves portions of both Oregon and Washington), the payment of cash rebates is not currently permitted by law, so we have adjusted our value proposition for our buyer clients by offering an enhanced client satisfaction guarantee. In New Jersey, the payment of cash rebates became permissible in January 2010, and accordingly we have commenced offering cash rebates to our buyer clients in New Jersey.
Our agents are typically employees. However, in February 2010, we ceased to employ agents in New York, and instead engaged agents as independent contractors in that state. Through that modified business model, we hope to deliver excellent customer service and enable independent contractor agents to be productive and efficient with minimal management oversight. We currently do not have plans to make a similar change in other markets, although we continually evaluate all aspects of our business and operational model and could make similar or different changes in other markets in the future.
Our net revenues are composed primarily of commissions earned as agents for buyers and sellers in residential real estate transactions, and we operate in one reportable segment. We record commission revenues net of any rebate (or, in New Jersey, net of charitable donation through April 1, 2009), or commission discount or transaction fee adjustment. Our net revenues are principally driven by the number of transactions we close and the average net revenue per transaction. Average net revenue per transaction is a function of the home sales price and percentage commission we receive on each transaction and varies significantly by market. We also receive revenues from certain marketing arrangements, such as with mortgage lenders to whom we provide access through the mortgage center on our website, who typically pay us a flat monthly fee that is established on a
31
Table of Contents
periodic basis, as well as from relationships with advertisers. For example, in the second quarter of 2009 we entered into a marketing agreement with Bank of America and completed the implementation of that agreement in all of our markets during the third quarter of 2009. Generally, non-commission revenues represent less than 5% of our net revenues during any period. We routinely explore our options for entering into additional marketing and other business arrangements for offering other services related to the purchase, sale and ownership of a home.
We believe that customer acquisition is one of our core competencies, and although the difficulty of acquiring a sufficient number of leads online could increase over time, we expect that we can mitigate some of that impact with repeat and referral business, as well as by increasing our visibility and credibility to potential clients over time. Because our aggregate transaction volume market share in our markets has averaged less than 1% historically, we believe that there is an opportunity to increase our market share and grow our business, even if the overall level of sales continue to decline due to macroeconomic conditions.
Market conditions and trends in our business
Macroeconomic forces. For the past few years, the residential real estate market has been negatively impacted by macroeconomic conditions. We perceive that conditions such as tight lending criteria, record numbers of foreclosures (which, according to RealtyTrac, an online marketplace for foreclosure properties, reached their highest levels of all time during the third quarter of 2009), and high unemployment continue to exert negative pressure on the residential real estate market, and may continue to do so for some time. Although the federal government, state governments and related agencies have acted repeatedly to address the decline in the residential real estate market and the availability of home mortgage credit, there can be no assurance that these activities will have a positive and meaningful impact. Looking ahead into 2010, we currently believe that the health of the residential housing market will be significantly affected by the availability of credit, shadow inventory levels, and interest rates, all of which could be negatively impacted by high unemployment levels.
Current residential real estate market conditions. The residential real estate market remains volatile and unpredictable both nationally and regionally. While home sales in the fourth quarter of 2009 improved in all major regions of the country, bolstered by tax credits and historically low interest rates, home sales prices continued to decline nationally, as did the inventory of homes available for sale. Federal tax credit programs designed to encourage home buyers have been extended into 2010, but the expiration of these programs, and any future rise in interest rates in keeping with our current expectations, could deter future home buyers.
Current indicators of national market conditions include the following:
| • | Volume: According to the National Association of REALTORS®, or NAR, existing home sales for the fourth quarter of 2009 rose 13.9% from the third quarter of 2009 and 27.2% from the fourth quarter of 2008, with sales rising above prior-quarter and prior-year levels in all major regions of the country. The increased demand for housing appears to have been fueled by a federal tax credit program for first-time homebuyers that had been set to expire on November 30, 2009; please see discussion below under “Fluctuations in quarterly profitability.” In addition, home buyers were also bolstered by low mortgage rates. According to Freddie Mac, the national average commitment rate for a 30 year conventional fixed-rate mortgage reached a record low in the fourth quarter of 2009. |
| • | Price: According to NAR, the median existing home sales price in the fourth quarter of 2009 was 4.1% lower than in the fourth quarter of 2008. However, the year-over-year decline in price continued to slow from previous periods, and the median existing home sales price in December 2009 actually rose 1.5% from the prior-year period, representing the first year-over-year price increase since August 2007. We believe that some of this price stabilization was caused by a shift in the transaction mix away from distressed properties, as discussed below, and any future shift in the transaction mix back towards distressed properties could have a negative impact on prices. In addition, we perceive that overall prices continue to be negatively impacted by the tight lending criteria for non-conforming “jumbo” loans and the resulting constriction of the market for higher-priced homes. |
32
Table of Contents
| • | Inventory: According to NAR, in the fourth quarter of 2009, the total inventory of homes available for sale continued its 18-month decline. In December 2009, inventory decreased by 11.1% from December 2008 and reached its lowest level since March 2006. There is some evidence that this decrease may have been caused, in part, by changes in foreclosure practices that have resulted in “shadow inventory,” discussed below. As discussed below, we expect that more distressed properties may enter the market in 2010, which should increase inventory levels. |
| • | Distressed Properties: Currently, a significant percentage of our sales transaction volume is composed of distressed properties. Distressed properties are homes that are in foreclosure, are bank owned (or REO), or are “short sales,” meaning a sale where the sale price is less than the loans or debt secured by the home listed for sale. In the fourth quarter of 2009, the percentage of our sales transactions composed of distressed properties was approximately 33%. This result was substantially less than the peak of 53% realized in the first quarter of 2009. However, we currently expect that this percentage may rise again in 2010. In particular, we believe that more distressed properties may enter the market as mortgage rates reset and as banks step up their efforts to sell their swelling pipeline of shadow inventory, as discussed below. Distressed properties not only tend to sell at reduced prices, but they also tend to put downward pressure on the values of other homes for sale in the same and nearby neighborhoods. We expect distressed properties to continue to represent a significant portion of the residential real estate market and of our business in the foreseeable future. |
| • | Shadow Inventory: “Shadow inventory” refers to distressed and other properties that have not yet been listed for sale, as well as properties that homeowners wish to sell, but will not sell at current market prices. Shadow inventory can occur when lenders put REO properties (properties that have been foreclosed or forfeited to lenders) on the market gradually, rather than all at once, or delay the foreclosure process. They may choose to do so because of regulations and foreclosure moratoriums, because of the additional costs and resources required to process and sell foreclosed properties, or because they want to avoid depressing housing prices further by putting many distressed properties up for sale at the same time. This shadow inventory could dampen and delay the recovery of the residential real estate market as it is introduced into the market in future periods. It is difficult to assess the current volume of shadow inventory and its future impact on the residential real estate market. Recently, we have perceived a change in the handling by banks of distressed properties, whereby banks appear to be pursuing more short sales to avoid the foreclosure process. We believe this trend will continue through at least the remainder of 2010 due, in part, to the federal Home Affordable Foreclosure Alternatives Program, or HAFA, which is currently scheduled to run from April 5, 2010 through the end of this year. HAFA was designed to promote the use of short sales instead of foreclosures for certain borrowers by offering incentives to lenders and by streamlining the short sale process. If this trend towards short sales continues it should help reduce the backlog of shadow inventory as homes are introduced for sale on the market and become true inventory. |
Fluctuations in quarterly profitability. We have experienced fluctuations in profitability from period to period. Our profitability has been impacted by various factors including seasonality, new market expansion, legal settlements, government activism and ongoing market challenges, including the tightening in the availability of home mortgage credit.
For example, in 2009, the federal government introduced a program to provide a tax credit of up to $8,000 to first-time home buyers, meaning, for this purpose, buyers who had not owned a home in the preceding three years. That program had been set to expire on November 30, 2009. We believe many first-time home buyers chose to accelerate their home purchases to take advantage of the credit before it expired, which bolstered our sales volume in November and its preceding months, but which cost us sales that otherwise would have closed in December 2009 or later.
In November 2009, before the tax credit program expired, the federal government extended and expanded the program. In its current form, the program offers a credit of $8,000 to first-time home buyers and up to $6,500
33
Table of Contents
to repeat home buyers who have lived in their current home for five consecutive years in the past eight years. To take advantage of the current program, buyers must enter into a home purchase contract by April 30, 2010, and complete the purchase by June 30, 2010. Once again, we expect that this program will have a positive effect on our home sales volume in the first half of 2010, but will result in fewer sales than we otherwise would have closed in the second half of 2010, unless the program is extended or replaced. In addition, we expect that the program will be less effective in regions where income levels and home prices are relatively high, given that the size of the tax credit is phased out as income increases, and that the credit is not available when the home purchase price exceeds $800,000.
Industry seasonality and cyclicality. The residential real estate brokerage market is influenced both by annual seasonality factors, as well as by overall economic cycles. While individual markets vary, transaction volume nationally tends to progressively increase from January through the summer months, then gradually slows over the last three to four months of the calendar year. Revenues in each quarter are significantly affected by activity during the prior quarter, given the typical 30- to 45-day time lag between contract execution and closing for traditional home purchases. For non-traditional sales, the time lag from contract execution to closing can be a few months. We have been, and believe we will continue to be, influenced by overall market activity and seasonal forces. We generally experience the most significant impact in the first and fourth quarters of each year, when our revenues are typically lower relative to the second and third quarters as a result of traditionally slower home sales activity and reduced listings inventory between Thanksgiving and Presidents’ Day.
The impact of seasonality can be masked by the general health of the residential real estate market at any given point in time, whether affected by macroeconomic events, periodic business cycles or other factors. Generally, when economic times are fair or good, the housing market tends to perform well. If the economy is weak, if interest rates dramatically increase, if mortgage lending standards tighten, or if there are disturbances such as terrorist attacks or threats, the outbreak of war or geopolitical uncertainties, the housing market likely would be negatively impacted.
CRITICAL ACCOUNTING POLICIES AND ESTIMATES
Our financial statements are prepared in accordance with accounting principles generally accepted in the United States. The preparation of these consolidated financial statements requires us to make estimates and assumptions that affect the reported amounts of assets, liabilities, revenues, costs and expenses and related disclosures. On an ongoing basis, we evaluate our estimates and assumptions. Accordingly, our actual results may differ from these estimates under different assumptions or conditions.
Our significant accounting policies are described in Note 1 of the Notes to Consolidated Financial Statements, and of those policies, we believe that the following accounting policies are the most critical to understand and evaluate our financial condition and results of operations.
Revenue recognition
We derive the majority of our revenues from commissions earned as agents for buyers and sellers in residential real estate transactions. We recognize commission revenues upon closing of a sale and purchase transaction, net of any rebate, commission discount or transaction fee adjustment, as evidenced when the escrow or similar account has closed and funds have been disbursed to all appropriate parties. We recognize non-commission revenues from our other business relationships, including marketing agreements, advertising, referral and other income, as the fees are earned from the other party. We recognize revenue only when there is persuasive evidence an arrangement exists, the sales price is fixed or determinable, the transaction has been completed and collectability of the resulting receivable is reasonably assured.
34
Table of Contents
Internal-use software and website development costs
We account for internal-use software and website development costs, including the development of our ZipAgent Platform (“ZAP”) in accordance with the guidance set forth in the related accounting standards. We capitalize internal costs consisting of payroll and direct payroll-related costs of employees who devote time to the development of internal-use software, as well as any external direct costs. We amortize these costs over their estimated useful lives, which typically range between 15 to 24 months. Our judgment is required in determining the point at which various projects enter the stages at which costs may be capitalized, in assessing the ongoing value of the capitalized costs, and in determining the estimated useful lives over which the costs are amortized. The estimated life is based on management’s judgment as to the product life cycle.
Stock-based compensation
We follow the provisions of accounting standards for share-based payments, which requires the measurement and recognition of compensation expense for all stock-based payment awards made to employees and directors, including employee stock options and employee stock purchases, based on estimated fair values. Under the fair value recognition provisions of the accounting standards, stock-based compensation cost is estimated at the grant date based on the fair value of the awards expected to vest and recognized as expense using the straight-line method over the requisite service period of the award.
We estimate the fair value of stock options using the Black-Scholes option pricing model, which incorporates various assumptions including volatility, expected life and interest rates. The expected volatility is based on the historical volatility of our common stock and consideration of other relevant factors such as the volatility of guideline companies. The expected life of options is estimated by taking the average of the vesting term and the contractual term of the option. We estimate expected forfeitures based on various factors including employee class and historical experience. The estimation of stock awards that will ultimately vest requires judgment, and to the extent actual results or updated estimates differ from our current estimates, such amounts will be recorded as a cumulative adjustment in the period the estimates are revised.
Income taxes
Deferred tax assets and liabilities arise from the differences between the tax basis of an asset or liability and its reported amount in the financial statements as well as from net operating loss and tax credit carry forwards. Deferred tax amounts are determined by using the tax rates expected to be in effect when the taxes will actually be paid or refunds received, as provided under current tax law. Valuation allowances are established when necessary to reduce deferred tax assets to the amount expected to be realized. Income tax expense or benefit is the tax payable or refundable, respectively, for the period adjusted for the change during the period in deferred tax assets and liabilities.
The accounting standard for income taxes requires that deferred tax assets be evaluated for future realization and reduced by a valuation allowance to the extent we believe a portion will not be realized. We consider many factors when assessing the likelihood of future realization of our deferred tax assets, including our recent historical results and our expectations for the future. Historically, we have recorded a valuation allowance on our deferred tax assets, the majority of which relate to net operating loss carryforwards and we maintain that a full valuation allowance should be accounted for against our net deferred tax assets at December 31, 2009.
35
Table of Contents
RESULTS OF OPERATIONS
The following table summarizes certain financial data related to our operations for the periods indicated:
| Year Ended December 31, | ||||||||||||
| 2009 | 2008 | 2007 | ||||||||||
| Statements of Operations Data |
(In thousands, except per share amounts) | |||||||||||
| Net transaction revenues |
$ | 120,738 | $ | 105,427 | $ | 101,100 | ||||||
| Marketing and other revenues |
2,392 | 2,023 | 2,762 | |||||||||
| Net revenues |
123,130 | 107,450 | 103,862 | |||||||||
| Operating expenses: |
||||||||||||
| Cost of revenues |
72,197 | 62,702 | 58,613 | |||||||||
| Product development |
9,429 | 8,678 | 7,320 | |||||||||
| Sales and marketing |
41,881 | 40,571 | 38,256 | |||||||||
| General and administrative |
13,405 | 12,789 | 15,409 | |||||||||
| Litigation (recovery), net |
— | (1,355 | ) | 3,550 | ||||||||
| Total operating expenses |
136,912 | 123,385 | 123,148 | |||||||||
| Loss from operations |
(13,782 | ) | (15,935 | ) | (19,286 | ) | ||||||
| Other income (expense): |
||||||||||||
| Interest income |
718 | 2,518 | 4,401 | |||||||||
| Other income (expense), net |
1 | 75 | 1 | |||||||||
| Total other income, net |
719 | 2,593 | 4,402 | |||||||||
| Loss before income taxes |
(13,063 | ) | (13,342 | ) | (14,884 | ) | ||||||
| Provision for (benefit from) income taxes |
(171 | ) | — | — | ||||||||
| Net loss |
$ | (12,892 | ) | $ | (13,342 | ) | $ | (14,884 | ) | |||
| Net loss per share: |
||||||||||||
| Basic and diluted |
$ | (0.64 | ) | $ | (0.64 | ) | $ | (0.66 | ) | |||
| Weighted average common shares outstanding: |
||||||||||||
| Basic and diluted |
20,242 | 20,917 | 22,586 | |||||||||
The following table presents our operating results as a percentage of net revenues for the periods indicated:
| Year Ended December 31, | |||||||||
| Statements of Operations Data |
2009 | 2008 | 2007 | ||||||
| Net transaction revenues |
98.1 | % | 98.1 | % | 97.3 | % | |||
| Marketing and other revenues |
1.9 | 1.9 | 2.7 | ||||||
| Net revenues |
100.0 | 100.0 | 100.0 | ||||||
| Operating expenses: |
|||||||||
| Cost of revenues |
58.6 | 58.4 | 56.4 | ||||||
| Product development |
7.7 | 8.1 | 7.0 | ||||||
| Sales and marketing |
34.0 | 37.8 | 36.8 | ||||||
| General and administrative |
10.9 | 11.9 | 14.8 | ||||||
| Litigation (recovery), net |
— | (1.3 | ) | 3.4 | |||||
| Total operating expenses |
111.2 | 114.9 | 118.4 | ||||||
| Loss from operations |
(11.2 | ) | (14.9 | ) | (18.4 | ) | |||
| Other income (expense): |
|||||||||
| Interest income |
0.6 | 2.3 | 4.2 | ||||||
| Other income (expense) |
— | 0.1 | — | ||||||
| Total other income, net |
0.6 | 2.4 | 4.2 | ||||||
| Loss before income taxes |
(10.6 | ) | (12.5 | ) | (14.2 | ) | |||
| Provision for (benefit from) income taxes |
(0.1 | ) | — | — | |||||
| Net loss |
(10.5 | )% | (12.5 | )% | (14.2 | )% | |||
36
Table of Contents
Comparison of the years ended December 31, 2009 and December 31, 2008
Other operating data
| Twelve Months Ended December 31, |
Increase (Decrease) |
Percent Change |
|||||||||||
| 2009 | 2008 | ||||||||||||
| Number of markets (1) |
|||||||||||||
| Comparable existing markets |
23 | 23 | — | ||||||||||
| New markets |
12 | 11 | 1 | ||||||||||
| Total |
35 | 34 | 1 | ||||||||||
| Number of transactions closed during the period (2) |
|||||||||||||
| Comparable existing markets |
|||||||||||||
| Buyer representation |
17,546 | 13,985 | 3,561 | 25.5 | % | ||||||||
| Seller representation |
1,345 | 974 | 371 | 38.1 | % | ||||||||
| Total existing markets |
18,891 | 14,959 | 3,932 | 26.3 | % | ||||||||
| New markets |
|||||||||||||
| Buyer representation |
3,858 | 2,042 | 1,816 | 88.9 | % | ||||||||
| Seller representation |
351 | 155 | 196 | 126.5 | % | ||||||||
| Total new markets |
4,209 | 2,197 | 2,012 | 91.6 | % | ||||||||
| Total |
23,100 | 17,156 | 5,944 | 34.6 | % | ||||||||
| Average net revenue per transaction (3) |
|||||||||||||
| Comparable existing markets |
$ | 5,399 | $ | 6,376 | $ | (977 | ) | (15.3 | )% | ||||
| New markets |
4,452 | 4,571 | (119 | ) | (2.6 | )% | |||||||
| All markets |
$ | 5,227 | $ | 6,145 | $ | (918 | ) | (14.9 | )% | ||||
| Number of ZipAgents at end of the period |
|||||||||||||
| Comparable existing markets |
2,429 | 2,212 | 217 | 9.8 | % | ||||||||
| New markets |
656 | 604 | 52 | 8.6 | % | ||||||||
| All markets |
3,085 | 2,816 | 269 | 9.6 | % | ||||||||
| (1) | Beginning with our Form 10-Q for the three months ended March 31, 2009, new markets are transferred to existing markets on January 1st following the completion of their first full two calendar years of operation. In our reports filed prior to that Form 10-Q, new markets were transferred to existing markets on January 1st following the completion of their first full calendar year of operation. Our Tampa, Orlando, Minneapolis, Austin, Palm Beach and the Greater Philadelphia Area markets opened during 2006 and, therefore, completed their first two full calendar years as of the end of 2008. Accordingly, these markets were moved to existing markets as of January 1, 2009 and are included in comparable existing markets for all periods presented. |
The operations of our Westchester County, NY market (opened in December 2007) and our Long Island, NY market (opened in March 2008) were combined during 2009 and, therefore, are included as one market for all periods presented.
37
Table of Contents
Comparable existing markets:
| Atlanta, GA | Houston, TX | Phoenix, AZ | ||
| Austin, TX | Las Vegas, NV | Sacramento, CA | ||
| Baltimore, MD | Los Angeles, CA | San Diego, CA | ||
| Boston, MA | Miami, FL | San Francisco Bay Area, CA | ||
| Chicago, IL | Minneapolis, MN | Seattle, WA | ||
| Dallas, TX | Orange County, CA | Tampa, FL | ||
| Fresno/Central Valley, CA | Orlando, FL | Washington, DC | ||
| Greater Philadelphia Area, PA | Palm Beach, FL | |||
| New markets and the month opened: | ||||
| Naples, FL | March 2007 | |||
| Tucson, AZ | March 2007 | |||
| Denver, CO | April 2007 | |||
| Jacksonville, FL | May 2007 | |||
| Salt Lake City, UT | July 2007 | |||
| Richmond, VA | July 2007 | |||
| Virginia Beach, VA | August 2007 | |||
| Charlotte, NC | August 2007 | |||
| Raleigh-Durham, NC | September 2007 | |||
| Westchester County/Long Island, NY | December 2007 | |||
| Hartford, CT | July 2008 | |||
| Portland, OR | April 2009 | |||
| (2) | The term “transaction” refers to each representation of a buyer or seller in a real estate purchase or sale. |
| (3) | Average net revenue per transaction equals net transaction revenues divided by number of transactions with respect to each period. |
Net transaction revenues
Net transaction revenues consist of commissions earned as agents to buyers and sellers on the purchase or sale of real estate transactions, net of any rebate, commission discount or transaction fee adjustment.
| Year Ended December 31, |
Increase (Decrease) |
Percent Change |
||||||||||
| 2009 | 2008 | |||||||||||
| (In thousands) | ||||||||||||
| Net transaction revenues |
||||||||||||
| Comparable existing markets |
$ | 101,999 | $ | 95,384 | $ | 6,615 | 6.9 | % | ||||
| New markets |
18,739 | 10,043 | 8,696 | 86.6 | % | |||||||
| Total |
$ | 120,738 | $ | 105,427 | $ | 15,311 | 14.5 | % | ||||
The increase in our net transaction revenues of $15.3 million for the year ended December 31, 2009 compared to the year ended December 31, 2008 was primarily due to increases in net transaction revenues of $6.6 million in our existing markets and $8.7 million in our new markets.
The increase in net transaction revenues in our existing markets of $6.6 million or 6.9% was driven primarily by an increase in the number of transactions closed during the year of 3,932 or 26.3%, offset by a decrease in average net revenue per transaction of $977 or 15.3%. The decrease in average net revenue per
38
Table of Contents
transaction was primarily attributable to a combination of factors including an overall decrease in housing prices, an increase in the number of foreclosure, bank real estate owned (“REO”) and short sale transactions, typically at further reduced sales prices, and ongoing tightening in the availability of consumer mortgage financing particularly impacting the sale of higher priced housing.
The increase in net transaction revenues in our new markets of $8.7 million was driven by an increase of 2,012 transactions closed during the period primarily from the ten new markets opened during 2007 and the two new markets opened in 2008. Average net revenue per transaction decreased by $119 or 2.6%.
We expect our net transaction revenues will increase for 2010 driven by an increase in the overall number of transactions in both our existing and new markets, offset by decreases in net revenue per transaction. The decrease in net revenue per transaction year over year is expected to result from a continuation of the factors impacting the year ended December 31, 2009: overall decreases in housing prices, increases in the number of foreclosure, bank REO and short sale transactions, typically at further reduced sales prices, and ongoing pressure on the availability of consumer mortgage financing particularly impacting the sale of higher priced housing.
Marketing and other revenues
Marketing and other revenues consist primarily of market transaction referrals and corporate marketing agreements and advertising.
| Year Ended December 31, |
Increase (Decrease) |
Percent Change |
||||||||||
| 2009 | 2008 | |||||||||||
| (In thousands) | ||||||||||||
| Marketing and other revenues |
||||||||||||
| Comparable existing markets |
$ | 399 | $ | 388 | $ | 11 | 2.9 | % | ||||
| New markets |
75 | 35 | 40 | 112.4 | % | |||||||
| Corporate |
1,918 | 1,600 | 318 | 19.9 | % | |||||||
| Total |
$ | 2,392 | $ | 2,023 | $ | 369 | 18.3 | % | ||||
The increase in corporate referral and other revenues was primarily attributable to fees from a mortgage services marketing agreement with Bank of America which commenced June 2009. This marketing services agreement replaced a previous agreement with E-LOAN which terminated October 31, 2008.
We expect our referral and other income will increase for 2010 attributable to full year results form the Bank of America agreement and as we explore our options for other marketing agreements and sources of residential real estate related services.
Cost of revenues
Our cost of revenues consists principally of commissions, payroll taxes, benefits including health insurance, performance and tenure based award programs, agent expense reimbursements and amortization of internal-use software and website development costs which relate primarily to our ZAP technology. Agent commissions are generally paid on market net revenues which include net transaction revenues plus referral and other revenues generated by our ZipAgents.
| Year Ended December 31, |
Increase (Decrease) |
Percent Change |
||||||||||
| 2009 | 2008 | |||||||||||
| (In thousands) | ||||||||||||
| Cost of revenues |
||||||||||||
| Comparable existing markets |
$ | 62,027 | $ | 57,307 | $ | 4,720 | 8.2 | % | ||||
| New markets |
10,170 | 5,395 | 4,775 | 88.5 | % | |||||||
| Total |
$ | 72,197 | $ | 62,702 | $ | 9,495 | 15.1 | % | ||||
39
Table of Contents
The increase in cost of revenues for the year ended December 31, 2009 compared to the year ended December 31, 2008 was primarily related to the overall increase in net revenues on which we pay agent commissions.
Cost of revenues increased in our existing markets by approximately $4.7 million or 8.2% for the year ended December 31, 2009 compared to the year ended December 31, 2008. Agent commissions and payroll taxes increased by $4.0 million or 8.8% primarily attributable to the increase in the net revenues on which these costs are based. Agent performance and tenure based programs, benefits and expense reimbursements increased by approximately $0.5 million or 4.4%. Amortization of internal-use software increased by approximately $0.2 million or 38.1%. Overall, cost of revenues as a percentage of existing markets net revenues increased by about 0.8 percentage points.
Cost of revenues increased in our new markets by approximately $4.8 million related primarily to the increase net revenue during the year. Agent commissions and payroll taxes increased by $4.1 million primarily attributable to the increase in net revenues on which these costs are based. Agent expense reimbursements and benefits increased by approximately $0.5 million primarily attributable to the increased number of agents. Amortization of internal-use software increased by approximately $0.1 million. Overall, cost of revenues as a percentage of new market net revenues increased by 0.6 percentage points. This increase in the cost of revenues percentage in new markets is expected as increasing numbers of ZipAgents achieve higher commission splits and benefits as the new markets mature.
We expect our cost of revenues for 2010 will increase in absolute dollars but remain relatively consistent as a percentage of net revenues.
Product development
Product development expenses include our information technology costs relating to the maintenance of our website, proprietary technology platforms and system infrastructure. These costs consist primarily of compensation and benefits for our product development and infrastructure personnel, depreciation of software and equipment and infrastructure costs consisting primarily of facilities, communications and other operating expenses.
| Year Ended December 31, |
Increase (Decrease) |
Percent Change |
||||||||||
| 2009 | 2008 | |||||||||||
| (In thousands) | ||||||||||||
| Product development |
$ | 9,429 | $ | 8,678 | $ | 751 | 8.7 | % | ||||
The increase in product development expenses for the year ended December 31, 2009 compared to the year ended December 31, 2008 was due primarily to developing and enhancing features on our website, as well as supporting higher website volume and a new data site and consisted primarily of increases in salaries and benefits of $1.1 million partially offset by a decrease in depreciation of $0.4 million. As a percentage of net revenues, product development expenses decreased by 0.4 percentage points for the year ended December 31, 2009 compared to the year ended December 31, 2008.
We expect our product development expenses to increase in 2010 in absolute dollars but to decrease as a percentage of net revenues as we continue to grow our business and enhance our technology systems to improve our ZipAgents efficiency and enhance features on our website for consumers.
40
Table of Contents
Sales and marketing
Sales and marketing expenses consist primarily of compensation and related costs for personnel engaged in sales, sales support and customer service as well as promotional, advertising and client acquisition costs. These expenses have been categorized below between those incurred in the existing and new markets offices and those expenses which are incurred by the regional and corporate support functions across all markets.
| Year Ended December 31, |
Increase (Decrease) |
Percent Change |
|||||||||||
| 2009 | 2008 | ||||||||||||
| (In thousands) | |||||||||||||
| Sales and marketing: |
|||||||||||||
| Comparable existing markets |
$ | 25,387 | $ | 25,459 | $ | (72 | ) | (0.3 | )% | ||||
| New markets |
8,829 | 7,643 | 1,186 | 15.5 | % | ||||||||
| Regional/corporate sales support and marketing |
7,665 | 7,469 | 196 | 2.6 | % | ||||||||
| Total |
$ | 41,881 | $ | 40,571 | $ | 1,310 | 3.2 | % | |||||
The increase in sales and marketing expenses for the year ended December 31, 2009 compared to the year ended December 31, 2008 was primarily related to growth in our new markets partially offset by the impact of cost control initiatives in all of our markets and regional/corporate support operations.
Sales and marketing expenses decreased in our existing markets by approximately $0.1 million principally attributable to increases in salaries and benefits of $0.2 million and facilities and operating related expenses of $0.2 million offset by decreases in travel of $0.1 million, depreciation of $0.1 million and customer acquisition and marketing costs of $0.3 million. As a percentage of existing market net revenues, existing market sales and marketing expenses were 24.8% in the current year compared to 26.6% in the prior year.
Sales and marketing expenses increased in our new markets by approximately $1.2 million principally attributable to the current year reflecting a full year of operations for the two markets opened during 2008, as well as the expenses relating to opening one new market office during 2009. The increased expenses consisted primarily of customer acquisition and marketing costs of $1.1 million and a one time charge of $0.2 million attributable to merging the operations of two offices partially offset by a decrease in travel of $0.1 million. As a percentage of new market revenues, new market sales and marketing expenses were 46.9% in the current year compared to 75.8% in the prior year.
Regional/corporate sales support and marketing expenses increased by approximately $0.2 million and consisted primarily of increased salaries and benefits $0.2 million and marketing of $0.1 million partially offset by a decrease of $0.1 million of travel expense. As a percentage of net revenues, regional/corporate sales support and marketing expenses were approximately 6.2% in the current year compared to 7.0% in the prior year.
We expect our sales and marketing expenses for 2010 will increase in absolute dollars but will decrease modestly as a percentage of net revenues.
General and administrative
General and administrative expenses consist primarily of compensation and related costs for personnel and facilities related to our executive, finance, human resources, facilities and legal organizations, and fees for professional services. Professional services are principally comprised of outside legal, audit and tax services.
| Year Ended December 31, |
Increase (Decrease) |
Percent Change |
||||||||||
| 2009 | 2008 | |||||||||||
| (In thousands) | ||||||||||||
| General and administrative |
$ | 13,405 | $ | 12,789 | $ | 616 | 4.8 | % | ||||
41
Table of Contents
The increase in general and administrative expenses for the year ended December 31, 2009 compared to the year ended December 31, 2008 was principally due to increased salaries and benefits of $1.3 million partially offset by a decrease in professional fees of $0.6 million. As a percentage of net revenues, general and administrative expenses were 10.9% for the year compared to 11.9% in the year ended December 31, 2008.
We expect our general and administrative expenses for 2010 will increase in absolute dollars but will decrease as a percentage of net revenues.
Litigation
| Year Ended December 31, |
Increase (Decrease) |
Percent Change |
|||||||||||
| 2009 | 2008 | ||||||||||||
| (In thousands) | |||||||||||||
| Litigation |
$ | — | $ | (1,355 | ) | $ | 1,355 | (100.0 | )% | ||||
Litigation for the year ended December 31, 2008 relates to the recovery, net of legal fees, of approximately $2.0 million from the settlement of a lawsuit we filed against a law firm that provided counseling in connection with certain employment matters in prior years partially offset by the settlement of a class action lawsuit filed by a former ZipAgent in the amount of $0.6 million.
Interest income
Interest income relates to interest we earn on our money market deposits and short-term investments.
| Year Ended December 31, |
Increase (Decrease) |
Percent Change |
|||||||||||
| 2009 | 2008 | ||||||||||||
| (In thousands) | |||||||||||||
| Interest income |
$ | 718 | $ | 2,518 | $ | (1,800 | ) | (71.5 | )% | ||||
Interest income fluctuates as our cash equivalents and short-term investment balances change and applicable interest rates increase or decrease. The decrease in interest income for the year ended December 31, 2009, compared to the year ended December 31, 2008, was due primarily to overall lower interest rates, a move from asset and mortgage backed securities to money market securities and US Government and agency obligations featuring lower interest rates and lower average balances. The lower average balances were primarily attributable to the repurchase of shares of our common stock for approximately $17.4 million during 2008 and cash used in our operating activities as a result of the losses incurred during both years.
Other income (expense), net
Other income (expense), net consists of non-operating items.
| Year Ended December 31, |
Increase (Decrease) |
Percent Change |
|||||||||||
| 2009 | 2008 | ||||||||||||
| (In thousands) | |||||||||||||
| Other income (expense), net |
$ | 1 | $ | 75 | $ | (74 | ) | (98.2 | )% | ||||
Other income for the year ended December 31, 2009 relates primarily to realized gains on our short term investments.
Provision for income taxes
| Year Ended December 31, |
Increase (Decrease) |
Percent Change |
||||||||||||
| 2009 | 2008 | |||||||||||||
| (In thousands) | ||||||||||||||
| Provision for (benefit from) income taxes |
$ | (171 | ) | $ | — | $ | (171 | ) | 100 | % | ||||
42
Table of Contents
The income tax benefit in 2009 is principally related to carryback of net operating losses (“NOL”) under recently enacted legislation which provides an election to extend the carryback period from two years up to five years for NOLs incurred in the tax years beginning or ending 2008 and 2009. The enacted legislation further eliminates the general restriction on alternative minimum tax NOLs in the carryback years. We intend to make the election and apply for refund of Federal alternative minimum tax remitted in 2004 and 2005.
Comparison of the years ended December 31, 2008 and December 31, 2007
Other operating data
| Twelve Months Ended December 31, |
Increase (Decrease) |
Percent Change |
|||||||||||
| 2008 | 2007 | ||||||||||||
| Number of markets (1) |
|||||||||||||
| Comparable existing markets |
17 | 17 | — | ||||||||||
| New markets |
17 | 16 | 1 | ||||||||||
| Total |
34 | 33 | 1 | ||||||||||
| Number of transactions closed during the period (2) |
|||||||||||||
| Comparable existing markets |
|||||||||||||
| Buyer representation |
11,770 | 10,582 | 1,188 | 11.2 | % | ||||||||
| Seller representation |
784 | 1,231 | (447 | ) | (36.3 | )% | |||||||
| Total existing markets |
12,554 | 11,813 | 741 | 6.3 | % | ||||||||
| New markets |
|||||||||||||
| Buyer representation |
4,257 | 1,959 | 2,298 | 117.3 | % | ||||||||
| Seller representation |
345 | 190 | 155 | 81.6 | % | ||||||||
| Total new markets |
4,602 | 2,149 | 2,453 | 114.1 | % | ||||||||
| Total |
17,156 | 13,962 | 3,194 | 22.9 | % | ||||||||
| Average net revenue per transaction (3) |
|||||||||||||
| Comparable existing markets |
$ | 6,662 | $ | 7,585 | $ | (923 | ) | (12.2 | )% | ||||
| New markets |
4,736 | 5,350 | (614 | ) | (11.5 | )% | |||||||
| All markets |
$ | 6,145 | $ | 7,241 | $ | (1,096 | ) | (15.1 | )% | ||||
| Number of ZipAgents at end of the period |
|||||||||||||
| Comparable existing markets |
1,839 | 1,627 | 212 | 13.0 | % | ||||||||
| New markets |
977 | 553 | 424 | 76.7 | % | ||||||||
| All markets |
2,816 | 2,180 | 636 | 29.2 | % | ||||||||
| (1) | Beginning with our Form 10-Q for the three months ended March 31, 2009, new markets are transferred to existing markets on January 1st following the completion of their first full two calendar years of operation. In our reports filed prior to that Form 10-Q, new markets were transferred to existing markets on January 1st following the completion of their first full calendar year of operation. Our Tampa, Orlando, Minneapolis, Austin, Palm Beach and the Greater Philadelphia Area markets opened during 2006 and, therefore, completed their first two full calendar years as of the end of 2008. Accordingly, these markets were moved to existing markets as of January 1, 2009 and are included in comparable existing markets for all periods presented. |
The operations of our Westchester County, NY market (opened in December 2007) and our Long Island, NY market (opened in March 2008) were combined during 2009 and, therefore, are included as one market for all periods presented.
43
Table of Contents
Comparable existing markets:
| Atlanta, GA | Houston, TX | Sacramento, CA | ||
| Baltimore, MD | Las Vegas, NV | San Diego, CA | ||
| Boston, MA | Los Angeles, CA | San Francisco Bay Area, CA | ||
| Chicago, IL | Miami, FL | Seattle, WA | ||
| Dallas, TX | Orange County, CA | Washington, DC | ||
| Fresno/Central Valley, CA | Phoenix, AZ |
New markets and the month opened:
| Tampa, FL | February 2006 | |
| Orlando, FL | April 2006 | |
| Minneapolis, MN | May 2006 | |
| Austin, TX | July 2006 | |
| Palm Beach, FL | September 2006 | |
| Greater Philadelphia Area, PA | December 2006 | |
| Naples, FL | March 2007 | |
| Tucson, AZ | March 2007 | |
| Denver, CO | April 2007 | |
| Jacksonville, FL | May 2007 | |
| Salt Lake City, UT | July 2007 | |
| Richmond, VA | July 2007 | |
| Virginia Beach, VA | August 2007 | |
| Charlotte, NC | August 2007 | |
| Raleigh-Durham, NC | September 2007 | |
| Westchester County/ Long Island, NY | December 2007 | |
| Hartford, CT | July 2008 |
| (2) | The term “transaction” refers to each representation of a buyer or seller in a real estate purchase or sale. |
| (3) | Average net revenue per transaction equals net transaction revenues divided by number of transactions with respect to each period. |
Net transaction revenues
Net transaction revenues consist of commissions earned as agents to buyers and sellers on the purchase or sale of real estate transactions, net of any rebate, commission discount or transaction fee adjustment.
| Year Ended December 31, |
Increase (Decrease) |
Percent Change |
|||||||||||
| 2008 | 2007 | ||||||||||||
| (In thousands) | |||||||||||||
| Net transaction revenues |
|||||||||||||
| Comparable existing markets |
$ | 83,633 | $ | 89,604 | $ | (5,971 | ) | (6.7 | )% | ||||
| New markets |
21,794 | 11,496 | 10,298 | 89.6 | % | ||||||||
| Total |
$ | 105,427 | $ | 101,100 | $ | 4,327 | 4.3 | % | |||||
The increase in our net transaction revenues of $4.3 million for the year ended December 31, 2008 compared to the year ended December 31, 2007 was primarily due to an increase in net transaction revenues of $10.3 million in our new markets offset by a decrease in net transaction revenues of $6.0 million from our existing markets.
The decrease in net transaction revenues in our existing markets of $6.0 million or 6.7% was driven primarily by an increase in the number of transactions closed during the year of 741 or 6.3%, offset by a decrease
44
Table of Contents
in average net revenue per transaction of $923 or 12.2%. The decrease in average net revenue per transaction was primarily attributable to a combination of factors including an overall decrease in housing prices, an increase in the number of foreclosure, bank REO and short sale transactions, typically at further reduced sales prices, and ongoing tightening in the availability of consumer mortgage financing particularly impacting the sale of higher priced housing.
The increase in net transaction revenues in our new markets of $10.3 million was driven by an increase of 2,453 transactions closed during the year primarily from the new markets opened during 2006 and 2007. Average net revenue per transaction decreased by $614 or 11.5%.
Marketing and other revenues
Marketing and other revenues consist primarily of market transaction referrals and corporate marketing agreements and advertising.
| Year Ended December 31, |
Increase (Decrease) |
Percent Change |
|||||||||||
| 2008 | 2007 | ||||||||||||
| (In thousands) | |||||||||||||
| Marketing and other revenues |
|||||||||||||
| Comparable existing markets |
$ | 308 | $ | 287 | $ | 21 | 7.1 | % | |||||
| New markets |
115 | 67 | 48 | 73.9 | % | ||||||||
| Corporate |
1,600 | 2,408 | (808 | ) | (33.6 | )% | |||||||
| Total |
$ | 2,023 | $ | 2,762 | $ | (739 | ) | (26.8 | )% | ||||
The decrease in corporate referral and other revenues was primarily attributable to reduced fees from our primary source of corporate referral income, a mortgage services marketing agreement with E-LOAN, which terminated on October 31, 2008.
Cost of revenues
Our cost of revenues consists principally of commissions, payroll taxes, benefits including health insurance, performance and tenure based award programs, agent expense reimbursements and amortization of internal-use software and website development costs which relate primarily to our ZAP technology. Agent commissions are generally paid on market net revenues which include net transaction revenues plus referral and other revenues generated by our ZipAgents.
| Year Ended December 31, |
Increase (Decrease) |
Percent Change |
|||||||||||
| 2008 | 2007 | ||||||||||||
| (In thousands) | |||||||||||||
| Cost of revenues |
|||||||||||||
| Comparable existing markets |
$ | 50,738 | $ | 52,378 | $ | (1,640 | ) | (3.1 | )% | ||||
| New markets |
11,964 | 6,235 | 5,729 | 91.9 | % | ||||||||
| Total |
$ | 62,702 | $ | 58,613 | $ | 4,089 | 7.0 | % | |||||
The increase in cost of revenues for the year ended December 31, 2008 compared to the year ended December 31, 2007 was primarily related to increases in performance and tenure based award programs, agent expense reimbursements and the overall increase in net revenues on which we pay agent commissions.
Cost of revenues decreased in our existing markets by approximately $1.6 million or 3.1% for the year ended December 31, 2008 compared to the year ended December 31, 2007. Agent commissions and payroll taxes
45
Table of Contents
decreased by $2.8 million or 6.4% primarily attributable to the decrease in the net revenues on which these costs are based. Agent performance and tenure based programs, benefits and expense reimbursements increased by approximately $1.3 million or 15.2% primarily attributable to the increased number of qualifying agents. Amortization of internal-use software decreased by approximately $0.2 million or 30.5%. Overall, cost of revenues as a percentage of existing markets net revenues increased by about 2.2 percentage points.
Cost of revenues increased in our new markets by approximately $5.7 million related primarily to the increase net revenue during the year. Agent commissions and payroll taxes increased by $4.8 million primarily attributable to the increase in net revenues on which these costs are based. Agent expense reimbursements and benefits increased by approximately $0.9 million primarily attributable to the increased number of agents. Overall, cost of revenues as a percentage of new market net revenues increased by 0.7 percentage points. This increase in the cost of revenues percentage in new markets is expected as increasing numbers of ZipAgents achieve higher commission splits and qualify for benefits and performance based award programs as the new markets mature.
Product development
Product development expenses include our information technology costs relating to the maintenance of our website, proprietary technology platforms and system infrastructure. These costs consist primarily of compensation and benefits for our product development and infrastructure personnel, depreciation of software and equipment and infrastructure costs consisting primarily of facilities, communications and other operating expenses.
| Year Ended December 31, |
Increase (Decrease) |
Percent Change |
||||||||||
| 2008 | 2007 | |||||||||||
| (In thousands) | ||||||||||||
| Product development |
$ | 8,678 | $ | 7,320 | $ | 1,358 | 18.5 | % | ||||
The increase in product development expenses for the year ended December 31, 2008 compared to the year ended December 31, 2007 was due primarily to supporting higher website volume and a new data site and consisted primarily of increases in salaries and benefits of $0.1 million, technology infrastructure costs of $1.1 million, depreciation of $0.3 million and stock-based compensation of $0.1 million. These costs were partially offset by an increase in the amount of salaries and benefits capitalized as internal-use software of $0.1 million and a decrease in consulting costs of $0.1 million. As a percentage of net revenues, product development expenses increased by 1.1 percentage points for the year ended December 31, 2008 compared to the year ended December 31, 2007.
Sales and marketing
Sales and marketing expenses consist primarily of compensation and related costs for personnel engaged in sales, sales support and customer service as well as promotional, advertising and client acquisition costs. These expenses have been categorized below between those incurred in the existing and new markets offices and those expenses which are incurred by the regional and corporate support functions across all markets.
| Year Ended December 31, |
Increase (Decrease) |
Percent Change |
|||||||||||
| 2008 | 2007 | ||||||||||||
| (In thousands) | |||||||||||||
| Sales and marketing: |
|||||||||||||
| Comparable existing markets |
$ | 20,467 | $ | 22,289 | $ | (1,822 | ) | (8.2 | )% | ||||
| New markets |
12,635 | 8,591 | 4,044 | 47.1 | % | ||||||||
| Regional/corporate sales support and marketing |
7,469 | 7,376 | 93 | 1.3 | % | ||||||||
| Total |
$ | 40,571 | $ | 38,256 | $ | 2,315 | 6.1 | % | |||||
46
Table of Contents
The increase in sales and marketing expenses for the year ended December 31, 2008 compared to the year ended December 31, 2007 was primarily related to the overall growth in our business, principally the expansion into new markets.
Sales and marketing expenses decreased in our existing markets by approximately $1.8 million principally attributable to decreases in salaries and benefits of $0.6 million, travel of $0.2 million, depreciation of $0.1 million, recruiting and training costs of $0.2 million and customer acquisition and marketing costs of $0.7 million. As a percentage of existing market net revenues, existing market sales and marketing expenses were 24.4% in the current year compared to 24.8% in the prior year.
Sales and marketing expenses increased in our new markets by approximately $4.0 million principally attributable to the current year reflecting a full year of operations for the ten new markets opened during 2007, as well as the expenses relating to opening two new market offices during 2008. The increased expenses consisted primarily of salaries and benefits of $1.6 million, customer acquisition and marketing costs of $1.9 million and facilities and operating related expenses of $0.7 million partially offset by a decrease of $0.1 million of travel costs. As a percentage of new market revenues, new market sales and marketing expenses were 57.7% in the current year compared to 74.3% in the prior year.
Regional/corporate sales support and marketing expenses increased by approximately $0.1 million and consisted primarily of increased salaries and benefits expense, including stock-based compensation expenses of $0.3 million and travel of $0.1 million partially offset by decreases of $0.2 million of consulting costs. As a percentage of net revenues, regional sales support and marketing expenses were approximately 7.0% in the current year compared to 7.1% in the prior year.
General and administrative
General and administrative expenses consist primarily of compensation and related costs, including stock-based compensation, for personnel and facilities related to our executive, finance, human resources, facilities and legal organizations, and fees for professional services. Professional services are principally comprised of outside legal, audit and tax services.
| Year Ended December 31, |
Increase (Decrease) |
Percent Change |
|||||||||||
| 2008 | 2007 | ||||||||||||
| (In thousands) | |||||||||||||
| General and administrative |
$ | 12,789 | $ | 15,409 | $ | (2,620 | ) | (17.0 | )% | ||||
The decrease in general and administrative expenses for the year ended December 31, 2008 compared to the year ended December 31, 2007 was principally due to decreased salaries and benefits of $1.6 million, travel of $0.1 million, professional fees of $0.4 million, recruiting and training of $0.2 million and facilities and operating expenses of $0.3 million. Reflected in the decrease in general and administrative expenses during the year were expenses associated with the termination of our former CEO which totaled approximately $0.7 million during 2007. As a percentage of net revenues, general and administrative expenses were 11.9% for the year compared to 14.8% in the year ended December 31, 2007.
Litigation
| Year Ended December 31, |
Increase (Decrease) |
Percent Change |
||||||||||||
| 2008 | 2007 | |||||||||||||
| (In thousands) | ||||||||||||||
| Litigation |
$ | (1,355 | ) | $ | 3,550 | $ | (4,905 | ) | (138.2 | )% | ||||
47
Table of Contents
Litigation for the year ended December 31, 2008 relates to the settlement of a class action lawsuit filed by a former ZipAgent in the amount of $0.6 million offset by the settlement of a lawsuit we filed against a law firm that provided counseling in connection with certain employment matters in prior years. We settled this matter in exchange for payment of $3.2 million; net of legal fees, we recorded a recovery of approximately $2.0 million. Litigation for the year ended December 31, 2007 relates to the settlement of a class action lawsuit filed by four former ZipAgents in the amount of approximately $3.55 million.
Interest income
Interest income relates to interest we earn on our money market deposits and short-term investments.
| Year Ended December 31, |
Increase (Decrease) |
Percent Change |
|||||||||||
| 2008 | 2007 | ||||||||||||
| (In thousands) | |||||||||||||
| Interest income |
$ | 2,518 | $ | 4,401 | $ | (1,883 | ) | (42.8 | )% | ||||
Interest income fluctuates as our cash equivalents and short-term investment balances change and applicable interest rates increase or decrease. The decrease in interest income for the year ended December 31, 2008 compared to the year ended December 31, 2007 was due primarily to lower interest rates earned on lower average balances. The lower average balances were primarily attributable to the repurchase of shares of our common stock for approximately $17.4 million and cash used in our operating activities as a result of the loss incurred for the year ended December 31, 2008.
Other income (expense), net
Other income (expense), net consists of non-operating items.
| Year Ended December 31, |
Increase (Decrease) |
Percent Change |
||||||||||
| 2008 | 2007 | |||||||||||
| (In thousands) | ||||||||||||
| Other income (expense), net |
$ | 75 | $ | 1 | $ | 74 | 8,904.6 | % | ||||
Other income for the year ended December 31, 2008 relates primarily to realized gains on our short term investments.
LIQUIDITY AND CAPITAL RESOURCES
Our principal sources of liquidity for 2010 are our cash, cash equivalents and short-term investments. As of December 31, 2009 and 2008, we had cash, cash equivalents and short-term investments at fair value of $44.1 million and $49.4 million, respectively. We had no bank debt, line of credit or equipment facilities at December 31, 2009 and 2008.
Operating activities
Our operating activities used cash in the amount of $3.8 million, $11.6 million and $5.7 million in the years ended December 31, 2009, 2008 and 2007, respectively. Cash used in the year ended December 31, 2009 resulted primarily from a net loss $12.9 million partially offset by $2.6 million of depreciation and amortization, $3.9 million of non-cash stock-based compensation expense and net changes in working capital. Cash used in the year ended December 31, 2008 resulted primarily from a net loss $13.3 million and the payment of a $3.55 million litigation settlement accrued in the year ended December 31, 2007 partially offset by $2.8 million of depreciation and amortization and $3.9 million of non-cash stock-based compensation expense. Cash used in the
48
Table of Contents
year ended December 31, 2007 resulted primarily from a net loss of $14.9 million partially offset by $2.8 million of depreciation and amortization, $3.8 million of non-cash stock-based compensation expense and the accrual of the $3.55 million litigation settlement.
Our primary source of operating cash flow is the collection of our net commission income from escrow companies or similar intermediaries in the real estate transaction closing process offset by cash payments for ZipAgent costs including commissions, payroll taxes, benefits, award programs and expense reimbursements, as well as for product development, sales and marketing and general and administrative costs including employee compensation, benefits, client acquisition costs and other operating expenses. Due to the structure of our commission arrangements, our accounts receivable are settled in cash on a short-term basis and our accounts receivable balances at period end have historically been significantly less than one month’s net revenues.
Investing activities
Our investing activities provided cash of $9.2 million, $39.6 million, and $4.3 million in the years ended December 31, 2009, 2008 and 2007, respectively. Cash provided for the years ended December 31, 2009, 2008 and 2007 primarily represents the net proceeds from the sale and purchase of short-term investments offset by the purchase of property and equipment, including amounts for website development and internal use software.
We typically maintain a minimum amount of cash and cash equivalents for operational purposes and invest the remaining amount of our cash in investment grade, highly liquid interest-bearing securities which allows for flexibility in the event our cash needs change. Due to current economic conditions we have retained proceeds from maturing short-term investments in money market securities and as a result our cash and cash equivalent balances have increased by approximately $5.2 million at December 31, 2009 from December 31, 2008.
Currently, we expect our 2010 capital expenditures to be approximately $2.7 million primarily attributable to amounts capitalized for internal-use software and website development as well as expenditures for increased server capacity and software. In the future, our ability to make significant capital investments may depend on our ability to generate cash flow from operations and to obtain adequate financing, if necessary and available.
Financing activities
Our financing activities used cash in the amount of $0.1 million and $17.3 million and provided cash in the amount of $0.6 million in the years ended December 31, 2009, 2008 and 2007, respectively. The use of cash for the year ended December 31, 2009 represents primarily the repurchase of shares of our common stock in connection with the payment of withholding and payroll taxes due upon vesting of employee restricted stock awards. The use of cash for the year ended December 31, 2008 represents primarily the repurchase of approximately 3.5 million shares of our common stock directly from an investor during April 2008. The shares were originally issued in private placement transactions or pursuant to warrants acquired prior to our initial public offering. Our Board of Directors authorized the repurchase of the shares in a privately negotiated transaction for a purchase price of $5.00 per share for a total purchase price of approximately $17.4 million. The closing price of our common stock on the date of the repurchase was $5.14 per share. Sources of cash for 2007 primarily represented the proceeds from the exercise of common stock warrants and stock options.
As of December 31, 2009, we had one warrant outstanding for the purchase of an aggregate of 3,284 shares of our common stock at an exercise price of $18.27 per share; that warrant is currently exercisable at the option of the holder and expires in 2010.
Future needs
We believe that our current cash, cash equivalents and short-term investments will be sufficient to fund cash used in our operations and capital expenditures for at least the next twelve months. Our future capital requirements will depend on many factors, including our rate of growth into new geographic markets, our level
49
Table of Contents
of investment in technology, advertising initiatives and possible repurchases of our common stock. In addition, if the current macroeconomic environment and depressed state of the residential real estate market continues or worsens, we may have a greater need to fund our business by using our cash reserves, which could not continue indefinitely without our raising additional capital.
We routinely explore our options for offering services relating to the purchase, sale and ownership of a home, including services related to title insurance, escrow, mortgage, home warranty insurance and property and casualty insurance (including auto insurance), which we refer to as core services. We expect that some of our core services may be offered through affiliates (including wholly owned subsidiaries), while others may be offered through joint ventures or promoted through marketing arrangements with independent third parties, such as title companies, banks and insurance companies. We may enter into these types of arrangements in the future, which could also require us to seek additional equity or debt financing.
We have no bank debt or line of credit facilities. In the event that additional financing is required, we may not be able to raise it on terms acceptable to us or at all. If we are unable to raise additional capital when desired, our business, operations and results will likely suffer.
CONTRACTUAL OBLIGATIONS AND COMMITMENTS
We lease office space under non-cancelable operating leases with various expiration dates through June 2016. The following table provides summary information concerning our future contractual obligations and commitments at December 31, 2009.
| Payments Due by Period | |||||||||||||||
| Less Than 1 Year |
1 to 3 Years |
3 to 5 Years |
More Than 5 Years |
Total | |||||||||||
| (In thousands) | |||||||||||||||
| Operating lease commitments |
$ | 2,538 | $ | 3,684 | $ | 773 | $ | 84 | $ | 7,079 | |||||
OFF-BALANCE SHEET ARRANGEMENTS
We do not have any off balance-sheet arrangements, investments in special purpose entities or undisclosed borrowings or debt. Additionally, we are not a party to any derivative contracts or synthetic leases.
EFFECT OF RECENT ACCOUNTING PRONOUNCEMENTS
See “Recent Accounting Pronouncements” in Note 1 “The Company and Summary of Significant Accounting Policies” of the Notes to Consolidated Financial Statements for a full description of recent accounting pronouncements including the respective expected dates of adoption.
NON-GAAP MEASURE
The table below shows the trend of Adjusted EBITDA as a percentage of revenue for the periods indicated:
| Year Ended December 31, | ||||||||||||
| 2009 | 2008 | 2007 | ||||||||||
| (In thousands) | ||||||||||||
| Net revenue |
$ | 123,130 | $ | 107,450 | $ | 103,862 | ||||||
| Adjusted EBITDA |
$ | (7,294 | ) | $ | (10,487 | ) | $ | (9,126 | ) | |||
| Adjusted EBITDA margin |
(5.9 | )% | (9.8 | )% | (8.8 | )% | ||||||
We present Adjusted EBITDA, a non-GAAP financial measure, as a supplemental measure of our performance. We believe Adjusted EDITDA provides useful information regarding the operating results of our core business activity and prospects for the future. We define Adjusted EBITDA as net income (loss) less interest
50
Table of Contents
income plus interest expense, provision for income taxes, depreciation and amortization expense, stock-based compensation and further adjusted to eliminate the impact of certain items that we do not consider reflective of our ongoing core operating performance.
We present Adjusted EBITDA because we believe it assists investors and analysts in comparing our operating performance across reporting periods on a consistent basis by excluding items that we do not believe are reflective of our core operating performance. In addition, we use Adjusted EBITDA to evaluate our financial results and business strategies, develop budgets, manage expenditures and as a factor in evaluating management’s performance when determining incentive compensation.
Our use of Adjusted EBITDA has limitations as an analytical tool. Some of these limitations are:
| • | Adjusted EBITDA does not reflect our cash expenditures, or future requirements, for capital expenditures or contractual commitments; |
| • | Adjusted EBITDA does not reflect changes in, or cash requirements for, our working capital needs; |
| • | although depreciation and amortization are non-cash charges, the assets being depreciated and amortized may have to be replaced in the future, and Adjusted EBITDA does not reflect any cash requirements for such replacements; |
| • | non-cash stock-based compensation is and will remain a key element of our overall long-term incentive compensation package, although we exclude it as an expense when evaluating our ongoing operating performance for a particular period; |
| • | Adjusted EBITDA does not reflect the impact of certain cash charges or credits resulting from matters we consider not to be reflective of our core ongoing operations, and |
| • | other companies, including companies in our industry, may calculate Adjusted EBITDA differently than we do, which limits its usefulness as a comparative measure. |
Because of these limitations, Adjusted EBITDA should not be considered in isolation or as a substitute for performance measures calculated in accordance with GAAP. When evaluating our performance, Adjusted EBITDA should be considered alongside other financial measures, including net income and our other GAAP results.
The following is a reconciliation of Adjusted EBITDA to the most comparable GAAP measure, net loss for the years ended December 31, 2009, 2008 and 2007:
| Year Ended December 31, | ||||||||||||
| 2009 | 2008 | 2007 | ||||||||||
| Reconciliation of non-GAAP Adjusted EBITDA to net income (loss) |
(In thousands) | |||||||||||
| Net loss |
$ | (12,892 | ) | $ | (13,342 | ) | $ | (14,884 | ) | |||
| Add back: |
||||||||||||
| Interest income |
(718 | ) | (2,518 | ) | (4,401 | ) | ||||||
| Provision for (benefit from) income taxes |
(171 | ) | — | — | ||||||||
| Depreciation and amortization |
2,588 | 2,816 | 2,858 | |||||||||
| Stock-based compensation expense |
3,899 | 3,912 | 3,751 | |||||||||
| Non-operating litigation (recovery), net (1) |
— | (1,355 | ) | 3,550 | ||||||||
| Non-GAAP Adjusted EBITDA |
$ | (7,294 | ) | $ | (10,487 | ) | $ | (9,126 | ) | |||
| (1) | Litigation for the year ended December 31, 2008 represents the recovery, net of legal fees, of approximately $2.0 million from the settlement of a lawsuit we filed against a law firm that provided counsel in connection with certain employment matters in prior years partially offset by the settlement of a class action lawsuit filed by a former ZipAgent in the amount of $0.6 million. Litigation for the year ended December 31, 2007 represents the settlement of a class action lawsuit filed by four former ZipAgents in the amount of approximately $3.55 million. |
51
Table of Contents
| Item 7A. | Quantitative and Qualitative Disclosures About Market Risk: |
Interest rate sensitivity
Our investment policy requires us to invest funds in excess of current operating requirements. The principal objectives of our investment activities are to preserve principal, provide liquidity and maximize income consistent with minimizing risk of material loss. We believe this investment policy is prudent, and helps to reduce, but does not prevent, loss of principal, and results in minimal interest rate exposure on our investments.
As of December 31, 2009 and 2008, our cash and cash equivalents consisted primarily of money market funds and our short-term investments consisted primarily of investment grade, highly liquid interest-bearing securities. The recorded carrying amounts of cash and cash equivalents approximate fair value due to their short maturities and short-term investments are carried at fair value. The amount of credit exposure to any one issue, issuer and type of instrument is limited. Our interest income is sensitive to changes in the general level of interest rates in the United States, particularly since the majority of our investments are fixed income investments. If market interest rates were to increase or decrease immediately and uniformly by 10% from levels at December 31, 2009 and 2008, the increase or decline in fair market value of the portfolio would be approximately $0.0 million and $0.1 million, respectively. There have not been any material changes in the past year to our primary market risk exposures, or how these exposures are managed.
Exchange rate sensitivity
We consider our exposure to foreign currency exchange rate fluctuations to be minimal, as we do not have any sales, assets or liabilities denominated in foreign currencies. We have not engaged in any hedging or other derivative transactions to date.
52
Table of Contents
| Item 8. | Financial Statements and Supplementary Data: |
Financial Statements Table of Contents
| Page Number | ||
| 54 | ||
| 55 | ||
| 56 | ||
| 57 | ||
| 58 | ||
| 59 | ||
| Financial Statement Schedule — Valuation and Qualifying Accounts |
79 |
53
Table of Contents
REPORT OF INDEPENDENT REGISTERED PUBLIC ACCOUNTING FIRM
To the Board of Directors and
Stockholders of ZipRealty, Inc.:
In our opinion, the consolidated financial statements listed in the accompanying index present fairly, in all material respects, the financial position of ZipRealty, Inc. and its subsidiaries at December 31, 2009 and December, 31, 2008, and the results of their operations and their cash flows for each of the three years in the period ended December 31, 2009 in conformity with accounting principles generally accepted in the United States of America. In addition, in our opinion, the financial statement schedule listed in the accompanying index presents fairly, in all material respects, the information set forth therein when read in conjunction with the related consolidated financial statements. Also in our opinion, the Company maintained, in all material respects, effective internal control over financial reporting as of December 31, 2009, based on criteria established in Internal Control — Integrated Framework issued by the Committee of Sponsoring Organizations of the Treadway Commission (COSO). The Company’s management is responsible for these financial statements and financial statement schedule, for maintaining effective internal control over financial reporting and for its assessment of the effectiveness of internal control over financial reporting, included in Management’s Report on Internal Control Over Financial Reporting appearing under Item 9A. Our responsibility is to express opinions on these financial statements, on the financial statement schedule, and on the Company’s internal control over financial reporting based on our integrated audits. We conducted our audits in accordance with the standards of the Public Company Accounting Oversight Board (United States). Those standards require that we plan and perform the audits to obtain reasonable assurance about whether the financial statements are free of material misstatement and whether effective internal control over financial reporting was maintained in all material respects. Our audits of the financial statements included examining, on a test basis, evidence supporting the amounts and disclosures in the financial statements, assessing the accounting principles used and significant estimates made by management, and evaluating the overall financial statement presentation. Our audit of internal control over financial reporting included obtaining an understanding of internal control over financial reporting, assessing the risk that a material weakness exists, and testing and evaluating the design and operating effectiveness of internal control based on the assessed risk. Our audits also included performing such other procedures as we considered necessary in the circumstances. We believe that our audits provide a reasonable basis for our opinions.
As discussed in Note 2 to the consolidated financial statements, effective January 1, 2008, the Company changed its method of accounting for fair value measurements.
A company’s internal control over financial reporting is a process designed to provide reasonable assurance regarding the reliability of financial reporting and the preparation of financial statements for external purposes in accordance with generally accepted accounting principles. A company’s internal control over financial reporting includes those policies and procedures that (i) pertain to the maintenance of records that, in reasonable detail, accurately and fairly reflect the transactions and dispositions of the assets of the company; (ii) provide reasonable assurance that transactions are recorded as necessary to permit preparation of financial statements in accordance with generally accepted accounting principles, and that receipts and expenditures of the company are being made only in accordance with authorizations of management and directors of the company; and (iii) provide reasonable assurance regarding prevention or timely detection of unauthorized acquisition, use, or disposition of the company’s assets that could have a material effect on the financial statements.
Because of its inherent limitations, internal control over financial reporting may not prevent or detect misstatements. Also, projections of any evaluation of effectiveness to future periods are subject to the risk that controls may become inadequate because of changes in conditions, or that the degree of compliance with the policies or procedures may deteriorate.
/s/ PricewaterhouseCoopers LLP
San Jose, California
March 10, 2010
54
Table of Contents
CONSOLIDATED BALANCE SHEETS
(In thousands, except per share amounts)
| December 31, | ||||||||
| 2009 | 2008 | |||||||
| ASSETS | ||||||||
| Current assets |
||||||||
| Cash and cash equivalents |
$ | 23,737 | $ | 18,500 | ||||
| Short-term investments |
20,397 | 30,889 | ||||||
| Accounts receivable, net of allowance of $29 and $26, respectively |
1,603 | 1,625 | ||||||
| Prepaid expenses and other current assets |
2,726 | 3,442 | ||||||
| Total current assets |
48,463 | 54,456 | ||||||
| Restricted cash |
110 | 130 | ||||||
| Property and equipment, net |
3,390 | 4,516 | ||||||
| Intangible assets, net |
58 | 89 | ||||||
| Other assets |
371 | 776 | ||||||
| Total assets |
$ | 52,392 | $ | 59,967 | ||||
| LIABILITIES AND STOCKHOLDERS’ EQUITY | ||||||||
| Current liabilities |
||||||||
| Accounts payable |
$ | 1,620 | $ | 2,169 | ||||
| Accrued expenses and other current liabilities |
8,815 | 6,706 | ||||||
| Total current liabilities |
10,435 | 8,875 | ||||||
| Other long-term liabilities |
327 | 441 | ||||||
| Total liabilities |
10,762 | 9,316 | ||||||
| Commitments and contingencies (Note 5) |
||||||||
| Stockholders’ equity |
||||||||
| Common stock: $0.001 par value; 100,000 shares authorized; 23,930 and 23,709 shares issued and 20,445 and 20,273 shares outstanding, respectively |
24 | 24 | ||||||
| Additional paid-in capital |
152,440 | 148,502 | ||||||
| Common stock warrants |
4 | 4 | ||||||
| Accumulated other comprehensive loss |
(153 | ) | (246 | ) | ||||
| Accumulated deficit |
(93,375 | ) | (80,483 | ) | ||||
| Treasury stock at cost 3,485 and 3,436 shares, respectively |
(17,310 | ) | (17,150 | ) | ||||
| Total stockholders’ equity |
41,630 | 50,651 | ||||||
| Total liabilities and stockholders’ equity |
$ | 52,392 | $ | 59,967 | ||||
The accompanying notes are an integral part of these consolidated financial statements.
55
Table of Contents
CONSOLIDATED STATEMENTS OF OPERATIONS
(In thousands, except per share amounts)
| Year Ended December 31, | ||||||||||||
| 2009 | 2008 | 2007 | ||||||||||
| Net transaction revenues |
$ | 120,738 | $ | 105,427 | $ | 101,100 | ||||||
| Marketing and other revenues |
2,392 | 2,023 | 2,762 | |||||||||
| Net revenues |
123,130 | 107,450 | 103,862 | |||||||||
| Operating expenses |
||||||||||||
| Cost of revenues |
72,197 | 62,702 | 58,613 | |||||||||
| Product development |
9,429 | 8,678 | 7,320 | |||||||||
| Sales and marketing |
41,881 | 40,571 | 38,256 | |||||||||
| General and administrative |
13,405 | 12,789 | 15,409 | |||||||||
| Litigation (recovery), net |
— | (1,355 | ) | 3,550 | ||||||||
| Total operating expenses |
136,912 | 123,385 | 123,148 | |||||||||
| Loss from operations |
(13,782 | ) | (15,935 | ) | (19,286 | ) | ||||||
| Other income (expense), net |
||||||||||||
| Interest income |
718 | 2,518 | 4,401 | |||||||||
| Other income (expense), net |
1 | 75 | 1 | |||||||||
| Total other income, net |
719 | 2,593 | 4,402 | |||||||||
| Loss before income taxes |
(13,063 | ) | (13,342 | ) | (14,884 | ) | ||||||
| Provision for (benefit from) income taxes |
(171 | ) | — | — | ||||||||
| Net loss |
$ | (12,892 | ) | $ | (13,342 | ) | $ | (14,884 | ) | |||
| Net loss per share: |
||||||||||||
| Basic and diluted |
$ | (0.64 | ) | $ | (0.64 | ) | $ | (0.66 | ) | |||
| Weighted average common shares outstanding: |
||||||||||||
| Basic and diluted |
20,242 | 20,917 | 22,586 | |||||||||
The accompanying notes are an integral part of these consolidated financial statements.
56
Table of Contents
CONSOLIDATED STATEMENTS OF STOCKHOLDERS’ EQUITY
(In thousands)
| Common Stock | Additional Paid-In Capital |
Common Stock Warrants |
Deferred Stock-Based Compensation |
Accumulated Other Comprehensive Income (Loss) |
Accumulated Deficit |
Treasury Stock | Total Stockholders’ Equity |
Compre- hensive Income (Loss) |
|||||||||||||||||||||||||||||||||
| Shares | Amount | Shares | Amount | ||||||||||||||||||||||||||||||||||||||
| Balance at December 31, 2006 |
21,627 | 22 | 134,813 | 5,519 | (71 | ) | (157 | ) | (52,257 | ) | — | — | 87,869 | ||||||||||||||||||||||||||||
| Issuance of common stock upon exercise of stock options |
173 | — | 203 | — | — | — | — | — | — | 203 | |||||||||||||||||||||||||||||||
| Issuance of restricted common stock |
225 | — | — | — | — | — | — | — | — | — | |||||||||||||||||||||||||||||||
| Issuance of common stock upon exercise of common stock warrants |
1,626 | 2 | 5,758 | (5,310 | ) | — | — | — | — | — | 450 | ||||||||||||||||||||||||||||||
| Amortization of deferred stock-based compensation |
— | — | — | — | 57 | — | — | — | — | 57 | |||||||||||||||||||||||||||||||
| Reversal of deferred stock-based compensation upon employee terminations |
— | — | (11 | ) | — | 11 | — | — | — | — | — | ||||||||||||||||||||||||||||||
| Stock-based compensation expense |
— | — | 3,736 | — | — | — | — | — | — | 3,736 | |||||||||||||||||||||||||||||||
| Acquisition of treasury stock |
(10 | ) | — | — | — | — | — | — | 10 | (50 | ) | (50 | ) | ||||||||||||||||||||||||||||
| Comprehensive loss: |
|||||||||||||||||||||||||||||||||||||||||
| Net loss |
— | — | — | — | — | — | (14,884 | ) | — | — | (14,884 | ) | $ | (14,884 | ) | ||||||||||||||||||||||||||
| Unrealized gain on available-for-sale securities, net of tax |
— | — | — | — | — | 345 | — | — | — | 345 | 345 | ||||||||||||||||||||||||||||||
| Total comprehensive loss |
$ | (14,539 | ) | ||||||||||||||||||||||||||||||||||||||
| Balance at December 31, 2007 |
23,641 | 24 | 144,499 | 209 | (3 | ) | 188 | (67,141 | ) | 10 | (50 | ) | 77,726 | ||||||||||||||||||||||||||||
| Issuance of common stock upon exercise of stock options |
12 | — | 21 | — | — | — | — | — | — | 21 | |||||||||||||||||||||||||||||||
| Issuance of restricted common stock |
25 | — | — | — | — | — | — | — | — | — | |||||||||||||||||||||||||||||||
| Issuance of common stock upon exercise of common stock warrants |
21 | — | 205 | (205 | ) | — | — | — | — | — | — | ||||||||||||||||||||||||||||||
| Amortization of deferred stock-based compensation |
— | — | — | — | 3 | — | — | — | — | 3 | |||||||||||||||||||||||||||||||
| Stock-based compensation expense |
— | — | 3,972 | — | — | — | — | — | — | 3,972 | |||||||||||||||||||||||||||||||
| Acquisition of treasury stock |
(3,506 | ) | — | — | — | — | — | — | 3,506 | (17,500 | ) | (17,500 | ) | ||||||||||||||||||||||||||||
| Reissue of treasury stock |
80 | — | (195 | ) | — | — | — | — | (80 | ) | 400 | 205 | |||||||||||||||||||||||||||||
| Comprehensive loss: |
|||||||||||||||||||||||||||||||||||||||||
| Net loss |
— | — | — | — | — | — | (13,342 | ) | — | — | (13,342 | ) | $ | (13,342 | ) | ||||||||||||||||||||||||||
| Unrealized gain on available-for-sale securities, net of tax |
— | — | — | — | — | (434 | ) | — | — | — | (434 | ) | (434 | ) | |||||||||||||||||||||||||||
| Total comprehensive loss |
$ | (13,776 | ) | ||||||||||||||||||||||||||||||||||||||
| Balance at December 31, 2008 |
20,273 | 24 | 148,502 | 4 | — | (246 | ) | (80,483 | ) | 3,436 | (17,150 | ) | 50,651 | ||||||||||||||||||||||||||||
| Issuance of common stock upon exercise of stock options |
17 | — | 21 | — | — | — | — | — | — | 21 | |||||||||||||||||||||||||||||||
| Issuance of restricted common stock |
204 | — | — | — | — | — | — | — | — | — | |||||||||||||||||||||||||||||||
| Stock-based compensation expense |
— | — | 3,917 | — | — | — | — | — | — | 3,917 | |||||||||||||||||||||||||||||||
| Acquisition of treasury stock |
(49 | ) | — | — | — | — | — | — | 49 | (160 | ) | (160 | ) | ||||||||||||||||||||||||||||
| Comprehensive loss: |
|||||||||||||||||||||||||||||||||||||||||
| Net loss |
— | — | — | — | — | — | (12,892 | ) | — | — | (12,892 | ) | $ | (12,892 | ) | ||||||||||||||||||||||||||
| Unrealized loss on available-for-sale securities, net of tax |
— | — | — | — | — | 93 | — | — | — | 93 | 93 | ||||||||||||||||||||||||||||||
| Total comprehensive loss |
$ | (12,799 | ) | ||||||||||||||||||||||||||||||||||||||
| Balance at December 31, 2009 |
20,445 | $ | 24 | $ | 152,440 | $ | 4 | $ | — | $ | (153 | ) | $ | (93,375 | ) | 3,485 | $ | (17,310 | ) | $ | 41,630 | ||||||||||||||||||||
The accompanying notes are an integral part of these consolidated financial statements.
57
Table of Contents
CONSOLIDATED STATEMENTS OF CASH FLOWS
(In thousands)
| Year Ended December 31, | ||||||||||||
| 2009 | 2008 | 2007 | ||||||||||
| Cash flows from operating activities |
||||||||||||
| Net loss |
$ | (12,892 | ) | $ | (13,342 | ) | $ | (14,884 | ) | |||
| Adjustments to reconcile net loss to net cash used in operating activities |
||||||||||||
| Depreciation and amortization |
2,557 | 2,786 | 2,828 | |||||||||
| Amortization of intangible assets |
31 | 30 | 30 | |||||||||
| Stock-based compensation expense |
3,899 | 3,912 | 3,751 | |||||||||
| Provision for doubtful accounts |
3 | (3 | ) | (1 | ) | |||||||
| Amortization of short-term investment premium (discount) |
5 | (266 | ) | (420 | ) | |||||||
| Loss on disposal of property and equipment |
44 | 107 | 10 | |||||||||
| Equity in net loss of non-consolidated companies |
— | — | 4 | |||||||||
| Changes in operating assets and liabilities |
||||||||||||
| Accounts receivable |
19 | (452 | ) | 612 | ||||||||
| Prepaid expenses and other current assets |
716 | (175 | ) | (87 | ) | |||||||
| Other assets |
405 | (436 | ) | (122 | ) | |||||||
| Accounts payable |
(549 | ) | 74 | (89 | ) | |||||||
| Accrued expenses and other current liabilities |
2,063 | (3,789 | ) | 2,704 | ||||||||
| Other long-term liabilities |
(114 | ) | (62 | ) | (10 | ) | ||||||
| Net cash used in operating activities |
(3,813 | ) | (11,616 | ) | (5,674 | ) | ||||||
| Cash flows from investing activities |
||||||||||||
| Restricted cash |
20 | (40 | ) | — | ||||||||
| Purchases of short-term investments |
(16,084 | ) | (12,859 | ) | (48,830 | ) | ||||||
| Proceeds from sale and maturity of short-term investments |
26,664 | 54,451 | 57,179 | |||||||||
| Purchases of property and equipment |
(1,411 | ) | (1,980 | ) | (4,048 | ) | ||||||
| Investment in non-consolidated companies |
— | — | 13 | |||||||||
| Net cash provided by investing activities |
9,189 | 39,572 | 4,314 | |||||||||
| Cash flows from financing activities |
||||||||||||
| Proceeds from stock option exercises |
21 | 21 | 203 | |||||||||
| Proceeds from common stock warrant exercises |
— | — | 450 | |||||||||
| Acquisition of treasury stock |
(160 | ) | (17,500 | ) | (50 | ) | ||||||
| Proceeds from reissue of treasury stock |
— | 205 | — | |||||||||
| Net cash provided by (used in) financing activities |
(139 | ) | (17,274 | ) | 603 | |||||||
| Net increase (decrease) in cash and cash equivalents |
5,237 | 10,682 | (757 | ) | ||||||||
| Cash and cash equivalents at beginning of period |
18,500 | 7,818 | 8,575 | |||||||||
| Cash and cash equivalents at end of period |
$ | 23,737 | $ | 18,500 | $ | 7,818 | ||||||
| Supplemental cash flow information Non-cash investing and financing activities |
||||||||||||
| Reversal of deferred stock-based compensation upon employee terminations |
$ | — | $ | — | $ | 11 | ||||||
| Recognition of additional paid-in capital from common stock warrants due to exercise of common stock warrants |
$ | — | $ | 205 | $ | 5,310 | ||||||
| Stock-based compensation capitalized in internal-use software costs |
$ | 64 | $ | 63 | $ | 42 | ||||||
The accompanying notes are an integral part of these consolidated financial statements.
58
Table of Contents
NOTES TO CONSOLIDATED FINANCIAL STATEMENTS
1. THE COMPANY AND SUMMARY OF SIGNIFICANT ACCOUNTING POLICIES
Nature of operations
ZipRealty, Inc. (the “Company”), is a full-service real estate brokerage firm incorporated in the State of California in January 1999 and reincorporated in Delaware in August 2004. Headquartered in the San Francisco Bay Area, the Company provides brokerage services to buyers and sellers through its agents in Arizona, California, Colorado, Connecticut, Delaware, Florida, Georgia, Illinois, Maryland, Massachusetts, Minnesota, Nevada, New Jersey, New York, North Carolina, Oregon, Pennsylvania, South Carolina, Texas, Utah, Virginia, Washington, and Washington, D.C. The Company provides consumers the opportunity to access Multiple Listing Services, or MLS, data through its website, and offers a lower commission structure than is typical in the industry. Buyers are offered a commission rebate at the close of a transaction, while sellers are charged a reduced commission.
Principles of consolidation
The accompanying consolidated financial statements include the accounts of the Company and its wholly owned subsidiaries and reflect the elimination of intercompany accounts and transactions.
Net income (loss) per share
Basic net income (loss) per share is computed by dividing the net income (loss) for the period by the weighted average number of shares of common stock outstanding during the period. Diluted income (loss) per share is computed by dividing net income (loss) for the period by the weighted average number of shares of common stock outstanding plus, if dilutive, potential common shares outstanding during the period. Potential common shares are composed of incremental shares of common stock issuable upon the exercise of potentially dilutive stock options, warrants and unvested restricted stock.
Use of estimates
The preparation of financial statements in conformity with accounting principles generally accepted in the United States of America requires management to make estimates and assumptions that affect the reported amounts of assets and liabilities and disclosure of contingent assets and liabilities at the date of the financial statements and reported amounts of revenues and expenses during the reporting period. Actual results could differ from those estimates.
Revenue recognition
The Company derives the majority of its revenue from commissions earned as agents to buyers and sellers on purchase or sale transactions. Commission revenue is recognized upon closing of a sale and purchase transaction, net of any rebate or commission discount or transaction fee adjustment, as evidenced when the escrow or similar account has closed and funds have been disbursed to all appropriate parties. Non-commission revenue is recognized from its other business relationships as the fees are earned from the other party, typically on a monthly fee basis. Revenue is recognized only when there is persuasive evidence an arrangement exists, the price is fixed or determinable, the transaction has been completed and collectability of the resulting receivable is reasonably assured.
Expense recognition
Commission expenses to agents are recognized concurrently with the related revenues. All other costs and expenses are recognized when incurred.
59
Table of Contents
Cost of revenues
Cost of revenues consists of commissions, related payroll taxes, benefits including health insurance and performance and tenure based award programs and expense reimbursements paid to the Company’s ZipAgents, and the amortization of internal-use software and website development costs which relate primarily to the Company’s ZipAgent Platform.
Cash and cash equivalents
The Company considers all highly liquid investments with remaining maturities at the date of purchase of three months or less to be cash equivalents. At December 31, 2009 and 2008, $17,780,000 and $15,267,000, respectively, of money market funds, the fair value of which approximates cost, are included in cash and cash equivalents.
Short-term investments
The Company classifies fixed income securities with a maturity of over twelve months from the balance sheet date as short-term investments based on the funds being available for use in current operations, if needed. To date all fixed income securities have been classified as available-for-sale and carried at fair value, which is determined based on quoted market prices, with unrealized gains or losses, net of tax effects, included in accumulated other comprehensive income (loss) in the consolidated accompanying financial statements. Interest and amortization of premiums and discounts for fixed income securities are included in other income (expense), net, in the accompanying consolidated financial statements. Realized gains and losses are calculated using the specific identification method.
Fair value of financial instruments
The carrying amounts of the Company’s financial instruments, which include cash and cash equivalents, accounts receivable, restricted cash and accounts payable, accrued expenses and other current liabilities, approximate their fair values due to their short maturities.
Concentration of credit risk, significant customers and significant suppliers
Financial instruments that potentially subject the Company to a concentration of credit risk consist of cash, cash equivalents, short-term investments, accounts receivable and restricted cash.
The Company deposits its cash, cash equivalents and short-term investments with financial institutions that management believes to be of high credit quality, and these deposits may on occasion exceed federally insured limits. At December 31, 2009, substantially all of the Company’s cash, cash equivalents and short-term investments were managed by one financial institution. The fair value of these short-term investments are subject to fluctuations based on market prices.
Substantially all of the Company’s accounts receivable are derived from commissions earned and are due from escrow and other residential real estate transfer agents. These accounts receivable are typically unsecured. Allowances for credit losses and expected transaction price adjustments are provided for in the financial statements and have been within management’s expectations. No escrow or other transfer agent accounted for 10% or more of the accounts receivable at December 31, 2009 or 2008.
The Company derived 33%, 37% and 37% of its net transaction revenues during the years ended December 31, 2009, 2008 and 2007, respectively, in the State of California. No customers accounted for more than 10% of net revenues in 2009, 2008 or 2007.
60
Table of Contents
The Company generates leads for ZipAgents through many sources, including leads from third parties with which the Company has only non-exclusive, short-term agreements that are generally terminable on little or no notice and with no penalties. The cost of these leads are included in sales and marketing expenses. The Company’s largest third-party lead source, HomeGain, Inc., which is a competitor for online customer acquisition, generated approximately 15%, 19% and 21% of the Company’s leads during 2009, 2008 and 2007, respectively. Google generated approximately 14%, 13% and 16% of the Company’s leads in 2009, 2008 and 2007, respectively and Trouve generated approximately 10%, 10% and 9% of the Company’s leads in 2009, 2008 and 2007, respectively.
Property and equipment
Property and equipment are stated at cost. Leasehold improvements are amortized on the straight-line basis over the shorter of the lease period or their estimated useful lives. Depreciation and amortization is computed using the straight-line method over the estimated useful lives of the property and equipment as follows:
| Computer hardware and software |
1-3 years | |
| Furniture, fixtures and equipment |
4-5 years | |
| Leasehold improvements |
Shorter of the lease period or estimated useful life |
When assets are sold or retired, the cost and accumulated depreciation and amortization are eliminated from the accounts, and any resulting gains or losses are recorded in operations in the period realized. Maintenance and repairs are expensed as incurred. Expenditures that substantially increase an asset’s useful life or improve an asset’s functionality are capitalized.
Leasehold improvements made by the Company and reimbursable by the landlord as tenant incentives are recorded by the Company as leasehold improvement assets and amortized over the shorter of the lease period or estimated useful life. The incentives from the landlord are recorded as deferred rent and amortized as reductions to rent expense over the lease term. Deferred rent of $86,000 was amortized as a reduction of rent expense in 2007, 2008 and 2009. At December 31, 2009 the deferred rent balance attributable to these incentives totaled $180,000. Future amortization of the balance of these tenant incentives is estimated to be $86,000 per year from 2010 through 2011, and $8,000 for 2012.
Impairment of Long-Lived Assets
In accordance with the accounting standards for the impairment or disposal of long-lived assets, the Company periodically evaluates the carrying value of long-lived assets to be held and used when events and circumstances warrant such a review. The carrying value of a long-lived asset is considered impaired when the anticipated undiscounted cash flow from such asset is less than its carrying value. In that event, a loss is recognized based on the amount by which the carrying value exceeds the fair value of the long-lived asset. Fair value is determined primarily using the anticipated cash flows discounted at a rate commensurate with the risk involved. Losses on long-lived assets to be disposed of are determined in a similar manner, except that fair values are reduced for the cost of disposal.
Stock-Based Compensation
The Company follows the provisions of accounting standards for share-based payments which requires the measurement and recognition of compensation expense for all stock-based payment awards made to employees and directors, including employee stock options and employee stock purchases, based on estimated fair values. Under the fair value recognition provisions the accounting standards, stock-based compensation cost is estimated at the grant date based on the fair value of the awards expected to vest and recognized as expense using the straight-line method over the requisite service period of the award.
61
Table of Contents
The Company estimates the fair value of stock options using the Black-Scholes option pricing model, which incorporates various assumptions including volatility, expected life and interest rates. The expected volatility is based on the historical volatility of the Company’s common stock and consideration of other relevant factors such as the volatility assumptions of guideline companies. The expected life of options is estimated by taking the average of the vesting term and the contractual term of the option. The Company estimates expected forfeitures based on various factors including employee class and historical experience. The estimation of stock awards that will ultimately vest requires judgment, and to the extent actual results or updated estimates differ from our current estimates, such amounts will be recorded as a cumulative adjustment in the period the estimates are revised.
Internal-Use Software and Website Development Costs
The Company accounts for internal-use software and website development costs, including the development of its ZipAgent platform (“ZAP”) in accordance with the guidance set forth in the related accounting standards. Costs incurred in the planning stage are expensed as incurred while costs incurred in the application and infrastructure stage are capitalized, assuming such costs are deemed to be recoverable. Costs incurred in the operating stage are expensed as incurred except for the costs of fees paid for cancelable maintenance contracts for internal use software purchased from third-party vendors. The cost of these fees incurred during the operating phase are recognized on a ratable basis over the period of expected economic benefit, which generally coincides with the contractual service period. The planning stage ends when the functional specifications for a release are complete. Costs incurred relating to architecture design and coding that result in additional functionality are capitalized in the application and infrastructure stage. These costs principally relate to payroll costs for employees directly involved in the development process. Capitalized internal-use software costs, included in property and equipment, are amortized over the software’s useful life, which ranges between 15 and 24 months. Capitalized internal-use software costs are amortized to cost of revenues. Costs incurred in connection with the research and development of the Company’s product and technology are expensed as incurred to product development.
The Company capitalized $942,000 and $1,265,000 in internal-use software costs during the years ended December 31, 2009 and 2008, respectively. Amortization expense totaled $943,000, $639,000 and $792,000 during the years ended December 31, 2009, 2008 and 2007, respectively. The amount of unamortized internal-use software costs at December 31, 2009 and 2008 was $1,184,000 and $1,211,000 respectively.
Advertising Costs
The costs of advertising are expensed as incurred. Advertising expense was $418,000, $396,000, and $646,000 for the years ended December 31, 2009, 2008 and 2007, respectively. Such expense is included in sales and marketing expense.
Income Taxes
Deferred tax assets and liabilities arise from the differences between the tax basis of an asset or liability and its reported amount in the financial statements as well as from net operating loss and tax credit carry forwards. Deferred tax amounts are determined by using the tax rates expected to be in effect when the taxes will actually be paid or refunds received, as provided under current enacted tax law. Valuation allowances are established when necessary to reduce deferred tax assets to the amount expected to be realized. Income tax expense or benefit is the tax payable or refundable, respectively, for the period adjusted for the change during the period in deferred tax assets and liabilities.
Comprehensive Income (Loss)
Comprehensive income (loss) is the sum of net income (loss) and unrealized gains (losses) on available-for-sale securities. Unrealized gains (losses) on investments are excluded from net income (loss) and are reported in accumulated other comprehensive income (loss) in the accompanying consolidated financial statements.
62
Table of Contents
Segment Reporting
Under the accounting standards for reporting information about operating segments in a company’s financial statements. operating segments are defined as components of an enterprise about which separate financial information is available that is evaluated regularly by the chief operating decision maker (the Company’s Executive Committee), or decision making group, in deciding how to allocate resources and in assessing performance. The Company operates in one segment and in one geographic area, the United States of America.
Recent Accounting Pronouncements
In June 2009, the FASB issued the FASB Accounting Standards Codification (“Codification”). The Codification is the single source for all authoritative GAAP and is effective for financial statements issued for periods ending after September 15, 2009. The Company adopted the guidelines in the Codification effective July 1, 2009. The adoption of the Codification only impacts references for accounting guidance and did not affect the Company’s consolidated financial position, results of operations and cash flows.
In January 2010, the FASB issued new accounting guidance related to the disclosure requirements for fair value measurements and provides clarification for existing disclosures requirements. More specifically, this update will require (a) an entity to disclose separately the amounts of significant transfers in and out of Levels 1 and 2 fair value measurements and to describe the reasons for the transfers; and (b) information about purchases, sales, issuances and settlements to be presented separately (i.e. present the activity on a gross basis rather than net) in the reconciliation for fair value measurements using significant unobservable inputs (Level 3 inputs). This guidance clarifies existing disclosure requirements for the level of disaggregation used for classes of assets and liabilities measured at fair value and requires disclosures about the valuation techniques and inputs used to measure fair value for both recurring and nonrecurring fair value measurements using Level 2 and Level 3 inputs. The new disclosures and clarifications of existing disclosure are effective for fiscal years beginning after December 15, 2009, except for the disclosure requirements for related to the purchases, sales, issuances and settlements in the rollforward activity of Level 3 fair value measurements. Those disclosure requirements are effective for fiscal years ending after December 31, 2010. The Company does not anticipate the adoption of the updated guidance will have a material impact on its consolidated financial position, results of operations and cash flows.
2. BALANCE SHEET COMPONENTS
Restricted cash
The Company’s restricted cash balances at December 31, 2009 and 2008 were $110,000 and $130,000, respectively, and serve as collateral to letters of credit issued as security deposits in connection with facility lease agreements. The letters of credit expire in May and November 2010.
Short-term investments
At December 31, 2009 and 2008, short-term investments were classified as available-for-sale securities, except for restricted cash, and were reported at fair value as follows:
| December 31, 2009 | December 31, 2008 | |||||||||||||||||||||||||
| Gross Amortized Cost |
Gross Unrealized Gains |
Gross Unrealized Losses |
Estimated Fair Value |
Gross Amortized Cost |
Gross Unrealized Gains |
Gross Unrealized Losses |
Estimated Fair Value | |||||||||||||||||||
| (In thousands) | (In thousands) | |||||||||||||||||||||||||
| Money market securities |
$ | 18,776 | $ | — | $ | — | $ | 18,776 | $ | 21,252 | $ | 15 | $ | — | $ | 21,267 | ||||||||||
| Asset backed |
2,100 | — | (141 | ) | 1,959 | 8,779 | — | (396 | ) | 8,383 | ||||||||||||||||
| Mortgage backed |
2,387 | 33 | — | 2,420 | 6,960 | 104 | — | 7,064 | ||||||||||||||||||
| Corporate obligations |
5,580 | — | (19 | ) | 5,561 | 6,802 | 14 | (10 | ) | 6,806 | ||||||||||||||||
| US Government and agency obligations |
9,487 | — | (26 | ) | 9,461 | 2,609 | 27 | — | 2,636 | |||||||||||||||||
| Total |
$ | 38,330 | $ | 33 | $ | (186 | ) | $ | 38,177 | $ | 46,402 | $ | 160 | $ | (406 | ) | $ | 46,156 | ||||||||
63
Table of Contents
| December 31, 2009 |
December 31, 2008 | |||||
| (In thousands) | (In thousands) | |||||
| Recorded as: |
||||||
| Cash equivalents |
$ | 17,780 | $ | 15,267 | ||
| Short-term investments |
20,397 | 30,889 | ||||
| Total |
$ | 38,177 | $ | 46,156 | ||
At December 31, 2009 and 2008, the fair value of the Company’s investments that had been in an unrealized loss position for over twelve months was $1.9 million and $1.6 million and the related unrealized loss was approximately $141,000 and $363,000, respectively. The Company evaluates its investments periodically for possible other-than-temporary impairment and records impairment charges equal to the amount that the carrying value of its available-for-sale securities exceeds the estimated fair market value of the securities as of the evaluation date, if appropriate. The Company considers various factors such as the length of time and extent to which fair value has been below cost basis, the financial condition of the issuer and the Company’s ability and intent to hold the investment for a period of time which may be sufficient for anticipated recovery in market value. The evaluation of asset-backed securities involves many factors including, but not limited to, lien position, loan to value ratios, fixed vs. variable rate, amount of collateralization, delinquency rates, credit support, and servicer and originator quality. Based on its evaluation, the Company has determined that the unrealized loss is temporary and, accordingly, no impairment charge on investments has been recorded in the years ended December 31, 2009 and 2008. The factors evaluated in this determination may change and an impairment charge may be recorded in the future.
The estimated fair value of short-term investments classified by date of contractual maturity at December 31, 2009 was as follows:
| December 31, 2009 | |||
| (In thousands) | |||
| Due within one year or less |
$ | 19,473 | |
| Due after one year through two years |
14,424 | ||
| Due after two years through four years |
4,280 | ||
| Total |
$ | 38,177 | |
Fair value measurements
The Company follows the accounting standards establishing a fair value hierarchy to prioritize the inputs used in valuation techniques. There are three broad levels to the fair value hierarchy of inputs to fair value. Level 1 is the highest priority and Level 3 is the lowest priority and are as follows:
| • | Level 1: Observable inputs that reflect quoted prices (unadjusted) for identical assets or liabilities in active markets; |
| • | Level 2: Inputs reflect quoted prices for identical assets or liabilities in markets that are not active; quoted prices for similar assets or liabilities in active markets; inputs other than quoted prices that are observable for the asset or the liability, or inputs that are derived principally from or corroborated by observable market data by correlation or other means; |
| • | Level 3: Unobservable inputs reflecting the Company’s own assumptions incorporated in valuation techniques used to determine fair value. These assumptions are required to be consistent with market participant assumptions that are reasonably available. |
The Company measures and reports certain financial assets at fair value on a recurring basis, including its investments in money market funds and available-for-sale securities. At December 31, 2009 and 2008, there were no liabilities within the scope of the accounting standards.
64
Table of Contents
At December 31, 2009 and 2008, our available-for-sale short-term investments, measured at fair value on a recurring basis, by level within the fair value hierarchy were as follows:
| December 31, 2009 | December 31, 2008 | |||||||||||||||||||||||
| Level 1 | Level 2 | Level 3 | Total | Level 1 | Level 2 | Level 3 | Total | |||||||||||||||||
| (In thousands) | (In thousands) | |||||||||||||||||||||||
| Money market securities |
$ | 18,776 | $ | — | $ | — | $ | 18,776 | $ | 21,267 | $ | — | $ | — | $ | 21,267 | ||||||||
| Asset backed |
— | 1,959 | — | 1,959 | — | 8,383 | — | 8,383 | ||||||||||||||||
| Mortgage backed |
— | 2,420 | — | 2,420 | — | 7,064 | — | 7,064 | ||||||||||||||||
| Corporate obligations |
— | 5,561 | — | 5,561 | — | 6,806 | — | 6,806 | ||||||||||||||||
| US Government and agency obligations |
— | 9,461 | — | 9,461 | — | 2,636 | — | 2,636 | ||||||||||||||||
| Total |
$ | 18,776 | $ | 19,401 | $ | — | $ | 38,177 | $ | 21,267 | $ | 24,889 | $ | — | $ | 46,156 | ||||||||
The fair value of the Company’s investments in money market funds, included within money market securities, approximates their face value and has been included in cash and cash equivalents.
Prepaid expenses and other current assets
Prepaid expenses and other current assets consisted of the following:
| December 31, | ||||||
| 2009 | 2008 | |||||
| (In thousands) | ||||||
| Prepaid expenses |
$ | 2,351 | $ | 2,573 | ||
| Interest receivable |
216 | 158 | ||||
| Other assets |
159 | 711 | ||||
| Prepaid expenses and other current assets |
$ | 2,726 | $ | 3,442 | ||
Property and equipment, net
Property and equipment, net consisted of the following:
| December 31, | ||||||||
| 2009 | 2008 | |||||||
| (In thousands) | ||||||||
| Computer hardware and software |
$ | 8,861 | $ | 9,426 | ||||
| Furniture, fixtures and equipment |
2,240 | 2,225 | ||||||
| Leasehold improvements |
1,592 | 1,591 | ||||||
| 12,693 | 13,242 | |||||||
| Less: accumulated depreciation and amortization |
(9,303 | ) | (8,726 | ) | ||||
| Property and equipment, net |
$ | 3,390 | $ | 4,516 | ||||
Depreciation and amortization expense, for the years ended December 31, 2009, 2008 and 2007 was approximately $2,557,000, $2,786,000 and $2,828,000, respectively.
Included in property and equipment at December 31, 2009 and 2008 is approximately $5,048,000 and $4,881,000, respectively, of fully depreciated property and equipment still in use.
65
Table of Contents
Accrued expenses and other current liabilities
Accrued expenses and other current liabilities consisted of the following:
| December 31, | ||||||
| 2009 | 2008 | |||||
| (In thousands) | ||||||
| Accrued vacation |
$ | 1,558 | $ | 1,339 | ||
| Accrued agent commissions |
2,084 | 1,980 | ||||
| Accrued bonuses |
1,374 | 246 | ||||
| Accrued marketing expenses |
1,444 | 886 | ||||
| Other accrued expenses |
2,355 | 2,255 | ||||
| Accrued expenses and other current liabilities |
$ | 8,815 | $ | 6,706 | ||
Accumulated other comprehensive income (loss)
Accumulated other comprehensive income (loss) consisted of the following:
| December 31, | ||||||||
| 2009 | 2008 | |||||||
| (In thousands) | ||||||||
| Other comprehensive income (loss): |
||||||||
| Unrealized gain (loss) on available-for-sale securities, net of tax |
$ | (153 | ) | $ | (246 | ) | ||
| Accumulated other comprehensive income (loss) |
$ | (153 | ) | $ | (246 | ) | ||
3. NET INCOME (LOSS) PER SHARE
The following table sets forth the computation of basic and dilutive net income (loss) per share for the periods indicated:
| Year Ended December 31, | ||||||||||||
| 2009 | 2008 | 2007 | ||||||||||
| (In thousands, except per share amounts) | ||||||||||||
| Numerator: |
||||||||||||
| Net loss |
$ | (12,892 | ) | $ | (13,342 | ) | $ | (14,884 | ) | |||
| Denominator: |
||||||||||||
| Shares used to compute EPS basic and diluted: |
20,242 | 20,917 | 22,586 | |||||||||
| Net loss per share basic and diluted: |
$ | (0.64 | ) | $ | (0.64 | ) | $ | (0.66 | ) | |||
The following weighted-average outstanding options, warrants and non-vested common shares were excluded in the computation of diluted net loss per share for the periods presented because including them would be anti-dilutive:
| Year Ended December 31, | ||||||
| 2009 | 2008 | 2007 | ||||
| (In thousands) | ||||||
| Options to purchase common stock |
4,823 | 4,715 | 4,432 | |||
| Warrants to purchase common stock |
3 | 62 | 2,312 | |||
| Nonvested common stock |
251 | 180 | 65 | |||
| 5,077 | 4,957 | 6,809 | ||||
66
Table of Contents
4. INCOME TAXES
The components of the provision for income taxes are as follows:
| December 31, | ||||||||||
| 2009 | 2008 | 2007 | ||||||||
| (In thousands) | ||||||||||
| Current: |
||||||||||
| Federal |
$ | (171 | ) | $ | — | $ | — | |||
| State |
— | — | — | |||||||
| (171 | ) | — | — | |||||||
| Deferred: |
||||||||||
| Federal |
— | — | — | |||||||
| State |
— | — | — | |||||||
| — | — | — | ||||||||
| Total provision for (benefit from) income taxes |
$ | (171 | ) | $ | — | $ | — | |||
The Company’s income tax benefit in 2009 is principally related to the carryback of net operating losses (“NOL”). Recently enacted federal legislation provides an election by which a corporation can elect to extend the carryback period from two years up to five years for NOLs incurred in the tax years beginning or ending 2008 and 2009. The enacted legislation further eliminates the general restriction on alternative minimum tax NOLs in the carryback years. The Company intends to make the election and apply for refund of U.S. alternative minimum tax remitted in 2004 and 2005, resulting in $171 thousand of income tax benefit recognized in 2009. There is no provision (benefit) for federal or state income taxes for the tax years ended December 31, 2008 and 2007 because the Company incurred operating losses for those years and has established a valuation allowance equal to the net deferred tax asset.
The difference between the Company’s effective income tax rate and federal statutory rate consisted of the following:
| Year Ended December 31, | |||||||||
| 2009 | 2008 | 2007 | |||||||
| Statutory federal tax rate |
34.00 | % | 34.00 | % | 34.00 | % | |||
| State tax rate, net of federal benefit |
0.00 | % | 0.00 | % | 0.00 | % | |||
| Federal NOL carryback |
1.31 | % | 0.00 | % | 0.00 | % | |||
| Stock options |
(3.92 | )% | (4.70 | )% | (3.52 | )% | |||
| Change in valuation allowance |
(30.02 | )% | (29.60 | )% | (26.80 | )% | |||
| Other, net |
(0.06 | )% | 0.30 | % | (3.68 | )% | |||
| 1.31 | % | 0.00 | % | 0.00 | % | ||||
Deferred tax assets consist of the following at:
| December 31, | ||||||||
| 2009 | 2008 | |||||||
| (In thousands) | ||||||||
| Deferred tax assets |
||||||||
| Net operating loss carryforwards |
$ | 27,676 | $ | 24,067 | ||||
| Allowances and accruals |
4,391 | 3,972 | ||||||
| Credits |
24 | 194 | ||||||
| Total gross deferred tax assets |
32,091 | 28,233 | ||||||
| Less: valuation allowance |
(32,091 | ) | (28,233 | ) | ||||
| Net deferred tax assets |
$ | — | $ | — | ||||
67
Table of Contents
The Company maintains that a full valuation allowance should be accounted for against its net deferred tax assets at December 31, 2009 and 2008. The Company supports the need for a valuation allowance against the deferred tax assets due to negative evidence including recent historical results and management’s expectations for the future.
At December 31, 2009, the Company had approximately $77.6 million of federal and $72.2 million of state net operating loss carryforwards available to reduce future taxable income, which will begin to expire in 2019 for federal and 2011 for state tax purposes, respectively.
Approximately $5.1 million and $4.8 million of net operating loss carryforwards for federal and state income tax purposes, respectively, are attributable to employee stock option deductions, the benefit from which will be allocated to paid-in-capital rather than current income when subsequently recognized.
Federal and state tax laws impose substantial restrictions on the utilization of net operating loss and credit carryforwards in the event of an “ownership change” for tax purposes, as defined in Section 382 of the Internal Revenue Code. If an ownership change has occurred, utilization of the net operating loss carryforwards could be reduced significantly.
The Company does not have any material accrued interest or penalties associated with any unrecognized tax benefits. The Company will account for any interest related to uncertain tax positions as interest expense, and for penalties as tax expense. The Company does not believe it is reasonably possible that its unrecognized tax benefits will significantly change within the next twelve months. There were no material changes in the amount of unrecognized tax benefits as of December 31, 2009. The Company is subject to taxation the United States and various state jurisdictions. The tax years 2004-2009 remain open to examination by the federal and most state tax authorities.
5. COMMITMENTS, CONTINGENCIES AND SUBSEQUENT EVENT
Leases
The Company leases office space and equipment under non-cancelable operating leases with various expiration dates through June 2016.
Future minimum lease payments under non-cancelable operating leases are as follows at December 31, 2009:
| Operating Leases | |||
| (In thousands) | |||
| Year ending December 31, |
|||
| 2010 |
$ | 2,538 | |
| 2011 |
2,401 | ||
| 2012 |
1,283 | ||
| 2013 |
538 | ||
| 2014 |
235 | ||
| Thereafter |
84 | ||
| Total minimum lease payments |
$ | 7,079 | |
Rent expense for the years ended December 31, 2009, 2008 and 2007 was approximately $2,986,000, $2,880,000 and $2,359,000 respectively.
Legal Proceedings and Subsequent Event
On January 22, 2010, the Company was named in a class action lawsuit filed in the Superior Court of California, County of Alameda, Elizabeth Williams v. ZipRealty, Inc., et al., by a former employee agent of the Company. The complaint seeks monetary relief and alleges, among other things, that the Company’s practice of
68
Table of Contents
classifying agents as exempt employees pursuant to the “outside salesperson” exemption under California law, and compensating agents accordingly, violates applicable law regarding the payment of minimum wages and overtime. The Company filed a counter claim against Plaintiff Elizabeth Williams alleging, among other things, that Ms. Williams engaged in conduct violating her employment agreement with ZipRealty. While the Company is in the initial stages of investigating the specific allegations in this complaint, it strongly disputes these claims and intends to vigorously oppose this lawsuit. No estimate of possible loss, if any, can be made at this time.
On May 4, 2007, the Company was named in a class action lawsuit filed in United States District Court for the Central District of California, Lubocki, et al v. ZipRealty, by four former employee agents of the Company on behalf of themselves and others similarly situated. The complaint alleged, among other things, that the Company’s policies for expense allowances and expense reimbursement in place prior to October 2005, and its policy for commission payments to agents for transactions that do not close during the period of employment, violate applicable law. The Company reached a settlement agreement which called for a payment of $3.55 million and, as a result, recorded a charge in that amount during the quarter ended September 30, 2007. The settlement agreement included a full release from any further liability on the matters raised in the complaint. The settlement agreement received court approval on March 10, 2008. The Company made the payment under settlement agreement in March 2008.
On May 18, 2007, the Company was named in a class action lawsuit filed in the Superior Court of California, County of Alameda, Crystal Alexander, et al. v. ZipRealty, by a former employee agent of the Company. The complaint sought monetary relief and alleged, among other things, that the Company’s practices for compensating agents and reimbursing expenses violate applicable law regarding the payment of minimum wages and overtime. In March 2008 the Company reached a settlement agreement which called for a payment of $600,000, plus applicable payroll taxes, and included a full release of all claims for unpaid wages through December 31, 2007 for the period covering the first two weeks of employment, during which time the California ZipAgents received on-boarding training. The settlement agreement received final court approval. The Company recorded a charge in the amount of $625,000 during the quarter ended March 31, 2008 and made the settlement payment in September 2008.
On March 29, 2006, the Company filed a claim for malpractice against a law firm that provided counseling in connection with certain employment matters, including wage and expense issues, in California Superior Court, County of San Francisco, ZipRealty Inc., v. Squire, Sanders & Dempsey, LLP, Michael W. Kelly Esq., et. al. The Company reached a settlement in this matter in October 2008, in exchange for payment of $3.20 million. The settlement agreement included a full release from any further liability on matters raised in the complaint. The Company recorded the recovery of this amount, net of legal fees of approximately $1.22 million, and received the payment during the quarter ended December 31, 2008.
The Company is not currently subject to any other material legal proceedings. From time to time the Company has been, and it currently is, a party to litigation and subject to claims incident to the ordinary course of the business. The amounts in dispute in these matters are not material to the Company, and management believes that the resolution of these proceedings will not have a material adverse effect on the business, financial position, results of operations or cash flows.
Indemnifications
The Company has entered into various indemnification agreements in the ordinary course of our business. Pursuant to these agreements, the Company has agreed to indemnify, hold harmless and reimburse the indemnified parties, which include certain of our service providers as well as others, in connection with certain occurrences. In addition, the corporate charter documents require the Company to provide indemnification rights to the Company’s directors and officers to the fullest extent permitted by the Delaware General Corporation Law, and permit the Company to provide indemnification rights to our other employees and agents, for certain events that occur while these persons are serving in these capacities. The Company’s charter documents also protect
69
Table of Contents
each of its directors, to the fullest extent permitted by Delaware law, from personal liability to the Company and its stockholders from monetary damages for a breach of fiduciary duty as a director. The Company has also entered into indemnification agreements with the Company’s directors and each of our officers with a title of Vice President or higher. Further, the underwriting agreement for the Company’s initial public offering requires the Company to indemnify the underwriters and certain of their affiliates and agents for certain liabilities arising from the offering and the related registration statement.
The maximum potential amount of future payments the Company could be required to make under these indemnification agreements is unspecified. The Company is not aware of any material indemnification liabilities for actions, events or occurrences that have occurred to date. The Company maintains insurance on some of the liabilities the Company has agreed to indemnify, including liabilities incurred by the Company’s directors and officers while acting in these capacities, subject to certain exclusions and limitations of coverage.
6. STOCKHOLDERS’ EQUITY
Preferred Stock
The Company’s Certificate of Incorporation authorizes 5,000,000 shares of preferred stock, $0.001 par value. At December 31, 2009 and 2008, there were no shares issued or outstanding.
Common Stock
The Company’s Certificate of Incorporation authorizes 100,000,000 shares of common stock, $0.001 par value. At December 31, 2009 and 2008, there were 23,929,728 and 23,709,380 shares issued and 20,444,854 and 20,272,915 shares outstanding, respectively.
Treasury Stock
On April 2, 2008, the Company’s Board of Directors (“BOD”) authorized the repurchase of approximately 3.5 million shares of its common stock directly from an investor, Pyramid Technology Ventures I, L.P. The shares were purchased in a privately negotiated transaction for a purchase price of $5.00 per share for a total purchase price of approximately $17.4 million; the closing price of the Company’s common stock on the date of the repurchase was $5.14 per share. These shares represented approximately 15% of the Company’s common stock then outstanding and are recorded as part of treasury stock. Treasury stock is accounted for under the cost method.
On December 11, 2008, the BOD authorized the sale of 80,000 shares of the Company’s common stock held in treasury to the Company’s recently hired Chief Financial Officer. The shares were sold for a sales price of $2.56 per share, which was the closing price of the Company’s common stock on the date of sale.
During the years ended December 31, 2009 and 2008, the Company repurchased approximately 49,000, and 20,000 shares of its common stock for approximately $160,000 and $68,000, respectively, to cover tax withholding obligations. These shares were repurchased in connection with the net share settlement provision of its Restricted Stock Award Agreement upon the vesting of restricted stock during the periods.
Common Stock Warrants
During the year ended December 31, 2008, 154,931 common stock warrants were cash and net exercised. As of December 31, 2009, there was one warrant outstanding for the purchase of an aggregate of 3,284 shares of our common stock at an exercise price of $18.27 per share, expiring in 2010.
70
Table of Contents
7. STOCK-BASED COMPENSATION
Stock Option Plans
The Company maintains two Board of Directors (“BOD”) approved stock plans, the 1999 Stock Option Plan (“1999 Plan”) and the 2004 Equity Incentive Plan (“2004 Plan”), both of which are collectively referred to as the (“Stock Plans”). The Stock Plans provide for the granting of stock options to employees and consultants of the Company. Options granted under the Stock Plans may be either incentive stock options or nonstatutory stock options. Incentive stock options (“ISO”) may be granted only to Company employees (including officers and directors who are also employees). Nonstatutory stock options (“NSO”) may be granted to Company employees and consultants. Following the Company’s initial public offering, any shares that were reserved but not issued under the 1999 Plan were made available under the 2004 Plan, and any shares that would have otherwise returned to the 1999 Plan are made available for issuance under the 2004 Plan. The Company has authorized and reserved 4,362,000 shares of common stock for issuance under the Stock Plans. In addition, the number of shares reserved for issuance under the 2004 Plan is increased annually on the first day of the Company’s fiscal year beginning in 2006 equal to the least of (a) 1,666,666 shares, (b) 4% of the outstanding shares on such date, or (c) an amount determined by the BOD. Pursuant to this requirement, on January 1, 2009, 2008, 2007 and 2006, respectively, an additional 810,916 shares, 945,621 shares, 864,905 shares and 810,932 shares were added to the Stock Plans, reserved for issuance and subsequently registered for sale under Form S-8. The 2004 Equity Incentive Plan also allows for the issuance of restricted stock. The restricted stock awards have the voting rights of common stock and the shares underlying the restricted stock awards are considered issued and outstanding.
Options under the Stock Plans may be granted at prices no less than 85% of the estimated fair value of the shares on the date of grant as determined by the BOD, provided, however, that (i) the exercise price of an ISO and NSO shall not be less than 100% and 85% of the estimated fair value of the shares on the date of grant, respectively, and (ii) the exercise price of an ISO and NSO granted to a 10% stockholder shall not be less than 110% of the estimated fair value of the shares on the date of grant, respectively. Options generally vest 25% after the first year of service and ratably each month over the remaining 36 month period contingent upon employment with the Company on the date of vest. Options are generally granted for a term of ten years.
Other Stock Options
The BOD approved the registration of 325,000, 180,000 and 1,250,000 shares of common stock underlying options issued outside the Company’s Stock Plans in December 2008, September 2007 and September 2006, respectively. These nonstatutory stock options (“NSO”) were granted in connection with employment of executives with the Company and vest 25% after the first year of service and ratably each month over the remaining 36 month period contingent upon employment with the Company on the date of vest. These options were granted for a term of ten years. In June 2007, the BOD modified the September 2006 grant so that it vested immediately as to 312,500 shares and the remaining shares were forfeited. In December 2009, this option expired, unexercised.
Valuation Assumptions and Stock-based Compensation Expense
The Company estimates the fair value of stock options on the day of grant using the Black-Scholes option pricing model, which incorporates various assumptions including volatility, expected life and interest rates. The expected volatility is based on the historical volatility of the Company’s common stock and consideration of other relevant factors such as the volatility of guideline companies. The expected life of options granted during the years ended December 31, 2009, 2008 and 2007 was estimated by taking the average of the vesting term and the contractual term of the option as provided by accounting standards.
71
Table of Contents
The assumptions used and the resulting estimates of weighted average fair value per share of options granted were as follows:
| Year Ended December 31, | ||||||||||||
| 2009 | 2008 | 2007 | ||||||||||
| Expected volatility |
44-49 | % | 42-44 | % | 45-51 | % | ||||||
| Risk-free interest rate |
0.5-2.7 | % | 1.8-3.2 | % | 3.5-4.8 | % | ||||||
| Expected life (years) |
4.3-6.1 | 5.5-6.1 | 5.5-6.1 | |||||||||
| Expected dividend yield |
0 | % | 0 | % | 0 | % | ||||||
| Weighted-average fair value of options granted during the period |
$ | 1.45 | $ | 1.94 | $ | 3.74 | ||||||
Stock-based compensation expense was as follows:
| Year Ended December 31, | |||||||||
| 2009 | 2008 | 2007 | |||||||
| (In thousands) | |||||||||
| Cost of revenues |
$ | 341 | $ | 586 | $ | 565 | |||
| Product development |
537 | 218 | 157 | ||||||
| Sales and marketing |
1,023 | 1,112 | 731 | ||||||
| General and administrative |
1,998 | 1,996 | 2,298 | ||||||
| Total stock-based compensation expense |
3,899 | 3,912 | 3,751 | ||||||
| Tax effect on stock-based compensation expense |
— | — | — | ||||||
| Net effect on net income |
$ | 3,899 | $ | 3,912 | $ | 3,751 | |||
The accounting standards require forfeitures to be estimated at the time of grant and revised, if necessary in subsequent periods if actual forfeitures differ from those estimates. The Company estimated expected forfeitures based on various factors including employee class and historical experience. The amount of stock-based compensation expense has been reduced for estimated forfeitures. As of December 31, 2009, there was $5.0 million of unrecorded total stock-based compensation, after estimated forfeitures, related to unvested stock options. That cost is expected to be recognized over a weighted average remaining recognition period of 2.7 years. As of December 31, 2009, there was $0.6 million of unrecorded stock-based compensation related to unvested restricted stock. That cost is expected to be recognized over a weighted average remaining recognition period of 0.7 years.
Stock Option Activity
In July 2009, the Company completed a voluntary stock option exchange program. Under the terms of the program, eligible employees had the right to exchange stock options having an exercise price equal to or greater than $4.59 per share for new nonqualified stock options. Eligible employees received a new option for each tendered eligible option, depending on the exercise price, in accordance with the exchange ratios as follows:
| Exercise Price |
Exchange Ratio | |
| $4.59—$7.99 |
Two new options issued in exchange for three eligible options | |
| $8.00 or greater |
One new option issued in exchange for two eligible options |
Eligible options for 2,898,269 shares of the Company’s common stock were validly tendered and exchanged. The Company issued new options to purchase 1,792,031 shares of the Company’s common stock at an exercise price per share of $3.20. The new options vest ratably each month over a 36 month period contingent upon continued employment with the Company on the date of vest. Incremental compensation cost for the new options of $0.6 million plus the remaining unrecognized compensation cost of $3.1 million from the original options will be recognized in compensation expense ratably over the vesting period. The new options have a contractual term of seven years.
72
Table of Contents
A summary of the Company’s stock option activity for the periods indicated was as follows:
| Number of Shares |
Weighted Average Exercise Price |
Weighted Average Remaining Contractual Life (Years) |
Aggregate Intrinsic Value | ||||||||
| (In thousands) | (In thousands) | ||||||||||
| Outstanding at December 31, 2006 |
4,235 | $ | 7.71 | 8.50 | $ | 5,885 | |||||
| Options granted |
2,052 | 7.12 | |||||||||
| Options exercised |
(173 | ) | 1.18 | ||||||||
| Options forfeited/cancelled/expired |
(1,796 | ) | 7.79 | ||||||||
| Outstanding at December 31, 2007 |
4,318 | 7.66 | 8.19 | 1,901 | |||||||
| Options granted |
1,246 | 4.24 | |||||||||
| Options exercised |
(12 | ) | 1.66 | ||||||||
| Options forfeited/cancelled/expired |
(338 | ) | 8.79 | ||||||||
| Outstanding at December 31, 2008 |
5,214 | 6.78 | 7.30 | 630 | |||||||
| Options granted (1) |
2,387 | 3.36 | |||||||||
| Options exercised |
(17 | ) | 1.20 | ||||||||
| Options forfeited/cancelled/expired (2) |
(3,389 | ) | 7.84 | ||||||||
| Outstanding at December 31, 2009 |
4,195 | $ | 4.00 | 6.97 | $ | 2,495 | |||||
| Vested and expected to vest at December 31, 2009 |
3,985 | $ | 4.02 | 6.87 | $ | 2,407 | |||||
| Exercisable at December 31, 2009 |
1,471 | $ | 4.80 | 5.66 | $ | 1,237 | |||||
| (1) | Includes options for 1,792,031 shares exchanged in the stock option exchange program. |
| (2) | Includes options for 2,898,269 shares exchanged in the stock option exchange program. |
Aggregate intrinsic value represents the difference between the Company’s closing stock price on the last trading day of the fiscal period, which was $3.76 on December 31, 2009, and the exercise price for the options that were in-the-money at December 31, 2009. The total number of in-the-money options exercisable as of December 31, 2009 was 715,000. Total intrinsic value of options exercised was $39,000, $37,000 and $858,000 for the years ended December 31, 2009, 2008 and 2007, respectively.
The Company settles employee stock option exercises with newly issued common shares.
Restricted Stock
The Company expenses the cost of restricted stock awards, which is determined to be the fair market value of the shares at the date of grant, ratably over the period during which the restriction lapse. Stock-based compensation expense related to restricted stock for the years ended December 31, 2009, 2008 and 2007 was $958,000, $377,000 and $216,000, respectively.
73
Table of Contents
A summary of the Company’s nonvested restricted stock for the period indicated was as follows:
| Number of Shares |
Weighted Average Grant Date Fair Value Per Share | |||||
| (In thousands) | ||||||
| Nonvested at December 31, 2006 |
— | |||||
| Shares granted |
225 | |||||
| Shares vested |
(28 | ) | ||||
| Shares forfeited |
— | |||||
| Nonvested at December 31, 2007 |
197 | $ | 6.68 | |||
| Shares granted |
25 | |||||
| Shares vested |
(56 | ) | ||||
| Shares forfeited |
— | |||||
| Nonvested at December 31, 2008 |
166 | $ | 6.06 | |||
| Shares granted |
204 | |||||
| Shares vested |
(145 | ) | ||||
| Shares forfeited |
— | |||||
| Nonvested at December 31, 2009 |
225 | $ | 4.29 | |||
8. EMPLOYEE BENEFIT PLAN
The Company has a 401(k) profit sharing plan covering all eligible employees. Employees may contribute amounts ranging from 1% to 50% of their annual salary, up to the maximum statutory amount. The Company is not required to contribute to the plan, however, beginning January 1, 2006 the Company elected to match 25% of the first employee contributions to the plan of up to 4% of pay. For the years ended December 31, 2009, 2008 and 2007 the Company contributed $257,000, $213,000, and $245,000, respectively.
9. UNAUDITED QUARTERLY FINANCIAL DATA
The following table sets forth our selected unaudited quarterly operating information for each of the eight quarters ended December 31, 2009 This information has been prepared on the same basis as the audited financial statements contained in this report and includes all normal recurring adjustments necessary for the fair statement of the information for the periods presented, when read together with our financial statements and related notes. Our future operating results are difficult to predict and may vary significantly. Results for any fiscal quarter are not necessarily indicative of results for the full year or for any future quarter.
| Fourth Quarter |
Third Quarter |
Second Quarter |
First Quarter |
|||||||||||||
| Year Ended December 31, 2009 |
(In thousands) | |||||||||||||||
| Net transaction revenues |
$ | 33,037 | $ | 34,647 | $ | 31,702 | $ | 21,352 | ||||||||
| Cost of revenues |
19,181 | 20,273 | 18,909 | 13,834 | ||||||||||||
| Loss from operations |
(2,388 | ) | (903 | ) | (2,634 | ) | (7,857 | ) | ||||||||
| Net loss |
(2,132 | ) | (779 | ) | (2,433 | ) | (7,548 | ) | ||||||||
| Net loss per share: |
||||||||||||||||
| Basic and diluted |
$ | (0.11 | ) | $ | (0.04 | ) | $ | (0.12 | ) | $ | (0.38 | ) | ||||
| Weighted average common shares outstanding: |
||||||||||||||||
| Basic and diluted |
20,226 | 20,206 | 20,140 | 20,107 | ||||||||||||
74
Table of Contents
| Fourth Quarter |
Third Quarter |
Second Quarter |
First Quarter |
|||||||||||||
| Year Ended December 31, 2008 |
(In thousands) | |||||||||||||||
| Net transaction revenues |
$ | 24,667 | $ | 30,769 | $ | 29,870 | $ | 20,121 | ||||||||
| Cost of revenues |
15,293 | 17,911 | 17,156 | 12,342 | ||||||||||||
| Loss from operations |
(3,175 | ) | (2,241 | ) | (2,320 | ) | (8,199 | ) | ||||||||
| Net loss |
(2,718 | ) | (1,694 | ) | (1,669 | ) | (7,261 | ) | ||||||||
| Net loss per share: |
||||||||||||||||
| Basic and diluted |
$ | (0.14 | ) | $ | (0.08 | ) | $ | (0.08 | ) | $ | (0.31 | ) | ||||
| Weighted average common shares outstanding: |
||||||||||||||||
| Basic and diluted |
20,049 | 20,007 | 20,074 | 23,450 | ||||||||||||
| Item 9. | Changes in and Disagreements with Accountants on Accounting and Financial Disclosure: |
Not applicable.
| Item 9A. | Controls and Procedures: |
Evaluation of Disclosure Controls and Procedures
Our management, with the participation of our Chief Executive Officer and our Chief Financial Officer, has evaluated the effectiveness of our disclosure controls and procedures (as such items are defined in Rule 13a-15(e) and 15d-15(e) under the Securities Exchange Act of 1934, as amended (Exchange Act)) as of the end of the period covered by this Annual Report on Form 10-K. Based on this evaluation, our Chief Executive Officer and our Chief Financial Officer have concluded that our disclosure controls and procedures as of the end of the period covered by this Annual Report are effective to ensure that information we are required to disclose in reports that we file or submit under the Exchange Act is accumulated and communicated to our management, including our Chief Executive Officer and Chief Financial Officer, as appropriate to allow timely decisions regarding required disclosure, and that such information is recorded, processed, summarized and reported within the time periods specified in Securities and Exchange Commission rules and forms.
Management’s Report on Internal Control Over Financial Reporting
Our management is responsible for establishing and maintaining adequate internal control over financial reporting (as defined in Rule 13a-15(f) under the Exchange Act). Our management, including our Chief Executive Officer and Chief Financial Officer, conducted an evaluation of the effectiveness of our internal control over financial reporting as of December 31, 2009. In making its evaluation, management used the criteria set forth by the Committee of Sponsoring Organizations of the Treadway Commission (COSO) in Internal Control — Integrated Framework.
Based on our evaluation, under the criteria set forth by COSO in Internal Control — Integrated Framework, our management concluded that our internal control over financial reporting was effective as of December 31, 2009. PricewaterhouseCoopers LLP, an independent registered public accounting firm, has issued an attestation report on our management’s assessment of the effectiveness of our internal control over financial reporting as of December 31, 2009, as stated in their report which is included herein.
Our management, including our Chief Executive Officer and Chief Financial Officer, acknowledge that because of its inherent limitations, internal control over financial reporting may not prevent or detect misstatements. Also, projections of any evaluation of effectiveness to future periods are subject to the risk that controls may become inadequate because of changes in conditions, or that the degree of compliance with the policies or procedures may deteriorate.
75
Table of Contents
Changes in Internal Control Over Financial Reporting
There were no changes in our internal control over financial reporting during the quarter ended December 31, 2009 that have materially affected, or are reasonably likely to materially affect our internal control over financial reporting.
| Item 9B. | Other Information: |
On March 4, 2010, the Compensation Committee of our Board of Directors approved the following compensation arrangements for our named executive officers:
| • | J. Patrick Lashinsky, Chief Executive Officer and President, a stock option grant for 125,000 shares; |
| • | Mr. Charles C Baker, Executive Vice President and Chief Financial Officer, an increase in annual base salary to $312,000, a restricted stock grant for 12,500 shares, and a stock option grant for 65,000 shares; |
| • | Mr. William C. Sinclair, Executive Vice President, Operations and Business Development, an increase in annual base salary to $240,040, a restricted stock grant for 4,000 shares, and a stock option grant for 17,500 shares; |
| • | Mr. David A. Rector, Senior Vice President and Chief Accounting Officer, a restricted stock grant for 4,000 shares, and a stock option grant for 20,000 shares; and |
| • | Mr. Robert J. Yakominich, Senior Vice President, Sales, an increase in annual base salary to $236,750 a restricted stock grant for 5,000 shares, and a stock option grant for 25,000 shares. |
All of the above base salary increases are effective April 1, 2010. All equity awards were made under our 2004 Equity Incentive Plan. For each restricted stock grant noted above, we entered into a Restricted Stock Award Agreement, the form of which is filed as an exhibit to this report, which provides that one-half of the subject shares will vest on April 1, 2011, and the remainder will vest on April 1, 2012, in each case as long as the executive remains employed by or in a service relationship with us on such dates, and subject to any other vesting rights under separate change-of-control agreements between us and such executive. For each stock option grant noted above, the grant vests monthly over a four-year period, with an initial one-year “cliff” vesting of 25% of the award on the first anniversary of the grant date. The exercise price for each of the stock option grants is $4.90 per share, which equals the closing price of our common stock on The NASDAQ Stock Market on the date of grant.
Also on March 4, 2010, the Compensation Committee approved an amendment to our Management Incentive Plan — Fiscal Year 2010. Pursuant to the amendment, incentives that are earned, if any, under the plan are to be paid all in cash, rather than partially in restricted stock and partially in cash as the plan previously provided. Also pursuant to the amendment, total opportunity under the plan for the achievement of both the mid-year target hurdles and full-year target hurdles was increased for our Senior Vice President, Sales from 40% to 60% and for our Vice President, Marketing from 30% to 40%. Incentive payments under the plan are subject to other terms and conditions, as set forth more fully in the copy of the plan, as so amended, that is filed as an exhibit to this report.
76
Table of Contents
PART III
| Item 10. | Directors, Executive Officers and Corporate Governance: |
Executive officers
The information required by this item with respect to executive officers is incorporated by reference to Item 1 of this report. That information can be found under the caption, “Executive Officers.”
Directors
The information required by this item with respect to directors is incorporated by reference to our Proxy Statement for our 2010 Annual Meeting of Stockholders under the caption, “Directors.”
Section 16(a) beneficial ownership reporting compliance
The information required by this item with respect to Section 16(a) beneficial ownership reporting compliance is incorporated by reference to our Proxy Statement for our 2010 Annual Meeting of Stockholders under the caption, “Section 16(a) Beneficial Ownership Reporting Compliance.”
Code of ethics
Our Board of Directors has adopted a Code of Business Conduct and Ethics that is applicable to all directors, officers and employees, including our Chief Executive Officer, Chief Financial Officer, Principal Accounting Officer and Controller. The Code is available on our website at www.ziprealty.com under “Investor Relations — Corporate Governance — Governance Documents.” We intend to disclose, as required, any amendment to or waiver from a provision of the Code with respect to our Chief Executive Officer, Chief Financial Officer, Principal Accounting Officer or Controller, including the name of the officer to whom any waiver is granted, on our website as set forth above.
Corporate governance
The information required by this item with respect to corporate governance is incorporated by reference to our Proxy Statement for our 2010 Annual Meeting of Stockholders under the caption, “Board Committees — Audit Committee.”
| Item 11. | Executive Compensation: |
The information required by this item with respect to executive compensation is incorporated by reference to our Proxy Statement for our 2010 Annual Meeting of Stockholders under the caption, “Compensation and Other Information Concerning Officers.”
| Item 12. | Security Ownership of Certain Beneficial Owners and Management and Related Stockholder Matters: |
The information required by this item with respect to security ownership of certain beneficial owners and management is incorporated by reference to our Proxy Statement for our 2010 Annual Meeting of Stockholders under the caption, “Security Ownership by our Directors, Officers and Principal Stockholders.”
Equity compensation plan information
The following table provides information as of December 31, 2009 about our common stock that may be issued upon the exercise of options, warrants and rights awarded under our stockholder-approved plans (our 1999 Stock Option Plan and 2004 Equity Incentive Plan). The following table also provides such information
77
Table of Contents
concerning four options awarded outside of our equity plans, pursuant to NASDAQ Marketplace Rule 4350(i)(1)(A)(iv), to new executives as an inducement material to acceptance of employment with us. The Former CEO Grant (made on September 6, 2006 for 1,250,000 shares), SVP Sales Grant (made on September 13, 2007 for 130,000 shares), Former General Counsel Grant (made on September 13, 2007 for 50,000 shares) and CFO Grant (made on December 11, 2008 for 325,000 shares) were each made at the respective exercise price set forth below, which was the closing price of our common stock on the respective grant date, and were structured to vest as to 25% on the first anniversary of the date of employment and thereafter at the rate of 1/48 per month on the first of each month, provided the respective executive remained in a service relationship with us. The Former CEO Grant and CFO Grant terminate twelve months after such executive ceases to be a service provider to us, while the SVP Sales Grant and Former General Counsel Grant terminate pursuant to the standard terms applicable to our other option grants. These four grants are subject to the standard terms applicable to the Company’s other option grants. In June 2007, in connection with Richard F. Sommer’s resignation as our CEO, the Former CEO Grant was amended to accelerate vesting so that the option became fully vested as to 312,500 shares. In December 2009, this option expired, unexercised.
| Number of Securities to be Issued Upon Exercise of Outstanding Options, Warrants and Rights |
Weighted-Average Exercise Price of Outstanding Options, Warrants and Rights |
Number of Securities Available for Issuance Under Equity Compensation Plans (Excluding Securities Reflected in the First Column) | |||||
| Plan Name and Type |
(In thousands) | (In thousands) | |||||
| Equity compensation plans approved by stockholders |
|||||||
| 1999 Stock Option Plan |
441 | $ | 2.24 | — | |||
| 2004 Equity Incentive Plan |
3,272 | $ | 4.25 | 1,780 | |||
| Equity compensation not approved by stockholders |
|||||||
| SVP Sales Grant |
130 | $ | 6.68 | — | |||
| Former General Counsel Grant |
27 | $ | 6.68 | — | |||
| CFO Grant |
325 | $ | 2.56 | — | |||
| Total |
4,195 | $ | 4.00 | 1,780 | |||
| Item 13. | Certain Relationships and Related Transactions and Director Independence: |
The information required by this item is incorporated by reference to our Proxy Statement for our 2010 Annual Meeting of Stockholders under the caption, “Significant Relationships and Transactions with Directors, Officers or Principal Stockholders,” and “Director Independence.”
| Item 14. | Principal Accountant Fees and Services: |
The information required by this item is incorporated by reference to our Proxy Statement for our 2010 Annual Meeting of Stockholders under the caption, “Proposal 2 — Appointment of Independent Registered Public Accounting Firm.”
78
Table of Contents
PART IV
| Item 15. | Exhibits and Financial Statement Schedule: |
(a) Documents filed with this report:
1. Financial Statements.
The following financial statements and related report of Independent Registered Public Accounting Firm are incorporated in Item 8 of this report:
| • | Report of independent registered public accounting firm |
| • | Consolidated Balance Sheets at December 31, 2009 and 2008 |
| • | Consolidated Statements of Operations for the years ended December 31, 2009, 2008 and 2007 |
| • | Consolidated Statements of Stockholders’ Equity for the years ended December 31, 2009, 2008 and 2007 |
| • | Consolidated Statements of Cash Flows for the years ended December 31, 2009, 2008 and 2007 |
| • | Notes Consolidated Financial Statements. |
2. Financial Statement Schedule
Schedule II — Valuation and Qualifying Accounts for the three fiscal years in the period ended December 31, 2009.
The following financial statement schedule of ZipRealty, Inc. for each of the past three years in the period ended December 31, 2009 should be read in conjunction with the Consolidated Financial Statements of ZipRealty, Inc.
Schedule II — Valuation and Qualifying Accounts
| Balance at Beginning of Year |
Charged to Costs and Expenses |
Deductions | Balance at End of Year | |||||
| Description |
(In thousands) | |||||||
| Fiscal year ended December 31, 2007 |
||||||||
| Provision for Doubtful Accounts |
30 | 11 | 12 | 29 | ||||
| Deferred Tax Asset Valuation |
18,379 | 4,382 | — | 22,761 | ||||
| Fiscal year ended December 31, 2008 |
||||||||
| Provision for Doubtful Accounts |
29 | 8 | 11 | 26 | ||||
| Deferred Tax Asset Valuation |
22,761 | 5,472 | — | 28,233 | ||||
| Fiscal year ended December 31, 2009 |
||||||||
| Provision for Doubtful Accounts |
26 | 3 | — | 29 | ||||
| Deferred Tax Asset Valuation |
28,233 | 3,858 | — | 32,091 | ||||
All other financial statement schedules have been omitted because they are not applicable or are not required, or because the required information is included in the Consolidated Financial Statements and Notes thereto which are included herein.
3. Exhibits.
The exhibits listed in the Exhibit Index are filed as a part of this report.
79
Table of Contents
Pursuant to the requirements of Section 13 or 15(d) of the Securities Exchange Act of 1934, the registrant has duly caused this report to be signed on its behalf by the undersigned, thereunto duly authorized.
| ZIPREALTY, INC. | ||
| By: | /S/ CHARLES C. BAKER | |
| Charles C. Baker | ||
| Executive Vice President and Chief Financial Officer | ||
Date: March 10, 2010
KNOW ALL PERSONS BY THESE PRESENTS, that each person whose signature appears below constitutes and appoints J. Patrick Lashinsky, Charles C. Baker and David A. Rector, and each of them, his or her true and lawful attorneys-in-fact, each with full power of substitution, for him or her in any and all capacities, to sign any amendments to this report on Form 10-K and to file the same, with exhibits thereto and other documents in connection therewith, with the Securities and Exchange Commission, hereby ratifying and confirming all that each of said attorneys-in-fact or their substitute or substitutes may do or cause to be done by virtue hereof.
Pursuant to the requirements of the Securities Exchange Act of 1934, this report has been signed below by the following persons on behalf of the registrant and in the capacities and on the dates indicated.
| Name |
Title |
Date | ||
| /S/ J. PATRICK LASHINSKY J. Patrick Lashinsky |
Chief Executive Officer, President and Director (Principal Executive Officer) |
March 10, 2010 | ||
| /S/ CHARLES C. BAKER Charles C. Baker |
Executive Vice President and Chief Financial Officer (Principal Financial Officer) |
March 10, 2010 | ||
| /S/ DAVID A. RECTOR David A. Rector |
Senior Vice President and Chief Accounting Officer (Controller and Principal Accounting Officer) |
March 10, 2010 | ||
| /S/ DONALD F. WOOD Donald F. Wood |
Chairman of the Board of Directors | March 10, 2010 | ||
| /S/ ELISABETH H. DEMARSE Elisabeth H. DeMarse |
Director | March 10, 2010 | ||
| /S/ ROBERT C. KAGLE Robert C. Kagle |
Director | March 10, 2010 | ||
| /S/ STANLEY M. KOONCE, JR. Stanley M. Koonce, Jr. |
Director | March 10, 2010 | ||
| /S/ GARY A. WETSEL Gary A. Wetsel |
Director | March 10, 2010 | ||
80
Table of Contents
Exhibit Index
| Exhibit Number |
Description | |
| 3.1(a)(1) | Certificate of Correction to Amended and Restated Certificate of Incorporation, filed with the Secretary of State of Delaware on December 12, 2008 | |
| 3.2(a)(2) | Bylaws | |
| 4.1(2) | Form of Common Stock Certificate | |
| 10.1(2)* | Form of Director and Executive Officer Indemnification Agreement | |
| 10.2(2)* | 1999 Stock Option Plan | |
| 10.3(2)* | 2004 Equity Incentive Plan | |
| 10.3(a)(3)* | Form of Stock Option Award Agreement under 2004 Equity Incentive Plan | |
| 10.4(2)* | Form of Change of Control Agreement | |
| 10.5(X) | Office Lease Agreement between the Registrant and EOP-Emeryville Properties, L.L.C. dated November 28, 2001 | |
| 10.5(a)(X) | First Amendment dated March 22, 2002 to Office Lease Agreement between the Registrant and EOP-Emeryville Properties, L.L.C. dated November 28, 2001 | |
| 10.5(b)(4) | Third Amendment dated November 30, 2005 to Office Lease Agreement between ZipRealty, Inc. and CA-Emeryville Properties Limited Partnership (as successor in interest to EOP-Emeryville Properties, L.L.C.) dated November 28, 2001 | |
| 10.6(6) | Director Compensation | |
| 10.7(7)* | Management Incentive Plan — Fiscal Year 2007 | |
| 10.8(8)* | Management Incentive Plan — Fiscal Year 2008 | |
| 10.9(9)* | Management Incentive Plan — Fiscal Year 2009 | |
| 10.10(10)* | Management Incentive Plan — Fiscal Year 2010, as amended March 4, 2010 | |
| 10.11(11)* | J. Patrick Lashinsky Employment Agreement dated January 30, 2007, effective January 17, 2007 | |
| 10.11(a)(12)* | J. Patrick Lashinsky Employment Agreement dated September 13, 2007, effective June 4, 2007 | |
| 10.12(13)* | J. Patrick Lashinsky Restricted Stock Award Agreement dated September 13, 2007 | |
| 10.13(14)* | J. Patrick Lashinsky Stock Option Award Agreement dated September 13, 2007 | |
| 10.14(15) | Securities Purchase Agreement between the Company and Pyramid Technology Ventures I, L.P., entered into as of April 2, 2008 | |
| 10.15(16)* | Charles C. Baker Employment Agreement, effective December 1, 2009 | |
| 10.16(17)* | Stock Option Award Agreement with Charles C. Baker, dated December 11, 2008 | |
| 10.17(18)* | Restricted Stock Award Agreement with Charles C. Baker, dated December 11, 2008 | |
| 10.18(19)* | Stock Purchase Agreement with Charles C. Baker, dated December 11, 2008 | |
| 10.19(20)* | Form of Restricted Stock Award Agreement, dated February 12, 2009 | |
| 10.20(21)* | Form of Restricted Stock Award Agreement, dated as of August 21, 2009 | |
| 10.21(22)* | Form of Restricted Stock Award Agreement, dated as of January 15, 2010 | |
81
Table of Contents
| Exhibit Number |
Description | |
| 10.22(10)* | Form of Restricted Stock Award Agreement, dated as of March 4, 2010 | |
| 23.1 | Consent of independent registered public accounting firm | |
| 24.1 | Power of Attorney (see signature page) | |
| 31.1 | Certification of Chief Executive Officer, as required by Rule 13a-14(a) or Rule 15d-14(a) of the Securities Exchange Act of 1934 | |
| 31.2 | Certification of Chief Financial Officer, as required by Rule 13a-14(a) or Rule 15d-14(a) of the Securities Exchange Act of 1934 | |
| 32.1 | Certification of Chief Executive Officer, as required by Section 1350 of Chapter 63 of Title 18 of the United States Code (18 U.S.C. 1350) | |
| 32.2 | Certification of Chief Financial Officer, as required by Section 1350 of Chapter 63 of Title 18 of the United States Code (18 U.S.C. 1350) | |
| (1) | Incorporated by reference to Exhibit 3.1 to the Registrant’s Current Report on Form 8-K (File No. 000-51002) filed with the Securities and Exchange Commission on December 16, 2008. |
| (2) | Incorporated by reference to the exhibit of the same number to the Registrant’s Registration Statement on Form S-1(File No. 333-115657) filed with the Securities and Exchange Commission on May 20, 2004, as amended. |
| (3) | Incorporated by reference to the exhibit of the same number to the Registrant’s Annual Report on Form 10-K (File No. 000-51002) for its fiscal year ended December 31, 2004, filed with the Securities and Exchange Commission on March 28, 2005. |
| (4) | Incorporated by reference to Exhibit 10.6 and 10.6(a), respectively, to the Registrant’s Registration Statement on Form S-1(File No. 333-115657) filed with the Securities and Exchange Commission on May 20, 2004, as amended. |
| (5) | Incorporated by reference to Exhibit 10.6(b) to the Registrant’s Current Report on Form 8-K (File No. 000-51002) filed with the Securities and Exchange Commission on December 6, 2005. |
| (6) | Incorporated by reference to Exhibit 10.1 to the Registrant’s Current Report on Form 8-K (File No. 111-51002) filed with the Securities and Exchange Commission on June 19, 2007. |
| (7) | Incorporated by reference to Exhibit 10.21 to the Registrant’s Current Report on Form 8-K (File No. 111-51002) filed with the Securities and Exchange Commission on April 2, 2007. |
| (8) | Incorporated by reference to Exhibit 10.13 to the Registrant’s Annual Report on Form 10-K (File No. 000-51002) filed with the Securities and Exchange Commission on March 17, 2008. |
| (9) | Incorporated by reference to Exhibit 10.1 to the Registrant’s Current Report on Form 8-K (File No. 000-51002) filed with the Securities and Exchange Commission on March 6, 2009. |
| (10) | Filed herewith. |
| (11) | Incorporated by reference to Exhibit 10.1 to the Registrant’s Current Report on Form 8-K (File No. 000-51002) filed with the Securities and Exchange Commission on February 8, 2007. |
| (12) | Incorporated by reference to Exhibit 10.20(a) to the Registrant’s Annual Report on Form 10-K (File No. 000-51002) filed with the Securities and Exchange Commission on March 17, 2008. |
| (13) | Incorporated by reference to Exhibit 10.2 to the Registrant’s Current Report on Form 8-K (File No. 000-51002) filed with the Securities and Exchange Commission on September 19, 2007. |
| (14) | Incorporated by reference to Exhibit 10.3 to the Registrant’s Current Report on Form 8-K (File No. 000-51002) filed with the Securities and Exchange Commission on September 19, 2007. |
82
Table of Contents
| (15) | Incorporated by reference to Exhibit 10.1 to the Registrant’s Current Report on Form 8-K (File No. 000-51002) filed with the Securities and Exchange Commission on April 8, 2008. |
| (16) | Incorporated by reference to Exhibit 10.18 to the Registrant’s Annual Report on Form 10-K (File No. 000-51002) filed with the Securities and Exchange Commission on March 17, 2009. |
| (17) | Incorporated by reference to Exhibit 10.1 to the Registrant’s Current Report on Form 8-K (File No. 000-51002) filed with the Securities and Exchange Commission on December 16, 2008. |
| (18) | Incorporated by reference to Exhibit 10.2 to the Registrant’s Current Report on Form 8-K (File No. 000-51002) filed with the Securities and Exchange Commission on December 16, 2008. |
| (19) | Incorporated by reference to Exhibit 10.3 to the Registrant’s Current Report on Form 8-K (File No. 000-51002) filed with the Securities and Exchange Commission on December 16, 2008. |
| (20) | Incorporated by reference to Exhibit 10.1 to the Registrant’s Current Report on Form 8-K (File No. 000-51002) filed with the Securities and Exchange Commission on February 17, 2009. |
| (21) | Incorporated by reference to Exhibit 10.1 to the Registrant’s Current Report on Form 8-K (File No. 000-51002) filed with the Securities and Exchange Commission on August 26, 2009. |
| (22) | Incorporated by reference to Exhibit 10.1 to the Registrant’s Current Report on Form 8-K (File No. 000-51002) filed with the Securities and Exchange Commission on January 22, 2010. |
| * | Identifies a management contract or compensatory plan of arrangement required to be filed as an exhibit to this report. |
83