Attached files
| file | filename |
|---|---|
| 8-K - CURRENT REPORT ON FORM 8K - PROASSURANCE CORP | bodyoffiling.htm |

March 8-10, 2010
W. Stancil Starnes Chairman and Chief Executive Officer
Edward L. Rand, Jr. Chief Financial Officer
Frank B. O’Neil Investor Relations Officer
Raymond James & Associates
Raymond James & Associates
31st Annual Institutional Investors Conference
31st Annual Institutional Investors Conference

2
Forward Looking Statements
This presentation contains Forward Looking Statements and other information designed
to convey our projections and expectations regarding future results. There are a number
of factors which could cause our actual results to vary materially from those projected in
this presentation. The principal risk factors that may cause these differences are
described in various documents we file with the Securities and Exchange Commission,
such as our current reports on Form 8-K, and our regular reports on Forms 10-Q and 10-
K, particularly in “Item 1A, Risk Factors.” Please review this presentation in
conjunction with a thorough reading and understanding of these risk factors.
This presentation contains Non-GAAP measures, and we may reference
Non-GAAP measures in our remarks. A reconciliation of these measures to GAAP
measures is available in our latest quarterly news release, which is available in the
Investor Relations section of our website, www.ProAssurance.com, and in
the related Current Reports on Form 8K disclosing that release.
Non-GAAP measures in our remarks. A reconciliation of these measures to GAAP
measures is available in our latest quarterly news release, which is available in the
Investor Relations section of our website, www.ProAssurance.com, and in
the related Current Reports on Form 8K disclosing that release.
Non-GAAP Measures

Year-to-Year Success Comes From
Taking a Long-Term View
Year-to-Year Success Comes From
Taking a Long-Term View
Edward L. Rand, Jr.
Chief Financial Officer
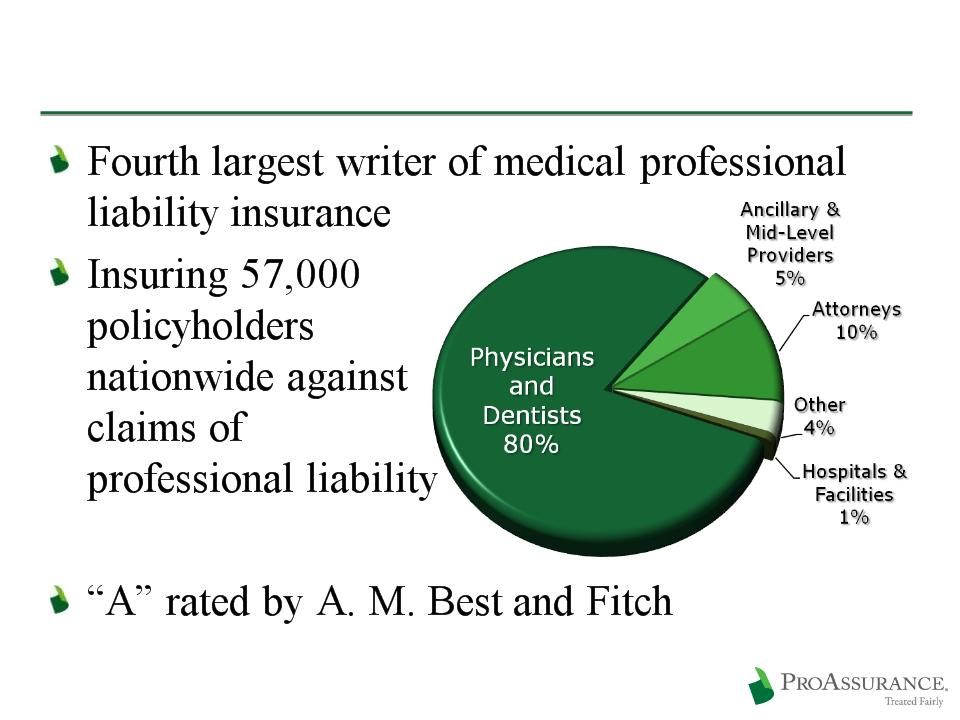
ProAssurance: Quick Facts
4

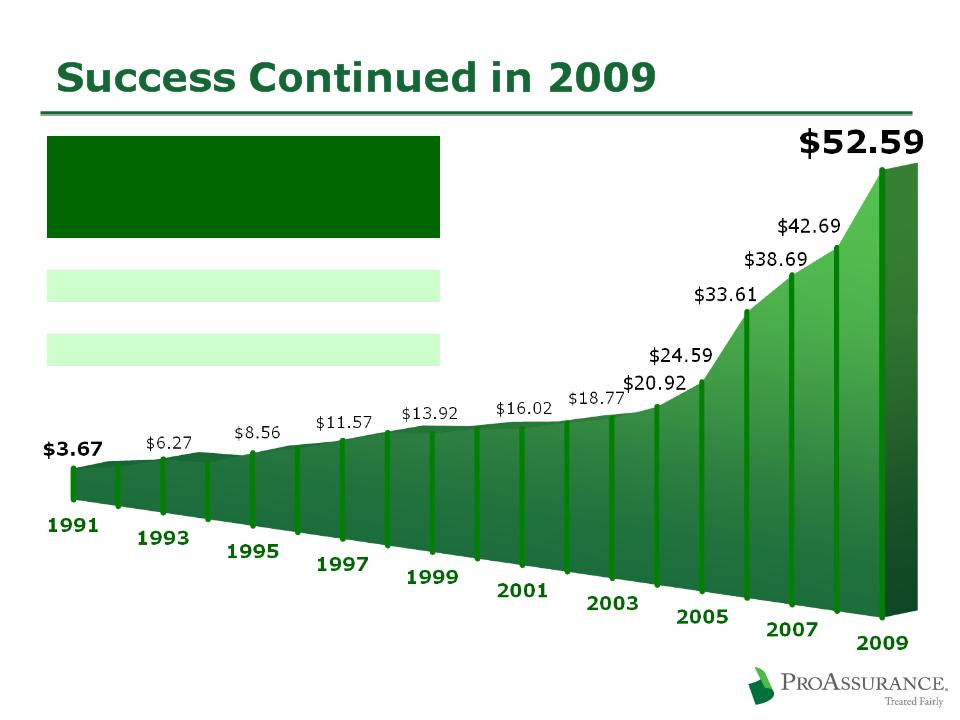
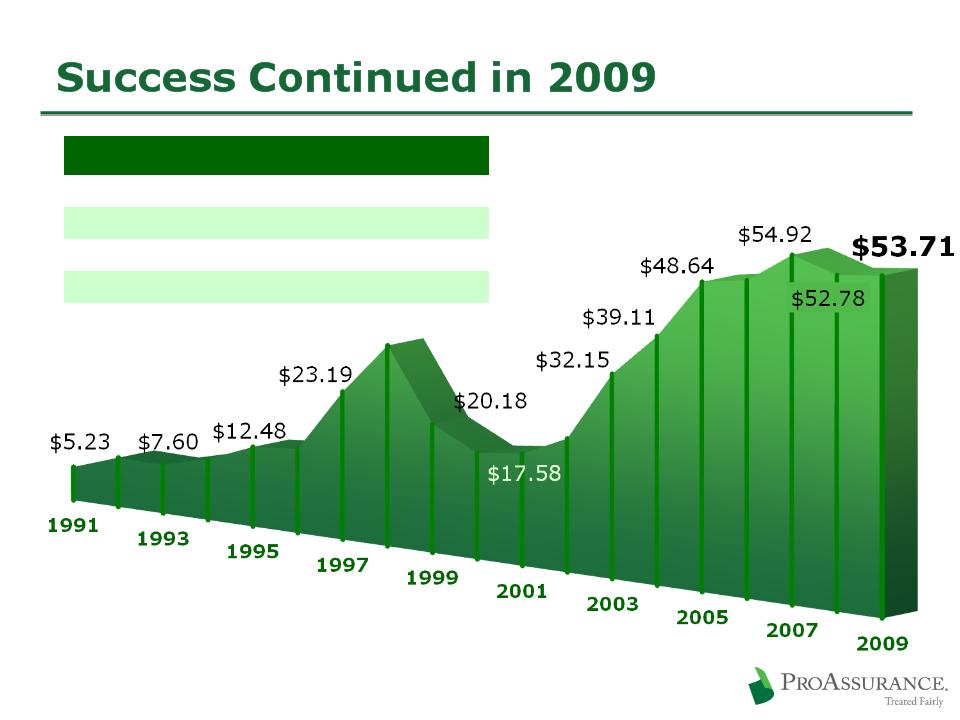
Success Continued in 2009
23% Increase in Book Value per Share in 2009
19% Increase in Revenue vs. 2008
28% Increase in Diluted EPS
Top Line Growth
$28 million of new business in our historical book
$95 million from completed M&A transactions
Three transactions completed in 2009
Outstanding performance in a challenging
financial market and a demanding line of
insurance
financial market and a demanding line of
insurance
5
|
Book Value Growth
EVERY
Year Since Inception |
||
|
|
Cumulative
|
CAGR
|
|
10 year
|
278%
|
14%
|
|
5 year
|
151%
|
20%
|
|
1 year
|
23%
|
23%
|
|
Measured through Year-End 2009
|
||
6
Book Value per Share at Year End
|
Share Prices Since Inception
|
||
|
|
Cumulative
|
CAGR
|
|
10 year
|
166%
|
10%
|
|
5 year
|
37%
|
7%
|
|
1 year
|
2%
|
2%
|
|
Measured through Year-End 2009
|
||
7
Share Price at Year End
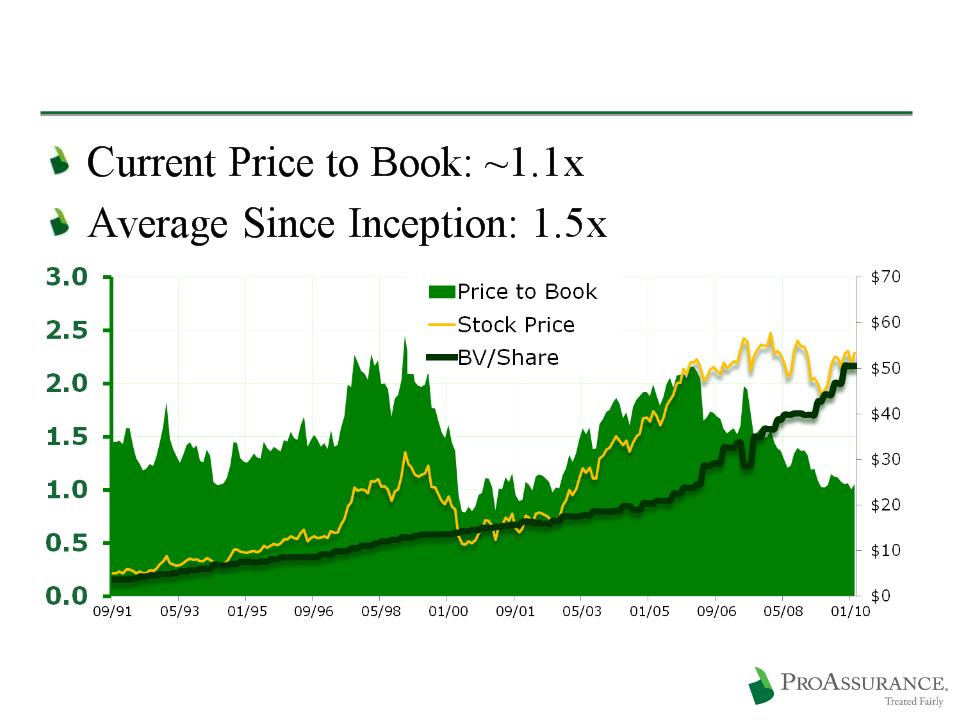
Prime Time to Invest in PRA
8
Price to Book Multiple by Month
Outstanding Performance vs Industry
Moody’s rankings of the top 100 P&C
insurance companies by premium volume
insurance companies by premium volume
9
1 by Direct Written Premium Source: 2008 Data from Moody’s Statistical Handbook October
2009
2009
|
Category
|
Ranking
|
|
Direct Written Premiums
|
95
|
|
Operating Ratio
|
1
|
|
Combined Ratio
|
2
|
|
Loss Ratio
|
5
|
|
ROE
|
5
|
2009 Financial Highlights
10
in millions, except per share data
Year-End
All data includes acquired entities since date of acquisition only. PICA was acquired on April 1, 2009.
1Excludes discontinued operations.
2Includes a loss on extinguishment of debt of $2.8 million for the year ended December 31, 2009 and a gain on
extinguishment of debt of $4.6 million for the year ended December 31, 2008
extinguishment of debt of $4.6 million for the year ended December 31, 2008
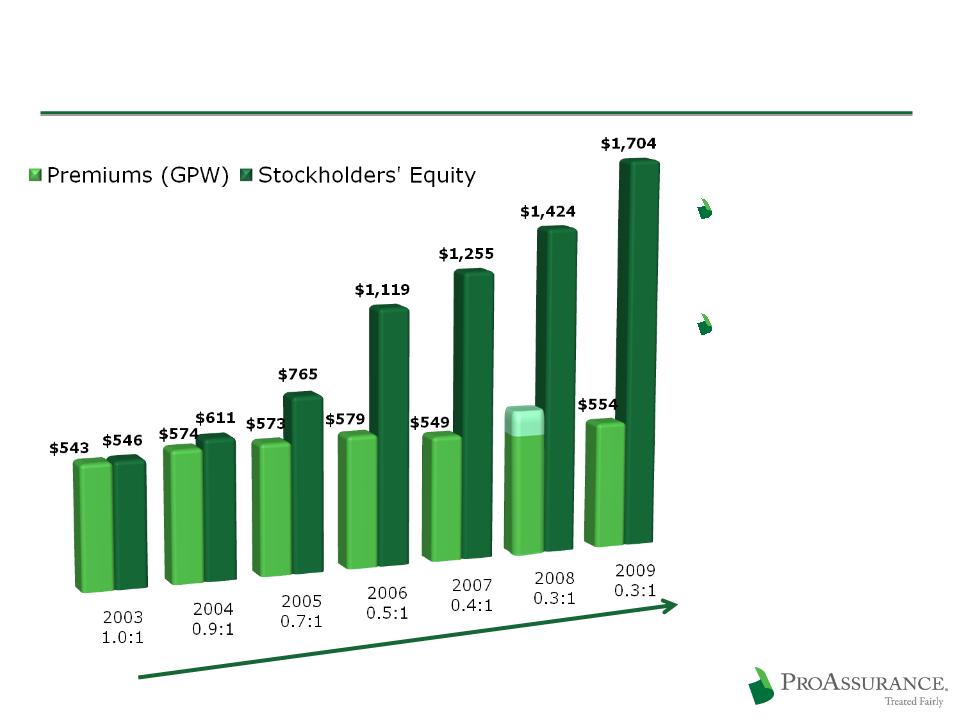
Gross Premiums Written1 $ 554 $ 471 $ 549
Net Investment Income1 151 158 171
Total Revenue1 673 567 706
Net Income (Includes Investment Losses)2 $ 222 $ 178 $ 168
Operating Income $ 215 $ 207 $ 172
Net Income/Diluted Share $ 6.70 $ 5.22 $4.78
Operating Income/Diluted Share $ 6.49 $ 6.07 $4.90
Total Assets $4,647 $ 4,281 $ 4,441
Shareowners’ Equity $1,705 $ 1,424 $ 1,255
2009 2008 2007
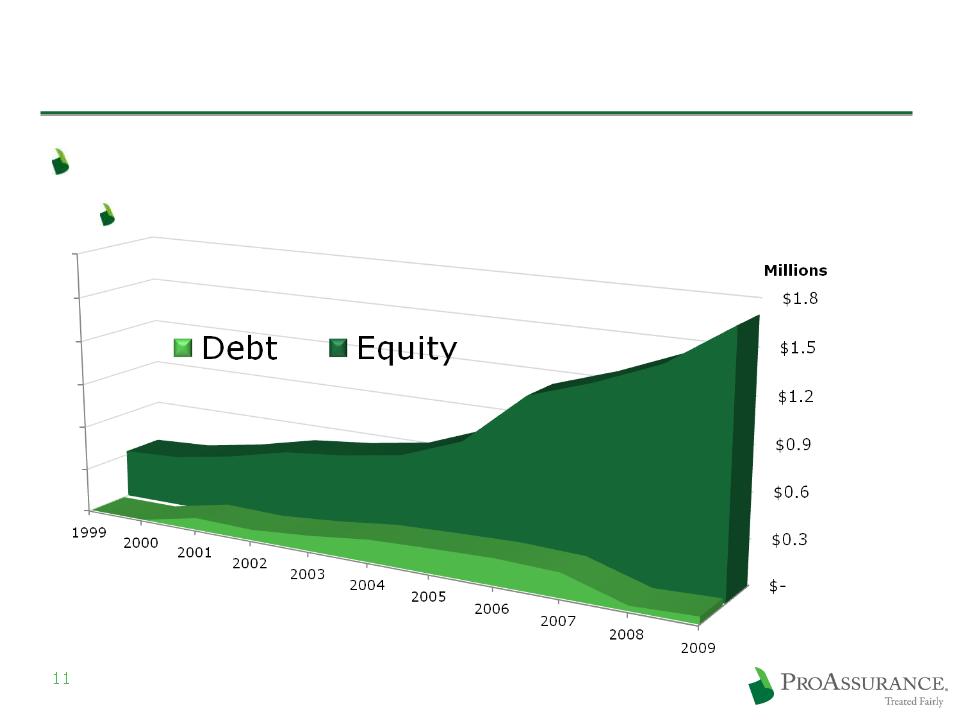
Conservative Use of Debt
Low Debt to Cap Ratio
No strain on cash flow

Capital Management
Active in prudent share repurchase
1.1 million shares in 2009
Board examination of capital management
alternatives
alternatives
12
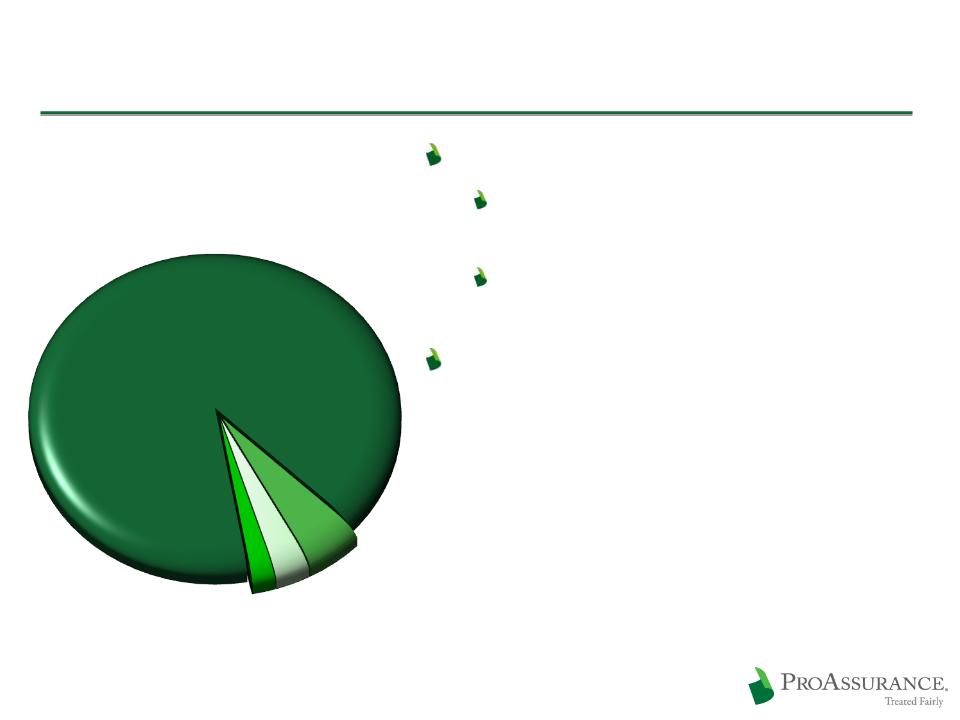
Investments Balance Risk vs. Return
Key Investment Actions in Q4 09
Reduced cash and short-term
balances
balances
Added to corporate and municipal
bond holdings
bond holdings
CUSIP-level portfolio disclosure
on our website:
www.proassurance.com/investorrelations/supplemental.aspx
on our website:
www.proassurance.com/investorrelations/supplemental.aspx
$3.8 Billion
Portfolio
Portfolio
$3.8 Billion
Portfolio
Portfolio
Fixed Income: 90%
Short Term: 5%
Short Term: 5%
Equity and Other Investments: 3%
Equity and Other Investments: 3%
BOLI: 2%
BOLI: 2%
13
12/31/09
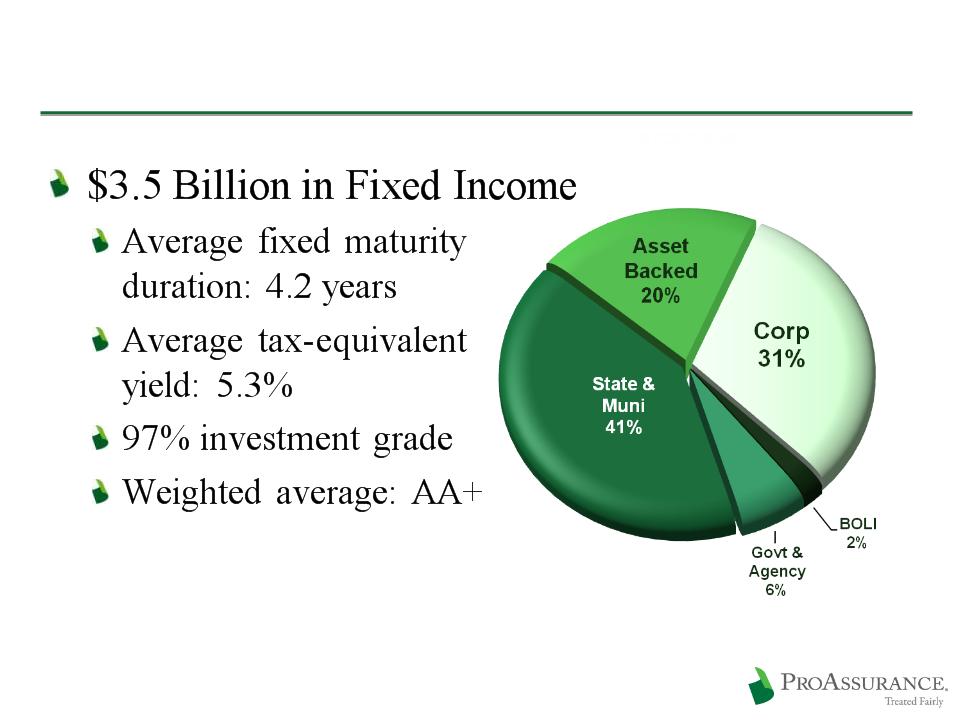
Fixed Income Breakdown
14
12/31/09

Our Disciplined Approach Produces
Operational Excellence
Our Disciplined Approach Produces
Operational Excellence
W. Stancil Starnes, Esq.
Chairman & CEO

Producing Sustainable Results
Building on growth opportunities
Using our unparalleled market knowledge
Leveraging our unique claims expertise
Employing our not so secret weapon
16

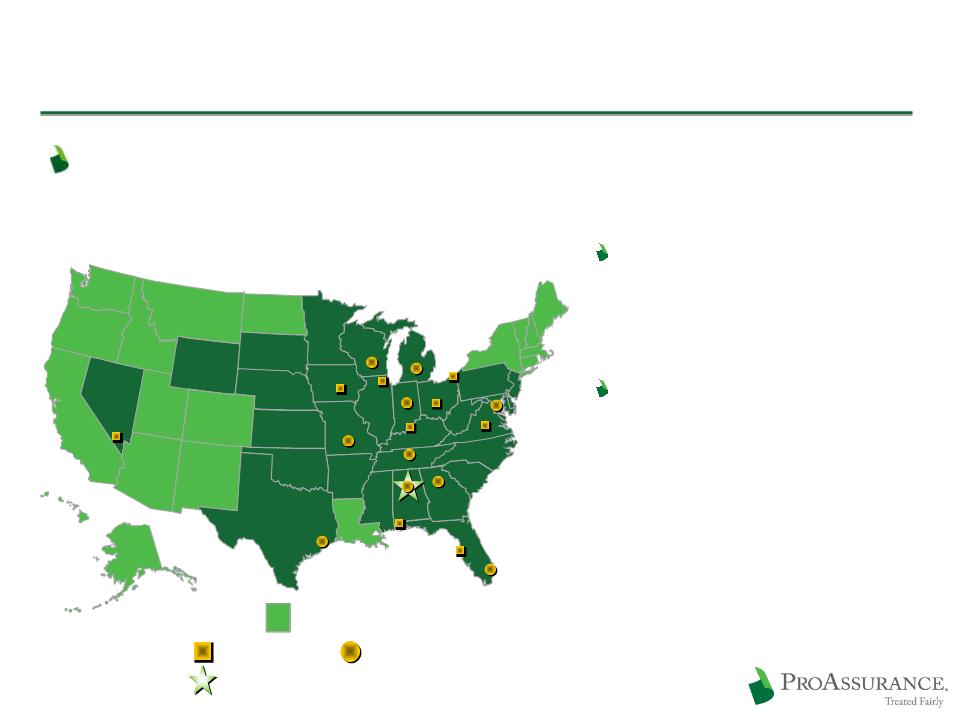
We Are a National Company
Broad geographic diversification provides an
unmatched spread of risk
unmatched spread of risk
17
Corporate Headquarters
Corporate Headquarters
Claims Offices
Claims Offices
Claims / Underwriting Offices
Claims / Underwriting Offices
PICA and/or E&S States
PICA and/or E&S States
(Birmingham)
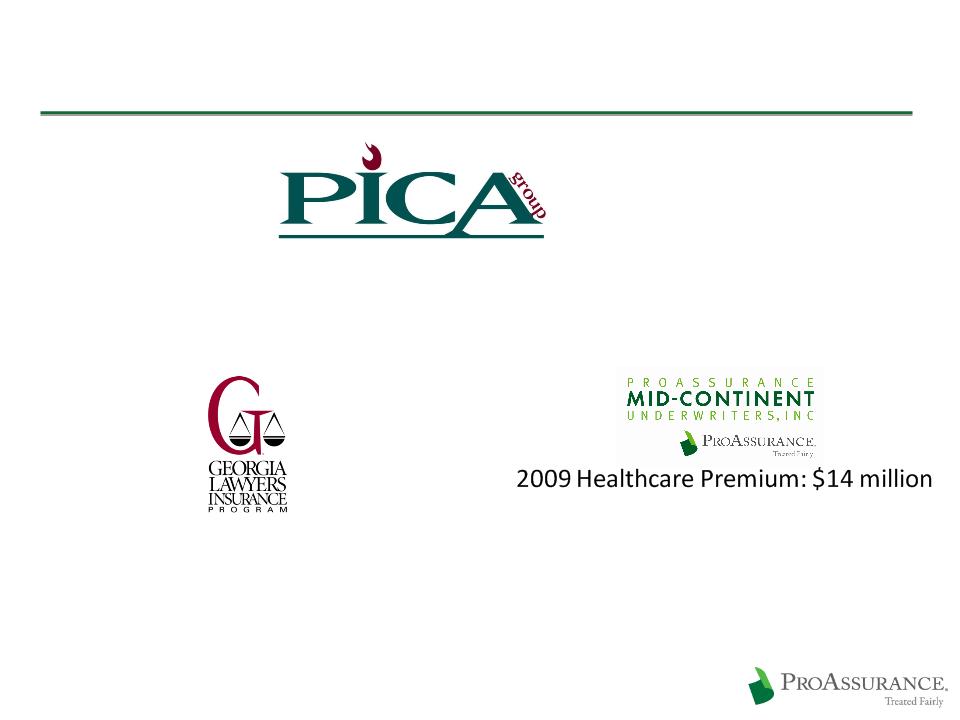
2009 M & A Transactions
18
2009 Premium: $77 million
Significant growth in our core business
Nationwide geographical expansion
Extends our core business
Broadens our medically-related range
Geographical expansion
Broadens our medically-related range
Geographical expansion
2009 Premium: $4.0 million
Adds to our lawyers’ book
Geographical expansion
Affirms our interest in this line
2009: Consolidation of:
Mid-Continent General Agency
Mid-Continent General Agency
2009: Consolidation of:
Mid-Continent General Agency
Mid-Continent General Agency
Georgia Lawyers Insurance Co.
Georgia Lawyers Insurance Co.
2004: Purchased Selected Renewal Rights from:
OHIC Insurance Company
OHIC Insurance Company
2004: Purchased Selected Renewal Rights from:
OHIC Insurance Company
OHIC Insurance Company
Growth Through M&A
We’ve built a leading platform through M&A
19
1994: Consolidation of:
West Virginia Hosp. Ins Co.
West Virginia Hosp. Ins Co.
1994: Consolidation of:
West Virginia Hosp. Ins Co.
West Virginia Hosp. Ins Co.
1995: Consolidation of;
1995: Consolidation of;
Physicians Ins Co of Indiana
Physicians Ins Co of Indiana
Assumed business of:
Physicians Ins Co of Ohio
Physicians Ins Co of Ohio
Assumed business of:
Physicians Ins Co of Ohio
Physicians Ins Co of Ohio
1996: Consolidation of:
1996: Consolidation of:
Missouri Medical Ins Co
Missouri Medical Ins Co
1995: Assumed business of:
Associated Physicians Ins Co. (IL)
Associated Physicians Ins Co. (IL)
1995: Assumed business of:
Associated Physicians Ins Co. (IL)
Associated Physicians Ins Co. (IL)
1998: Consolidation of:
Physicians Protective Trust Fund (FL)
Physicians Protective Trust Fund (FL)
1998: Consolidation of:
Physicians Protective Trust Fund (FL)
Physicians Protective Trust Fund (FL)
1996: Assumed business of:
American Medical Ins Exchange (IN)
American Medical Ins Exchange (IN)
1996: Assumed business of:
American Medical Ins Exchange (IN)
American Medical Ins Exchange (IN)
Founding in the 1970’s
Founding in the 1970’s
1999: Assumed business of:
Medical Defense Associates (MO)
Medical Defense Associates (MO)
1999: Assumed business of:
Medical Defense Associates (MO)
Medical Defense Associates (MO)
Mutual Assurance
Physicians Ins. Co. of Michigan
Professionals Group
Creation of:
Creation of:
2005: Consolidation of:
NCRIC Group
NCRIC Group
2005: Consolidation of:
NCRIC Group
NCRIC Group
2006: Consolidation of:
PIC Wisconsin Group
PIC Wisconsin Group
2006: Consolidation of:
PIC Wisconsin Group
PIC Wisconsin Group
2007: PRI renewal rights deal
2002: SERTA renewal rights deal
2001: OUM renewal rights deal
2000: DPM Merger
1999: PACO Acquisition
Growth Brings Size and Scope
Broad geographic diversification provides an
unmatched spread of risk
unmatched spread of risk
20
Our spread of risk provides
better market awareness and
more data points to gauge
loss trends
better market awareness and
more data points to gauge
loss trends
Our internal actuarial depth
allows us to assess emerging
trends and respond quickly
allows us to assess emerging
trends and respond quickly
Corporate Headquarters
Corporate Headquarters
Claims Offices
Claims Offices
Claims / Underwriting Offices
Claims / Underwriting Offices
PICA and/or E&S States
PICA and/or E&S States
(Birmingham)

Claims Handling Sets Us Apart
Our effective approach to handling claims sets
us apart
us apart
We price our product to offered an unfettered
defense of claims to the extent permitted by
law
defense of claims to the extent permitted by
law
Claims handling is a key to policyholder
loyalty and long-term financial success
loyalty and long-term financial success
21
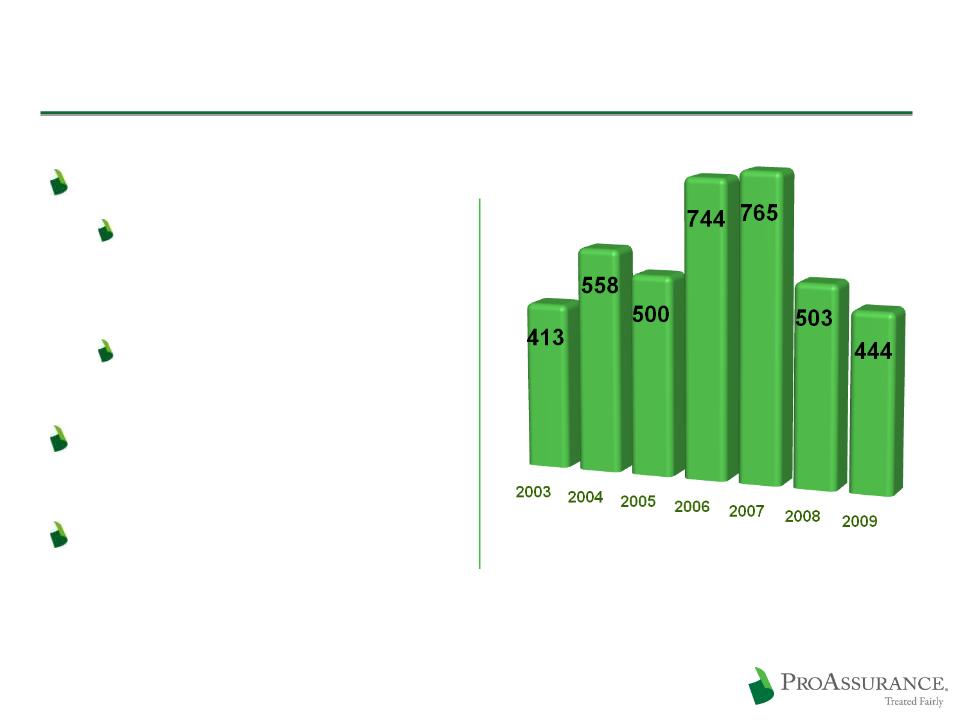
Claims Trends Remain Favorable
22
ProAssurance Claims Tried
to a Verdict
(includes PICA)
to a Verdict
(includes PICA)
We try cases
Frequency trends are
stable after declining
since 2005/2006
stable after declining
since 2005/2006
The result is fewer
cases to try
cases to try
Severity trends also
stable
stable
Trends are much the
same in states with or
without Tort Reform
same in states with or
without Tort Reform

The Ohio Example
Exhaustive, reliable data provided by the Ohio
Department of Insurance
Department of Insurance
Broad range of competitors and business
approaches
approaches
Pricing
Underwriting
Claims handling
23
www.insurance.ohio.gov/Legal/Reports/Documents/MedMal_Closed_Claim_2008.pdf
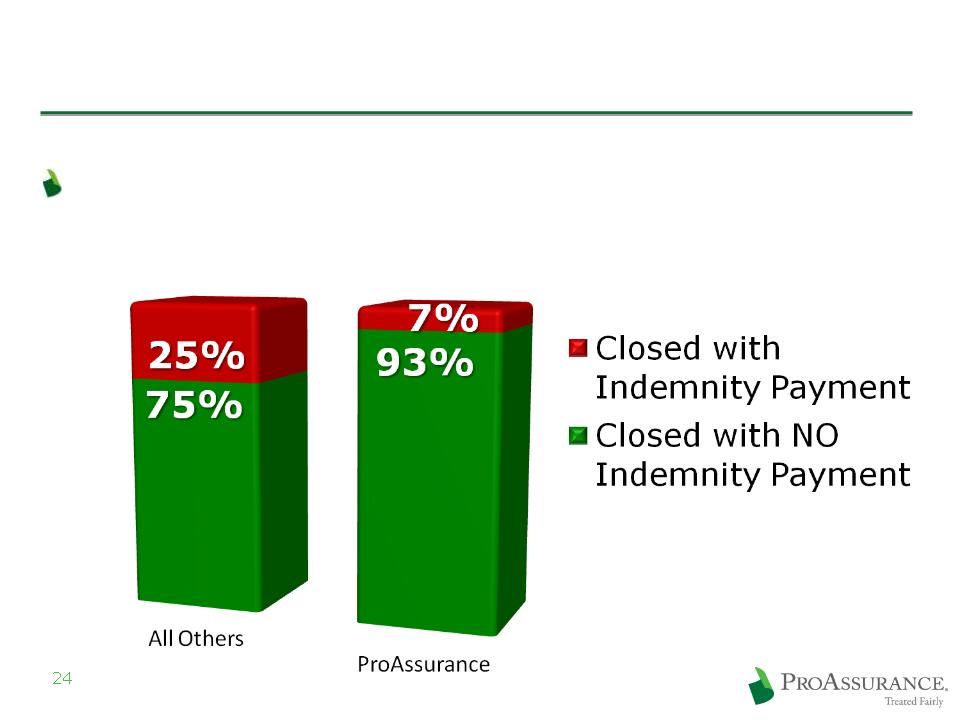
ProAssurance closes more claims
with NO indemnity payments
with NO indemnity payments
Ohio Closed Claims 2005-2008
Source: Ohio Department of Insurance: www.insurance.ohio.gov/Legal/Reports/Documents/MedMal_Closed_Claim_2008.pdf
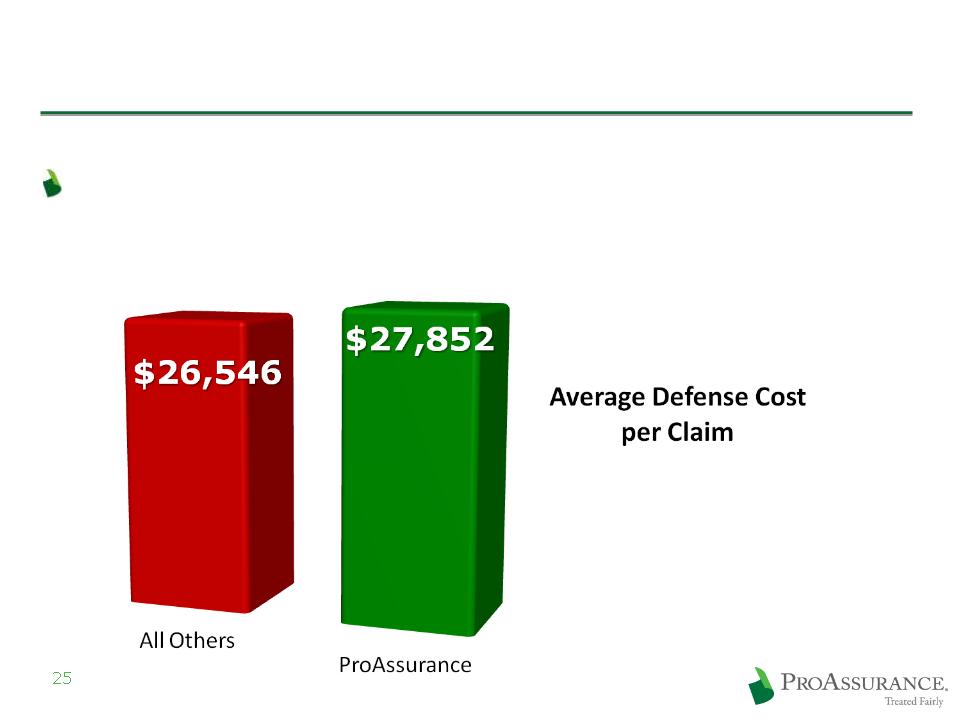
ProAssurance spends more, on average, to
defend cases—leveraging our strength
defend cases—leveraging our strength
Ohio Closed Claims 2005-2008
Source: Ohio Department of Insurance: www.insurance.ohio.gov/Legal/Reports/Documents/MedMal_Closed_Claim_2008.pdf
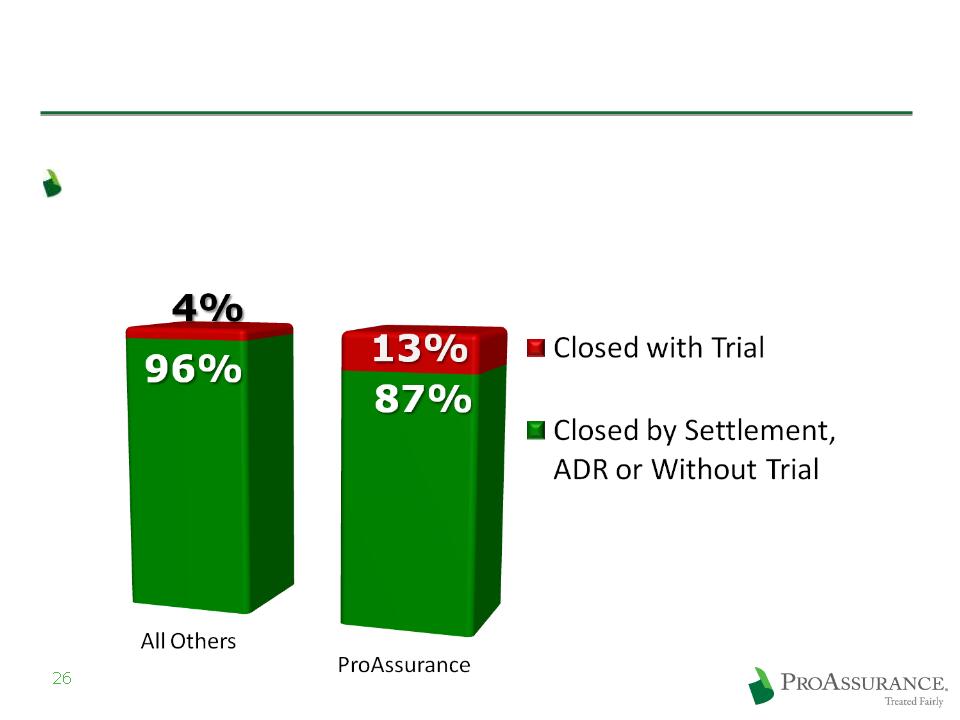
ProAssurance closes more claims at trial,
offering our insureds the chance for vindication
offering our insureds the chance for vindication
Ohio Closed Claims 2005-2008
Excludes Trials that Ended with a Directed Verdicts
Source: Ohio Department of Insurance: www.insurance.ohio.gov/Legal/Reports/Documents/MedMal_Closed_Claim_2008.pdf
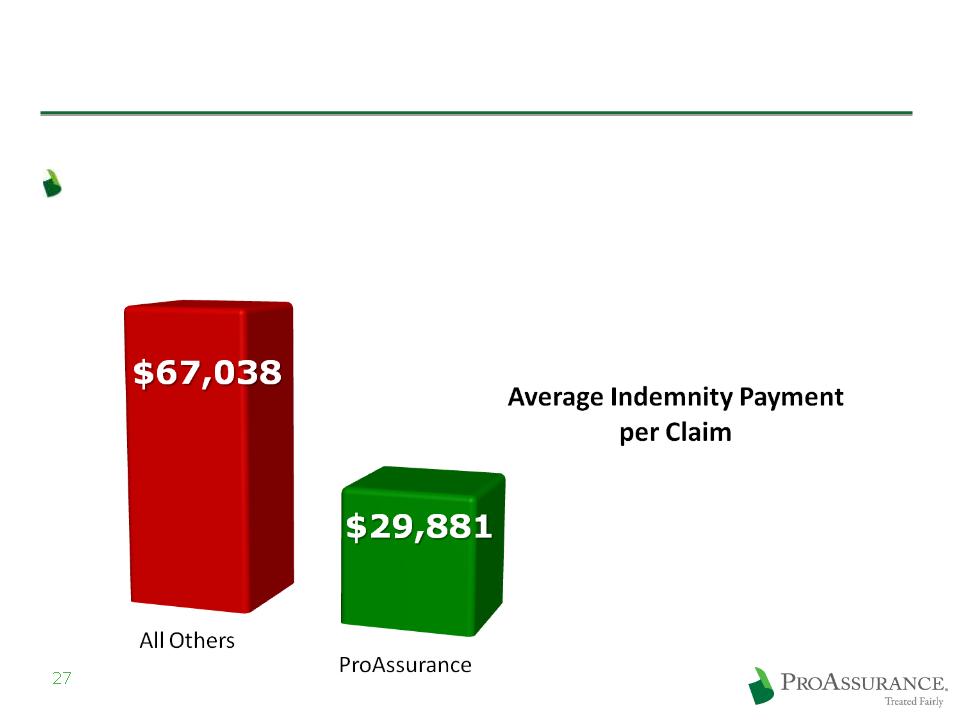
ProAssurance spends far less in average
indemnity payments
indemnity payments
Ohio Closed Claims 2005-2008
Source: Ohio Department of Insurance: www.insurance.ohio.gov/Legal/Reports/Documents/MedMal_Closed_Claim_2008.pdf

The Importance of Treated Fairly®
Treated Fairly® affirms our existing, enduring
commitment to every stakeholder
commitment to every stakeholder
Insureds
Agents
Investors
The public
Provides a touchstone that guides every interaction
Helps ensure that we run our business as owners
who are rewarded for long-term success
who are rewarded for long-term success
28

Producing Sustainable Results
Building on growth opportunities
Using our unparalleled market knowledge
Leveraging our unique claims expertise
Employing our not so secret weapon
29

SUPPLEMENTAL
DISCUSSION
SLIDES
DISCUSSION
SLIDES
SUPPLEMENTAL
DISCUSSION
SLIDES
DISCUSSION
SLIDES

Financial
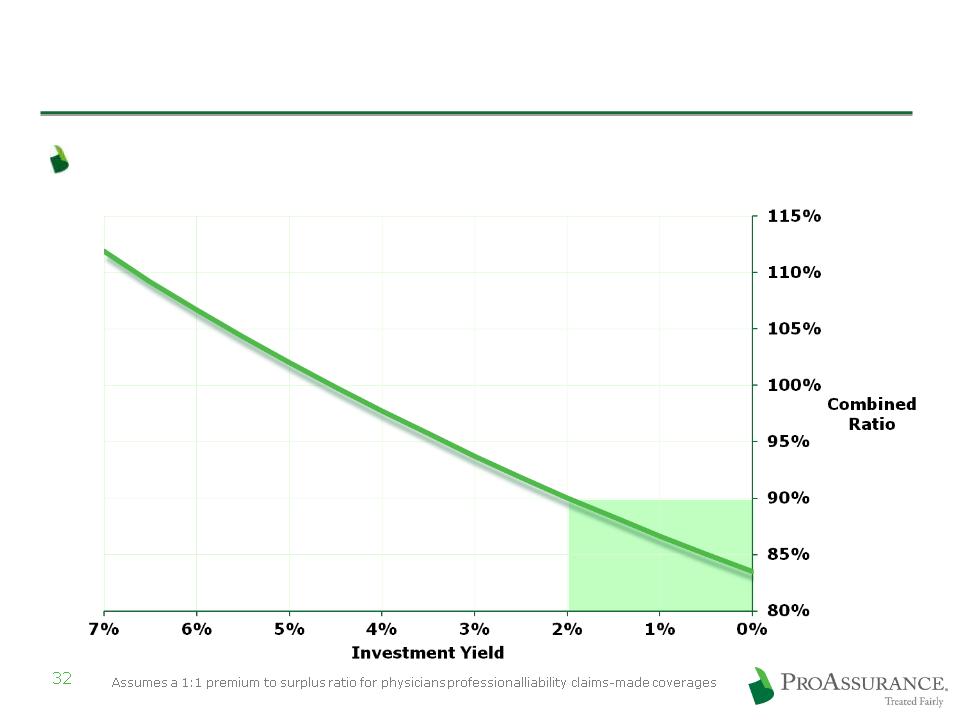
The Importance of Investment Income
Pricing discipline is even more critical
Combined Ratio
required to generate
a 13% after-tax ROE
required to generate
a 13% after-tax ROE

The Importance of Investment Income
33
Year
1
1
Year
2
2
Year
3
3
Year
4
4
Year
5
5
Year
6
6
Year
7
7
Year
8
8
Incident
Occurs
Occurs
Discovery
and
Preparation
and
Preparation
Claim
Reported
Reported
Trial
and
Appeals
Appeals
Resolution
5-6 Years
After
Claim
Reported
After
Claim
Reported
Life Cycle of a Typical Claim
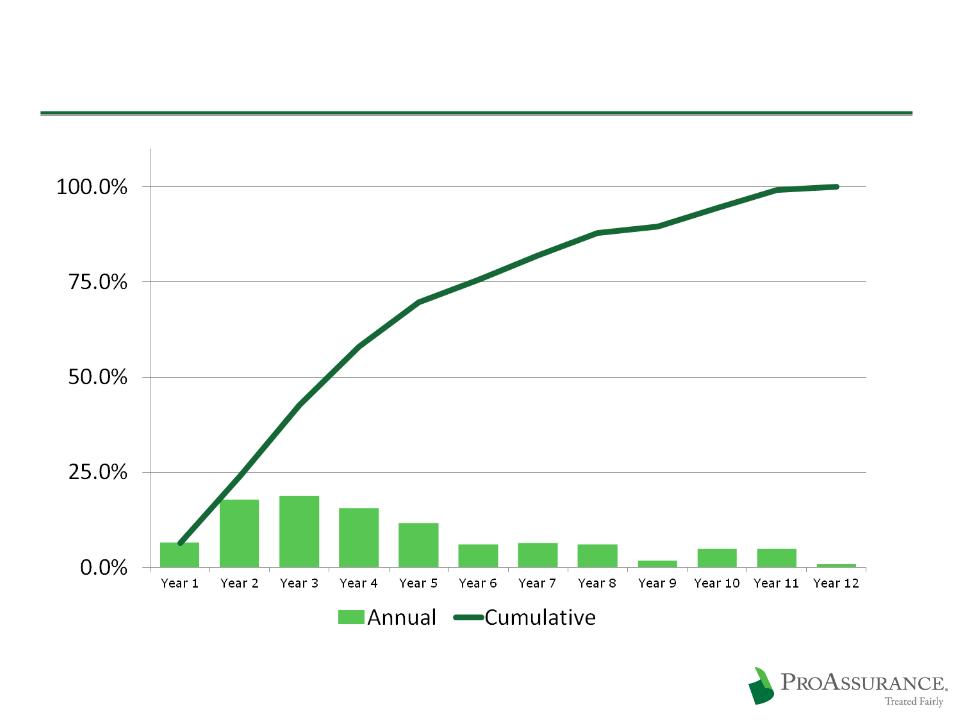
The Importance of Investment Income
34
Typical Claims Payout Pattern
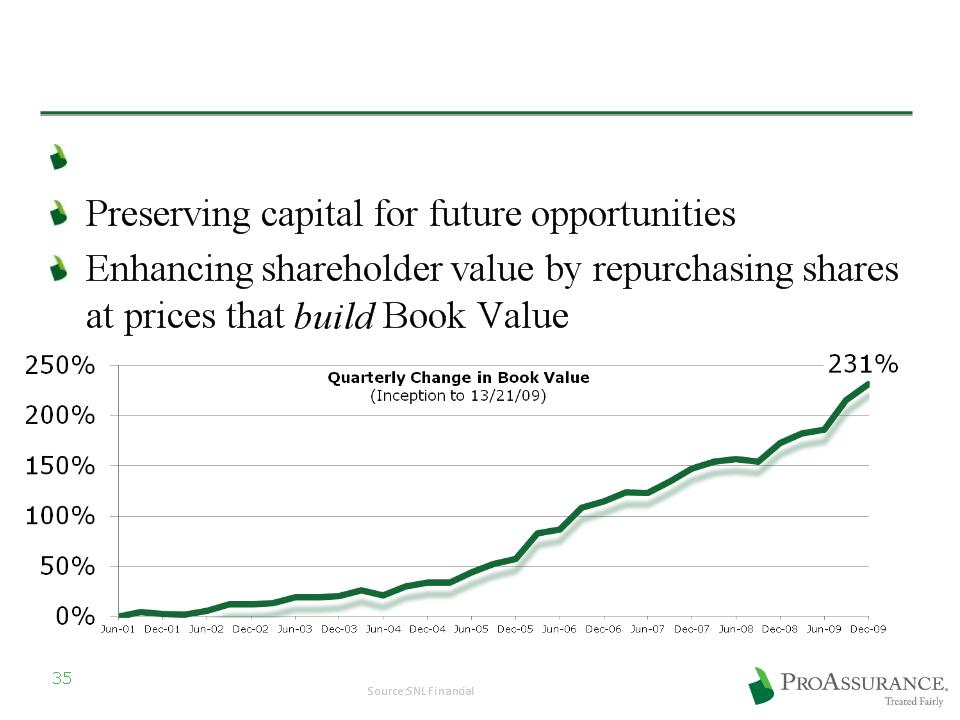
Using Capital Prudently
Using capital to build through M&A
Our Strong Capital/Low Leverage Position
36
(in millions)
Prepared for an
improving market
improving market
Prudent capital
management
management
Premiums to Surplus
for Each year
for Each year
$567
$ 96
$471
($96 mil PICA pro forma in 2008)
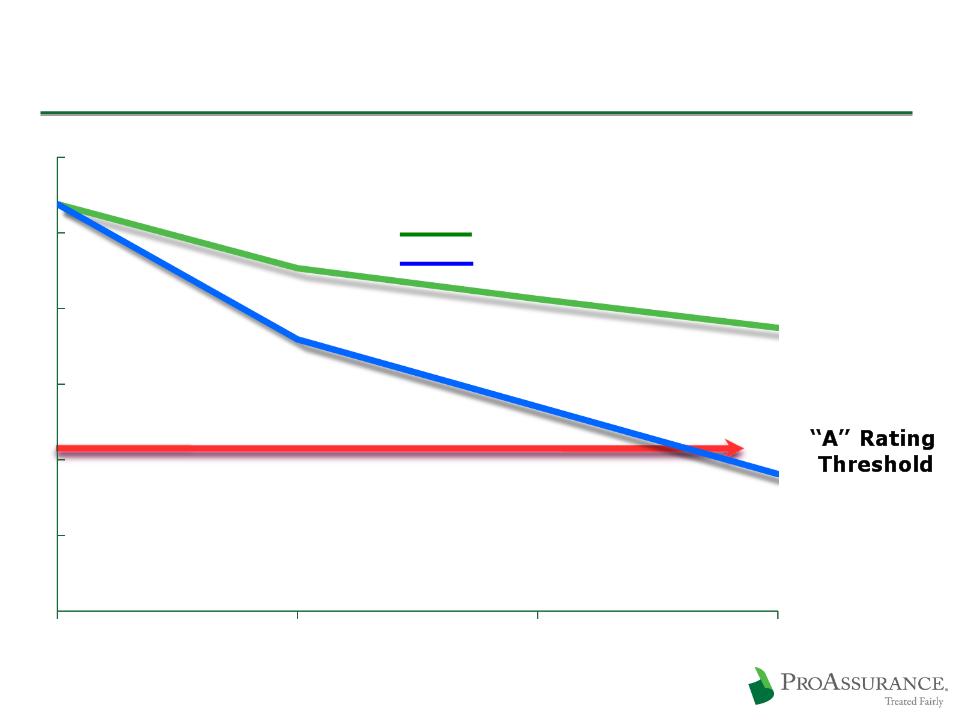
Excess Capital vs. Excess Capacity
37
Conceptual Model of Projected
A. M. Best BCAR Scores if
A. M. Best BCAR Scores if
Premiums Increase
Surplus is Reduced

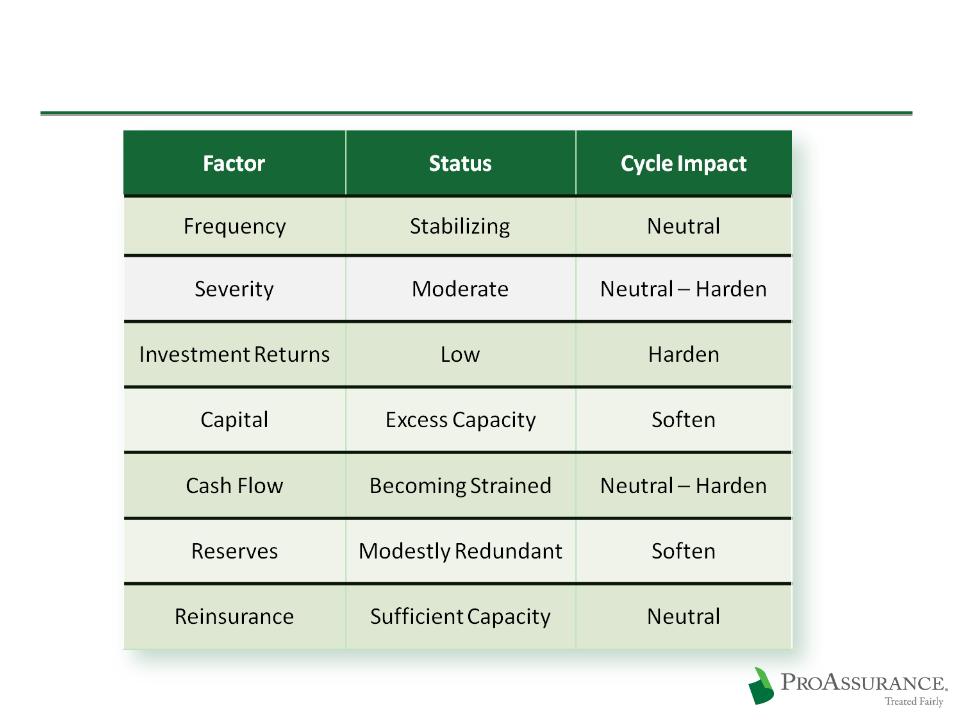
Market Conditions

The State of the Market
Prices have been falling yet profitability
remains high
remains high
Continued low interest rates must enforce
discipline sooner or later
discipline sooner or later
Frequency is no longer declining
Only a matter of time before frequency moves
higher
higher
But when?
Severity is trending upward at expected,
manageable rates (4%-5%) in most states
manageable rates (4%-5%) in most states
39
The State of the Market
40

Responding to Changes in HealthCare
Projected sector growth through 20181
Physician’s Assistants 39%
Medical Assistants 36%
Licensed Nurses 34%
Chiropractors 31%
Physicians and Surgeons 22%
Podiatrists 9%
41
1Bureau of Labor Statistics 2008 to 2018 Projections

Claims
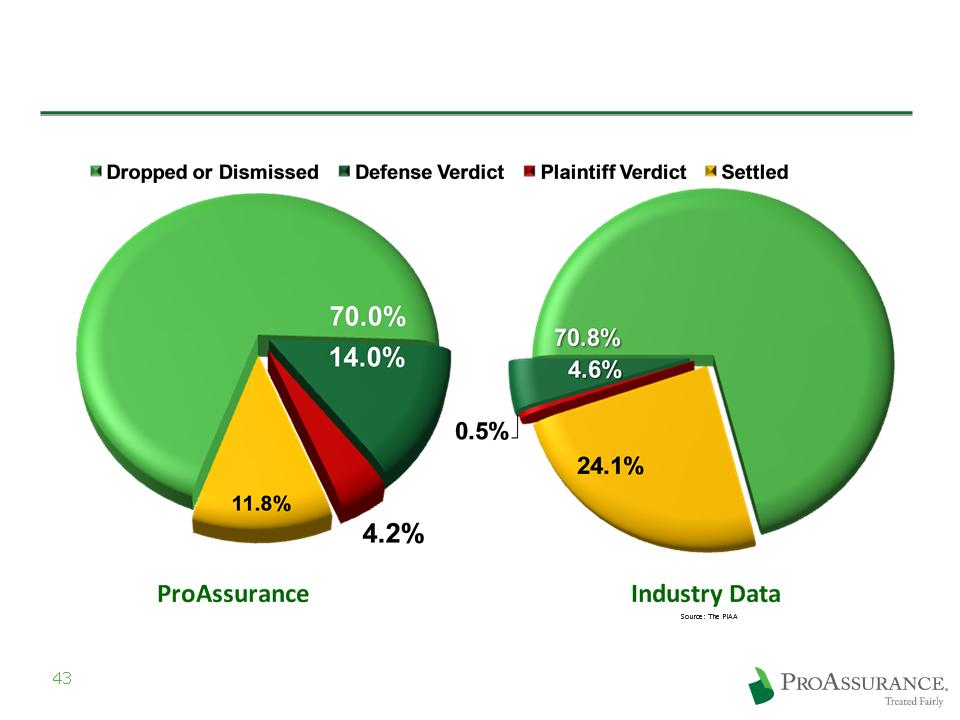
Why Claims Strategy Matters
Favorable
Outcomes:
84.0%
Outcomes:
84.0%
Favorable
Outcomes:
84.0%
Outcomes:
84.0%
Five Year Average
2004 - 2008
2004 - 2008
Favorable
Outcomes:
75.4%
Outcomes:
75.4%
Favorable
Outcomes:
75.4%
Outcomes:
75.4%
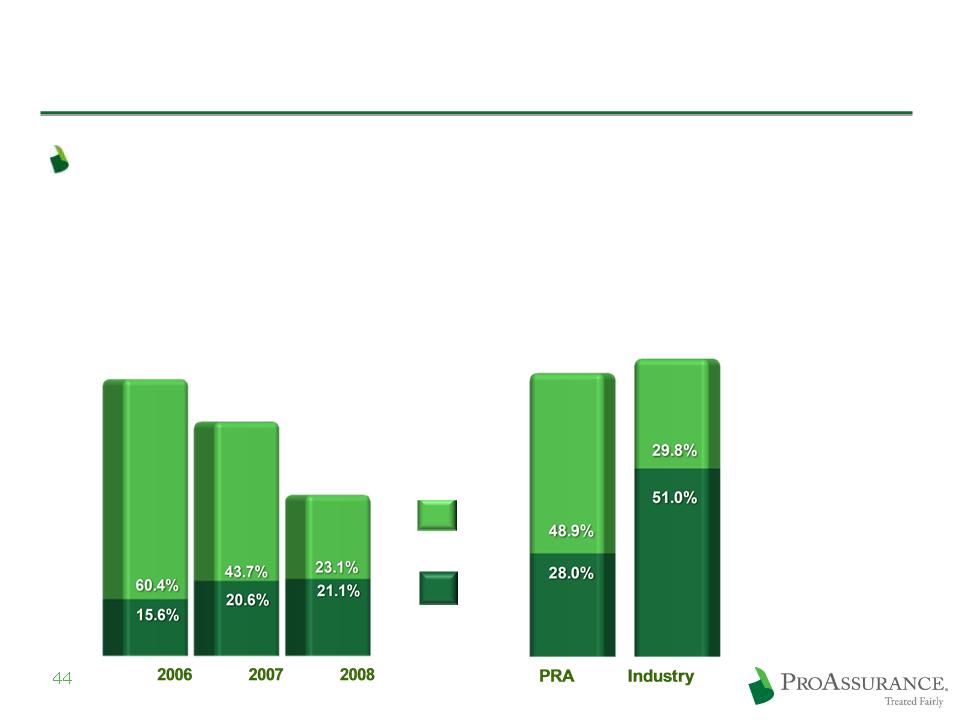
Why Claims Strategy Matters
Our ability and willingness to defend claims
allows us to achieve better results
allows us to achieve better results
ProAssurance vs. Industry
Average Statutory Loss Ratio
Average Statutory Loss Ratio
2003-2008
Legal
Payments
Payments
Loss
Payments
Payments
Trend for ProAssurance
Stand Alone Statutory Loss Ratio
Stand Alone Statutory Loss Ratio
2006 - 2008
76.0%
*Source: A. M. Best Aggregates & Averages, Medical Malpractice Predominating
64.3%
80.8%
76.9%
44.2%

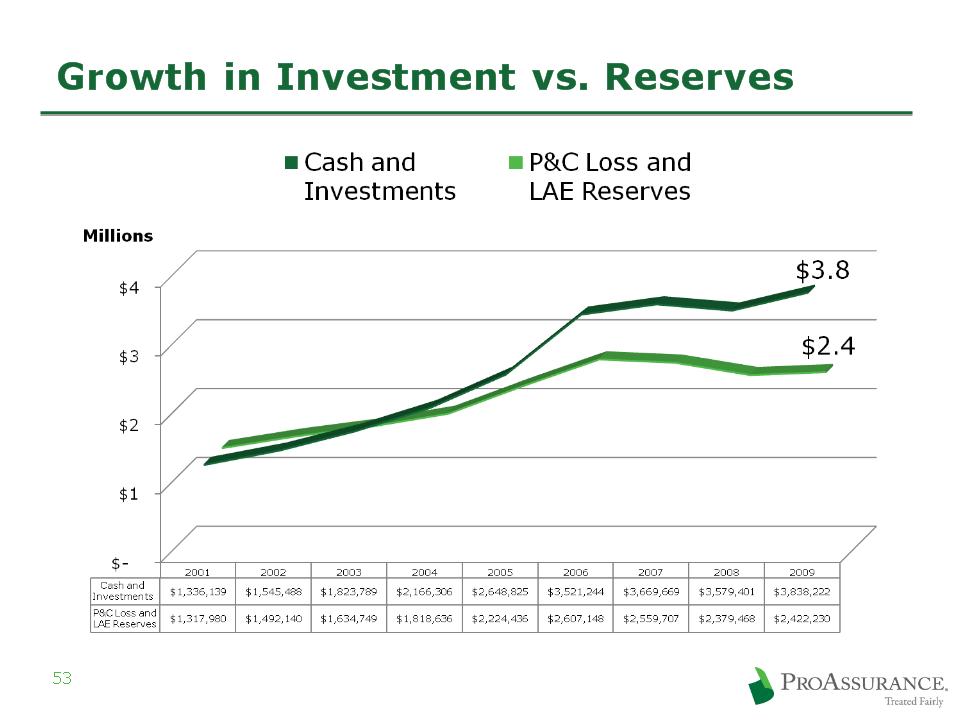
Appendix: Underwriting/Actuarial
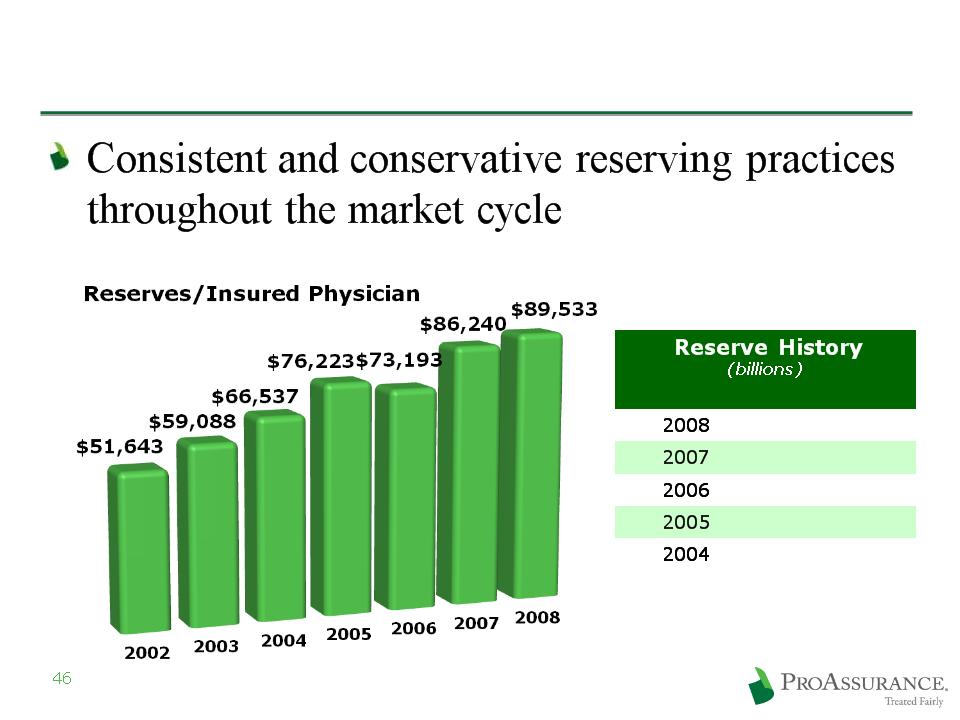
Enforce Actuarial Conservatism
|
$ 2.4
|
|
|
$ 2.6
|
|
|
$ 2.6
|
|
|
$ 2.2
|
|
|
$ 1.8
|
|
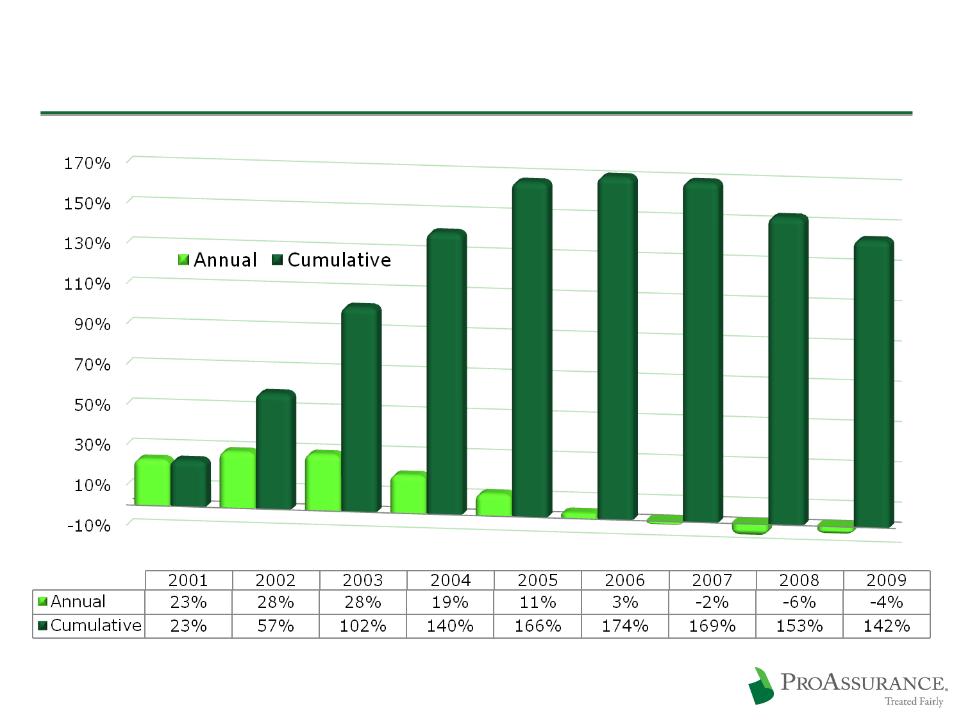
Rate Change History
47

Appendix: Moody’s Rankings
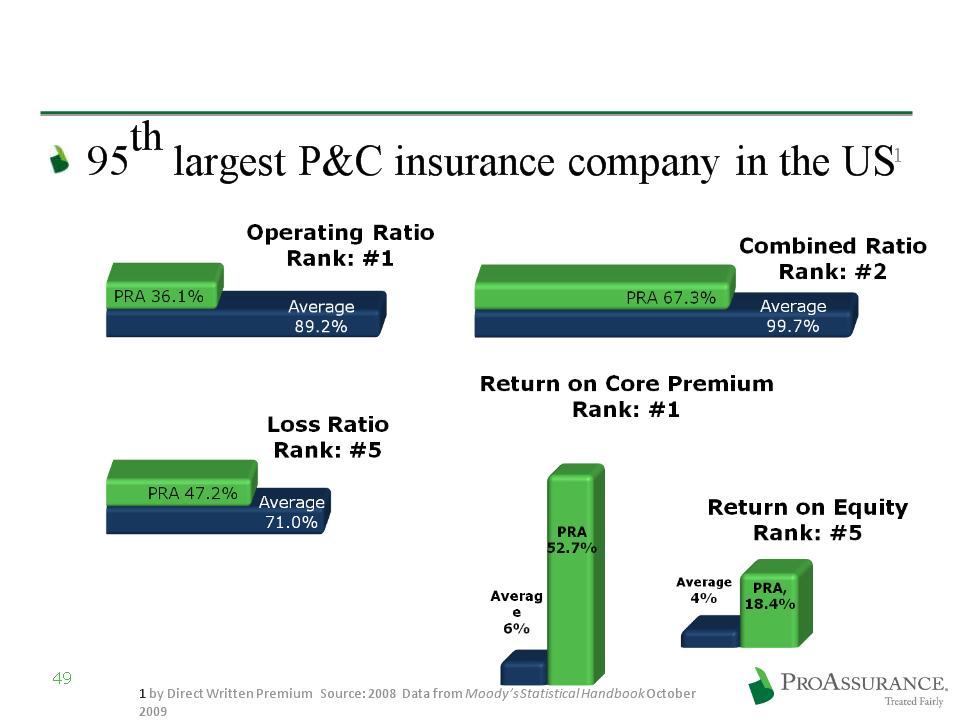
Moody’s Top 100 Ranking Data

Appendix: Investments
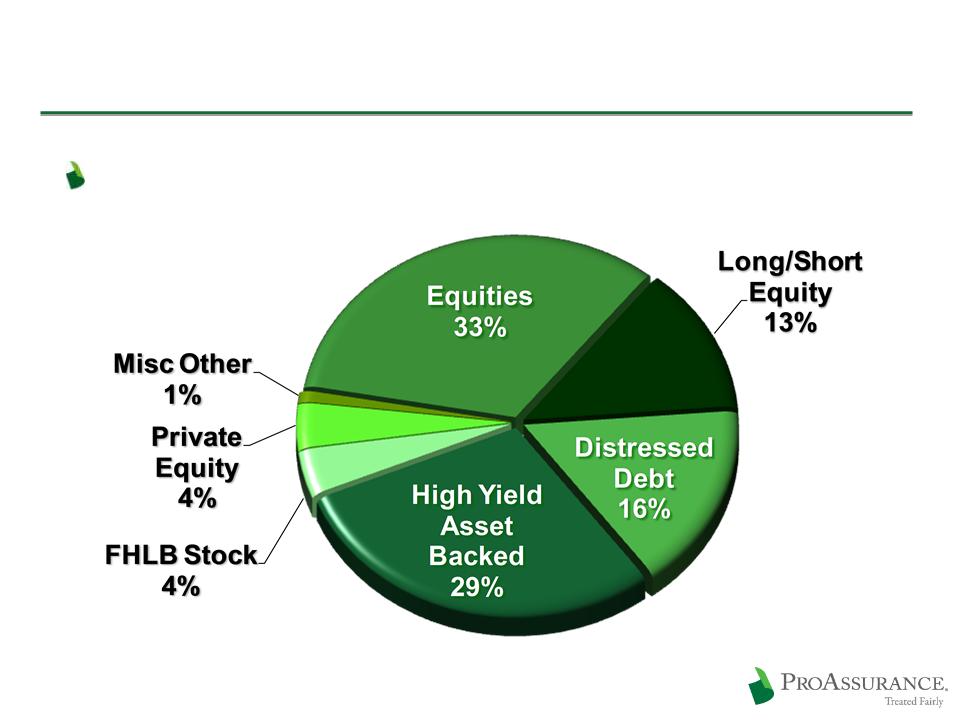
Equities & Other: $43 Million
51
12/31/09
Represents 3% of our Total Investments
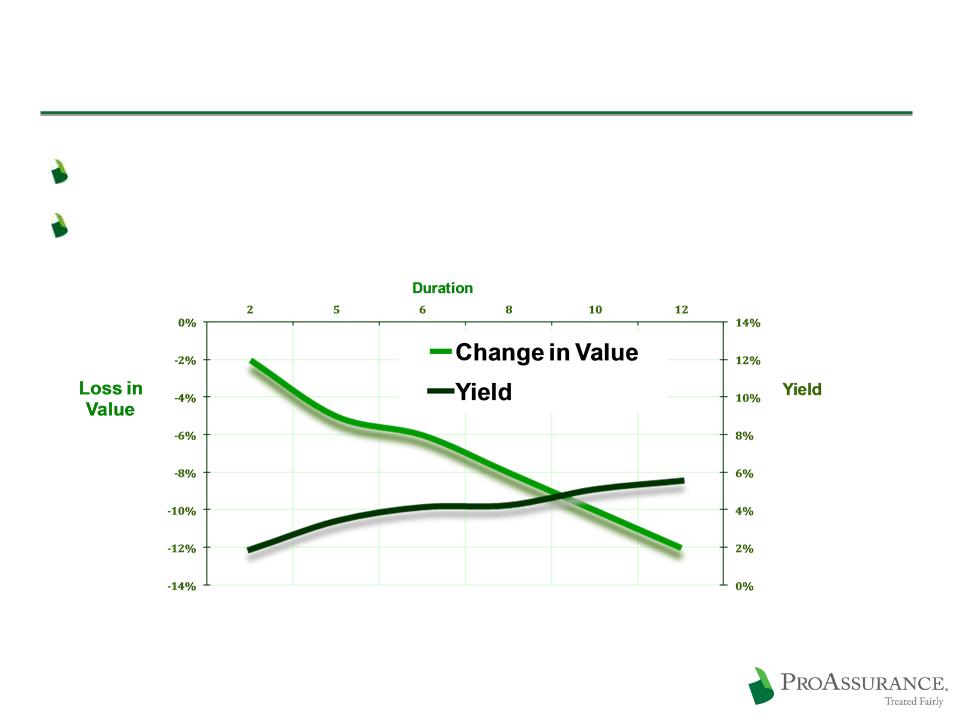
Strategy: Investment Discipline
The choice: Chase yield or extend duration
We are maintaining duration, looking for opportunities
55
Loss in value assuming a 100 basis point shift in the yield curve
Yields based on Single A composite corporate debt
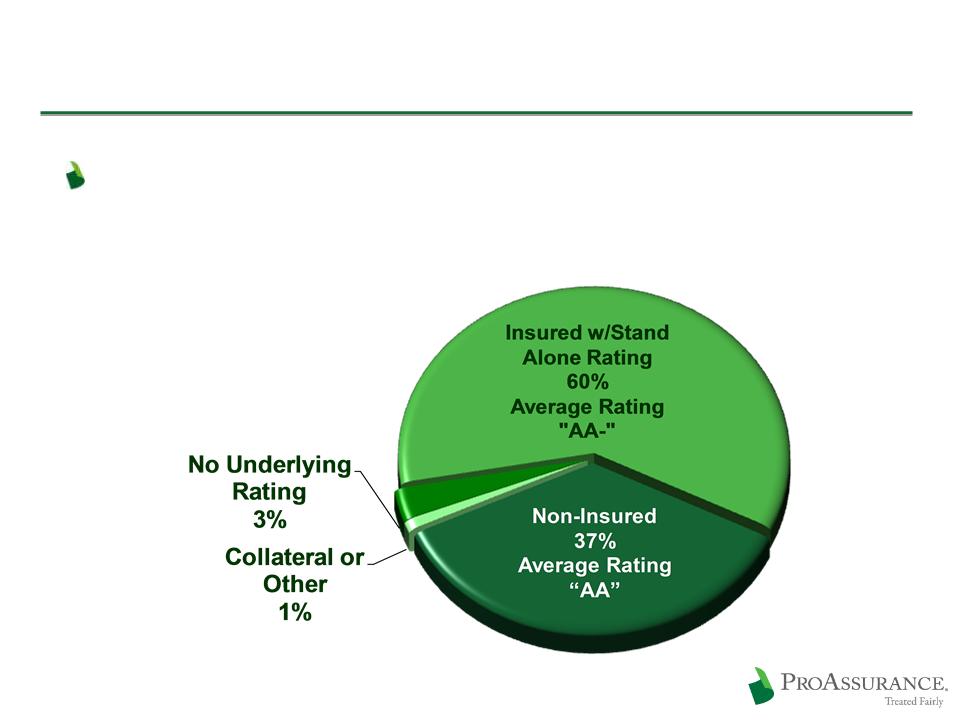
Municipals: $1.5 Billion
56
12/31/09
Investment policy has always required
investment grade rating prior to applying the
effect of insurance
investment grade rating prior to applying the
effect of insurance
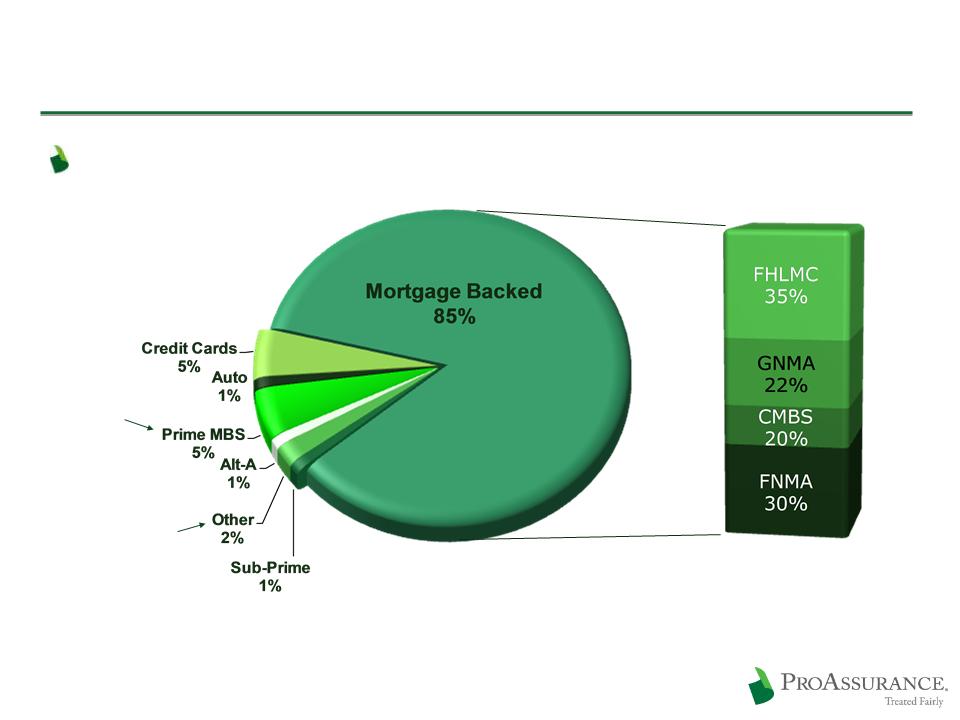
Asset Backed: $700 Million
Weighted average rating: “AA+”
Bloomberg Data
12/31/09
12/31/09
Alt-A
LTV 61%
LTV 61%
Prime MBS
LTV 57%
LTV 57%
Further Details Provided
on Sub-Prime and CMBS
on following pages
on Sub-Prime and CMBS
on following pages
57

Sub-Prime Detail
58
$7.2 million market value in AFS portfolio
$3.5 million unrealized loss
$13.3 million market value in
high-yield LP rated “A”
high-yield LP rated “A”
LP’s focus is distressed ABS
|
At 12/31/09
|
Vintage
|
|
$4.7 Mln
|
2004 & Prior
|
|
$2.5 Mln
|
2005
|
Quality & Vintage information only on direct holdings at 12/31/09
|
At 12/31/09
|
Type
|
Quality
|
|
$3.4 Mln
|
Mortgage-Backed
|
AA- avg - LTV 71%
|
|
$3.8 Mln
|
Home Equity
|
A+ avg
|

CMBS Detail
Vintages
2005 & Prior- $71 million
2006- $21 million
Top Property Types
Office: 56% of CMBS portfolio
Retail Anchored: 34% of CMBS portfolio
Mixed Use: 6% of CMBS portfolio
Other: 4% of CMBS Portfolio
59

CMBS Detail
$93 million Fair Value in non-agency CMBS
Book Value: $94 million
3% of fixed income portfolio
60
|
At 12/31/2009
|
Quality
|
|
$89.3 Mln
|
AAA
|
|
$ 3.0 Mln
|
AA
|
|
$ 0.7 Mln
|
A
|
|
At 12/31/2009
|
Wtd Avg LTV
|
|
16%
|
<65%
|
|
48%
|
=65-70%
|
|
19%
|
<70-75%
|
|
16%
|
=75-85%
|
|
1%
|
+85%
|
|
At 12/31/2009
|
Credit Support
|
|
39%
|
>30%
|
|
46%
|
20% - 30%
|
|
11%
|
10% - 20%
|
|
4%
|
Less than 10%
|
|
At 12/31/2009
|
Deal Cumulative Delinquencies
|
|
30%
|
0.0% - 1.0%
|
|
15%
|
1.0% - 2.0%
|
|
19%
|
2.0% - 3.0%
|
|
10%
|
3.0% - 5.0%
|
|
21%
|
5.0% - 8.0%
|
|
5%
|
8.0% - 10.0%
|
|
At
12/31/2009 |
Debt Service Coverage
|
|
87%
|
=>1.5x
|
|
7%
|
1.4x-1.5x
|
|
6%
|
1.3x-1.4x
|
AT
12/31/2009
12/31/2009
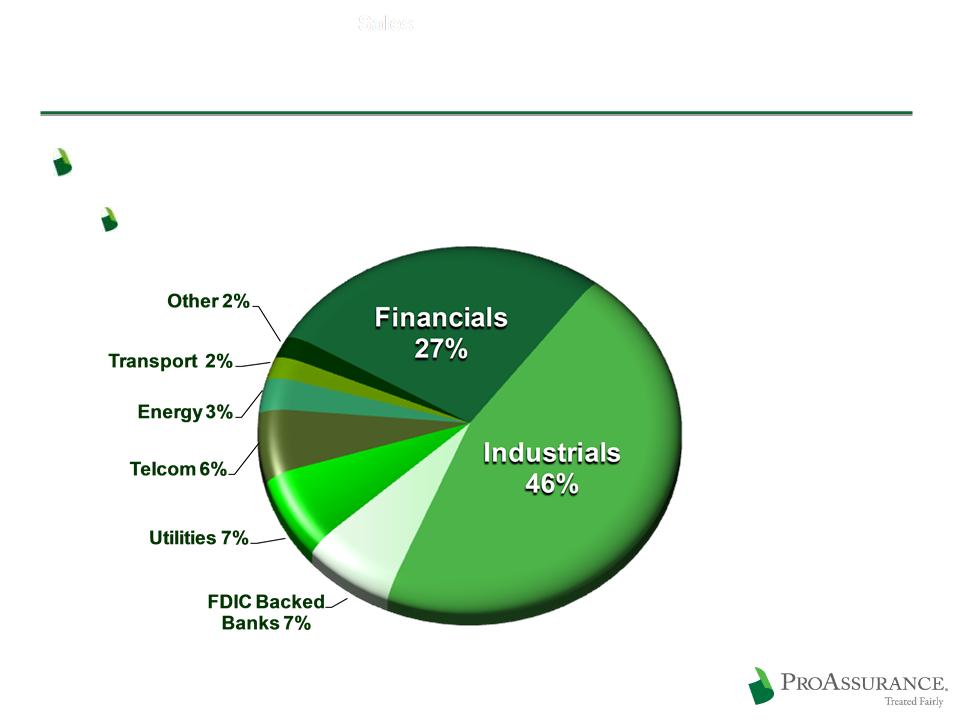
Weighted Average Rating: A
28% of Total Investments
Corporates: $1.1 Billion
61
12/31/2009

Corporate: Detail on Financials
Top 20 Largest Banks/Financials: $ 267 million
$68 mm FDIC backing
|
BA $41 ($23)
|
Credit Suisse $9
|
|
MS $29 ($6)
|
Eurohypo $8
|
|
BP Cap $25
|
KEY $6 ($6)
|
|
GECC $25 ($8)
|
BNY Mellon $6
|
|
JPM $23 ($14)
|
PNC $6 ($2)
|
|
GS $18( $2)
|
US Bank $6
|
|
Amex $13
|
Deutsche Bank $5
|
|
Citi $13($5)
|
Depfa ACS -Covered $5
|
|
Wells $13
|
FMCC $5
|
|
Natl Rural $9
|
John Deere Cap $5 ($2)
|
|
FDIC backed amounts listed in parentheses
|
|
62
12/31/2009
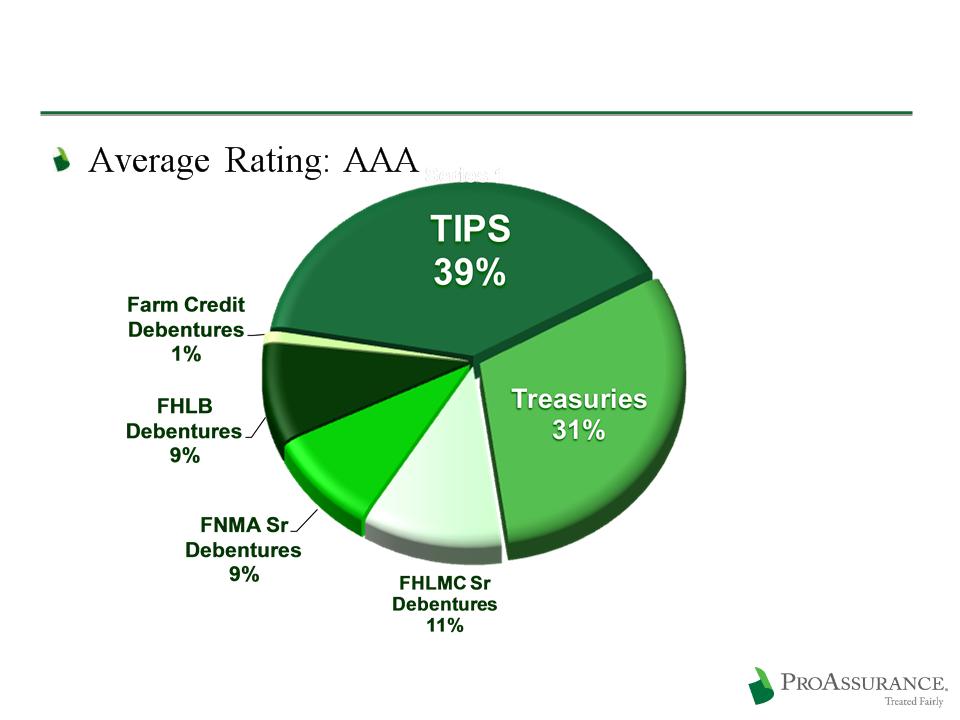
Treasury/GSE: $221 Million
63
12/31/2009
64
12/31/2009
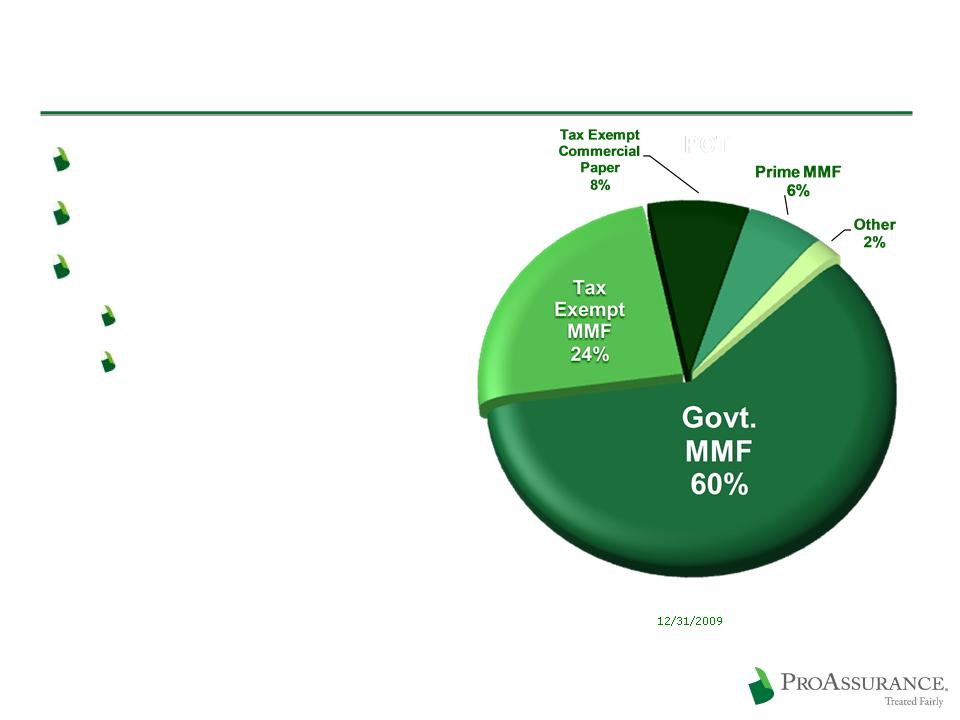
Portfolio Overview: Short Term
$187 Million
Rated A1/P1 or better
Money Markets:
Moody’s: Aaa
S&P: AAA
65
BOLI: $65 Million
Weighted average rating
Moody’s: AA3
S&P: AA-
A. M. Best: A+
66