Attached files
| file | filename |
|---|---|
| EX-23 - EXHIBIT 23 - KONA GRILL INC | c97245exv23.htm |
| EX-21 - EXHIBIT 21 - KONA GRILL INC | c97245exv21.htm |
| EX-31.1 - EXHIBIT 31.1 - KONA GRILL INC | c97245exv31w1.htm |
| EX-31.2 - EXHIBIT 31.2 - KONA GRILL INC | c97245exv31w2.htm |
| EX-32.1 - EXHIBIT 32.1 - KONA GRILL INC | c97245exv32w1.htm |
| EX-32.2 - EXHIBIT 32.2 - KONA GRILL INC | c97245exv32w2.htm |
| EX-4.10 - EXHIBIT 4.10 - KONA GRILL INC | c97245exv4w10.htm |
Table of Contents
UNITED STATES
SECURITIES AND EXCHANGE COMMISSION
SECURITIES AND EXCHANGE COMMISSION
WASHINGTON, D.C. 20549
FORM 10-K
(Mark one)
| þ | ANNUAL REPORT PURSUANT TO SECTION 13 OR 15(d) OF THE SECURITIES EXCHANGE ACT OF 1934 |
For the fiscal year ended December 31, 2009
or
| o | TRANSITION REPORT PURSUANT TO SECTION 13 OR 15(d) OF THE SECURITIES EXCHANGE ACT OF 1934 |
For the transition period from to
Commission File Number 001-34082
Kona Grill, Inc.
(Exact Name of Registrant as Specified in Its Charter)
| Delaware (State or other jurisdiction of incorporation or organization) |
20-0216690 (I.R.S. Employer Identification No.) |
7150 East Camelback Road, Suite 220
Scottsdale, Arizona 85251
(480) 922-8100
(Address, including zip code, and telephone number, including area code, of principal executive offices)
Scottsdale, Arizona 85251
(480) 922-8100
(Address, including zip code, and telephone number, including area code, of principal executive offices)
Securities registered pursuant to Section 12(b) of the Act:
| Title of Each Class | Name of Each Exchange on Which Registered | |
| Common Stock, par value $0.01 per share | NASDAQ Global Market |
Securities registered pursuant to Section 12(g) of the Act:
None
None
Indicate by check mark if the registrant is a well-known seasoned issuer, as defined in Rule
405 of the Securities Act. Yes o No þ
Indicate by check mark if the registrant is not required to file reports pursuant to Section
13 or Section15(d) of the Act. Yes o No þ
Indicate by check mark whether the registrant (1) has filed all reports required to be filed
by Section 13 or 15(d) of the Securities Exchange Act of 1934 during the preceding 12 months (or
for such shorter period that the registrant was required to file such reports), and (2) has been
subject to such filing requirements for the past 90 days. Yes þ No o
Indicate by check mark whether the registrant has submitted electronically and posted on its
corporate Web site, if any, every Interactive Data File required to be submitted and posted
pursuant to Rule 405 of Regulation S-T (§ 232.405 of this chapter) during the preceding 12 months
(or for such shorter period that the registrant was required to submit and post such files). Yes o No o
Indicate by check mark if disclosure of delinquent filers pursuant to Item 405 of Regulation
S-K (§229.405 of this chapter) is not contained herein, and will not be contained, to the best of
registrant’s knowledge, in definitive proxy or information statements incorporated by reference in
Part III of this Form 10-K or any amendment to this Form 10-K. o
Indicate by check mark whether the registrant is a large accelerated filer, an accelerated
filer, a non-accelerated filer, or a smaller reporting company. See definitions of “large
accelerated filer,” “accelerated filer,” and “smaller reporting company” in Rule 12b-2 of the
Exchange Act. (Check one):
| Large accelerated filer o | Accelerated filer o | Non-accelerated filer þ | Smaller reporting company o |
Indicate by check mark whether the registrant is a shell company (as defined in Rule 12b-2 of
the Exchange Act). Yes o No þ
The aggregate market value of common stock held by non-affiliates of the registrant as of the
last business day of the registrant’s most recently completed second fiscal quarter, June 30, 2009,
was $24,432,000, calculated based on the closing price of the registrant’s common stock as reported
by the NASDAQ Global Market. For purposes of this computation, all officers, directors, and 10%
beneficial owners of the registrant are deemed to be affiliates. Such determination should not be
deemed to be an admission that such officers, directors, or 10% beneficial owners are, in fact,
affiliates of the registrant.
As of March 1, 2010, there were 9,160,445 shares of the registrant’s common stock outstanding.
Documents Incorporated by Reference
Portions of the registrant’s definitive proxy statement for the 2010 Annual Meeting of
Stockholders are incorporated by reference into Part III of this report.
KONA GRILL, INC.
Annual Report on Form 10-K
For the Year Ended December 31, 2009
Annual Report on Form 10-K
For the Year Ended December 31, 2009
TABLE OF CONTENTS
| PART I |
||||||||
| 1 | ||||||||
| 12 | ||||||||
| 18 | ||||||||
| 19 | ||||||||
| 19 | ||||||||
| 19 | ||||||||
| PART II |
||||||||
| 20 | ||||||||
| 22 | ||||||||
| 23 | ||||||||
| 38 | ||||||||
| 38 | ||||||||
| 38 | ||||||||
| 38 | ||||||||
| 39 | ||||||||
| PART III |
||||||||
| 39 | ||||||||
| 39 | ||||||||
| 39 | ||||||||
| 39 | ||||||||
| 39 | ||||||||
| PART IV |
||||||||
| 40 | ||||||||
| 42 | ||||||||
| F-1 | ||||||||
| Exhibit 4.10 | ||||||||
| Exhibit 21 | ||||||||
| Exhibit 23 | ||||||||
| Exhibit 31.1 | ||||||||
| Exhibit 31.2 | ||||||||
| Exhibit 32.1 | ||||||||
| Exhibit 32.2 | ||||||||
Statements Regarding Forward-Looking Statements
The statements contained in this report on Form 10-K that are not purely historical are
forward-looking statements within the meaning of applicable securities laws. Forward-looking
statements include statements regarding our “expectations,” “anticipation,” “intentions,”
“beliefs,” or “strategies” regarding the future. Forward-looking statements relating to our future
economic performance, plans and objectives for future operations, and projections of sales and
other financial items are based on our beliefs as well as assumptions made by and information
currently available to us. Actual results could differ materially from those currently anticipated
as a result of a number of factors, including those discussed in Item 1A, “Risk Factors.”
Table of Contents
PART I
| Item 1. | Business |
Overview
Kona Grill, Inc. (referred to herein as the “Company” or “we,” “us,” and “our”) owns and
operates 24 upscale casual dining restaurants in 15 states. Kona Grill restaurants offer fresh
high quality food, personalized service, and an upscale contemporary ambiance that create an
exceptional, yet affordable dining experience that we believe exceeds many traditional casual
dining restaurants with whom we compete. Our high-volume upscale casual restaurants feature a
diverse selection of flavorful American food, internationally influenced appetizers and entrees and
an extensive selection of award-winning sushi. Our menu items also incorporate over 40 signature
sauces and dressings that we make from scratch, creating broad based appeal for the lifestyle and
taste trends of a diverse group of guests. Our freshly prepared menu offerings are complemented by
a full service bar offering a broad assortment of wines, specialty drinks, and beers. Our menu is
mostly standardized for all of our restaurants allowing us to deliver consistent, high quality
meals.
Our restaurants accommodate a range of approximately 260 to 300 guests and are comprised of
multiple dining areas that incorporate modern design elements to create an upscale ambiance that
reinforces our high standards of food and service. Our main dining area, full-service bar, outdoor
patio, and sushi bar provide a choice of atmospheres and a variety of environments designed to
attract new guests and encourage repeat visits from regular guests. We locate our restaurants in
high-activity areas such as retail centers, shopping malls, and lifestyle centers that are situated
near commercial office space and residential housing to attract guests throughout the day. Our
restaurants are designed to satisfy our guests’ dining preferences during lunch, dinner, and
non-peak periods such as late afternoon and late night.
We believe that the portability of our concept has been successfully demonstrated in a variety
of markets across the United States. Our primary growth objective is to gradually expand the Kona
Grill concept in selected markets over the next several years. We intend to continue developing
Kona Grill restaurants in high quality, densely populated areas in both new and existing markets.
During 2009, we opened four restaurants in Richmond, Virginia; Woodbridge, New Jersey; Eden
Prairie, Minnesota; and Tampa, Florida. We plan to open one new restaurant in Baltimore, Maryland
during 2010.
We believe that our vast array of menu offerings and generous portions combined with an
estimated average check per guest during 2009 of approximately $23.90 offers our guests an
attractive price-value proposition. This value proposition, coupled with our multiple daypart
model and exceptional service, has created an attractive business model. Furthermore, our
restaurant model provides us with considerable growth opportunities to expand the Kona Grill
concept. We believe our concept has the potential for over 100 restaurants nationwide.
Our executive offices are located at 7150 East Camelback Road, Suite 220, Scottsdale, Arizona
85251, and our telephone number is (480) 922-8100. Our website is located at www.konagrill.com.
Through our website, we make available free of charge our annual report on Form 10-K, quarterly
reports on Form 10-Q, current reports on Form 8-K, proxy statements, and any amendments to those
reports filed or furnished to the Securities and Exchange Commission. These reports are available
as soon as reasonably practicable after we electronically file these reports with the SEC. We also
post on our website the charters of our Audit, Compensation, and Nominating Committees; Code of
Business Conduct and Ethics and Code of Ethics for the CEO and Senior Financial Officers; and any
other corporate governance materials contemplated by SEC or NASDAQ regulations. These documents
are also available in print to any stockholder requesting a copy from our corporate secretary at
our principal executive offices.
Our History
Our predecessor concept was a sushi restaurant that commenced operations during 1994. As our
guests frequently requested additional selection and diversity in our menu offerings, we developed
a successor restaurant concept offering sushi plus innovative menu selections with mainstream
appeal that became Kona Grill. We opened the first Kona Grill restaurant in Scottsdale, Arizona
during 1998. We sold the predecessor restaurant during 2002 to focus on growing the Kona Grill
concept.
1
Table of Contents
Competitive Strengths
The restaurant business is intensely competitive with respect to food quality, price-value
relationships, ambiance, service and location. We believe that the key strengths of our business
include the following:
| • | Innovative Menu Selections with Mainstream Appeal. We offer a menu of freshly prepared,
high quality food that includes a diverse selection of mainstream American selections, a
variety of appetizers and entrees with an international influence, and award-winning sushi
to appeal to a wide range of tastes, preferences, and price points. We prepare our dishes
from scratch using original recipes with generous portions and creative and appealing
presentations that adhere to standards that we believe are much closer to fine dining than
typical casual dining. Our more than 40 proprietary sauces and dressings create memorable
flavor profiles and further differentiate our menu items. With an average check during
2009 of approximately $23.90 per guest ($16.35 per guest, excluding alcoholic beverages) we
believe we provide an exceptional price-value proposition that helps create a lasting
relationship between Kona Grill and our guests. |
| • | Distinctive Upscale Casual Dining Experience. Our upscale casual dining concept
captures some of the best elements of fine dining including a variety of exceptional food,
impeccable service, and an extensive wine and drink list, and combines them with more
casual qualities, like a broad menu with attractive price points and a choice of
environments to fit any dining occasion, enabling us to attract a broad guest demographic.
Our innovative menu, personalized service, and contemporary restaurant design blend
together to create our upscale casual dining experience. We design our restaurants with a
unique layout and utilize modern, eye-catching design elements such as our signature
saltwater aquarium stocked with bright and colorful exotic fish, plants, and coral. Our
multiple dining areas provide our guests with a number of distinct dining environments and
atmospheres to satisfy a range of occasions or dining preferences. Our open
exhibition-style kitchen and sushi bar further emphasize the quality and freshness of our
food that are the cornerstones of our unique upscale casual dining concept. |
| • | Significant Bar and Happy Hour Business. Our high-energy bar and patio offer a
distinctive atmosphere where guests can enjoy one of our many alcoholic beverage offerings,
while providing a place to be seen and see others. Our patio is a popular place for
younger clientele and industry professionals to enjoy our high-value happy hour and reverse
happy hour offerings. Our patio, including our enclosed patio in colder climate locations,
provides a year-round sales opportunity and is a key driver in generating business during
non-traditional periods as sales during these non-peak periods accounted for 24% of our
total sales during 2009, which we believe provides us with a competitive advantage. |
| • | Personalized Guest Service. Our commitment to provide prompt, friendly, and efficient
service enhances our food, reinforces our upscale ambiance, and helps distinguish us from
other traditional casual dining restaurants. We train our service personnel to be cordial,
friendly, and knowledgeable about all aspects of the restaurant, especially the menu, which
helps us provide personalized guest service that is designed to ensure a pleasurable dining
experience and exceed our guests’ expectations. Our kitchen staff completes extensive
training to ensure that our dishes are precisely prepared to provide a consistent quality
of taste. We believe our focus on high service standards underscores our guest-centric
philosophy. |
| • | Multiple Daypart Model. Our appetizers, pizzas, entrees, and sushi offerings provide a
flexible selection of items that can be ordered individually or shared by our guests,
allowing guests to dine with us during traditional lunch and dinner meal periods as well as
in between customary dining periods such as in the late afternoon and late night. The
lively ambiance of our patio and bar areas provides an energetic social forum that attracts
a young professional clientele during these non-peak periods, as well as provides a unique
atmosphere for all of our guests to enjoy before or after they dine with us. Our sushi bar
provides another dining venue for our guests while offering a wide selection of health
conscious menu items. We believe that our ability to attract and satisfy guests throughout
the day distinguishes us from many other casual dining chains and helps us maximize sales
and leverage our fixed operating costs. |
| • | Attractive Unit Economics. During 2009, the average unit volume of our comparable base
restaurants was $3.9 million, or $547 per square foot. We believe our high average unit
volume helps us attract high-quality employees, leverage our fixed costs, and makes us a
desirable tenant for landlords. We expect the average cash investment for our new
restaurants to be approximately $2.5 million, net of landlord tenant improvement allowances
and excluding preopening expenses. Restaurants that are subject to ground leases and do
not receive landlord tenant improvement allowances may require a significantly higher cash
investment, but typically have lower average rental costs over the duration of the lease. |
2
Table of Contents
Growth Strategy
We believe that there are significant
opportunities to grow our sales and
increase our brand awareness throughout the United States. The following sets forth the key
elements of our growth strategy.
Pursue Disciplined Restaurant Growth
We adhere to a disciplined site selection process and intend to continue opening Kona Grill
restaurants in both new and existing markets that meet our demographic, real estate, and investment
criteria. In 2010, we plan to open one restaurant in Baltimore, Maryland to expand our nationwide
footprint and to continue to build awareness of our concept, while further establishing Kona Grill
as a national upscale casual brand. Beyond 2011 we expect the rate of new unit expansion to
moderately increase as the cost of capital becomes more affordable and quality new restaurant sites
become available. Our expansion plans do not involve any franchised restaurant operations.
We believe the location of our restaurants plays a key role in our long-term success and,
accordingly, we devote significant time and resources to analyzing each prospective site. We
maintain a disciplined and controlled site selection process involving our management team and
Board of Directors. Our site selection criteria for new restaurants include locating our
restaurants near high activity areas such as retail centers, shopping malls, and lifestyle and
entertainment centers. In addition, we focus on areas that have above-average density and income
populations, have high customer traffic throughout the day from thriving businesses or retail
markets, and are convenient for and appealing to business and leisure travelers.
Our growth strategy for developing new restaurants also includes expansion in existing
markets. Operating multiple restaurants in existing markets enables us to leverage our brand
equity as well as gain operating efficiencies associated with regional supervision, marketing,
purchasing, and hiring. In addition, our ability to hire qualified employees is enhanced in
markets where we are well-known and we are able to utilize existing associates in new restaurants.
Grow Existing Restaurant Sales
Our goal for existing restaurants is to improve unit volumes through ongoing local and social
marketing efforts designed to generate awareness and trial of our concept and increase the
frequency of guest visits. During 2009, restaurant sales for our comparable base restaurants,
which include those units open for more than 18 months, declined 9.3% compared to 2008 reflecting
lower overall guest traffic and reduction in the average guest check as a result of the challenging
macroeconomic environment. We expect same-store sales to improve as the U.S. economy recovers from
the current economic downturn.
We continue to implement initiatives designed to increase sales at our restaurants. During
2009, we rolled out our Perfect Pairings lunch offering to drive weekday lunch sales and support
our price-value proposition. During 2010, we plan to introduce several marketing and branding
initiatives, including the recent launch of our new Konavore loyalty and rewards program that
enables us to track guest usage patterns and drive higher guest frequency through unique offerings
to specific guests. We have also increased our presence in social marketing and interactive
advertising. We also launched an ongoing guest satisfaction survey across the entire brand to
provide valuable feedback our management team can respond to immediately. We believe we can
generate additional sales through these programs at a reasonable expense per restaurant.
3
Table of Contents
Leverage Depth of Existing Corporate Infrastructure
We believe that successful execution of our growth strategies will enable Kona Grill to be a
leading upscale casual dining restaurant operator in the United States. We continue to make
strategic investments in our corporate infrastructure including the hiring of senior personnel with
significant restaurant experience. We continue to implement information systems and tools to
enhance our business while ensuring that strong financial controls are in place to minimize risks
associated with our current growth strategy. As we continue to realize the benefits of our growth,
we believe that we will be able to leverage our investments in corporate personnel and information
systems and realize benefits from the increasing sales volume that our company generates.
Unit Economics
On average, we target a 35% net cash-on-cash return for our restaurants once they reach their
mature level of operations. Maturation periods vary from restaurant to restaurant, but generally
range from two to four years. We target our restaurants to achieve average annual unit volume of
$4.5 million following 24 months of operations. During 2009, the average unit volume of our
comparable base restaurants was approximately $3.9 million, or $547 per square foot. Recent trends
are lower than our targeted volume due to the current recession. The cash-based performance target
for our restaurant operations do not consider field supervision, corporate support expenses or
non-cash items such as depreciation and amortization; and do not represent a targeted return on
investment in our common stock.
Our investment costs for new restaurants vary significantly depending upon the type of lease
entered into, the amount of tenant improvement allowance we receive from landlords, and whether we
assume responsibility for the construction of the building. We expect the cash investment cost of
our prototype restaurant to be approximately $2.5 million, net of landlord tenant improvement
allowances between $0.7 million and $1.2 million, and excluding cash preopening expenses of
approximately $0.4 million.
We believe our high average unit volume helps us attract high-quality employees, leverage our
fixed costs, and makes us a desirable tenant for landlords. In addition, our ability to generate
sales throughout the day is a key strength of our concept. The following table depicts the amount
and percentage of contribution for each daypart of overall restaurant sales during 2009.
2009 Sales by Daypart
| Sales | Percent | |||||||
| (Dollars in thousands) | ||||||||
Lunch (Open to 3 p.m.) |
$ | 17,885 | 22 | % | ||||
Dinner (5 p.m. to 9 p.m.) |
44,055 | 54 | % | |||||
Non-Peak (3 p.m. to 5 p.m. and 9 p.m. to Close) |
19,155 | 24 | % | |||||
Total All Day |
$ | 81,095 | 100 | % | ||||
Menu
The Kona Grill menu offers guests a diverse selection of mainstream American dishes as well as
a variety of appetizers and entrees with an international influence, including a broad selection of
award-winning sushi. This broad menu is an important factor in our differentiation from the other
upscale casual dining competitors. We are well-known for our selection of over 40 signature sauces
and dressings. Our sauces and dressings distinguish and compliment our dishes, creating delicious
flavor profiles and artistic presentations for our guests. All of our menu items are prepared from
scratch using fresh high quality ingredients and adhere to food standards that we believe are much
closer to fine dining than typical casual dining.
Our menu features a selection of appetizers, soups, salads, pizzas, sandwiches, noodle dishes,
seafood, signature entrees, and desserts. We round out our menu with over 60 hand-made
award-winning sushi choices. Our appetizers include socially interactive items that can be eaten
individually or easily shared amongst guests such as our Chicken Satay, Avocado Egg Rolls and Sweet
and Spicy Shrimp. Our signature entrees feature our various sauces and offer guests generous
portions that are impressive in presentation and in taste. For example, our most
popular entrée is the Macadamia Nut Chicken served with our special shoyu-cream sauce
accompanied by wok-tossed vegetables and white cheddar mashed potatoes. Other favorites include
our Miso-Sake Marinated Sea Bass served with shrimp and pork fried rice and our Pan-Seared Ahi Tuna
served over steamed white rice with a sweet-chili sauce accompanied by sautéed spinach.
4
Table of Contents
We are also known for our broad assortment of sushi that includes traditional favorites as
well as distinct specialty items such as our Tuna Carpaccio made with thinly sliced tuna sashimi
topped with wasabi mayo and yuzu ponzu served with fresh arugula, or our Salmon Wasabi Sashimi
topped with fresh wasabi root and red onions and served with cucumber salad and yuzu ponzu sauce.
We have designed our sushi menu with a combination of both straight-forward and unintimidating
selections such as our California Roll as well as more sophisticated items such as our Spider Roll
made with soft shell crab, avocado, and cucumber wrapped in seaweed and soy paper and served with
eel sauce. Our menu, coupled with our sushi selections, offers ample choices for health conscious
guests, which the National Restaurant Association expects will continue to be a point of focus for
consumers in the future.
Each of our restaurants has a dedicated kitchen staff member, whom we refer to as our saucier,
to oversee the preparation of our more than 40 unique sauces and dressings that are made fresh from
scratch using only high-quality ingredients and fresh products. Each sauce is designed according
to a proprietary recipe for a specific menu item and includes unique flavors and combinations such
as our honey cilantro, shoyu-cream, and spicy aioli dipping sauces, and our sesame-soy and honey
dijon dressings. We believe that our distinctive sauces and dressings provide a unique flavor
profile, which further distinguishes Kona Grill from its competitors. Our flavorful sauces and
dressings also enhance our guests’ overall dining experience by allowing them to not only
experience new tastes but to also share their favorite sauces with others, helping to create
customer loyalty and a socially interactive dining experience.
The versatility of our menu enables us to provide guests with dishes that can be enjoyed
outside of the traditional lunch and dinner meal periods as well as to serve guests for a variety
of dining occasions, including everyday dining, business lunches, social gatherings and special
occasions. Furthermore, each restaurant offers a separate children’s menu with selections
appealing to our youngest guests.
Menu prices range from $4.00 to $9.50 for appetizers and soups, $6.50 to $12.50 for salads,
$8.25 to $8.75 for our Perfect Pairings menu, $7.75 to $31.50 for sandwiches, pizza, seafood and
entrees, and $4.00 to $32.00 for our sushi selections ranging from a single sushi item up to our
assorted 18-piece Sashimi Platter. Based upon our innovative high-quality recipes, generous
portions, and flexible price points we believe we provide our guests exceptional value that allows
us to attract a diverse customer base and increase the frequency of dining visits to our upscale
casual restaurants.
In general our menu is consistent from location to location. We have added a local favorites
section designed to appeal to the local tastes of each of our restaurants’ guests. We review our
menu regularly and consider enhancements to existing items or the introduction of new items based
on customer feedback, which helps assure that we are meeting the needs of our guests.
Our restaurants also offer an extensive selection of domestic and imported bottled and draft
beers, over 25 selections of wines by the glass or bottle, and a broad selection of liquors and
specialty cocktail drinks. During our weekday happy hour (3 p.m. to 7 p.m.), reverse happy hour (9
p.m. to 11 p.m.), and Sunday happy hour we offer discounts on selected food and alcoholic beverage
items. Happy hour times may vary by location due to local liquor laws. Alcoholic beverage sales
represented approximately 32% of our total restaurant sales during 2009.
Decor and Atmosphere
We have created a uniform restaurant look and feel to adapt to varying real estate
opportunities. The layout of our restaurants focuses on joined spaces that create multiple
distinct dining areas for our guests while also maintaining an open atmosphere that allows our
guests to have a panoramic view of the entire restaurant without negatively impacting the specific
ambiance or dining occasion they desire.
5
Table of Contents
Our main dining room area offers a combination of booth seating and central tables of varying
sizes. Our full service bar area and covered outdoor patio offer not only a high-energy, socially
interactive area for our guests to enjoy appetizers or sushi while they wait to dine with us, but
also serves as a destination for many of our frequent guests who visit us during the late afternoon
and late night periods. Our bar area is strategically placed to ensure that families and other
groups that may prefer a quieter, more intimate dining experience are not disturbed. Our sushi bar
provides yet another dining alternative for singles, couples, and larger parties with more
sophisticated, health conscious, or adventuresome tastes.
We showcase our signature saltwater aquarium stocked with bright and colorful exotic fish,
plants, and coral in each of our restaurants. Our bars are made of granite and compliment our
mahogany finishes to enhance our contemporary design. We use a variety of directional lighting to
deliver a warm glow throughout our restaurants and we adjust our dining atmosphere throughout the
day by adjusting the lighting, music, and the choice of television programming in our bar and patio
areas. Our exhibition-style kitchens are brightly lit to display our kitchen staff at work. Our
covered outdoor patio areas seat an average of 60 guests. We utilize heaters suspended from our
roof structure to allow us to maximize the use of our patios throughout most of the year while
avoiding obtrusive heating mechanisms that could detract from our upscale ambiance. We have
enclosed the patio areas in certain of our colder climate locations allowing guests to utilize the
patio area throughout the year.
The exterior of our restaurants typically employ cultured stone and slate to create a highly
visible and attractive restaurant. We landscape our restaurants where appropriate and vary the
exterior design to coordinate with the surrounding area. We use accent lighting on trees and
directional lighting on our buildings to further increase the visual appeal of our restaurants.
Food Preparation, Quality Control, and Purchasing
We believe that we have some of the highest food quality standards in the industry. Our
standards are designed to protect our food products throughout the preparation process. We provide
detailed specifications to suppliers for our food ingredients, products, and supplies. We strive
to maintain quality and consistency in our restaurants through careful hiring, training and
supervision of personnel. Our restaurant general managers and executive chefs generally receive a
minimum of nine weeks of training while our other restaurant managers and sous chef receive seven
weeks of training. We have an annual recertification training for all employees and each employee
receives an operations manual relating to food and beverage preparation and restaurant operations.
We also instruct kitchen managers and staff on safety, sanitation, housekeeping, repair and
maintenance, product and service specifications, ordering and receiving products, and quality
assurance. All of our restaurant managers are compliant with Hazard Analysis and Critical Control
Point, or HACCP. We monitor minimum cook temperature requirements and conduct twice-a-day kitchen
and food quality inspections to further assure the safety and quality of all of the items we use in
our restaurants.
We are committed to purchasing high-quality ingredients for our restaurants while managing
costs. We use only the freshest ingredients and, as a result, we maintain only modest inventories.
We also have a nonexclusive contract with U.S. Foodservice, a national food distributor, to be the
primary supplier of our food. We have arrangements with local produce distributors and specialty
food suppliers who provide high-quality ingredients and perishable food products. We believe that
competitively priced alternative distribution sources are available should those channels be
necessary. We source all of our products and supplies with reputable and high-quality providers
that are capable of providing consistent, reliable distribution to all of our stores.
Our goal is to maximize our purchasing efficiencies and obtain the lowest possible prices for
our ingredients, products, and supplies, while maintaining the highest quality. Our corporate
purchasing manager coordinates our national supply contracts, negotiates prices for food supply
throughout all of our restaurants, monitors quality control and consistency of the food supplied to
our restaurants, and oversees delivery of food on a nationwide basis. In order to provide the
freshest ingredients and products, and to maximize operating efficiencies between purchase and
usage, we implemented an automated food cost and inventory system to assist each restaurant’s
kitchen manager in determining daily order requirements for food ingredients, products, and
supplies. The kitchen manager orders accordingly from approved suppliers, and all deliveries are
inspected to assure that the items received meet our quality specifications and negotiated prices.
6
Table of Contents
Expansion Strategy and Site Selection
We believe the location of our restaurants is critical to our long-term success and,
accordingly, we devote significant time and resources to analyzing each prospective site. Our
restaurant expansion strategy focuses primarily on penetrating new markets in major metropolitan
areas throughout the United States, as well as further penetrating existing markets. In general,
we prefer to open our restaurants in high-profile sites within specific trade areas with the
following considerations:
| • | suitable demographic characteristics, including residential and commercial population
density and above-average household incomes; |
| • | visibility; |
| • | high traffic patterns; |
| • | general accessibility; |
| • | availability of suitable parking; |
| • | proximity of shopping areas and office parks; |
| • | degree of competition and the revenue level of those competitors within the trade area;
and |
| • | general availability of restaurant-level employees. |
These sites generally include high-volume retail centers, regional malls, and lifestyle and
entertainment centers.
We thoroughly analyze each prospective site before presenting the site to our Real Estate
Committee, currently comprised of members of the Board of Directors, for review. Prior to
committing to a restaurant site and signing a lease, at least three members of our senior
management team and our Board of Directors visit the prospective site and evaluate the proposed
economics of the restaurant based on demographic data and other relevant criteria to assure that
the site will meet our return on investment criteria. In addition, we completed a comprehensive
custom guest profile study in December 2009 which is a precursor to a real estate site model
program to ensure even greater scrutiny when selecting new locations.
We lease all of our restaurant sites under lease terms that vary by restaurant; however, we
generally lease space (freestanding or in-line) for 10 to 20 years and negotiate at least two
five-year renewal options. Our rent structures vary from lease to lease, but generally provide for
the payment of both minimum base rent and contingent rent based on restaurant sales. We are also
generally responsible for our proportionate share of common area maintenance, property tax,
insurance, and other occupancy-related expenses.
We believe the high sales volumes of our restaurants make us an attractive tenant and provide
us with ample opportunities to obtain suitable leasing terms from landlords. As a result of the
locations we select, which are often in new retail center or shopping mall developments, our
restaurant development timeframes vary according to the landlord’s construction schedule and other
factors that are beyond our control. Once the site has been turned over to us, the typical
lead-time from commencement of construction to opening is approximately six months.
7
Table of Contents
Restaurant Operations
Executive and Restaurant Management
Our executive management team continually monitors restaurant operations to assure the quality
of products and services and the maintenance of facilities. Restaurant management and our
Scottsdale Support Center institute procedures to enhance efficiency, reduce costs and provide
centralized support systems. Our Senior Vice President of Operations and District Managers have
primary responsibility for managing our restaurants and participate in
analyzing restaurant-level performance and strategic planning. We employ four district
managers who report directly to our Senior Vice President of Operations and who are each
responsible for overseeing the restaurants in a specific region. The district managers’
responsibilities include supporting the general managers and helping each general manager achieve
the sales and cash flow targets for their restaurant as well as providing insight for decision
making in such areas as food and beverage, people development, and systems to enhance the
efficiency of our operations. As we expand our operations, we expect to hire additional district
managers who will each oversee six to eight restaurants. In addition, our support center team
includes an executive chef and sushi chef who help educate, coach, and develop kitchen personnel,
implement systems to improve the efficiency of our kitchen operations, and develop new menu
offerings.
Our typical restaurant management team consists of a general manager, assistant general
manager, two front-of-the-house managers, executive chef, sous chef, and sushi chef. Our
restaurants employ on average approximately 75 non-management employees, many of whom work
part-time. The general manager is responsible for the day-to-day operations of the restaurant,
including the hiring, training, development of personnel, execution of local marketing programs,
and operating results. The chefs are responsible for overseeing the preparation of our menu and
sushi items, maintaining product quality, and closely monitoring food costs and department labor
costs. We also employ a kitchen staff member who is dedicated to the preparation of our signature
sauces and dressings.
Training
In order to maintain quality and consistency in each of our restaurants, we carefully train
and supervise restaurant personnel and adhere to high standards related to personnel performance,
food and beverage preparation, and maintenance of our restaurants. All of our restaurant personnel
participate in both initial and ongoing training programs. Each restaurant general manager,
assistant general manager, front-of-the-house manager, and kitchen and sushi chef completes a
formal training program that is comprised of a mix of classroom and on-the-job instruction.
Typical programs for general managers and executive chefs provide at least nine weeks of training
that may include a rotation to different restaurants throughout the country. Typical programs for
other managers provide seven weeks of training and may involve work in our other restaurants and
cross training of various duties. The training covers all aspects of management philosophy and
overall restaurant operations, including supervisory skills, operating and performance standards,
accounting procedures, and employee selection and training necessary for top-quality restaurant
operations. The training programs also involve intensive understanding and testing of our menu,
the ingredients of our various menu items, and other key service protocols. In addition, our
hourly staff go through a series of in-depth interactive training for their positions.
We implement these programs by hiring dedicated corporate personnel as well as designate
high-performing existing restaurant personnel to assist in training. Our training personnel are
involved in training for both new employees hired in anticipation of new restaurant openings as
well as for ongoing training in existing restaurants. When we open a new restaurant, we provide
training to restaurant personnel in every position for several weeks prior to opening to assure the
smooth and efficient operation of the restaurant from the first day it opens to the public. Prior
to opening a new restaurant, certain of our newly-hired restaurant personnel are staffed in
existing restaurants to learn the operational aspects of a Kona Grill and to obtain on the job
instruction.
Recruitment and Retention
Our future growth and success is highly dependent upon our ability to attract, develop, and
retain qualified individuals who are capable of successfully managing our high-volume, upscale
casual restaurants. We believe that our unit volume, the image and atmosphere of the Kona Grill
concept, and our career advancement and employee benefit programs enable us to attract high quality
management and restaurant personnel. We offer our restaurant management personnel competitive
wages and benefits, including medical insurance and participation in our 401(k) plan with a company
match. We motivate and prepare our restaurant personnel by providing them with opportunities for
increased responsibility and advancement. Furthermore, the management team of each restaurant
share in a bonus tied to the sales and overall profitability of their restaurant. We believe that
our compensation package for managers and restaurant employees is comparable to those provided by
other upscale casual restaurants. We believe our compensation policies help us attract quality
personnel.
8
Table of Contents
Information Systems
We believe that our management information systems enable us to increase the speed and
accuracy of order-taking and pricing, efficiently schedule labor to better serve guests, monitor
labor costs, assist in product purchasing and menu mix management, promptly access financial and
operating data, and improve the accuracy and efficiency of store-level information and reporting.
We utilize an integrated information system to manage the flow of information within each of
our restaurants and between each restaurant and the corporate office. This system includes an
Aloha point-of-sales (POS) local area network that helps facilitate the operations of the
restaurant by recording sales transactions and printing orders in the appropriate locations within
the restaurant. Additionally, we utilize the POS system to authorize, batch, and transmit credit
card transactions, record employee time clock information, and produce a variety of management
reports. Our point of sale system is integrated with food cost and labor scheduling software as
well as our financial reporting system and incorporates a redundancy and back-up emergency
operating plan on a temporary basis if the system experiences downtime.
We transmit electronically to the support center on a daily basis select information that is
captured from the POS system. This information system enables senior management to monitor
operating results with daily and weekly sales analysis, detailed labor and food cost information,
and comparisons between actual and budgeted operating results. We anticipate continually updating
both our restaurant information systems and our corporate office information systems to enhance our
operations. We believe our information systems are secure and scalable as we continue to build our
organization.
Advertising and Marketing
Our ongoing advertising and marketing strategy consists of loyalty and reward programs, social
marketing, interactive advertising, selected outdoor and print mediums, various public relations
activities, direct mail, and word-of-mouth recommendations. We believe that these mediums are a
key component in driving guest trial and usage. During 2009, our marketing and advertising
expenditures were $1.1 million, or 1.3% of restaurant sales. We expect to continue to invest in
marketing, branding and advertising efforts, primarily in connection with driving comparable
restaurant sales and supporting new restaurant openings.
We implement a coordinated public relations effort in conjunction with each new restaurant
opening. Approximately 60 days before a scheduled restaurant opening, we collaborate with the
local media to publicize our restaurant and generate awareness of our brand. This effort is
usually supplemented by targeted direct mail campaigns, social marketing, and other marketing
efforts, including hosting a high profile event for a local charity as part of our preopening
practice activities that also serves to introduce our concept to the local market. In addition, we
use our website, www.konagrill.com, to help increase our brand awareness as well as gift card
sales.
Competition
The restaurant industry is highly competitive. Key competitive factors in the industry
include the taste, quality, and price of the food products offered, quality and speed of guest
service, brand name identification, attractiveness of facilities, restaurant location, and overall
dining experience.
We believe we compete favorably with respect to each of these factors, as follows:
| • | We offer a diverse selection of fresh high quality mainstream American dishes as well as
a variety of appetizers and entrees with an international influence, including an extensive
selection of sushi items; |
| • | We appeal to multiple demographic and psychographic profiles; |
| • | We strive to maintain quality and consistency in each of our restaurants through the
careful training and supervision of restaurant personnel and adherence to high standards
related to personnel performance, food and beverage preparation, and maintenance of our
restaurants; |
| • | Our innovative menu with attractive price points, personalized service, and contemporary
restaurant design with multiple environments blend together to create our upscale casual
dining experience and enables us to attract a broad guest demographic. |
9
Table of Contents
Although we believe we compete favorably with respect to each of these factors, there are a
substantial number of restaurant operations that compete directly and indirectly with us, many of
which have significantly greater financial resources, higher revenue, and greater economies of
scale. The restaurant business is often affected by changes in consumer tastes and discretionary
spending patterns; national and regional economic and public safety conditions; demographic trends;
weather conditions; the cost and availability of raw materials, labor, and energy; purchasing
power; governmental regulations; and local competitive factors. Any change in these or other
related factors could adversely affect our restaurant operations. Accordingly, we must constantly
evolve and refine the critical elements of our restaurant concept over time to protect their
longer-term competitiveness. Additionally, there is competition for highly qualified restaurant
management employees and for attractive locations suitable for upscale, high volume restaurants.
Trademarks
We have registered the service mark “Kona Grill” and the description “East Meets West. They
Party” with the United States Patent and Trademark Office. We believe that our trademarks and
other proprietary rights, such as our unique menu offerings and proprietary sauce recipes, have
significant value and are important to the marketing of our restaurant concept. We have in the
past and expect to continue to protect vigorously our proprietary rights. We cannot predict,
however, whether steps taken by us to protect our proprietary rights will be adequate to prevent
misappropriation of these rights or the use by others of restaurant features based upon, or
otherwise similar to, our concept. It may be difficult for us to prevent others from copying
elements of our concept and any litigation to enforce our rights will likely be costly. In
addition, other local restaurant companies with names similar to ours may try to prevent us from
using our marks in those locales.
Government Regulation
Each of our restaurants is subject to licensing and regulation by state and local departments
and bureaus of alcohol control, health, sanitation, zoning, and fire and to periodic review by
state and municipal authorities for areas in which the restaurants are located. In addition, we
are subject to local land use, zoning, building, planning, and traffic ordinances and regulations
in the selection and acquisition of suitable sites for developing new restaurants. Delays in
obtaining, or denials of, or revocation or temporary suspension of, necessary licenses or approvals
could have a material adverse impact on our development of restaurants.
Alcoholic beverage control regulations require each of our restaurants to apply to a state
authority and, in certain locations, county and municipal authorities for a license and permit to
sell alcoholic beverages on the premises. Typically, licenses must be renewed annually and may be
subject to penalties, temporary suspension or revocation for cause at any time. Alcoholic beverage
control regulations impact many aspects of the daily operations of our restaurants, including the
minimum age of patrons and employees, hours of operation, inventory control and handling, and
storage and dispensing of alcoholic beverages. We have not encountered any material problems
relating to alcoholic beverage licenses or permits to date. The failure of a restaurant to obtain
or retain its liquor license would adversely affect that restaurant’s operations and profitability.
We are subject to dram shop statutes in most of the states in which we operate. Those
statutes generally provide a person who has been injured by an intoxicated person the right to
recover damages from an establishment that wrongfully served alcoholic beverages to such person.
We carry liquor liability coverage as part of our existing comprehensive general liability
insurance which we believe is consistent with coverage carried by other companies in the restaurant
industry of similar size and scope of operations. Even though we carry liquor liability insurance,
a judgment against us under a dram shop statute in excess of our liability coverage could have a
material adverse effect on our operations.
Our operations are also subject to federal and state laws governing such matters as wages,
working conditions, citizenship requirements, and overtime. Some states have set minimum wage
requirements higher than the current federal level. A significant number of hourly personnel at
our restaurants are paid at rates related to state and federal
minimum wage laws and, accordingly, state minimum wage increases effective during 2010 and the
federal minimum wage increase in July 2009 have increased our labor costs. Increases in the
minimum wage rate or the cost of workers’ compensation insurance, changes in tip-credit provisions,
employee benefit costs (including costs associated with mandated health insurance coverage), or
other costs associated with employees could adversely affect our operating results. To our
knowledge, we are in compliance in all material respects with all applicable federal, state, and
local laws affecting our business.
10
Table of Contents
Employees
As of February 12, 2010, we employed approximately 1,908 people of whom approximately 1,876
worked in our restaurants and 32 were corporate management and staff personnel. None of our
employees are covered by a collective bargaining agreement with us. We have never experienced a
major work stoppage, strike, or labor dispute. We consider our relations with our employees to be
favorable.
Executive Officers
The following table sets forth certain information regarding our executive officers:
| Name | Age | Position | ||||
Marc A. Buehler
|
40 | President, Chief Executive Officer and Director | ||||
Mark S. Robinow
|
53 | Executive Vice President, Chief Financial Officer and Secretary | ||||
Larry J. Ryback
|
41 | Senior Vice President of Operations | ||||
Marc A. Buehler joined our company as Chief Executive Officer and President in November 2009
and was also appointed as a member of our Board of Directors. Prior to joining our company, Mr.
Buehler was the Chief Executive Officer of LS Management, Inc., the owner and operator of the Lone
Star Steakhouse & Saloon/Texas Land and Cattle Steak House restaurant concepts, as well as Lone
Star Business solutions, where he served from July 2007 to May 2009. From July 2002 to July 2007,
Mr. Buehler worked at Romacorp, which operates and franchises more than 200 Tony Roma’s casual
dining locations, as the Vice President of Marketing and was promoted to Chief Executive Officer,
President, and Director of Romacorp during July 2006. Prior to that, Mr. Buehler served as Vice
President of Marketing at Eateries, Inc. from March 1999 to July 2002 and Marketing Manager at
Applebee’s International, Inc. from February 1996 to March 1999. Mr. Buehler also serves as a Board
Member of Share Our Strength and is a co-chairperson of the National Restaurant Association’s
Marketing Executives Group. In addition he is a member of the Young Presidents’ Organization.
Mark S. Robinow has served as our Executive Vice President, Chief Financial Officer, and
Secretary since October 2004. Prior to joining our company, Mr. Robinow served as the Chief
Financial Officer of Integrated Decisions and Systems, Inc. (IDeaS) from July 2000 until October
2004. Mr. Robinow served as the Senior Vice President and Chief Financial Officer of Rainforest
Cafe, Inc. from November 1995 until January 2000. Mr. Robinow served as the Chief Financial
Officer of Edina Realty, Inc. from 1993 until 1995, and as Chief Financial Officer, Secretary, and
Treasurer of Ringer Corporation from 1986 until 1993. Mr. Robinow also served as a senior auditor
with Deloitte & Touche from 1980 until 1983. Mr. Robinow is a Certified Public Accountant
(inactive license holder).
Larry J. Ryback was appointed as Senior Vice President of Operations in February 2010. Mr.
Ryback oversees the day-to-day restaurant operations for our brand, culinary operations, training
and recruiting. Mr. Ryback brings more than 20 years of restaurant operations experience to our
company. Prior to joining our company, Mr. Ryback served as the President and Chief Operating
Officer of Redstone American Grill, Inc., a $35 million privately held company with five
high-volume, upscale restaurants in four states. Before joining Redstone during 2005, Mr. Ryback
spent 10 years with Champps Entertainment in various operations roles including three years as a
Regional Vice President of Operations overseeing 26 restaurants that together generated over $130
million in revenue.
11
Table of Contents
| Item 1A. | Risk Factors |
Risks Related to Our Business
We have a history of losses and we may never achieve profitability.
We incurred net losses during each of the last five years. We forecast that we will incur net
losses for at least the next year, and possibly longer. We expect that our expenses during the
next year will increase as we build and open at least one new restaurant. We may find that these
efforts are more expensive than we currently anticipate or that our expansion efforts do not result
in proportionate increases in our sales, which would further increase our losses. We cannot
predict whether we will be able to achieve profitability in the future.
We may require additional capital in the future as a result of changes in our restaurant operations
or growth plans, and our inability to raise such capital could harm our operations and restrict our
growth.
Changes in our restaurant operations, acceleration of our restaurant expansion plans, lower
than anticipated restaurant sales, increased food or labor costs, increased property expenses, or
other events, including those described in this report, may cause us to seek additional debt or
equity financing on an accelerated basis. Financing may not be available to us on acceptable
terms, or at all, and our failure to raise capital when needed could negatively impact our
restaurant growth plans as well as our financial condition and results of operations. Additional
equity financing, if available, will be dilutive to the holders of our common stock. Debt
financing may involve significant cash payment obligations, covenants, and financial ratios that
may restrict our ability to operate and grow our business, and would cause us to incur additional
interest expense and financing costs.
Unexpected expenses and low market acceptance of our restaurant concept could adversely affect the
profitability of restaurants that we open in new markets.
As part of our expansion strategy, we have opened and plan to open restaurants in markets in
which we have no prior operating experience and in which our brand may not be well-known. These
new markets may have different competitive conditions, consumer tastes, and discretionary spending
patterns than restaurants in our existing markets. As a result, we may incur costs related to the
opening, operation, and promotion of these new restaurants that are greater than those incurred in
markets with longer operating history. As a result of these factors, sales at restaurants opening
in new markets may take longer to achieve average unit volumes comparable with our existing
restaurants, if at all, which would adversely affect the profitability of those new restaurants.
We are dependent upon high levels of consumer traffic at the sites where our restaurants are
located and any adverse change in consumer activity could negatively affect our restaurant sales
and may require us to record an impairment charge for restaurants performing below expectations.
Our restaurants are primarily located in high-activity areas such as retail centers, shopping
malls, and lifestyle centers. We depend on high consumer traffic rates at these centers to attract
guests to our restaurants. In general, such visit frequencies are significantly affected by many
factors, including national, regional, or local economic conditions, anchor tenants closing in
retail centers or shopping malls in which we operate, changes in consumer preferences or shopping
patterns, higher frequency of online shopping, changes in discretionary consumer spending,
increasing gasoline prices, or otherwise. If visitor rates to these centers decline, our unit
volumes could decline and adversely affect our results of operations, including recording an
impairment charge for restaurants that are performing below expectations. During 2009, we recorded
$16.9 million in asset impairment charges for six underperforming restaurants. We may be required
to record impairment charges in the future if certain restaurants perform below expectations.
12
Table of Contents
We have a limited operating history and a limited number of restaurants upon which to evaluate our
company, and you should not rely on our history as an indication of our future results.
We currently operate 24 restaurants, more than half of which have operated for less than four
years. Consequently, the results we have achieved to date with a relatively small number of
restaurants may not be indicative of those restaurants’ long-term performance or the potential
performance of new restaurants. A number of factors historically have affected and are likely to
continue to affect our average unit volumes and comparable restaurant sales, including the
following:
| • | our ability to execute effectively our business strategy; |
||
| • | our ability to successfully select and secure sites for our Kona Grill concept; |
||
| • | the operating performance of new and existing restaurants; |
||
| • | competition in our markets; |
||
| • | consumer trends; and |
||
| • | changes in political or economic conditions. |
Our average unit volume and same-store sales have declined in recent years. Average unit volumes
for two of our restaurants opened within the last four years were significantly below the average
unit volume of our comparable restaurant base. In addition, we closed our restaurant in Naples,
Florida in September 2008 due to low sales volume. Changes in our average unit volumes and
comparable restaurant sales could cause the price of our common stock to fluctuate substantially.
Disruptions in the capital and credit markets may adversely affect our business, including the
availability and cost of funding, which could adversely affect our results of operations, cash
flows, and financial condition.
Our growth strategy depends upon the capital markets to expand our operations. Recent
disruptions in the capital and credit markets could adversely affect our ability to borrow money
from banks or other potential lenders. Our access to funds under any potential credit facility
will depend on the ability of the banks or other lenders to commit to lend funds to us. In the
event we enter into a credit facility with banks or other lenders, those parties may not be able to
meet their funding commitments to us if they experience shortages of capital or if they experience
excessive volumes of borrowing requests from us and other borrowers within a short period of time.
Longer term disruptions in the capital and credit markets as a result of uncertainty, changing
or increased regulation, or failures of significant financial institutions could adversely affect
our access to capital. Any long-term disruption could require us to take measures to conserve cash
until the markets stabilize or until alternative credit arrangements or other funding for our
business can be arranged. Such measures could result in deferring capital expenditures or altering
our growth strategy to reduce the opening of new restaurants.
Our future operating results may fluctuate significantly due to our limited number of existing
restaurants and the expenses required to open new restaurants.
We currently operate 24 restaurants, four of which opened during 2009, and we expect to open
one restaurant during 2010. The capital resources required to develop each new restaurant are
significant. We estimate that the cost of opening a new Kona Grill restaurant currently ranges
from $3.2 million to $3.7 million, exclusive of landlord tenant improvement allowances and
preopening expenses and assuming that we do not purchase the underlying real estate. Actual costs
may vary significantly depending upon a variety of factors, including the site and size of the
restaurant and conditions in the local real estate and employment markets. The combination of our
relatively small number of existing restaurants, the significant investment associated with each
new restaurant, and the average unit volumes of our new restaurants may cause our results of
operations to fluctuate significantly, and poor operating results at any one restaurant or a delay
or cancellation in the planned opening of a restaurant could materially affect
our company, making the investment risks related to any one location much larger than those
associated with most other restaurant chains.
13
Table of Contents
Our future expansion in existing markets may cause sales in some of our existing restaurants to
decline.
Our future growth strategy may include opening new restaurants in our existing markets. We
may be unable to attract enough guests to our new restaurants for them to operate profitably. In
addition, guests to our new restaurants may be former guests of one of our existing restaurants in
that market, which may reduce guest visits and sales at those existing restaurants, adversely
affecting our results of operations.
Our ability to open new restaurants may be adversely affected by delays or problems associated with
securing suitable restaurant locations and leases and by other factors, some of which are beyond
our control and the timing of which is difficult to forecast accurately.
Due in part to the unique nature of each proposed restaurant location, we cannot predict the
timing or ultimate success of our site selection process. Our ability to open new restaurants
depends upon a number of factors, many of which are beyond our control, including the following:
| • | the availability and cost of suitable restaurant locations for development and our
ability to compete successfully for those locations; |
| • | the availability of adequate financing; |
| • | cash flow generated by our existing restaurants; |
| • | the timing of delivery of leased premises from our landlords so we can commence our
build-out construction activities; |
| • | construction and development costs; |
| • | labor shortages or disputes experienced by our landlords or outside contractors; |
| • | unforeseen engineering or environmental problems with the leased premises; |
| • | our ability to secure governmental approvals and permits, including liquor licenses,
construction permits, and occupancy permits; |
| • | weather conditions or natural disasters; and |
| • | general economic conditions. |
Our growth may strain our infrastructure and resources, which could slow our development of new
restaurants and adversely affect our ability to manage our existing restaurants.
Over the last two years, we have opened seven restaurants or 29% of our total restaurant base.
This expansion and any future growth has increased demands on our management team, restaurant
management systems and resources, financial controls, and information systems. These increased
demands may adversely affect our ability to manage our existing restaurants. If we fail to
continue to improve our infrastructure or to manage other factors necessary for us to meet our
expansion objectives, our operating results could be adversely affected.
Our restaurants are subject to natural disasters and other events which are beyond our control and
for which we may not be able to obtain insurance at reasonable rates.
We endeavor to insure our restaurants against wind, flood, and other disasters, but we may not
be able to obtain insurance for these types of events for all of our restaurants at reasonable
rates. A devastating natural disaster or other event in the vicinity of one of our restaurants could result in substantial losses and
have a material adverse affect on our results of operations.
14
Table of Contents
If our distributors or suppliers do not provide food and beverages to us in a timely fashion, we
may experience short-term supply shortages and increased food and beverage costs.
We currently depend on U.S. Foodservice, a national food distribution service company, and
other regional distributors to provide food and beverage products to all of our restaurants. If
U.S. Foodservice or other distributors or suppliers cease doing business with us, we could
experience short-term supply shortages in some or all of our restaurants and could be required to
purchase food and beverage products at higher prices until we are able to secure an alternative
supply source. In addition, any delay in replacing our suppliers or distributors on acceptable
terms could, in extreme cases, require us to remove temporarily items from the menus of one or more
of our restaurants, which also could adversely affect our business.
Our failure to protect our trademarks, service marks, or trade secrets could negatively affect our
competitive position and the value of the Kona Grill brand.
Our business prospects depend in part on our ability to develop favorable consumer recognition
of the Kona Grill name. Although Kona Grill is a federally registered trademark, our trademarks
and service marks could be imitated in ways that we cannot prevent. Alternatively, third parties
may attempt to cause us to change our name or not operate in a certain geographic region if our
name is confusingly similar to their name. In addition, we rely on trade secrets, proprietary
know-how, concepts, and recipes. Our methods of protecting this information may not be adequate.
Moreover, we may face claims of misappropriation or infringement of third parties’ rights that
could interfere with our use of this information. Defending these claims may be costly and, if
unsuccessful, may prevent us from continuing to use this proprietary information in the future, and
may result in a judgment or monetary damages. We do not maintain confidentiality and
non-competition agreements with all of our executives, key personnel, or suppliers. If competitors
independently develop or otherwise obtain access to our trade secrets, proprietary know-how, or
recipes, the appeal of our restaurants could be reduced and our business could be harmed.
Risks Related to the Restaurant Industry
Negative publicity surrounding our restaurants or the consumption of beef, seafood, poultry, or
produce generally, or shifts in consumer tastes, could negatively impact the popularity of our
restaurants, our sales, and our results of operations.
The popularity of our restaurants in general, and our menu offerings in particular, are key
factors to the success of our operations. Negative publicity resulting from poor food quality,
illness, injury, or other health concerns, whether related to one of our restaurants or to the
beef, seafood, poultry, or produce industries in general (such as negative publicity concerning
salmonella, e-coli, Hepatitis A, mercury poisoning and other food-borne illnesses), or operating
problems related to one or more of our restaurants, could make our brand and menu offerings less
appealing to consumers. In addition, other shifts in consumer preferences away from the kinds of
food we offer, whether because of dietary or other health concerns or otherwise, would make our
restaurants less appealing and adversely affect our sales and results of operations. If our
restaurants are unable to compete successfully with other restaurants in new and existing markets,
our results of operations will be harmed and we will not achieve profitability.
Increases in the prices of, or reductions in the availability of, seafood, poultry, beef, or
produce could reduce our operating margins and adversely affect our operating results.
Our profitability depends, in part, on our ability to anticipate and react to changes in
seafood, poultry, beef, or produce costs. The supply and price of these items is more volatile
than other types of food. The type, variety, quality, and price of seafood, poultry, beef, and
produce is subject to factors beyond our control, including adverse weather conditions,
transportation costs, governmental regulation, availability, and seasonality, each of which may
affect our food costs or cause a disruption in our supply. We currently do not purchase seafood,
poultry, beef, or produce pursuant to long-term contracts or use financial management strategies to
reduce our exposure to price fluctuations. Changes in the price or availability of certain types of seafood, poultry,
beef, or produce could affect our ability to offer a broad menu and price offering to our guests
and could reduce our operating margins and adversely affect our results of operations.
15
Table of Contents
Regulations affecting the operation of our restaurants could increase operating costs, restrict our
growth, or require us to suspend operations.
Each of our restaurants must obtain licenses from regulatory authorities allowing it to sell
liquor, beer, and wine, and each restaurant must obtain a food service license from local health
authorities. Each restaurant’s liquor license must be renewed annually and may be revoked or
suspended at any time for cause, including violation by us or our employees of any laws and
regulations relating to the minimum drinking age, over serving, advertising, wholesale purchasing,
and inventory control. Each restaurant is also subject to local health inspections. Failure to
pass one or multiple inspections may result in temporary or permanent suspension of operations and
could significantly impact our reputation. In certain states, including states where we have
existing restaurants or where we plan to open restaurants in the near term, the number of liquor
licenses available is limited and licenses are traded at market prices. Liquor, beer, and wine
sales comprise a significant portion of our sales, representing approximately 32% of our sales
during 2009. Therefore, if we are unable to maintain our existing licenses, or if we choose to
open a restaurant in those states, the cost of a new license could be significant. Obtaining and
maintaining licenses is an important component of each of our restaurant’s operations, and the
failure to obtain or maintain food and liquor licenses and other required licenses, permits, and
approvals would adversely impact our restaurants and our growth strategy.
In addition, the Federal Americans with Disabilities Act prohibits discrimination on the basis
of disability in public accommodations and employment. Although our restaurants are designed to be
accessible to the disabled, we could be required to reconfigure our restaurants to provide service
to, or make reasonable accommodations for, disabled persons. Non-compliance with this law and
related laws enacted at the state or local level could result in the imposition of fines or an
award of damages in litigation.
Litigation concerning our food quality, our employment practices, liquor liability, and other
issues could result in significant expenses to us and could divert resources from our operations.
Like other restaurants, we may receive complaints or litigation from, and potential liability
to, our guests involving food-borne illness or injury or other operational issues. We may also be
subject to complaints or allegations from, and potential liability to, our former, existing, or
prospective employees involving our restaurant employment practices and procedures. In addition,
we are subject to state “dram shop” laws and regulations, which generally provide that a person
injured by an intoxicated person may seek to recover damages from an establishment that wrongfully
served alcoholic beverages to such person. Recent litigation against restaurant chains has
resulted in significant judgments, including punitive damages, under “dram shop” statutes. While
we carry liquor liability coverage as part of our existing comprehensive general liability
insurance, we may still be subject to a judgment in excess of our insurance coverage and we may not
be able to obtain or continue to maintain such insurance coverage at reasonable costs, if at all.
Regardless of whether any claims against us are valid or whether we are liable, our sales may be
adversely affected by publicity resulting from such claims. Such claims may also be expensive to
defend and may divert time and money away from our operations and adversely affect our business.
Labor shortages or increases in labor costs could slow our growth or adversely affect our business.
Our success depends in part on our ability to attract, motivate, and retain a sufficient
number of qualified employees, including restaurant general managers and kitchen managers,
necessary to continue our operations and keep pace with our growth. This ability is especially
critical to our company because of our relatively small number of existing restaurants and our
current development plans. If we are unable to recruit and retain a sufficient number of qualified
employees, our business and growth strategy could be adversely affected.
Competition for qualified restaurant employees in our current or prospective markets could
require us to pay higher wages and benefits, which could result in higher labor costs. In
addition, we have a substantial number of hourly employees who are paid rates based upon the
federal or state minimum wage and who rely on tips for a significant portion of their income.
Government-mandated increases in minimum wages, overtime pay, health
benefits, or increased tax reporting and tax payment requirements for employees who receive
gratuities, or a reduction in the number of states that allow tips to be credited toward minimum
wage requirements, could increase our labor costs. We may be unable to increase our prices
proportionately in order to pass these increased costs on to our guests, in which case our
operating margins would be adversely affected.
16
Table of Contents
Risks Related to Ownership of Our Common Stock
The market price for our common stock may be volatile.
Many factors could cause the market price of our common stock to rise and fall, including but
not limited to the following:
| • | actual or anticipated variations in comparable restaurant sales or operating results;
whether in our operations or those of our competitors; |
| • | changes in the consumer spending environment or general economic conditions; |
| • | changes in the market valuations of other companies in the restaurant industry; |
| • | recruitment or departure of key restaurant operations or management personnel; |
| • | changes in the estimates of our operating performance or changes in recommendations by
any research analysts that follow our stock; and |
| • | announcements of investigations or regulatory scrutiny of our restaurant operations or
lawsuits filed against us. |
Due to the volatility of our stock price, we also may become the target of securities litigation.
Securities litigation could result in substantial costs and divert our management’s attention and
resources from our business as well as depress the price of our common stock.
Our current principal stockholders own a large percentage of our voting stock, which allows them to
control substantially all matters requiring stockholder approval.
Six entities or persons together own approximately 59% of our outstanding common stock,
including two of our directors. As a result, these investors may have significant influence over a
decision to enter into any corporate transaction and may have the ability to prevent any
transaction that requires the approval of stockholders, regardless of whether or not our other
stockholders believe that such transaction is in their own best interests. Such concentration of
voting power could have the effect of delaying, deterring, or preventing a change of control or
other business combination, which could in turn have an adverse effect on the market price of our
common stock or prevent our stockholders from realizing a premium over the then-prevailing market
price for their shares of common stock.
The large number of shares eligible for public sale and registered for resale could depress the
market price of our common stock.
The market price for our common stock could decline as a result of sales of a large number of
shares of our common stock in the market, and the perception that these sales could occur may
depress the market price. As of December 31, 2009, we had outstanding 9,146,695 shares of common
stock, all of which shares are either freely tradable or otherwise eligible for sale under Rule 144
under the Securities Act of 1933. In addition, we have 1,875,000 shares reserved for issuance
under our stock award and employee stock purchase plans, of which approximately 300,000 shares have
been issued. We have filed registration statements under the securities laws to register the
common stock to be issued under these plans. As a result, shares issued under these plans will be
freely tradable without restriction unless acquired by affiliates of our company, who will be
subject to the volume and other limitations of Rule 144.
17
Table of Contents
We have also filed a registration statement covering the resale of 950,000 shares held by
investors in our private placement transaction during November 2007 and one other stockholder. We
have agreed to keep this registration effective for a period of time following the private
transaction. As a result, the existence of the registration statement may have a depressive effect
on the market price of our common stock.
Provisions in our certificate of incorporation, our bylaws, and Delaware law could make it more
difficult for a third party to acquire us, discourage a takeover, and adversely affect existing
stockholders.
Our certificate of incorporation, our bylaws, and the Delaware General Corporation Law contain
provisions that may have the effect of making more difficult, delaying, or deterring attempts by
others to obtain control of our company, even when these attempts may be in the best interests of
stockholders. These include provisions on our maintaining a classified Board of Directors and
limiting the stockholders’ powers to remove directors or take action by written consent instead of
at a stockholders’ meeting. Our certificate of incorporation also authorizes our Board of
Directors, without stockholder approval, to issue one or more series of preferred stock, which
could have voting and conversion rights that adversely affect or dilute the voting power of the
holders of common stock. Delaware law also imposes conditions on the voting of “control shares”
and on certain business combination transactions with “interested stockholders.”
These provisions and others that could be adopted in the future could deter unsolicited
takeovers or delay or prevent changes in our control or management, including transactions in which
stockholders might otherwise receive a premium for their shares over then current market prices.
These provisions may also limit the ability of stockholders to approve transactions that they may
deem to be in their best interests.
Failure to maintain effective internal controls in accordance with Section 404 of the
Sarbanes-Oxley Act could have a material adverse effect on our ability to produce accurate
financial statements and on our stock price.
Pursuant to Section 404 of the Sarbanes-Oxley Act of 2002, we have furnished a report by our
management on internal control over financial reporting as of December 31, 2009. To achieve
compliance with Section 404, we engaged in a process to document and evaluate our internal control
over financial reporting which was both challenging and time-consuming.
Subject to proposed changes by the SEC, our independent auditors will be required to issue a
report on the effectiveness of our internal control over financial reporting for the year ended
December 31, 2010. Despite our efforts, we can provide no assurance as to our, or our independent
auditors’, conclusions with respect to the effectiveness of our internal control over financial
reporting under Section 404 in the future. There is a risk that neither we nor our independent
auditors will be able to conclude within the prescribed timeframe that our internal controls over
financial reporting are effective as required by Section 404. This could result in an adverse
reaction in the financial markets due to a loss of confidence in the reliability of our financial
statements.
Since we do not expect to pay any dividends for the foreseeable future, holders of our common stock
may be forced to sell their stock in order to obtain a return on their investment.
We do not anticipate that we will pay any dividends to holders of our common stock in the
foreseeable future. Instead, we plan to reinvest any earnings to finance our restaurant operations
and growth plans. Accordingly, stockholders must rely on sales of their common stock after price
appreciation, which may never occur, as the only way to realize any return on their investment. As
a result, investors seeking cash dividends should not purchase our common stock.
| Item 1B. | Unresolved Staff Comments |
Not applicable.
18
Table of Contents
| Item 2. | Properties |
We currently operate 24 restaurants in 15 states. Each of our restaurants and our corporate
offices are located in a leased facility. As of December 31, 2009, our restaurant leases had
expiration dates ranging from 2013 to 2029, typically with options to renew for at least a
five-year period. We do not anticipate any difficulties renewing existing leases as they expire.
The following table sets forth our current restaurant locations.
| Year | Square | Number of | ||||||||||||
| State | City | Location | Opened | Footage | Seats (1) | |||||||||
Arizona |
Scottsdale | Scottsdale Fashion Square | 1998 | 5,964 | 274 | |||||||||
Arizona |
Chandler | Chandler Fashion Center | 2001 | 7,389 | 326 | |||||||||
Missouri |
Kansas City | Country Club Plaza | 2002 | 7,455 | 222 | |||||||||
Nevada |
Las Vegas | Boca Park Fashion Village | 2003 | 7,380 | 295 | |||||||||
Colorado |
Denver | Cherry Creek Mall | 2004 | 5,920 | 243 | |||||||||
Nebraska |
Omaha | Village Pointe | 2004 | 7,415 | 304 | |||||||||
Indiana |
Carmel | Clay Terrace | 2004 | 7,433 | 295 | |||||||||
Texas |
Sugar Land | First Colony Mall | 2005 | 7,127 | 285 | |||||||||
Texas |
San Antonio | The Shops at La Cantera | 2005 | 7,200 | 256 | |||||||||
Texas |
Dallas | North Park Mall | 2006 | 6,872 | 299 | |||||||||
Illinois |
Lincolnshire | Lincolnshire Commons | 2006 | 7,020 | 305 | |||||||||
Texas |
Houston | Houston Galleria | 2006 | 7,459 | 315 | |||||||||
Illinois |
Oak Brook | Oak Brook Promenade | 2006 | 6,999 | 298 | |||||||||
Texas |
Austin | The Domain | 2007 | 6,890 | 298 | |||||||||
Michigan |
Troy | Big Beaver Road | 2007 | 7,000 | 280 | |||||||||
Connecticut |
Stamford | Stamford Town Center | 2007 | 7,654 | 305 | |||||||||
Louisiana |
Baton Rouge | Perkins Rowe | 2007 | 6,900 | 260 | |||||||||
Arizona |
Gilbert | San Tan Village | 2008 | 6,770 | 259 | |||||||||
Florida |
West Palm Beach | CityPlace | 2008 | 6,750 | 243 | |||||||||
Arizona |
Phoenix | CityNorth | 2008 | 7,510 | 368 | |||||||||
Virginia |
Richmond | West Broad Village | 2009 | 7,000 | 282 | |||||||||
New Jersey |
Woodbridge | Woodbridge Conference Center | 2009 | 7,000 | 280 | |||||||||
Minnesota |
Eden Prairie | Windsor Plaza | 2009 | 7,000 | 310 | |||||||||
Florida |
Tampa | MetWest International | 2009 | 7,500 | 338 | |||||||||
| (1) | Number of seats includes dining room, patio seating, sushi bar, bar, and private dining room
(where applicable). |
| Item 3. | Legal Proceedings |
We are involved in various legal proceedings arising out of our operations in the ordinary
course of business. We do not believe that such proceedings, even if determined adversely, will
have a material adverse effect on our business, financial condition, or results of operations. See
discussion of Legal Proceedings in Note 14 to the consolidated financial statements.
| Item 4. | Reserved |
19
Table of Contents
PART II
| Item 5. | Market for Registrant’s Common Equity, Related Stockholder Matters and Issuer Purchases of Equity Securities |
Market Information
Our common stock has traded on the NASDAQ Global Market under the symbol KONA since our
initial public offering on August 16, 2005. The following table sets forth high and low sale
prices of our common stock for each calendar quarter indicated as reported on the NASDAQ Global
Market.
| High | Low | |||||||
2009 |
||||||||
First quarter |
$ | 3.25 | $ | 1.42 | ||||
Second quarter |
$ | 4.34 | $ | 1.17 | ||||
Third quarter |
$ | 4.15 | $ | 3.16 | ||||
Fourth quarter |
$ | 3.59 | $ | 2.32 | ||||
2008 |
||||||||
First quarter |
$ | 14.77 | $ | 8.38 | ||||
Second quarter |
$ | 9.70 | $ | 6.15 | ||||
Third quarter |
$ | 8.37 | $ | 5.45 | ||||
Fourth quarter |
$ | 5.97 | $ | 1.10 | ||||
On March 1, 2010, the closing sale price of our common stock was $3.25 per share. On March 1,
2010, there were approximately 31 holders of record of our common stock.
Dividend Policy
We have not paid any dividends to holders of our common stock since our initial public
offering and do not anticipate that we will pay any dividends to holders of our common stock in the
foreseeable future, but instead we currently plan to retain any earnings to finance our restaurant
operations and the growth of our business. Payments of any cash dividends in the future, however,
is within the discretion of our Board of Directors and will depend on our financial condition,
results of operations, and capital and legal requirements as well as other factors deemed relevant
by our Board of Directors.
20
Table of Contents
PERFORMANCE GRAPH
The following line graph compares cumulative total stockholder returns for the period from
August 16, 2005 through December 31, 2009 for (1) our common stock; (2) the NASDAQ Composite (U.S.)
Index; and (3) a restaurant peer group. We do not believe that an index exists with companies
comparable to those of our company. We have therefore elected to include a peer group consisting
of P.F. Chang’s China Bistro, Inc.; The Cheesecake Factory Incorporated; McCormick & Schmick’s
Seafood Restaurants, Inc.; Benihana, Inc.; BJ’s Restaurants, Inc.; Granite City Food & Brewery
Ltd.; and J. Alexander’s Corporation. The graph assumes an investment of $100 on August 16, 2005,
which was the first day on which our stock was listed on the NASDAQ Global Market. The
calculations of cumulative stockholder return for the NASDAQ Composite (U.S.) Index and the
restaurant peer group include reinvestment of dividends, but the calculation of cumulative
stockholder return on our common stock does not include reinvestment of dividends because we did
not pay any dividends during the measurement period. The performance shown is not necessarily
indicative of future performance.
The performance graph shall not be deemed “filed” for purposes of Section 18 of the Securities
Exchange Act of 1934, as amended, or the Exchange Act, or otherwise subject to the liability of
that section. The performance graph will not be deemed incorporated by reference into any filing
of our company under the Exchange Act or the Securities Act of 1933, as amended.
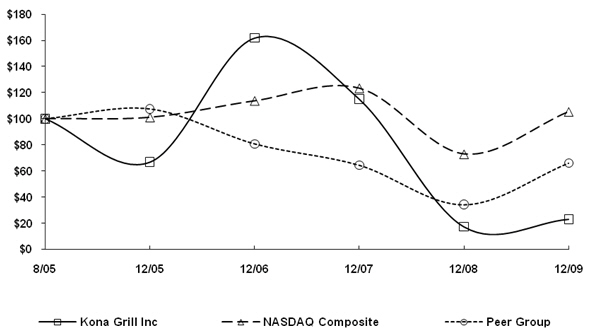
21
Table of Contents
| Item 6. | Selected Financial Data |
The following selected consolidated financial data has been derived from audited financial
statements and should be read in conjunction with the consolidated financial statements and notes
thereto and Item 7, “Management’s Discussion and Analysis of Financial Condition and Results of
Operations.”
| Year Ended December 31, | ||||||||||||||||||||
| 2009 | 2008 | 2007 | 2006 | 2005 | ||||||||||||||||
| (In thousands, except per share data) | ||||||||||||||||||||
Consolidated Statement of Operations Data: |
||||||||||||||||||||
Restaurant sales |
$ | 81,095 | $ | 75,815 | $ | 69,521 | $ | 50,322 | $ | 36,828 | ||||||||||
Costs and expenses: |
||||||||||||||||||||
Cost of sales |
21,058 | 20,730 | 19,600 | 14,320 | 10,550 | |||||||||||||||
Labor |
28,517 | 25,396 | 21,554 | 15,555 | 11,123 | |||||||||||||||
Occupancy |
6,457 | 5,157 | 4,465 | 3,363 | 2,466 | |||||||||||||||
Restaurant operating expenses |
13,156 | 11,314 | 9,479 | 6,875 | 4,698 | |||||||||||||||
General and administrative |
8,200 | 8,416 | 7,294 | 7,155 | 4,783 | |||||||||||||||
Preopening expense |
1,685 | 2,073 | 1,962 | 1,971 | 634 | |||||||||||||||
Depreciation and amortization |
7,314 | 6,547 | 5,428 | 3,906 | 2,333 | |||||||||||||||
Asset impairment charge |
16,915 | 3,219 | — | — | — | |||||||||||||||
Total costs and expenses |
103,302 | 82,852 | 69,782 | 53,145 | 36,587 | |||||||||||||||
(Loss) income from operations |
(22,207 | ) | (7,037 | ) | (261 | ) | (2,823 | ) | 241 | |||||||||||
Nonoperating expenses: |
||||||||||||||||||||
Interest income and other, net |
204 | 296 | 617 | 936 | 300 | |||||||||||||||
Interest expense |
(174 | ) | (51 | ) | (85 | ) | (294 | ) | (841 | ) | ||||||||||
(Loss) income from continuing operations before
provision for income taxes |
(22,177 | ) | (6,792 | ) | 271 | (2,181 | ) | (300 | ) | |||||||||||
Provision for income taxes |
65 | 205 | 406 | 60 | 83 | |||||||||||||||
Loss from continuing operations |
(22,242 | ) | (6,997 | ) | (135 | ) | (2,241 | ) | (383 | ) | ||||||||||
Gain (loss) from discontinued operations (1) |
690 | (3,504 | ) | (534 | ) | (503 | ) | — | ||||||||||||
Net loss |
$ | (21,552 | ) | $ | (10,501 | ) | $ | (669 | ) | $ | (2,744 | ) | $ | (383 | ) | |||||
Net (loss) income per share — Basic and Diluted: |
||||||||||||||||||||
Continuing operations |
$ | (2.57 | ) | $ | (0.87 | ) | $ | (0.02 | ) | $ | (0.31 | ) | $ | (0.10 | ) | |||||
Discontinued operations |
0.08 | (0.43 | ) | (0.07 | ) | (0.07 | ) | — | ||||||||||||
Net loss |
$ | (2.49 | ) | $ | (1.30 | ) | $ | (0.09 | ) | $ | (0.38 | ) | $ | (0.10 | ) | |||||
Weighted average shares used in computation: |
||||||||||||||||||||
Basic |
8,645 | 8,054 | 7,364 | 7,128 | 3,747 | |||||||||||||||
Diluted |
8,645 | 8,054 | 7,364 | 7,128 | 3,747 | |||||||||||||||
Balance Sheet Data (end of period): |
||||||||||||||||||||
Cash and cash equivalents |
$ | 2,404 | $ | 2,477 | $ | 4,991 | $ | 1,934 | $ | 4,466 | ||||||||||
Investments |
6,282 | 6,861 | 14,188 | 14,249 | 24,200 | |||||||||||||||
Working (deficit) capital |
(5,054 | ) | (7,653 | ) | 13,656 | 9,142 | 24,672 | |||||||||||||
Total assets |
49,963 | 65,554 | 69,474 | 58,796 | 52,418 | |||||||||||||||
Total debt |
7,120 | 4,525 | 2,700 | 3,313 | 4,042 | |||||||||||||||
Total stockholders’ equity |
17,983 | 35,598 | 46,431 | 35,822 | 37,311 | |||||||||||||||
| (1) | As a result of our decision to close our Naples, Florida restaurant during September 2008,
the results of this restaurant (including related asset impairment, lease obligation, and
restaurant-level closing costs) are classified as discontinued operations for all periods
presented as discussed further in Note 2 to our consolidated financial statements. |
22
Table of Contents
| Item 7. | Management’s Discussion and Analysis of Financial Condition and Results of Operations |
The following discussion and analysis should be read in conjunction with our consolidated
financial statements and related notes contained elsewhere in this report. This discussion contains
forward-looking statements that involve risks, uncertainties, and assumptions. Our actual results
may differ materially from those anticipated in these forward-looking statements as a result of a
variety of factors, including those set forth under Item 1A, “Risk Factors” and elsewhere in this
report.
Overview
We currently own and operate 24 restaurants located in 15 states. We offer freshly prepared
food, personalized service, and a contemporary ambiance that create a satisfying yet affordable
dining experience that we believe exceeds many traditional casual dining restaurants with whom we
compete. Our high-volume upscale casual restaurants feature a diverse selection of mainstream
American favorites as well as a variety of appetizers and entrees with an international influence,
including an extensive selection of sushi items. Our menu items are freshly prepared and
incorporate over 40 signature sauces and dressings that we make from scratch, creating broad-based
appeal for the lifestyle and taste trends of a diverse group of guests. Our menu is mostly
standardized for all of our restaurants, allowing us to deliver consistent quality meals. We
believe that our vast menu and generous portions, combined with an average check of approximately
$23.90, offers our guests an attractive price-value proposition.
Over the last four years, we have funded development of new restaurants primarily from the
proceeds of our initial public offering, a private offering of common stock completed during
November 2007, the rights offering completed during June 2009, and cash flows from operations. We
opened four restaurants during 2009 in Richmond, Virginia; Woodbridge, New Jersey; Eden Prairie,
Minnesota; and Tampa, Florida. We plan to open one restaurant in Baltimore, Maryland during 2010.
We target our restaurants to achieve an average annual unit volume of $4.5 million following 24
months of operations. Recent openings are trending lower than our targeted volume during the
current recession. We continue to believe that in a stable economic environment our typical new
restaurants experience gradually increasing unit volumes as guests begin to discover our concept
and we begin to generate market awareness. Our restaurants are also subject to seasonal
fluctuations. Sales in most of our restaurants typically are higher during the spring and summer
months and winter holiday season.
During 2009, we recorded non-cash asset impairment charges for six underperforming
restaurants. The asset impairment charges resulted from an evaluation of the long-term prospects
of each of these restaurants that have not been meeting sales, profitability, and cash flow
targets. We have no plans to close any of these restaurants; however, we will continue to evaluate
each of these restaurants to determine whether operating performance can be improved.
We experience various trends in our operating cost structure. Cost of sales, labor, occupancy,
and other operating expenses for our restaurants open at least 12 months generally trend consistent
with restaurant sales, and we analyze those costs as a percentage of restaurant sales. We
anticipate that our new restaurants will take approximately six months to achieve operating
efficiencies as a result of challenges typically associated with opening new restaurants, including
lack of market recognition and the need to hire and sufficiently train employees, as well as other
factors. We expect cost of sales and labor expenses as a percentage of restaurant sales to be
higher when we open a new restaurant, but decrease as a percentage of restaurant sales as the
restaurant matures and as the restaurant management and employees become more efficient operating
that unit. As a result, the volume and timing of newly opened restaurants has had, and is expected
to continue to have, an impact on costs of sales, labor, occupancy, restaurant operating expenses,
and preopening expenses. The majority of our general and administrative costs are fixed costs. We
expect our general and administrative spending to decrease as a percentage of restaurant sales as
we leverage these investments and realize the benefits of higher sales volumes.
23
Table of Contents
Key Measures We Use to Evaluate Our Company
Key measures we use to evaluate and assess our business include the following:
Number of Restaurant Openings. Number of restaurant openings reflects the number of
restaurants opened during a particular reporting period.
Same-Store Sales Percentage Change. Same-store sales percentage change reflects the periodic
change in restaurant sales for the comparable restaurant base. In calculating the percentage change
in same-store sales, we include a restaurant in the comparable restaurant base after it has been in
operation for more than 18 months. Same-store sales growth can be generated by an increase in guest
traffic counts or by increases in the per person average check amount. Menu price changes and the
mix of menu items sold can affect the per person average check amount.
Average Weekly Sales. Average weekly sales represents the average of restaurant sales
measured over consecutive Monday through Sunday time periods.
Average Unit Volume. Average unit volume represents the average restaurant sales for all of
our restaurants open for at least 12 months before the beginning of the period measured.
Sales Per Square Foot. Sales per square foot represents the restaurant sales for our
restaurants open for at least 12 months, divided by the total leasable square feet for such
restaurants.
Restaurant Operating Profit. Restaurant operating profit is defined as restaurant sales minus
cost of sales, labor, occupancy, and restaurant operating expenses. Restaurant operating profit
does not include general and administrative expenses, depreciation and amortization, preopening
expenses, or asset impairment charges. We believe restaurant operating profit is an important
component of financial results because it is a widely used metric within the restaurant industry to
evaluate restaurant-level productivity, efficiency, and performance prior to application of
corporate overhead. We use restaurant operating profit as a percentage of restaurant sales as a
key metric to evaluate our restaurants’ financial performance compared with our competitors. This
measure provides useful information regarding our financial condition and results of operations and
allows investors to more easily determine future financial results driven by growth and allows
investors to more easily compare restaurant level profitability.
Key Financial Definitions
Restaurant Sales. Restaurant sales include gross food and beverage sales, net of promotions
and discounts.
Cost of Sales. Cost of sales consists of food and beverage costs.
Labor. Labor includes all direct and indirect labor costs incurred in operations.
Occupancy. Occupancy includes all rent payments associated with the leasing of real estate,
including base, percentage and straight-line rent, property taxes, and common area maintenance
expense. We record tenant improvement allowances as a reduction of occupancy expense over the
initial term of the lease.
Restaurant Operating Expenses. Restaurant operating expenses consist of all other
restaurant-level operating costs, the major components of which are utilities, credit card fees,
advertising, supplies, marketing, repair and maintenance, and other expenses. Other operating
expenses contain both variable and fixed components.
General and Administrative. General and administrative includes all corporate and
administrative functions that support operations and provide infrastructure to facilitate our
future growth. Components of this category include management and staff salaries, bonuses,
stock-based compensation and related employee benefits, travel, information systems, human
resources, training, corporate rent, professional and consulting fees, and corporate insurance
costs.
24
Table of Contents
Preopening Expense. Preopening expense consists of costs incurred prior to opening a new
restaurant and is comprised principally of manager salaries and relocation, payroll and related
training costs for new employees, including food and beverage costs associated with practice and
rehearsal of service activities, and rent expense incurred from the date we obtain possession of
the property until opening. We expense restaurant preopening expenses as incurred, and we expect
preopening expenses to be similar for each new restaurant opening, which typically commence six to
eight months prior to a restaurant opening. Our preopening costs will fluctuate from period to
period depending upon the number of restaurants opened, the timing of new restaurant openings, the
location of the restaurants, and the complexity of the staff hiring and training process.
Depreciation and Amortization. Depreciation and amortization expense consists of the
depreciation of property and equipment and gains and losses on disposal of assets.
Asset Impairment Charge. Asset impairment charge results from an assessment of a restaurant’s
historical operating performance combined with its projected cash flows over the remaining lease
term. An impairment charge is recorded if the asset’s fair value is deemed to be less than its
carrying value.
Interest Income and Other, Net. Interest income and other, net consists of interest earned on
our cash and investments and any gains or losses on our investments.
Interest Expense. Interest expense includes the cost of servicing our debt obligations, net of
capitalized interest.
Financial Performance Overview
The following table sets forth certain information regarding our financial performance for
2009, 2008, and 2007.
| Year Ended December 31, | ||||||||||||
| 2009 | 2008 | 2007 | ||||||||||
Restaurant sales growth |
7.0 | % | 9.1 | % | 38.2 | % | ||||||
Same-store sales percentage change(1) |
(9.3 | )% | (7.2 | )% | 2.7 | % | ||||||
Average unit volume (in thousands)(2) |
$ | 3,815 | $ | 4,279 | $ | 4,808 | ||||||
Sales per square foot (2) |
$ | 541 | $ | 608 | $ | 684 | ||||||
Restaurant operating profit (in thousands) (3) |
$ | 11,907 | $ | 13,218 | $ | 14,423 | ||||||
Restaurant operating profit as a percentage of sales (3) |
14.7 | % | 17.4 | % | 20.7 | % | ||||||
| (1) | Same-store sales percentage change reflects the periodic change in restaurant
sales for the comparable restaurant base. In calculating the percentage change in
same-store sales, we include a restaurant in the comparable restaurant base after it has
been in operation for more than 18 months. |
|
| (2) | Includes only those restaurants open for at least 12 months. |
25
Table of Contents
| (3) | Restaurant operating profit is not a financial measurement determined in
accordance with generally accepted accounting principles and should not be considered in
isolation or as an alternative to loss from operations. Restaurant operating profit may
not be comparable to the same or similarly titled measures computed by other companies.
The table below sets forth our calculation of restaurant operating profit and
reconciliation to loss from operations, the most comparable GAAP measure. |
| Year Ended December 31, | ||||||||||||
| 2009 | 2008 | 2007 | ||||||||||
| (In thousands) | ||||||||||||
Restaurant sales |
$ | 81,095 | $ | 75,815 | $ | 69,521 | ||||||
Costs and expenses: |
||||||||||||
Cost of sales |
21,058 | 20,730 | 19,600 | |||||||||
Labor |
28,517 | 25,396 | 21,554 | |||||||||
Occupancy |
6,457 | 5,157 | 4,465 | |||||||||
Restaurant operating expenses |
13,156 | 11,314 | 9,479 | |||||||||
Restaurant operating profit |
11,907 | 13,218 | 14,423 | |||||||||
Deduct — other costs and expenses |
||||||||||||
General and administrative |
8,200 | 8,416 | 7,294 | |||||||||
Preopening expense |
1,685 | 2,073 | 1,962 | |||||||||
Depreciation and amortization |
7,314 | 6,547 | 5,428 | |||||||||
Asset impairment charge |
16,915 | 3,219 | — | |||||||||
Loss from operations |
$ | (22,207 | ) | $ | (7,037 | ) | $ | (261 | ) | |||
| Percentage of Restaurant Sales | ||||||||||||
| Year Ended December 31, | ||||||||||||
| 2009 | 2008 | 2007 | ||||||||||
Restaurant sales |
100.0 | % | 100.0 | % | 100.0 | % | ||||||
Costs and expenses: |
||||||||||||
Cost of sales |
26.0 | 27.3 | 28.2 | |||||||||
Labor |
35.2 | 33.5 | 31.0 | |||||||||
Occupancy |
8.0 | 6.8 | 6.4 | |||||||||
Restaurant operating expenses |
16.2 | 14.9 | 13.6 | |||||||||
Restaurant operating profit |
14.7 | 17.4 | 20.7 | |||||||||
Deduct — other costs and expenses |
||||||||||||
General and administrative |
10.1 | 11.1 | 10.5 | |||||||||
Preopening expense |
2.1 | 2.7 | 2.8 | |||||||||
Depreciation and amortization |
9.0 | 8.6 | 7.8 | |||||||||
Asset impairment charge |
20.9 | 4.2 | — | |||||||||
Loss from operations |
(27.4 | )% | (9.3 | )% | (0.4 | )% | ||||||
Certain percentage amounts may not sum to total due to rounding.
| Year Ended December 31, | ||||||||||||
| 2009 | 2008 | 2007 | ||||||||||
Store Growth Activity |
||||||||||||
Beginning Restaurants |
20 | 18 | 14 | |||||||||
Openings |
4 | 3 | 4 | |||||||||
Closings |
— | (1 | ) | — | ||||||||
Total |
24 | 20 | 18 | |||||||||
26
Table of Contents
Results of Operations
The following table sets forth, for the years indicated, our Consolidated Statements of
Operations expressed as a percentage of restaurant sales.
| Year Ended December 31, | ||||||||||||
| 2009 | 2008 | 2007 | ||||||||||
Restaurant sales |
100.0 | % | 100.0 | % | 100.0 | % | ||||||
Costs and expenses: |
||||||||||||
Cost of sales |
26.0 | 27.3 | 28.2 | |||||||||
Labor |
35.2 | 33.5 | 31.0 | |||||||||
Occupancy |
8.0 | 6.8 | 6.4 | |||||||||
Restaurant operating expenses |
16.2 | 14.9 | 13.6 | |||||||||
General and administrative |
10.1 | 11.1 | 10.5 | |||||||||
Preopening expense |
2.1 | 2.7 | 2.8 | |||||||||
Depreciation and amortization |
9.0 | 8.6 | 7.8 | |||||||||
Asset impairment charge |
20.9 | 4.2 | — | |||||||||
Total costs and expenses |
127.4 | 109.3 | 100.4 | |||||||||
Loss from operations |
(27.4 | ) | (9.3 | ) | (0.4 | ) | ||||||
Nonoperating expenses: |
||||||||||||
Interest income and other, net |
0.3 | 0.4 | 0.9 | |||||||||
Interest expense |
(0.2 | ) | (0.1 | ) | (0.1 | ) | ||||||
(Loss) income from continuing operations before
provision for income taxes |
(27.3 | ) | (9.0 | ) | 0.4 | |||||||
Provision for income taxes |
0.1 | 0.3 | 0.6 | |||||||||
Loss from continuing operations |
(27.4 | ) | (9.3 | ) | (0.2 | ) | ||||||
Gain (loss) from discontinued operations, net of tax |
0.8 | (4.6 | ) | (0.8 | ) | |||||||
Net loss |
(26.6 | )% | (13.9 | )% | (1.0 | )% | ||||||
Certain percentage amounts may not sum to total due to rounding.
Year Ended December 31, 2009 Compared with Year Ended December 31, 2008
Restaurant Sales. Restaurant sales increased $5.3 million, or 7.0% to $81.1 million during
2009 from $75.8 million during 2008. The increase in sales is primarily attributable to restaurant
sales generated from the opening of seven new restaurants since June 2008, partially offset by
overall traffic declines at our comparable restaurant sales base resulting from the weak U.S.
economy, high unemployment rates, and reduced consumer spending. Higher menu pricing of
approximately 2.0% was more than offset by reduced guest traffic and a decline in the average guest
check as comparable restaurant sales declined 9.3% during 2009.
Cost of Sales. Cost of sales increased $0.3 million, or 1.6% to $21.0 million during 2009
from $20.7 million during 2008. Cost of sales as a percentage of restaurant sales decreased 1.3%
to 26.0% during 2009 from 27.3% during the prior year period. Cost of sales during 2009 was
positively affected by favorable year-over-year pricing on certain proteins and produce products
and operating efficiencies attributed to the rollout of an automated food cost and inventory
management system that was completed during July 2008.
Labor. Labor costs for our restaurants increased $3.1 million, or 12.3% to $28.5 million
during 2009 from $25.4 million during the prior year period. The increase was primarily due to the
opening of seven new restaurants since June 2008. As a percentage of restaurant sales, labor costs
increased 1.7% to 35.2% during 2009 from 33.5% during 2008. The increase in labor costs as a
percentage of restaurant sales was primarily due to reduced leverage of fixed labor costs and
hourly labor expense resulting from lower average weekly sales. In addition, high labor costs from
restaurants opened during the year also contributed to the increase in labor expense as labor
expenses are typically higher than normal during the first several months of operations. Federal and state
minimum wage increases, implemented during the second half of 2008 and during 2009, also
contributed to increased labor costs as a percentage of sales.
27
Table of Contents
Occupancy. Occupancy expense increased by $1.3 million, or 25.2% to $6.5 million during 2009
from $5.2 million during the prior year period. Occupancy expenses as a percentage of restaurant
sales increased 1.2% to 8.0% during 2009 from 6.8% during 2008. The increase reflects increased
common area maintenance allocations at many locations, reduction in deferred rent credits at
several locations with rent concessions, and decreased leverage of fixed rental costs from lower
average sales volume, partially offset by reduced percentage rent.
Restaurant Operating Expenses. Restaurant operating expenses increased by $1.8 million, or
16.3% to $13.1 million during 2009 from $11.3 million during the prior year period. Restaurant
operating expenses as a percentage of restaurant sales increased 1.3% to 16.2% during 2009 from
14.9% during the prior year period. During 2009, higher repair and maintenance, utilities, and
property taxes combined with reduced leverage of fixed operating costs resulting from lower average
sales volume contributed to the increase in restaurant operating expenses as a percentage of sales.
General and Administrative. General and administrative expenses decreased $0.2 million, or
2.6% to $8.2 million during 2009 compared to $8.4 million during 2008. The decrease is primarily
attributable to lower salary and benefit costs resulting from the January 2009 downsizing and
realignment of certain corporate office staff and lower expenditures attributable to cost
containment efforts, partially offset by $1.6 million in special charges including $0.8 million in
severance and related benefits associated with the resignation of two executive officers, $0.6
million in legal and professional fees associated with stockholder activities, including financial
advisory fees to evaluate an unsolicited offer to purchase our company, and $0.2 million write-off
for architectural drawings and permit costs associated with amending the lease for our Baltimore,
Maryland restaurant expected to open in 2010. General and administrative expenses as a percentage
of restaurant sales decreased 1.0% to 10.1% of restaurant sales during 2009 compared to 11.1% of
restaurant sales during the prior year period.
Preopening Expense. Preopening expense decreased $0.4 million, or 18.7% to $1.7 million
during 2009 compared to $2.1 million during 2008. The decrease in preopening expense is
attributable to the timing of new restaurant openings. During 2009, there were four restaurant
openings compared to three new restaurants during 2008; however $0.5 million of expenses were
incurred during 2008 for the four restaurants opened during 2009.
Depreciation and Amortization. Depreciation and amortization expense increased $0.8 million,
or 11.7% to $7.3 million during 2009 from $6.5 million during the prior year period. The increase
was primarily attributable to seven restaurants opened since June 2008, partially offset by a
reduction of $0.5 million due to the fourth quarter of 2008 impairment of long-lived assets at our
Lincolnshire, Illinois restaurant. Depreciation and amortization expense as a percentage of
restaurant sales increased 0.4% to 9.0% during 2009 from 8.6% during 2008 reflecting decreased
leverage from lower average weekly sales.
Asset Impairment Charge. During 2009, we recorded non-cash asset impairment charges of $16.9
million related to the write-down of the carrying value of long-lived assets associated with six
underperforming restaurants that have not been meeting sales, profitability, and cash flow targets.
The asset impairment charges were based upon an assessment of each restaurant’s historical
operating performance combined with expected cash flows for these restaurants over the respective
remaining lease term. During 2008, we recorded non-cash asset impairment charges of $3.2 million
for one restaurant. We have no plans to close any of these restaurants; however, we will continue
to evaluate each of these restaurants to determine whether operating performance can be improved.
Interest Income and Other, Net. Interest income and other, net decreased $0.1 million during
2009 compared to the prior year period due to lower interest rates received and lower investment
balances. Please refer to Note 3 to the consolidated financial statements for discussion of our
investment in auction rate securities.
Interest Expense. Interest expense increased $0.1 million due to interest costs associated
with the $1.2 million bridge loan issued during March 2009 and subsequently repaid during June
2009. Interest expense for 2009 includes $70,000 for amortization of the debt discount associated
with warrants issued to the noteholders that was charged to interest expense.
28
Table of Contents
Provision for Income Taxes. During 2009, we recorded income taxes of $65,000 primarily
for states in which income taxes are not calculated based upon net income compared to $205,000
during 2008.
Gain from Discontinued Operations. During the second quarter of 2009, we reached a settlement
agreement regarding the lease for our closed Naples, Florida restaurant. We recorded a gain of
approximately $0.7 million as the settlement amount was less than the lease termination costs
originally recorded during 2008 when the restaurant was closed. During 2008, we recorded a loss of
$3.5 million for asset impairment and lease obligations, along with the sales, costs and expenses
attributable to this restaurant.
Year Ended December 31, 2008 Compared with Year Ended December 31, 2007
Restaurant Sales. Restaurant sales increased by $6.3 million, or 9.1%, to $75.8 million
during 2008 from $69.5 million during the prior year primarily attributed to restaurant sales
generated from the opening of five new restaurants since November 2007, partially offset by overall
traffic declines at our existing restaurants resulting from the slowing U.S. economy which has
negatively impacted overall consumer traffic in the restaurant industry. Higher menu pricing of
approximately 3.8% was more than offset by reduced guest traffic as comparable restaurant sales
declined 7.2% during 2008.
Cost of Sales. Cost of sales increased by $1.1 million, or 5.8%, to $20.7 million during 2008
from $19.6 million during 2007. Cost of sales as a percentage of restaurant sales decreased 0.9%
to 27.3% during 2008 from 28.2% during the prior year. Cost of sales during 2008 was positively
affected by increased purchasing efficiency and reduced waste attributed to the rollout of an
automated food cost and inventory management system that was completed during July 2008.
Labor. Labor costs for our restaurants increased $3.8 million, or 17.8%, to $25.4 million
during 2008 from $21.6 million during 2007. The increase was primarily due to the opening of five
new restaurants since November 2007. As a percentage of restaurant sales, labor costs increased
2.5% to 33.5% during 2008 from 31.0% during 2007. The increase in labor costs as a percentage of
restaurant sales was primarily due to reduced leverage of fixed labor costs resulting from lower
average weekly sales during 2008. In addition, higher average salaries to attract and retain
qualified restaurant managers and federal and state minimum wage increases implemented during 2008
contributed to increased labor costs as a percentage of sales.
Occupancy. Occupancy expense increased by $0.7 million, or 15.5%, to $5.2 million during 2008
from $4.5 million during 2007. Occupancy expenses as a percentage of restaurant sales increased
0.4% to 6.8% during 2008 from 6.4% during 2007. The increase reflects decreased leverage of the
fixed portion of these costs from lower average weekly sales, partially offset by reduced
percentage rent.
Restaurant Operating Expenses. Restaurant operating expenses increased by $1.8 million, or
19.4%, to $11.3 million during 2008 from $9.5 million during 2007. Restaurant operating expenses
as a percentage of restaurant sales increased 1.3% to 14.9% during 2008 from 13.6% during the prior
year period. During 2008, we incurred higher repair and maintenance costs to refurbish our
mature units in addition to higher utilities and increased training costs. Furthermore, reduced
leverage of fixed operating costs resulting from lower average weekly sales contributed to the
increase in restaurant operating expenses as a percentage of sales.
General and Administrative. General and administrative expenses increased by $1.1 million, or
15.4%, to $8.4 million during 2008 from $7.3 million during 2007. The increase is primarily
attributable to planned investments in corporate personnel to support our growth, costs associated
with our stockholder rights plan adopted in May 2008, separation costs related to the resignation
of our chief operating officer, and higher professional fees. General and administrative expenses
as a percentage of restaurant sales increased 0.6% to 11.1% of restaurant sales during 2008
compared to 10.5% of restaurant sales during 2007. During January 2009, we downsized and realigned
certain staff at the corporate office which we estimate will result in approximately $0.8 million
of savings during 2009.
Preopening Expense. Preopening expense increased by $0.1 million, or 5.6%, to $2.1 million
during 2008 compared to $2.0 million during 2007. Preopening expense for 2008 primarily relates to
expenses associated with three restaurants opened during 2008, one restaurant opened during January
2009, and other restaurants scheduled to
open during 2009. During 2007, preopening expense reflected costs associated with opening
four restaurants during 2007.
29
Table of Contents
Depreciation and Amortization. Depreciation and amortization expense increased $1.1 million,
or 20.6%, to $6.5 million during 2008 from $5.4 million during 2007. The increase was primarily
the result of additional depreciation and amortization from five restaurants opened since November
2007. Depreciation and amortization expense as a percentage of restaurant sales increased 0.8% to
8.6% during 2008 from 7.8% during 2007 reflecting decreased leverage from lower average weekly
sales.
Asset Impairment Charge. Asset impairment charge of $3.2 million during 2008, or 4.2% of
restaurant sales resulted from the evaluation of restaurants that have not been meeting sales,
profitability, and cash flow targets. This evaluation resulted in long-lived asset impairment
charges of $3.2 million for our Lincolnshire, Illinois restaurant. We intend to continue operating
this restaurant and believe that the operating performance of this restaurant can be improved.
Interest Income and Other, Net. Interest income and other, net decreased $0.3 million, or
52.0%, to $0.3 million during 2008 from $0.6 million during 2007. This decrease is primarily due
to lower average investment balances, coupled with lower average interest rates, as compared to the
same period last year. In addition, we recognized a loss of approximately $0.1 million on our
investments as the fair value of the put option on our auction rate securities was determined to be
less than the impairment recorded on our auction rate securities. Please refer to Note 3 to the
consolidated financial statements for discussion of our investment in auction rate securities.
Interest Expense. Interest expense decreased slightly due to lower average debt balances
during 2008 as compared to 2007.
Provision for Income Taxes. During 2008, we recorded income taxes of $0.2 million primarily
for states in which income taxes are not calculated based upon net income. During 2007, we
incurred $0.4 million of federal and state tax expense, including a non-cash charge of $0.2 million
related to stock options exercised during 2007 which required the recording of additional tax
expense under accounting rules for stock-based compensation.
Loss from Discontinued Operations, Net of Tax. During September 2008, we closed our Naples,
Florida restaurant to focus our attention on our profitable restaurants. As a result of the
closure, we determined that the closure met the criteria for classification as a discontinued
operation during 2008. Accordingly, all impairment charges and exit costs, along with the sales,
costs and expenses and income taxes attributable to this restaurant are included in discontinued
operations for all periods presented. See Note 2 to the consolidated financial statements for
additional discussion.
Potential Fluctuations in Quarterly Results and Seasonality
Our quarterly operating results may fluctuate significantly as a result of a variety of
factors, including the following:
| • | timing of new restaurant openings and related expenses; |
||
| • | restaurant operating costs and preopening costs for our newly-opened restaurants, which
are often materially greater during the first several months of operation than thereafter; |
||
| • | labor availability and costs for hourly and management personnel; |
||
| • | profitability of our restaurants, especially in new markets; |
||
| • | increases and decreases in comparable restaurant sales; |
||
| • | impairment of long-lived assets and any loss on restaurant closures; |
||
| • | changes in borrowings and interest rates; |
||
| • | general economic conditions; |
||
| • | weather conditions or natural disasters; |
||
| • | timing of certain holidays; |
||
| • | changes in government regulations; |
30
Table of Contents
| • | outside shareholder activities; |
||
| • | settlements, damages and legal costs associated with litigation; |
||
| • | new or revised regulatory requirements and accounting pronouncements; |
||
| • | changes in consumer preferences and competitive conditions; and |
||
| • | fluctuations in commodity prices. |
Quarterly Results of Operations
The following table presents unaudited consolidated statement of operations data for each of
the eight quarters in the period ended December 31, 2009. We believe that all necessary
adjustments have been included to present fairly the quarterly information when read in conjunction
with our annual financial statements and related notes. The operating results for any quarter are
not necessarily indicative of the results for any subsequent quarter.
| Quarter Ended | ||||||||||||||||||||||||||||||||
| 2009 | 2008 | |||||||||||||||||||||||||||||||
| March 31 | June 30 | Sept. 30 | Dec. 31 | March 31 | June 30 | Sept. 30 | Dec. 31 | |||||||||||||||||||||||||
| (In thousands, except per share data) | ||||||||||||||||||||||||||||||||
Consolidated Statement of Operations Data: |
||||||||||||||||||||||||||||||||
Restaurant sales |
$ | 19,455 | $ | 21,468 | $ | 20,173 | $ | 19,999 | $ | 18,103 | $ | 19,685 | $ | 19,454 | $ | 18,573 | ||||||||||||||||
Costs and expenses: |
||||||||||||||||||||||||||||||||
Cost of sales |
5,097 | 5,461 | 5,267 | 5,233 | 5,193 | 5,369 | 5,254 | 4,914 | ||||||||||||||||||||||||
Labor |
6,749 | 7,269 | 7,117 | 7,382 | 6,127 | 6,380 | 6,496 | 6,393 | ||||||||||||||||||||||||
Occupancy |
1,520 | 1,536 | 1,655 | 1,746 | 1,256 | 1,244 | 1,260 | 1,397 | ||||||||||||||||||||||||
Restaurant operating expenses |
3,030 | 3,242 | 3,296 | 3,588 | 2,588 | 2,902 | 2,978 | 2,846 | ||||||||||||||||||||||||
General and administrative |
1,887 | 2,661 | 1,590 | 2,062 | 1,852 | 2,026 | 2,079 | 2,459 | ||||||||||||||||||||||||
Preopening expense |
500 | 352 | 480 | 353 | 178 | 541 | 471 | 883 | ||||||||||||||||||||||||
Depreciation and amortization |
1,741 | 1,812 | 1,820 | 1,941 | 1,566 | 1,584 | 1,656 | 1,741 | ||||||||||||||||||||||||
Asset impairment charge |
— | — | — | 16,915 | — | — | — | 3,219 | ||||||||||||||||||||||||
Total costs and expenses |
20,524 | 22,333 | 21,225 | 39,220 | 18,760 | 20,046 | 20,194 | 23,852 | ||||||||||||||||||||||||
Loss from operations |
(1,069 | ) | (865 | ) | (1,052 | ) | (19,221 | ) | (657 | ) | (361 | ) | (740 | ) | (5,279 | ) | ||||||||||||||||
Nonoperating expenses: |
||||||||||||||||||||||||||||||||
Interest income and other, net |
48 | 77 | 44 | 35 | 204 | 105 | 62 | (75 | ) | |||||||||||||||||||||||
Interest expense |
(32 | ) | (99 | ) | (22 | ) | (21 | ) | (34 | ) | (17 | ) | — | — | ||||||||||||||||||
Loss from continuing operations before provision
for income taxes |
(1,053 | ) | (887 | ) | (1,030 | ) | (19,207 | ) | (487 | ) | (273 | ) | (678 | ) | (5,354 | ) | ||||||||||||||||
Provision for income taxes |
30 | 30 | 5 | — | 75 | 75 | 55 | — | ||||||||||||||||||||||||
Loss from continuing operations |
(1,083 | ) | (917 | ) | (1,035 | ) | (19,207 | ) | (562 | ) | (348 | ) | (733 | ) | (5,354 | ) | ||||||||||||||||
(Loss) gain from discontinued operations |
(13 | ) | 703 | — | — | (111 | ) | (187 | ) | (3,161 | ) | (45 | ) | |||||||||||||||||||
Net loss |
$ | (1,096 | ) | $ | (214 | ) | $ | (1,035 | ) | $ | (19,207 | ) | $ | (673 | ) | $ | (535 | ) | $ | (3,894 | ) | $ | (5,399 | ) | ||||||||
Net (loss) income per share — Basic and diluted: |
||||||||||||||||||||||||||||||||
Continuing operations |
$ | (0.14 | ) | $ | (0.11 | ) | $ | (0.11 | ) | $ | (2.10 | ) | $ | (0.07 | ) | $ | (0.04 | ) | $ | (0.09 | ) | $ | (0.67 | ) | ||||||||
Discontinued operations |
— | 0.08 | — | — | (0.01 | ) | (0.03 | ) | (0.40 | ) | — | |||||||||||||||||||||
Net loss |
$ | (0.14 | ) | $ | (0.03 | ) | $ | (0.11 | ) | $ | (2.10 | ) | $ | (0.08 | ) | $ | (0.07 | ) | $ | (0.49 | ) | $ | (0.67 | ) | ||||||||
Weighted average shares used in computation: |
||||||||||||||||||||||||||||||||
Basic and diluted |
8,016 | 8,278 | 9,141 | 9,144 | 8,134 | 8,081 | 7,998 | 8,003 | ||||||||||||||||||||||||
31
Table of Contents
Liquidity and Capital Resources
Our primary capital requirements are for new restaurant development. Subject to availability
of capital on terms acceptable to us, we will pursue additional leases based on significant
economic opportunity. Similar to many restaurant chains, we utilize operating lease arrangements
for all of our restaurant locations. We believe that our operating lease arrangements provide
appropriate leverage for our capital structure in a financially efficient manner. We are typically
required to expend cash to perform site-related work and to construct and equip each restaurant.
The average investment cost for our restaurants depends upon the type of lease entered into, the
amount of tenant improvement allowance we receive from landlords, and whether we assume
responsibility for the construction of the building. We expect the cash investment cost of our
typical restaurant to be approximately $2.5 million, net of landlord tenant improvement allowances
between $0.7 million and $1.2 million, and excluding cash preopening expenses of approximately $0.4
million. We expect these costs will vary from one market to another based on real estate values,
zoning regulations, permitting requirements, labor markets and other variables. Restaurants that
are subject to ground leases and do not receive landlord tenant improvement allowances typically
require a significantly higher cash investment. We also require capital resources to maintain our
existing base of restaurants and to further expand and strengthen the capabilities of our corporate
and information technology infrastructures.
The following tables set forth, for the periods indicated, a summary of our key liquidity
measurements (amounts in thousands):
| December 31, | December 31, | |||||||
| 2009 | 2008 | |||||||
Cash and short-term investments(1) |
$ | 2,890 | $ | 2,847 | ||||
Net working capital (deficit)(2) |
(5,054 | ) | (7,653 | ) | ||||
| (1) | At December 31, 2009 and 2008, cash and short-term investments exclude $5.8
million and $6.5 million, respectively, in auction rate securities that are used as
collateral for the line of credit. Proceeds from the sale of auction rate securities
are used to reduce the outstanding balance on the line of credit. |
|
| (2) | The working capital deficit at December 31, 2009, is primarily attributable to
accruals for payroll, legal fees, and severance. The working capital deficit at
December 31, 2008 is principally due to $6.5 million of investments in auction rate
securities which were classified as non-current assets. |
| 2009 | 2008 | |||||||
Cash provided by operating activities |
$ | 5,341 | $ | 6,693 | ||||
Capital expenditures |
12,021 | 17,146 | ||||||
Future Capital Requirements
Our capital requirements, including development costs related to the opening of new
restaurants, have historically been significant. Over the last several years, we funded
development of new restaurants primarily from the proceeds of equity financing, debt financing, and
cash flows from operations. Our future cash requirements and the adequacy of available funds will
depend on many factors, including the operating performance of our restaurants, the pace of
expansion, real estate markets, site locations, the nature of the arrangements negotiated with
landlords and the credit market environment.
Our current operations generate sufficient cash flow to fund operations and general and
administrative costs. We believe existing cash and short-term investments of $2.9 million in
addition to cash flow from operations is sufficient to fund development costs required for our
Baltimore restaurant. Any reduction of our cash flow from operations may cause a delay or
cancellation of planned future restaurant development. As of December 31, 2009, we had a working
capital deficit of $5.1 million. We plan to reduce this deficit through cost containment efforts
and cash flow from operations. Financing to construct new restaurants may not be available on
acceptable terms, or at all, and our failure to raise capital when needed could impact our growth
plans, financial condition, and results of operations. Additional equity financing may result in
dilution to current shareholders and debt financing, if available, may involve significant cash
payment obligations or financial covenants and ratios that may restrict our ability to operate our
business.
32
Table of Contents
Bridge Loan
On March 6, 2009, and as amended on April 7, 2009, we entered into a Note and Warrant Purchase
Agreement with certain accredited investors whereby we sold $1.2 million aggregate principal amount
of 10% unsecured subordinated notes and warrants to purchase shares of our common stock. The
principal and accrued interest outstanding under the notes were due and payable upon the closing of
any offering of equity securities by our company generating gross proceeds to us of at least $2.5
million. For each $100,000 issued in notes, we issued to the noteholder three-year warrants to
purchase 10,000 shares of our common stock at an aggregate exercise price per share of $2.29, which
was equal to 120% of the five-day average of the closing price of our common stock during the five
trading days prior to the date of issuance. The bridge loan, including accrued interest, was
repaid during June 2009 upon completion of the rights offering described below. The holders of the
notes exercised over-subscription rights granted in the agreement and purchased 482,178 shares or
18.5% of the total shares sold in the rights offering.
Rights Offering
As part of the Note and Warrant Purchase Agreement, we filed with the SEC a registration
statement on Form S-3 to conduct a rights offering with targeted gross proceeds to us of $3,520,000
pursuant to which each of our stockholders received one non-transferrable subscription right for
every 2.5 shares of common stock owned on April 17, 2009. Each subscription right entitled the
holder to purchase one share of common stock at a price of $1.35 per share. The terms of the
agreement provided that any shares of common stock that were not subscribed for in the rights
offering by existing stockholders were offered to the holders of the notes on a pro rata basis
based on the aggregate principal amount of notes outstanding and at the same subscription price as
offered to the holders of subscription rights granted under the rights offering. We sold 2,608,045
shares of common stock pursuant to the rights offering and received net proceeds of $3,245,000
after deducting $275,000 in expenses. A portion of the net proceeds was used to repay amounts owed
on the notes, and the remaining proceeds are being utilized to fund capital expenditure
requirements.
Equipment Loans
As of December 31, 2009, we had five equipment term loans with a lender, each collateralized
by restaurant equipment. The outstanding principal balance under these loans aggregated $1.3
million. The loans bear interest at rates ranging from 7.0% to 8.5% and require monthly principal
and interest payments aggregating approximately $71,000. The loans mature between June 2010 and
June 2012. The loans also require us to maintain certain financial covenants, including a Fixed
Charge Coverage Ratio of 1.25:1.00 calculated at the end of each calendar year, and we were in
compliance with all such financial covenants as of December 31, 2009.
Credit Facility
During October 2008, as part of the settlement agreement with UBS, our broker from which we
purchased auction rate security instruments, we entered into a line of credit that is secured by
the auction rate security instruments held with UBS. Available borrowings under the line of credit
are based upon terms specified in the agreement and subject to adjustment by UBS after
consideration of various factors. At December 31, 2009, $5,800,000 was outstanding under the line
of credit. Borrowings under the line of credit are callable by UBS at any time. The line of
credit is classified as short-term in the accompanying consolidated balance sheets as the loan
expires on June 30, 2010. The cost of the line of credit effectively offsets the interest earned
on the auction rate securities. See Note 3 to the consolidated financial statements for further
information on the auction rate securities and the settlement agreement.
33
Table of Contents
Cash Flows
The following table summarizes our primary sources and uses of cash during the periods
presented.
| Year Ended December 31, | ||||||||||||
| 2009 | 2008 | 2007 | ||||||||||
| (In thousands) | ||||||||||||
Net cash provided by (used in): |
||||||||||||
Operating activities |
$ | 5,341 | $ | 6,693 | $ | 5,701 | ||||||
Investing activities |
(11,316 | ) | (10,118 | ) | (12,781 | ) | ||||||
Financing activities |
5,902 | 911 | 10,137 | |||||||||
Net (decrease) increase in cash and cash equivalents |
$ | (73 | ) | $ | (2,514 | ) | $ | 3,057 | ||||
Operating Activities. During 2009, net cash provided by operating activities was
$5.3 million and exceeded our net loss by $26.9 million due principally to non-cash asset
impairment charges, depreciation and amortization, and the timing of payment for accrued expenses.
During 2008, net cash provided by operating activities was $6.7 million and exceeded our net loss
by $17.2 million primarily due to depreciation and amortization, non-cash asset impairment charges,
and an increase in the deferred rent liability, partially offset by our net loss of $10.5 million.
During 2007, net cash provided by operating activities was $5.7 million and exceeded our net loss
by $6.4 million due principally to the effect of depreciation and amortization and an increase in
the deferred rent liability.
Investing activities. We fund the development and construction of new restaurants
primarily with cash and investments. Net cash used in investing activities during 2009 was $11.3
million primarily reflecting $12.0 million to fund construction of four restaurants opened during
the year. Net cash used in investing activities was $10.1 million during 2008 reflecting $17.1
million to fund construction at three restaurants opened during 2008 and one restaurant opened
during January 2009, as well as capital expenditures for existing restaurants and other restaurants
scheduled to open during 2009. This increase was partially offset by $7.3 million in proceeds from
the sale of investments to fund this construction. Net cash used in investing activities was
$12.8 million during 2007 which consisted primarily of $12.8 million in expenditures for leasehold
improvements and restaurant equipment principally to construct new restaurants.
Financing Activities. Net cash provided by financing activities was $5.9 million during 2009
reflecting $3.3 million in net borrowings under our line of credit and $3.2 million in net proceeds
from the subscription rights offering completed during June 2009, partially offset by $0.7 million
in principal payments on equipment loans. Net cash provided by financing activities was $0.9
million during 2008 principally consisting of $2.5 million in net borrowings under our line of
credit offset by the purchase of 116,200 shares of common stock under our stock repurchase program
at a total cost of $1.0 million, and $0.7 million in principal payments on equipment notes. Net
cash provided by financing activities was approximately $10.1 million during 2007 consisting
primarily of $10.0 million in net proceeds from the sale of common stock in a private placement
transaction, $0.6 million in proceeds primarily from the issuance of common stock as a result of
the exercise of stock options and warrants, partially offset by $0.6 million of principal payments
on equipment loans.
34
Table of Contents
Aggregate Contractual Obligations
The following table sets forth our contractual commitments as of December 31, 2009 (in
thousands).
| Payments Due by Period | ||||||||||||||||||||
| Less than | More than | |||||||||||||||||||
| Contractual Obligations | Total | 1 year | 1-3 years | 3-5 years | 5 years | |||||||||||||||
Long-term notes payable, including current portion |
$ | 1,320 | $ | 684 | $ | 636 | $ | — | $ | — | ||||||||||
Interest on notes payable |
116 | 81 | 35 | — | — | |||||||||||||||
Line of credit(1) |
5,800 | 5,800 | — | — | — | |||||||||||||||
Operating leases |
61,972 | 6,699 | 14,150 | 13,490 | 27,633 | |||||||||||||||
Total |
$ | 69,208 | $ | 13,264 | $ | 14,821 | $ | 13,490 | $ | 27,633 | ||||||||||
| (1) | The line of credit expires on June 30, 2010, but is callable upon demand. See Note 8 to
the consolidated financial statements for further information. |
The table above does not include obligations related to lease renewal option periods even
if it is reasonably assured that we will exercise the related option. In addition, the table above
does not reflect unrecognized tax benefits of $140,000, the timing of which is uncertain. Refer to
Note 9 of the Consolidated Financial Statements for additional discussion on unrecognized tax
benefits. We have evaluated and determined that we do not have any purchase obligations as defined
in the SEC Final Rule No. 67, Disclosure in Management’s Discussion and Analysis about Off-Balance
Sheet Arrangements and Aggregate Contractual Obligations.
Off-Balance Sheet Arrangements
We had no off-balance sheet guarantees or off-balance sheet arrangements as of December 31,
2009.
Critical Accounting Policies
Critical accounting policies are those that we believe are most important to the portrayal of
our financial condition and results of operations and also require our most difficult, subjective,
or complex judgments. Judgments or uncertainties regarding the application of these policies may
result in materially different amounts being reported under various conditions or using different
assumptions. We consider the following policies to be the most critical in understanding the
judgment that is involved in preparing our consolidated financial statements.
Fair Value Measurements
Our investment portfolio includes auction rate securities that are reflected at estimated fair
value in the consolidated balance sheets. We held auction rate securities with a par value of $5.8
million which are classified as trading securities at December 31, 2009. Historically, due to the
auction process that reset interest rates at pre-determined calendar intervals, quoted market
prices were readily available, which would have qualified as Level 1 under the fair value
hierarchy. Since February 2008, events in the credit markets have adversely affected the auction
market and auctions for these securities have failed, and, therefore, we were required to determine
the fair value of our auction rate securities using valuation models obtained from third parties.
We also elected to apply fair value accounting to the put option received from our broker as the
put option acts as an economic hedge against any further price movement in the auction rate
securities and enables us to recognize future changes in the fair value of the put option as those
changes occur to offset fair value movements in the auction rate securities.
As we rely on unobservable (Level 3) inputs, which are highly subjective, in determining the
fair value of our auction rate security instruments and related put option, the valuations could
vary significantly based on our assumptions. We use a discounted cash flow model to value our
auction rate security instruments. The valuation models require numerous assumptions and
assessments, including the following: (i) collateralization underlying each security; (ii) the
present value of future principal and interest payments discounted at rates considered to reflect
current market conditions; (iii) the creditworthiness of the counterparty; and (iv) the current
illiquidity of the investments. We determine the fair value of our put option through comparison
of the fair value of each auction rate security instrument to its par value and then discount this
amount by a rate reflective of the risk of default by the issuer between the valuation date and the
expected exercise date of the put option. These assumptions, assessments
and the interpretations of relevant market data are subject to uncertainties, are difficult to
predict and require significant judgment. The use of different assumptions, applying different
judgment to inherently subjective matters and changes in future market conditions could result in
significantly different estimates of fair value. The fair value of our auction rate securities
could change significantly based on market conditions and continued uncertainties in the credit
markets.
35
Table of Contents
Property and Equipment
We record property and equipment at cost less accumulated depreciation and we select useful
lives that reflect the actual economic lives of the underlying assets. We amortize leasehold
improvements over the shorter of the useful life of the asset or the related lease term. We
calculate depreciation using the straight-line method for financial statement purposes. We
capitalize improvements and expense repairs and maintenance costs as incurred. We are often
required to exercise judgment in our decision whether to capitalize an asset or expense an
expenditure that is for maintenance and repairs. Our judgments may produce materially different
amounts of repair and maintenance or depreciation expense if different assumptions were used.
We evaluate property and equipment for impairment whenever events or changes in restaurant
operating results indicate that the carrying value of those assets may not be recoverable. Factors
considered include, but are not limited to, significant underperformance relative to expected
historical or projected future operating results; significant negative industry or economic trends;
and significant changes in legal factors or in the business climate. The assessment of impairment
is performed on a restaurant-by-restaurant basis. The recoverability is assessed by comparing the
carrying value of the asset to the undiscounted cash flows expected to be generated by the asset.
This assessment process requires the use of estimates and assumptions regarding future cash flows
and estimated useful lives, which are subject to a significant degree of judgment. If indicators
of impairment are present and if we determine that the carrying value of the asset exceeds the fair
value of the restaurant assets, an impairment charge is recorded to reduce the carrying value of
the asset to its fair value. Calculation of fair value requires significant estimates and
judgments which could vary significantly based on our assumptions.
During 2009 and 2008, we recorded non-cash asset impairment charges for underperforming
restaurants. We continue to monitor the operating performance of each individual restaurant. We
may be required to record impairment charges in the future if certain restaurants perform below
expectations.
Leasing Activities
We lease all of our restaurant properties. At the inception of the lease, we evaluate each
property and classify the lease as an operating or capital lease in accordance with applicable
accounting standards. We exercise significant judgment in determining the estimated fair value of
the restaurant as well as the discount rate used to discount the future minimum lease payments.
The term used for this evaluation includes renewal option periods only in instances in which the
exercise of the renewal option can reasonably be assured and failure to exercise such option would
result in an economic penalty. All of our restaurant leases are classified as operating leases.
Our lease term used for straight-line rent expense is calculated from the date we take
possession of the leased premises through the lease termination date. There is potential for
variability in our “rent holiday” period which typically begins on the possession date and ends on
the store open date. Factors that may affect the length of the rent holiday period generally
include construction related delays. Extension of the rent holiday period due to delays in
restaurant opening will result in greater rent expensed during the rent holiday period.
We record contingent rent expense based on a percentage of restaurant sales, which exceeds
minimum base rent, over the periods the liability is incurred. Contingent rent expense is recorded
prior to achievement of specified sales levels if achievement of such amounts is considered
probable and estimable.
36
Table of Contents
Income Taxes
We provide for income taxes based on our estimate of federal and state tax liabilities. These
estimates consider, among other items, effective rates for state and local income taxes, allowable
tax credits for items such as taxes paid on reported tip income, estimates related to depreciation
and amortization expense allowable for tax purposes, and the tax deductibility of certain other
items. Our estimates are based on information available to us at the time we prepare the income
tax provision. We generally file our annual income tax returns several months after our fiscal
year end. Income tax returns are subject to audit by federal, state, and local governments,
generally years after the returns are filed. These returns could be subject to material
adjustments or differing interpretations of the tax laws.
Deferred income tax assets and liabilities are recognized for the expected future income tax
consequences of carryforwards and temporary differences between the book and tax basis of assets
and liabilities. Valuation allowances are established for deferred tax assets that are deemed more
likely than not to be realized in the near term. We must assess the likelihood that we will be
able to recover our deferred tax assets. If recovery is not likely, we establish valuation
allowances to offset any deferred tax asset recorded. The valuation allowance is based on our
estimates of future taxable income in each jurisdiction in which we operate, tax planning
strategies, and the period over which our deferred tax assets will be recoverable. In the event
that actual results differ from these estimates, we may be unable to implement certain tax planning
strategies or adjust these estimates in future periods. As we update our estimates, we may need to
establish an additional valuation allowance which could have a material negative impact on our
results of operations or financial position, or we could reduce our valuation allowances which
would have a favorable impact on our results of operations and financial position.
Stock-Based Compensation
We apply the Black-Scholes valuation model in determining the fair value of stock option
awards, which requires the use of a number of highly complex and subjective variables. These
variables include, but are not limited to the actual and projected employee and director stock
option exercise behavior, expected volatility, risk-free interest rate, expected dividends, and
expected term. Expected volatility is based on the historical volatility of a peer group of
companies over the expected life of the option as we do not have enough history trading as a public
company to calculate our own stock price volatility. We utilize historical data to estimate option
exercise and employee termination behavior within the valuation model. The risk-free interest rate
is based on the U.S. Treasury yield curve in effect at the time of grant for the expected term of
the option. We also estimate forfeitures at the time of grant and revise these estimates, if
necessary, in subsequent periods if actual forfeitures differ from those estimates. We estimate
forfeitures based on our expectation of future experience while considering our historical
experience. Changes in the subjective assumptions can materially affect the estimate of fair value
of stock-based compensation and consequently, the related amount recognized in the consolidated
statement of operations. We are also required to establish deferred tax assets for expense
relating to options that would be expected to generate a tax deduction under their original terms.
The recoverability of such assets are dependent upon the actual deduction that may be available at
exercise and can further be impaired by either the expiration of the option or an overall valuation
reserve on deferred tax assets.
We believe the estimates and assumptions related to these critical accounting policies are
appropriate under the circumstances; however, should future events result in unanticipated
consequences, there could be a material impact on our future financial condition or results of
operations.
Recent Accounting Pronouncements
See the Recent Accounting Pronouncements section of Note 1 to our consolidated financial
statements for a summary of new accounting standards.
37
Table of Contents
| Item 7A. | Quantitative and Qualitative Disclosures About Market Risk |
Interest Rates
We are exposed to market risk primarily from fluctuations in interest rates on our
investments. We held approximately $6.3 million in investments, including $5.8 million of auction
rate securities, as of December 31, 2009. Changes in interest rates affect the investment income
we earn on our investments and, therefore, impact our cash flows and results of operations. For
2009, the average interest rate earned on our investments was approximately 1.4%. A hypothetical
100 basis point decline in the interest rate earned on our investments would decrease our interest
income by approximately $50,000.
Primary Market Risk Exposures
Our primary market risk exposures are in the areas of commodity costs. Many of the food
products purchased by us can be subject to volatility due to changes in weather, production,
availability, seasonality, and other factors outside our control. Substantially all of our food
and supplies are available from several sources, which helps to diversify our overall commodity
cost risk. We also believe that we have the ability to increase certain menu prices in response to
food commodity price increases.
| Item 8. | Financial Statements and Supplementary Data |
Reference is made to the consolidated financial statements, the notes thereto, and the report
thereon, commencing on page F-1 of this report, which financial statements, notes, and report are
incorporated herein by reference.
| Item 9. | Changes in and Disagreements With Accountants on Accounting and Financial Disclosure |
Not applicable.
| Item 9A(T). | Controls and Procedures |
Evaluation of Disclosure Controls and Procedures
We have evaluated, with the participation of our Chief Executive Officer and Chief Financial
Officer, the effectiveness of our disclosure controls and procedures as of December 31, 2009.
Based on this evaluation, our Chief Executive Officer and Chief Financial Officer have each
concluded that our disclosure controls and procedures are effective to ensure that we record,
process, summarize, and report information required to be disclosed by us in our reports filed
under the Exchange Act within the time periods specified by the SEC’s rules and forms, and that
such information is accumulated and communicated to our management, including our Chief Executive
Officer and Chief Financial Officer, as appropriate, to allow timely decisions regarding required
disclosure.
Management’s Report on Internal Control Over Financial Reporting
We are responsible for establishing and maintaining adequate internal control over financial
reporting. As defined in the securities laws, internal control over financial reporting is a
process designed by, or under the supervision of, our principal executive and principal financial
officer and effected by our Board of Directors, management, and other personnel, to provide
reasonable assurance regarding the reliability of financial reporting and the preparation of
financial statements for external purposes in accordance with generally accepted accounting
principles and includes those policies and procedures that (i) pertain to the maintenance of
records that in reasonable detail accurately and fairly reflect the transactions and dispositions
of our assets; (ii) provide reasonable assurance that transactions are recorded as necessary to
permit preparation of financial statements in accordance with generally accepted accounting
principles, and that our receipts and expenditures are being made only in accordance with
authorizations of management and directors; and (iii) provide reasonable assurance regarding
prevention or timely detection of unauthorized acquisition, use or disposition of our assets that
could have a material effect on the
financial statements. Because of its inherent limitations, internal control over financial
reporting may not prevent or detect misstatements.
38
Table of Contents
Under the supervision and with the participation of our management, including our Chief
Executive Officer and Chief Financial Officer, we carried out an evaluation of the effectiveness of
our internal control over financial reporting as of December 31, 2009 based on the criteria in
“Internal Control — Integrated Framework” issued by the Committee of Sponsoring Organizations of
the Treadway Commission (“COSO”). Based upon this evaluation, we concluded that our internal
control over financial reporting was effective as of December 31, 2009.
This annual report does not include an attestation report of our independent registered public
accounting firm regarding internal control over financial reporting pursuant to temporary rules of
the SEC that permit us to provide only management’s report in this annual report on Form 10-K for
the year ended December 31, 2009.
Changes in Internal Control Over Financial Reporting
There has not been any change in our internal control over financial reporting during our
fourth fiscal quarter that has materially affected, or is reasonably likely to materially affect,
our internal control over financial reporting.
| Item 9B. | Other Information |
Not applicable.
PART III
| Item 10. | Directors, Executive Officers and Corporate Governance |
The information required by this Item relating to our directors is incorporated herein by
reference to the definitive Proxy Statement to be filed pursuant to Regulation 14A of the Exchange
Act for our 2010 Annual Meeting of Stockholders. The information required by this Item relating to
our executive officers is included in Part I, Item 1 “Business — Executive Officers.”
| Item 11. | Executive Compensation |
The information required by this Item is incorporated herein by reference to the information
contained in the definitive Proxy Statement to be filed pursuant to Regulation 14A of the Exchange
Act for our 2010 Annual Meeting of Stockholders.
| Item 12. | Security Ownership of Certain Beneficial Owners and Management and Related Stockholder
Matters |
The information required by this Item is incorporated herein by reference to the information
contained in the definitive Proxy Statement to be filed pursuant to Regulation 14A of the Exchange
Act for our 2010 Annual Meeting of Stockholders.
| Item 13. | Certain Relationships and Related Transactions, and Director Independence |
The information required by this Item is incorporated herein by reference to the information
contained in the definitive Proxy Statement to be filed pursuant to Regulation 14A of the Exchange
Act for our 2010 Annual Meeting of Stockholders.
| Item 14. | Principal Accountant Fees and Services |
The information required by this Item is incorporated herein by reference to the information
contained in the definitive Proxy Statement to be filed pursuant to Regulation 14A of the Exchange
Act for our 2010 Annual Meeting of Stockholders.
39
Table of Contents
PART IV
| Item 15. | Exhibits and Financial Statement Schedules |
(a) The following documents are filed as a part of the report:
| (1) | Financial Statements |
||
Financial Statements are listed in the Index to Consolidated Financial Statements on page F-1
of this report. |
|||
| (2) | Financial Statement Schedules |
||
No financial statement schedules are included because such schedules are not applicable, are
not required, or because required information is included in the consolidated financial
statements or notes thereto. |
|||
| (3) | Exhibits |
| Exhibit | ||||
| Number | Exhibit | |||
| 3.1 | Amended and Restated Certificate of Incorporation of the Registrant (2) |
|||
| 3.3 | Amended and Restated Bylaws of Kona Grill, Inc., as of October 30, 2007 (6) |
|||
| 3.4 | Certificate of Designations, Preferences, and Rights of Series A Junior Participating
Preferred Stock of Kona Grill, Inc. (8) |
|||
| 4.1 | Form of Common Stock Certificate (3) |
|||
| 4.2 | Kona Grill, Inc. Stockholders’ Agreement, dated August 29, 2003 (3) |
|||
| 4.3 | Kona Grill, Inc. Series A Investor Rights Agreement, dated August 29, 2003 (3) |
|||
| 4.4 | Amendment No. 1 to Kona Grill, Inc. Series A Investor Rights Agreement, dated May 31, 2005 (3) |
|||
| 4.9 | Form of First Amended and Restated Promissory Note, dated April 7, 2009, among Kona Grill,
Inc. and the investor parties thereto (10) |
|||
| 4.10 | Form of Warrant |
|||
| 10.6 | (a) | Loan Agreement, dated May 19, 2003, between GE Capital Franchise Finance Corporation and Kona
Grill Kansas City, Inc. (1) |
||
| 10.6 | (b) | Promissory Note, dated May 19, 2003, issued by Kona Grill Kansas City, Inc. in favor of GE
Capital Franchise Finance Corporation (1) |
||
| 10.7 | (a) | Loan Agreement, dated April 30, 2004, between GE Capital Franchise Finance Corporation and
Kona Grill Las Vegas, Inc. (1) |
||
| 10.7 | (b) | Promissory Note, dated April 30, 2004, issued by Kona Grill Las Vegas, Inc. in favor of GE
Capital Franchise Finance Corporation (1) |
||
| 10.8 | (a) | Form of Equipment Loan and Security Agreement (i) dated as of September 2, 2004, between Kona
Grill Denver, Inc. and GE Capital Franchise Finance Corporation; (ii) dated as of December
31, 2004, between Kona Grill Omaha, Inc. and GE Capital Franchise Finance Corporation; and
(iii) dated January 21, 2005 between Kona Grill Indiana, Inc. and GE Capital Franchise
Finance Corporation (1) |
||
| 10.8 | (b) | Form of Equipment Promissory Note, each in favor of GE Capital Franchise Finance Corporation
(i) dated as of April 22, 2005, issued by Kona Grill Omaha, Inc.; and (ii) dated as of May
20, 2005, issued by Kona Grill Indiana, Inc. (1) |
||
| 10.8 | (c) | Equipment Promissory Note, dated September 17, 2004, issued by Kona Grill Denver, Inc. in
favor of GE Capital Franchise Finance Corporation (1) |
||
| 10.10 | * | Kona Grill, Inc. 2002 Stock Plan (as of November 13, 2002) (1) |
||
| 10.11 | * | Kona Grill, Inc. 2005 Stock Award Plan (2) |
||
| 10.12 | * | Kona Grill, Inc. 2005 Employee Stock Purchase Plan (amended as of August 15, 2005) (4) |
||
| 10.15 | * | Form of Stock Option Agreement (2005 Stock Award Plan) (5) |
||
| 10.17 | Securities Purchase Agreement, dated November 1, 2007, among Kona Grill, Inc. and the
investor parties thereto (7) |
|||
| 10.21 | Note and Warrant Purchase Agreement, dated March 6, 2009, among Kona Grill, Inc. and the
investor parties thereto (9) |
|||
40
Table of Contents
| Exhibit | ||||
| Number | Exhibit | |||
| 10.22 | * | Employment Agreement, dated as of May 11, 2009, between the Company and Marcus E. Jundt (11) |
||
| 10.23 | * | Employment Agreement, dated as of May 11, 2009, between the Company and Mark L. Bartholomay
(11) |
||
| 10.24 | * | Employment Agreement, dated as of May 11, 2009, between the Company and Mark S. Robinow (11) |
||
| 10.25 | * | Separation Agreement, dated as of August 6, 2009, between the Company and Marcus E. Jundt (12) |
||
| 10.26 | * | Employment Agreement, dated as of November 2, 2009, between the Company and Marc A. Buehler
(13) |
||
| 10.27 | * | Separation Agreement, dated as of November 24, 2009, between the Company and Mark L.
Bartholomay (14) |
||
| 21 | List of Subsidiaries |
|||
| 23 | Consent of Independent Registered Public Accounting Firm |
|||
| 31.1 | Certification of Chief Executive Officer pursuant to Rule 13a-14(a) and Rule 15d-14(a),
promulgated under the Securities Exchange Act of 1934, as amended. |
|||
| 31.2 | Certification of Chief Financial Officer pursuant to Rule 13a-14(a) and Rule 15d-14(a),
promulgated under the Securities Exchange Act of 1934, as amended. |
|||
| 32.1 | Certification pursuant to 18 U.S.C. Section 1350, as adopted pursuant to Section 906 of the
Sarbanes-Oxley Act of 2002. |
|||
| 32.2 | Certification pursuant to 18 U.S.C. Section 1350, as adopted pursuant to Section 906 of the
Sarbanes-Oxley Act of 2002. |
|||
| * | Management contract or compensatory plan or arrangement in which directors or executive
officers are eligible to participate. |
|
| (1) | Incorporated by reference to the Registrant’s Registration Statement on Form S-1
(Registration No. 333-125506), as filed with the Commission on June 3, 2005. |
|
| (2) | Incorporated by reference to Amendment No. 1 to the Registrant’s Registration Statement on
Form S-1 (Registration No. 333-125506), as filed on July 8, 2005. |
|
| (3) | Incorporated by reference to Amendment No. 2 to the Registrant’s Registration Statement on
Form S-1 (Registration No. 333-125506), as filed on July 21, 2005. |
|
| (4) | Incorporated by reference to the Registrant’s Registration Statement on Form S-8
(Registration No. 333-127593), as filed with the Commission on August 16, 2005. |
|
| (5) | Incorporated by reference to the Registrant’s Quarterly Report on Form 10-Q for the quarter
ended March 31, 2006, as filed with the Commission on May 8, 2006. |
|
| (6) | Incorporated by reference to the Registrant’s Form 8-K filed on November 5, 2007. |
|
| (7) | Incorporated by reference to the Registrant’s Form 8-K filed on November 6, 2007. |
|
| (8) | Incorporated by reference to the Registrant’s Form 8-K filed on May 28, 2008. |
|
| (9) | Incorporated by reference to the Registrant’s Form 8-K filed on March 9, 2009. |
|
| (10) | Incorporated by reference to the Registrant’s Form 8-K filed on April 10, 2009. |
|
| (11) | Incorporated by reference to the Registrant’s Form 8-K filed on May 14, 2009. |
|
| (12) | Incorporated by reference to the Registrant’s Form 8-K filed on August 12, 2009. |
|
| (13) | Incorporated by reference to the Registrant’s Form 8-K filed on November 3, 2009. |
|
| (14) | Incorporated by reference to the Registrant’s Form 8-K filed on November 27, 2009. |
41
Table of Contents
Signatures
Pursuant to the requirements of Section 13 or 15(d) of the Securities Exchange Act of 1934,
the registrant has duly caused this report to be signed on its behalf by the undersigned, thereunto
duly authorized.
| Kona Grill, Inc. |
||||
| /s/ Marc A. Buehler | ||||
| Marc A. Buehler | ||||
| President and Chief Executive Officer | ||||
Date: March 4, 2010
Pursuant to the requirements of the Securities Exchange Act of 1934, this report has been
signed below by the following persons on behalf of the registrant and in the capacity and on the
dates indicated.
| Signature | Capacity | Date | ||
/s/ Marc A. Buehler
|
President, Chief Executive
Officer and Director (Principal Executive Officer) |
March 4, 2010 | ||
/s/ Mark S. Robinow
|
Executive Vice President, Chief
Financial Officer, and Secretary (Principal Accounting and Financial Officer) |
March 4, 2010 | ||
/s/ Richard J. Hauser
|
Director | March 4, 2010 | ||
/s/ Douglas G. Hipskind
|
Director | March 4, 2010 | ||
/s/ Berke Bakay
|
Director | March 4, 2010 | ||
/s/ Anthony L. Winczewski
|
Director | March 4, 2010 | ||
/s/ Mark A. Zesbaugh
|
Director | March 4, 2010 |
42
Table of Contents
KONA GRILL, INC.
INDEX TO CONSOLIDATED FINANCIAL STATEMENTS
| Page | ||||
| F-2 | ||||
| F-3 | ||||
| F-4 | ||||
| F-5 | ||||
| F-6 | ||||
| F-7 | ||||
F-1
Table of Contents
Report of Independent Registered Public Accounting Firm
The Board of Directors and Stockholders of Kona Grill, Inc.
We have audited the accompanying consolidated balance sheets of Kona Grill, Inc. as of December 31,
2009 and 2008, and the related consolidated statements of operations, stockholders’ equity, and
cash flows for each of the three years in the period ended December 31, 2009. These financial
statements are the responsibility of the Company’s management. Our responsibility is to express an
opinion on these financial statements based on our audits.
We conducted our audits in accordance with the standards of the Public Company Accounting Oversight
Board (United States). Those standards require that we plan and perform the audit to obtain
reasonable assurance about whether the financial statements are free of material misstatement. We
were not engaged to perform an audit of the Company’s internal control over financial reporting.
Our audits included consideration of internal control over financial reporting as a basis for
designing audit procedures that are appropriate in the circumstances, but not for the purpose of
expressing an opinion on the effectiveness of the Company’s internal control over financial
reporting. Accordingly, we express no such opinion. An audit also includes examining, on a test
basis, evidence supporting the amounts and disclosures in the financial statements, assessing the
accounting principles used and significant estimates made by management, and evaluating the overall
financial statement presentation. We believe that our audits provide a reasonable basis for our
opinion.
In our opinion, the financial statements referred to above present fairly, in all material
respects, the consolidated financial position of Kona Grill, Inc. at December 31, 2009 and 2008,
and the consolidated results of its operations and its cash flows for each of the three years in
the period ended December 31, 2009, in conformity with U.S. generally accepted accounting
principles.
/s/ Ernst & Young LLP
Phoenix, Arizona
March 4, 2010
March 4, 2010
F-2
Table of Contents
KONA GRILL, INC.
CONSOLIDATED BALANCE SHEETS
(In thousands, except share data)
| December 31, | ||||||||
| 2009 | 2008 | |||||||
ASSETS |
||||||||
Current assets: |
||||||||
Cash and cash equivalents |
$ | 2,404 | $ | 2,477 | ||||
Investments |
6,282 | 370 | ||||||
Receivables |
308 | 980 | ||||||
Other current assets |
1,111 | 938 | ||||||
Total current assets |
10,105 | 4,765 | ||||||
Long-term investments |
— | 6,491 | ||||||
Other assets |
668 | 794 | ||||||
Property and equipment, net |
39,190 | 53,504 | ||||||
Total assets |
$ | 49,963 | $ | 65,554 | ||||
LIABILITIES AND STOCKHOLDERS’ EQUITY |
||||||||
Current liabilities: |
||||||||
Accounts payable |
$ | 2,922 | $ | 4,335 | ||||
Accrued expenses |
5,753 | 4,878 | ||||||
Current portion of notes payable |
684 | 717 | ||||||
Line of credit |
5,800 | 2,488 | ||||||
Total current liabilities |
15,159 | 12,418 | ||||||
Notes payable |
636 | 1,320 | ||||||
Deferred rent |
16,185 | 16,218 | ||||||
Total liabilities |
31,980 | 29,956 | ||||||
Commitments and contingencies (Note 13) |
||||||||
Stockholders’ equity: |
||||||||
Preferred stock, $0.01 par value, 2,000,000 shares authorized; none issued |
— | — | ||||||
Common stock, $0.01 par value, 15,000,000 shares authorized, 9,262,895
shares issued and 9,146,695 shares outstanding at December 31, 2009 and
6,628,191 shares issued and 6,511,991 shares outstanding at December 31,
2008 |
93 | 66 | ||||||
Additional paid-in capital |
57,649 | 53,739 | ||||||
Accumulated deficit |
(38,759 | ) | (17,207 | ) | ||||
Treasury stock, at cost, 116,200 shares at December 31, 2009 and 2008 |
(1,000 | ) | (1,000 | ) | ||||
Total stockholders’ equity |
17,983 | 35,598 | ||||||
Total liabilities and stockholders’ equity |
$ | 49,963 | $ | 65,554 | ||||
See accompanying notes to the consolidated financial statements.
F-3
Table of Contents
KONA GRILL, INC.
CONSOLIDATED STATEMENTS OF OPERATIONS
(In thousands, except per share data)
| Year Ended December 31, | ||||||||||||
| 2009 | 2008 | 2007 | ||||||||||
Restaurant sales |
$ | 81,095 | $ | 75,815 | $ | 69,521 | ||||||
Costs and expenses: |
||||||||||||
Cost of sales |
21,058 | 20,730 | 19,600 | |||||||||
Labor |
28,517 | 25,396 | 21,554 | |||||||||
Occupancy |
6,457 | 5,157 | 4,465 | |||||||||
Restaurant operating expenses |
13,156 | 11,314 | 9,479 | |||||||||
General and administrative |
8,200 | 8,416 | 7,294 | |||||||||
Preopening expense |
1,685 | 2,073 | 1,962 | |||||||||
Depreciation and amortization |
7,314 | 6,547 | 5,428 | |||||||||
Asset impairment charge |
16,915 | 3,219 | — | |||||||||
Total costs and expenses |
103,302 | 82,852 | 69,782 | |||||||||
Loss from operations |
(22,207 | ) | (7,037 | ) | (261 | ) | ||||||
Nonoperating expenses: |
||||||||||||
Interest income and other, net |
204 | 296 | 617 | |||||||||
Interest expense |
(174 | ) | (51 | ) | (85 | ) | ||||||
(Loss) income from continuing operations before provision for income taxes |
(22,177 | ) | (6,792 | ) | 271 | |||||||
Provision for income taxes |
65 | 205 | 406 | |||||||||
Loss from continuing operations |
(22,242 | ) | (6,997 | ) | (135 | ) | ||||||
Gain (loss) from discontinued operations, net of tax |
690 | (3,504 | ) | (534 | ) | |||||||
Net loss |
$ | (21,552 | ) | $ | (10,501 | ) | $ | (669 | ) | |||
Net loss per share – Basic and Diluted (Note 1): |
||||||||||||
Continuing operations |
$ | (2.57 | ) | $ | (0.87 | ) | $ | (0.02 | ) | |||
Discontinued operations |
0.08 | (0.43 | ) | (0.07 | ) | |||||||
Net loss |
$ | (2.49 | ) | $ | (1.30 | ) | $ | (0.09 | ) | |||
Weighted average shares used in computation (Note 1): |
||||||||||||
Basic |
8,645 | 8,054 | 7,364 | |||||||||
Diluted |
8,645 | 8,054 | 7,364 | |||||||||
See accompanying notes to the consolidated financial statements.
F-4
Table of Contents
KONA GRILL, INC.
CONSOLIDATED STATEMENTS OF STOCKHOLDERS’ EQUITY
(In thousands)
| Accumulated | ||||||||||||||||||||||||||||
| Additional | Other | |||||||||||||||||||||||||||
| Common Stock | Paid-in | Accumulated | Treasury | Comprehensive | ||||||||||||||||||||||||
| Shares | Amount | Capital | Deficit | Stock | Income/(Loss) | Total | ||||||||||||||||||||||
Balances at December 31, 2006 |
5,848 | $ | 58 | $ | 41,722 | $ | (5,957 | ) | $ | — | $ | (1 | ) | $ | 35,822 | |||||||||||||
Cumulative effect adjustment upon adoption of FIN 48 |
— | — | 15 | (80 | ) | — | — | (65 | ) | |||||||||||||||||||
Tax benefit from stock option exercises |
— | — | 145 | — | — | — | 145 | |||||||||||||||||||||
Stock-based compensation expense |
— | — | 607 | — | — | — | 607 | |||||||||||||||||||||
Issuance of common stock, net of $594 of offering expenses |
650 | 7 | 9,962 | — | — | — | 9,969 | |||||||||||||||||||||
Issuance of common stock under the Employee Stock
Purchase Plan and exercise of stock options and warrants |
110 | 1 | 620 | — | — | — | 621 | |||||||||||||||||||||
Net loss |
— | — | — | (669 | ) | — | — | (669 | ) | |||||||||||||||||||
Unrealized holding gain (loss), net |
— | — | — | — | — | 1 | 1 | |||||||||||||||||||||
Comprehensive loss |
(668 | ) | ||||||||||||||||||||||||||
Balances at December 31, 2007 |
6,608 | 66 | 53,071 | (6,706 | ) | — | — | 46,431 | ||||||||||||||||||||
Stock-based compensation expense |
— | — | 582 | — | — | — | 582 | |||||||||||||||||||||
Purchase of treasury stock |
(116 | ) | — | — | — | (1,000 | ) | — | (1,000 | ) | ||||||||||||||||||
Issuance of common stock under the Employee Stock
Purchase Plan and exercise of stock options and warrants |
20 | — | 86 | — | — | — | 86 | |||||||||||||||||||||
Net loss |
— | — | — | (10,501 | ) | — | — | (10,501 | ) | |||||||||||||||||||
Unrealized holding gain (loss), net |
— | — | — | — | — | — | — | |||||||||||||||||||||
Comprehensive loss |
(10,501 | ) | ||||||||||||||||||||||||||
Balances at December 31, 2008 |
6,512 | 66 | 53,739 | (17,207 | ) | (1,000 | ) | — | 35,598 | |||||||||||||||||||
Stock-based compensation expense |
— | — | 560 | — | — | — | 560 | |||||||||||||||||||||
Issuance of common stock, net of $275 of offering expenses |
2,608 | 26 | 3,219 | — | — | — | 3,245 | |||||||||||||||||||||
Issuance of common stock under the Employee Stock
Purchase Plan and exercise of stock options and warrants |
27 | 1 | 61 | — | — | — | 62 | |||||||||||||||||||||
Warrants issued with bridge loan |
— | — | 70 | — | — | — | 70 | |||||||||||||||||||||
Net loss |
— | — | — | (21,552 | ) | — | — | (21,552 | ) | |||||||||||||||||||
Unrealized holding gain (loss), net |
— | — | — | — | — | — | — | |||||||||||||||||||||
Comprehensive loss |
(21,552 | ) | ||||||||||||||||||||||||||
Balances at December 31, 2009 |
9,147 | $ | 93 | $ | 57,649 | $ | (38,759 | ) | $ | (1,000 | ) | $ | — | $ | 17,983 | |||||||||||||
See accompanying notes to the consolidated financial statements.
F-5
Table of Contents
KONA GRILL, INC.
CONSOLIDATED STATEMENTS OF CASH FLOWS
(In thousands)
| Year Ended December 31, | ||||||||||||
| 2009 | 2008 | 2007 | ||||||||||
Operating activities |
||||||||||||
Net loss |
$ | (21,552 | ) | $ | (10,501 | ) | $ | (669 | ) | |||
Adjustments to reconcile net loss to net cash provided by operating activities: |
||||||||||||
Depreciation and amortization |
7,314 | 6,805 | 5,791 | |||||||||
Stock-based compensation |
560 | 582 | 607 | |||||||||
Asset impairment |
16,915 | 5,377 | — | |||||||||
Amortization of debt discount |
70 | — | — | |||||||||
Excess tax benefit related to stock option exercises |
— | — | (160 | ) | ||||||||
Change in operating assets and liabilities: |
||||||||||||
Receivables |
672 | 116 | (147 | ) | ||||||||
Other current assets |
(173 | ) | 455 | (652 | ) | |||||||
Accounts payable |
693 | (218 | ) | (1,123 | ) | |||||||
Accrued expenses |
875 | 853 | 603 | |||||||||
Deferred rent |
(33 | ) | 3,224 | 1,451 | ||||||||
Net cash provided by operating activities |
5,341 | 6,693 | 5,701 | |||||||||
Investing activities |
||||||||||||
Purchase of property and equipment |
(12,021 | ) | (17,146 | ) | (12,755 | ) | ||||||
Decrease (increase) in other assets |
126 | (299 | ) | (88 | ) | |||||||
Net purchases and sales of investments |
579 | 7,327 | 62 | |||||||||
Net cash used in investing activities |
(11,316 | ) | (10,118 | ) | (12,781 | ) | ||||||
Financing activities |
||||||||||||
Net borrowings on line of credit |
3,312 | 2,488 | — | |||||||||
Repayments of notes payable |
(717 | ) | (663 | ) | (613 | ) | ||||||
Proceeds from bridge loan |
1,200 | — | — | |||||||||
Repayment of bridge loan |
(1,200 | ) | — | — | ||||||||
Proceeds from issuance of common stock, net of issuance costs |
3,245 | — | 9,969 | |||||||||
Proceeds from issuance of common stock under the Employee Stock Purchase Plan and exercise of stock options and warrants |
62 | 86 | 621 | |||||||||
Purchase of treasury stock |
— | (1,000 | ) | — | ||||||||
Excess tax benefit related to stock option exercises |
— | — | 160 | |||||||||
Net cash provided by financing activities |
5,902 | 911 | 10,137 | |||||||||
Net (decrease) increase in cash and cash equivalents |
(73 | ) | (2,514 | ) | 3,057 | |||||||
Cash and cash equivalents at the beginning of the year |
2,477 | 4,991 | 1,934 | |||||||||
Cash and cash equivalents at the end of the year |
$ | 2,404 | $ | 2,477 | $ | 4,991 | ||||||
Supplemental disclosures of cash flow information |
||||||||||||
Cash paid for interest (net of capitalized interest) |
$ | 104 | $ | 51 | $ | 85 | ||||||
Cash paid for income taxes, net of refunds |
$ | 74 | $ | 110 | $ | — | ||||||
Noncash investing activities |
||||||||||||
(Decrease) increase in accounts payable related to property and equipment additions |
$ | (2,106 | ) | $ | 1,229 | $ | (169 | ) | ||||
See accompanying notes to the consolidated financial statements.
F-6
Table of Contents
KONA GRILL, INC.
NOTES TO CONSOLIDATED FINANCIAL STATEMENTS
DECEMBER 31, 2009
1. The Company and Summary of Significant Accounting Policies
Description of Business
Kona Grill, Inc. (referred to herein as the “Company” or “we,” “us,” and “our”) owns and
operates upscale casual dining restaurants under the name “Kona Grill.” Our restaurants feature a
diverse selection of mainstream American dishes and award-winning sushi that are prepared fresh
daily. We currently own and operate 24 restaurants in 15 states across the United States.
Basis of Presentation
The accompanying consolidated financial statements include the accounts and operations of the
Company and its wholly owned subsidiaries. All significant intercompany balances and transactions
have been eliminated in consolidation.
In connection with preparation of the consolidated financial statements, we evaluated
subsequent events after the balance sheet date of December 31, 2009 through March 4, 2010, the date
the financial statements were issued.
Use of Estimates
The preparation of financial statements in conformity with U.S. generally accepted accounting
principles requires management to make estimates and assumptions that affect the amounts reported
in the consolidated financial statements and accompanying notes. Actual results could differ from
those estimates.
Cash and Cash Equivalents
Cash and cash equivalents consist of cash, money market funds, and highly liquid short-term
fixed income securities with a maturity of 90 days or less when purchased. Amounts receivable from
credit card processors are also considered cash equivalents because they are both short-term and
highly liquid in nature and are typically converted to cash within one business day of the sales
transaction.
Investments
Investments consist primarily of auction rate securities, certificates of deposit, and
money market securities that are generally highly liquid in nature and represent the investment of
cash that is available for current operations. We generally invest in high quality securities that
are rated “AAA.” We classify our investments based on the intended holding period.
Available-for-sale securities are carried at estimated fair value, based on available market
information, with unrealized gains and losses, if any, reported as a separate component of
stockholders’ equity. Trading securities are carried at fair value with gains and losses reported
in the consolidated statements of operations.
Inventories
Inventories consist of food and beverage products and are stated at the lower of cost or
market using the first-in, first-out method. Inventories are included in other current assets in
the accompanying consolidated balance sheets.
Fair Value of Financial Instruments
The carrying amount of cash and cash equivalents, certificates of deposit, money market
securities, receivables, accounts payable, and accrued expenses approximates fair value because of
the immediate or short-term maturity of these financial instruments. Investments in auction rate
securities are recorded at fair value based on valuation models and methodologies using “Level 3”
inputs as defined by accounting guidance for fair value measurements. The fair value of long-term
debt is determined using current applicable rates for similar instruments and approximates the
carrying value of such obligations.
F-7
Table of Contents
KONA GRILL, INC.
NOTES TO CONSOLIDATED FINANCIAL STATEMENTS — (CONTINUED)
NOTES TO CONSOLIDATED FINANCIAL STATEMENTS — (CONTINUED)
Concentration of Credit Risk
Financial instruments that potentially subject us to a concentration of credit risk
principally consist of cash and cash equivalents, investments and accounts receivable.
Concentration of credit risk is limited by diversifying cash deposits among a variety of high
credit-quality issuers. At times, cash and cash equivalent balances may be in excess of the FDIC
insurance limit. Concentration of credit risk for our investments is limited by diversifying
investments among a variety of high credit-quality issuers. We consider our concentration of
credit risk with respect to receivables to be limited as the balance is primarily comprised of
tenant improvement allowances from landlords.
Property and Equipment
Property and equipment are stated at cost less accumulated depreciation. We capitalize all
direct costs on the construction of leasehold improvements and capitalize interest during the
construction and development period. Leasehold improvements are amortized over the shorter of the
useful life of the asset or the related lease term that includes reasonably assured lease renewals
as determined on the date of acquisition of the leasehold improvement. Improvements that
materially extend the life of an asset are capitalized while repair and maintenance costs are
expensed as incurred.
Depreciation and amortization are recorded on a straight-line basis over the following
estimated useful lives:
Furniture and fixtures |
5-7 years | |||
Equipment |
7 years | |||
Computer software and electronic equipment |
3 years | |||
Leasehold improvements |
Shorter of the useful life or the lease term | |||
We evaluate property and equipment for impairment whenever events or changes in restaurant
operating results indicate that the carrying value of those assets may not be recoverable. Factors
considered include, but are not limited to, significant underperformance relative to expected
historical or projected future operating results; significant negative industry or economic trends;
and significant changes in legal factors or in the business climate. The assessment of impairment
is performed on a restaurant-by-restaurant basis. The recoverability is assessed by comparing the
carrying value of the asset to the undiscounted cash flows expected to be generated by the asset.
This assessment process requires the use of estimates and assumptions regarding future cash flows
and estimated useful lives, which are subject to a significant degree of judgment. If indicators
of impairment are present and if we determine that the carrying value of the asset exceeds the fair
value of the restaurant assets, an impairment charge is recorded to reduce the carrying value of
the asset to its fair value. See Note 2 for discussion of asset impairment charges recorded during
2008 and 2009.
Leases
We lease our restaurant locations under operating lease agreements with initial terms of
approximately 10 to 20 years. Most of these agreements require minimum annual rent payments plus
contingent rent payments based on a percentage of restaurant sales which exceed the minimum base
rent. Contingent rent payments, to the extent they exceed minimum payments, are accrued over the
periods in which the liability is incurred. Rent expense associated with these contingent payments
is recorded prior to the achievement of specified sales levels if exceeding such amount is
considered probable and is estimable. The lease agreements typically also require scheduled
increases to minimum annual rent payments. For leases that contain rent escalations, we record the
total rent payable over the initial lease term, starting on the date we gain possession of the
property (including the construction period), on a straight-line basis. Any difference between
minimum rent and straight-line rent is recorded as deferred rent. Deferred rent also includes
tenant improvement allowances which are amortized as a reduction of rent expense on a straight-line
basis over the initial term of the lease.
F-8
Table of Contents
KONA GRILL, INC.
NOTES TO CONSOLIDATED FINANCIAL STATEMENTS — (CONTINUED)
NOTES TO CONSOLIDATED FINANCIAL STATEMENTS — (CONTINUED)
Revenue Recognition
Revenues from food, beverage, and alcohol sales are recognized when payment is tendered at the
point of sale. Restaurant sales are recorded net of promotions and discounts. Revenues from gift
card sales are recognized upon redemption. Prior to redemption, the outstanding balances of all
gift cards are included in accrued expenses in the accompanying consolidated balance sheets.
Sales Taxes
Revenues are presented net of sales taxes. The obligation is included in accrued expenses
until the taxes are remitted to the appropriate taxing authorities.
Advertising Costs
Advertising costs are expensed as incurred. Advertising expense for 2009, 2008, and
2007 was $1,063,000, $934,000, and $1,192,000, respectively, and is included in restaurant
operating expenses in the accompanying consolidated statements of operations. Costs associated
with the redemption of a promotion in the form of a coupon for a free or discounted product are
recorded in cost of sales as the intent of the coupon is to generate additional restaurant sales
through driving guest traffic. Costs associated with promotional giveaways of food and beverages
to local businesses and sponsorship of events are viewed as advertising in nature and recorded in
restaurant operating expenses in the accompanying consolidated statements of operations.
Preopening Expense
Costs directly related to the opening of new restaurants, including employee relocation,
travel, employee payroll and related training costs, and rent expense subsequent to the date we
take possession of the property through the restaurant opening, are expensed as incurred.
Stock-Based Compensation
We have two stock option plans under which we may issue incentive stock options, non-qualified
stock options, restricted stock, and other types of awards to employees, directors, and
consultants. Upon effectiveness of the 2005 Stock Award Plan, the 2002 Stock Award Plan was closed
for purposes of new grants. During the last three years, we have only granted non-qualified stock
options. Stock options issued under these plans are granted with an exercise price at or above the
fair market value of the underlying common stock on the date of grant and generally expire five
years from the date of grant. Employee stock options generally vest 25% each year over a four-year
period, while annual recurring awards for non-employee director options vest 25% each quarter over
a one-year period. Certain executive officer stock options may vest earlier in the event of a
change of control or termination, as defined in the executive officer’s employment agreement.
We apply the Black-Scholes valuation model in determining the fair value of stock option
grants. We recognize compensation cost for our stock awards using a graded vesting schedule on a
straight line basis over the requisite service period.
Income Taxes
We utilize the liability method of accounting for income taxes. Under the liability method,
deferred tax assets and liabilities are computed at each balance sheet date for temporary
differences between the consolidated financial statements and tax basis of assets and liabilities
that will result in taxable or deductible amounts in the future based on tax rates in effect in the
years in which the temporary differences are expected to affect taxable income. Valuation
allowances are established when necessary to reduce deferred tax assets to the amounts that will
more likely than not be realized.
F-9
Table of Contents
KONA GRILL, INC.
NOTES TO CONSOLIDATED FINANCIAL STATEMENTS — (CONTINUED)
NOTES TO CONSOLIDATED FINANCIAL STATEMENTS — (CONTINUED)
We recognize the impact of a tax position in our financial statements if that position is more
likely than not of being sustained on audit, based on the technical merits of the position. We
recognize accrued interest and penalties related to uncertain tax positions as income tax expense.
Net Loss Per Share
Basic net loss per share is computed by dividing net loss by the weighted average number of
common shares outstanding during the year. Diluted net loss per share excludes the dilutive effect
of potential stock option and warrant exercises, which are calculated using the treasury stock
method, as these shares are anti-dilutive.
The following table sets forth the computation of basic and diluted net loss per share:
| Year Ended December 31, | ||||||||||||
| 2009 | 2008 | 2007 | ||||||||||
| (In thousands, except per share data) | ||||||||||||
Numerator: |
||||||||||||
Loss from continuing operations |
$ | (22,242 | ) | $ | (6,997 | ) | $ | (135 | ) | |||
Gain (loss) from discontinued operations |
690 | (3,504 | ) | (534 | ) | |||||||
Net loss |
$ | (21,552 | ) | $ | (10,501 | ) | $ | (669 | ) | |||
Denominator: |
||||||||||||
Weighted average shares — basic |
8,645 | 8,054 | 7,364 | |||||||||
Effect of dilutive stock options and warrants |
— | — | — | |||||||||
Weighted average shares — diluted |
8,645 | 8,054 | 7,364 | |||||||||
Net loss per share — Basic and Diluted: |
||||||||||||
Continuing operations |
$ | (2.57 | ) | $ | (0.87 | ) | $ | (0.02 | ) | |||
Discontinued operations |
0.08 | (0.43 | ) | (0.07 | ) | |||||||
Net loss |
$ | (2.49 | ) | $ | (1.30 | ) | $ | (0.09 | ) | |||
On June 9, 2009, we completed our rights offering for which each holder of common
stock as of the April 17, 2009 record date received one non-transferrable subscription right for
every 2.5 shares of common stock. Each subscription right entitled our stockholders to purchase
one share of common stock at a purchase price of $1.35 per share. The market price of our common
stock was $3.93 per share on June 5, 2009, which was the expiration date of the rights offering.
Since the $1.35 per share subscription price of common stock issued under the rights offering was
lower than the $3.93 per share market price on June 5, 2009, the rights offering contained a bonus
element. As a result, we retroactively increased the weighted average common shares outstanding
used to compute basic and diluted earnings (loss) per share by an adjustment factor of 1.2309 for
all periods presented prior to the completion of the rights offering.
For 2009, 2008, and 2007, there were approximately 965,000, 1,033,000, and 855,000, stock
options and warrants outstanding, respectively, that were not included in the dilutive earnings per
share calculation because the effect would have been anti-dilutive.
Comprehensive Loss
Comprehensive loss is defined as the aggregate change in stockholders’ equity, excluding
changes in ownership interests. Comprehensive loss reported in the accompanying consolidated
statements of stockholders’ equity consists of net loss and unrealized gains or losses on
available-for-sale securities.
F-10
Table of Contents
KONA GRILL, INC.
NOTES TO CONSOLIDATED FINANCIAL STATEMENTS — (CONTINUED)
NOTES TO CONSOLIDATED FINANCIAL STATEMENTS — (CONTINUED)
Recent Accounting Pronouncements
In April 2009, the Financial Accounting Standards Board issued additional application guidance
and enhanced disclosures regarding fair value measurements and impairment of securities. The
guidance includes how to determine the fair value of assets and liabilities when the volume and
level of activity for the asset or liability has significantly decreased. Enhanced disclosure
requirements include the following: 1) interim disclosures regarding the fair values of financial
instruments that are not currently reflected on the balance sheet at fair value; and 2) disclosure
on the methods and significant assumptions used to estimate the fair value of financial instruments
on an interim basis as well as changes of the methods and significant assumptions from prior
periods. We adopted the additional guidance and disclosure requirements as of our second quarter
ended June 30, 2009. The adoption did not have a material effect on our financial condition or
results of operations.
2. Asset Impairment Charges and Discontinued Operations
Asset Impairment Charges
We review the carrying value of our long-lived assets on a restaurant-by-restaurant basis.
During 2009, we recorded non-cash asset impairment charges of $16,915,000 for six underperforming
restaurants based upon an assessment of each restaurant’s historical operating performance combined
with expected cash flows for these restaurants over the respective remaining lease term. We
reduced the carrying value of these assets to their estimated fair value which was determined using
a discounted cash flow model or the market value of each restaurant’s assets. The six restaurants
that comprise the asset impairment charge are located in the following cities: 1) Phoenix,
Arizona; 2) Stamford, Connecticut; 3)West Palm Beach, Florida; 4) Oak Brook, Illinois; 5) Baton
Rouge, Louisiana and 6) Sugar Land, Texas. We do not intend to close any of these restaurants at
this time, but will continue to evaluate each of these restaurants on a case-by-case basis.
Additionally during 2008, we recorded non-cash charges of $3,219,000 for the impairment of
long-lived assets at our Lincolnshire, Illinois restaurant based upon the restaurant’s past and
present operating performance combined with our assessment of expected cash flows from this
location over the remainder of the original lease term. We intend to continue operating this
restaurant and believe that the operating performance of this restaurant can be improved. No asset
impairment charges were recorded during 2007.
Discontinued Operations
On September 13, 2008, we closed our Naples, Florida restaurant to focus our attention on the
profitable locations and position our concept to generate profit from operations. As a result of
the closure, we recorded non-cash asset impairment charges of $2,158,000 as well as ongoing
contractual lease obligations, restaurant-level closing costs, and employee termination benefits,
net of deferred costs, of approximately $800,000 during 2008.
Gain (loss) from discontinued operations includes both the historical results of operations as
well as exit costs attributed to the Naples, Florida restaurant. During the second quarter of
2009, we entered into a settlement agreement for the termination of the lease for $700,000. As the
settlement amount was less than the lease termination accrual previously recorded during 2008, we
recorded a gain of $690,000, after deducting fees and other expenses, for 2009. Gain (loss) from
discontinued operations, net of tax is comprised of the following (in thousands):
| Year Ended December 31, | ||||||||||||
| 2009 | 2008 | 2007 | ||||||||||
Restaurant sales |
$ | — | $ | 1,531 | $ | 2,737 | ||||||
Gain (loss) from discontinued operations before income tax benefit |
$ | 690 | $ | (3,579 | ) | $ | (590 | ) | ||||
Income tax benefit |
— | 75 | 56 | |||||||||
Gain (loss) from discontinued operations, net of tax |
$ | 690 | $ | (3,504 | ) | $ | (534 | ) | ||||
F-11
Table of Contents
KONA GRILL, INC.
NOTES TO CONSOLIDATED FINANCIAL STATEMENTS — (CONTINUED)
NOTES TO CONSOLIDATED FINANCIAL STATEMENTS — (CONTINUED)
Activity associated with the lease termination accrual is summarized below (in thousands):
Balance at December 31, 2008 |
$ | 1,417 | ||
Cash payments |
(546 | ) | ||
Non-cash activity |
(690 | ) | ||
Balance at December 31, 2009 |
$ | 181 | ||
Non-cash activity reflects the revised estimate of lease termination costs based upon the
settlement agreement discussed above. The lease settlement required an initial payment of $350,000
that was paid during July 2009 and the remaining amount, including interest at a 6% annual rate, is
payable in 12 equal monthly installments beginning in August 2009. Settlement fees of $181,000 are
included in accrued expenses on the accompanying consolidated balance sheet as of December 31,
2009.
3. Investments
The following is a summary of our investments (in thousands):
| Gross | ||||||||||||
| Adjusted | Unrealized | Estimated | ||||||||||
| Cost | Losses | Fair Value | ||||||||||
December 31, 2009 |
||||||||||||
Short-term investments: |
||||||||||||
Certificates of deposit |
$ | 172 | $ | — | $ | 172 | ||||||
Money market securities |
314 | — | 314 | |||||||||
Auction rate securities |
5,433 | — | 5,433 | |||||||||
Put option on auction rate securities |
363 | — | 363 | |||||||||
Total investments |
$ | 6,282 | $ | — | $ | 6,282 | ||||||
December 31, 2008 |
||||||||||||
Short-term investments: |
||||||||||||
Certificates of deposit |
$ | 370 | $ | — | $ | 370 | ||||||
Long-term investments: |
||||||||||||
Auction rate securities |
5,858 | — | 5,858 | |||||||||
Put option on auction rate securities |
633 | — | 633 | |||||||||
| 6,491 | — | 6,491 | ||||||||||
Total investments |
$ | 6,861 | $ | — | $ | 6,861 | ||||||
As of December 31, 2009, our investment portfolio included six auction rate securities with a
par value of $5,800,000. These securities are AAA rated long term debt obligations secured by
student loans, substantially all of which are guaranteed by the federal government under the
Federal Family Education Loan Program. While the maturity dates of our auction rate securities
range from 2029 to 2046, liquidity for these securities has historically been provided by an
auction process that resets the applicable interest rate at pre-determined calendar intervals,
generally every 28 days. Since February 2008, events in the credit markets have adversely affected
the auction market for these types of securities and auctions for our securities have failed to
settle on their respective settlement dates. During August 2009, we were able to sell $800,000 of
these securities at par value. The proceeds from the sale were used to pay down a portion of the
outstanding balance under the line of credit.
F-12
Table of Contents
KONA GRILL, INC.
NOTES TO CONSOLIDATED FINANCIAL STATEMENTS — (CONTINUED)
NOTES TO CONSOLIDATED FINANCIAL STATEMENTS — (CONTINUED)
Our auction rate securities are classified as trading securities as they are subject to an
agreement we entered into with UBS during October 2008 pursuant to which UBS issued to us Series
C-2 Auction Rate Securities Rights. The agreement allows us the right to sell our auction rate
securities to UBS at full par value between June 30, 2010 and July 2, 2012. In conjunction with
this agreement, we elected to apply the provisions of fair value accounting to this put option
because the put option does not provide for net settlement, and the auction rate securities
themselves are not readily convertible to cash. The put option does not meet the definition of a
derivative, and thus, would not
be marked to fair value. We therefore elected to apply fair value accounting to our put
option as the put option acts as an economic hedge against any further price movement in the
auction rate securities and enables us to recognize future changes in the fair value of the put
option as those changes occur to offset fair value movements in the auction rate securities. Also
as part of this agreement, UBS agreed to provide a line of credit through June 30, 2010 that is
secured by the auction rate securities held with UBS. Both the put option and the auction rate
securities are marked to market value through the consolidated statements of operations each period
(see Note 4 for discussion of how fair value measurements are determined). At December 31, 2009,
the fair value of the put option was $363,000 and the fair value of the auction rate securities was
$5,433,000. We recorded a net gain of $105,000 during 2009 and a net loss of $109,000 during 2008
for the fair value measurement of both the auction rate securities and the put option that is
included in interest income and other, net. As of June 30, 2009, we reclassified our auction rate
securities and put option from long-term to short-term investments on our consolidated balance
sheet due to the expected timing of when these securities will be redeemed at par value by UBS. We
continue to earn interest on our auction rate securities at the maximum contractual rate. Interest
earned on the auction rate securities is used to reduce the outstanding balance under the line of
credit.
4. Fair Value Measurements
Fair value is defined as the price that would be received to sell an asset or paid to transfer
a liability in an orderly transaction between market participants at the measurement date. As
such, fair value is a market-based measurement that should be determined based on assumptions that
market participants would use in pricing an asset or a liability. As a basis for considering such
assumptions, a three-tier value hierarchy has been established, which prioritizes the inputs used
in the valuation methodologies in measuring fair value.
| Level 1: | Fair values determined by quoted prices in active markets for identical assets or
liabilities that the reporting entity has the ability to access. |
| Level 2: | Fair values utilize inputs other than quoted prices that are observable for the asset or
liability, and may include quoted prices for similar assets and liabilities in active markets,
and inputs other than quoted prices that are observable for the asset or liability. |
| Level 3: | Fair values determined by unobservable inputs that are not corroborated by market data
and may reflect the reporting entity’s own assumptions market participants would use in
pricing the asset or liability. |
Our short-term investments in certificates of deposit and money market securities represent
available-for-sale securities that are valued primarily using quoted market prices or alternative
pricing sources and models utilizing market observable inputs. Money market securities represent
collateral for a letter of credit required under certain lease obligations.
Our investment in auction rate securities are classified within Level 3 because they are
valued using a discounted cash flow model. We estimate the fair value of auction rate securities
using valuation models provided by third parties and internal analyses. The valuation models
require numerous assumptions and assessments, including the following: (i) collateralization
underlying each security; (ii) present value of future principal and interest payments discounted
at rates considered to reflect current market conditions; (iii) creditworthiness of the
counterparty; and (iv) current illiquidity of the investments.
F-13
Table of Contents
KONA GRILL, INC.
NOTES TO CONSOLIDATED FINANCIAL STATEMENTS — (CONTINUED)
NOTES TO CONSOLIDATED FINANCIAL STATEMENTS — (CONTINUED)
The fair value of the put option is determined through comparison of the fair value
of each auction rate security to its par value and then discounted by a rate reflective of the risk of default by UBS between the valuation date and the expected exercise date of the put option. A discounted cash flow approach is used to value the difference between the par value and fair value of each security using a discount rate that considers the credit risk associated with UBS and the expected timing of when the put option will be exercised. The put option is adjusted at each balance sheet date based
on its then fair value. The fair value of the put option is based on unobservable inputs and is therefore classified within Level 3 in the hierarchy. The following table presents information about our assets measured at fair value on a recurring basis at December 31, 2009, and indicates the fair value hierarchy of the valuation techniques utilized to determine such fair value (in thousands):
| Fair Value Measurements at Reporting Date Using | ||||||||||||||||
| Quoted Prices in | Significant | |||||||||||||||
| Active Markets | Other | Significant | ||||||||||||||
| for Identical | Observable | Unobservable | ||||||||||||||
| Assets | Inputs | Inputs | December 31, | |||||||||||||
| Description | (Level 1) | (Level 2) | (Level 3) | 2009 | ||||||||||||
Certificates of deposit |
$ | 172 | $ | — | $ | — | $ | 172 | ||||||||
Money market securities |
314 | — | — | 314 | ||||||||||||
Auction rate securities |
— | — | 5,433 | 5,433 | ||||||||||||
Put option on auction rate securities |
— | — | 363 | 363 | ||||||||||||
| $ | 486 | $ | — | $ | 5,796 | $ | 6,282 | |||||||||
The following table summarizes the changes in fair value of our Level 3 assets (in
thousands):
| Put option on | ||||||||
| Auction rate | auction rate | |||||||
| securities | securities | |||||||
Balance at December 31, 2008 |
$ | 5,858 | $ | 633 | ||||
Transfer to Level 3 |
— | — | ||||||
Total gains or losses (realized and unrealized) |
||||||||
Included in earnings |
375 | (270 | ) | |||||
Included in other comprehensive loss |
— | — | ||||||
Net settlements |
(800 | ) | — | |||||
Balance at December 31, 2009 |
$ | 5,433 | $ | 363 | ||||
As discussed in Note 2, we recorded asset impairment charges for long-lived assets
associated with six of our restaurants. These long-lived assets had a carrying amount of
$17,444,000 and were written down to their estimated fair value of $529,000. The fair value of
each restaurant’s long-lived assets was determined using either a discounted cash flow model or the
market value of each restaurant’s long-lived assets. The market value was determined based upon
market prices for similar assets in active markets and are classified within Level 2. Valuations
using discounted cash flows are classified within Level 3 as these valuations were determined by
projecting future cash flows of each restaurant and discounting those cash flows at a rate
reflective of current market conditions and factors specific to our company. The following table
presents information about our assets measured at fair value on a non-recurring basis at December
31, 2009, and indicates the fair value hierarchy of the valuation techniques utilized to determine
such fair value (in thousands):
| Fair Value Measurements at Reporting Date Using | ||||||||||||||||
| Quoted Prices in | Significant | |||||||||||||||
| Active Markets | Other | Significant | ||||||||||||||
| for Identical | Observable | Unobservable | ||||||||||||||
| Assets | Inputs | Inputs | ||||||||||||||
| Description | (Level 1) | (Level 2) | (Level 3) | Total Losses | ||||||||||||
Property and equipment |
$ | — | $ | 427 | $ | 102 | $ | (16,915 | ) | |||||||
5. Receivables
Receivables consisted of the following (in thousands):
| December 31, | ||||||||
| 2009 | 2008 | |||||||
Landlord tenant improvement allowances |
$ | 300 | $ | 970 | ||||
Other |
8 | 10 | ||||||
Total receivables |
$ | 308 | $ | 980 | ||||
No allowance for doubtful accounts has been recorded as collection of tenant improvement
allowances and other receivables is considered probable.
F-14
Table of Contents
KONA GRILL, INC.
NOTES TO CONSOLIDATED FINANCIAL STATEMENTS — (CONTINUED)
NOTES TO CONSOLIDATED FINANCIAL STATEMENTS — (CONTINUED)
6. Property and Equipment
Property and equipment consisted of the following (in thousands):
| December 31, | ||||||||
| 2009 | 2008 | |||||||
Leasehold improvements |
$ | 44,878 | $ | 49,299 | ||||
Equipment |
12,491 | 13,406 | ||||||
Furniture and fixtures |
3,208 | 3,548 | ||||||
| 60,577 | 66,253 | |||||||
Less accumulated depreciation and amortization |
(21,525 | ) | (20,004 | ) | ||||
| 39,052 | 46,249 | |||||||
Construction in progress |
138 | 7,255 | ||||||
Total property and equipment, net |
$ | 39,190 | $ | 53,504 | ||||
7. Accrued Expenses
Accrued expenses consisted of the following (in thousands):
| December 31, | ||||||||
| 2009 | 2008 | |||||||
Accrued payroll |
$ | 1,875 | $ | 1,846 | ||||
Gift cards |
859 | 654 | ||||||
Business and income taxes |
739 | 663 | ||||||
Sales taxes |
686 | 643 | ||||||
Accrued occupancy |
192 | 255 | ||||||
Lease termination accrual |
181 | — | ||||||
Other |
1,221 | 817 | ||||||
Total accrued expenses |
$ | 5,753 | $ | 4,878 | ||||
8. Debt and Credit Agreements
Line of Credit
During October 2008, as part of the settlement agreement with UBS, our broker from which we
purchased auction rate security instruments, we entered into a line of credit that is secured by
the auction rate security instruments held with UBS. Available borrowings under the line of credit
are based upon terms specified in the agreement and are subject to adjustment by UBS after
consideration of various factors. At December 31, 2009, $5,800,000 was outstanding under the line
of credit. Borrowings under the line of credit are callable by UBS at any time. The line of
credit is classified as short-term in the accompanying consolidated balance sheets as the loan
expires on June 30, 2010. The cost of the line of credit effectively offsets the interest earned
on the auction rate securities. See Note 3 for further information on the auction rate securities
and the settlement agreement.
Bridge Loan
On March 6, 2009, and as amended on April 7, 2009, we entered into a Note and Warrant Purchase
Agreement with certain accredited investors whereby we sold $1,200,000 aggregate principal amount
of 10% unsecured subordinated notes and warrants to purchase shares of our common stock. The
principal and accrued interest outstanding under the notes were due and payable upon the closing of
any offering of equity securities generating gross proceeds to us of at least $2,500,000. As
described in Note 10 below, we completed a rights offering during June 2009 and used a portion of
the proceeds to repay amounts owed on the notes.
F-15
Table of Contents
KONA GRILL, INC.
NOTES TO CONSOLIDATED FINANCIAL STATEMENTS — (CONTINUED)
NOTES TO CONSOLIDATED FINANCIAL STATEMENTS — (CONTINUED)
For each $100,000 issued in notes, we issued to the noteholder three-year warrants to purchase
10,000 shares of our common stock at an aggregate exercise price per share of $2.29, which was
equal to 120% of the five-day average of the closing price of our common stock during the five
trading days prior to the date of issuance. In connection with the issuance of the warrants, we
recorded a discount to the bridge loan and a corresponding increase in stockholders’ equity of
$70,000 due to the warrants. The value of the warrants was derived through application of the
Black-Scholes option pricing model. We amortized the debt discount to interest expense in the
amount of $70,000 for 2009.
Notes Payable
Notes payable consisted of the following:
| December 31, | ||||||||
| 2009 | 2008 | |||||||
| (In thousands) | ||||||||
$1,000,000 equipment loan, collateralized
by certain restaurant assets of the
Company, payable in monthly installments
of $15,521 including interest at 7.87%,
until October 2011, at which time all
remaining principal and interest is due
and payable |
$ | 317 | $ | 472 | ||||
$1,000,000 equipment loan, collateralized
by certain restaurant assets of the
Company, payable in monthly installments
of $15,526 including interest at 7.88%,
until May 2011, at which time all
remaining principal and interest is due
and payable |
249 | 409 | ||||||
$993,544 equipment loan, collateralized by
certain restaurant assets of the Company,
payable in monthly installments of $15,015
including interest at 7.04%, until June
2010, at which time all remaining
principal and interest is due and payable |
88 | 256 | ||||||
$600,000 equipment loan, collateralized by
certain restaurant assets of the Company,
payable in monthly installments of $9,508
including interest at 8.52%, until May
2012, at which time all remaining
principal and interest is due and payable |
248 | 337 | ||||||
$995,000 equipment loan, collateralized by
certain restaurant assets of the Company,
payable in monthly installments of $15,687
including interest at 8.36%, until June
2012, at which time all remaining
principal and interest is due and payable |
418 | 563 | ||||||
Total notes payable |
1,320 | 2,037 | ||||||
Less current portion |
(684 | ) | (717 | ) | ||||
Total notes payable, net of current portion |
$ | 636 | $ | 1,320 | ||||
Future maturities of notes payable at December 31, 2009 are as follows (in thousands):
2010 |
$ | 684 | ||
2011 |
504 | |||
2012 |
132 | |||
Total notes payable |
$ | 1,320 | ||
The equipment loans require us to maintain a corporate fixed charge coverage ratio of at least
1.25:1.00 determined on the last day of each fiscal year. We were in compliance with the required
coverage ratio as of December 31, 2009. Each equipment loan is collateralized by certain of our
restaurant assets. During 2009, 2008, and 2007, we incurred gross interest expense of $312,000,
$199,000, and $242,000, respectively. We capitalized $138,000, $148,000, and $157,000 of interest
costs during 2009, 2008, and 2007, respectively.
F-16
Table of Contents
KONA GRILL, INC.
NOTES TO CONSOLIDATED FINANCIAL STATEMENTS — (CONTINUED)
NOTES TO CONSOLIDATED FINANCIAL STATEMENTS — (CONTINUED)
9. Income Taxes
Income tax expense from continuing operations consisted of the following (in thousands):
| Year Ended December 31, | ||||||||||||
| 2009 | 2008 | 2007 | ||||||||||
Current: |
||||||||||||
Federal(1) |
$ | — | $ | 15 | $ | 190 | ||||||
State(1) |
65 | 190 | 216 | |||||||||
| 65 | 205 | 406 | ||||||||||
Deferred: |
||||||||||||
Federal |
— | — | — | |||||||||
State |
— | — | — | |||||||||
| — | — | — | ||||||||||
Total |
$ | 65 | $ | 205 | $ | 406 | ||||||
| (1) | Excludes federal and state tax benefits resulting from the exercise of stock options, which
were credited directly to “Additional paid-in capital.” |
Income tax expense differed from amounts computed by applying the federal statutory
rate to (loss) income from continuing operations before provision for income taxes as follows (in
thousands):
| Year Ended December 31, | ||||||||||||
| 2009 | 2008 | 2007 | ||||||||||
Income tax (benefit) expense at federal statutory rate |
$ | (7,540 | ) | $ | (2,309 | ) | $ | 96 | ||||
State income taxes, net of federal benefit |
(839 | ) | 125 | 88 | ||||||||
Nondeductible expenses |
362 | 373 | 305 | |||||||||
Business tax credit |
(910 | ) | (1,028 | ) | (831 | ) | ||||||
Other |
(3 | ) | (63 | ) | 70 | |||||||
Discontinued operations |
235 | (1,353 | ) | (175 | ) | |||||||
Change in valuation reserve |
8,760 | 4,460 | 853 | |||||||||
Total |
$ | 65 | $ | 205 | $ | 406 | ||||||
The temporary differences that give rise to significant portions of deferred tax assets and
liabilities were as follows (in thousands):
| December 31, | ||||||||
| 2009 | 2008 | |||||||
Deferred tax assets (liabilities): |
||||||||
Net operating loss carryforward |
$ | 2,533 | $ | 845 | ||||
Deferred rent |
5,971 | 5,474 | ||||||
Business tax credits |
3,779 | 2,869 | ||||||
Organizational and preopening costs |
162 | 216 | ||||||
Impairment of assets |
7,487 | 1,200 | ||||||
Stock-based compensation |
905 | 708 | ||||||
Accrued expenses |
125 | 643 | ||||||
Property and equipment |
(4,784 | ) | (4,601 | ) | ||||
Accelerated tax depreciation |
792 | 850 | ||||||
Other |
128 | 134 | ||||||
Net deferred tax assets |
17,098 | 8,338 | ||||||
Valuation allowance |
(17,098 | ) | (8,338 | ) | ||||
Total |
$ | — | $ | — | ||||
F-17
Table of Contents
KONA GRILL, INC.
NOTES TO CONSOLIDATED FINANCIAL STATEMENTS — (CONTINUED)
NOTES TO CONSOLIDATED FINANCIAL STATEMENTS — (CONTINUED)
The valuation allowance increased by approximately $8,760,000 and $4,460,000 at December 31,
2009 and 2008, respectively. In assessing the realization of deferred tax assets, we consider
whether it is more likely than not that some portion or all of the deferred tax assets will not be
realized. The ultimate realization of deferred tax assets is dependent upon the generation of
future taxable income during the periods in which those temporary differences become deductible.
We consider the scheduled reversal of deferred tax liabilities, projected future taxable income,
and tax planning strategies in making this assessment. Based on historical operating losses, we
have elected to maintain a full valuation allowance until realization of deferred tax assets is
more likely than not.
At December 31, 2009, we have approximately $6,205,000 and $11,656,000 in federal and state
net operating loss carryforwards, respectively, which begin expiring in 2028 for federal income tax
purposes and 2011 for state income tax purposes. We also have federal business tax credit
carryforwards of approximately $3,780,000 which begin expiring in 2021. These credits are also
potentially subject to annual limitations due to ownership change rules under the Internal Revenue
Code.
As of December 31, 2009, we had $140,000 of unrecognized tax benefits. Future changes in the
unrecognized tax benefits are not expected to have a material impact on the effective tax rate, nor
do we expect that the amount of unrecognized tax benefits will significantly change in the next 12
months. A reconciliation of the beginning and ending amount of unrecognized tax benefits is as
follows (in thousands):
| Year Ended December 31, | ||||||||||||
| 2009 | 2008 | 2007 | ||||||||||
Beginning balance |
$ | 158 | $ | 167 | $ | 80 | ||||||
Additions related to current year tax positions |
— | — | 35 | |||||||||
Additions related to tax positions taken during the prior period |
— | 1 | 52 | |||||||||
Reductions related to settlements with taxing authorities |
— | — | — | |||||||||
Reductions due to lapse of statute of limitations |
(18 | ) | (10 | ) | — | |||||||
Ending balance |
$ | 140 | $ | 158 | $ | 167 | ||||||
We recognize interest and penalties related to uncertain tax positions in income tax expense.
For the years ended December 31, 2009, 2008, and 2007 provision for income taxes includes $12,000,
$12,000, and $14,000, respectively, in interest and penalties on unrecognized tax benefits. We had
$36,000 and $30,000 accrued for the payment of interest and penalties at December 31, 2009 and
2008, respectively.
We are subject to U.S. federal income tax as well as income tax of multiple state
jurisdictions. The earliest tax year still subject to examination by a significant taxing
jurisdiction is 2005.
10. Stockholders’ Equity
Preferred Stock
We are authorized to issue 2,000,000 shares of preferred stock with a par value of $0.01.
There were no shares of preferred stock that were issued or outstanding at December 31, 2009 or
2008.
Common Stock
Private Placement
On November 6, 2007, we sold 650,000 shares of common stock at a purchase price of $16.25 per
share in a private placement to accredited institutional investors. We received net proceeds of
$9,969,000 (net of $594,000 in related fees and expenses). These proceeds were utilized to fund
new restaurant development and for general corporate purposes.
F-18
Table of Contents
KONA GRILL, INC.
NOTES TO CONSOLIDATED FINANCIAL STATEMENTS — (CONTINUED)
NOTES TO CONSOLIDATED FINANCIAL STATEMENTS — (CONTINUED)
Rights Offering
As part of the Note and Warrant Purchase Agreement discussed in Note 8, we filed with the SEC
a registration statement on Form S-3 to conduct a subscription rights offering with targeted gross
proceeds to us of $3,520,000 pursuant to which each of our stockholders received one
non-transferrable subscription right for every 2.5 shares of common stock owned on April 17, 2009.
Each subscription right entitled the holder to purchase one share of common stock at a price of
$1.35 per share. The terms of the agreement provided that any shares of common stock that were not
subscribed for in the rights offering by existing stockholders were offered to the holders of the
notes on a pro rata basis based on the aggregate principal amount of notes outstanding and at the
same subscription price as offered to the holders of subscription rights granted under the rights
offering. We sold 2,608,045 shares of common stock pursuant to the rights offering, including the
exercise of over-subscription rights by the holders of the notes for the purchase of 482,178 shares
or 18.5% of the total shares sold. We received net proceeds of $3,245,000 after deducting $275,000
in expenses. A portion of the net proceeds was used to repay amounts owed on the notes, and the
remaining proceeds are being utilized to fund capital expenditure requirements.
Stock Repurchase Program
During April 2008, our Board of Directors approved a stock repurchase program under which we
are authorized to repurchase up to 600,000 shares of our common stock. We repurchased 116,200
shares at a total cost of $1,000,000 during 2008 under a section 10b5-1 purchase program. The
authorization does not have an expiration date and it does not require us to purchase a specific
number of shares. This authorization may be modified, suspended or terminated at any time. The
timing and number of shares repurchased pursuant to the share repurchase authorization are subject
to a number of factors, including current market conditions, legal constraints and available cash
or other sources of funding.
11. Stock-Based Compensation
Stock Options
We maintain stock award plans which provide for discretionary grants of incentive and
nonstatutory stock options, restricted stock, and other types of awards to our employees,
consultants, and non-employee directors. A total of 1,450,000 shares of common stock have been
reserved for issuance under our plans of which 362,821 shares were available for grant as of
December 31, 2009.
The fair value of each option award is estimated on the date of grant using the Black-Scholes
option pricing model and is affected by assumptions regarding a number of highly complex and
subjective variables. These variables include, but are not limited to, the actual and projected
employee stock option exercise behavior, expected volatility, risk-free interest rate, expected
dividends, and expected term. Expected volatility is based on the historical volatility of a peer
group of companies over the expected life of the option as we do not have enough history trading as
a public company to calculate our own stock price volatility. The expected term of the options
represents the estimated period of time until exercise and is based on historical experience of
similar awards, giving consideration to the contractual terms, vesting schedules and expectations
of future employee behavior. The risk-free interest rate is based on the U.S. Treasury yield curve
in effect at the time of grant for the expected term of the option. We have not paid dividends in
the past and do not plan to pay any dividends in the near future. Compensation expense is
recognized only for those options expected to vest, with forfeitures estimated based on our
historical experience and future expectations. The fair value of stock options granted was
estimated at the date of grant using the Black-Scholes option pricing model with the following
weighted average assumptions:
| 2009 | 2008 | 2007 | ||||||||||
Expected volatility |
57.6 | % | 36.0 | % | 33.8 | % | ||||||
Risk-free interest rate |
1.8 | % | 2.5 | % | 4.8 | % | ||||||
Dividend yield |
0.0 | % | 0.0 | % | 0.0 | % | ||||||
Expected life (in years) |
3.9 | 3.7 | 3.8 | |||||||||
Weighted average fair value per option granted |
$ | 1.19 | $ | 3.42 | $ | 6.19 | ||||||
F-19
Table of Contents
KONA GRILL, INC.
NOTES TO CONSOLIDATED FINANCIAL STATEMENTS — (CONTINUED)
NOTES TO CONSOLIDATED FINANCIAL STATEMENTS — (CONTINUED)
Activity during 2009, 2008, and 2007 under our stock award plans was as follows:
| Shares | Weighted | Weighted Average | ||||||||||||||
| Under | Average | Remaining | Aggregate | |||||||||||||
| Option | Exercise Price | Contractual Term | Intrinsic Value | |||||||||||||
Outstanding options at December 31, 2006 |
631,589 | $ | 10.65 | |||||||||||||
Granted |
146,750 | 18.79 | ||||||||||||||
Forfeited |
(43,553 | ) | 15.82 | |||||||||||||
Exercised |
(79,347 | ) | 6.84 | |||||||||||||
Outstanding options at December 31, 2007 |
655,439 | 12.59 | ||||||||||||||
Granted |
185,417 | 11.24 | ||||||||||||||
Forfeited |
(14,800 | ) | 10.29 | |||||||||||||
Exercised |
(2,000 | ) | 6.00 | |||||||||||||
Outstanding options at December 31, 2008 |
824,056 | 12.34 | ||||||||||||||
Granted |
407,100 | 2.64 | ||||||||||||||
Forfeited |
(376,300 | ) | 12.42 | |||||||||||||
Exercised |
— | — | ||||||||||||||
Outstanding options at December 31, 2009 |
854,856 | $ | 7.67 | 3.15 years | $ | 130,000 | ||||||||||
Exercisable at December 31, 2009 |
453,393 | $ | 9.70 | 2.22 years | $ | 32,000 | ||||||||||
Stock-based compensation totaled $560,000, $582,000, and $607,000 during 2009, 2008, and 2007,
respectively. The intrinsic value of options exercised during 2008 and 2007 was approximately
$6,000 and $764,000, respectively. The total fair value of shares vested during 2009, 2008, and
2007 was approximately $390,000, $489,000, and $629,000, respectively. As of December 31, 2009,
there was approximately $587,000 of total unrecognized stock-based compensation expense related to
unvested share-based compensation arrangements, which is expected to be recognized over a weighted
average period of 1.92 years.
Information regarding options outstanding and exercisable at December 31, 2009 is as follows:
| Options Outstanding | Options Exercisable | |||||||||||||||||||
| Weighted Average | Weighted | |||||||||||||||||||
| Remaining | Average | Weighted | ||||||||||||||||||
| Range of | Contractual | Exercise | Average | |||||||||||||||||
| Exercise Prices | Shares | Life (years) | Price | Shares | Exercise Price | |||||||||||||||
| $1.92 – $3.21 | 351,650 | 4.43 | $ | 2.72 | 48,750 | $ | 2.39 | |||||||||||||
| $5.00 – $8.35 | 233,289 | 2.43 | $ | 6.31 | 229,539 | $ | 6.27 | |||||||||||||
| $10.00 – $12.64 | 134,417 | 2.63 | $ | 11.33 | 65,104 | $ | 11.96 | |||||||||||||
| $18.08 – $19.49 | 135,500 | 1.57 | $ | 18.81 | 110,000 | $ | 18.72 | |||||||||||||
| 854,856 | 3.15 | $ | 7.67 | 453,393 | $ | 9.70 | ||||||||||||||
Warrants
As discussed in Note 8, we issued to the noteholders of the bridge loan three-year warrants to
purchase 120,000 shares of our common stock at an aggregate exercise price per share of $2.29,
which was equal to 120% of the five-day average of the closing price of our common stock during the
five trading days prior to the date of issuance. These warrants are exercisable through March 6,
2012 and 10,000 warrants were exercised during 2009 resulting in 110,000 warrants outstanding at
December 31, 2009. We recorded the value of the warrant at $70,000 and amortized this amount to
interest expense during 2009.
F-20
Table of Contents
KONA GRILL, INC.
NOTES TO CONSOLIDATED FINANCIAL STATEMENTS — (CONTINUED)
NOTES TO CONSOLIDATED FINANCIAL STATEMENTS — (CONTINUED)
12. Employee Benefit Plans
Defined Contribution Plan
We maintain a voluntary defined contribution plan covering eligible employees as defined in
the plan documents. Participating employees may elect to defer the receipt of a portion of their
compensation, subject to applicable laws, and contribute such amount to one or more investment
options. We currently match in cash a certain percentage of the employee contributions to the plan
and also pay for related administrative expenses. Matching contributions made during 2009, 2008,
and 2007 were $142,000, $126,000, and $107,000, respectively.
Employee Stock Purchase Plan
During 2005, our Board of Directors and stockholders approved the 2005 Employee Stock Purchase
Plan, or ESPP and reserved 425,000 shares of common stock for issuance thereunder. The ESPP
permits eligible employees to purchase common stock at a discount through payroll deductions up to
15% of employees’ eligible earnings during the offering period. The purchase price per share at
which shares of common stock are sold in an offering under the ESPP is equal to 95% of the fair
market value of common stock on the last day of the applicable offering period. During 2009, 2008,
and 2007, 16,659 shares, 18,113 shares and 5,183 shares, respectively, were purchased under the
ESPP.
13. Commitments and Contingencies
We lease restaurant and office facilities and certain real property under operating leases
having terms expiring from 2011 to 2029. The restaurant leases primarily have renewal clauses of
five years exercisable at the option of our company and rent escalation clauses stipulating
specific rent increases. We record deferred rent to recognize rent evenly over the initial lease
term. Certain of these leases require the payment of contingent rentals based on a percentage of
gross revenues above specified minimum amounts as defined in the respective lease agreement. The
leases typically require us to pay our proportionate share of common area maintenance, property
tax, insurance, and other occupancy-related costs.
Rent expense on all operating leases was as follows (in thousands):
| Year Ended December 31, | ||||||||||||
| 2009 | 2008 | 2007 | ||||||||||
Straight-line minimum base rent |
$ | 6,018 | $ | 4,900 | $ | 4,127 | ||||||
Contingent rent |
24 | 123 | 376 | |||||||||
Total rent |
$ | 6,042 | $ | 5,023 | $ | 4,503 | ||||||
At December 31, 2009, we had entered into a lease agreement for one restaurant scheduled to be
constructed during 2010. The following table does not include obligations related to renewal
option periods even if it is reasonably assured that we will exercise the related option. Future
minimum lease payments under operating leases at December 31, 2009, were as follows (in thousands):
2010 |
$ | 6,699 | ||
2011 |
7,104 | |||
2012 |
7,046 | |||
2013 |
7,061 | |||
2014 |
6,429 | |||
Thereafter |
27,633 | |||
Total minimum lease payments |
$ | 61,972 | ||
F-21
Table of Contents
KONA GRILL, INC.
NOTES TO CONSOLIDATED FINANCIAL STATEMENTS — (CONTINUED)
NOTES TO CONSOLIDATED FINANCIAL STATEMENTS — (CONTINUED)
14. Legal Proceedings
We are engaged in various legal actions, which arise in the ordinary course of our business.
Although there can be no assurance as to the ultimate disposition of these matters, it is the
opinion of our management, based upon the information available at this time, that the expected
outcome of these matters, individually or in the aggregate, will not have a material adverse effect
on the results of operations or financial condition of our company.
On April 1, 2009, Samuel Beren, as trustee for the Samuel Beren Trust, filed a stockholder
derivative suit in the Court of Chancery of the State of Delaware. The suit was brought on behalf
of us against our directors and the purchasers of our promissory notes issued on March 5, 2009, and
named us as a nominal defendant. The complaint alleged that our directors breached their fiduciary
duties of loyalty, good faith, and due care to us, and that the noteholders aided and abetted such
breach, in connection with certain of our fundraising efforts. The suit originally sought
unspecified damages, interest, reasonable attorneys’ fees, expert witness fees, and other costs,
and any further relief the court deems just and proper.
On June 16, 2009, the director defendants filed a motion to dismiss the lawsuit. On August
28, 2009, the director defendants filed an opening brief in support of the motion to dismiss.
Separately, on October 26, 2009, the plaintiff served a demand on us pursuant to Section 220 of
Delaware’s General Corporation Law requesting that we make certain books and records available for
inspection. On November 11, 2009, the plaintiff moved to suspend the briefing schedule on the
motion to dismiss the derivative lawsuit until the parties resolved the October 26, 2009 books and
records demand. The director defendants opposed the motion to modify the briefing schedule. On
January 19, 2010, the Court order that the plaintiff must either amend his complaint, or file an
answering brief in response to the motion to dismiss by January 26, 2010.
On January 20, 2010, we produced books and records in response to the October 26, 2009 demand.
Two days later, on January 22, 2010, the plaintiff commenced a separate lawsuit against us seeking
the production of the books and records requested in the plaintiff’s February 6, 2009 and October
26, 2009 demand letters. The books and records complaint was served on our registered agent in
Delaware on February 16, 2010.
On January 25, 2010, the plaintiff filed a letter with the Court informing the Court of the
newly filed lawsuit and requested a stay of the lawsuit until the newly filed books and records
lawsuit is resolved. After receiving the director defendants’ opposition to the request for a
stay, the Court instructed the plaintiff to file a formal motion to stay, as opposed to a letter
request, if it is seeking a stay of the derivative lawsuit. The Court also asked the plaintiff to
advise the Court as to “why no action has been taken in conformity with [the] Court’s January 19,
2010 letter decision.” We continue to believe that the allegations in the derivative complaint,
including the amended complaint, are without merit and we intend to defend vigorously such lawsuit.
In addition, we and our legal counsel currently are reviewing the complaint filed in the books and
records lawsuit to determine the appropriate response.
F-22
Table of Contents
KONA GRILL, INC.
NOTES TO CONSOLIDATED FINANCIAL STATEMENTS — (CONTINUED)
NOTES TO CONSOLIDATED FINANCIAL STATEMENTS — (CONTINUED)
15. Selected Quarterly Financial Data (Unaudited)
Summarized unaudited financial data for 2009 and 2008 is as follows (in thousands, except per
share data):
| March 31, | June 30, | September 30, | December 31, | |||||||||||||
| Quarter ended | 2009 | 2009 | 2009 | 2009 | ||||||||||||
Restaurant sales |
$ | 19,455 | $ | 21,468 | $ | 20,173 | $ | 19,999 | ||||||||
Loss from continuing operations |
(1,083 | ) | (917 | ) | (1,035 | ) | (19,207 | )(2) | ||||||||
(Loss) gain from discontinued operations |
(13 | ) | 703 | — | — | |||||||||||
Net loss |
(1,096 | ) | (214 | ) | (1,035 | ) | (19,207 | ) | ||||||||
Diluted net (loss) income per share: |
||||||||||||||||
Continuing operations |
$ | (0.14 | ) | $ | (0.11 | ) | $ | (0.11 | ) | $ | (2.10 | ) | ||||
Discontinued operations |
— | 0.08 | — | — | ||||||||||||
Net loss (1) |
$ | (0.14 | ) | $ | (0.03 | ) | $ | (0.11 | ) | $ | (2.10 | ) | ||||
| March 31, | June 30, | September 30, | December 31, | |||||||||||||
| Quarter ended | 2008 | 2008 | 2008 | 2008 | ||||||||||||
Restaurant sales |
$ | 18,103 | $ | 19,685 | $ | 19,454 | $ | 18,573 | ||||||||
Loss from continuing operations |
(562 | ) | (348 | ) | (733 | ) | (5,354 | )(3) | ||||||||
Loss from discontinued operations |
(111 | ) | (187 | ) | (3,161 | ) | (45 | ) | ||||||||
Net loss |
(673 | ) | (535 | ) | (3,894 | ) | (5,399 | ) | ||||||||
Diluted net loss per share: |
||||||||||||||||
Continuing operations |
$ | (0.07 | ) | $ | (0.04 | ) | $ | (0.09 | ) | $ | (0.67 | ) | ||||
Discontinued operations |
(0.01 | ) | (0.03 | ) | (0.40 | ) | — | |||||||||
Net loss (1) |
$ | (0.08 | ) | $ | (0.07 | ) | $ | (0.49 | ) | $ | (0.67 | ) | ||||
| (1) | Net loss per share calculations for each quarter are based on the weighted
average diluted shares outstanding for that quarter and may not total to the full year
amount. |
|
| (2) | Includes asset impairment charges of $16.9 million for six underperforming
restaurants. |
|
| (3) | Includes asset impairment charges of $3.2 million for one underperforming
restaurant. |
F-23