Attached files
| file | filename |
|---|---|
| 8-K - FORM 8-K - WESTAR ENERGY INC /KS | d8k.htm |
 UBS
Electric Power Conference March 3 & 4, 2010 Dallas, TX Exhibit 99.1 |
 2 Forward Looking Disclosures The following presentation contains some “forward-looking statements” with respect to Westar Energy, Inc.’s (“Westar”) future plans, expectations
and goals, including management’s expectations with respect to future
operating results and dividend growth. The Private Securities
Litigation Reform Act of 1995 has established that these statements qualify
for safe harbors from liability. Although we believe that the expectations and goals reflected in such forward- looking statements are based on reasonable assumptions, all forward-looking statements involve risk and uncertainty. Therefore, actual results could vary
materially from what we expect. Please review our Annual Report Form 10-K for the year ended December 31, 2009 for important risk factors that could cause results to differ materially from those in any such forward-looking
statements. Any forward-looking statement speaks only as of the date such
statement was made, and we do not undertake any obligation to update any
forward-looking statement to reflect events or circumstances after the
date on which such statement was made except as required by applicable laws
or regulations. |
 3 Recent Events • Ironwood wind site acquired • Abbreviated rate case approved • Proposed settlement of EPA litigation • 2010 transmission revenue update • 2010 earnings guidance • New KCC commissioner appointed |
 4 Ironwood Wind Site • Acquired development rights for wind site • Preserves option of ownership or power purchase – Build out for own use – Allow 3 rd party to develop, and WR acquires power via PPA • Site located near Spearville, KS – Contracts with landowners cover more than 18,600 acres • Able to support 500 MW of wind |
 5 Abbreviated Rate Case Approved • Filed abbreviated rate case June 2009 – Address remaining Emporia and wind investments • Investment of $97 million plus D&A and O&M • Stipulation and Agreement filed Dec. 1, 2009 – Recommended $17.1 million annual revenue increase – Propose new rates reflect consolidated rates for most tariffs • New base rates approved January 2010 – Implemented $17.1 million increase effective February |
 6 Proposed Settlement of EPA Litigation • Agreement with EPA to resolve New Source Review allegations at the Jeffrey Energy Center • Install SCR on one unit by 2014 • Lower plant-wide NOx emission limit established – Simpler plant modifications planned to achieve emissions target • If plant unable to meet emission target by 2012, then a second SCR will be installed • Settlement awaiting the approval of federal court |
 7 2010 Transmission Revenue Update • October 2009 filed updated transmission formula rate – Resulted in $16 million increase in revenue requirement • New transmission rates effective January 1, 2010 – Component applicable to wholesale and other transmission customers $10 million • Companion retail component of transmission revenue – Filed updated Transmission Delivery Charge with KCC in February – Request $6.4 million revenue increase – Anticipate tariff update to be approved by mid-March |
 8 2010 Earnings Guidance of $1.65 to $1.80 • No change in business strategy or direction • No change in regulatory principles or methods • Expected price adjustments: – Abbreviated rate case – Tracking adjustments • Weather adjusted retail sales grow 2% • O&M/SG&A increases 2-3% • Depreciation increases $20 million • AFUDC equity decreases $4 million • COLI proceeds $11 million • Interest charges increases $10 - $15 million • Effective tax rate of 29% - 31% |
 9 Kansas Corporation Commission • Chairman Tom Wright reappointed to four-year term – Has served since 2007 • New commissioner appointed – Ward Lloyd – 25 years of public service • Served 8 years in Kansas House of Representatives • Served on House Utilities Committee among other committees
|
 10 Introduction |
 11 • Committed to being a pure-play, vertically integrated utility • Rate regulated based on cost of service • Key operational facts • About 7,100 MW of available generation (48% coal, 8% nuclear, 40% gas, 4%
wind) • 7,800 miles of transmission • 685,000 customers Kansas’ Largest Electric Provider |
 12 In Our Favor Coal 77% Gas 7% Wind 1.0% Uranium 15% 0.0¢ 1.0¢ 2.0¢ 3.0¢ 4.0¢ 5.0¢ 6.0¢ 7.0¢ 8.0¢ 9.0¢ 10.0¢ Westar Energy Kansas City Power and Light (KS) Empire District Electric (KS) National Average 6.9¢ 7.8¢ 8.5¢ $48.52 $16.79 $4.87 Uranium Coal Gas Low Rates Industrial 27% Other 0.5% Residential 34% Commercial 38% Diverse Retail Sales High Quality, Diverse Generating Fleet (TTM 12/31/09) Ave. Fuel Cost $17.18/MWh 0 100 200 300 400 500 600 700 800 900 1,000 2010 2011 2015 2019 0 100 200 300 400 500 600 700 800 900 1,000 2010 2011 2015 2019 Potential to renew Potential to recapture Wholesale Sales Contract Portfolio 921 Source: Edison Electric Institute 06/30/2009 |
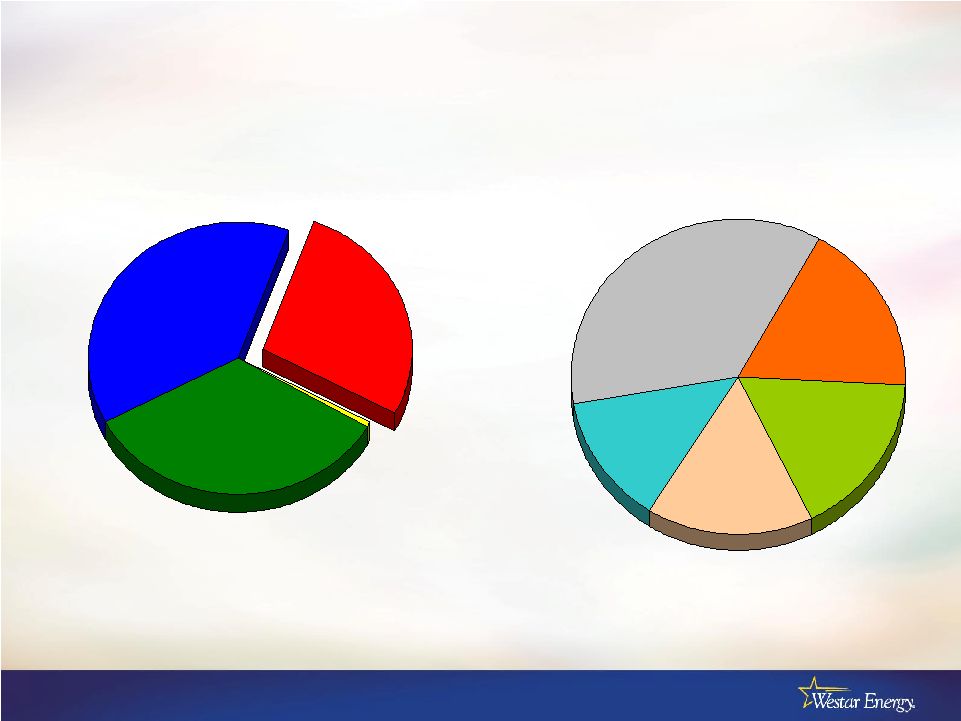 13 Major Industrial Sectors 36% 18% 17% 16% 13% Chemical & oil Food processing Aerospace Consumer manufacturing Other Commercial 38% Residential 34% Other 0.5% Industrial 29% Significant Industrial Sectors Based on MWh sales |
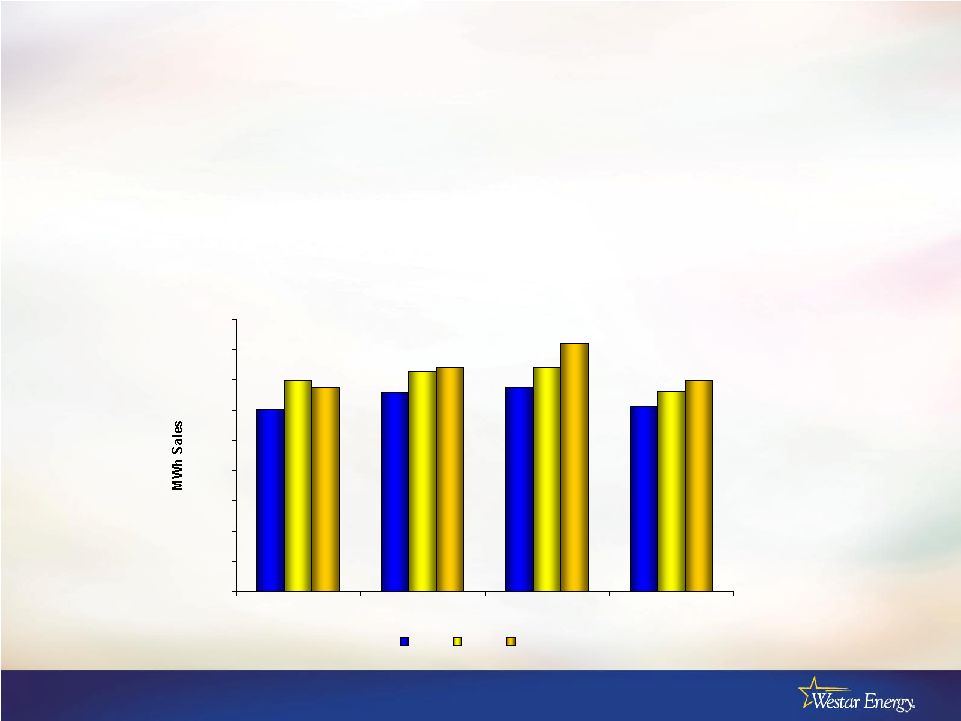 14 2009 Industrial Energy Sales 0 200 400 600 800 1,000 1,200 1,400 1,600 1,800 Q1 Q2 Q3 Q4 2009 2008 Budget • Down 11% from 2008 – Hard hit sectors include chemical, aerospace and construction – Seeing positive trends in petroleum refining and animal science (13.8%) to ‘08 (11.0%) to Bud (9.5%) to ‘08 (10.9%) to Bud (12.1%) to ‘08 (14.6%) to Bud (7.5%) to ‘08 (12.3%) to Bud |
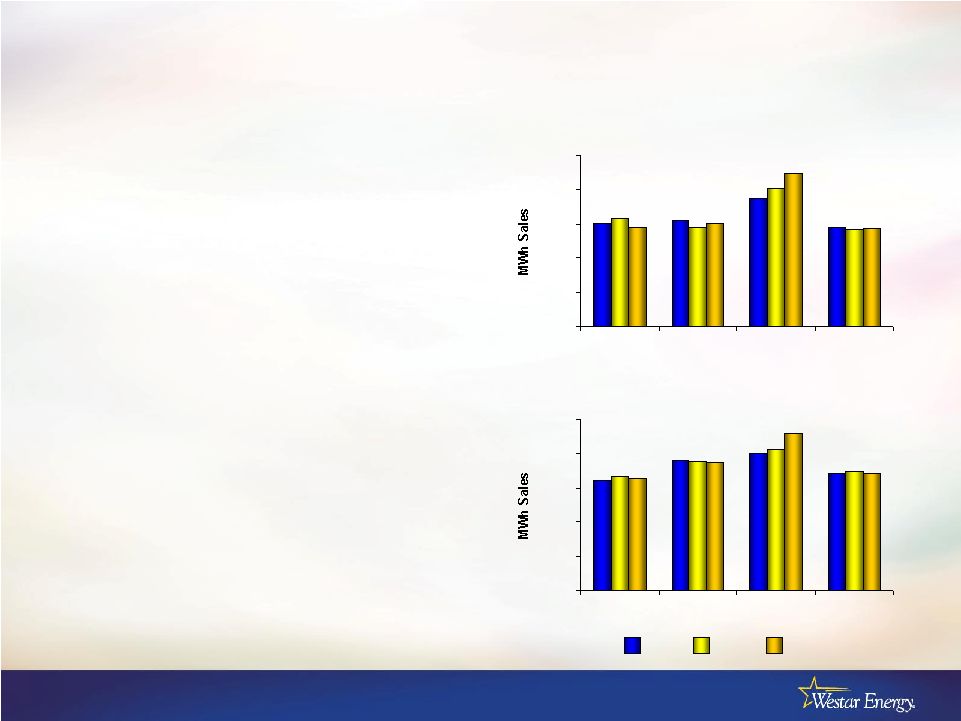 15 2009 Residential and Commercial Energy Sales • Residential down 1.4% from ‘08 – Customer growth in line with historical growth and budget – Prior to cool summer average use per customer was ahead of plan and equal to 2008 – Clearly the most weather sensitive group • Commercial down 1.7% from ‘08 – Customer growth in line with plan – Stability from state government, military and higher education – Second most weather-sensitive group 0 500 1,000 1,500 2,000 2,500 Q1 Q2 Q3 Q4 (4.5%) to ‘08 4.8% to Bud 0 500 1,000 1,500 2,000 2,500 Q1 Q2 Q3 Q4 6.9% to ‘08 2.6% to Bud (7.8%) to ‘08 (16.3%) to Bud (3.2%) to ‘08 (2.2%) to Bud 0.8% to ‘08 1.1% to Bud (2.7%) to ‘08 (12.5%) to Bud 2009 2008 Budget 2.7% to ‘08 1.5% to Bud (1.9%) to ‘08 (0.4%) to Bud |
 16 Strategic Approach • Place a high value on flexibility – Create and preserve options and off ramps • e.g., CapEx plans with built-in flexibility—both to timing and approach
– Avoid over committing to any single supply strategy • Leverage actions and strategies around unique attributes – Invest according to strengths, even if differently than the pack • Seek collaborative and constructive approaches to regulation – More predictability--less volatility – Ultimately lower prices for customers |
 17 Outlook for 2010 |
 18 Service Territory Economy • Diverse customer base – Military – State government – Higher education – Manufacturing – Oil and gas – Agriculture and food processing – Chemicals • Kansas economy has slowed, resulting primarily in weaker industrial sales • However: – Receivables in arrears remain at about the same level as last year – Kansas foreclosures about 1/3 of national rate – State unemployment improving 2009 Unemployment 3% 4% 5% 6% 7% 8% 9% 10% 11% Jan Feb Mar Apr May Jun Jul Aug Sep Oct Nov Dec Kansas U. S. |
 19 Annualized Rate & Revenue Changes Actual and Estimated 2009 2010 (Estimated) 2011 (Estimated) Base rates $130 million Feb 3 $ 17 million late Jan FERC transmission $ 4 million Jan 1 $ 10 million Jan 1 $ 6 million Jan 1 State TDC (transmission) $ 32 million March 13 $ 6 million March $ 28 million March ECRR $ 32 million June 1 $ 15 million June 1 $ 18 million June 1 |
 20 Managing O&M and SG&A • O&M / SG&A increased at CAGR of 4% over last four years – Have reduced impact to by almost half by managing increases with revenue offsets and deferred accounting treatment: • SPP transmission expense largely offset with transmission revenue • Amortization of deferred storm expenses included in rates • Additional O&M for new generation included in abbreviated rate case • Deferred accounting for increased pension expenses Adjusted CAGR 2.2% $525 $575 $625 $675 $725 2005 2006 2007 2008 2009 2010 Est. |
 21 Current Capital Expenditure Forecast 2010 - 2012 Actual Forecast Forecast Forecast Forecast 2009 2010 2011 2012 2010-2012 Method of Cost Recovery Generation Replacements and other 103.9 $ 99.9 $ 106.2 $ 126.6 $ 332.7 $ General Rate Case (GRC) Additional Generation Emporia Energy Center 4.4 - - - - Predetermination/CWIP/ARC* Wind Energy 69.5 - - - - Predetermination/CWIP/ARC* Turbine upgrade - Wolf Creek 12.2 12.3 10.1 - 22.4 GRC Environmental 85.2 181.2 350.1 414.7 946.0 Environmental Cost Recovery Rider Nuclear Fuel 19.8 36.1 26.7 26.1 88.9 Fuel adjustment clause Transmission 156.6 203.6 167.8 175.1 546.5 FERC formula rate/TDC Distribution New customers, replacements & other 92.7 102.3 114.6 118.6 335.5 GRC AMI / Smart grid - 8.9 9.2 12.3 30.4 GRC Other 11.5 20.3 16.0 25.3 61.6 GRC Total 555.6 $ 664.6 $ 800.7 $ 898.7 $ 2,364.0 $ *Abbreviated rate case |
 22 Approximate Rate Base $ 516 $ 470 Transmission rate base $ 4,330 $ 4,103 Total (Dollars in millions) KCC Jurisdiction 100 - Incentive rate base (1) $ 416 $ 470 Standard rate base FERC Transmission $ 3,814 $ 3,633 Estimated retail rate base 324 240 Incremental environmental $ 3,490 $ 3,393 Standard rate base Estimated Dec. 31, 2009 Estimated Dec. 31, 2008 (1) Incentive ROE of 12.3% on equity portion |
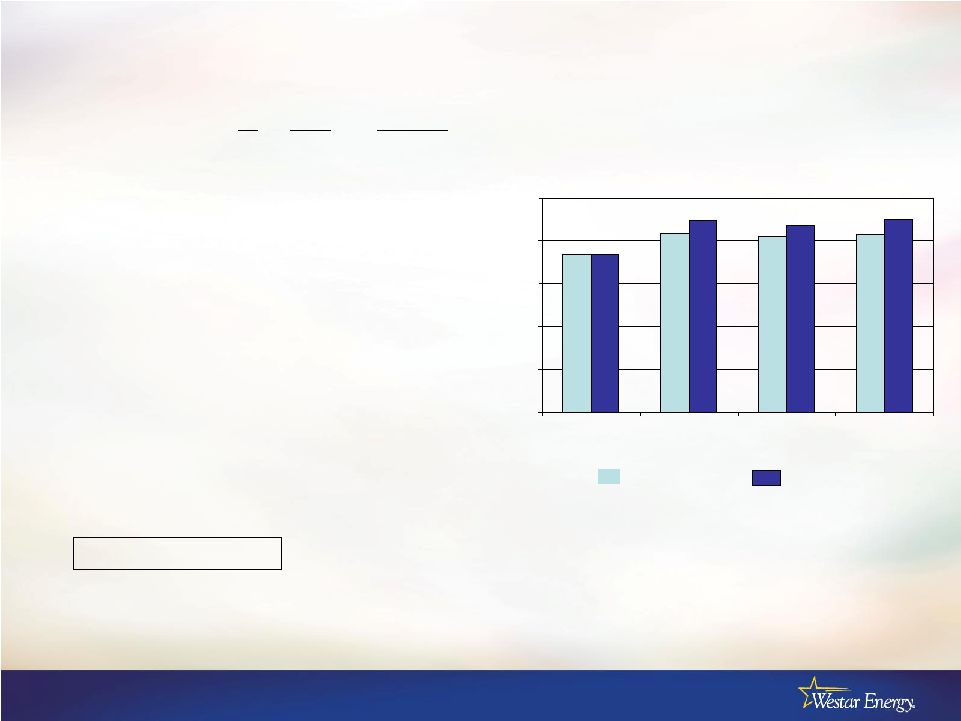
 23 Projected Rate Base 2009 – 2014 (in billions) $3.2 $3.4 $3.4 $3.5 $3.7 $3.9 2009 2010 2011 2012 2013 2014 Base Renewable Environmental Transmission $6.6 $6.3 $5.8 $5.2 $4.7 $4.3 |
 24 Transmission |
    25 345kV Transmission System Additions • Wichita – Salina Segment 1 Wichita-Hutchinson • Completed December 2008 • Investment $100 million Segment 2 Hutchinson-Salina • Under construction – target completion latter half 2010 • Investment $100 million • Rose Hill – Oklahoma Construction to follow the Hutchinson-Salina line • Target completion mid year 2012 • Investment $90 million |
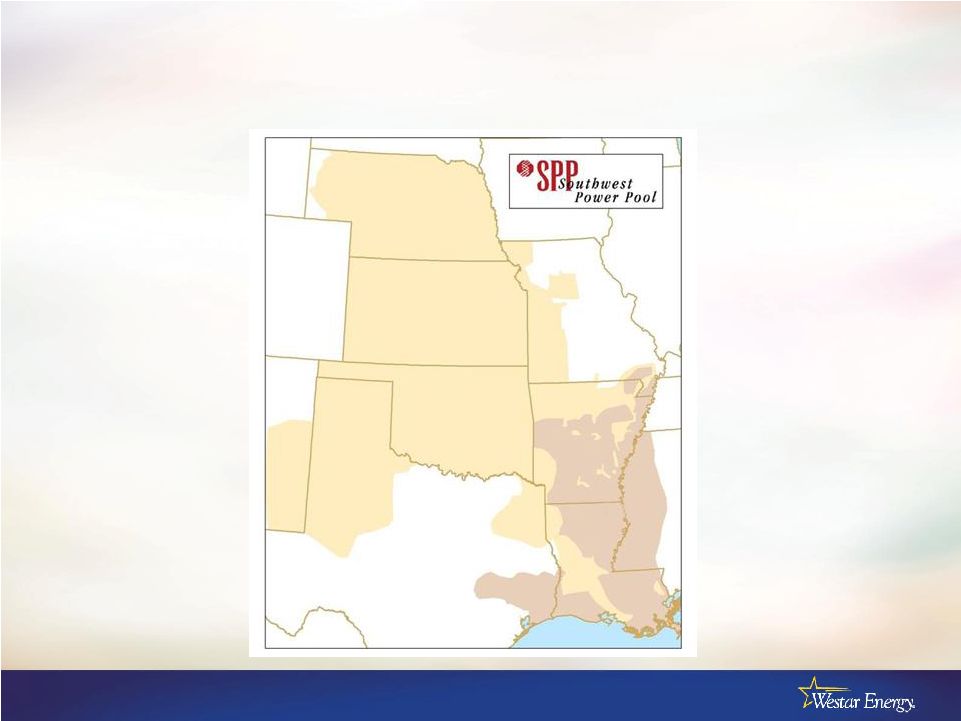 26 Southwest Power Pool RTO New Mexico Oklahoma Louisiana Texas Nebraska Kansas Arkansas Missouri |
 27 Prairie Wind Transmission, LLC • Joint venture formed between Westar Energy and Electric Transmission America – Venture to develop 765 kV transmission in Kansas – 50% Westar / 50% ETA • ETA is joint venture between AEP Transmission Holding Company and MEHC America Transco, LLC (wholly-owned subsidiary of MidAmerican Energy Holdings Company) Prairie Wind Transmission, LLC Westar 50% Electric Transmission America 50% AEP 50% MidAmerican 50% |
 28 Prairie Wind Transmission, LLC • Received FERC incentives – Abandonment costs – Recovery of pre-commercial development costs – CWIP recovery in rate base – Use of hypothetical capital structure of 50% debt and 50% equity – Allowed ROE of 12.8% • KCC – Approved Stipulation resolved dispute regarding construction of line – Routing and siting of line to follow SPP regional plans • Southwest Power Pool – Development of regional cost allocation tariff for “highway” projects under way |
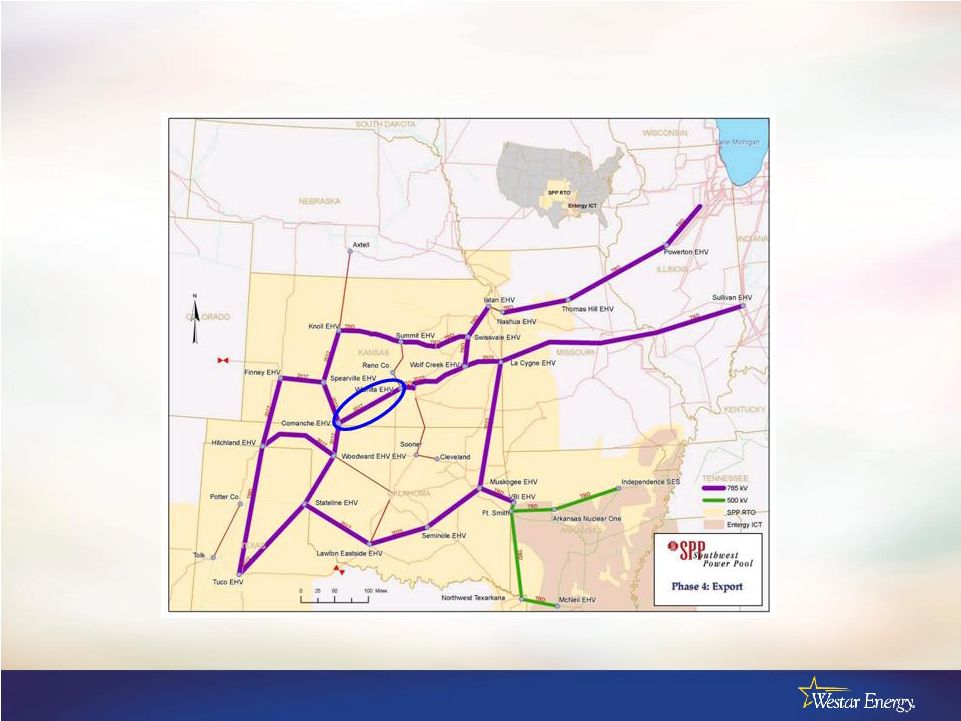 29 Prairie Wind Transmission LLC Part of the Conceptual SPP EHV Overlay Plan From the 2008 SPP Transmission Expansion Plan |
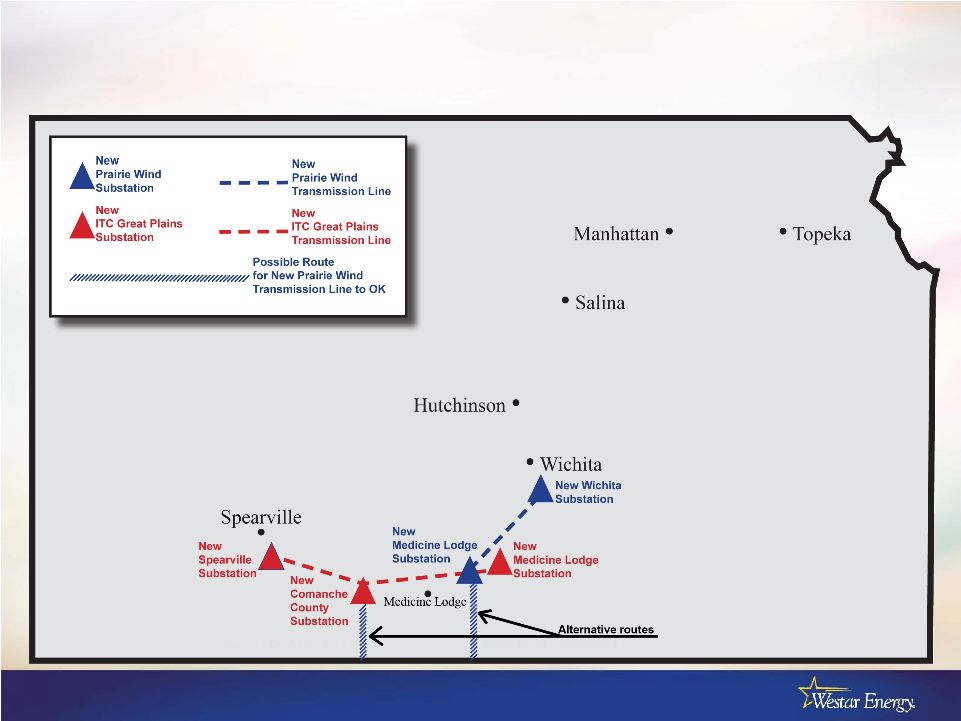 30 Kansas EHV Agreement |
 31 Next Steps and Tentative Schedule • Inclusion in SPP regional plans • Region-wide rate authority • Obtain siting authority from KCC • Engineer and design • Acquire right-of-way • Construct |
 32 Financial Overview/Profile |
 33 Capitalization and Liquidity • Target 50/50 capital structure • Solid credit & liquidity position – Investment grade ratings – $730 million revolver • Minimal refunding obligations – No maturities until 2014 Dec 31, 2009 (millions) Long-term, net $2,492 Preferred 21 Common 2,245 Total Capitalization $4,758 Debt 52% Equity 47% Preferred <1% Secured Unsecured Outlook Moody's (1) Baa1 Baa3 Stable Fitch Ratings BBB+ BBB Stable Standard & Poor's BBB BBB- Positive (1) Moody’s upgraded secured rating August 3, 2009
|
 34 $0.92 $1.00 $1.08 $1.16 $1.20 $1.24 $0.75 $0.85 $0.95 $1.05 $1.15 $1.25 $1.35 2005 2006 2007 2008 2009 2010 Dividend • Long-standing dividend payout target of 60%-75% of earnings – Dividend payout 69%-75% based on 2010 guidance Indicated annual rate |
 35 Westar Remains Well-Positioned for Targeted Shareholder Base • Stable, experienced utility management team • Thoughtful, flexible approach to capital planning and financing – Maintaining control of our business • Diverse customer base and stable service territory • Focus on containing risks and maintaining returns • Collaborative and constructive approach to regulation and energy policy |
 Rates
& Regulation 36 |
 37 Regulatory Approach • A sound regulatory and energy policy platform – Stable, more predictable – Collaborative, constructive approach – Timely • Benefits for customers: – Minimize rate volatility Time Traditional GRC Riders coupled with GRC Ultimately, lower rates |
 38 Methods of Cost Recovery for Westar Smoothes period expenses for extraordinary storm restoration costs Traditionally deferred accounting treatment as rate base Extraordinary storm damages 6. Smoothes period expenses in excess of amount in base rates Deferred as a regulatory asset for subsequent recovery Pension expenses 7. Smoothes period expenses for energy efficiency programs Deferred as a regulatory asset for subsequent recovery Energy efficiency programs 8. Allows timely recovery of actual property tax costs in current rates Annual adjustment to reflect current property taxes Property taxes 5. Typical rate case reflects current level of operating expenses and most recent plant investment Traditional rate case, but improved through predetermination and CWIP statutes General capital investments 4. Timely recovery of transmission system operating and capital costs FERC formula rate adjusts annually; companion retail tariff to reflect current revenue requirement Transmission rate recovery 3. Allows annual price adjustment to reflect capital costs for investments in emission controls Environmental Cost Recovery Rider adjusts annually Environmental capital 2. Adjusts prices for actual costs, protecting both customers and investors from mispricing Quarterly adjustment based on forecasted cost, with annual true-up Fuel, purchased power and environmental consumables 1. Comment Method of Recovery Revenue Requirement |
 39 Retail Energy Cost Adjustment (RECA) • Provides timely price adjustments for fuel and purchased power costs • Retail rates based on forecast of fuel and purchased power costs and retail sales – Set quarterly – Difference between forecast and actual is accrued/deferred • Quarterly approach produces more stable prices • Annual settlement of accrued/deferred balance • RECA also used to rebate wholesale margins as a credit to retail cost of service – Beginning March 2009, credits match actual results • Energy Marketing (i.e., non-asset) margins continue to be excluded from rate setting |
 40 Environmental Cost Recovery Rider Mechanics • ECRR adjusts retail rates annually to reflect capital costs for emission controls – Investment at December 31 begins recovery in rates following June – Eliminates need to file a rate case to capture rate base additions • Return of and on capital that is in service December 31 • Return on capital not yet placed in service December 31 (i.e., CWIP) • ECRR speeds recovery of investments in emission control equipment – Regulatory lag limited to months, rather than longer lag typically associated with traditional rate case filings |
 41 Illustrative ECRR Mechanics (1) Illustration reflects only the projects publicly announced and assumes one-half of
annual investment in service at year end (2) Illustration uses 12% pretax return and 4% depreciation recovery (3) Annual ECRR Tariff is effective June 1; assume Jan-May at prior year revenue
requirement and Jun-Dec at new revenue requirement Clean Air Investment
(1) 2008 2009 2010 2011 2012 Year 1 Investment 238.4 $ Year 2 Investment 85.2 $ Year 3 Investment 181.2 $ Year 4 Investment 350.1 $ Year 5 Investment 414.7 $ Environmental Investment 238.4 $ 323.6 $ 504.8 $ 854.9 $ 1,269.6 $ Accumulated Depreciation Clean Air Investment Depreciation on Year 1 Investment 4.8 $ 9.5 $ 9.5 $ 9.5 $ 9.5 $ Depreciation on Year 2 Investment 1.7 3.4 3.4 3.4 Depreciation on Year 3 Investment 3.6 7.2 7.2 Depreciation on Year 4 Investment 7.0 14.0 Depreciation on Year 5 Investment 8.3 Annual Depreciation 4.8 $ 11.2 $ 16.6 $ 27.2 $ 42.5 $ Total Accum Depreciation for Environmental Investment 4.8 $ 16.0 $ 32.6 $ 59.8 $ 102.3 $ Environmental Investment, net of Accum. Depreciation 233.6 $ 307.6 $ 472.2 $ 795.1 $ 1,167.3 $ Return on prior YE investment balance (2) 28.0 $ 36.9 $ 56.7 $ 95.4 $ Return of prior YE investments completed 4.8 11.2 16.6 27.2 Annual ECRR Revenue Requirement 32.8 $ 48.2 $ 73.2 $ 122.6 $ Estimated calendar year revenue recognition (3) 19.1 $ 41.8 $ 49.1 $ 95.6 $ Cumulative ECRR revenue recognition 19.1 $ 60.9 $ 110.0 $ 205.6 $ |
 42 Transmission Cost Recovery • FERC formula transmission rate – Changes in cost of service reflected in annual update of FERC tariff • Update posted each October using projected test year – Forecasted capital expenditures – Forecasted O&M – Tariff is based on year-end consolidated capital structure • FERC transmission changes effective January 1 • Allowed ROE 11.3% • Annual true-up compares projected revenue requirement to actual, with difference incorporated into next update – Incentives on Wichita to Salina transmission line • 12.3% ROE is 100 basis points above base FERC-authorized ROE • Accelerated book depreciation of 15 vs. 45 years • Transmission Delivery Charge (TDC) – Retail rates adjusted to match changes to FERC tariff |
 43 Transmission Formula Rate Mechanics • Fixed formula with changing inputs – Updated annually using Form 1 data – Established protocols for updates • Uses projected test year – Rate base (based on 13 mo. Avg.) – O&M, depreciation and taxes – Cost of debt • Annual true-up incorporated in subsequent year’s formula inputs Establish Proj. 2010 Rev. Req. Establish Proj. 2011 Rev. Req. Start of 2011 Rate Year Start of 2010 Rate Year FERC Form 1 Released True-up between ’09 Proj. Rev. Req. and Actual Rev. Req. Transmission Formula Rate Time Line |
 44 Statutes for Predetermination and CWIP • Predetermination – Utilities can obtain order establishing ratemaking principles that will apply over the life of the asset • Construction Work in Progress (CWIP) – Utilities can include CWIP in rate cases |
 45 Pension Tracker • Defer on balance sheet differences between funding of GAAP pension/OPEB expense and pension/OPEB currently authorized in rates • Maintain minimum funding level equal to GAAP pension/OPEB expense • Recover deferrals over period up to 5 years at time of future rate case |
 46 Energy Efficiency Initiatives • Selected by DOE to begin negotiations for smart grid implementation in Lawrence, Kansas – Installation of about 48,000 “smart” meters – Total project cost of $40 million • Eligible for 50% match – To be implemented over 2 to 3 years • Regulatory orders may allow deferral of costs for energy efficiency initiatives, such as – Smart thermostats – Customer educational programs – Demand response programs |
 47 Kansas’ Comprehensive Energy Bill Passed • Renewable Portfolio Standard established – Installed capability standard in lieu of energy standard • 10% of peak load by 2011, 15% by 2016 and 20% after 2020 – Implies additional 150 to 200 MW for Westar – If generated in Kansas, treated at 110% of requirement • Limited net metering approved (up to 1% of peak demand) • Environmental predictability – Legislation precludes state air emission levels from being more stringent than federal standards Supplemental note to HB 2369:
http://www.kslegislature.org/supplemental/2010/SN2369.pdf Link to full text
of bill: http://www.kslegislature.org/bills/2010/2369.pdf |
 48 Capital Structure for Ratemaking (Per Recent Orders) 12.00% 8.50% 100.00% 8.77 5.29 10.40 50.83 Common .04 .02 4.55 0.51 Preferred 3.19% 3.19% 6.55% 48.66% Long-term debt Pre-tax Weighted Cost of Capital Weighted Cost of Capital Cost of Capital Capitalization Ratio 11.76% 8.18% 100.00% 8.99 5.43 11.30 48.07 Common .04 .02 4.52 0.47 Preferred 2.73% 2.73% 5.30% 51.46% Long-term debt Pre-tax Weighted Cost of Capital Weighted Cost of Capital Cost of Capital Capitalization Ratio KCC FERC Transmission (1) Incentive ROE of 12.3% for applicable rate base (1) |
 49 Background |
 50 Westar Energy Legal Structure Kansas Gas and Electric Company Consolidated capital structure is used for ratemaking (Rate regulated utility) (Rate regulated utility) Westar Energy, Inc. Parent Subsidiary Combined company does business under the name “Westar Energy” |
 51 Management and Organization Structure • Executive Management – President & CEO, Bill Moore – EVP & COO, Doug Sterbenz – EVP & CFO, Mark Ruelle – EVP, Public Affairs / Consumer Services, Jim Ludwig – Officers average 23+ years utility experience, largely with Westar • Independent Board of Directors – Non-executive chairman – All directors other than CEO are independent Board of Directors Bill Moore President and CEO Mark Ruelle Exec. VP, Chief Financial Officer Doug Sterbenz Exec. VP, Chief Operating Officer Jim Ludwig Exec. VP, Public Affairs and Consumer Services Mike Lennen VP, Regulatory Affairs Larry Irick VP, General Counsel and Corp. Secretary Greg Greenwood VP, Generation Construction Tony Somma Treasurer Lee Wages VP, Controller Bruce Akin VP, Operations Strategy and Support Kelly Harrison VP,Transmission Ops & Environmental Services Ken Johnson VP, Generation Caroline Williams VP, Distribution Power Delivery Peggy Loyd VP, Customer Care Jeff Beasley VP, Corporate Compliance and Internal Audit Audit Committee |
 52 Wholesale Sales • Market-based sales (asset-based margins) – Opportunistic sales using as available capacity • Real time up to 1 year • Margins reflected as credit to RECA • Tariff-based sales – Long-term agreements – Cost-based tariffs – Primarily with coops, municipals and participation agreements with other utilities – Reflected as credit to base retail rates • Energy marketing (non-asset margins) – 50% real-time to next day; 20% few days to a few months • Energy transactions unrelated to our generating assets • Market pricing • Financial and physical trading sourced outside our control area – 30% Energy management – managing load and resources for others – Not reflected in rates |
 53 Westar’s Plants Westar Energy 2008 Results NERC 5-Year Average Plant Performance 83.4% 82.2% 82.7% 89.3% 87.0% 90.1% 73.7% 73.7% 0% 20% 40% 60% 80% 100% Coal Capacity Factor Wolf Creek Capacity Factor Coal Availability Factor Wolf Creek Availability Factor Westar's MW Operator Years Installed Pulverized coal Jeffrey Energy Center 1,991.0 Westar 1978, 1980, 1983 Lawrence Energy Center 529.0 Westar 1954, 1960, 1971 Tecumseh Energy Center 202.0 Westar 1957, 1962 LaCygne Station 709.0 KCPL 1973, 1977 Nuclear Wolf Creek 545.0 WCNOC (1) 1985 Gas steam turbine Gordon Evans Energy Center 537.0 Westar 1961, 1967 Hutchinson Energy Center 162.0 Westar 1965 Murray Gill Energy Center 293.0 Westar 1952, 1954, 1956, 1959 Neosho Energy Center 67.0 Westar 1954 Gas combustion turbine Abilene Energy Center 64.0 Westar 1973 Gordon Evans Energy Center 295.0 Westar 2000, 2001 Hutchinson Energy Center 230.0 Westar 1974, 1975 Spring Creek Energy Center 278.0 Westar 2001 Tecumseh Energy Center 37.0 Westar 1972 Emporia Energy Center 663.0 Westar 2008, 2009 Gas combined cycle State Line 199.0 EDE Co. 2001 Diesel Gordon Evans Energy Center 3.0 Westar 1969 Hutchinson Energy Center 3.0 Westar 1983 Wind Meridian Way 96.0 Horizon (2) 2008 Central Plains 99.0 Westar 2009 Flat Ridge 100.0 Westar (3) 2009 Available generation At Dec. 31, 2009 7,102.0 (1) Wolf Creek Nuclear Operating Company is a company formed specifically to operate Wolf
Creek for its owners. WCNOC is governed by a board of directors
consisting of the CEO of WCNOC and senior executives of the plant
owners. (2) 100% of generation purchased under Power Purchase Agreement (PPA) (3) 50% owned and 50% of generation purchased under PPA from BP Alternative Energy
|
 54 Westar-operated plant supply (80%) • JEC supply under contract through 2020 (10+ million tons/year) – 70% has no market openers – 30% reopened on price every 5 years • Next re-pricing will occur in 2013 – All volumes have cost escalators – Rail contract through 2013 • LEC/TEC supply under contract until 2010 (3.5 million tons/year) – 100% at fixed price or capped through 2012 – Additional supply being negotiated for future years – Rail contract through 2013 Co-owned plant supply managed by GXP (20%) • LAC supply (3 million tons/year) Coal Supply |
 55 Wolf Creek Generating Station • Commercial operation in September 1985 – 1166 MW Westinghouse PWR • Co-owners – Westar Energy – 47% (548 MW) – Great Plains Energy – 47% – KEPCo – 6% • Operated by Wolf Creek Nuclear Operating Corporation – Separate and dedicated operating company – Owned and governed by plant’s co-owners • Current operating license until 2045 – Received 20-year license extension in November 2008 • Operates on 18-month refuel cycle • No refuel and maintenance outage planned for 2010 |
 56 Future Wind Resources • Kansas statute requires additional 150 - 200 MW by end of 2011 • Currently in discussions with short list of providers – Expect to firm up plans by year end • Can include either PPAs, ownership or both |