Attached files
| file | filename |
|---|---|
| EX-32 - EXHIBIT 32 - Graham Holdings Co | dex32.htm |
| EX-23 - EXHIBIT 23 - Graham Holdings Co | dex23.htm |
| EX-24 - EXHIBIT 24 - Graham Holdings Co | dex24.htm |
| EX-21 - EXHIBIT 21 - Graham Holdings Co | dex21.htm |
| EX-10.3 - EXHIBIT 10.3 - Graham Holdings Co | dex103.htm |
| EX-31.2 - EXHIBIT 31.2 - Graham Holdings Co | dex312.htm |
| EX-31.1 - EXHIBIT 31.1 - Graham Holdings Co | dex311.htm |
Table of Contents
UNITED STATES SECURITIES AND EXCHANGE COMMISSION
Washington, D.C. 20549
FORM 10-K
ANNUAL REPORT PURSUANT TO SECTION 13 OR 15(d) OF THE SECURITIES EXCHANGE ACT OF 1934
FOR THE FISCAL YEAR ENDED JANUARY 3, 2010
Commission file number 1-6714
The Washington Post Company
(Exact name of registrant as specified in its charter)
| Delaware | 53-0182885 | |
| (State or other jurisdiction of incorporation or organization) |
(I.R.S. Employer Identification No.) | |
| 1150 15th St., N.W., Washington, D.C. | 20071 | |
| (Address of principal executive offices) | (Zip Code) | |
Registrant’s Telephone Number, Including Area Code: (202) 334-6000
Securities Registered Pursuant to Section 12(b) of the Act:
| Title of each class | Name of each exchange on which registered | |
| Class B Common Stock, par value $1.00 per share |
New York Stock Exchange |
Indicate by check mark if the registrant is a well-known seasoned issuer, as defined in Rule 405 of the Securities Act. Yes x No ¨
Indicate by check mark if the registrant is not required to file reports pursuant to Section 13 or 15(d) of the Securities Exchange Act of 1934 (the “Act”). Yes ¨ No x
Indicate by check mark whether the registrant (1) has filed all reports required to be filed by Section 13 or 15(d) of the Act during the preceding 12 months (or for such shorter period that the registrant was required to file such reports) and (2) has been subject to such filing requirements for the past 90 days. Yes x No ¨
Indicate by check mark whether the registrant has submitted electronically and posted on its corporate Website, if any, every Interactive Data File required to be submitted and posted pursuant to Rule 405 of Regulation S-T (§232.405 of this chapter) during the preceding 12 months (or for such shorter period that the registrant was required to submit and post such files). Yes ¨ No ¨
Indicate by check mark if disclosure of delinquent filers pursuant to Item 405 of Regulation S-K is not contained herein, and will not be contained, to the best of registrant’s knowledge, in definitive proxy or information statements incorporated by reference in Part III of this Form 10-K or any amendment to this Form 10-K. x
Indicate by check mark whether the registrant is a large accelerated filer, an accelerated filer, a non-accelerated filer, or a smaller reporting company. See the definition of “large accelerated filer,” “accelerated filer” and “smaller reporting company” in Rule 12b-2 of the Act. (Check one):
| Large accelerated filer x | Accelerated filer ¨ | Non-accelerated filer ¨ | Smaller reporting company ¨ |
Indicate by check mark whether the registrant is a shell company (as defined in Rule 12b-2 of the Act). Yes ¨ No x
Aggregate market value of the registrant’s common equity held by non-affiliates on June 26, 2009, based on the closing price for the Company’s Class B Common Stock on the New York Stock Exchange on such date: approximately $2,800,000,000.00.
Shares of common stock outstanding at February 25, 2010:
Class A Common Stock – 1,291,693 shares
Class B Common Stock – 7,961,086 shares
Documents partially incorporated by reference:
Definitive Proxy Statement for the registrant’s 2010 Annual Meeting of Stockholders
(incorporated in Part III to the extent provided in Items 10, 11, 12, 13 and 14 hereof).
Table of Contents
THE WASHINGTON POST COMPANY 2009 FORM 10-K
Table of Contents
The Washington Post Company (the “Company”) is a diversified education and media company. The Company’s Kaplan subsidiary provides a wide variety of educational services, both domestically and outside the United States. The Company’s media operations consist of the ownership and operation of cable television systems, newspaper publishing (principally The Washington Post), television broadcasting (through the ownership and operation of six television broadcast stations) and magazine publishing (Newsweek).
Information concerning the consolidated operating revenues, consolidated income from operations and identifiable assets attributable to the principal segments of the Company’s business for the last three fiscal years is contained in Note Q to the Company’s Consolidated Financial Statements appearing elsewhere in this Annual Report on Form 10-K. (Revenues for each segment are shown in Note Q gross of intersegment sales. Consolidated revenues are reported net of intersegment sales, which did not exceed 0.2% of consolidated operating revenues.)
The Company’s operations in geographic areas outside the United States consist primarily of Kaplan’s foreign operations and the publication of the international editions of Newsweek. During the fiscal years 2009, 2008 and 2007, these operations accounted for approximately 12%, 13% and 12%, respectively, of the Company’s consolidated revenues, and the identifiable assets attributable to foreign operations represented approximately 13%, 13% and 11% of the Company’s consolidated assets at January 3, 2010, December 28, 2008, and December 30, 2007, respectively.
Kaplan, Inc., a subsidiary of the Company, provides an extensive range of education and related services worldwide for students and professionals. Effective in the third quarter of 2009, Kaplan reorganized its operations into four segments: Kaplan Higher Education, Kaplan Test Preparation, Kaplan International and Kaplan Ventures.
The following table presents the net revenue for the three years ended December 31, 2009, 2008, and 2007 for each of Kaplan’s reportable segments:
| (in millions) | Year Ended December 31 | |||||||||||
| 2009 | 2008 | 2007 | ||||||||||
| Kaplan Higher Education |
$ | 1,539.6 | $ | 1,160.1 | $ | 933.3 | ||||||
| Kaplan Test Preparation |
445.0 | 507.1 | 554.8 | |||||||||
| Kaplan International |
537.2 | 545.1 | 442.2 | |||||||||
| Kaplan Ventures |
124.2 | 126.2 | 105.8 | |||||||||
| Kaplan Corporate and Intersegment Eliminations |
(9.4 | ) | (6.9 | ) | (5.2 | ) | ||||||
| Net Revenue |
$ | 2,636.6 | $ | 2,331.6 | $ | 2,030.9 | ||||||
See Note Q to the Company’s Consolidated Financial Statements for the segment information required by Items 101(b) and 101(d) of Regulation S-K.
Kaplan Higher Education
Kaplan Higher Education provides a wide array of certificate, diploma and degree programs—on campus and online—designed to meet the needs of students seeking to advance their education and career goals.
In 2009, Kaplan’s U.S. based higher education division included the following businesses: Kaplan University and Kaplan Higher Education Campuses. Each of these businesses is described briefly below.
Kaplan University
Kaplan University specializes in online education, is accredited by the Higher Learning Commission of the North Central Association of Colleges and Schools and holds other programmatic accreditations. Most of Kaplan University’s programs are offered online, while others are offered in a traditional classroom format at ten campuses in Iowa, Nebraska and Maryland. Kaplan University also includes Concord Law School, the nation’s first fully online law school. At year-end 2009, Kaplan University had approximately 60,400 students enrolled in online programs and 5,120 students enrolled in its classroom-based programs.
2009 FORM 10-K 1
Table of Contents
Kaplan Higher Education Campuses
At the end of 2009, Kaplan’s Higher Education Campuses business consisted of 73 schools in 19 states that were providing classroom-based instruction to approximately 44,500 students (including the 5,120 students enrolled at Kaplan University’s on-ground campuses). Each of these schools is accredited by one of several regional or national accrediting agencies recognized by the U.S. Department of Education.
Program Offerings and Enrollment
Kaplan University and Kaplan Higher Education Campuses offer degree and certificate programs in a variety of subject areas. Among them are the following:
| Master’s | Bachelor’s | Associate’s | Certificate | |||
| • Arts and Sciences
• Business Management
• Criminal Justice
• Health Sciences
• Higher Education Studies
• Information Systems and Technology
• Legal and Paralegal Studies
• Nursing
• Teacher Education |
• Arts and Sciences
• Business Management
• Criminal Justice
• Fire Safety and Emergency Management
• Health Sciences
• Information Systems and Technology
• Legal and Paralegal Studies
• Nursing
• Political Science and Public and Environmental Policy |
• Arts and Sciences
• Business Management
• Criminal Justice
• Fire Safety and Emergency Management
• Health Sciences
• Information Systems and Technology
• Legal and Paralegal Studies
• Nursing
• Political Science and Public and Environmental Policy |
• Criminal Justice
• Health Sciences
• Information Systems and Technology
• Nursing |
Kaplan University and Kaplan Higher Education Campuses enrollment at December 31, 2009, 2008 and 2007 totaled by degree and certificate programs were as follows:
| At December 31 | |||||||||
| 2009 | 2008 | 2007 | |||||||
| Certificate |
27.6 | % | 31.8 | % | 33.0 | % | |||
| Associate’s |
33.0 | % | 31.6 | % | 33.8 | % | |||
| Bachelor’s |
34.7 | % | 33.5 | % | 30.9 | % | |||
| Master’s |
4.7 | % | 3.1 | % | 2.3 | % | |||
| Total |
100 | % | 100 | % | 100 | % | |||
Financial Aid Programs and Regulatory Environment
Funds provided under the federal student financial aid programs that have been created under Title IV of the Higher Education Act of 1965, as amended (the “Federal Higher Education Act”), historically have been responsible for a majority of the net revenues of Kaplan Higher Education. During 2009, funds received under Title IV programs accounted for approximately $1,283 million, or approximately 83%, of total Kaplan Higher Education revenues, and 49% of Kaplan, Inc. revenues. The Company estimates that funds received from students borrowing under third-party private loan programs comprised approximately 1% of its higher education net revenues. Beginning in 2008 and continuing through 2009, as the private loan market deteriorated, Kaplan Higher Education provided loans directly to some Kaplan students under a third-party institutional loan program. Lending under Kaplan’s institutional loan program totaled approximately 1% of its higher education net revenue in 2009. Direct student payments, funds received under various state and agency grant programs and corporate reimbursement under tuition assistance programs accounted for most of the remainder of 2009 Kaplan Higher Education revenues. The significant role of Title IV funding in the operations of Kaplan Higher Education is expected to continue.
Title IV programs encompass various forms of student loans, with the funds being provided either by the federal government itself or by private financial institutions with a federal guarantee protecting the institutions against the risk of default. In some cases, the federal government pays part of the interest expense. Other Title IV programs offer
2 THE WASHINGTON POST COMPANY
Table of Contents
nonrepayable grants. Subsidized loans and grants are only available to students who can demonstrate financial need. During 2009, about 71% of the approximately $1,283 million of Title IV funds received by Kaplan Higher Education came from student loans, and approximately 29% of such funds came from grants.
Title IV Eligibility. To maintain Title IV eligibility, a school must comply with extensive statutory and regulatory requirements relating to its financial aid management, educational programs, financial strength, administrative capability, facilities, recruiting practices and various other matters. Among other things, the school must be licensed or otherwise authorized to offer its educational programs by the appropriate governmental body in the state or states in which it is physically located, be accredited by an accrediting agency recognized by the U.S. Department of Education (the “Department of Education”) and be certified to participate in the Title IV programs by the Department of Education. Schools are required periodically to apply for renewal of their authorization, accreditation or certification with the applicable state governmental bodies, accrediting agencies and the Department of Education. In accordance with Department of Education regulations, some schools in Kaplan Higher Education are combined into groups of two or more schools for the purpose of determining compliance with certain Title IV requirements, and each such group is assigned its own identification number, known as an OPEID number. As a result, the schools in Kaplan’s Higher Education division have a total of 33 OPEID numbers.
No assurance can be given that the Kaplan schools currently participating in Title IV programs will maintain their Title IV eligibility, accreditation and state authorization in the future or that the Department of Education might not successfully assert that one or more of such schools have previously failed to comply with Title IV requirements.
Student Default Rates. A school may lose its eligibility to participate in Title IV programs if student defaults on the repayment of Title IV loans exceed specified rates, referred to as “cohort default rates.” The Department of Education calculates a cohort default rate for each of Kaplan Higher Education’s OPEID numbers. The schools in an OPEID number whose cohort default rate exceeds 40% for any single year may lose their eligibility to participate in the Federal Family Education Loan (“FFEL”) and Direct Loan programs and Federal Pell Grant programs for at least two fiscal years, except in the event of a successful adjustment or appeal. The schools in an OPEID number whose cohort default rate equals or exceeds 25% for three consecutive years may lose their Title IV eligibility to participate in FFEL, Direct Loan and Federal Pell Grant programs for at least two fiscal years, except in the event of a successful adjustment or appeal. The schools in an OPEID number whose cohort default rate equals or exceeds 25% in any one of the three most recent fiscal years for which rates have been issued by the Department of Education may be placed on provisional certification by the Department of Education.
The enactment in August 2008 of the Higher Education Opportunity Act (which reauthorized the Federal Higher Education Act) changed the methodology that will be used to calculate cohort default rates for future years. Under the revised law, the period of time for which student defaults are tracked and included in the cohort default rate calculation is extended by a year, which is expected to increase the cohort default rates for most institutions. That change became effective with the calculation of institutions’ cohort default rates for the federal fiscal year ending September 30, 2009; those rates are expected to be calculated and issued by the Department of Education in 2012. The Department of Education will not impose sanctions based on rates calculated under this new methodology until three consecutive years of rates have been calculated, which is expected to occur in 2014. Until that time, the Department of Education will continue to calculate rates under the old method and impose sanctions based on those rates. The revised law also increases the threshold for ending an institution’s participation in certain Title IV programs from 25% to 30% for three consecutive years, effective for three-year cohort default rates issued beginning in fiscal year 2012.
The cohort default rate for Kaplan University (which comprises 52% of Kaplan Higher Education’s revenue) and for all of Kaplan Higher Education for the federal fiscal year periods 2007, 2006 and 2005 were as follows:
| Cohort Year Ended September 30 |
|||||||||
| 2007 | 2006 | 2005 | |||||||
| Kaplan University |
13.3 | % | 9.2 | % | 5.9 | % | |||
| Total Kaplan Higher Education |
17.8 | % | 14.7 | % | 9.7 | % | |||
For the 2007 cohort year, four reporting units had a cohort default rate of 25% or more. For the 2008 cohort year, which has been issued in draft form by the Department of Education, only one reporting unit had a cohort default rate greater than 25%, and none had two or more consecutive years above 25%. These 2008 draft rates are not final and are subject to revision. Based on the 2008 draft cohort default rates, we expect Kaplan University’s 2008 fiscal year cohort default rate to be between 15% and 17%, and the overall Kaplan Higher Education rate to be between 16% and 18%. Student loan default rates tend to be higher in certificate and associate’s degree programs as compared to bachelor’s and graduate degree programs. A majority of Kaplan Higher Education students are enrolled in certificate and associate’s degree programs.
2009 FORM 10-K 3
Table of Contents
Kaplan Higher Education has implemented initiatives to mitigate the increased risk of student loan defaults for Kaplan University and Kaplan Higher Education Campuses’ students. Kaplan has dedicated resources focused on helping the students who are at risk of default. Kaplan personnel contact students and provide assistance, which includes providing students with specific loan repayment information, lender contact information and debt counseling. Kaplan has also implemented a financial literacy and counseling program for current students and has refined and improved its student retention programs, resulting in improved retention rates. Students who withdraw prior to program completion demonstrate a higher loan default rate than those who continue through to graduation. Although Kaplan has dedicated resources to mitigate the increased risk of student loan defaults by its students, there is no guarantee that such efforts will be successful.
The “90/10” Rule. Prior to the enactment of the Higher Education Opportunity Act, any for-profit postsecondary institution (a category that includes all of the schools in Kaplan Higher Education) would lose its Title IV eligibility for at least one year if more than 90% of the institution’s receipts for any fiscal year were derived from Title IV programs, as calculated on a cash basis in accordance with the Federal Higher Education Act and applicable Department of Education regulations. Under amendments to the Federal Higher Education Act, a for-profit institution loses its eligibility to participate in the Title IV programs for a period of at least two fiscal years if the institution derives more than 90% of its receipts from Title IV programs for two consecutive fiscal years, commencing with the institution’s first fiscal year that ends after August 14, 2008. An institution with Title IV receipts exceeding 90% for a single fiscal year ending after August 14, 2008, will be placed on provisional certification and may be subject to other enforcement measures. The 90/10 Rule calculations are performed for each OPEID unit. The largest OPEID reporting unit in Kaplan’s Higher Education division in terms of revenue is Kaplan University, which accounted for approximately 61% of the Title IV funds received by the division in 2009. In 2009, Kaplan University derived less than 87.5% of its receipts from the Title IV programs, and other OPEID units derived an average of less than 83% of their receipts from Title IV programs, with no unit deriving more than 88% of its receipts from such programs.
The proportion of Kaplan Higher Education’s revenue from certificate and associate degree programs is composed of a higher percentage of Title IV funds than is the case for its bachelor’s and other degree programs. A majority of Kaplan Higher Education students are enrolled in certificate and associate degree programs. Kaplan Higher Education is taking various measures to reduce the percentage of its receipts attributable to Title IV funds, including emphasizing direct-pay and employer-paid education programs, encouraging students to carefully evaluate the amount of Title IV borrowing, and developing additional professional development and continuing education programs. Although Kaplan is taking steps to address compliance with the 90/10 Rule, there can be no guarantee that these measures will be adequate to prevent the 90/10 Rule calculations from exceeding 90% in the future.
Regulations Regarding Disbursement or Retention of Title IV Funds. The Department of Education may fine a school, require a school to repay Title IV program funds, limit or terminate a school’s eligibility to participate in the Title IV programs, initiate an emergency action to suspend the school’s participation in the Title IV programs without prior notice or opportunity for a hearing, transfer a school to a method of Title IV payment that would adversely affect the timing of the institution’s receipt of Title IV funds, deny or refuse to consider a school’s application for renewal of its certification to participate in the Title IV programs, refer a matter for possible civil or criminal investigation or take other enforcement measures if it finds that the school has failed to comply with Title IV requirements or improperly disbursed or retained Title IV program funds. In addition, there may be other legal theories under which a school could be sued as a result of alleged irregularities in the administration of student financial aid.
Change of Control. Each Kaplan Higher Education school is certified to participate in Title IV programs. Pursuant to Title IV program regulations, a school that undergoes a change in control, which may include a change in control of a school’s parent corporation or other owners, must be reviewed and recertified by the Department of Education and obtain approvals from certain state agencies and accrediting bodies, in some cases prior to the change of control. Certifications obtained from the Department of Education following a change in control are granted on a provisional basis that permits the school to continue participating in Title IV programs, but provides fewer procedural protections if the Department of Education asserts a material violation of Title IV requirements.
Standards of Financial Responsibility. An institution participating in the Title IV programs must comply with certain measures of financial responsibility under the Higher Education Act and under Department of Education regulations. Among other things, the applicable regulations require an institution to achieve a composite score of at least 1.5 as calculated under Department of Education regulations based on data in annual financial statements submitted to the Department of Education. If an institution fails to achieve a composite score of 1.5 or fails to comply with other financial responsibility standards, the Department of Education may place conditions on the institution’s participation in the Title IV programs and may require the institution to submit to the Department of Education a letter of credit in an amount of at least 10% to 50% of the institution’s annual Title IV participation for its most recent fiscal year. The Department of Education has
4 THE WASHINGTON POST COMPANY
Table of Contents
measured the compliance of Kaplan Higher Education schools based on the composite score of the division. For the 2009 fiscal year, Kaplan’s Higher Education had a composite score of 2.45.
Department of Education Program Reviews. In September 2008, the Department of Education began a Program Review at Kaplan’s Higher Education division’s CHI-Broomall campus. The Program Review is ongoing. The reviewers have completed their field work. CHI-Broomall and Kaplan have responded to a preliminary report issued by the Department of Education, are responding to a February 12, 2010 request by the Department of Education for additional information and are cooperating fully in the review. The Department of Education has not yet issued a final report on this review. No assurance can be given that the Department of Education’s final report will not have a significant adverse effect on Kaplan’s ability to continue to operate this school.
The Department of Education has also conducted Program Reviews at Kaplan’s Higher Education division’s Pittsburgh and Baltimore locations, which began in October 2007 and May 2008, respectively. Kaplan has responded to all requests for information and is cooperating fully in these reviews. The Department of Education has not yet issued final reports on these reviews. No assurance can be given that the Department of Education’s final report will not have a significant adverse effect on Kaplan’s ability to continue to operate these schools.
In September 2009, the Department of Education began a Program Review of Kaplan University at its offices in Fort Lauderdale, FL. Kaplan University is continuing to respond to all requests for information and is cooperating fully in the review. The reviewers completed their field work, are reviewing documentation already submitted and are gathering additional documentation. The Department of Education has not issued the final Program Review report. No assurance can be given that the Department of Education’s final report will not have a significant adverse effect on Kaplan’s ability to continue to operate this school.
In January 2010, the Department of Education began a program review at Kaplan Higher Education’s Bauder campus. That same month, the Department of Education issued an expedited final determination letter, closing its program review with no significant finding.
The Company is presently not aware of any proceeding by the Department of Education to fine any Kaplan school for a failure to comply with any Title IV requirement, or to limit, suspend or terminate the Title IV eligibility of any Kaplan school.
Institutional Accreditation. As noted previously, to remain eligible to participate in Title IV programs, a school must maintain its accreditation by an accrediting agency recognized by the Department of Education. In 2009, no Kaplan Higher Education division school received notice from its institutional accreditors indicating that the school’s accreditation was being withdrawn or that the school was being issued an order to show cause why its accreditation should not be withdrawn.
Congressional Reauthorization of Title IV Programs. All of the Title IV financial aid programs are subject to periodic legislative review and reauthorization. In addition, while Congress historically has not limited the amount of funding available for the various Title IV student loan programs, the availability of funding for the Title IV programs that provide for the payment of grants is primarily contingent upon the outcome of the annual federal appropriations process.
Whether as a result of changes in the laws and regulations governing Title IV programs, a reduction in Title IV program funding levels or a failure of schools within Kaplan Higher Education to maintain eligibility to participate in Title IV programs, a material reduction in the amount of Title IV financial assistance available to the students attending those schools would have a significant negative impact on Kaplan’s operating results. In addition, any development that has the effect of making the terms on which Title IV financial assistance is made available materially less attractive could also adversely affect Kaplan’s operating results.
Test Preparation
Kaplan Test Preparation (“KTP”) includes the following businesses: Test Preparation and Tutoring; Professional and Licensure; and Kaplan Publishing. Each of these businesses is discussed briefly below.
Test Preparation and Tutoring
The test preparation and tutoring business prepares students for a broad range of college and graduate school admissions examinations, including the SAT, ACT, LSAT, GMAT, MCAT and GRE. During 2009, these courses were offered at numerous locations throughout the U.S., Canada, Puerto Rico, Mexico, London and Paris. KTP also offers courses online, which are delivered in a live online classroom and a self-study format. In addition, KTP licenses material for certain of its courses to third parties and a Kaplan affiliate, which, during 2009, offered courses at 55 locations in 11 countries outside the U.S. KTP also offers programs and services, including college admissions examination preparation courses, directly to schools and school districts for students in kindergarten through 12th grade. These offerings were
2009 FORM 10-K 5
Table of Contents
provided through Kaplan’s K12 Learning Services business, which, in the first quarter of 2010, was integrated into KTP’s business. In July 2009, KTP launched Kaplan Tutoring, which offers individualized live tutoring and customized online programs for children from kindergarten through 8th grade.
Professional and Licensure
The professional and licensure businesses (collectively, “Professional and Licensure”) prepare professionals for a variety of licensing and advanced designation exams and offer continuing education in various fields. Professional and Licensure includes the following businesses: Kaplan Medical and Kaplan Nursing, which prepare students for licensure exams including the USMLE and NCLEX exams; Kaplan PMBR, which offers full-service bar review in 19 states, as well as review for the multistate portion of the bar exam nationwide; Kaplan Schweser, which offers test preparation courses to financial services professionals for the CFA, FRM and CPA exams, as well as continuing education for accountants; Kaplan Financial Education, which provides entrance exam preparation and continuing education courses for financial services professionals; Kaplan Real Estate Education, which provides courses for real estate, home inspection, architecture and engineering; Kaplan Professional Publishing, which provides printed and online materials that help individuals study for and/or satisfy state licensing and continuing education requirements; and Kaplan Continuing Education, which offers certificate programs in fields such as business, finance, health care and information technology.
The courses offered by KTP are provided in various formats including classroom-based instruction, online programs, printed study guides, in-house training and through other technological means. During 2009, these businesses enrolled more than 638,000 students in their courses (including over 206,000 enrolled in online programs).
Publishing
Kaplan Publishing, which is operated separately from Kaplan Professional Publishing, publishes a variety of general trade and educational books in subject areas such as test preparation, business, law, medicine and nursing. At the end of 2009, Kaplan Publishing had nearly 550 books in print, more than 330 e-Books and 20 mobile applications for smart- phones.
Kaplan International
Kaplan International includes Kaplan Europe and Kaplan Asia Pacific. Each of these businesses is discussed briefly below.
Kaplan Europe
Kaplan Europe, which Kaplan formed in connection with the 2009 reorganization, includes the following businesses, which are all based in the U.K. and Ireland: Kaplan Professional; Kaplan International Colleges; and a set of higher education institutions.
The Kaplan Professional business in Europe is a U.K.-based provider of training, test preparation services and degrees for accounting and financial services professionals, including those studying for ACCA, CIMA and ICAEW qualifications. In addition, Kaplan Professional provides legal and professional training, including the operation of a U.K. law school in collaboration with Nottingham Trent University’s Nottingham Law School. In 2009, Kaplan Professional provided courses to approximately 74,000 students, of which 48,000 were dedicated to accounting and financial services professionals. Kaplan Professional is headquartered in London and has 27 training centers located throughout the U.K.
The Kaplan International Colleges (“KIC”) business comprises a University pathways business and an English-language business. The University pathways business offers academic preparation programs especially designed for international students who wish to study in English-speaking countries. KIC operates University pathways programs in collaboration with six U.K. universities, two U.S. universities and one Australian university. At the end of 2009, KIC’s University pathways business was serving over 2,800 students. The English-language business (previously operated under the name “Kaplan Aspect”) provides English-language training, academic preparation programs and test preparation for English proficiency exams, principally for students wishing to study and travel in English-speaking countries. KIC operates a total of 43 English-language schools, with 21 located in the U.K., Ireland, Australia, New Zealand and Canada, and 22 located in the U.S., where they operate under the name Kaplan International Centers. During 2009, the English-language business served approximately 55,000 students.
Kaplan Europe also includes three higher education institutions located in the U.K. and Ireland. These institutions are Dublin Business School, Holborn College and Kaplan Open Learning. At year-end, these institutions had an aggregate of approximately 8,050 students.
6 THE WASHINGTON POST COMPANY
Table of Contents
Kaplan Asia Pacific
Kaplan Asia Pacific operates primarily in Singapore, Australia, Hong Kong and China.
In Singapore, Kaplan provides students with the opportunity to earn undergraduate and graduate degrees, principally in business-related subjects, science and engineering, as well as communications and media. Kaplan degrees are offered by affiliated educational institutions in Australia, the U.K. and the U.S. In addition, Kaplan’s Singapore business offers pre-university and diploma programs. Kaplan also offers accountancy exams and financial markets training in Singapore. At year-end 2009, Kaplan’s Singapore business had approximately 18,000 students enrolled in its programs.
In Australia, Kaplan delivers a broad range of financial services education and professional development courses. In 2009, this business provided courses to more than 11,000 students through classroom programs and to more than 30,000 students through distance-learning programs. Additionally, Kaplan operates three Australian accredited Kaplan Business School centers, in Sydney, Melbourne and Adelaide, offering foundation and master’s degree programs. Finally, through Bradford College, Kaplan offers two academic preparation programs for entry into Australian undergraduate university programs for 700 international students.
In Hong Kong, Kaplan offers accountancy exams, non-exam-based postgraduate programs, financial markets training and continuing professional development training. Kaplan also offers Mandarin-language training and test preparation courses for the Chinese Proficiency Test. During 2009, Kaplan’s Hong Kong business provided courses to over 20,000 students.
In China, Kaplan provides academic preparation programs for entry to overseas universities at campuses in several cities in China. Kaplan China had approximately 600 students enrolled at the end of 2009.
Kaplan Ventures
The Kaplan Ventures division manages and develops businesses in markets adjacent to Kaplan’s core educational businesses. Kaplan Ventures’ management provides these businesses with industry expertise and management support with a view toward the long-term strategic benefits these businesses may provide to Kaplan. In 2009, the Kaplan Ventures division included Kaplan EduNeering, Kaplan Compliance Solutions, Education Connection, Kaplan IT Learning, The Kidum Group and Kaplan Virtual Education.
Kaplan EduNeering provides online regulatory compliance training and learning management systems technology principally for businesses in the pharmaceutical, medical technology, health care, energy, telecom and defense-related industries. During 2009, Kaplan EduNeering provided services to more than 1.5 million users at approximately 376 companies.
Kaplan Compliance Solutions (“KCS”) assists insurance carriers, agencies and broker/dealers with their licensure and/or registration filings and assists its clients in compliance with myriad national and state-level regulatory requirements applicable to these industries. During 2009, KCS provided services to more than 700 companies.
Kaplan IT Learning provides certification preparation, assessment, learning services and software to help individuals and organizations train on software applications and prepare for technical certifications in the information technology industry. During 2009, Kaplan IT Learning delivered more than 160,000 certification preparation practice tests.
The Kidum Group, headquartered in Tel Aviv, Israel, provides test preparation courses for Israeli high school graduation exams, university admissions exams and the GMAT. Kidum also provides English-language courses at 11 permanent centers located throughout Israel as a franchisee of Wall Street International, which is a provider of English-language training to corporations and individuals at locations outside the U.S. During 2009, Kidum provided courses to approximately 30,000 students.
Kaplan Virtual Education (“KVE”) operates charter and private virtual schools that offer online instruction to students in grades 6 through 12. KVE also provides instructors and curriculum and manages virtual schools for 19 school districts throughout the U.S. At year-end 2009, KVE was providing courses to approximately 3,850 students.
Through its subsidiary Cable ONE, Inc. (“Cable ONE”), the Company owns and operates cable television systems that provide video, Internet and phone service to subscribers in 19 midwestern, western and southern states. At the end of 2009, Cable ONE provided cable service to approximately 669,000 basic video subscribers (representing about 48% of the 1,395,000 homes passed by the systems) and had in force approximately 219,100 subscriptions to digital video service, 392,800 subscriptions to cable modem service and 109,600 subscriptions to VoIP (digital voice) service. Digital video, cable modem and VoIP services are available in markets serving virtually Cable ONE’s entire subscriber base. The digital video services offered by Cable ONE include certain premium, cable network and local over-the-air channels in HDTV.
2009 FORM 10-K 7
Table of Contents
Regulation of Cable Television and Related Matters
Cable ONE’s cable, Internet and voice operations are subject to various requirements imposed by local, state and federal governmental authorities. The regulation of certain cable television rates pursuant to procedures established by Congress has negatively affected Cable ONE’s revenue. Certain other legislative and regulatory matters discussed in this section also have the potential to adversely affect Cable ONE’s cable television, Internet and voice businesses.
Cable Television
Federal law requires or authorizes the imposition of a wide range of regulations on cable television operations.
Franchising. Cable ONE’s cable systems are required to obtain franchises from state or local governmental authorities to operate. Those franchises typically are nonexclusive and limited in time, contain various conditions and limitations, and provide for the payment of fees to the local authority, determined generally as a percentage of revenues. Additionally, those franchises often regulate the conditions of service and technical performance and contain various types of restrictions on transferability. Failure to comply with all of the terms and conditions of a franchise may give rise to rights of termination by the franchising authority. The Federal Communications Commission (“FCC”) has adopted rules designed to expedite the process of awarding competitive franchises and relieving applicants for competing franchises of some locally-imposed franchise obligations. The FCC also has extended certain of these “reforms” to incumbent cable operators. Separately, a number of states (including Iowa, Kansas, Louisiana, Missouri, Tennessee and Texas—all states in which Cable ONE operates cable systems) have enacted laws to permit video service providers to secure statewide franchises, thereby relieving these providers of the need to seek multiple authorizations from various local franchising authorities within a state. This development, which is especially beneficial to new entrants, is expected to continue to accelerate the competition Cable ONE is experiencing in the marketplace for video service.
Rate Regulation. FCC regulations prohibit local franchising authorities or the FCC to regulate the rates that cable systems charge for certain levels of video cable service, equipment and service calls when those cable systems are subject to “effective competition.” The FCC has confirmed that some of the cable systems owned by the Company fall within the effective-competition exemption, and the Company believes, based on an analysis of competitive conditions within its systems, that other of its systems may also qualify for that exemption. Nevertheless, monthly subscription rates charged for the basic tier of cable service, as well as rates charged for equipment rentals and service calls for many of Cable ONE’s cable systems, remain subject to regulation by local franchise authorities in accordance with FCC rules. However, rates charged by cable systems for tiers of service other than the basic tier—such as pay-per-view and per-channel premium program services, digital video, cable modem and digital telephone services—and for advertising currently are exempt from regulation.
“Must-Carry” and Retransmission Consent. Federal law provides that a commercial television broadcast station may, subject to certain limitations, insist on carriage of its signal on cable systems located within the station’s market area. Similarly, a noncommercial public station may insist on carriage of its signal on cable systems located either within the station’s predicted Grade B signal contour or within 50 miles of a reference point in a station’s community designated by the FCC. As a result of these obligations, certain of Cable ONE’s cable systems must carry broadcast stations that they might not otherwise have elected to carry, and their freedom to drop signals previously carried has been reduced.
Commercial broadcasters have the right to elect at three-year intervals to forego must-carry rights and insist instead that their signals not be carried by cable systems without their prior consent. The next three-year election cycle begins October 1, 2011, with the elections effective January 1, 2012, through December 31, 2014. In some cases, Cable ONE has been required to provide consideration to broadcasters to obtain retransmission consent, such as commitments to carry other program services offered by a station or an affiliated company, to purchase advertising on a station or to provide advertising availabilities on cable to a station. More recently, some broadcasters have begun to seek cash payment from cable systems such as Cable ONE for the right to carry their signals. This development results in increased operating costs for cable systems that ultimately increase the rates cable systems charge subscribers.
Digital Television (“DTV”). FCC regulations require cable systems to ensure that all local must-carry broadcast stations are “viewable” by all subscribers. Moreover, where a must-carry broadcast station’s signal is transmitted in high-definition television (“HDTV”) format, cable operators generally are required to carry the signal in HDTV format. Although certain smaller cable systems are not subject to these requirements, satisfaction of the generally applicable obligation could increase Cable ONE’s costs by requiring it to expand the capacity of its cable systems or to delete some existing programming to make room for all of the video streams included in broadcasters’ DTV signals.
8 THE WASHINGTON POST COMPANY
Table of Contents
Pole Attachments. Federal law requires most telephone and power utilities to charge reasonable rates to cable operators for utilizing space on utility poles or in underground conduits. The FCC has adopted two separate formulas for calculating such rates: one for attachments by cable operators generally and a higher rate for attachments used to provide “telecommunications services.” A number of cable operators (including the Cable ONE) are using their cable systems to provide not only television programming, but also Internet access and digital voice. In 2002, the U.S. Supreme Court held that the lower pole attachment rates apply not only to attachments used to provide traditional cable services, but also to attachments used to provide Internet access services. The FCC has not yet determined whether digital voice provided by cable operators is a “telecommunications service” that would trigger the higher pole attachment rates. Changes to Cable ONE’s pole attachment rate structure could significantly increase its annual pole attachment costs.
Federal Copyright Issues. The Copyright Act of 1976, as amended, gives cable television systems the ability, under certain terms and conditions and assuming that any applicable retransmission consents have been obtained, to retransmit the signals of television stations pursuant to a compulsory copyright license. Those terms and conditions require all cable systems that retransmit broadcast signals to pay semiannual royalty fees, generally based on the systems’ gross revenues from basic service and, in certain instances, the number of “distant” broadcast signals carried. The compulsory license fees have been increased on several occasions since this act went into effect. Since 1989, a separate compulsory copyright license for distant signal retransmissions has applied to direct broadcast satellite (“DBS”), and in 1999, Congress provided DBS with a royalty-free compulsory copyright license for distribution of the signals of local television stations to satellite subscribers in the markets served by such stations. The cable compulsory license for local and distant signals and the DBS local signal compulsory license are permanent, while the DBS distant signal compulsory license is scheduled to sunset at the end of February 2010, although it is possible that the DBS distant signal compulsory license will be extended. In addition, the cable and DBS compulsory licenses employ different methodologies for calculating royalties, with cable using a percentage of revenues approach and DBS using a flat, per subscriber, per signal payment approach.
Congress is considering amendments to the cable compulsory license that could affect application of the compulsory license to the retransmission of digital television broadcast signals, revise certain compulsory license reporting requirements and change how statutory royalty fees are calculated. In addition, the Copyright Office is considering requests for clarification of the application of the cable compulsory license to the retransmission of distant DTV broadcast signals and for clarification and revisions of certain cable compulsory copyright license reporting requirements. Cable ONE cannot predict the outcome of any such inquiries, rulemaking proceedings or legislative initiatives; however, it is possible that changes in the rules or copyright compulsory license fee computations or compliance procedures could have an adverse effect on its business by increasing copyright compulsory license fee costs or by causing Cable ONE to reduce or discontinue carriage of certain broadcast signals that it currently carries on a discretionary basis.
Telephone Company Competition. Federal law permits telephone companies also to offer video programming services. Over the past decade, telephone companies have pursued multiple strategies to enter the market for the delivery of multichannel video programming services. Initially, some telephone companies partnered with DBS operators to resell a DBS service to their telephone customers. Some telephone companies still do this, but other telephone companies have entered into traditional franchise agreements with local and state franchising authorities and have constructed their own video programming delivery systems. Still other telephone companies have developed other methods to deliver video programming that, depending on the technology employed, may be regulated in a manner similar to the Company’s cable systems. Some telephone companies have taken the position that the specific technology employed in delivering video programming dictates whether a local franchise is required. The theory is that because the provider is not delivering a “cable service,” as that term is defined in federal law, but rather is delivering an “information service,” which by law is not subject to regulation by state and local governments, no local franchise is required. Neither the FCC nor the courts have addressed this issue definitively, but in the meantime, most major telephone companies are entering into franchise agreements to provide their video programming distribution services to consumers. Increased competition from telephone companies that provide competing services could have a material effect on Cable ONE’s business.
Wireless Services. At various times over the past decade, the FCC has taken steps to facilitate the use of certain frequencies, notably the 2.5 GHz and 3.1 GHz bands, to deliver over-the-air multichannel video programming services to subscribers in competition with cable television systems. However, those services generally were not deployed commercially in any significant way. Beginning in 2004, the FCC adopted rule changes that allowed the 2.5 GHz band to be used for nonvideo services and permitted transmitters to be deployed in cellular patterns. As a result of these rule changes, the 2.5 GHz and other frequency bands (including the 1.7 GHz and 2.1 GHz bands in which the FCC auctioned spectrum in 2006) now are being adopted for the delivery of two-way broadband digital data and high-speed Internet access services capable of covering large areas. Initially, these services were going to be provided on a fixed basis, delivering access to houses and businesses, but they now are expected to accommodate mobile devices, such as laptop computers with a wireless adapter card. These wireless networks are expected to use a variety of advanced
2009 FORM 10-K 9
Table of Contents
transmission standards, including an increasingly popular standard known as WiMAX, and may result in the increased availability of mobile video services. Also in 2006, a number of cellular telephone providers introduced or expanded subscription services that deliver full-length television programs or video clips directly to cellular telephones, although at present these services are capable of supporting only a limited number of available video streams. In 2008, the FCC auctioned additional spectrum in the 700 MHz band, which historically has been used for analog television broadcasting, and it is expected that this additional spectrum will be used to accommodate broadband, video and other services to mobile devices. Although it is not yet clear what effect, if any, the increased availability of mobile video services will have on the cable television industry, these developments likely will increase the number of competitive alternatives to Cable ONE’s services.
Horizontal and Vertical Ownership Limits. In September 2009, a reviewing court struck down and remanded the FCC’s horizontal cable ownership rule, which provided that a single company could not serve more than 30% of potential cable subscribers (or “homes passed” by cable) nationwide. Although the reviewing court’s decision authorizes the FCC to seek to justify the rule, it is not clear whether the FCC will attempt to do so. Separately, the FCC has proposed reinstating vertical ownership restrictions that would cap the percentage of a cable system’s channel capacity that could be used to carry channels in which the operator has an ownership interest, but it has taken no action to implement such restrictions. There currently is no restriction on the ownership of both a television broadcast station and a cable television system in the same market.
Set-Top Boxes. Pursuant to a Congressional directive to promote competition in the retail market for set-top converter boxes, the FCC has adopted rules barring cable operators from deploying set-top boxes with “integrated” security and navigation functions and requiring cable operators to support boxes and other devices designed to accept plug-in cards (“CableCARDs”) that provide the descrambling and other security features that traditionally have been included in the integrated set-top converter boxes leased by cable operators to their customers. The FCC has granted some requests for waivers of this rule, including one such request filed by Cable ONE to allow it to offer low-cost, HD-capable integrated set-top boxes to subscribers of its Dyersburg, TN, system. The general prohibition on integrated set-top boxes has the potential to increase the capital costs of cable operators (because of the need to provide CableCARDs to customers and because the new type of converter box is typically more expensive than the traditional integrated box).
Other Requirements. In February 2008, the FCC issued revised commercial leased access rules that require cable operators to make a certain portion of their systems’ capacity available to parties desiring to transmit programming via cable on a leased basis. These revised rules could substantially reduce the rates for parties desiring to lease capacity on cable systems and also impose a variety of leased access customer service, information and reporting standards. Implementation of these new rules has been stayed by the courts, and certain of the rules also were rejected by the Office of Management and Budget (“OMB”) as inconsistent with the federal Paperwork Reduction Act. Certain parties have requested that the FCC override the OMB ruling, but no action has been taken on that request. The FCC has not indicated its intent to move forward with implementation of these new rules. If they take effect, however, they likely will increase Cable ONE’s costs and could cause additional leased access activity on Cable ONE’s cable systems. As a result, Cable ONE may find it necessary to either discontinue other channels of programming or opt not to carry new channels of programming or other services that may be more desirable to its customers.
The FCC also regulates various other aspects of cable television operations. Long-standing FCC rules require cable systems to black out from certain distant broadcast stations the syndicated programs for which local stations have purchased exclusive rights and requested exclusivity, and to delete, under certain circumstances, duplicative network programs broadcast by distant stations. The FCC also imposes certain technical standards on cable television operators, exercises the power to license various microwave and other radio facilities frequently used in cable television operations and regulates the assignment and transfer of control of such licenses.
Internet Access Services
In 2005, the U.S. Supreme Court upheld the FCC’s classification of cable modem service as an “information service.” As a result, cable modem service is not subject to the full panoply of regulations that applies to “cable services” or “telecommunications services” under the Communications Act of 1934, as amended (the “Communication Act”), nor is it subject to state or local government regulation. In response to the Supreme Court’s decision, the FCC ruled that a telephone company’s offering of digital subscriber line (“DSL”) Internet access service is also an “information service.”
Cable ONE currently offers broadband Internet access service on virtually all of its cable systems and is the sole Internet service provider on those systems. Cable ONE does not restrict the websites that its broadband Internet access subscribers may view; however, regulations that distinguish between interference with subscriber access and reasonable network management are evolving and, over time, could begin to interfere with Cable ONE’s ability to manage its
10 THE WASHINGTON POST COMPANY
Table of Contents
network or provide services to its subscribers. The FCC currently is considering whether to impose certain “net neutrality” obligations on providers of broadband Internet access services, and the outcome of that proceeding is unclear. Congress, from time to time, also has considered whether to impose net neutrality requirements on providers of broadband Internet access service that would limit the ability of such providers to prioritize the delivery of particular types of content, applications or services over their networks. As a result of allegations that cable operators may be interfering with transmission and receipt of data on so-called “peer-to-peer” networks, several entities asked the FCC to ban such practices and to rule that reasonable network management practices do not include conduct that would block, degrade or unreasonably discriminate against lawful Internet applications, content or technologies. The FCC has ruled against at least one cable operator thus far in response to this request, but the cable operator has sought judicial review of the ruling, and the appeal is pending. Cable One cannot predict the outcome of this appeal or the impact it may have on net neutrality considerations in the future.
As part of the American Reinvestment and Recovery Act of 2009 (“ARRA”), the federal government has implemented a program pursuant to which a total of approximately $7.2 billion in grants and loans will be distributed to fund investment in the development of broadband networks throughout the U.S. It is expected that these grants and loans will be distributed mostly to facilitate the deployment of broadband Internet access services in rural and remote regions that do not already enjoy such services. The ARRA also required the FCC to develop a national broadband plan that is intended to guide U.S. policy in the area of domestic broadband deployment. The national broadband plan, which the FCC is expected to deliver to Congress on March 17, 2010, does not contain self-effectuating provisions, but it is expected to serve as a blueprint for broadband regulatory policy in the U.S. and, therefore, could have a material effect on Cable ONE and other providers of broadband Internet access services.
Providers of broadband Internet access services are subject to many of the same federal and state privacy laws that apply to other providers of electronic communications, such as cable companies and telephone companies, including the Electronic Communications Privacy Act, which addresses interceptions of electronic communications that are in transit; the Stored Communications Act, which addresses acquisitions of electronic data in storage; and the Communications Assistance for Law Enforcement Act (“CALEA”), which requires providers to make their services and facilities accessible to law enforcement for purposes of surveillance. Various federal and state laws also apply to Cable ONE and to others whose services are accessible through Cable ONE’s broadband Internet access service. These laws include copyright laws, prohibitions on obscenity and requirements governing unsolicited commercial email.
In December 2006, Cable ONE purchased in the FCC’s Advanced Wireless Service auction approximately 20 MHz of spectrum in the 1.7 GHz and 2.1 GHz frequency bands in areas that cover more than 85% of the homes passed by Cable ONE’s systems. This spectrum can be used to provide a variety of advanced wireless services, including fixed and mobile high-speed Internet access using WiMAX and other digital transmission systems. Licenses for this spectrum have an initial 15-year term and 10-year renewal terms. Licensees will be required to show that they have provided substantial service by the end of the initial license term to be eligible to renew, but there are no interim construction or service requirements. Cable ONE is evaluating how best to utilize its spectrum.
Voice Services
Voice Over Internet Protocol (“VoIP”). Cable companies, including Cable ONE and others, offer telephone service using VoIP, which permits users to make telephone calls over broadband communications networks, including the Internet. Federal law preempts state and local regulatory barriers to the offering of telephone service by cable companies and others, and the FCC generally has preempted specific state laws that seek to regulate VoIP.
The FCC has held that VoIP services generally are interstate in nature and thus subject exclusively to the FCC’s federal jurisdiction. This decision was upheld on appeal, although the FCC has an ongoing proceeding to consider whether VoIP services provided by cable companies and others are properly classified as an “information service,” “telecommunications service” or some other new category of service. This determination, once made, could have numerous regulatory implications for cable companies that provide VoIP services, including Cable ONE. Although the FCC has yet to ascribe a regulatory definition to VoIP services, the FCC nevertheless has imposed a number of obligations on VoIP providers, some of which are discussed more fully below. In the absence of a definitive FCC decision, several states (including some in Cable ONE’s service territory) also have attempted—and are expected to continue to attempt—to regulate VoIP services like traditional telephony service and impose certain fees and taxes on the provision of VoIP services. These state actions could have an adverse effect on Cable ONE’s business by increasing its costs to provide VoIP services. Legislation from time to time has been introduced in Congress to address the classification and regulatory obligations of VoIP providers. The prospects for passage of any such legislation are uncertain.
2009 FORM 10-K 11
Table of Contents
Emergency 911 Services. The FCC has ruled that an interconnected VoIP provider that enables its customers to make calls to and from persons who use the public switched telephone network must provide its customers with the same enhanced 911 (“E911”) features that traditional telephone and wireless companies are obligated to provide. This requirement was upheld on appeal. The FCC is currently assessing whether additional rules related to the provision of E911 services by interconnected VoIP service providers should be adopted.
CALEA. FCC regulations require providers of interconnected VoIP service to comply with the requirements of CALEA, which requires covered carriers and their equipment suppliers to deploy equipment that law enforcement officials can access readily for lawful wiretap purposes.
Universal Service. The FCC has determined that interconnected VoIP service providers must contribute to the universal service fund. The amount of a company’s universal service fund contribution is based on a percentage of revenues earned from end-user interstate and international services. This percentage figure changes from time to time and generally has been increasing, prompting Congress and the FCC to consider ways in which the universal service fund and the payment obligations of fund contributors should be reformed. Cable One cannot predict whether and how such reform will occur and the extent to which it may affect providers of VoIP services, including Cable ONE.
Intercarrier Compensation. The FCC is considering various proposals designed to reform the manner in which providers of telecommunications and VoIP services compensate one another for transporting and terminating various forms of network traffic. FCC determinations regarding the rates, terms and conditions for transporting and terminating such traffic can have a profound and material effect on the profitability of providing voice and data services. It is not possible to predict what actions the FCC might take in this area or the effect that they will have on Cable ONE.
CPNI. In 2007, the FCC adopted rules expanding the protection of customer proprietary network information (“CPNI”) and extending CPNI protection requirements to providers of interconnected VoIP. CPNI is information about the quantity, technical configuration, type, location and amount of a phone customer’s use. These requirements generally have increased the cost of providing VoIP service, as providers now must implement various safeguards to protect CPNI from unauthorized disclosure.
Access for Persons With Disabilities. FCC regulations require providers of interconnected VoIP services to comply with all disability access requirements that apply to telecommunications carriers, including the provision of telecommunications relay services for persons with speech or hearing impairments. These requirements generally have had the effect of increasing the cost of providing VoIP services.
Regulatory Fees. The FCC requires interconnected VoIP service providers to contribute to shared costs of FCC regulation through an annual regulatory fee assessment. These fees have increased Cable ONE’s cost of providing VoIP services.
Local Number Portability. Providers of interconnected VoIP services and their “numbering partners” must ensure that their subscribers have the ability to port their telephone numbers when changing service providers, and local exchange carriers and commercial mobile radio service providers must port numbers that they control to an interconnected VoIP service provider upon a valid port request. Cable ONE, along with other providers of interconnected VoIP service, must contribute funds to cover the shared costs of local number portability and the costs of North American Numbering Plan Administration. The FCC currently is considering whether additional numbering requirements (such as allowing consumers access to abbreviated dialing codes like 211 and 311) should be applied to interconnected VoIP service providers. Although consumers’ ability to port their existing telephone numbers to interconnected VoIP service has created additional opportunities for Cable ONE to gain voice customers, the local number portability and associated rules overall have had the effect of increasing the cost of providing VoIP service.
The Company’s newspaper publishing operations include results for its flagship newspaper, The Washington Post, its website, washingtonpost.com, The Slate Group and a number of additional newspapers and websites.
The Washington Post
WP Company LLC (“WP Company”), a subsidiary of the Company, publishes The Washington Post, which is a morning daily and Sunday newspaper primarily distributed by home delivery in the Washington, DC, metropolitan area, including large portions of Maryland and northern Virginia. The Post’s two primary sources of revenue are advertising and subscription fees, which accounted for 68% and 29% of its total revenue in 2009, respectively. Advertising revenue is derived from the sale of display and classified advertisements, as well as the insertion of preprinted advertisements.
The following table shows the average paid daily (including Saturday) and Sunday circulation of the Post for 52-week periods ended September 30, 2007 and September 28, 2008, as reported by the Audit Bureau of Circulations (“ABC”)
12 THE WASHINGTON POST COMPANY
Table of Contents
and as estimated by the Post for the 52-week period ended September 27, 2009, (for which period ABC had not completed its audit as of the date of this report), from the semiannual publisher’s statements submitted to ABC for the 26-week periods ended March 29, 2009 and September 27, 2009:
| Average Paid Circulation | ||||
| Daily | Sunday | |||
| 2007 |
657,918 | 912,433 | ||
| 2008 |
639,474 | 878,110 | ||
| 2009 |
615,628 | 845,587 | ||
The Post’s primary circulation territory accounts for more than 90% of its daily and Sunday circulation and consists of Washington, DC, and communities generally within a 50-mile radius from the city (but excluding Baltimore City and its northern and eastern suburbs). The current newsstand price is $0.75 for the daily newspaper and $2.00 for the Sunday newspaper in this area. The rate charged for each four-week period for home-delivered copies of the daily and Sunday newspaper was raised to $21.56 effective January 18, 2010. The rate charged for Sunday-only home delivery was raised to $7.40 for each four-week period effective January 18, 2010. On June 1, 2009, daily and Sunday newsstand prices were raised from $0.75 to $1.00 and from $2.00 to $2.50, respectively, outside the primary circulation area. Rates for home-delivered copies of the daily and Sunday newspaper outside the primary circulation area for each four-week period are $34.00 and are $10.00 for the Sunday newspaper only. From March 2, 2009, through January 17, 2010, newsstand and home-delivery prices in certain counties outside the greater Washington area were $0.75 daily and $2.00 on Sunday. As of January 18, 2010, prices in these counties are the same as those in areas outside the primary circulation area.
With the final issue date of December 21/28, 2009, WP Company ceased publication of The Washington Post National Weekly Edition, a tabloid that contained selected articles and features from The Washington Post edited for a national audience. The National Weekly Edition had a basic subscription price of $78.00 per year and was delivered by second-class mail to approximately 11,348 subscribers.
The Post’s subscriber loyalty program, PostPoints, has approximately 173,000 members. The program allows readers to earn points, exchangeable for rewards, through a variety of activities centered on interacting with The Washington Post in print and online, shopping at participating advertisers and helping the community.
The Post closed its printing plant located in Prince George’s County, MD, in July 2009. Printing operations have been consolidated in the Fairfax County, VA, printing plant.
In January 2010, the Post’s print and online operations were integrated. As a result, WP Company now publishes washingtonpost.com, an Internet site that currently features much of the full editorial text of The Washington Post and most of the Post’s classified advertising, as well as original content, blogs written by Post reporters and others, interactive discussions hosted by Post reporters and outside subject experts, user-generated comments and content obtained from other sources.
As measured by WP Company, this site averaged more than 250 million page views per month and had an average of 23.9 million unique visitors per month during 2009. Washingtonpost.com also features extensive information about activities, groups and businesses in the Washington, DC, area, including arts and entertainment and news focusing on politics and on technology businesses and related policy issues. This site has developed a substantial audience of users who are outside the Washington, DC, area, and WP Company believes, based on analytical data, that approximately 87% of the unique users who access the site each month are in that category. WP Company provides online advertisers with a wide range of options, including to advertise on selected pages or page combinations or to specific geographic areas and demographic groups. WP Company also provides content on websites specially formatted to be downloaded and displayed on web-enabled cell phones and other personal digital devices.
WP Company has about 548 full-time editors, reporters and photographers on its staff, of which 77 were formerly part of the online operations. WP Company draws upon the news reporting facilities of the major wire services, maintains a network of correspondents and contract writers in international news centers and maintains reporters in nine local news bureaus.
The Los Angeles Times-Washington Post News Service disbanded at the end of 2009. On January 1, 2010, WP Company and Bloomberg News launched The Washington Post News Service with Bloomberg News, which offers a selection of content from the Post and Bloomberg News stories to newspapers and other subscribers daily.
WP Company owns an interest in Classified Ventures, a newspaper industry company that offers online classified advertising databases for cars and apartment rentals. Washingtonpost.com provides links to the Classified Ventures’
2009 FORM 10-K 13
Table of Contents
national car and apartment rental websites (cars.com and apartments.com). In addition, washingtonpost.com launched Trulia real estate search functionality in April 2009. Trulia enables readers to search real estate listings online using self-selected search criteria.
WP Company shares select news material and promotional resources with NBC News and MSNBC, and washingtonpost.com is being provided with access to certain MSNBC.com multimedia content. The parties are currently renegotiating the terms of this cross-promotional arrangement, which dates back to 2000.
The Slate Group
The Slate Group publishes Slate, an online magazine, and several additional websites. Slate features articles analyzing news, politics and contemporary culture and adds new material on a daily basis. Content is supplied by the magazine’s own editorial staff, as well as by independent contributors. The Slate Group also publishes The Root, an online magazine focused on issues of importance to African Americans and others interested in black culture, offering daily news and provocative commentary on politics and culture; The Big Money, an online magazine launched in September 2008 featuring articles and commentary on business news; and Foreign Policy, a bimonthly print magazine and website that features articles analyzing current events, business and policy news from around the world. In addition, Foreign Policy hosts a small number of foreign policy conferences every year.
Express Publications
Express Publications Company, LLC (“Express Publications”), another subsidiary of the Company, publishes Express, a weekday tabloid newspaper, which is distributed free of charge using hawkers and news boxes near Metro stations and in other locations in Washington, DC, and nearby suburbs with heavy daytime sidewalk traffic. A typical edition of Express is 48 to 60 pages and contains short news, entertainment and sports stories, as well as both classified and display advertising. Current daily circulation is approximately 184,300 copies. Express relies primarily on wire service and syndicated content and is edited by a full-time newsroom staff of 23. Advertising sales, production and certain other services for Express are provided by WP Company. The Express newsroom also produces a website, ExpressNightOut.com, which features entertainment and lifestyle coverage of local interest.
Post–Newsweek Media
The Company’s Post–Newsweek Media, Inc. subsidiary publishes two weekly paid-circulation, three twice-weekly paid-circulation and 26 controlled-circulation weekly community newspapers. This subsidiary’s newspapers are divided into three groups: The Gazette Newspapers, which circulate in Montgomery, Prince George’s and Frederick counties and in parts of Carroll County, MD; and Southern Maryland Newspapers, which circulate in southern Prince George’s County and in Charles, St. Mary’s and Calvert counties, MD; and the Fairfax County Times, which circulates in Fairfax County, VA. During 2009, these newspapers had a combined average circulation of approximately 835,000 copies. This division also produces military newspapers (most of which are weekly) under agreements where editorial material is supplied by local military bases, with the exception of one independent newspaper. In 2009, the 12 military newspapers produced by this division had a combined average circulation of more than 125,000 copies.
The Gazette Newspapers have a companion website (Gazette.net) that includes editorial material and classified advertising from the print newspapers. The military newspapers produced by this division are supported by a website (DCMilitary.com) that includes base guides and other features, as well as articles from the print newspapers. The Southern Maryland Newspapers‘ website (SoMdNews.com) also includes editorial and classified advertising from the print newspapers. The Fairfax County Times website (FairFaxtimes.com) also includes editorials and classified advertising from the print newspapers. Each website also contains display advertising that is sold specifically for the site.
The Gazette Newspapers, Southern Maryland Newspapers and the Fairfax County Times together employ approximately 170 editors, reporters and photographers.
This division also operates a commercial printing business in suburban Maryland.
The Herald
The Company owns The Daily Herald Company, publisher of The Herald in Everett, WA, about 30 miles north of Seattle. The Herald is published mornings seven days a week and is primarily distributed by home delivery in Snohomish County and online at Heraldnet.com. The Daily Herald Company also provides commercial printing services and publishes The Enterprise, a weekly community newspaper home delivered in south Snohomish County. The Daily Herald Company also publishes La Raza del Noroeste, a weekly Spanish-language newspaper that is distributed free of charge in more
14 THE WASHINGTON POST COMPANY
Table of Contents
than 780 retail locations in Snohomish, King, Skagit and northern Pierce counties, and the Snohomish County Business Journal, a monthly publication focused on Snohomish County business news .
The Herald’s average paid circulation as reported to ABC for the 12 months ending March 31, 2009, was 46,665 daily (Monday through Friday); 46,414 (Monday through Saturday) and 50,322 Sunday. The aggregate average weekly circulation of The Enterprise Newspapers during the 12-month period ending March 31, 2009, was 70,928 copies as reported by Verified Audit Circulation. The circulation of La Raza del Noroeste during the three-month period ended March 31, 2009, was 21,783 copies, as reported by Verified Audit Circulation. The monthly circulation of the Snohomish County Business Journal is approximately 14,100 copies.
The Herald, The Enterprise, La Raza and the Snohomish County Business Journal together employ approximately 80 editors, reporters and photographers.
Greater Washington Publishing
The Company’s Greater Washington Publishing, Inc. subsidiary publishes several free-circulation advertising periodicals that have little or no editorial content and are distributed in the greater Washington, DC, metropolitan area using sidewalk distribution boxes. Greater Washington Publishing’s periodicals of that kind are Apartment Showcase, which is published monthly and has an average circulation of about 46,000 copies; New Homes Guide, which is published six times a year and has an average circulation of about 51,000 copies; and Guide to Retirement Living Sourcebook, which is published nine times a year and has an average circulation of about 35,000 copies. Greater Washington Publishing, Inc. ceased publication of Washington Spaces Magazine in 2009, with the November/December Early Winter 2009 issue as its final issue.
El Tiempo Latino
El Tiempo Latino LLC publishes El Tiempo Latino, a weekly Spanish-language newspaper that is distributed free of charge in northern Virginia, suburban Maryland and Washington, DC, using sidewalk news boxes and retail locations that provide space for distribution. El Tiempo Latino provides a mix of local, national and international news together with sports and community-events coverage and has a current circulation of approximately 50,000 copies. Employees of the newspaper handle advertising sales as well as prepress production, and content is provided by a combination of wire service copy, contributions from freelance writers and photographers and stories produced by the newspaper’s own editorial staff.
Post–Newsweek Stations, Inc. (“PNS”), a subsidiary of the Company, owns six television stations located in Houston, TX; Detroit, MI; Miami, FL; Orlando, FL; San Antonio, TX; and Jacksonville, FL. The following table sets forth certain information with respect to each of the Company’s television stations:
| Station Location and Year Commercial Operation Commenced |
National Market Ranking (a) |
Primary Affiliation |
Expiration Date of FCC License |
Expiration Date of Network Agreement |
Total Commercial Stations in DMA (b) | ||||||
| KPRC Houston, TX, 1949 |
10th | NBC | Aug. 1, 2014 | Dec. 31, 2016 |
|
14 | |||||
| WDIV Detroit, MI, 1947 |
11th | NBC | Oct. 1, 2013 | Dec. 31, 2016 |
|
8 | |||||
| WPLG Miami, FL, 1961 |
16th | ABC | Feb. 1, 2013 | Dec. 31, 2009 |
(c) |
13 | |||||
| WKMG Orlando, FL, 1954 |
17th | CBS | Feb. 1, 2013 | Apr. 6, 2015 |
|
13 | |||||
| KSAT San Antonio, TX, 1957 |
37th | ABC | Aug. 1, 2014 | Dec. 31, 2009 |
(c) |
10 | |||||
| WJXT Jacksonville, FL, 1947 |
47th | None | Feb. 1, 2013 | — | 7 |
| (a) | Source: 2009/2010 DMA Market Rankings, Nielsen Media Research, fall 2009, based on television homes in DMA (see note (b) below). |
| (b) | Designated Market Area (“DMA”) is a market designation of A.C. Nielsen that defines each television market exclusive of another, based on measured viewing patterns. References to stations that are operating in each market are to stations that are broadcasting analog signals. However, most of the stations in these markets are also engaged in digital broadcasting using the FCC-assigned channels for DTV operations. |
| (c) | WPLG and KSAT continue to carry ABC Television Network programming pursuant to an extension of their affiliation agreement, which had been scheduled to expire on December 31, 2009. The Company presently is negotiating a longer-term affiliation agreement for these stations with the ABC Television Network. |
2009 FORM 10-K 15
Table of Contents
Revenue from broadcasting operations is derived primarily from the sale of advertising time to local, regional and national advertisers. In 2009, advertising revenue accounted for 90% of the total for PNS’s operations. Advertising revenue is sensitive to a number of factors, some specific to a particular station or market and others more general in nature. Some examples include a station’s audience share and market ranking; seasonal fluctuations in demand for air time; annual or biannual events, such as sporting events and political elections; and broader economic trends. The recent economic crisis put downward pressure on advertising revenue as businesses cut their advertising budgets. Most notably, the automobile industry, historically a large buyer of television advertising, contracted dramatically in recent years and reduced overall advertising spending accordingly. PNS’s revenue in 2009 reflects the effects of this contraction.
Regulation of Broadcasting and Related Matters
PNS’s television broadcasting operations are subject to the jurisdiction of the FCC under the Communications Act. The FCC, among other things, assigns frequency bands for broadcast and other uses; manages broadcast licensing; regulates equipment used by stations; and adopts and implements regulations and policies that directly or indirectly affect the ownership, operations and profitability of broadcasting stations.
Each PNS television station holds an FCC license that is renewable upon application for an eight-year period.
Digital Television (“DTV”) and Spectrum Issues. During 2009, in conjunction with the nationwide digital television transition, each PNS station discontinued analog broadcasts and currently broadcasts only in digital format. The digital broadcast format used by television stations allows transmission of high-definition television (“HDTV”) programming, multiple channels of standard-definition television programming (“multicasting”), and subscription video and data services known as “ancillary and supplementary” services. PNS, along with other broadcasting companies, has been actively pursuing the use of digital spectrum to provide mobile video service to consumers, in partnership with consumer electronics manufacturers and other partners.
Television stations may receive interference from a variety of sources, including interference from other broadcast stations that is below a threshold established by the FCC. That interference could limit viewers’ ability to receive television stations’ signals. The amount of interference to stations may increase in the future because of the FCC’s decision to allow electronic devices known as “white space” devices to operate in the television frequency band on an unlicensed basis. That decision is on appeal.
As a part of an effort to develop a national broadband plan, the FCC and Congress have begun to consider reallocation of spectrum for use by wireless broadband providers. Although no specific proposals have been announced, any reallocation that involves television spectrum could materially affect PNS’s operations.
Carriage of Local Broadcast Signals. The Communications Act and the FCC rules allow a commercial television broadcast station, under certain circumstances, to insist on mandatory carriage of its signal on cable systems serving the station’s market area (“must carry”). For stations that elect must carry, only a single stream of video (that is, a single channel of programming), rather than a television broadcast station’s entire signal, is eligible for mandatory carriage by a cable system operator. Thus, a television station currently can obtain carriage of one or more digital multicast streams only through retransmission consent agreements.
Alternatively, stations may elect, at three-year intervals, to forego must-carry rights and allow their signals to be carried only pursuant to a “retransmission consent” agreement. Stations that elect retransmission consent may negotiate for compensation from cable systems in exchange for the right to carry their signals in the form of such things as mandatory advertising purchases by the system operator, station promotional announcements on the system and cash payments to the station. Each of PNS’s television stations is being carried on all of the major cable systems in each station’s respective local market pursuant to retransmission consent agreements.
Commercial television stations also may elect either mandatory carriage or retransmission consent with respect to the carriage of their signals on direct broadcast satellite (“DBS”) systems that choose to provide “local-into-local” service (i.e., to distribute the signals of local television stations to viewers in the local market area). In 2008, the FCC ruled that if a DBS operator carries the signal of any television station in a market in HDTV, it will be required to carry all other local stations in HDTV (rather than in a lower-resolution format). Recognizing the capacity and technological constraints faced by DBS operators, the FCC established a four-year phase-in period, starting in 2009, during which DBS systems must progressively transition their local-into-local markets into compliance with this “HD carry-one, carry-all” requirement.
As with cable, stations make DBS carriage elections at three-year intervals. The signal of each of the Company’s television stations is being carried by EchoStar and DirecTV (the two nationwide DBS operators in the United States, operating the Dish Network and DirecTV systems, respectively) on a local-into-local basis pursuant to retransmission consent agreements.
16 THE WASHINGTON POST COMPANY
Table of Contents
On or prior to October 1, 2008, the Company elected retransmission consent status for its stations with respect to major cable operators and the two DBS operators. These elections apply to the three-year period from January 1, 2009 through December 31, 2011, and the Company has negotiated retransmission consent agreements with the major cable and DBS operators serving each of its stations’ markets.
Ownership Limits. The FCC’s rules limit the number and type of media outlets in which a single person or entity may have an attributable interest. Among other restrictions, the FCC’s local television multiple ownership rule generally permits one company to own two television stations in the same market only if there are at least eight independently owned full-power television stations in that market (including noncommercial stations and counting co-owned stations as one), and if at least one of the commonly-owned stations is not among the top-four-ranked television stations in that market. In addition, the FCC restricts so-called “cross-ownership” of newspapers and broadcast stations within a market. The Communications Act requires the FCC to review its ownership rules periodically and to repeal or modify any rule that it determines is no longer in the public interest.
In its 2008 ownership rules review order, the FCC liberalized its daily newspaper/broadcast cross-ownership rule to presumptively allow newspaper/broadcast combinations in the 20 largest markets, subject to several fairly rigorous economic hardship and public interest criteria. It also declined to modify its other ownership rules, including the local television multiple ownership rule. A number of media companies and public interest groups have challenged the FCC’s modification of the daily newspaper/broadcast cross-ownership rule and its retention of the other ownership rules. These challenges are pending judicial review. Several public interest groups also have asked the FCC to reconsider its 2008 ownership rules review order; this request is also pending.
By law, a single person or entity may have an attributable interest in an unlimited number of television stations nationwide, as long as the aggregate audience reach of such stations does not exceed 39% of nationwide television households, and as long as the interest complies with the FCC’s other ownership restrictions.
Programming. Five of PNS’s six stations are affiliated with one or more of the national television networks, which provide a substantial amount of programming to their television station affiliates. PNS’s Jacksonville station, WJXT, has operated as an independent station since 2002. In addition, each of the Company’s stations receives programming from syndicators and other third-party programming providers. PNS’s performance depends, in part, on the quality and availability of third-party programming, and any substantial decline in the quality or availability of this programming could materially affect PNS’s operations.
Public Interest Obligations. To satisfy FCC requirements, stations generally are expected to air a specified number of hours of programming intended to serve the educational and informational needs of children and to complete reports on a quarterly basis concerning the children’s programming that they broadcast. In addition, the FCC requires stations to limit the amount of advertising that appears during certain children’s programs. This past year, the FCC began to consider changes to its children’s programming rules in light of technological developments and changes in the video marketplace, and Congress last year held a hearing on the same subject. No specific changes to the children’s programming requirements have yet been adopted.
The FCC has considered imposing public interest programming requirements like those that apply to children’s programming to broadcast television programming more broadly. In November 2007, the FCC adopted new “enhanced disclosure” obligations for broadcasters that would require, among other things, reporting on public interest programming and online posting for stations’ public files. However, these obligations are subject to administrative and judicial review and therefore have not gone into effect.
In a separate “localism” proceeding, the FCC received comments on whether to adopt additional proposals, including license renewal guidelines that would establish minimum amounts of locally-oriented programming, require broadcasters to establish permanent community advisory boards and require stations to locate their main studios in their communities of license. The localism proceeding is pending at the FCC.
It is not possible to predict what, if any, effect adoption of the proposed new obligations would have on PNS’s operations, but a substantial increase in programming obligations could adversely affect PNS.
Political Advertising. The FCC regulates the sale of advertising by PNS’s stations to candidates for public office and imposes other restrictions on the broadcast of political announcements more generally. The application of these regulations may limit the advertising revenues of PNS’s television stations during the periods preceding elections.
Broadcast Indecency. The FCC’s policies prohibit the broadcast of indecent and profane material during certain hours of the day, and the FCC regularly imposes monetary forfeitures when it determines that a television station violated that policy. Court challenges concerning the validity of the FCC’s indecency policy are ongoing, and many broadcasters have argued, among other things, that the FCC has failed to justify its indecency decisions adequately, that the FCC’s
2009 FORM 10-K 17
Table of Contents
policy is too subjective to guide broadcasters’ programming decisions and that its enforcement approach otherwise violates the First Amendment.
The U.S. Supreme Court issued a decision during 2009 in which it reversed a decision by the U.S. Court of Appeals for the Second Circuit. The Second Circuit decision had held that the FCC violated its procedural obligations when it found that certain television stations’ broadcast of so-called “fleeting expletives” was indecent. Neither court ruled on whether the FCC’s indecency policy was constitutional, however, and that question now is pending before the Second Circuit.
It is not generally the FCC’s policy to notify licensees when it receives indecency complaints regarding their broadcasts before it issues a formal Letter of Inquiry or takes other enforcement action. As a result, the FCC may have received complaints of which PNS is not aware alleging that one or more of its stations broadcast indecent material. PNS was notified on January 25, 2008, that the FCC had proposed a monetary forfeiture against station KSAT, along with 51 other television stations, in connection with the station’s broadcast of an allegedly indecent scene in an episode of the drama “NYPD Blue.” KSAT, along with the other affected ABC affiliates, has appealed the FCC’s decision. The case is pending before the U.S. Court of Appeals for the Second Circuit.
Sponsorship Identification. During 2006 and 2007, a media watchdog group filed a series of complaints at the FCC alleging that various broadcast stations and cable channels had violated the FCC’s sponsorship identification rules by broadcasting material provided to them by a third party without disclosing the source of the material. The FCC issued Letters of Inquiry to three PNS stations that had been named in the complaints. Specifically, WJXT was named in the first complaint, along with 76 other broadcast stations, and WKMG and WPLG were named in the second complaint, along with 44 other stations. The FCC has not proposed any enforcement action against these stations.
In September 2007, however, the FCC released two decisions involving news telecasts by a cable operator identified in the same set of complaints. In these decisions, the FCC purported to expand the scope of its sponsorship identification rules in the context of news broadcasts. These decisions do not directly affect PNS, but they are relevant because the FCC typically uses similar standards to evaluate alleged sponsorship identification violations by broadcast stations and cable operators. The FCC’s investigations concerning the three PNS stations are pending. It is not possible to predict what further actions, if any, the FCC may take in response to the complaints.
The FCC is conducting proceedings concerning various matters in addition to those described in this section. The outcome of these FCC proceedings and other matters described in this section could adversely affect the profitability of PNS’s television broadcasting operations.
Newsweek, Inc.
Newsweek, Inc. (“Newsweek”) publishes Newsweek, a weekly global forward-looking news and ideas magazine and its digital platform, Newsweek.com. Newsweek is published domestically and internationally. The domestic edition of Newsweek includes more than 100 different geographic or demographic editions that carry substantially identical news and feature material, but enable advertisers to direct messages to specific market areas or demographic groups. Newsweek is sold through subscription mail order sales derived from a number of sources, principally direct-mail promotion, as well as online and on newsstands. Newsweek‘s published advertising rates are based on its average weekly circulation rate base and are competitive with those of the other publications in its category. Newsweek reaffirmed its plans to reduce its domestic rate base to 1,500,000 copies in the first quarter of 2010, reflecting a shift in focus to a different demographic that is closer to its core base of loyal subscribers. This demographic consists of a group of subscribers who are highly educated, who have demonstrated a high level of interest in news and ideas and who have higher incomes. This will change Newsweek’s competitive set, making it the largest premium news and ideas magazine, aligned more closely with The Economist, New York magazine, New Yorker, Wired, BusinessWeek and The Atlantic. In 2009, Newsweek, Inc. increased the subscription price of Newsweek and its national advertising rates to reflect a more valuable subscriber base.
Internationally, Newsweek is published in English in a Europe, Middle East and Africa edition; an Asia edition covering Japan, Korea and south Asia; and a Latin America edition. Editorial copy solely of domestic interest is eliminated in the international editions and is replaced by other international, business or national coverage primarily of interest abroad. Newsweek estimates that the combined average weekly paid circulation for these English-language international editions of Newsweek in 2009 was approximately 460,000 copies.
Newsweek has agreements with publishers in a number of foreign countries to produce and distribute local-language editions of Newsweek abroad. Currently, Newsweek is published in Japanese, Korean, Spanish, Arabic, Polish, Russian and Turkish. In addition to containing selected stories translated from Newsweek‘s various U.S. and foreign editions, each
18 THE WASHINGTON POST COMPANY
Table of Contents
of these magazines includes editorial content created by a staff of local reporters and editors. Newsweek estimates that the combined average weekly paid circulation of the various foreign-language international editions of Newsweek was approximately 561,000 copies in 2009.
The online version of Newsweek includes material from Newsweek‘s print edition, as well as original content. Newsweek assumed responsibility for producing Newsweek.com from WashingtonpostNewsweek Interactive Company, LLC (“WPNI”) effective January 1, 2009. Newsweek.com maintains a content-sharing, co-branding and traffic relationship with MSNBC.com that has evolved from a contractual relationship that was established in 2000.
Arthur Frommer’s Budget Travel magazine, another Newsweek publication, was published ten times during 2009 and had an average paid circulation of more than 675,000 copies. Newsweek sold its Budget Travel operations, including all assets and liabilities formerly reported as Newsweek Budget Travel, effective December 31, 2009.
Avenue100 Media Solutions Inc.
Avenue100 Media Solutions Inc. (“Avenue100”), formerly known as CourseAdvisor, Inc. is a digital marketing company headquartered in Woburn, MA that sources leads for academic institutions and recruiting organizations. Avenue100 operates as an independent subsidiary of the Company.
Bowater Mersey Paper Company
The Company owns 49% of the common stock of Bowater Mersey Paper Company Limited (“Bowater Mersey”), the majority interest in which is held by a subsidiary of AbitibiBowater, Inc. Bowater Mersey is engaged in the manufacture and sale of newsprint and lumber, as well as the production of electricity in Nova Scotia, Canada.
The Washington Post and El Tiempo Latino are produced at the printing plant of WP Company in Fairfax County, VA. The Herald, The Enterprise Newspapers, the SCBJ and La Raza del Noroeste are produced at The Daily Herald Company’s plant in Everett, WA, while The Gazette Newspapers, Southern Maryland Newspapers, Express (since March 30, 2009) and the Fairfax County Times are printed at the commercial printing facilities owned by Post–Newsweek Media, Inc. Ten military papers, three free weeklies and one paid weekly from Southern Maryland are printed at Chesapeake Publishing in Easton, MD. Greater Washington Publishing’s periodicals are produced by independent contract printers. The Post closed its printing plant located in College Park, MD, in July of 2009.
In 2009, The Washington Post, Express and El Tiempo Latino consumed about 105,000 tons* of newsprint in WP Company’s printing plants in Prince George’s County, MD and Fairfax County, VA. Printing of Express was transferred to Post–Newsweek Media, Inc. in March 2009 and consumed an additional 3,778 tons. Such newsprint was purchased from a number of suppliers, including AbitibiBowater, Inc., which supplied approximately 33% of the 2009 newsprint requirements for these newspapers.
The price of newsprint has historically been volatile. The RISI East Coast Newsprint Price Index, which provides monthly single-price estimates based on marketplace surveys of both buyers and sellers, for 30-lb. newsprint (the kind of newsprint used by The Washington Post and most of the newspapers published by Post–Newsweek Media, Inc.), began 2009 at $694 per short ton, declined to $395 by August and rebounded to $481 by year-end. From December 2009 through January 2010, The Washington Post transitioned from 30-lb. newsprint to 27.7-lb newsprint. (Because of quantity discounts and other factors, the RISI index prices do not necessarily correspond with the prices actually paid for newsprint by the Company’s subsidiaries.) The Company believes that adequate supplies of newsprint are available to The Washington Post and the other newspapers published by the Company’s subsidiaries through contracts with various suppliers. More than 90% of the newsprint consumed by WP Company’s printing plant includes recycled content. The Company owns 80% of the stock of Capitol Fiber Inc., which handles and sells to recycling industries old newspapers, paper and other recyclable materials collected in Washington, DC, Maryland and northern Virginia.
Newsweek‘s domestic edition is produced by two independent contract printers at four separate plants in the United States; advertising inserts and photo-offset films for the domestic edition are also produced by independent contractors. The international editions of Newsweek are printed in England, Singapore, the Netherlands, South Africa and Hong Kong. Since 1997, Newsweek and a subsidiary of Time Warner have used a jointly owned company based in England to provide and procure production and distribution services for the Europe, Middle East and Africa edition of Newsweek and the Europe edition of Time. In 2002, this jointly owned company began providing certain production and distribution services for the Asia editions of these magazines.
2009 FORM 10-K 19
Table of Contents
The domestic edition of Newsweek consumed about 17,000 tons of paper in 2009, the bulk of which was purchased from four major suppliers. The current cost of body paper (the principal paper component of the magazine) is approximately $1,000 per ton.
In 2009, the operations of The Daily Herald Company and Post–Newsweek Media, Inc. consumed approximately 4,648 and 8,740 tons* of newsprint, respectively, which were obtained in each case from various suppliers. Approximately 40% of the newsprint used by The Daily Herald Company and 68% of the newsprint used by Post–Newsweek Media, Inc. includes recycled content.
More than 90% of the aggregate domestic circulation of Newsweek is delivered by periodical (formerly second-class) mail, and most subscriptions for such publications are solicited by either first-class or standard (formerly third-class) mail. Thus, substantial increases in postal rates for these classes of mail could have a significant negative impact on the operating income of these business units. Postal rates have increased in each of the past four years. Future postal rate increases generally will be limited to increases in the Consumer Price Index. Effective May 2009, there were rate increases of 4.8% for first-class, 3.9% for standard and 4.0% for periodical mail, which increased Newsweek’s 2009 postal costs (January through April) by about $0.3 million.
Kaplan’s businesses operate in fragmented and competitive markets. Kaplan Higher Education competes with both facilities-based and other distance-learning providers of similar educational services, including not-for-profit colleges and universities and for-profit businesses. Kaplan Test Preparation division’s test preparation and tutoring business competes with a variety of regional and national test preparation businesses, with individual tutors and with in-school preparation for standardized tests. Kaplan Test Preparation division’s professional and licensure business competes in each of its professional lines with other companies that provide alternative or similar professional training, test preparation and consulting services. Overseas, each of Kaplan’s businesses competes with other for-profit companies and, in certain instances, with governmentally supported schools and institutions that provide similar training and educational programs.
Cable television systems operate in a highly competitive environment. In addition to competing with over-the-air reception, cable television systems face competition from various other forms of video program delivery systems, including DBS services, telephone companies and the Internet. Certain of the Company’s cable television systems have also been partially or substantially overbuilt, using conventional cable system technology by various small to mid-sized independent telephone companies, which typically offer cable modem and telephone service, as well as basic cable service. Even without constructing their own cable plant, local telephone companies compete with cable television systems in the delivery of high-speed Internet access by providing DSL service. In addition, some telephone companies have entered into strategic partnerships with DBS operators that permit the telephone company to package the video programming services of the DBS operator with the telephone company’s own DSL service, thereby competing with the video programming and cable modem services being offered by existing cable television systems. Satellite-delivered broadband and high-powered WiMAX services will increasingly provide competition to Cable ONE. Finally, video programming is becoming increasingly available on the Internet, where viewers can watch programming for free, as well as access pay-per-view offerings. Cable ONE distinguishes itself from its competition by providing excellent local customer service and consistently attaining very high levels of customer satisfaction.
The Washington Post competes in the Washington, DC, metropolitan area with The Washington Times, a newspaper that has published weekday editions since 1982. The Post also encounters competition for advertising revenue and audience in varying degrees from other newspapers and specialized publications distributed in the Post’s circulation area (including newspapers published in suburban and outlying areas and nationally circulated newspapers), and from websites, television, radio, magazines and other advertising media, including direct-mail advertising. Express similarly competes with various other advertising media in its service area, including both daily and weekly free-distribution newspapers.
Washingtonpost.com, Newsweek.com and the websites produced by The Slate Group face competition from many Internet sites that provide news and information, sites that cover niche content, sites that aggregate content and sites where users generate content. The Company’s websites compete for advertising revenue with these types of websites, as well as with a wide variety of other print publications and online services, plus other forms of advertising. Display advertising is a key source of revenue for Company websites. With advertising inventory continuing to increase and advertising networks becoming more prevalent, the display advertising marketplace is experiencing some pricing
| * | All references in this report to newsprint tonnage and prices refer to short tons (2,000 pounds) and not to metric tons (2,204.6 pounds), which are often used in newsprint quotations. |
20 THE WASHINGTON POST COMPANY
Table of Contents
pressures, and our websites are not immune to this trend. Washingtonpost.com also relies on classified advertising as a key revenue source. Classified advertising has become a crowded field online, with a number of national and local competitors, often with a vertical focus. For example, Carmax.com and Autobytel.com aggregate national car listings; Redfin.com and move.com aggregate national real estate listings; Monster.com, Hotjobs! (which was recently acquired by Monster) and CareerBuilder.com aggregate employment listings. All of these vertical-niche sites can be searched locally. Finally, several services challenge established business models. Some nationally managed sites, such as Yelp and OpenTable, also offer local information and services. Major search engines have also entered local markets. For example, Google and Yahoo! have launched local services that offer directory information for local markets with enhanced functionality, such as mapping and links to reviews and other information. In addition, other forms of digital distribution, such as smartphones and e-readers, are also competitive with Company news sites.
The Herald circulates principally in Snohomish County, WA; its chief competitor is the Seattle Times, a daily newspaper published in Seattle whose Snohomish County circulation is principally in the southwestern portion of the county. The Enterprise Newspapers is distributed in south Snohomish County, where the principal competitors are the Seattle Times and The Journal Newspapers, a group of monthly controlled-circulation newspapers. Numerous other newspapers and shoppers are distributed in The Herald‘s and The Enterprise’s principal circulation areas. La Raza del Noroeste‘s principal competitors in its circulation territory are the Spanish-language newspapers El Mundo and Tu decides, both weekly publications delivering in eastern and western Washington territories, and with significantly lower circulation than La Raza in the Puget Sound region. The chief competitor for the Snohomish County Business Journal is the Puget Sound Business Journal.
The circulation of The Gazette Newspapers is limited to Montgomery, Prince George’s and Frederick counties and parts of Carroll County, MD. The Gazette Newspapers compete with many other advertising vehicles available in their service areas, including The Potomac and Bethesda/Chevy Chase Almanacs, The Western Montgomery Bulletin, The Bowie Blade-News, The West County News and The Laurel Leader, weekly controlled-circulation community newspapers; The Montgomery Sentinel, a weekly paid-circulation community newspaper; The Prince George’s Sentinel, a weekly controlled-circulation community newspaper, which also has a weekly paid-circulation edition; and The Frederick News– Post and Carroll County Times, daily paid-circulation community newspapers. The Southern Maryland Newspapers circulate in southern Prince George’s County and in Charles, Calvert and St. Mary’s counties, MD, where they also compete with many other advertising vehicles available in their service areas, including the Calvert County Independent and St. Mary’s Today, weekly paid-circulation community newspapers; the County Times, a free weekly; and The Pennysaver, a shopper. The Fairfax County Times circulates in Fairfax County, VA, where it also competes with many other advertising vehicles available in the service area, including Herndon–Reston Observer, Connections, Sun Gazette, Chronicles and Examiner, which are all community newspapers. It also competes with the following shoppers: Merchandiser, Buyer’s Guide and Val Pak.
The Examiner, a free newspaper containing national and international as well as local news, is being published six days a week in northern Virginia, suburban Maryland and Washington, DC. The Examiner’s home edition is delivered to targeted ZIP codes on Thursdays and Sundays. A street edition is distributed Monday through Friday within the Washington, DC, metropolitan area. The Examiner competes in varying degrees with The Gazette Newspapers, Express and The Washington Post.
The advertising periodicals published by Greater Washington Publishing compete with many other forms of advertising available in their distribution area, as well as with various other free-circulation advertising periodicals.
El Tiempo Latino competes with other Spanish-language advertising media available in the Washington, DC, area, including several other Spanish-language newspapers.
PNS competes for audiences and advertising revenues with television and radio stations, cable television systems and video services offered by telephone companies serving the same or nearby areas; with direct broadcast satellite services; and, to a lesser degree, with other media, such as newspapers and magazines. Cable television systems operate in substantially all of the areas served by the Company’s television stations, where they compete for television viewers by importing out-of-market television signals; by distributing pay-cable, advertiser-supported and other programming that is originated for cable systems; and by offering movies and other programming on a pay-per-view basis. In addition, DBS services provide nationwide distribution of television programming, including pay-per-view programming and programming packages unique to DBS, using digital transmission technologies. The Company’s television stations may also become subject to increased competition from low-power television stations, wireless cable services and satellite master antenna systems, which can carry pay-cable and similar program material. In addition, major TV networks offer some of their programming on their Internet sites free of charge.
2009 FORM 10-K 21
Table of Contents
Avenue100 competes with businesses that provide lead generation products or services into the educational services markets and ones that develop web properties and interactive marketing programs to optimize yield in the recruiting field. The largest lead generation competitors include Quinstreet, EducationDynamics and CollegeBound.
The magazine industry is highly competitive, both within itself and with other advertising media, including Internet-based media, that compete for audience and advertising revenue.
The executive officers of the Company, each of whom is elected annually by the Board of Directors, are as follows:
Donald E. Graham, age 64, has been Chairman of the Board of the Company since September 1993 and Chief Executive Officer of the Company since May 1991. Mr. Graham served as President of the Company from May 1991 until September 1993 and prior to that had been a Vice President of the Company for more than five years. Mr. Graham also served as Publisher of The Washington Post from 1979 until September 2000 and as Chairman of the Post from September 2000 to February 2008.
Veronica Dillon, age 60, became Senior Vice President in June 2008 and the Vice President, General Counsel and Secretary of the Company in January 2007. Ms. Dillon began her career with the Company in February 1991 as corporate counsel at Kaplan, Inc. She was subsequently named General Counsel at Kaplan in June 1995 and then served as Kaplan’s Chief Administrative Officer beginning in December 2003.
Boisfeuillet Jones, Jr., age 63, became Vice Chairman of the Company and Chairman of The Washington Post in February 2008. Mr. Jones joined The Washington Post in 1980 as Vice President and counsel. In 1995, he became President and General Manager and was named Associate Publisher in January 2000. In September 2000, he succeeded Donald Graham as Publisher and Chief Executive Officer of The Washington Post.
Hal S. Jones, age 57, became Senior Vice President–Finance of the Company in November 2008 and Chief Financial Officer in January 2009. He had most recently been Chief Executive Officer of Kaplan Professional, responsible for Kaplan’s professional businesses in financial services, real estate, technology and engineering in the United States and the United Kingdom. Mr. Jones has spent 20 years at The Washington Post Company and Kaplan, serving in a variety of senior management positions with a focus on finance, auditing and accounting.
Ann L. McDaniel, age 54, became Senior Vice President–Human Resources of the Company in June 2008 and was formerly Vice President–Human Resources since September 2001. She also serves as Managing Director of Newsweek, Inc., a position she assumed in January 2008. Ms. McDaniel had previously served as Senior Director of Human Resources of the Company since January 2001 and before that held various editorial positions at Newsweek.
Gerald M. Rosberg, age 63, became Senior Vice President–Planning and Development of the Company in June 2008 and was formerly Vice President–Planning and Development since February 1999. He had previously served as Vice President–Affiliates at The Washington Post, a position he assumed in November 1997. Mr. Rosberg joined the Company in January 1996 as the Post‘s Director of Affiliate Relations.
Wallace R. Cooney, age 47, became Vice President–Finance and Chief Accounting Officer of the Company in June 2008. Mr. Cooney joined the Company in 2001 as Controller and prior to that had been with Gannett Co., Inc. and Price Waterhouse LLP.
The Company and its subsidiaries employ approximately 21,500 persons on a full-time basis.
Worldwide, Kaplan employs approximately 15,000 persons on a full-time basis. Kaplan also employs substantial numbers of part-time employees who serve in instructional and administrative capacities. During peak seasonal periods, Kaplan’s part-time workforce exceeds 19,000 employees. In Canada, 39 Kaplan employees are represented by a union.
Cable ONE has approximately 2,341 full-time employees, none of whom is represented by a union.
WP Company has approximately 2,058 full-time employees. About 1,137 of that unit’s full-time employees and about 308 part-time employees are represented by one or another of five unions. Collective bargaining agreements are currently in effect with locals of the following unions covering the full-time and part-time employees and expiring on the dates indicated: 945 editorial, newsroom and commercial department employees represented by the Communications Workers of America (June 7, 2011); 29 machinists represented by the International Association of Machinists (January 10, 2011); 16 photoengravers-platemakers represented by the Graphic Communications Conference of the
22 THE WASHINGTON POST COMPANY
Table of Contents
International Brotherhood of Teamsters (February 6, 2012); 32 paper handlers and general workers represented by the Graphic Communications Conference of the International Brotherhood of Teamsters (November 16, 2011); and 17 electricians represented by the International Brotherhood of Electrical Workers (March 12, 2012). The agreement covering 383 mailroom workers represented by the Communications Workers of America expired on May 18, 2003; the parties reached a Comprehensive Tentative Agreement that was subject to ratification on December 16, 2009. On January 10, 2010, the unit failed to ratify the Comprehensive Tentative Agreement. The agreement covering 23 engineers, carpenters and painters represented by the International Union of Operating Engineers expired on April 12, 2008; negotiations have yet to produce a successor agreement. In April and May 2009, WP Company announced that Voluntary Retirement Incentive Programs would be offered to some employees of The Washington Post newspaper. The programs resulted in 221 employees retiring from positions across the newspaper.
Of the approximately 228 full-time and 85 part-time employees at The Daily Herald Company, about 54 full-time and 24 part-time employees are represented by one or another of three unions. The newspaper’s collective bargaining agreement with the Graphic Communications Conference of the International Brotherhood of Teamsters, which represents press operators, expires on March 15, 2011; its agreement with The Newspaper Guild—Communications Workers of America, which represents printers and mailers, expires on October 31, 2010; and its agreement with the International Brotherhood of Teamsters, which represents bundle haulers, expires on September 22, 2010.
The Company’s broadcasting operations have approximately 875 full-time employees, of whom about 180 are union-represented. Of the eight collective bargaining agreements covering union-represented employees, four have expired and are being renegotiated. Two collective bargaining agreements will expire in 2010.
Newsweek, Inc. has approximately 427 full-time employees as of December 31, 2009, including 74 editorial employees represented by the Communications Workers of America under a collective bargaining agreement that expires on January 1, 2013.
Post–Newsweek Media, Inc. has approximately 405 full-time and 183 part-time employees. Robinson Terminal Warehouse Corporation (the Company’s newsprint warehousing and distribution subsidiary), Greater Washington Publishing, Inc., Express Publications Company, LLC and El Tiempo Latino LLC each employs fewer than 100 persons. None of these units’ employees is represented by a union.
All public statements made by the Company and its representatives that are not statements of historical fact, including certain statements in this Annual Report on Form 10-K and elsewhere in the Company’s 2009 Annual Report to Stockholders, are “forward-looking statements” within the meaning of the Private Securities Litigation Reform Act of 1995. Forward-looking statements include comments about the Company’s business strategies and objectives, the prospects for growth in the Company’s various business operations and the Company’s future financial performance. As with any projection or forecast, forward-looking statements are subject to various risks and uncertainties, including the risks and uncertainties described in Item 1A of this Annual Report on Form 10-K, that could cause actual results or events to differ materially from those anticipated in such statements. Accordingly, undue reliance should not be placed on any forward-looking statement made by or on behalf of the Company. The Company assumes no obligation to update any forward- looking statement after the date on which such statement is made, even if new information subsequently becomes available.
The Company’s Internet address is washpostco.com. The Company makes available free of charge through its website its Annual Report on Form 10-K, quarterly reports on Form 10-Q, current reports on Form 8-K and amendments to those reports filed or furnished pursuant to Section 13(a) or 15(d) of the Exchange Act as soon as reasonably practicable after such documents are electronically filed with the Securities and Exchange Commission. In addition, the Company’s Certificate of Incorporation, its Corporate Governance Guidelines, the Charters of the Audit and Compensation Committees of the Company’s Board of Directors and the codes of conduct adopted by the Company and referred to in Item 10 of this Annual Report on Form 10-K are each available on the Company’s website; printed copies of such documents may be obtained by any stockholder upon written request to the Secretary of the Company at 1150 15th Street, NW, Washington, DC 20071.
The Company faces a number of significant risks and uncertainties in connection with its operations. The most significant of these are described below. These risks and uncertainties may not be the only ones facing the Company. Additional
2009 FORM 10-K 23
Table of Contents
risks and uncertainties not presently known, or currently deemed immaterial, may adversely affect the Company in the future. In addition to the other information included in this Annual Report on Form 10-K, investors should carefully consider the following risk factors. If any of the events or developments described below occurs, it could have a material adverse effect on the Company’s business, financial condition or results of operations.
| • | Failure to Comply with Statutory and Regulatory Requirements Could Result in Loss of Access to U.S. Federal Student Loans and Grants Under Title IV, a Requirement to Pay Fines or Monetary Liabilities or Other Sanctions |
To maintain Title IV eligibility, each group of schools combined into an OPEID unit must comply with the extensive statutory and regulatory requirements of the Federal Higher Education Act relating to its financial aid management, educational programs, financial strength, facilities, recruiting practices and various other matters. Failure to comply with these requirements could result in the loss or limitation on the eligibility of one or more of the schools in Kaplan Higher Education to participate in Title IV programs, a requirement to pay fines or to repay Title IV program funds, a denial or refusal by the Department of Education to consider a school’s application for renewal of its certification to participate in the Title IV programs, civil or criminal penalties or other sanctions. No assurance can be given that the Kaplan schools currently participating in Title IV programs will maintain their Title IV eligibility, accreditation and state authorization in the future or that the Department of Education might not successfully assert that one or more of such schools have previously failed to comply with Title IV requirements. The loss of Title IV eligibility by either (a) the single OPEID unit that includes Kaplan University or (b) a combination of two or more other OPEID units would have a materially adverse effect on Kaplan’s operating results.
| • | Program Reviews, Audits, Investigations and Other Reviews of Kaplan Higher Education Schools Could Result in Findings of Failure to Comply with Statutory and Regulatory Requirements |
The Kaplan Higher Education division schools are subject to program reviews, audits, investigations and other compliance reviews conducted by various regulatory agencies and auditors, including, among others, the Department of Education, the Department of Education’s Office of Inspector General, accrediting bodies and state and various other agencies, as well as annual audits by an independent certified public accountant of each OPEID unit’s compliance with Title IV statutory and regulatory requirements. These compliance reviews can result in findings of noncompliance with statutory and regulatory requirements that can, in turn, result in proceedings to impose fines, liabilities, civil or criminal penalties or other sanctions against the school, including loss or limitation of its eligibility to participate in Title IV programs. Certain Kaplan Higher Education division schools are the subject of ongoing compliance reviews and lawsuits related to their compliance with statutory and regulatory requirements and may be subject to future compliance reviews. The Kaplan Higher Education division schools also may be subject to complaints and lawsuits by present or former students or employees or other persons related to school compliance with statutory and regulatory requirements, that, if successful, could result in requirements to pay monetary liabilities or fines or result in other sanctions.
| • | Reductions in the Amount of Funds Available to Students, Including Under the Federal Title IV Programs, in Kaplan’s Higher Education Schools, Changes in the Terms on Which Such Funds Are Made Available or Loss or Limitation of Eligibility to Receive Such Funds |
During the Company’s 2009 fiscal year, funds provided under the student financial aid programs created under Title IV accounted for approximately $1,283 million of the net revenues of the schools in Kaplan Higher Education. Any legislative, regulatory or other development that has the effect of materially reducing the amount of Title IV financial assistance or other funds available to the students of those schools would have a significant adverse effect on Kaplan’s operating results. In addition, any development that has the effect of making the terms on which Title IV financial assistance or other funds are available to students of those schools materially less attractive could have an adverse effect on Kaplan’s operating results.
| • | Changes in U.S. Department of Education Regulations Could Lead to New Operational Risks and Requirements |
On September 9, 2009, the Department of Education established negotiated rulemaking committees to help prepare proposed regulations that would amend or add to existing Title IV regulations. In late January 2010, the negotiated rulemaking committee failed to reach consensus on proposed regulations. As a result of this lack of consensus, the Department of Education is not bound by the proposed regulations presented to the committee and may therefore publish proposed regulations for public comment that may differ from those presented to the committee. The proposed regulations are expected to address areas including, but not limited to, revised standards governing the payment of incentive compensation to admissions and financial aid advisors; a new definition of “gainful employment” that may take into account student tuition and debt levels or other factors to determine whether educational programs prepare students for “gainful employment” in a recognized occupation and thereby qualify as Title IV eligible educational programs, and other changes to Title IV eligibility requirements for institutions, programs and students. The changes ultimately proposed to the Title IV regulations could adversely affect, among other things, Kaplan’s ability to retain admissions and financial aid
24 THE WASHINGTON POST COMPANY
Table of Contents
advisors and the ability of Kaplan Higher Education division’s programs and students to qualify for Title IV financial assistance, could require the schools to change their tuition or educational programs in order to comply with new “gainful employment requirements,” and could otherwise have a material adverse effect on Kaplan’s operating results. The Department of Education has stated its intent to publish any new final regulations developed through this process by November 1, 2010, which is the deadline for the regulations to take effect by July 1, 2011.
| • | Student Loan Defaults Could Result in Loss of Eligibility to Participate in Title IV Programs |
A Kaplan Higher Education OPEID unit would lose its eligibility to participate in certain Title IV programs if the default rate of its students on the repayment of Title IV loans exceeds specified default rates, referred to as “cohort default rates.” The Department of Education calculates a cohort default rate for each of Kaplan Higher Education’s OPEID reporting units. Any OPEID unit that has a cohort default rate in excess of 40% for any single year may lose its eligibility to participate in the Federal Family Education Loan (“FFEL”) and Direct Loan programs for at least two fiscal years. Any OPEID unit that has a cohort default rate equal to or in excess of 25% for three consecutive years may lose its Title IV eligibility to participate in FFEL, Direct Loan and Federal Pell Grant programs for at least two fiscal years. The loss of Title IV eligibility by either (a) the single OPEID unit that includes Kaplan University or (b) a combination of two or more other OPEID units would have a materially adverse effect on Kaplan’s operating results.
| • | Loss of Eligibility to Participate in Title IV Programs if Title IV Revenues Exceed Federally-Set Percentage |
A Kaplan Higher Education OPEID unit would lose its eligibility to participate in the Title IV programs for a period of at least two fiscal years if it derives more than 90% of its receipts from the Title IV programs for two consecutive fiscal years, commencing with the unit’s first fiscal year that ends after August 14, 2008. Any OPEID reporting unit with receipts from the Title IV programs exceeding 90% for a single fiscal year ending after August 14, 2008 would be placed on provisional certification and may be subject to other enforcement measures. The loss of Title IV eligibility by either (a) the single OPEID unit that includes Kaplan University or (b) a combination of two or more other OPEID units would have a materially adverse effect on Kaplan’s operating results.
| • | Failure to Maintain Institutional Accreditation Could Lead to Loss of Ability to Participate in Title IV Programs |
Kaplan Higher Education’s online university and all of its ground campuses are institutionally accredited by one or another of a number of national and regional accreditors recognized by the U.S. Department of Education. Accreditation by an accrediting agency recognized by the U.S. Department of Education is required for an institution to become and remain eligible to participate in Title IV programs. The loss of accreditation would, among other things, render the affected Kaplan schools and programs ineligible to participate in Title IV programs and would have a material adverse effect on its business.
| • | Failure to Maintain State Authorizations Could Cause Loss of Ability to Operate and to Participate in Title IV Programs in Some States |
Kaplan Higher Education ground campuses and online university are authorized to operate and to grant degrees, certificates or diplomas by the applicable state agency of each state where such authorization is required. Such state authorization is required for each campus located in the state or, in the case of states that require it, for Kaplan University online to offer postsecondary education. Each school must be licensed or otherwise authorized to offer its educational programs by the appropriate governmental body in the state in which the school is physically located in order to be eligible to participate in Title IV programs. The loss of such authorization would preclude the campuses or online university from offering postsecondary education and render students ineligible to participate in Title IV programs. Loss of authorization at those state campus locations, or, in states that require it, for Kaplan University online, could have a material adverse effect on Kaplan Higher Education’s business.
| • | Failure to Correctly Calculate or Timely Return Title IV Funds for Students Who Withdraw Prior to Completing Programs Could Result in a Requirement to Post a Letter of Credit or Other Sanctions |
Department of Education regulations require schools participating in Title IV programs to calculate correctly and return on a timely basis unearned Title IV funds disbursed to students who withdraw from a program of study prior to completion. These funds must be returned in a timely manner, generally within 45 days of the date the school determines that the student has withdrawn. Under Department of Education regulations, failure to make timely returns of Title IV program funds for 5% or more of students sampled in a school’s annual compliance audit in either of its two most recently completed fiscal years could result in a requirement that the school to post a letter of credit in an amount equal to 25% of its prior year returns of Title IV program funds. If unearned funds are not properly calculated and returned in a timely manner, an institution is also subject to monetary liabilities, fines, or other sanctions. Six of the Kaplan Higher Education reporting units currently have letters of credit outstanding to the Department of Education as a result of this requirement, with a collective total face value of approximately $3.3
2009 FORM 10-K 25
Table of Contents
million. The requirement to post additional letters of credit or the imposition of other sanctions by the Department of Education would increase Kaplan’s regulatory compliance costs and could have a materially adverse effect on its results of operations.
| • | Failure to Demonstrate “Financial Responsibility” Could Result in a Requirement to Submit Letters of Credit to the U.S. Department of Education, Loss of Eligibility to Participate in Title IV Programs, or Other Sanctions |
An institution participating in the Title IV programs must comply with certain measures of financial responsibility under the Federal Higher Education Act and under Department of Education regulations. Among other things, the applicable regulations require an institution to achieve a composite score of at least 1.5 as calculated under Department of Education regulations based on data in annual financial statements submitted to the Department of Education. If an institution fails to achieve a composite score of 1.5, or fails to comply with other financial responsibility standards, the Department of Education may place conditions on the institution’s participation in the Title IV programs and may require the institution to submit to the Department of Education a letter of credit in an amount of at least 10% to 50% of the institution’s annual Title IV participation for its most recent fiscal year. The Department of Education has measured the compliance of Kaplan’s Higher Education division’s schools based on the composite score of the division. If one or more of the institutions in Kaplan’s Higher Education division fails to meet the composite score standard, or any of the other financial responsibility standards, those institutions may be required to post a letter of credit in favor of the Department of Education and possibly may be subject to other sanctions, including limitation or termination of its participation in Title IV programs. A requirement to post a letter of credit or the imposition of any one or more other sanctions by the Department of Education could have a material adverse effect on Kaplan’s results of operations.
| • | Failure to Demonstrate “Administrative Capability” Could Result in Loss of Eligibility to Participate in Title IV Programs or Other Sanctions |
Department of Education regulations specify extensive criteria an institution must satisfy to establish that it has the required “administrative capability” to participate in Title IV programs. These criteria include, but are not limited to, requirements relating to the institution’s compliance with all applicable Title IV requirements, the institution’s administration of Title IV programs, the institution’s compliance with certain reporting, disclosure, and record keeping obligations, and maintaining cohort default rates below prescribed thresholds. Failure to comply with these criteria could result in the loss or limitation of the eligibility of one or more of the schools in Kaplan’s Higher Education division to participate in the Title IV programs, a requirement to pay fines or to repay Title IV program funds, a denial or refusal by the Department of Education to consider a school’s application for renewal of its certification to participate in the Title IV programs, civil or criminal penalties, or other sanctions. Any one or more of these actions by the Department of Education could have a material adverse effect on Kaplan’s results of operations.
| • | Changes in the Extent to Which Standardized Tests Are Used in the Admissions Process by Colleges or Graduate Schools |
A substantial portion of Kaplan’s operating income is generated by Kaplan Text Preparation. The source of this income is fees charged for courses that prepare students for a broad range of admissions examinations that are required for admission to colleges and graduate schools. Historically, colleges and graduate schools have required standardized tests as part of the admissions process. There has been some movement away from this historical reliance on standardized admissions tests among a small number of colleges that have adopted “test-optional” admissions policies. Any significant reduction in the use of standardized tests in the college or graduate school admissions process could have an adverse effect on Kaplan’s operating results.
| • | Changes in the Extent to Which Licensing and Proficiency Examinations Are Used to Qualify Individuals to Pursue Certain Careers |
A substantial portion of Kaplan Test Preparation’s and Kaplan International’s revenue comes from preparing individuals for licensing or technical proficiency examinations in various fields. Any significant relaxation or elimination of licensing or technical proficiency requirements in those fields served by Kaplan Test Preparation’s and Kaplan International’s businesses could negatively impact Kaplan’s operating results.
| • | Failure to Successfully Assimilate Acquired Businesses |
The Company’s Kaplan subsidiary has historically been an active acquirer of businesses that provide educational services. Consistent with this historical trend, during 2009 Kaplan completed two acquisitions. Acquisitions involve various inherent risks and uncertainties, including difficulties in efficiently integrating the service offerings, accounting and other administrative systems of an acquired business; the challenges of assimilating and retaining key personnel; the consequences of diverting the attention of senior management from existing operations; the possibility that an acquired
26 THE WASHINGTON POST COMPANY
Table of Contents
business does not meet or exceed the financial projections that supported the purchase price; and the possible failure of the due diligence process to identify significant business risks or undisclosed liabilities associated with the acquired business. A failure to effectively manage growth and integrate acquired businesses could have a material adverse effect on Kaplan’s operating results.
| • | Difficulties of Managing Foreign Operations |
Kaplan has operations and investments in a growing number of foreign countries, including Canada, Mexico, the U.K., Ireland, France, Israel, Australia, New Zealand, Singapore, India and China. Operating in foreign countries presents a number of inherent risks, including the difficulties of complying with unfamiliar laws and regulations, effectively managing and staffing foreign operations, successfully navigating local customs and practices, preparing for potential political and economic instability and adapting to currency exchange rate fluctuations. The failure to effectively manage these risks could have a material adverse effect on Kaplan’s operating results.
| • | Changes in International Regulatory and Physical Environments Could Negatively Affect International Student Enrollments |
A substantial portion of Kaplan International’s revenue comes from programs that prepare international students to study and travel to English-speaking countries, principally the U.S., the U.K., Australia, and Singapore. Any significant changes to the regulatory environment, or a natural disaster or pandemic, in either the students’ counties of origin or the countries to which they desire to travel or study, could negatively affect Kaplan’s ability to attract and retain such students, which could negatively impact Kaplan’s operating results.
| • | Negative Impact of Recent Financial Market Crisis and Economic Downturn, Particularly in the Specific Geographic Markets Served by the Company’s Publishing and Television Broadcasting Businesses |
A significant portion of the Company’s revenues in its publishing and broadcasting businesses comes from advertising. The demand for advertising is sensitive to the overall level of economic activity, both nationally and locally. The financial market crisis and economic downturn has reduced advertising expenditures of many of our advertisers, which has had a negative impact on the operating results of the Company’s newspaper and magazine publishing and television broadcasting businesses. A continued decline in general economic conditions in the United States may have a material adverse effect on the operating results of the Company’s businesses.
| • | Changing Preferences of Readers or Viewers Away From Traditional Media Outlets |
The rates that the Company’s print publishing and television broadcasting businesses can charge for advertising are directly related to the number of readers and viewers of its publications and broadcasts. There is tremendous competition for readers and viewers from other media. The Company’s publishing and television broadcasting businesses will be adversely affected to the extent that individuals decide to obtain news, entertainment, classified listings and local shopping information from Internet-based or other media to the exclusion of the Company’s print publications and broadcasts.
| • | Changing Perceptions About the Effectiveness of Publishing and Television Broadcasting in Delivering Advertising |
Historically, newspaper and magazine publishing and television broadcasting have been viewed as cost-effective methods of delivering various forms of advertising. There can be no guarantee that this historical perception will guide future decisions on the part of advertisers. To the extent that advertisers shift advertising expenditures to other media outlets, the profitability of the Company’s publishing and television broadcasting businesses will suffer.
| • | Increased Competition Resulting From Technological Innovations in News, Information and Video Programming Distribution Systems |
The development of direct broadcast satellite systems has significantly increased the competition faced by the Company’s cable television systems. In addition, the continuing growth and technological expansion of Internet-based services has increased competitive pressure on the Company’s media businesses. The development and deployment of new technologies has the potential to negatively and dramatically affect the Company’s businesses in ways that cannot now be reliably predicted and that may have a material adverse effect on the Company’s operating results.
| • | Changes in the Nature and Extent of Government Regulations in the Case of Television Broadcasting, Cable Television and VoIP Services |
The Company’s television broadcasting and cable television businesses operate in highly regulated environments. The Company’s VoIP services business also is subject to a growing degree of regulation. Complying with applicable regulations has significantly increased, and may continue to increase, the costs and reduced the revenues of these
2009 FORM 10-K 27
Table of Contents
businesses. Changes in regulations have the potential to further negatively impact those businesses, not only by increasing compliance costs and reducing revenues through restrictions on certain types of advertising, limitations on pricing flexibility or other means, but also by possibly creating more favorable regulatory environments for the providers of competing services. More generally, all of the Company’s businesses could have their profitability or their competitive positions adversely affected by significant changes in applicable regulations.
| • | Potential Liability for Patent Infringement in the Cable Industry |
Providers of services similar to those offered by Cable ONE have been the target of patent infringement claims from time to time relating to such matters as cable system architecture, electronic program guides, cable modem technology and VoIP services. Although we cannot predict the impact at this time, if any such claims are successful, the outcome would likely affect Cable ONE and could have a material adverse effect on its operating results.
| • | Changes in the Cost or Availability of Raw Materials, Particularly Newsprint |
The Company’s newspaper publishing businesses collectively spend significant amounts each year on newsprint. Increases in the cost of newsprint or significant disruptions in the supply of newsprint could have a material adverse effect on the operating results of the Company’s newspaper publishing businesses.
Item 1B. Unresolved Staff Comments.
Not applicable.
Directly or through subsidiaries, Kaplan owns a total of 11 properties: a 30,000-square-foot six-story building located at 131 West 56th Street in New York City, which serves as an educational center primarily for international students; a redeveloped 47,410-square-foot four-story brick building in Lincoln, NE, which is used by Kaplan University; a 4,000-square-foot office condominium in Chapel Hill, NC, which it utilizes for its Test Prep business; a 15,000-square-foot three- story building in Berkeley, CA, used for its Test Prep and English-language businesses; a 25,000-square-foot one-story building in Omaha, NE, and an 18,000-square-foot building in Dayton, OH, which are currently vacant; a 131,000-square-foot five-story brick building in Manchester, NH, used by Hesser College; a 25,000-square-foot building in Hammond, IN, used by Kaplan Career College (formerly Sawyer College); a 45,000-square-foot three-story brick building in Houston, TX, used by the Texas School of Business; and a 34,000-square-foot building in London, U.K., and a 2,200-square-foot building in Oxfordshire, U.K., each of which is used by Holborn College. Kaplan, Inc. and Kaplan University maintain corporate offices, together with a data center, call center and employee-training facilities, in two 97,000-square-foot leased buildings located on adjacent lots in Fort Lauderdale, FL. Both of those leases will expire in 2017. In December 2009, Kaplan Higher Education entered into an agreement to lease 76,515 square feet of corporate office space to house its corporate headquarters in Chicago, IL. This lease will expire in 2022. In December 2008, Kaplan University entered into an agreement to lease a two-story, 124,500-square-foot building in Orlando, FL, to house an additional call center. In June 2009, Kaplan, Inc. and Kaplan Higher Education began sharing corporate office space in a 78,000-square-foot office building in Alpharetta, GA, under a lease that expires in 2019. In October 2009, Kaplan University entered into an agreement to lease 88,845 square feet of corporate office space in Plantation, FL. This lease expires in 2021 and includes an option to lease an additional 29,898 square feet. Kaplan’s distribution facilities for most of its domestic publications are located in a 291,000-square-foot warehouse in Aurora, IL, under a lease expiring in 2017. Kaplan, Inc. maintains corporate offices at 888 7th Avenue in New York City, where Kaplan rents space on three floors under a lease that will expire in 2017. Overseas, DBS’s facilities in Dublin, Ireland, are located in nine buildings aggregating approximately 79,000 square feet of space that have been rented under leases expiring between 2010 and 2029. Kaplan Publishing has an office and distribution warehouse in Wokingham, Berkshire, U.K., of 25,000 square feet, under a lease expiring in 2016. Kaplan Financial’s largest leaseholds are office and instructional space in London of 33,000 square feet (which will expire in 2033), 21,000 square feet (which will expire in 2015) and 28,000 square feet (comprising six separate leases, which will expire in 2015); office and instructional space in Birmingham of 23,500 square feet (comprising two separate leases, which will expire in 2017); office and instructional space in Manchester of 26,000 square feet (comprising of five separate leases, which will expire in 2027); and office and instructional space in Wales of 34,000 square feet (on an open-ended lease with termination on 12 months’ notice). Kidum has 19 locations throughout Israel, all of which are occupied under leases expiring between 2010 and 2015. All other Kaplan facilities in the U.S. and overseas (including administrative offices and instructional locations) occupy leased premises.
28 THE WASHINGTON POST COMPANY
Table of Contents
The headquarters offices of Cable ONE are located in a three-story office building in Phoenix, AZ, that was purchased by Cable ONE in 1998. Cable ONE purchased an adjoining two-story office building in 2005; that building is currently leased to third-party tenants. The majority of the offices and head-end facilities of the division’s individual cable systems are located in buildings owned by Cable ONE. Most of the tower sites used by the division are leased. In addition, the division houses call-center operations in 60,000 square feet of rented space in Phoenix under a lease that will expire in 2013.
WP Company owns the principal offices of The Washington Post in downtown Washington, DC, including both a seven-story building in use since 1950 and a connected nine-story office building on contiguous property completed in 1972 in which the Company’s principal executive offices are located. WP Company also owns and occupies a small office building on L Street that is connected to the Post‘s office building. Additionally, WP Company owns land on the corner of 15th and L Streets, NW, in Washington, DC, adjacent to the Post‘s office building. This land is leased on a long-term basis to the owner of a multistory office building that was constructed on the site in 1982. WP Company rents one floor in this building, which it has subleased to a third party.
WP Company owns a printing plant in Fairfax County, VA, which was built in 1980 and expanded in 1998. That facility is located on 19 acres of land owned by WP Company. In July 2009, WP Company closed a printing plant and distribution facility in Prince George’s County, MD, that was built in 1998 on a 17-acre tract of land owned by WP Company. This property was sold in 2010.
The Daily Herald Company owns its plant and office building in Everett, WA; it also owns two warehouses and a small rental building adjacent to its plant, as well as a small office building in Lynnwood, WA.
Post–Newsweek Media, Inc. owns a two-story combination office building and printing plant on a seven-acre plot in Laurel, MD. Post–Newsweek Media, Inc. also owns a one-story brick building in St. Mary’s County used by editorial and sales staff and office space in Montgomery and Charles counties, MD. In addition to these owned properties, Post–Newsweek Media leases editorial and sales office space in Alexandria, VA, and in Frederick, Carroll, Calvert and Prince George’s counties, MD, and Fairfax County, VA.
The headquarters offices of the Company’s broadcasting operations are located in Detroit, MI, in the same facilities that house the offices and studios of WDIV. That facility and those that house the operations of each of the Company’s other television stations are all owned by subsidiaries of the Company, as are the related tower sites (except in Houston, Orlando, Jacksonville and Miami, where the tower sites are 50% owned).
The principal offices of Newsweek, Inc. are located at 395 Hudson Street in New York City, where Newsweek rents space on two floors. The lease on this new space, subject to renewal rights, will expire on April 30, 2024. During the second half of 2009, Newsweek implemented a restructuring plan that resulted in the recognition of lease exit costs associated with the closing of certain domestic and international offices and bureaus, as well as the write-off of fixed assets located at the facilities that have been vacated.
Robinson Terminal Warehouse Corporation owns two wharves and several warehouses in Alexandria, VA. These facilities are adjacent to the business district and occupy approximately seven acres of land. Robinson also owns two partially developed tracts of land in Fairfax County, VA, aggregating about 20 acres. These tracts are near The Washington Post‘s Virginia printing plant and include several warehouses. Robinson also owns 23 acres of undeveloped land on the Potomac River in Charles County, MD.
WPNI leases 85,000 square feet of office space in Arlington, VA, under a lease that will expire in 2015. WP Company is marketing the space for sublease because the employees have been relocated following the integration of Washington Post Digital’s business into WP Company in Washington, DC. In addition, WPNI leases space in Washington, DC, and Los Angeles and subleases space from Newsweek in New York City for Slate’s offices in those cities. WP Company leases office space for sales representatives in Los Angeles and Detroit and subleases space from Newsweek, Inc. for sales representatives in New York City, Chicago and San Francisco. In January of 2008, WP Company entered into a two-year sublease for office space in Washington, DC, to house Foreign Policy magazine.
Greater Washington Publishing’s offices are located in leased space in Vienna, VA, while El Tiempo Latino’s offices are located in leased space in Arlington, VA.
Avenue100 leases space in an office building in Woburn, MA. This lease expires in 2015.
2009 FORM 10-K 29
Table of Contents
Kaplan, Inc., a subsidiary of the Company, is a party to a previously disclosed class action antitrust lawsuit filed on April 29, 2005, by purchasers of BAR/BRI bar review courses from fall 1997 through July 2006 in the U.S. District Court for the Central District of California. On February 2, 2007, the parties filed a settlement agreement with the court, together with documents setting forth a procedure for class notice. The court approved the terms of the settlement on July 9, 2007. Certain class members filed an appeal to the case to the U.S. Court of Appeals for the Ninth Circuit. On April 23, 2009, the Ninth Circuit affirmed the approval of the settlement. The Ninth Circuit also vacated the district court’s award of attorney’s fees to class counsel and counsel to various objectors to the settlement and remanded to the U.S. District Court to consider the attorney’s fees issue anew. That issue continues to be litigated; however, the attorney’s fees award will be paid from the escrowed settlement funds, so Kaplan should not be affected by the ultimate determination of the attorney’s fees issue. Effectiveness of the settlement is subject to court approval. On February 6, 2008, Kaplan was served with another purported class action lawsuit in the U.S. District Court for the Central District of California alleging claims substantially similar to those alleged in the previously settled lawsuit but on behalf of a putative class that included all persons who purchased a bar review course from BAR/BRI in the United States after the July 2006 cut-off for class membership in the prior action. West Publishing Corporation, which owns BAR/BRI, is a co-defendant. On April 15, 2008, the court granted defendants’ motion to dismiss. On May 20, 2008, the plaintiffs filed an appeal. The appeal is pending in the U.S. Court of Appeals for the Ninth Circuit. On November 20, 2009, Kaplan entered into a stipulation of settlement with the plaintiffs that would resolve the case as to Kaplan on a class-wide basis. The stipulation of settlement requires court approval to become effective. On April 29, 2009, Kaplan was served with a purported class action lawsuit by a purchaser of Kaplan’s LSAT preparation course, alleging that in 1997, BAR/BRI and Kaplan entered into a market allocation agreement in violation of U.S. antitrust laws. Kaplan has moved to dismiss this complaint and will continue to vigorously defend this lawsuit.
On June 17, 2008, teachers at Kaplan Aspect, which is now operated within Kaplan International Colleges, filed a complaint in California Superior Court in San Francisco against Kaplan, Inc. and Aspect Education, Inc. alleging wage and hour violations on behalf of a putative class of California teachers. In January 2009, the parties reached an agreement to settle the claims in the action, as well as similar claims for a class of Kaplan Aspect teachers in states outside California. On January 21, 2010, the parties received preliminary approval of that settlement in the California Superior Court and will seek approval of the non-California claims in a separate action that has not yet been filed.
In 2007, the Company became aware of several state attorneys general who have opened inquiries or investigations into arrangements between lenders and institutions of higher education. Subsidiaries of the Company received requests for information from the Attorneys General of the states of Arizona, Iowa and Maryland regarding relationships with student loan providers. The Company also became aware of similar requests from members of the U.S. Congress to at least one lender with regard to its relationship with the Company and its subsidiaries, as well as other institutions of higher education. The Company believes that these governmental authorities are conducting wide-ranging inquiries of student lending practices generally, which, among other things, led to new legislation and other regulatory proposals and changes in 2008. The Company believes that it was not the sole recipient of this type of information request. The Company’s subsidiaries responded to these information requests and cooperated fully with these inquiries. The Company’s subsidiaries received no further requests for such information during 2009.
On or about January 17, 2008, an Assistant U.S. Attorney in the Civil Division of the U.S. Attorney’s Office for the Eastern District of Pennsylvania contacted Kaplan Higher Education’s CHI-Broomall campus and made inquiries about the Surgical Technology program, including the program’s eligibility for Title IV federal financial aid, the program’s student loan defaults, licensing and accreditation. The inquiry is presently proceeding on an “informal, voluntary basis.” Kaplan responded to the information requests and is fully cooperating with the inquiry. The U.S. Department of Education is also conducting a Program Review at the CHI-Broomall campus. CHI-Broomall and Kaplan have responded to a preliminary report issued by the Department of Education, are responding to a February 12, 2010 request by the Department of Education for additional information and are fully cooperating with its Program Review. The U.S. Attorney’s Office has informed Kaplan Higher Education that it may make further information requests upon the completion of the Department of Education Program Review.
Several Kaplan subsidiaries are also subject to four complaints that include, among other allegations, claims under the federal False Claims Act (31U.S.C. § 3729, et seq.), relating to eligibility for Title IV funding. The U.S. Government declined to intervene in all four cases, which are captioned:
United States of America ex rel. Carlos Urquilla-Diaz, et al. v. Kaplan University et al. (unsealed March 25, 2008); United States of America ex rel. Jorge Torres v. Kaplan Higher Education Corp. (unsealed April 7, 2008); United States of America ex rel. Victoria Gatsiopoulos et al. v. ICM School of Business & Medical Careers et al. (unsealed September 2, 2008); and United States of America ex rel. Charles Jajdelski v. Kaplan Higher Education Corp. et al. (unsealed January 6, 2009).
30 THE WASHINGTON POST COMPANY
Table of Contents
The Diaz, Torres and Gatsiopoulos cases have been transferred to the U.S. District Court for the Southern District of Florida, where motions to dismiss have been filed in each case and await decision by the court. The Jajdelski case is pending in the U.S. District Court for the District of Nevada, where a motion to dismiss also has been filed and awaits decision by the court. The Company will continue to vigorously defend each of these actions.
The Company and its subsidiaries are also subject to administrative proceedings and are defendants in various other civil lawsuits that have arisen in the ordinary course of their businesses, including contract disputes, actions alleging libel, invasion of privacy, patent infringement, violations of applicable wage and hour laws and claims involving current and former students and employees. While it is not possible to predict the outcomes of these lawsuits, in the opinion of management, their ultimate dispositions should not have a material adverse effect on the Company’s business or financial condition.
Item 5. Market for the Registrant’s Common Equity, Related Stockholder Matters and Issuer Purchases of Equity Securities.
Market Information and Holders
The Company’s Class B Common Stock is traded on the New York Stock Exchange under the symbol “WPO.” The Company’s Class A Common Stock is not publicly traded.
The high and low sales prices of the Company’s Class B Common Stock during the last two years were:
| 2009 | 2008 | |||||||||||
| Quarter |
High | Low | High | Low | ||||||||
| January–March |
$ | 433 | $ | 300 | $ | 823 | $ | 636 | ||||
| April–June |
430 | 326 | 713 | 552 | ||||||||
| July–September |
495 | 340 | 667 | 529 | ||||||||
| October–December |
484 | 404 | 557 | 320 | ||||||||
At January 31, 2010, there were 28 holders of record of the Company’s Class A Common Stock and 756 holders of record of the Company’s Class B Common Stock.
Dividend Information
Both classes of the Company’s Common Stock participate equally as to dividends. Quarterly dividends were paid at the rate of $2.15 per share during 2009 and 2008.
Securities Authorized for Issuance Under Equity Compensation Plans
The following table and the footnote thereto set forth certain information as of January 3, 2010, concerning compensation plans of the Company under which equity securities of the Company are authorized to be issued.
| Number of Securities to Be Issued Upon Exercise of Outstanding Options, Warrants and Rights |
Weighted-Average Exercise Price of Outstanding Options, Warrants and Rights |
Number of Securities Remaining Available for Future Issuance Under Equity Compensation Plans (Excluding Securities Reflected in Column (a)) | |||||
| Plan Category | (a) | (b) | (c) | ||||
| Equity compensation plans approved by security holders |
90,569 | $ | 525.44 | 271,956 | |||
| Equity compensation plans not approved by security holders |
— | — | — | ||||
| Total |
90,569 | $ | 525.44 | 271,956 | |||
This table does not include information relating to restricted stock grants awarded under The Washington Post Company Incentive Compensation Plan, which plan has been approved by the stockholders of the Company. At January 3, 2010, there were 9,565 shares of restricted stock outstanding under the 2007–2010 Award Cycle and 27,025 shares of restricted stock outstanding under the 2009 – 2012 Award Cycle that had been awarded to employees of the Company and its subsidiaries under that Plan. In addition, the Company has from time to time awarded special discretionary grants of restricted stock to employees of the Company and its subsidiaries. At January 3, 2010, there were a total of 29,430 shares of restricted stock outstanding under special discretionary grants approved by the Compensation Committee of the Board of Directors. At January 3, 2010, a total of 85,375 shares of restricted stock were available for future awards.
2009 FORM 10-K 31
Table of Contents
Purchases of Equity Securities by the Issuer and Affiliated Purchasers
During the quarter ended January 3, 2010, the Company purchased shares of its Class B Common Stock as set forth in the following table:
| Period | Total Number of Shares Purchased |
Average Price Paid per Share |
Total Number of Shares Purchased as Part of Publicly Announced Plan* |
Maximum Number of Shares That May Yet Be Purchased Under the Plan* | |||||
| Sept. 28–Nov. 1, 2009 |
0 | — | 0 | 242,597 | |||||
| Nov. 2–Nov. 29, 2009 |
0 | — | 0 | 242,597 | |||||
| Nov. 30–Jan. 3, 2010 |
141,681 | $ | 420.56 | 141,681 | 100,916 | ||||
| Total |
141,681 | $ | 420.56 | 141,681 | |||||
| * | On September 22, 2003, the Company’s Board of Directors authorized the Company to purchase, on the open market or otherwise, up to 542,800 shares of its Class B Common Stock, and the existence of that authorization was disclosed in the Company’s Annual Report on Form 10-K for the fiscal year ended December 28, 2003. There is no expiration date for that authorization. All purchases made during the quarter ended January 3, 2010, were open-market transactions. In January 2010, the Board of Directors increased the authorization to a total of 750,000 shares of Class B common stock. |
Performance Graph
The following graph is a comparison of the yearly percentage change in the Company’s cumulative total shareholder return with the cumulative total return of the Standard & Poor’s 500 Stock Index, the Standard & Poor’s Publishing Index and a custom peer group index comprised of education companies. The Standard & Poor’s 500 Stock Index is comprised of 500 U.S. companies in the industrial, transportation, utilities and financial industries and is weighted by market capitalization. The Standard & Poor’s Publishing Index is comprised of Gannett Co., Inc., The McGraw-Hill Companies, The Meredith Corporation, The New York Times Company and The Washington Post Company and also is weighted by market capitalization. The custom peer group of education companies includes American Public Education, Apollo Group Inc., Capella Education Co., Career Education Corp., Corinthian Colleges, Inc., DeVry Inc., Education Management Corp., ITT Educational Services Inc. and Strayer Education Inc. The Company is using a custom peer index of education companies because the Company is a diversified education and media company. Its largest and fastest growing business is Kaplan, Inc., a leading global provider of educational services to individuals, schools and businesses. The graph reflects the investment of $100 on December 31, 2004, in the Company’s Class B Common Stock, the Standard & Poor’s 500 Stock Index, the Standard & Poor’s Publishing Index and the custom peer group index of education companies. For purposes of this graph, it has been assumed that dividends were reinvested on the date paid in the case of the Company and on a quarterly basis in the case of the Standard & Poor’s 500 Index, the Standard & Poor’s Publishing Index and the custom peer group index of education companies.
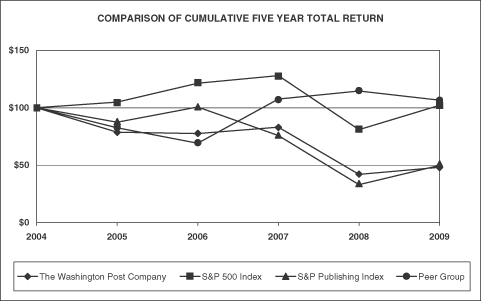
| December 31 | 2004 | 2005 | 2006 | 2007 | 2008 | 2009 | ||||||
| The Washington Post Company |
100 | 78.50 | 77.30 | 82.91 | 41.49 | 47.69 | ||||||
| S&P 500 Index |
100 | 104.91 | 121.48 | 128.16 | 80.74 | 102.11 | ||||||
| S&P Publishing Index |
100 | 87.26 | 100.62 | 75.56 | 32.44 | 49.40 | ||||||
| Education Peer Group |
100 | 82.39 | 68.81 | 107.59 | 114.66 | 106.60 |
32 THE WASHINGTON POST COMPANY
Table of Contents
Item 6. Selected Financial Data.
See the information for the years 2005 through 2009 contained in the table titled “Ten-Year Summary of Selected Historical Financial Data,” which is included in this Annual Report on Form 10-K and listed in the index to financial information on page 37 hereof (with only the information for such years to be deemed filed as part of this Annual Report on Form 10-K).
Item 7. Management’s Discussion and Analysis of Financial Condition and Results of Operations.
See the information contained under the heading “Management’s Discussion and Analysis of Results of Operations and Financial Condition,” which is included in this Annual Report on Form 10-K and listed in the index to financial information on page 37 hereof.
Item 7A. Quantitative and Qualitative Disclosures About Market Risk.
The Company is exposed to market risk in the normal course of its business due primarily to its ownership of marketable equity securities, which are subject to equity price risk; to its borrowing and cash-management activities, which are subject to interest rate risk; and to its foreign business operations, which are subject to foreign exchange rate risk. Except for insignificant activity in short-term forward foreign exchange contracts, neither the Company nor any of its subsidiaries is a party to any derivative financial instruments.
Equity Price Risk
The Company has common stock investments in several publicly traded companies (as discussed in Note E to the Company’s Consolidated Financial Statements) that are subject to market price volatility. The fair value of these common stock investments totaled $353,884,000 at January 3, 2010.
Interest Rate Risk
The Company’s long-term debt consists of $400,000,000 principal amount of 7.25% unsecured notes due February 1, 2019 (the “Notes”). At January 3, 2010, the aggregate fair value of the Notes, based upon quoted market prices, was $443,120,000. An increase in the market rate of interest applicable to the Notes would not increase the Company’s interest expense with respect to the Notes since the rate of interest the Company is required to pay on the Notes is fixed, but such an increase in rates would affect the fair value of the Notes. Assuming, hypothetically, that the market interest rate applicable to the Notes was 100 basis points higher than the Notes’ stated interest rate of 7.25%, the fair value of the Notes at January 3, 2010, would have been approximately $374,750,000. Conversely, if the market interest rate applicable to the Notes was 100 basis points lower than the Notes’ stated interest rate, the fair value of the Notes at such date would have been approximately $427,360,000.
Foreign Exchange Rate Risk
The Company is exposed to foreign exchange rate risk at its Kaplan and Newsweek international operations, and the primary exposure relates to the exchange rate between the U.S. dollar and both the British pound and the Australian dollar. This exposure includes British pound and Australian-dollar denominated intercompany loans on U.S. based Kaplan entities with a functional currency in U.S. dollars. Gains and losses arising from foreign currency transactions affecting the Consolidated Statements of Income have historically not been significant; however, unrealized foreign currency gains on intercompany loans of $16.9 million were recorded in 2009 arising from the weakening of the U.S dollar during the year. Comparing exchange rates in effect at December 31, 2009, versus December 31, 2008, the U.S. dollar weakened against the British pound and the Australian dollar by approximately 10% and 29%, respectively. In 2008, the Company reported unrealized foreign currency losses of $46.3 million as a result of the significant strengthening of the U.S. dollar against the British pound and the Australian dollar. In 2007, the Company reported unrealized foreign currency gains of $8.8 million as a result of the weakening of the U.S. dollar against the British pound and the Australian dollar.
If the values of the British pound and the Australian dollar relative to the U.S. dollar had been 10% lower than the values that prevailed during 2009, the Company’s pre-tax income for fiscal 2009 would have been approximately $17 million lower. Conversely, if such values had been 10% greater, the Company’s reported pre-tax income for fiscal 2009 would have been approximately $17 million higher.
2009 FORM 10-K 33
Table of Contents
Item 8. Financial Statements and Supplementary Data.
See the Company’s Consolidated Financial Statements at January 3, 2010, and for the periods then ended, together with the report of PricewaterhouseCoopers LLP thereon and the information contained in Note R to said Consolidated Financial Statements titled “Summary of Quarterly Operating Results and Comprehensive Income (Unaudited),” which are included in this Annual Report on Form 10-K and listed in the index to financial information on page 37 hereof.
Item 9. Changes in and Disagreements With Accountants on Accounting and Financial Disclosure.
Not applicable.
Item 9A. Controls and Procedures.
Evaluation of Disclosure Controls and Procedures
An evaluation was performed by the Company’s management, with the participation of the Company’s Chief Executive Officer (the Company’s principal executive officer) and the Company’s Senior Vice President–Finance (the Company’s principal financial officer), of the effectiveness of the Company’s disclosure controls and procedures (as defined in Exchange Act Rules 13a-15(e) and 15d-15(e)), as of January 3, 2010. Based on that evaluation, the Company’s Chief Executive Officer and Senior Vice President–Finance have concluded that the Company’s disclosure controls and procedures, as designed and implemented, are effective in ensuring that information required to be disclosed by the Company in the reports that it files or submits under the Exchange Act is recorded, processed, summarized and reported within the time periods specified in the Securities and Exchange Commission’s rules and forms and is accumulated and communicated to management, including the Chief Executive Officer and Senior Vice President–Finance, in a manner that allows timely decisions regarding required disclosure.
Management’s Report on Internal Control Over Financial Reporting
Management’s report set forth on page 53 is incorporated herein by reference.
Changes in Internal Control Over Financial Reporting
There has been no change in the Company’s internal control over financial reporting during the quarter ended January 3, 2010, that has materially affected, or is reasonably likely to materially affect, the Company’s internal control over financial reporting.
Not applicable.
Item 10. Directors, Executive Officers and Corporate Governance.
The information contained under the heading “Executive Officers” in Item 1 hereof and the information contained under the headings “Nominees for Election by Class A Shareholders,” “Nominees for Election by Class B Shareholders,” “Audit Committee” and “Section 16(a) Beneficial Ownership Reporting Compliance” in the definitive Proxy Statement for the Company’s 2010 Annual Meeting of Stockholders is incorporated herein by reference thereto.
The Company has adopted codes of conduct that constitute “codes of ethics” as that term is defined in paragraph (b) of Item 406 of Regulation S-K and that apply to the Company’s principal executive officer, principal financial officer, principal accounting officer or controller and to any persons performing similar functions. Such codes of conduct are posted on the Company’s Internet website, the address of which is www.washpostco.com, and the Company intends to satisfy the disclosure requirements under Item 5.05 of Form 8-K with respect to certain amendments to, and waivers of the requirements of, the provisions of such codes of conduct applicable to the officers and persons referred to above by posting the required information on its Internet website.
In addition to the certifications of the Company’s Chief Executive Officer and Chief Financial Officer filed as exhibits to this Annual Report on Form 10-K, on May 22, 2009, the Company’s Chief Executive Officer submitted to the New York Stock Exchange the annual certification regarding compliance with the NYSE’s corporate governance listing standards required by Section 303A.12(a) of the NYSE Listed Company Manual.
34 THE WASHINGTON POST COMPANY
Table of Contents
Item 11. Executive Compensation.
The information contained under the headings “Director Compensation,” “Compensation Committee Interlocks and Insider Participation,” “Executive Compensation” and “Compensation Committee Report” in the definitive Proxy Statement for the Company’s 2010 Annual Meeting of Stockholders is incorporated herein by reference thereto.
Item 12. Security Ownership of Certain Beneficial Owners and Management and Related Stockholder Matters.
The information contained under the heading “Stock Holdings of Certain Beneficial Owners and Management” in the definitive Proxy Statement for the Company’s 2010 Annual Meeting of Stockholders is incorporated herein by reference thereto.
Item 13. Certain Relationships and Related Transactions and Director Independence.
The information contained under the headings “Transactions with Related Persons, Promoters and Certain Control Persons” and “Controlled Company” in the definitive Proxy Statement for the Company’s 2010 Annual Meeting of Stockholders is incorporated herein by reference thereto.
Item 14. Principal Accounting Fees and Services.
The information contained under the heading “Audit Committee Report” in the definitive Proxy Statement for the Company’s 2010 Annual Meeting of Stockholders is incorporated herein by reference thereto.
Item 15. Exhibits, Financial Statement Schedules.
The following documents are filed as part of this report:
| 1. | Financial Statements |
As listed in the index to financial information on page 37 hereof.
| 2. | Exhibits |
As listed in the index to exhibits on page 89 hereof.
2009 FORM 10-K 35
Table of Contents
Pursuant to the requirements of Section 13 or 15(d) of the Securities Exchange Act of 1934, the Registrant has duly caused this report to be signed on its behalf by the undersigned, thereunto duly authorized, on March 1, 2010.
| THE WASHINGTON POST COMPANY | ||
| (Registrant) | ||
| By | /s/ Hal S. Jones | |
| Hal S. Jones | ||
| Senior Vice President–Finance | ||
Pursuant to the requirements of the Securities Exchange Act of 1934, this report has been signed below by the following persons on behalf of the Registrant and in the capacities indicated on March 1, 2010:
| Donald E. Graham | Chairman of the Board, Chief Executive Officer (Principal Executive Officer) and Director | |||
| Hal S. Jones | Senior Vice President--Finance (Principal Financial Officer) |
|||
| Wallace R. Cooney | Principal Accounting Officer | |||
| Lee C. Bollinger | Director | |||
| Warren E. Buffett | Director | |||
| Christopher C. Davis | Director | |||
| Barry Diller | Director | |||
| John L. Dotson Jr. | Director | |||
| Melinda French Gates | Director | |||
| Thomas S. Gayner | Director | |||
| Anne M. Mulcahy | Director | |||
| Ronald L. Olson | Director | |||
| By | /s/ Hal S. Jones | |
| Hal S. Jones | ||
| Attorney-in-Fact | ||
An original power of attorney authorizing Donald E. Graham, Hal S. Jones and Veronica Dillon, and each of them, to sign all reports required to be filed by the Registrant pursuant to the Securities Exchange Act of 1934 on behalf of the above-named directors and officers has been filed with the Securities and Exchange Commission.
36 THE WASHINGTON POST COMPANY
Table of Contents
INDEX TO FINANCIAL INFORMATION
THE WASHINGTON POST COMPANY
All schedules have been omitted either because they are not applicable or because the required information is included in the consolidated financial statements or the notes thereto referred to above.
2009 FORM 10-K 37
Table of Contents
MANAGEMENT’S DISCUSSION AND ANALYSIS OF RESULTS OF OPERATIONS AND FINANCIAL CONDITION
This analysis should be read in conjunction with the consolidated financial statements and the notes thereto.
OVERVIEW
The Washington Post Company is a diversified education and media company, with education as the largest and fastest growing business. Through its subsidiary Kaplan, Inc., the Company provides educational services for individuals, schools and businesses. The Company also operates principally in four areas of the media business: cable television, newspaper publishing, television broadcasting and magazine publishing. The Company’s business units are diverse and subject to different trends and risks.
The Company’s education division is the largest operating division of the Company, accounting for 58% of the Company’s consolidated revenues in 2009. The Company has devoted significant resources and attention to this division, given the attractiveness of investment opportunities and growth prospects. The growth of Kaplan in recent years has come from both rapid internal growth and acquisitions. Kaplan completed a reorganization of its organizational and internal reporting structure in 2009 into the following four operating segments: Higher Education, Test Preparation, Kaplan International and Kaplan Ventures. Higher Education showed significant revenue growth in 2009, while the other segments reported revenue declines. Kaplan’s Higher Education division showed strong operating income growth, for both its online and fixed-facility operations, due to increased enrollment in both online and residential programs. Operating results for Kaplan’s Test Preparation division were adversely impacted by continued weakness in the Score businesses and declines at the traditional programs, offset by improved results at its professional training businesses due to expense reductions. Kaplan International results declined in 2009 primarily from weaknesses in financial education programs in the U.K. and English-language programs. Kaplan Ventures’ losses increased primarily from development costs incurred at Kaplan Virtual Education, a group of online high schools. The restructuring of Score was completed in 2009. The Company decided to offer tutoring services, previously provided at Score, in Kaplan Test Preparation centers; 14 Score centers were converted into Kaplan test preparation centers and the remaining 64 Score centers were closed. Restructuring activities at Kaplan’s professional domestic businesses were also completed in 2009.
Kaplan made two acquisitions in 2009, nine acquisitions in 2008 and nine acquisitions in 2007; the largest of these are mentioned below. In 2007, Kaplan Ventures acquired EduNeering Holdings, Inc., a Princeton, NJ-based provider of knowledge management solutions for organizations in the pharmaceutical, medical device, health care, energy and manufacturing sectors. In August 2007, Kaplan International completed the acquisition of the education division of Financial Services Institute of Australasia. Over the past several years, Kaplan’s revenues have grown rapidly, while operating income has fluctuated due largely to restructuring activities, various business investments and stock compensation charges.
The cable division has also been a source of recent growth and capital investment. Cable ONE’s industry has experienced significant technological changes that have created new revenue opportunities, such as digital television, broadband and, more recently, telephony. Cable ONE has also experienced increased competition, particularly from satellite television service providers and, to a smaller extent, other telephony providers. The cable division’s subscriber base was down in 2009 (decrease of 30,500 subscribers to approximately 669,000 at the end of 2009) due to the challenging economic environment in 2009 and competition from satellite and telephone companies. Cable telephone subscribers and high-speed data subscribers grew 17% and 5%, respectively, to approximately 109,600 and 392,800, respectively, at the end of 2009. The cable division continues to provide monthly discounts for subscribers who take at least three offered services (basic service, digital service, high-speed data service and/or telephony service). Promotional discounts are offered for new subscribers or existing subscribers adding new services.
The Company’s newspaper publishing, broadcast television and magazine publishing divisions derive revenue from advertising and, to a lesser extent, circulation and subscriptions. The results of these divisions tend to fluctuate with the overall advertising cycle, among other business factors.
Like many other large newspapers, The Washington Post has experienced a significant continued downward trend in print advertising revenue, which declined 23% in 2009, reflecting a large decline in classified, zones and retail advertising. This follows a 17% print advertising decline at The Washington Post in 2008 and a 13% decline in 2007. Circulation volume also continued a downward trend, although revenues increased 7% due to home-delivery price increases and significant single-copy sales in January 2009 during the Presidential Inauguration. The Company’s online publishing businesses, primarily washingtonpost.com and The Slate Group, reported an 8% revenue decline in 2009, following a 7% revenue increase in 2008. The Washington Post is integrating the print and online operations and implemented cost savings initiatives in 2009, including a Voluntary Retirement Incentive Program in which 221 employees accepted early retirement and the July 2009 closing of the Post’s College Park, MD, printing plant.
The Company’s television broadcasting division reported a decline in revenues and operating income due largely to weakness in most of its markets and product categories and the absence of significant political and Olympics-related advertising revenue in 2009.
Newsweek magazine advertising revenue was down 37% in 2009 due to fewer ads at the domestic and international editions, following a 14% decline in 2008 due to fewer ad pages at the domestic edition. In 2008, Newsweek implemented a circulation rate base reduction at its domestic edition, from 3.1 million to 2.6 million, and in 2009, Newsweek implemented another rate base reduction, to 1.5 million in January 2010. Also in 2009, Newsweek completed a Voluntary Retirement Incentive Program, with 44 employees accepting early retirement.
The Company generates a significant amount of cash from its businesses that is used to support its operations, to pay down debt and to fund capital expenditures, share repurchases, dividends, acquisitions and other investments.
38 THE WASHINGTON POST COMPANY
Table of Contents
RESULTS OF OPERATIONS — 2009 COMPARED TO 2008
Net income was $91.2 million ($9.78 per share) for the fiscal year ended January 3, 2010, up from $65.8 million ($6.87 per share) for the fiscal year ended December 28, 2008. The Company’s results for 2009 and 2008 include several unusual or one-time items, as described below.
Items included in the Company’s results in 2009:
| • | $64.5 million in early retirement program expense, primarily at The Washington Post and Newsweek (after-tax impact of $40.0 million, or $4.26 per share); |
| • | $33.2 million in restructuring charges related to Kaplan’s Score and Test Preparation operations (after-tax impact of $20.6 million, or $2.19 per share); |
| • | $33.8 million in accelerated depreciation at The Washington Post (after-tax impact of $21.0 million, or $2.23 per share); |
| • | A $25.4 million goodwill and other long-lived assets impairment charge related to Kaplan Ventures (after-tax impact of $18.8 million, or $2.00 per share); |
| • | A $29.0 million decline in equity in earnings (losses) of affiliates associated with impairment charges at two of the Company’s affiliates (after-tax impact of $18.8 million, or $2.00 per share); and |
| • | $16.9 million in non-operating unrealized foreign currency gains arising from the weakening of the U.S. dollar (after-tax impact of $10.3 million, or $1.10 per share). |
Items included in the Company’s results in 2008:
| • | Goodwill, intangible assets and other impairment charges of $142.3 million at the Company’s online lead generation business, included in the other businesses and corporate office segment; at the Company’s community newspapers, The Herald and other operations, included in the newspaper publishing segment; and at two of the Company’s equity affiliates (after-tax impact of $115.7 million, or $12.35 per share); |
| • | Charges of $111.1 million related to early retirement program expense at The Washington Post newspaper, the corporate office and Newsweek (after-tax impact of $67.2 million, or $7.07 per share); |
| • | $22.3 million in accelerated depreciation related to the planned closing of The Washington Post’s College Park, MD, plant (after-tax impact of $13.9 million, or $1.48 per share); |
| • | Expenses and charges of $11.0 million (after-tax impact of $6.8 million, or $0.72 per share) in connection with the restructuring of Test Preparation’s professional training businesses; |
| • | Non-operating gains include $47.3 million from the sales of marketable equity securities (after-tax impact of $28.9 million, or $3.09 per share), offset by $46.3 million in non-operating unrealized foreign currency losses arising from the strengthening of the U.S. dollar (after-tax impact of $28.5 million, or $3.04 per share); and |
| • | Income tax expense of $9.5 million related to valuation allowances provided against certain state and local income tax benefits, net of U.S. Federal income tax benefits ($1.01 per share). |
Revenue for 2009 was $4,569.7 million, up 2% compared to revenue of $4,461.6 million in 2008. The increases are due primarily to strong revenue growth at the education division and increased revenue at the cable division, partially offset by revenue declines at the Company’s newspaper publishing, magazine publishing and television broadcasting divisions. In 2009, education revenue increased 13%, advertising revenue decreased 21%, circulation and subscriber revenue increased 3% and other revenue declined 2%. Revenue growth at Kaplan accounted for the increase in education revenue. The decrease in advertising revenue is due to declines in print advertising at The Washington Post, as well as to declines in the television broadcasting and magazine publishing divisions. The increase in circulation and subscriber revenue is due to a 5% increase in subscriber revenue at the cable division from continued revenue growth in all major product offerings and a 7% increase in circulation revenue at the Post. This increase was offset by a 14% decline in Newsweek circulation revenue due to circulation rate base reductions at the domestic edition of Newsweek.
Operating costs and expenses for the year increased 2% to $4,375.7 million, from $4,287.4 million in 2008. The increase is due to higher expenses from operating growth at Kaplan and Cable ONE, offset by reduced costs at the newspaper and magazine publishing divisions.
Operating income for 2009 increased to $194.0 million, from $174.2 million in 2008. Operating results were significantly impacted by the unusual or one-time operating items described above. Excluding these one-time or unusual items, results at the newspaper publishing, magazine publishing and television broadcasting divisions were down, generally due to weakness in advertising demand, offset by improved results at the Company’s education and cable television divisions.
The Company’s 2009 operating income includes $8.1 million of net pension credits, compared to $25.7 million in 2008. These amounts exclude $64.5 million and $111.1 million in charges related to early retirement programs in 2009 and 2008, respectively.
DIVISION RESULTS
Education Division. Education division revenue in 2009 increased to $2,636.6 million, a 13% increase from $2,331.6 million in 2008. Kaplan reported operating income of $194.8 million for 2009, compared to $206.3 million in 2008. Kaplan’s results for 2009 and 2008 were impacted by several unusual or one-time items (discussed below).
Kaplan completed a reorganization of its organizational and internal reporting structure during the third quarter of 2009 that resulted in changes to the composition of the Company’s reporting
2009 FORM 10-K 39
Table of Contents
segments. A summary of Kaplan’s operating results reported under this structure for 2009 compared to 2008 is as follows:
| (in thousands) | 2009 |
2008 |
% Change |
||||||||
| Revenue |
|||||||||||
| Higher education |
$ | 1,539,587 | $ | 1,160,062 | 33 | ||||||
| Test preparation, excluding Score |
436,438 | 478,440 | (9 | ) | |||||||
| Score |
8,557 | 28,672 | (70 | ) | |||||||
| Kaplan international |
537,238 | 545,070 | (1 | ) | |||||||
| Kaplan ventures |
124,250 | 126,242 | (2 | ) | |||||||
| Kaplan corporate |
1,354 | 1,426 | (5 | ) | |||||||
| Intersegment elimination |
(10,786 | ) | (8,332 | ) | — | ||||||
| $ | 2,636,638 | $ | 2,331,580 | 13 | |||||||
| Operating income (loss) |
|||||||||||
| Higher education |
$ | 274,753 | $ | 172,897 | 59 | ||||||
| Test preparation, excluding Score |
21,205 | 47,580 | (55 | ) | |||||||
| Score |
(36,787 | ) | (13,278 | ) | — | ||||||
| Kaplan international |
53,772 | 59,957 | (10 | ) | |||||||
| Kaplan ventures |
(16,332 | ) | (3,844 | ) | — | ||||||
| Kaplan corporate |
(53,617 | ) | (49,143 | ) | (9 | ) | |||||
| Kaplan stock compensation |
(933 | ) | 7,829 | — | |||||||
| Amortization of intangible assets |
(22,223 | ) | (15,472 | ) | (44 | ) | |||||
| Impairment of goodwill and other long-lived assets |
(25,387 | ) | — | — | |||||||
| Intersegment elimination |
310 | (224 | ) | — | |||||||
| $ | 194,761 | $ | 206,302 | (6 | ) | ||||||
Kaplan Higher Education (KHE) includes Kaplan’s domestic post-secondary education businesses, made up of fixed-facility colleges as well as online postsecondary and career programs. Higher education revenue grew by 33% for 2009 due mostly to strong enrollment growth. Operating income at KHE increased 59% in 2009 due to this strong enrollment growth, offset by increased marketing and advertising costs in the first quarter of 2009, including a $21.0 million national media campaign. At December 31, 2009, KHE’s enrollments totaled 104,900, a 32% increase compared to total enrollments of 79,800 at December 31, 2008. Enrollment growth was particularly strong at Kaplan University’s online offerings, which grew 47% in 2009. Beginning in 2008, KHE provided loans directly to some Kaplan students under an institutional loan program. Lending under Kaplan’s institutional loan program totaled approximately 1% of its higher education revenue in 2009.
Test Preparation includes Kaplan’s standardized test preparation and tutoring offerings, as well as the professional domestic training business, K12 and other businesses. Test Preparation revenue, excluding Score, declined 9% in 2009 due to continued revenue declines in the real estate and financial education businesses, declines at the traditional test preparation programs and softness in other programs. Test Preparation operating results, excluding Score, were also down in 2009 due to declines at the traditional test preparation programs and softness in other programs, along with a fourth quarter $4.6 million charge at the K12 business for product development and other write-downs. The declines were offset by improved results at Test Preparation’s professional domestic training businesses due to expense reductions.
At the end of March 2009, the Company approved a plan to offer tutoring services, previously provided at Score, in Kaplan test preparation centers. The plan was substantially completed by the end of the second quarter of 2009; 14 existing Score centers were converted into Kaplan test preparation centers, and the remaining 64 Score centers were closed. Score revenues declined to $8.6 million in 2009, from $28.7 million in 2008. Operating losses at Score increased to $36.8 million in 2009, inclusive of $24.9 million in restructuring-related charges, compared to $13.3 million in operating losses for 2008.
In 2007, Kaplan announced restructuring plans at its professional domestic training businesses that involved product changes and decentralization of certain operations, in addition to employee terminations. These businesses are now part of Kaplan’s Test Preparation division. In the fourth quarter of 2008, Kaplan expanded this restructuring to include additional operations. Total restructuring-related expenses of $8.3 million were recorded in 2009 related to lease termination costs, accelerated depreciation of fixed assets and severance costs, compared to $11.0 million in restructuring-related severance costs recorded in 2008.
Kaplan International includes professional training and post-secondary education businesses outside the United States, as well as English-language programs. Kaplan International revenue declined 1% in 2009. Excluding revenue from acquired businesses, Kaplan International revenue was down 6% in 2009. The decline for 2009 is primarily the result of unfavorable exchange rates in the U.K., Europe and Australia. These declines were offset by revenue growth at International’s Asian operations. Kaplan International operating income was down in 2009 largely due to weakness in the financial education programs in the U.K. and English-language programs, offset by improved operating results at International’s Asian operations.
Kaplan Ventures is made up of a number of businesses in various stages of development that are managed separately from the other education businesses. Kaplan Ventures includes Kaplan EduNeering, Kaplan Compliance Solutions, Kaplan IT Learning, Education Connection, Kaplan Virtual Education, Kidum and other smaller businesses. Revenues at Kaplan Ventures declined 2% in 2009. Kaplan Ventures reported operating losses of $16.3 million in 2009, compared to operating losses of $3.8 million in 2008, due primarily to increased losses at Kaplan Virtual Education, a developing group of online high school institutions. A goodwill and other long-lived assets impairment charge of $25.4 million was recorded at Kaplan in the third quarter of 2009 related to certain Kaplan Ventures’ businesses, as the book value of these businesses exceeded their estimated fair value.
Corporate represents unallocated expenses of Kaplan, Inc.’s corporate office and other minor activities. Corporate expenses in 2008 included expenses associated with the resignation of Kaplan’s former chief executive officer in 2008.
40 THE WASHINGTON POST COMPANY
Table of Contents
Stock compensation (charges) credits relate to incentive compensation arising from equity awards under the Kaplan stock option plan, which was established for certain members of Kaplan’s management. Kaplan recorded stock compensation expense of $0.9 million in 2009, compared to a stock compensation credit of $7.8 million in 2008. The stock compensation credit in 2008 relates primarily to the forfeiture of 21,526 Kaplan stock options due to the resignation noted above.
Cable Television Division. Cable television division revenue of $750.4 million for 2009 represents a 4% increase from $719.1 million in 2008. The 2009 revenue increase is due to continued growth in the division’s cable modem and telephone revenues and a $4 monthly rate increase for most basic subscribers in June 2009.
Cable television division operating income in 2009 increased 4% to $169.1 million, from $162.2 million in 2008. The cable division’s operating results in 2009 included a $7.7 million gain arising from changes to the cable division retiree health care benefits program. Excluding this gain, the cable division’s operating income in 2009 was even with 2008, as revenue increases were offset by increased programming, depreciation and general and administrative costs. Operating margin at the cable television division was 23% in 2009 and 2008.
Revenue generating units (RGUs) were even with the prior year-end due to a reduction in basic and digital subscribers, offset by continued growth in high-speed data and telephony subscribers. A summary of RGUs is as follows:
| Cable Television Division Subscribers |
December 31, 2009 |
December 31, 2008 | ||
| Basic |
668,986 | 699,469 | ||
| Digital |
219,062 | 224,877 | ||
| High-speed data |
392,832 | 372,887 | ||
| Telephony |
109,619 | 93,520 | ||
| Total |
1,390,499 | 1,390,753 | ||
RGUs include about 6,300 subscribers who receive free basic video service, primarily local governments, schools and other organizations as required by various franchise agreements.
Below are details of cable division capital expenditures for 2009 and 2008 in the NCTA Standard Reporting Categories:
| (in millions) | 2009 | 2008 | ||||
| Customer premise equipment |
$ | 24.1 | $ | 34.5 | ||
| Scalable infrastructure |
23.9 | 19.0 | ||||
| Line extensions |
10.1 | 16.2 | ||||
| Upgrade/rebuild |
8.6 | 14.8 | ||||
| Support capital |
17.3 | 29.7 | ||||
| Total |
$ | 84.0 | $ | 114.2 | ||
Newspaper Publishing Division. At most of the newspaper publishing division, 2009 included 53 weeks compared to 52 weeks in 2008. Newspaper publishing division revenue in 2009 decreased 15% to $679.3 million, from $801.3 million in 2008. Print advertising revenue at the Post in 2009 declined 23% to $317.0 million, from $410.4 million in 2008. The print revenue decline in 2009 is from large decreases in classified, zones and retail advertising. Revenue generated by the Company’s newspaper online publishing activities, primarily washingtonpost.com, declined 8% to $99.6 million, from $108.3 million in 2008. Display online advertising revenue grew 2% in 2009 and online classified advertising revenue on washingtonpost.com declined 24%. Daily circulation at the Post declined 5.9%, and Sunday circulation declined 4.7% in 2009; average daily circulation at the Post totaled 595,800 (unaudited) and average Sunday circulation totaled 831,300 (unaudited).
The Company offered a Voluntary Retirement Incentive Program to certain employees of The Washington Post newspaper in the first quarter of 2009. A total of 221 employees accepted the offer, and early retirement program expense of $56.8 million was recorded in the second quarter of 2009, which is being funded primarily from the assets of the Company’s pension plans. In the third quarter of 2009, the Company offered a Voluntary Retirement Incentive Program to certain employees at Robinson Terminal Warehouse Corporation, and $1.1 million in early retirement program expense was recorded, also to be funded from the assets of the Company’s pension plans. In the first quarter of 2008, a Voluntary Retirement Incentive Program was offered at The Washington Post, with 231 employees accepting the offer; $79.8 million in early retirement program expense was recorded in the second quarter of 2008, also funded primarily from the assets of the Company’s pension plans.
The Post closed its College Park, MD, printing plant in July 2009 and consolidated its printing operations in Springfield, VA. The Post is also in the process of consolidating certain other operations in Washington, DC. In connection with these activities, accelerated depreciation of $33.8 million and $22.3 million was recorded in 2009 and 2008, respectively. The Post incurred additional costs related to the shutdown of the College Park, MD, printing plant of $1.7 million in 2009. The Post expects to incur additional costs in 2010 that will be recorded as incurred. In the fourth quarter of 2009, the Company recorded a $2.2 million loss on an office lease in conjunction with the consolidation of operations. An additional loss will be recorded in 2010, depending on the timing of the consolidation. Also in 2008, as a result of the challenging advertising environment at the Company’s community newspapers, The Herald and other operations included in the newspaper publishing division, the Company recorded goodwill impairment charges of $65.8 million.
The newspaper division reported an operating loss of $163.5 million in 2009, compared to an operating loss of $192.7 million in 2008. Excluding early retirement program charges, accelerated depreciation and goodwill impairment losses, operating results declined in 2009 due to the significant decline in division advertising revenue, offset by expense reductions and a 19% reduction in newsprint expense due to a decline in newsprint consumption and prices.
Television Broadcasting Division. Revenue for the television broadcasting division decreased 16% to $272.7 million in 2009, from $325.1 million in 2008. The decrease in revenue is due to weaker advertising demand in most markets and product
2009 FORM 10-K 41
Table of Contents
categories, particularly automotive, and a $19.4 million decrease in political advertising revenue in 2009. Additionally, in the third quarter of 2008, the television broadcasting division benefited from $6.3 million in incremental summer Olympics-related advertising at the Company’s NBC affiliates.
In 2008, the television broadcasting division recorded $6.9 million in noncash property, plant and equipment gains as a reduction to expense due to new digital equipment received at no cost from Sprint/Nextel in connection with an FCC mandate reallocating a portion of the broadcast spectrum.
Television broadcasting division operating income for 2009 declined 43% to $70.5 million, from $123.5 million in 2008. The operating income decline for 2009 is due to the revenue decreases discussed above and the noncash gains in 2008. Operating margin at the television broadcasting division was 26% in 2009 and 38% in 2008.
Competitive market position remained strong for the Company’s television stations. KSAT in San Antonio, WPLG in Miami and WJXT in Jacksonville ranked number one in the November 2009 ratings period, Monday through Friday, sign-on to sign-off; WDIV in Detroit and WKMG in Orlando ranked second; and KPRC in Houston ranked third.
Magazine Publishing Division. Revenue for the magazine publishing division totaled $184.2 million in 2009, a 27% decline from $250.9 million in 2008. The decrease in revenue for 2009 is due to advertising revenue declines at Newsweek of 37%, resulting from fewer ad pages at both the domestic and international editions. In February 2009, Newsweek announced a circulation rate base reduction at its domestic edition, from 2.6 million to 1.5 million, by January 2010. Subscription revenue also declined at the domestic edition in 2009 due to the rate base reduction.
Newsweek offered a Voluntary Retirement Incentive Program to certain employees in November 2008, and 44 employees accepted the offer in the first quarter of 2009; early retirement program expense of $6.6 million was recorded in the first quarter of 2009, which is being funded primarily from the assets of the Company’s pension plans. In the first quarter of 2008, Newsweek also offered a Voluntary Retirement Incentive Program to certain employees and 117 employees accepted the offer. The early retirement program expense in 2008 totaled $28.3 million, also funded primarily from the assets of the Company’s pension plans. Additional cost savings initiatives were implemented at Newsweek’s operations in 2009, and $8.4 million in severance and lease termination costs were recorded.
The division had an operating loss in 2009 of $29.3 million, compared to an operating loss of $16.1 million in 2008. Excluding early retirement program expense, the division’s operating results declined in 2009 due to the revenue reductions discussed above and a reduced pension credit, offset by a decline in subscription, editorial and manufacturing expenses at the domestic edition of Newsweek.
In December 2009, Newsweek sold its Newsweek Budget Travel magazine and realized a gain on the transaction. Budget Travel revenues for 2009 were $18.7 million, compared to $23.5 million in 2008. Including the gain on the sale, Budget Travel incurred operating losses of $1.2 million in 2009 and $0.7 million in 2008.
Other Businesses and Corporate Office. Other businesses and corporate office include the expenses of the Company’s corporate office and the operating results of Avenue100 Media Solutions (formerly CourseAdvisor). In the fourth quarter of 2008, a goodwill and other intangible assets impairment charge of $69.7 million was recorded to write down the intangible assets of Avenue100 Media Solutions to their estimated fair values. The 2008 results also include $3.0 million in early retirement program expense at the corporate office.
Equity in Losses of Affiliates. The Company’s equity in losses of affiliates for 2009 was $29.4 million, compared to $7.8 million in losses for 2008. Results for 2009 included $29.0 million in write-downs at two of the Company’s affiliate investments. Most of the loss relates to an impairment charge recorded on the Company’s interest in Bowater Mersey Paper Company as a result of the challenging economic environment for newsprint producers. Results in 2008 include $6.8 million in impairment charges at two of the Company’s affiliates.
The Company holds a 49% interest in Bowater Mersey Paper Company and interests in several other affiliates.
Non-Operating Items. The Company recorded other non-operating income, net, of $13.2 million in 2009, compared to other non-operating expense, net, of $2.2 million in 2008. The 2009 non-operating income, net, primarily included $16.9 million in unrealized foreign currency gains, offset by $3.8 million in impairment write-downs on cost method investments. The 2008 non-operating expense, net, primarily consisted of $46.3 million in unrealized foreign currency losses, offset by $47.3 million in gains from sales of marketable equity securities.
As noted above, a large part of the Company’s non-operating income (expense) is from unrealized foreign currency gains or losses arising from the translation of British pound and Australian dollar-denominated intercompany loans into U.S. dollars. The unrealized foreign currency gains in 2009 were the result of a weakening of the U.S. dollar against the British pound and the Australian dollar in 2009, versus the exchange rates in effect at the end of 2008. The unrealized foreign currency losses in 2008 were the result of a strengthening of the U.S. dollar against the British pound and the Australian dollar in 2008, versus the exchange rates in effect at the end of 2007.
A summary of non-operating income (expense) for the years ended January 3, 2010 and December 28, 2008 follows:
| (in millions) | 2009 | 2008 | ||||||
| Foreign currency gains (losses), net |
$ | 16.9 | $ | (46.3 | ) | |||
| Impairment write-downs on cost method investments |
(3.8 | ) | (2.9 | ) | ||||
| Gain on sales of marketable equity securities |
— | 47.3 | ||||||
| Other gains (losses) |
0.1 | (0.3 | ) | |||||
| Total |
$ | 13.2 | $ | (2.2 | ) | |||
42 THE WASHINGTON POST COMPANY
Table of Contents
The Company incurred net interest expense of $29.0 million in 2009, compared to $19.0 million in 2008. The increases are due to higher average interest rates in 2009 compared to 2008, as well as a decline in interest income. At January 3, 2010, the Company had $399.3 million in borrowings outstanding at an average interest rate of 7.2%; at December 28, 2008, the Company had $553.8 million in borrowings outstanding at an average interest rate of 4.1%.
Income Taxes. The effective tax rate for 2009 was 38.7%. This effective tax rate was adversely impacted by $12.2 million in noncash valuation allowances provided against deferred state and local income tax benefits, net of U.S. Federal income taxes, and $3.3 million from nondeductible goodwill in connection with impairment charges recorded in 2009; these items were offset by favorable adjustments recorded for a reduction in state income taxes and for prior year permanent U.S. Federal tax deductions.
The effective tax rate for 2008 was 54.7%. This high effective tax rate was due to $31.1 million from nondeductible goodwill in connection with impairment charges recorded in 2008 and $9.5 million in noncash valuation allowances provided against deferred state and local income tax benefits, net of U.S. Federal income taxes; these were offset by a favorable $4.6 million provision to return adjustment from 2007.
RESULTS OF OPERATIONS—2008 COMPARED TO 2007
Net income was $65.8 million ($6.87 per share) for the fiscal year ended December 28, 2008, down from $289.0 million ($30.19 per share) for the fiscal year ended December 30, 2007. The Company’s results for 2008 and 2007 include several unusual or one-time items, as described below.
Items included in the Company’s results in 2008:
| • | Goodwill, intangible assets and other impairment charges of $142.3 million at the Company’s online lead generation business, included in the other businesses and corporate office segment; at the Company’s community newspapers, The Herald and other operations, included in the newspaper publishing segment; and at two of the Company’s equity affiliates (after-tax impact of $115.7 million, or $12.35 per share); |
| • | Charges of $111.1 million related to early retirement program expense at The Washington Post newspaper, the corporate office and Newsweek (after-tax impact of $67.2 million, or $7.07 per share); |
| • | $22.3 million in accelerated depreciation related to the planned closing of The Washington Post’s College Park, MD, plant (after-tax impact of $13.9 million, or $1.48 per share); |
| • | Expenses and charges of $11.0 million (after-tax impact of $6.8 million, or $0.72 per share) in connection with the restructuring of Test Preparation’s professional training businesses; |
| • | Non-operating gains include $47.3 million from the sales of marketable equity securities (after-tax impact of $28.9 million, or $3.09 per share), offset by $46.3 million in non-operating unrealized foreign currency losses arising from the strengthening of the U.S. dollar (after-tax impact of $28.5 million, or $3.04 per share); and |
| • | Income tax expense of $9.5 million related to valuation allowances provided against certain state and local income tax benefits, net of U.S. Federal income tax benefits ($1.01 per share). |
Items included in the Company’s results in 2007:
| • | A gain of $9.5 million from the sale of property at the Company’s television station in Miami (after-tax impact of $5.9 million, or $0.62 per share); |
| • | Expenses and charges of $17.2 million (after-tax impact of $10.3 million, or $1.08 per share) in connection with the restructuring of Kaplan’s Score and Test Preparation operations; |
| • | Non-operating unrealized foreign currency gains on intercompany loans of $8.8 million (after-tax impact of $5.5 million, or $0.58 per share); and |
| • | A charge of $6.6 million ($0.70 per share) in additional income tax expense, as the result of a $12.9 million increase in taxes associated with Bowater Mersey, offset by a tax benefit of $6.3 million associated with changes in certain state income tax laws. Both of these were noncash items in 2007, impacting the Company’s long-term net deferred income tax liabilities. |
Revenue for 2008 was $4,461.6 million, up 7% compared to revenue of $4,180.4 million in 2007. The increase is due primarily to significant revenue growth at the education and cable divisions, partially offset by revenue declines at the Company’s newspaper publishing, magazine publishing and television broadcasting divisions. Advertising revenue decreased 12% in 2008, and circulation and subscriber revenue increased 10%. Education revenue increased 15% in 2008, and other revenue was up 49%. The decrease in advertising revenue is due to declines in print advertising at The Washington Post, as well as declines in the television broadcasting and magazine publishing divisions. The increase in circulation and subscriber revenue is due to a 16% increase in subscriber revenue at the cable division from continued growth in all major product offerings, and a 4% increase in circulation revenue at the Post. This increase was offset by a 12% decline in Newsweek circulation revenue due primarily to a circulation rate base reduction at the domestic edition of Newsweek, from 3.1 million to 2.6 million. Revenue growth at Kaplan (about 24% of which was from acquisitions) accounted for the increase in education revenue. Other revenues increased due to the CourseAdvisor acquisition in October 2007. CourseAdvisor is now known as Avenue100 Media Solutions.
Operating costs and expenses for the year increased 16% to $4,287.4 million, from $3,703.4 million in 2007. The increase is due to higher expenses from operating growth at Kaplan and Cable ONE, as well as goodwill and other intangible asset impairment charges, and early retirement program expenses as previously discussed.
2009 FORM 10-K 43
Table of Contents
Operating income for 2008 declined to $174.2 million, from $477.0 million in 2007. Operating results were significantly impacted by the unusual or one-time operating items described above. Excluding these one-time or unusual items, results at the newspaper publishing, magazine publishing and television broadcasting divisions were down generally due to weakness in advertising demand, offset by improved results at the Company’s education and cable television divisions.
The Company’s 2008 operating income included $25.7 million of net pension credits, compared to $22.3 million in 2007. These amounts exclude $111.1 million in charges related to early retirement programs in 2008.
DIVISION RESULTS
Education Division. Education division revenue in 2008 increased 15% to $2,331.6 million, from $2,030.9 million in 2007. Excluding revenue from acquired businesses, education division revenue increased 11% in 2008. Kaplan reported operating income of $206.3 million for 2008, compared to $149.0 million in 2007. Kaplan’s results for 2008 and 2007 were impacted by several unusual or one-time items (discussed below).
Kaplan completed a reorganization of its organizational and internal reporting structure during 2009 that resulted in changes to the composition of the Company’s reporting segments. A summary of Kaplan’s operating results reported under this new structure for 2008 compared to 2007 is as follows:
| (in thousands) | 2008 |
2007 |
% Change |
||||||||
| Revenue |
|||||||||||
| Higher education |
$ | 1,160,062 | $ | 933,286 | 24 | ||||||
| Test preparation, excluding Score |
478,440 | 499,010 | (4 | ) | |||||||
| Score |
28,672 | 55,830 | (48 | ) | |||||||
| Kaplan international |
545,070 | 442,200 | 23 | ||||||||
| Kaplan ventures |
126,242 | 105,806 | 19 | ||||||||
| Kaplan corporate |
1,426 | 1,261 | 13 | ||||||||
| Intersegment elimination |
(8,332 | ) | (6,504 | ) | — | ||||||
| $ | 2,331,580 | $ | 2,030,889 | 15 | |||||||
| Operating income (loss) |
|||||||||||
| Higher education |
$ | 172,897 | $ | 123,535 | 40 | ||||||
| Test preparation, excluding Score |
47,580 | 81,215 | (41 | ) | |||||||
| Score |
(13,278 | ) | (23,228 | ) | 43 | ||||||
| Kaplan international |
59,957 | 54,962 | 9 | ||||||||
| Kaplan ventures |
(3,844 | ) | 1,596 | — | |||||||
| Kaplan corporate |
(49,143 | ) | (32,772 | ) | (50 | ) | |||||
| Kaplan stock compensation |
7,829 | (41,294 | ) | — | |||||||
| Amortization of intangible assets |
(15,472 | ) | (14,670 | ) | (5 | ) | |||||
| Intersegment elimination |
(224 | ) | (307 | ) | — | ||||||
| $ | 206,302 | $ | 149,037 | 38 | |||||||
Kaplan Higher Education (KHE) includes Kaplan’s domestic post-secondary education businesses, made up of fixed-facility colleges, as well as online postsecondary and career programs. Higher education revenue grew by 24% for 2008, and operating income increased 40% due to strong enrollment growth. At December 31, 2008, KHE’s enrollments totaled 79,800, a 21% increase compared to total enrollments of 65,700 at December 31, 2007, due to growth in the online and residential programs. Higher Education results in 2007 were adversely affected by $2.7 million in lease termination charges.
Test Preparation includes Kaplan’s standardized test preparation and tutoring offerings, as well as the professional domestic training business, K12 and other businesses. Test Preparation revenue, excluding Score, declined 4% in 2008 due to continued revenue declines in the real estate and financial education businesses. Test Preparation operating results, excluding Score, were down 41% in 2008 due to continued weakness in the real estate and financial education businesses, and higher payroll and marketing costs for the traditional test preparation programs.
Score revenues declined 48% in 2008 as a result of the Score restructuring in 2007 that included the closing of 75 Score centers. Score incurred approximately $11.2 million in expenses in 2007 related to lease obligations, severance and accelerated depreciation of fixed assets.
In 2007, Kaplan announced restructuring plans at its professional domestic training businesses that involved product changes and decentralization of certain operations, in addition to employee terminations. A charge of $6.0 million was recorded in 2007 related to the write-off of an integrated software product under development and severance costs in connection with the restructuring; an additional $3 million was anticipated to be incurred in 2008. In the fourth quarter of 2008, Kaplan expanded this restructuring to include additional operations. Total severance and other restructuring-related expenses of $11.0 million were recorded in 2008.
Kaplan International includes professional training and post-secondary education businesses outside the United States, as well as English-language programs. Kaplan International revenue increased 23% in 2008. Excluding revenue from acquired businesses, Kaplan International revenue increased 9% in 2008 due to revenue growth in English-language programs and at International’s Asian and Pacific businesses, offset by reductions in the U.K. due to unfavorable exchange rates. Kaplan International’s operating income increased 9% in 2008 due to growth in English-language programs and improved results in the Asian operations, offset by unfavorable exchange rates in the U.K. and investments in higher education international programs.
Kaplan Ventures is made up of a number of businesses in various stages of development that are managed separately from the other education businesses. Kaplan Ventures includes Kaplan EduNeering, Kaplan Compliance Solutions, Kaplan IT Learning, Education Connection, Kaplan Virtual Education, Kidum and other smaller businesses. Revenues at Kaplan Ventures increased 19% in 2008. Kaplan Ventures reported operating losses of $3.8 million in 2008, compared to operating income of $1.6 million in 2007, due primarily to additional costs associated with the expansion of Kaplan’s online high school.
Corporate represents unallocated expenses of Kaplan, Inc.’s corporate office and other minor activities. Kaplan corporate expenses increased in 2008 due to an increase in employee benefits costs in the fourth quarter of 2008 and expenses
44 THE WASHINGTON POST COMPANY
Table of Contents
associated with the resignation of Kaplan’s former chief executive officer in November 2008.
Stock compensation credits (charges) relate to incentive compensation arising from equity awards under the Kaplan stock option plan, which was established for certain members of Kaplan’s management. Kaplan recorded a stock compensation credit of $7.8 million in 2008, compared to stock compensation expense of $41.3 million in 2007. The stock compensation credit in 2008 related primarily to the forfeiture of 21,526 Kaplan stock options due to the resignation noted above.
Cable Television Division. Cable television division revenue of $719.1 million for 2008 represents a 15% increase from $626.4 million in 2007. The 2008 revenue increase is due to continued growth in the division’s cable modem, telephone and digital revenues, as well as a rate increase in September 2007 for most high-speed data subscribers; a January 2008 basic video cable service rate increase at nearly all of its systems; and a rate increase in August 2008 for telephone subscribers. The last rate increase for most high-speed data subscribers had previously been in March 2003, and the last rate increase for basic cable subscribers had previously been in February 2006.
Cable television division operating income in 2008 increased 31% to $162.2 million, from $123.7 million in 2007. The increase in operating income is due to the division’s revenue growth, offset by higher depreciation and programming expenses and increases in Internet and telephony costs. Operating margin at the cable television division was 23% in 2008, compared to 20% in 2007.
Revenue generating units (RGUs) grew 5% in 2008 due to continued growth in high-speed data and telephony subscribers. The cable television division began offering telephone service on a very limited basis in the second quarter of 2006; at December 31, 2008, telephone service is being offered in all or part of systems representing 95% of homes passed. A summary of RGUs is as follows:
| Cable Television Division Subscribers |
December 31, 2008 |
December 31, 2007 | ||
| Basic |
699,469 | 702,669 | ||
| Digital |
224,877 | 223,931 | ||
| High-speed data |
372,887 | 341,034 | ||
| Telephony |
93,520 | 58,640 | ||
| Total |
1,390,753 | 1,326,274 | ||
RGUs included about 6,900 subscribers who received free basic video service, primarily local governments, schools and other organizations as required by various franchise agreements.
Below are details of cable division capital expenditures for 2008 and 2007 in the NCTA Standard Reporting Categories:
| (in millions) | 2008 | 2007 | ||||
| Customer premise equipment |
$ | 34.5 | $ | 52.5 | ||
| Scalable infrastructure |
19.0 | 20.6 | ||||
| Line extensions |
16.2 | 21.1 | ||||
| Upgrade/rebuild |
14.8 | 12.8 | ||||
| Support capital |
29.7 | 31.3 | ||||
| Total |
$ | 114.2 | $ | 138.3 | ||
Newspaper Publishing Division. Newspaper publishing division revenue in 2008 decreased 10% to $801.3 million, from $889.8 million in 2007. Print advertising revenue at the Post in 2008 declined 17% to $410.4 million, from $496.2 million in 2007. The decline in 2008 is primarily the result of a large decrease in classified advertising revenue, along with reductions in retail, general, supplements and zones. Revenue generated by the Company’s online publishing activities, primarily washingtonpost.com, increased 7% to $108.3 million, from $100.8 million in 2007. Display online advertising revenue grew 17%, and online classified advertising revenue on washingtonpost.com declined 3%. Daily circulation at the Post declined 2.6%, and Sunday circulation declined 3.3%; average daily circulation totaled 633,100 (unaudited), and average Sunday circulation totaled 872,500 (unaudited).
The newspaper publishing division reported an operating loss of $192.7 million in 2008, compared to operating income of $66.4 million in 2007. In March 2008, the Company offered a Voluntary Retirement Incentive Program to certain employees of The Washington Post newspaper, and 231 employees accepted the offer. Early retirement program expense of $79.8 million was recorded in the second quarter of 2008, which is being funded mostly from the assets of the Company’s pension plans. Also, the Post made plans to close its College Park, MD, printing plant in the second half of 2009. The Company reassessed the useful life of the presses and the fair value of the plant building and recorded accelerated depreciation beginning in June 2008; as a result, accelerated depreciation of $22.3 million was recorded in 2008. Also in 2008, as a result of the challenging advertising environment at the Company’s community newspapers, The Herald and other operations included in the newspaper publishing division, the Company recorded goodwill impairment charges of $65.8 million. The decline in operating results is due to reduced revenues and the unusual or one-time operating expense items noted above; excluding these charges, however, the newspaper publishing division still incurred an operating loss in 2008 due to revenue declines. Newsprint expense was down 3% for 2008.
Television Broadcasting Division. Revenue for the television broadcasting division decreased 4% to $325.1 million in 2008, from $340.0 million in 2007. The revenue decline is the result of weaker advertising demand in most markets and product categories, offset by a $22.3 million increase in political advertising and $6.3 million in incremental summer Olympics-related advertising at the Company’s NBC affiliates. Excluding the increased political and Olympics-related advertising, revenues were $296.5 million in 2008, a 13% decline from 2007.
In 2008, the television broadcasting division recorded $6.9 million in noncash property, plant and equipment gains as a reduction to expense due to new digital equipment received at no cost from Sprint/Nextel in connection with an FCC mandate reallocating a portion of the broadcast spectrum. In July 2007, the Company entered into a transaction to sell and lease back its current Miami television station facility; a $9.5 million gain was recorded as a reduction to expense in 2007.
2009 FORM 10-K 45
Table of Contents
Operating income for 2008 declined 13% to $123.5 million, from $142.1 million in 2007. The decline in operating income is due primarily to overall weak advertising demand and the $9.5 million gain on the sale of property at the Miami television station in 2007, offset by the $6.9 million in noncash gains in 2008. Operating margin at the broadcast television division was 38% for 2008 and 42% for 2007; however, the operating margins in 2008 and 2007 would have been lower without the property, plant and equipment gains.
Competitive market position remained strong for the Company’s television stations. KSAT in San Antonio, WPLG in Miami and WJXT in Jacksonville ranked number one in the November 2008 ratings period, Monday through Friday, sign-on to sign-off; WDIV in Detroit and WKMG in Orlando ranked second; and KPRC in Houston ranked third.
Magazine Publishing Division. Revenue for the magazine publishing division totaled $250.9 million in 2008, a 13% decline from $288.4 million for 2007. The decrease in revenue is due to an advertising revenue decline of 14% at Newsweek as a result of fewer ad pages at the domestic edition and lower rates due to the previously announced circulation rate base reduction, from 3.1 million to 2.6 million. Subscription revenue also declined at the domestic edition in 2008 due to the rate base reduction. In February 2009, Newsweek announced another circulation rate base reduction at its domestic edition, from 2.6 million to 1.5 million by January 2010.
Newsweek offered a Voluntary Retirement Incentive Program to certain employees in the first quarter of 2008, and 117 employees accepted the offer. The early retirement program expense totaled $28.3 million, which is being funded mostly from the assets of the Company’s pension plans. In November 2008, Newsweek announced another Voluntary Retirement Incentive Program, which was offered to certain Newsweek employees.
The magazine publishing division had an operating loss in 2008 of $16.1 million, compared to operating income of $31.4 million for 2007, with the decline due primarily to $28.3 million in early retirement program expense and the revenue reductions discussed above, offset by a decline in subscription, manufacturing and distribution expenses at the domestic edition of Newsweek. The magazine publishing division reported an operating loss in 2008; operating margin was 11% in 2007, including the pension credit. Excluding the pension credit, the division would have reported an operating loss in 2007.
Other Businesses and Corporate Office. In October 2007, the Company acquired the outstanding stock of CourseAdvisor, Inc., an online lead generation provider. (CourseAdvisor is now known as Avenue100 Media Solutions.) In the fourth quarter of 2008, a goodwill and other intangible assets impairment charge of $69.7 million was recorded to write down the intangible assets of Avenue100 to their estimated fair values, which declined primarily due to lower than expected revenue and operating income growth.
In 2008, other businesses and corporate office included the expenses of the Company’s corporate office and the operating results of Avenue100. In 2007, other businesses and corporate office included the expenses associated with the Company’s corporate office and the operating results of Avenue100 from its October 2007 acquisition date through the end of 2007. Revenue for other businesses totaled $39.4 million in 2008, compared to revenue of $6.6 million in 2007 from the Avenue100 acquisition. Operating expenses were $148.4 million for 2008, from $42.2 million for 2007, due to the goodwill and other intangible assets impairment charge of $69.7 million and increased expenses at Avenue100. A corporate office early retirement program expense of $3.0 million recorded in the second quarter of 2008 also contributed to the overall expense increase in 2008.
Equity in (Losses) Earnings of Affiliates. The Company’s equity in losses of affiliates for 2008 was $7.8 million, compared to $6.0 million in earnings in 2007. Results in 2008 included $6.8 million in impairment charges at two of the Company’s affiliates. In the first quarter of 2007, the Company’s equity in earnings of affiliates included a gain of $8.9 million on the sale of land at the Company’s Bowater Mersey affiliate; however, operating losses at Bowater Mersey in 2007 largely offset the gain. The Company’s affiliate investments at the end of 2008 consisted primarily of a 49% interest in Bowater Mersey Paper Company Limited.
Non-Operating Items. The Company recorded other non-operating expense, net, of $2.2 million in 2008, compared to non-operating income, net, of $11.2 million in 2007. The 2008 non-operating expense, net, primarily consisted of $46.3 million in unrealized foreign currency losses, offset by $47.3 million in gains from sales of marketable equity securities. The 2007 non-operating income, net, included $8.8 million in unrealized foreign currency gains.
As noted above, a large part of the Company’s non-operating income (expense) is from unrealized foreign currency gains or losses arising from the translation of British pound and Australian dollar-denominated intercompany loans into U.S. dollars. The unrealized foreign currency losses in 2008 were the result of the significant strengthening of the U.S. dollar against the British pound and the Australian dollar; the unrealized foreign currency gains in 2007 were the result of the weakening of the U.S. dollar against the British pound and the Australian dollar.
A summary of non-operating (expense) income for the years ended December 30, 2008, and December 31, 2007, follows:
| (in millions) | 2008 | 2007 | |||||
| Gain on sales of marketable equity securities |
$ | 47.3 | $ | 0.4 | |||
| Foreign currency (losses) gains |
(46.3 | ) | 8.8 | ||||
| Impairment write-downs on investments |
(2.9 | ) | — | ||||
| Other (losses) gains |
(0.3 | ) | 2.0 | ||||
| Total |
$ | (2.2 | ) | $ | 11.2 | ||
The Company incurred net interest expense of $19.0 million in 2008, compared to $12.7 million in 2007. The increase is due to
46 THE WASHINGTON POST COMPANY
Table of Contents
a decline in interest income, as well as higher average borrowings in 2008 versus 2007. At December 28, 2008, the Company had $553.8 million in borrowings outstanding at an average interest rate of 4.1%; at December 30, 2007, the Company had $490.1 million in borrowings outstanding at an average interest rate of 5.3%.
Income Taxes. The effective tax rate was 54.7% for 2008 and 40.0% for 2007. The higher effective tax rate for 2008 is due to $31.1 million from nondeductible goodwill in connection with impairment charges recorded in 2008 and $9.5 million in noncash valuation allowances provided against deferred state and local income tax benefits, net of U.S. Federal income taxes; these were offset by a favorable $4.6 million provision to return adjustment from 2007. As previously discussed, results for 2007 included an additional $12.9 million in income tax expense related to the Company’s Bowater Mersey affiliate and a $6.3 million income tax benefit related to a change in certain state income tax laws enacted in the second quarter of 2007. Both of these were noncash items in 2007 that impacted the Company’s long-term net deferred income tax liabilities. Excluding the impact of these items, the effective tax rate for 2008 was 35.1%, compared to 37.7% for 2007. The decline is due to a reduction in state income taxes and a higher proportion of earnings in jurisdictions outside the U.S. with lower effective tax rates.
FINANCIAL CONDITION: CAPITAL RESOURCES AND LIQUIDITY
Acquisitions and Dispositions. The Company completed business acquisitions totaling approximately $26.1 million in 2009, $123.5 million in 2008 and $296.3 million in 2007. The assets and liabilities of the companies acquired have been recorded at their estimated fair values at the date of acquisition; the purchase price allocations mostly comprised goodwill and other intangibles, and property, plant and equipment. Any additional purchase consideration related to a 2008 acquisition is expected to be recorded as goodwill.
During 2009, the Company acquired three businesses for $22.9 million. Kaplan acquired one business in each of its International and Test Preparation divisions, and the newspaper division acquired a small local publication. The purchase price allocations for these acquisitions mostly comprised goodwill and other intangible assets. Also in 2009, the Company recorded $3.2 million of additional purchase consideration in connection with the achievement of certain operating results by a company acquired in 2007 and allocated the additional purchase consideration to goodwill.
In December 2009, the Company completed the sale of Newsweek’s Budget Travel, which was part of the Company’s magazine publishing segment, and recorded a gain.
During 2008, the Company acquired ten businesses within its education and newspaper segments, for a total of $93.1 million, financed with cash and $3.2 million in debt. Kaplan acquired nine businesses in its International, Test Preparation and Ventures divisions. These included Kaplan International’s acquisition of a majority interest in Shanghai Kai Bo Education Management Investment Co., Ltd. (“Kaplan China”), a provider of education in China that offers preparation courses for entry to U.K. universities, along with degree and professional training programs at campuses throughout China. In 2007, Kaplan purchased a 40% interest in Kaplan China. In the first quarter of 2008, Kaplan exercised an option to increase its investment in Kaplan China to an 85% majority interest. The transaction was completed in November 2008, and Kaplan China’s results from the transaction date forward have been included in the Company’s consolidated financial statements. The purchase price allocations for these acquisitions mostly comprised goodwill and other intangible assets.
Also in 2008, the cable television division acquired subscribers primarily in the Mississippi area for $15.3 million. The purchase price allocations for these transactions mostly comprised intangible assets and property, plant and equipment.
In connection with a 2008 acquisition, additional purchase consideration of approximately $1.5 million was contingent on the achievement of certain future operating results and was not included in the Company’s purchase accounting as of December 28, 2008. During 2008, the Company recorded $15.1 million of additional purchase consideration in connection with the achievement of certain operating results by a company acquired in 2007 and allocated the additional purchase consideration to goodwill.
During 2007, the Company acquired 11 businesses within its education, newspaper and other businesses and corporate office segments for a total of $292.0 million, financed with cash and $2.0 million in debt. Kaplan acquired 9 businesses in its International, Test Preparation and Ventures divisions, of which the largest two were Kaplan Ventures’ acquisition of EduNeering Holdings, Inc., a Princeton, NJ-based provider of knowledge management solutions for organizations in the pharmaceutical, medical device, health care, energy and manufacturing sectors; and Kaplan International’s acquisition of the education division of Financial Services Institute of Australasia. In October 2007, the Company acquired the outstanding stock of Avenue100 Media Solutions (formerly CourseAdvisor, Inc.), a premier online lead generation provider, headquartered in Wakefield, MA. Through its search engine marketing expertise and proprietary technology platform, Avenue100 generates student leads for the postsecondary education market. Avenue100 operates as an independent subsidiary of the Company. The purchase price allocations for these acquisitions mostly comprised goodwill and other intangible assets. Also in 2007, the cable television division acquired subscribers in the Boise, ID, area for $4.3 million. Most of the purchase price for this transaction was allocated to indefinite-lived intangible assets and property, plant and equipment.
In connection with certain 2007 acquisitions, additional purchase consideration of approximately $22 million was contingent on the achievement of certain future operating results; such amounts were largely funded in escrow in 2007 and were not included in the Company’s purchase accounting as of December 30, 2007.
In July 2007, the television broadcasting division entered into a transaction to sell and lease back its current Miami television station
2009 FORM 10-K 47
Table of Contents
facility; a $9.5 million gain was recorded as a reduction to expense in the third quarter. An additional $1.9 million deferred gain was amortized over the leaseback period. The television broadcasting division purchased land and built a new Miami television station facility that was completed in 2009.
Capital Expenditures. During 2009, the Company’s capital expenditures totaled $257.8 million. The Company’s capital expenditures for 2009, 2008 and 2007 are disclosed in Note Q to the consolidated financial statements. The Company estimates that its capital expenditures will be in the range of $280 million to $320 million in 2010.
Investments in Marketable Equity Securities. At January 3, 2010, the fair value of the Company’s investments in marketable equity securities was $353.9 million, which includes $247.5 million in Berkshire Hathaway Inc. Class A and B common stock and $106.4 million in the common stock of a publicly traded education company.
At January 3, 2010, and December 28, 2008, the gross unrealized gain related to the Company’s Berkshire stock investment totaled $90.2 million and $72.4 million, respectively. During 2009, the Company invested $10.8 million in the Class B common stock of Berkshire. During 2008, the Company sold 420 and 5,975 shares of Berkshire Class A and Class B common stock, respectively. Total proceeds from the sale were $64.4 million, and the net realized gains were $26.0 million. The gross unrealized gain related to the Company’s other marketable equity security investments totaled $40.6 million and $48.7 million at January 3, 2010, and December 28, 2008, respectively.
Common Stock Repurchases and Dividend Rate. During 2009, 2008 and 2007, the Company repurchased 145,040 shares, 167,642 shares and 54,506 shares, respectively, of its Class B common stock at a cost of $61.0 million, $99.0 million and $42.0 million, respectively. At January 3, 2010, the Company had authorization from the Board of Directors to purchase up to 100,916 shares of Class B common stock. In January 2010, the Board of Directors increased the authorization to a total of 750,000 shares of Class B common stock. The annual dividend rate for 2010 was increased to $9.00 per share, from $8.60 per share in 2009 and 2008.
Liquidity. At January 3, 2010, the Company had $477.7 million in cash and cash equivalents, compared to $390.5 million at December 28, 2008. As of January 3, 2010, and December 28, 2008, the Company had money market investments of $327.8 million and $99.1 million, respectively, that are classified as cash and cash equivalents in the Company’s consolidated financial statements.
At December 28, 2008, the Company had $150.0 million in commercial paper borrowings outstanding at an average interest rate of 0.2% with various maturities through the first quarter of 2009. In addition, the Company had outstanding $399.9 million of 5.5% unsecured notes due February 15, 2009, and $3.9 million in other debt. On January 30, 2009, the Company completed the issuance of $400.0 million of 7.25% unsecured notes due February 1, 2019. The interest is payable semi-annually on February 1 and August 1, beginning August 1, 2009. The Company used the net proceeds from the sale of the notes and other cash to repay the Company’s $400.0 million unsecured notes that matured on February 15, 2009.
During 2009, the Company’s borrowings, net of repayments, decreased by $154.5 million, and the Company’s cash and cash equivalents increased by $87.2 million. There were no commercial paper borrowings outstanding at January 3, 2010.
The Company’s $500 million commercial paper program continues to serve as a significant source of short-term liquidity. The $500 million revolving credit facility that expires in August 2011 supports the issuance of the Company’s short-term commercial paper and provides for general corporate purposes. The Company continued to have access to and borrowed funds under its commercial paper program and has not borrowed funds under its revolving credit facility.
The Company’s credit ratings were affirmed by the rating agencies in October 2008 with a change in ratings outlook from stable to negative. In May 2009, Standard & Poor’s placed the Company’s “A+” long-term corporate credit and senior unsecured ratings, and the Company’s “A-1” short-term commercial paper rating on CreditWatch with negative implications. In June 2009, Standard & Poor’s lowered its long-term rating to “A” from “A+,” affirmed the “A-1” short-term rating and removed both ratings from CreditWatch. In December 2009, Standard & Poor’s revised the Company’s long-term outlook to stable. Moody’s rating outlook for the Company remains negative. The Company’s current credit ratings are as follows:
| Moody’s | Standard & Poor’s | |||
| Long-term |
A1 | A | ||
| Short-term |
Prime-1 | A-1 |
During 2009 and 2008, the Company had average borrowings outstanding of approximately $426.7 million and $492.3 million, respectively, at average annual interest rates of approximately 6.9% and 4.9%, respectively. The Company incurred net interest costs on its borrowings of $29.0 million and $19.0 million, respectively, during 2009 and 2008.
At January 3, 2010, and December 28, 2008, the Company had working capital of $398.5 million and $257.3 million, respectively. The Company maintains working capital levels consistent with its underlying business requirements and consistently generates cash from operations in excess of required interest or principal payments.
The Company’s net cash provided by operating activities, as reported in the Company’s Consolidated Statements of Cash Flows, was $653.0 million in 2009, compared to $535.8 million in 2008.
48 THE WASHINGTON POST COMPANY
Table of Contents
The Company expects to fund its estimated capital needs primarily through existing cash balances and internally generated funds and, to a lesser extent, through commercial paper borrowings. In management’s opinion, the Company will have ample liquidity to meet its various cash needs in 2010.
The following reflects a summary of the Company’s contractual obligations as of January 3, 2010:
| (in thousands) |
2010 |
2011 |
2012 |
2013 |
2014 |
Thereafter | Total | ||||||||||||||
| Debt and interest |
$ | 32,059 | $ | 29,000 | $ | 29,000 | $ | 29,000 | $ | 29,000 | $ | 530,500 | $ | 678,559 | |||||||
| Programming purchase commit- |
178,149 | 171,227 | 133,298 | 102,968 | 57,505 | 807 | 643,954 | ||||||||||||||
| Operating leases |
140,665 | 119,537 | 104,202 | 91,206 | 75,890 | 310,135 | 841,635 | ||||||||||||||
| Other purchase obligations(2) |
145,957 | 78,822 | 48,159 | 19,690 | 15,469 | 242 | 308,339 | ||||||||||||||
| Long-term liabilities(3) |
5,654 | 5,988 | 6,344 | 6,729 | 6,993 | 53,869 | 85,577 | ||||||||||||||
| Total |
$ | 502,484 | $ | 404,574 | $ | 321,003 | $ | 249,593 | $ | 184,857 | $ | 895,553 | $ | 2,558,064 | |||||||
| (1) | Includes commitments for the Company’s television broadcasting and cable television businesses that are reflected in the Company’s consolidated financial statements and commitments to purchase programming to be produced in future years. |
| (2) | Includes purchase obligations related to newsprint contracts, printing contracts, employment agreements, circulation distribution agreements, capital projects and other legally binding commitments. Other purchase orders made in the ordinary course of business are excluded from the table above. Any amounts for which the Company is liable under purchase orders are reflected in the Company’s Consolidated Balance Sheets as accounts payable and accrued liabilities. |
| (3) | Primarily made up of postretirement benefit obligations other than pensions. The Company has other long-term liabilities excluded from the table above, including obligations for deferred compensation, long-term incentive plans and long-term deferred revenue. |
Other. The Company does not have any off-balance-sheet arrangements or financing activities with special-purpose entities (SPEs). Transactions with related parties, as discussed in Note E to the Company’s consolidated financial statements, are in the ordinary course of business and are conducted on an arm’s-length basis.
CRITICAL ACCOUNTING POLICIES AND ESTIMATES
The preparation of financial statements in conformity with generally accepted accounting principles requires management to make estimates and judgments that affect the amounts reported in the financial statements. On an ongoing basis, the Company evaluates its estimates and assumptions. The Company bases its estimates on historical experience and other assumptions believed to be reasonable under the circumstances, the results of which form the basis for making judgments about the carrying value of assets and liabilities that are not readily apparent from other sources. Actual results could differ from these estimates.
An accounting policy is considered to be critical if it is important to the Company’s financial condition and results and if it requires management’s most difficult, subjective and complex judgments in its application. For a summary of all of the Company’s significant accounting policies, see Note B to the Company’s consolidated financial statements.
Revenue Recognition, Trade Accounts Receivable, Sales Returns and Allowance for Doubtful Accounts. Education tuition revenue is recognized ratably over the period of instruction as services are delivered to students, net of any refunds, corporate discounts, scholarships and employee tuition discounts. In 2009, Kaplan Higher Education modified its method of recognizing revenue ratably over the period of instruction as services are delivered to students from a weekly convention to a daily convention, on a prospective basis. At Kaplan’s Test Preparation and International divisions, estimates of average student course length are developed for each course, along with estimates for the anticipated level of student drops and refunds from test performance guarantees, and these estimates are evaluated on an ongoing basis and adjusted as necessary. As Kaplan’s businesses and related course offerings have expanded, including distance-learning businesses and contracts with school districts as part of its K12 business, the complexity and significance of management’s estimates have increased.
Revenue from media advertising is recognized, net of agency commissions, when the underlying advertisement is published or broadcast. Revenues from newspaper and magazine subscriptions and retail sales are recognized upon the later of delivery or cover date, with adequate provision made for anticipated sales returns. The Company records, as a reduction of revenue, the estimated impact of such returns. The Company bases its estimates for sales returns on historical experience and has not experienced significant fluctuations between estimated and actual return activity.
Accounts receivable have been reduced by an allowance for amounts that may be uncollectible in the future. This estimated allowance is based primarily on the aging category, historical trends and management’s evaluation of the financial condition of the customer. Accounts receivable also have been reduced by an estimate of advertising rate adjustments and discounts, based on estimates of advertising volumes for contract customers who are eligible for advertising rate adjustments and discounts.
Goodwill and Other Intangible Assets. The Company has a significant amount of goodwill and indefinite-lived intangible assets that are reviewed at least annually for possible impairment.
| (in millions) | January 3, 2010 |
December 28, 2008 |
||||||
| Goodwill and indefinite-lived intangible assets |
$ | 1,963.5 | $ | 1,921.5 | ||||
| Total assets |
$ | 5,186.2 | $ | 5,158.4 | ||||
| Percentage of goodwill and indefinite-lived intangible assets to total assets |
38 | % | 37 | % | ||||
The Company performs its annual goodwill and intangible assets impairment test as of November 30. Goodwill and other intangible assets are reviewed for possible impairment between annual tests if an event occurred or circumstances changed that would more likely than not reduce the fair value of the reporting unit or other intangible assets below its carrying value. The Company tests its goodwill at the reporting unit level, which is an operating segment or one level below an operating segment. The Company tests the goodwill for impairment using a two-step process. The first step of the goodwill impairment test compares the estimated fair value of a reporting unit
2009 FORM 10-K 49
Table of Contents
with its carrying amount, including goodwill. This step is performed to identify potential impairment, which occurs when the carrying amount of the reporting unit exceeds its estimated fair value. The second step of the goodwill impairment test is only performed when there is a potential impairment and is performed to measure the amount of impairment loss at the reporting unit. During the second step, the Company allocates the estimated fair value of the reporting unit to all of the assets and liabilities of the unit (including any unrecognized intangible assets). The excess of the fair value of the reporting unit over the amounts assigned to its assets and liabilities is the implied fair value of goodwill. The amount of the goodwill impairment is the difference between the carrying value of the reporting unit’s goodwill and the implied fair value determined during the second step. The other intangible assets impairment test compares the fair value of the asset with its carrying value. The Company records an impairment loss if the carrying value of the other intangible assets exceeds the fair value of the assets for the difference in the values.
The education division completed a reorganization of its organizational and internal structure during the third quarter of 2009. As a result, the education division reorganized its operations for the purpose of making operating decisions and assessing performance into four operating segments: Higher Education, Test Preparation, Kaplan International and Kaplan Ventures. The reorganization significantly changed the composition of the reporting units within the education division and resulted in the reassignment of the goodwill to the affected reporting units using a relative fair value approach.
The fair value of the previous reporting units and components transferred were generally determined utilizing a discounted cash flow model and, where appropriate, a market value approach to supplement the discounted cash flow model. The Company made estimates and assumptions regarding future cash flows, discount rates, long-term growth rates and market values to determine each reporting unit and component’s estimated fair value.
The assumptions about future cash flows and growth rates were based on forecasts and long-term business plans of each reporting unit and component. Such assumptions took into account numerous factors including historical experience; anticipated economic conditions; changes in the reporting unit and component’s cost structures; cost savings from recent restructuring activities and other initiatives; and expected revenues from current and future enrollments at the universities, campuses and education centers.
The discount rate assumptions for each reporting unit and component took into account the Company’s assessment of the risks inherent in the future cash flows of the respective reporting unit and component and the weighted-average cost of capital of market participants in businesses similar to each reporting unit and component.
The key assumptions used by the Company were as follows:
| • | Expected cash flows underlying the education division’s business plans for the periods 2009 through 2013. |
| • | Cash flows beyond 2013 were projected to grow at a long-term growth rate, which the Company estimated between 3% and 6% for each reporting unit and component. |
| • | The Company used a discount rate of 10.5% to 20% to risk adjust the cash flow projections in determining the estimated fair value. |
The effect of the reallocation of goodwill is included in Note G, “Goodwill and Other Intangible Assets,” of the consolidated financial statements of the Company for fiscal year 2009. Each postreorganization reportable segment is also a reporting unit, except for Kaplan Ventures, which consists of seven reporting units.
As a result of the reassignment, the Company performed an interim review of the carrying value of goodwill at the education division for possible impairment on a prereorganization and post-reorganization basis. The fair value of the prereorganization reporting units each exceeded their respective carrying value by a margin in excess of 15%. On a postreorganization basis, the estimated fair value of the reporting units within the education division with significant goodwill balances (Higher Education, Test Preparation and Kaplan International) exceeded their respective carrying values by a margin in excess of 50%.
Following the reorganization, two reporting units (Kaplan EduNeering and Kaplan Compliance Solutions, previously within Kaplan Professional) newly included in the Kaplan Ventures operating segment failed step one of the interim goodwill impairment review, and the Company performed a step two analysis. The Company recorded a goodwill and other long-lived assets impairment charge of $25.4 million related to these two reporting units. Following the impairment, the remaining goodwill balances at these two reporting units as of January 3, 2010, totaled $22.8 million.
The Company had 18 reporting units as of January 3, 2010. The reporting units with significant goodwill balances as of January 3, 2010, were as follows, representing 91% of the total goodwill of the Company:
| (in millions) | Goodwill | ||
| Education |
|||
| Higher education |
$ | 335.2 | |
| Test preparation |
236.8 | ||
| Kaplan international |
433.0 | ||
| Cable television |
85.5 | ||
| Television broadcasting |
203.2 | ||
| Total |
$ | 1,293.7 | |
As of November 30, 2009, in connection with the Company’s annual impairment testing, the Company used a discounted cash flow model, and where appropriate, a market value approach was also utilized to supplement the discounted cash flow model to determine the estimated fair value of its reporting units. The Company made estimates and assumptions regarding future cash flows, discount rates, long-term growth rates and market values to determine each reporting unit’s estimated fair value. The
50 THE WASHINGTON POST COMPANY
Table of Contents
methodology used to estimate the fair value of the Company’s reporting units on November 30, 2009, was consistent with the one used during our 2008 annual goodwill impairment test. The Company made changes to certain of its assumptions utilized in the discounted cash flow models for 2009 compared with the prior year due largely to the adverse economic environment and its impact on our businesses. The key assumptions used by the Company were as follows:
| • | Expected cash flows underlying the Company’s business plans for the periods 2010 through 2014. The expected cash flows took into account historical growth rates, but also included the adverse effect of the overall economic downturn at some of the Company’s businesses, particularly at the Company’s advertising-related businesses. Expected cash flows also reflected the anticipated savings from restructuring plans at the newspaper publishing, magazine publishing and education divisions’ reporting units, early retirement plans at the newspaper and magazine publishing reporting units and other initiatives. |
| • | Cash flows beyond 2014 were projected to grow at a long-term growth rate, which the Company estimated between 1% and 6% for each reporting unit. |
| • | The Company used a discount rate of 8.3% to 18.5% to risk adjust the cash flow projections in determining the estimated fair value. |
The fair value of each of the reporting units exceeded its respective carrying value as of November 30, 2009.
In 2008, the Company recorded goodwill and other intangible asset impairment charges at three of its reporting units totaling $135.4 million. The remaining goodwill balances at these three reporting units as of January 3, 2010 totaled $38.4 million. Combined, the goodwill balance of $61.2 million at the five reporting units that have been subject to impairment charges in 2009 and 2008 represents less than 5% of the Company’s total goodwill balance of $1,423.5 million as of January 3, 2010. There exists a reasonable possibility that a decrease in the projected cash flows or long-term growth rate, or an increase in the discount rate assumptions used in the discounted cash flow model of these reporting units, could result in additional impairment charges.
The estimated fair value of the Company’s reporting units with significant goodwill balances exceeded their respective carrying values by a margin in excess of 25%. While less likely, additional impairment charges could occur at these reporting units as well, given the inherent variability in projecting future operating performance.
Pension Costs. Excluding special termination benefits related to early retirement programs, the Company’s net pension credit was $8.1 million, $25.7 million and $22.3 million for 2009, 2008 and 2007, respectively. The Company’s pension benefit costs are actuarially determined and are impacted significantly by the Company’s assumptions related to future events, including the discount rate, expected return on plan assets and rate of compensation increases. The Company’s expected return on plan assets assumption remained at 6.5% for fiscal years 2009, 2008 and 2007. At December 31, 2006, the Company raised its discount rate assumption from 5.75% to 6.0%, which resulted in the pension credit for 2007 increasing slightly for 2007 compared to 2006. At December 30, 2007, the discount rate assumption remained at 6.0%; the pension credit increased by $3.4 million as a result of higher than expected investment returns on plan assets in 2007. At December 28, 2008, the Company reduced its discount rate assumption from 6.0% to 5.75% and changed to a more current Mortality Table. The pension credit declined substantially in 2009 largely due to significant investment losses in 2008. At January 3, 2010, the Company increased its discount rate assumption from 5.75% to 6.0%. The Company estimates that it will record a net pension credit of approximately $2.0 million in 2010. This amount is lower than in 2009 as a result of significant investment losses on pension plan assets in 2008, offset to some extent by the investment gains in 2009. The Company’s actual return (loss) on plan assets was 14.7% in 2009, (25.0%) in 2008 and 7.7% in 2007, based on plan assets at the beginning of each year. For each 1% increase or decrease to the Company’s assumed expected return on plan assets, the pension credit increases or decreases by approximately $15 million. For each 1% increase or decrease to the Company’s assumed discount rate, the pension credit increases or decreases by approximately $10 million.
Note L to the Company’s consolidated financial statements provides additional details surrounding pension costs and related assumptions.
Income Tax Valuation Allowances. Deferred income taxes arise from temporary differences between the tax and financial statement recognition of assets and liabilities. In evaluating its ability to recover deferred tax assets within the jurisdiction from which they arise, the Company considers all available positive and negative evidence, including scheduled reversals of deferred tax liabilities, projected future taxable income, tax planning strategies and recent financial operations. These assumptions require significant judgment about forecasts of future taxable income.
As of January 3, 2010, the Company had state income tax net operating loss carryforwards of $525.6 million, which will expire at various dates from 2010 through 2029. Also at January 3, 2010, the Company had approximately $31.0 million of foreign income tax loss carryforwards, of which $28.0 million may be carried forward indefinitely and $3.0 million that, if unutilized, will start to expire in 2012. At January 3, 2010, the Company has established approximately $26.2 million in valuation allowances against these deferred state and foreign income taxes, net of U.S. Federal income taxes, as the Company believes that it is more likely than not that the benefit from certain state and foreign net operating loss carryforwards will not be realized. The Company has established valuation allowances against state income tax benefits recognized, without considering potentially offsetting deferred tax liabilities established with respect to prepaid pension cost and goodwill. Prepaid pension cost and goodwill have not been considered a source of future taxable income for realizing deferred tax benefits recognized since these temporary differences are not likely to reverse in the foreseeable future. The valuation allowances
2009 FORM 10-K 51
Table of Contents
established against state income tax benefits recorded may increase or decrease within the next 12 months, based on operating results or the market value of investment holdings; as a result, the Company is unable to estimate the potential tax impact, given the uncertain operating and market environment.
Kaplan Stock Compensation. The Kaplan stock option plan was adopted in 1997 and initially reserved 15%, or 150,000 shares, of Kaplan’s common stock for awards to be granted under the plan to certain members of Kaplan management. Under the provisions of this plan, options are issued with an exercise price equal to the estimated fair value of Kaplan’s common stock, and options vest ratably over the number of years specified (generally four to five years) at the time of the grant. Upon exercise, an option holder may receive Kaplan shares or cash equal to the difference between the exercise price and the then fair value.
The amount of compensation expense varies directly with the estimated fair value of Kaplan’s common stock, the number of options and shares outstanding and the key assumptions used to determine the fair value of Kaplan stock options. The estimated fair value of Kaplan’s common stock is based upon a comparison of operating results and public market values of other education companies and is determined by the Company’s compensation committee of the Board of Directors (the “committee”), with input from management. Over the past several years, the value of education companies has fluctuated significantly, and consequently, there has been significant volatility in the amounts recorded as expense each year, as well as on a quarterly basis.
In November 2008, Kaplan’s then chief executive officer resigned. The executive exercised 40,805 Kaplan stock options, sold 6,572 Kaplan shares and forfeited 21,526 unvested Kaplan stock options at the time of his resignation. A Kaplan senior manager continues to hold the remaining 2,000 outstanding Kaplan stock options (representing about 0.2% of Kaplan’s common stock), which expire in 2011. In January 2010, the committee set the fair value price at $1,975 per share. Option holders have a 30-day window in which to exercise at this price, after which time the committee has the right to determine a new price in the event of an exercise. No options were awarded or exercised during 2009 or the first two months of 2010.
The committee awarded to a senior manager of Kaplan shares equal in value to $4.8 million for the 2007 fiscal year, and the expense of this award was recorded in the Company’s results of operations for the relevant fiscal year. As a result, in the first quarter of 2008, 1,778 Kaplan shares were issued related to the 2007 Kaplan share awards. In the fourth quarter of 2007, a Kaplan senior manager exercised Kaplan stock options and received 1,750 Kaplan shares that remain outstanding at January 3, 2010. In February 2010 and 2009, a Kaplan senior manager was granted 2,278 and 1,176 shares, respectively, of Kaplan restricted stock that vest over a three-year period.
Kaplan recorded stock compensation expense of $0.9 million for 2009, compared to a credit of $7.8 million for 2008 and expense of $41.3 million for 2007. There were no payouts in 2009. In 2008 and 2007, total net payouts were $85.1 million and $8.1 million, respectively. At December 31, 2009, the Company’s accrual balance related to Kaplan stock-based compensation totaled $9.2 million. Note K to the Company’s consolidated financial statements provides additional details surrounding Kaplan stock compensation.
Recent Accounting Pronouncements. See Note B to the Company’s consolidated financial statements for a discussion of recent accounting pronouncements.
52 THE WASHINGTON POST COMPANY
Table of Contents
MANAGEMENT’S REPORT ON INTERNAL CONTROL OVER FINANCIAL REPORTING
Management of The Washington Post Company is responsible for establishing and maintaining adequate internal control over financial reporting (as defined in Exchange Act Rules 13a-15(f) and 15d-15(f)). The Company’s internal control over financial reporting is designed to provide reasonable assurance regarding the reliability of financial reporting and the preparation of financial statements for external purposes in accordance with accounting principles generally accepted in the United States of America.
The Company’s internal control over financial reporting includes those policies and procedures that (i) pertain to the maintenance of records that, in reasonable detail, accurately and fairly reflect the transactions and dispositions of the assets of the Company; (ii) provide reasonable assurance that transactions are recorded as necessary to permit preparation of financial statements in accordance with generally accepted accounting principles, and that receipts and expenditures of the Company are being made only in accordance with authorizations of management and directors of the Company; and (iii) provide reasonable assurance regarding prevention or timely detection of unauthorized acquisition, use or disposition of the Company‘s assets that could have a material effect on the financial statements.
Because of its inherent limitations, internal control over financial reporting may not prevent or detect misstatements. Also, projections of any evaluation of effectiveness to future periods are subject to the risk that controls may become inadequate because of changes in conditions, or that the degree of compliance with the policies or procedures may deteriorate.
Our management assessed the effectiveness of our internal control over financial reporting as of January 3, 2010. In making this assessment, our management used the criteria set forth by the Committee of Sponsoring Organizations of the Treadway Commission (“COSO”) in Internal Control — Integrated Framework. Our management has concluded that, as of January 3, 2010, our internal control over financial reporting was effective based on these criteria.
The effectiveness of our internal control over financial reporting as of January 3, 2010 has been audited by PricewaterhouseCoopers LLP, an independent registered public accounting firm, as stated in their report included herein.
2009 FORM 10-K 53
Table of Contents
REPORT OF INDEPENDENT REGISTERED PUBLIC ACCOUNTING FIRM
To the Board of Directors and
Shareholders of The Washington Post Company:
In our opinion, the consolidated financial statements referred to under Item 15 (1) on page 35 and listed in the index on page 37 present fairly, in all material respects, the financial position of The Washington Post Company and its subsidiaries at January 3, 2010 and December 28, 2008, and the results of their operations and their cash flows for each of the three years in the period ended January 3, 2010 in conformity with accounting principles generally accepted in the United States of America. Also in our opinion, the Company maintained, in all material respects, effective internal control over financial reporting as of January 3, 2010, based on criteria established in Internal Control — Integrated Framework issued by the Committee of Sponsoring Organizations of the Treadway Commission (COSO). The Company’s management is responsible for these financial statements, for maintaining effective internal control over financial reporting and for its assessment of the effectiveness of internal control over financial reporting, included in Management’s Report on Internal Control Over Financial Reporting appearing under Item 9A. Our responsibility is to express opinions on these financial statements, and on the Company’s internal control over financial reporting based on our integrated audits. We conducted our audits in accordance with the standards of the Public Company Accounting Oversight Board (United States). Those standards require that we plan and perform the audits to obtain reasonable assurance about whether the financial statements are free of material misstatement and whether effective internal control over financial reporting was maintained in all material respects. Our audits of the financial statements included examining, on a test basis, evidence supporting the amounts and disclosures in the financial statements, assessing the accounting principles used and significant estimates made by management and evaluating the overall financial statement presentation. Our audit of internal control over financial reporting included obtaining an understanding of internal control over financial reporting, assessing the risk that a material weakness exists and testing and evaluating the design and operating effectiveness of internal control based on the assessed risk. Our audits also included performing such other procedures as we considered necessary in the circumstances. We believe that our audits provide a reasonable basis for our opinions.
A company’s internal control over financial reporting is a process designed to provide reasonable assurance regarding the reliability of financial reporting and the preparation of financial statements for external purposes in accordance with generally accepted accounting principles. A company’s internal control over financial reporting includes those policies and procedures that (i) pertain to the maintenance of records that, in reasonable detail, accurately and fairly reflect the transactions and dispositions of the assets of the company; (ii) provide reasonable assurance that transactions are recorded as necessary to permit preparation of financial statements in accordance with generally accepted accounting principles and that receipts and expenditures of the company are being made only in accordance with authorizations of management and directors of the company and (iii) provide reasonable assurance regarding prevention or timely detection of unauthorized acquisition, use or disposition of the company’s assets that could have a material effect on the financial statements.
Because of its inherent limitations, internal control over financial reporting may not prevent or detect misstatements. Also, projections of any evaluation of effectiveness to future periods are subject to the risk that controls may become inadequate because of changes in conditions, or that the degree of compliance with the policies or procedures may deteriorate.
PricewaterhouseCoopers LLP
McLean, Virginia
March 1, 2010
54 THE WASHINGTON POST COMPANY
Table of Contents
CONSOLIDATED STATEMENTS OF INCOME
| Fiscal Year Ended | ||||||||||||
| (in thousands, except per share amounts) | January 3, 2010 |
December 28, 2008 |
December 30, 2007 |
|||||||||
| Operating Revenues |
||||||||||||
| Education |
$ | 2,636,638 | $ | 2,331,580 | $ | 2,030,889 | ||||||
| Advertising |
858,109 | 1,083,084 | 1,234,643 | |||||||||
| Circulation and subscriber |
932,402 | 901,898 | 817,807 | |||||||||
| Other |
142,582 | 145,018 | 97,067 | |||||||||
| 4,569,731 | 4,461,580 | 4,180,406 | ||||||||||
| Operating Costs and Expenses |
||||||||||||
| Operating |
2,002,938 | 2,023,816 | 1,882,984 | |||||||||
| Selling, general and administrative |
2,024,901 | 1,839,986 | 1,581,596 | |||||||||
| Depreciation of property, plant and equipment |
295,871 | 265,606 | 221,239 | |||||||||
| Amortization of intangible assets |
26,642 | 22,525 | 17,571 | |||||||||
| Impairment of goodwill and other long-lived assets |
25,387 | 135,439 | — | |||||||||
| 4,375,739 | 4,287,372 | 3,703,390 | ||||||||||
| Income from Operations |
193,992 | 174,208 | 477,016 | |||||||||
| Equity in (losses) earnings of affiliates |
(29,421 | ) | (7,837 | ) | 5,975 | |||||||
| Interest income |
2,597 | 5,672 | 11,338 | |||||||||
| Interest expense |
(31,565 | ) | (24,658 | ) | (24,046 | ) | ||||||
| Other income (expense), net |
13,197 | (2,189 | ) | 11,182 | ||||||||
| Income Before Income Taxes |
148,800 | 145,196 | 481,465 | |||||||||
| Provision for Income Taxes |
57,600 | 79,400 | 192,500 | |||||||||
| Net Income |
91,200 | 65,796 | 288,965 | |||||||||
| Net Loss (Income) Attributable to Noncontrolling Interests |
1,574 | (74 | ) | (358 | ) | |||||||
| Net Income Attributable to The Washington Post Company |
92,774 | 65,722 | 288,607 | |||||||||
| Redeemable Preferred Stock Dividends |
(928 | ) | (946 | ) | (952 | ) | ||||||
| Net Income Available for Common Shares |
$ | 91,846 | $ | 64,776 | $ | 287,655 | ||||||
| Basic Earnings per Common Share |
$ | 9.78 | $ | 6.89 | $ | 30.31 | ||||||
| Diluted Earnings per Common Share |
$ | 9.78 | $ | 6.87 | $ | 30.19 | ||||||
CONSOLIDATED STATEMENTS OF COMPREHENSIVE INCOME (LOSS)
| Fiscal Year Ended | ||||||||||||
| (in thousands) | January 3, 2010 |
December 28, 2008 |
December 30, 2007 |
|||||||||
| Net Income |
$ | 91,200 | $ | 65,796 | $ | 288,965 | ||||||
| Other Comprehensive Income (Loss) |
||||||||||||
| Foreign currency translation adjustments |
33,550 | (51,172 | ) | 26,653 | ||||||||
| Change in net unrealized gain on available-for-sale securities |
9,742 | (87,513 | ) | 115,269 | ||||||||
| Pension and other postretirement plan adjustments |
130,492 | (630,574 | ) | 42,777 | ||||||||
| Less reclassification adjustment for realized gains included in net income |
— | (47,308 | ) | (394 | ) | |||||||
| 173,784 | (816,567 | ) | 184,305 | |||||||||
| Income tax (expense) benefit related to other comprehensive income (loss) |
(58,592 | ) | 311,351 | (67,330 | ) | |||||||
| 115,192 | (505,216 | ) | 116,975 | |||||||||
| Comprehensive Income (Loss) |
$ | 206,392 | $ | (439,420 | ) | $ | 405,940 | |||||
| Comprehensive loss (income) attributable to the noncontrolling interest |
1,574 | (74 | ) | (358 | ) | |||||||
| Total Comprehensive Income (Loss) Attributable to The Washington Post Company |
$ | 207,966 | $ | (439,494 | ) | $ | 405,582 | |||||
See accompanying Notes to Consolidated Financial Statements.
2009 FORM 10-K 55
Table of Contents
CONSOLIDATED BALANCE SHEETS
| As of | ||||||||
| (in thousands) | January 3, 2010 |
December 28, 2008 |
||||||
| Assets |
||||||||
| Current Assets |
||||||||
| Cash and cash equivalents |
$ | 477,673 | $ | 390,509 | ||||
| Investments in marketable equity securities and other investments |
385,001 | 357,337 | ||||||
| Accounts receivable, net |
430,669 | 479,361 | ||||||
| Deferred income taxes |
14,633 | 10,967 | ||||||
| Inventories |
16,019 | 40,213 | ||||||
| Other current assets |
64,069 | 73,153 | ||||||
| Total Current Assets |
1,388,064 | 1,351,540 | ||||||
| Property, Plant and Equipment, Net |
1,239,692 | 1,302,334 | ||||||
| Investments in Affiliates |
54,722 | 76,437 | ||||||
| Goodwill, Net |
1,423,462 | 1,390,157 | ||||||
| Indefinite-Lived Intangible Assets, Net |
540,012 | 531,323 | ||||||
| Amortized Intangible Assets, Net |
71,314 | 94,260 | ||||||
| Prepaid Pension Cost |
409,445 | 346,325 | ||||||
| Deferred Charges and Other Assets |
59,495 | 66,058 | ||||||
| Total Assets |
$ | 5,186,206 | $ | 5,158,434 | ||||
| Liabilities and Shareholders’ Equity |
||||||||
| Current Liabilities |
||||||||
| Accounts payable and accrued liabilities |
$ | 555,478 | $ | 544,920 | ||||
| Income taxes payable |
8,048 | 7,499 | ||||||
| Deferred revenue |
422,998 | 388,007 | ||||||
| Short-term borrowings |
3,059 | 153,822 | ||||||
| Total Current Liabilities |
989,583 | 1,094,248 | ||||||
| Postretirement Benefits Other Than Pensions |
73,672 | 70,992 | ||||||
| Accrued Compensation and Related Benefits |
210,640 | 210,058 | ||||||
| Other Liabilities |
134,783 | 135,163 | ||||||
| Deferred Income Taxes |
422,838 | 360,359 | ||||||
| Long-Term Debt |
396,236 | 400,003 | ||||||
| Total Liabilities |
2,227,752 | 2,270,823 | ||||||
| Redeemable Noncontrolling Interest |
6,907 | 17,360 | ||||||
| Redeemable Preferred Stock, Series A, $1 par value, with a redemption and liquidation value of $1,000 per share; 23,000 shares authorized; 11,526 and 11,826 shares issued and outstanding |
11,526 | 11,826 | ||||||
| Preferred Stock, $1 par value; 977,000 shares authorized, none issued |
— | — | ||||||
| Common Shareholders’ Equity |
||||||||
| Common stock |
||||||||
| Class A Common stock, $1 par value; 7,000,000 shares authorized; 1,291,693 shares issued and outstanding |
1,292 | 1,292 | ||||||
| Class B Common stock, $1 par value; 40,000,000 shares authorized; 18,708,307 shares issued; 7,975,120 and 8,073,539 shares outstanding |
18,708 | 18,708 | ||||||
| Capital in excess of par value |
241,435 | 232,201 | ||||||
| Retained earnings |
4,324,289 | 4,313,287 | ||||||
| Accumulated other comprehensive income (loss), net of taxes |
||||||||
| Cumulative foreign currency translation adjustment |
27,010 | (3,412 | ) | |||||
| Unrealized gain on available-for-sale securities |
78,492 | 72,646 | ||||||
| Unrealized loss on pensions and other postretirement plans |
(990 | ) | (79,914 | ) | ||||
| Cost of 10,733,187 and 10,634,768 shares of Class B common stock held in treasury |
(1,750,686 | ) | (1,697,268 | ) | ||||
| Total The Washington Post Company Common Shareholders’ Equity |
2,939,550 | 2,857,540 | ||||||
| Noncontrolling Interest |
471 | 885 | ||||||
| Total Shareholders’ Equity |
2,940,021 | 2,858,425 | ||||||
| Total Liabilities and Shareholders’ Equity |
$ | 5,186,206 | $ | 5,158,434 | ||||
See accompanying Notes to Consolidated Financial Statements.
56 THE WASHINGTON POST COMPANY
Table of Contents
CONSOLIDATED STATEMENTS OF CASH FLOWS
| Fiscal Year Ended | ||||||||||||
| (in thousands) | January 3, 2010 |
December 28, 2008 |
December 30, 2007 |
|||||||||
| Cash Flows from Operating Activities: |
||||||||||||
| Net income |
$ | 91,200 | $ | 65,796 | $ | 288,965 | ||||||
| Adjustments to reconcile net income to net cash provided by operating activities: |
||||||||||||
| Depreciation of property, plant and equipment |
295,871 | 265,606 | 221,239 | |||||||||
| Amortization of intangible assets |
26,642 | 22,525 | 17,571 | |||||||||
| Goodwill and other long-lived asset impairment charges |
25,387 | 135,439 | — | |||||||||
| Net pension benefit |
(8,069 | ) | (25,651 | ) | (22,280 | ) | ||||||
| Early retirement program expense |
64,541 | 111,077 | — | |||||||||
| Gain on sale of marketable equity securities |
— | (47,308 | ) | (394 | ) | |||||||
| Foreign exchange (gain) loss |
(16,871 | ) | 46,285 | (8,790 | ) | |||||||
| Equity in losses (earnings) of affiliates including impairment charges, net of distributions |
30,072 | 9,065 | (3,820 | ) | ||||||||
| Provision (benefit) for deferred income taxes |
33 | (4,196 | ) | 33,041 | ||||||||
| Net loss on sale or write-down of property, plant and equipment |
19,724 | 4,483 | 3,136 | |||||||||
| Change in assets and liabilities: |
||||||||||||
| Decrease (increase) in accounts receivable, net |
55,970 | (4,398 | ) | (42,246 | ) | |||||||
| Decrease (increase) in inventories |
24,195 | (16,907 | ) | (3,356 | ) | |||||||
| Increase in accounts payable and accrued liabilities |
831 | 41,788 | 35,940 | |||||||||
| Increase in deferred revenue |
25,178 | 32,119 | 47,163 | |||||||||
| Increase (decrease) in Kaplan stock compensation liability |
933 | (92,941 | ) | 33,240 | ||||||||
| Increase (decrease) in income taxes payable |
534 | 3,110 | (1,247 | ) | ||||||||
| Decrease (increase) in other assets and other liabilities, net |
17,872 | (6,629 | ) | (16,075 | ) | |||||||
| Other |
(1,050 | ) | (3,496 | ) | (900 | ) | ||||||
| Net cash provided by operating activities |
652,993 | 535,767 | 581,187 | |||||||||
| Cash Flows from Investing Activities: |
||||||||||||
| Purchases of property, plant and equipment |
(257,758 | ) | (288,923 | ) | (290,007 | ) | ||||||
| Investments in certain businesses, net of cash acquired |
(26,133 | ) | (86,262 | ) | (273,929 | ) | ||||||
| Purchases of marketable equity securities and other investments |
(10,237 | ) | (68,202 | ) | (694 | ) | ||||||
| Investments in affiliates |
(283 | ) | (4,419 | ) | (15,309 | ) | ||||||
| Return (funding) of escrow for acquisition |
4,667 | — | (18,914 | ) | ||||||||
| Return of investment in affiliates |
4,321 | — | — | |||||||||
| Proceeds from sale of marketable equity securities |
— | 114,393 | 538 | |||||||||
| Other |
4,296 | 3,314 | 17,204 | |||||||||
| Net cash used in investing activities |
(281,127 | ) | (330,099 | ) | (581,111 | ) | ||||||
| Cash Flows from Financing Activities: |
||||||||||||
| Principal payments on debt |
(400,868 | ) | (1,864 | ) | (3,578 | ) | ||||||
| Issuance of notes, net |
395,225 | — | — | |||||||||
| (Repayment) issuance of commercial paper, net |
(149,983 | ) | 65,183 | 84,800 | ||||||||
| Dividends paid |
(81,772 | ) | (82,161 | ) | (79,024 | ) | ||||||
| Common shares repurchased |
(60,956 | ) | (98,960 | ) | (42,031 | ) | ||||||
| Other |
5,079 | 147 | 8,076 | |||||||||
| Net cash used in financing activities |
(293,275 | ) | (117,655 | ) | (31,757 | ) | ||||||
| Effect of Currency Exchange Rate Change |
8,573 | (18,970 | ) | 4,999 | ||||||||
| Net Increase (Decrease) in Cash and Cash Equivalents |
87,164 | 69,043 | (26,682 | ) | ||||||||
| Cash and Cash Equivalents at Beginning of Year |
390,509 | 321,466 | 348,148 | |||||||||
| Cash and Cash Equivalents at End of Year |
$ | 477,673 | $ | 390,509 | $ | 321,466 | ||||||
| Supplemental Cash Flow Information: |
||||||||||||
| Cash paid during the year for: |
||||||||||||
| Income taxes |
$ | 58,900 | $ | 78,600 | $ | 158,100 | ||||||
| Interest |
$ | 26,600 | $ | 25,400 | $ | 23,800 | ||||||
See accompanying Notes to Consolidated Financial Statements.
2009 FORM 10-K 57
Table of Contents
CONSOLIDATED STATEMENTS OF CHANGES IN COMMON SHAREHOLDERS’ EQUITY
| (in thousands) | Class A Common Stock |
Class B Common Stock |
Capital in Excess of Par Value |
Retained Earnings |
Cumulative Foreign Currency Translation Adjustment |
Unrealized Gain on Available- for-Sale Securities |
Unrealized Gain (Loss) on Pensions and Other Postretirement Plans |
Treasury Stock |
Noncontrolling Interest |
||||||||||||||||||||||||||
| Balance, December 31, 2006 |
$ | 1,722 | $ | 18,278 | $ | 205,820 | $ | 4,120,143 | $ | 22,689 | $ | 84,614 | $ | 270,258 | $ | (1,564,010 | ) | $ | 453 | ||||||||||||||||
| Net income for the year |
288,965 | ||||||||||||||||||||||||||||||||||
| Net income attributable to noncontrolling interest |
(358 | ) | 358 | ||||||||||||||||||||||||||||||||
| Dividends paid on common stock — $8.20 per share |
(78,072 | ) | |||||||||||||||||||||||||||||||||
| Dividends paid on redeemable preferred stock |
(952 | ) | |||||||||||||||||||||||||||||||||
| Repurchase of 54,506 shares of Class B common stock |
(42,031 | ) | |||||||||||||||||||||||||||||||||
| Issuance of 34,363 shares of Class B common stock, net of restricted stock award forfeitures |
2,699 | 5,158 | |||||||||||||||||||||||||||||||||
| Amortization of unearned stock compensation |
6,563 | ||||||||||||||||||||||||||||||||||
| Change in foreign currency translation adjustment (net of taxes) |
20,156 | ||||||||||||||||||||||||||||||||||
| Change in unrealized gain on available-for-sale securities (net of taxes) |
68,925 | ||||||||||||||||||||||||||||||||||
| Adjustment for pensions and other postretirement plans (net of taxes) |
27,894 | ||||||||||||||||||||||||||||||||||
| Stock option expense |
1,225 | ||||||||||||||||||||||||||||||||||
| Conversion of Class A common stock to Class B common stock |
(430 | ) | 430 | ||||||||||||||||||||||||||||||||
| Tax benefits arising from employee stock plans |
1,473 | ||||||||||||||||||||||||||||||||||
| Balance, December 30, 2007 |
1,292 | 18,708 | 217,780 | 4,329,726 | 42,845 | 153,539 | 298,152 | (1,600,883 | ) | 811 | |||||||||||||||||||||||||
| Net income for the year |
65,796 | ||||||||||||||||||||||||||||||||||
| Net income attributable to noncontrolling interest |
(74 | ) | 74 | ||||||||||||||||||||||||||||||||
| Dividends paid on common stock — $8.60 per share |
(81,215 | ) | |||||||||||||||||||||||||||||||||
| Dividends paid on redeemable preferred stock |
(946 | ) | |||||||||||||||||||||||||||||||||
| Repurchase of 167,642 shares of Class B common stock |
(98,960 | ) | |||||||||||||||||||||||||||||||||
| Issuance of 16,827 shares of Class B common stock, net of restricted stock award forfeitures |
5,845 | 2,575 | |||||||||||||||||||||||||||||||||
| Amortization of unearned stock compensation |
6,736 | ||||||||||||||||||||||||||||||||||
| Change in foreign currency translation adjustment (net of taxes) |
(46,257 | ) | |||||||||||||||||||||||||||||||||
| Change in unrealized gain on available-for-sale securities (net of taxes) |
(80,893 | ) | |||||||||||||||||||||||||||||||||
| Adjustment for pensions and other postretirement plans (net of taxes) |
(378,066 | ) | |||||||||||||||||||||||||||||||||
| Stock option expense |
1,078 | ||||||||||||||||||||||||||||||||||
| Tax benefits arising from employee stock plans |
762 | ||||||||||||||||||||||||||||||||||
| Balance, December 28, 2008 |
1,292 | 18,708 | 232,201 | 4,313,287 | (3,412 | ) | 72,646 | (79,914 | ) | (1,697,268 | ) | 885 | |||||||||||||||||||||||
| Net income for the year |
91,200 | ||||||||||||||||||||||||||||||||||
| Net loss attributable to noncontrolling interest |
141 | (141 | ) | ||||||||||||||||||||||||||||||||
| Net loss attributable to redeemable noncontrolling interest |
1,433 | ||||||||||||||||||||||||||||||||||
| Dividends paid on common stock — $8.60 per share |
(80,844 | ) | |||||||||||||||||||||||||||||||||
| Dividends paid on redeemable preferred stock |
(928 | ) | |||||||||||||||||||||||||||||||||
| Repurchase of 145,040 shares of Class B common stock |
(60,956 | ) | |||||||||||||||||||||||||||||||||
| Issuance of 46,621 shares of Class B common stock, net of restricted stock award forfeitures |
(7,677 | ) | 7,538 | ||||||||||||||||||||||||||||||||
| Amortization of unearned stock compensation |
7,949 | ||||||||||||||||||||||||||||||||||
| Change in foreign currency translation adjustment (net of taxes) |
30,422 | ||||||||||||||||||||||||||||||||||
| Change in unrealized gain on available-for-sale securities (net of taxes) |
5,846 | ||||||||||||||||||||||||||||||||||
| Adjustment for pensions and other postretirement plans (net of taxes) |
78,924 | ||||||||||||||||||||||||||||||||||
| Stock option expense |
1,397 | ||||||||||||||||||||||||||||||||||
| Taxes arising from employee stock plans |
(1,719 | ) | |||||||||||||||||||||||||||||||||
| Other |
9,284 | (273 | ) | ||||||||||||||||||||||||||||||||
| Balance, January 3, 2010 |
$ | 1,292 | $ | 18,708 | $ | 241,435 | $ | 4,324,289 | $ | 27,010 | $ | 78,492 | $ | (990 | ) | $ | (1,750,686 | ) | $ | 471 | |||||||||||||||
See accompanying Notes to Consolidated Financial Statements.
58 THE WASHINGTON POST COMPANY
Table of Contents
NOTES TO CONSOLIDATED FINANCIAL STATEMENTS
| A. | ORGANIZATION AND NATURE OF OPERATIONS |
The Washington Post Company, Inc. (the “Company”) is a diversified education and media company. The Company’s Kaplan subsidiary provides a wide variety of educational services, both domestically and outside the United States. The Company’s media operations consist of the ownership and operation of cable television systems, newspaper publishing (principally The Washington Post), television broadcasting (through the ownership and operation of six television broadcast stations) and magazine publishing (Newsweek).
Education—Kaplan, Inc. provides an extensive range of educational services for children, students and professionals. Kaplan’s various businesses comprise four categories: Higher Education, Test Preparation, Kaplan International and Kaplan Ventures.
Media—The Company’s diversified media operations consist of cable television operations, newspaper publishing, television broadcasting, and magazine publishing.
Cable television operations: Cable ONE provides cable services that include basic video, digital video, cable modem and telephone service in the midwestern, western and southern states of the United States.
Newspaper publishing: Washington Post Media publishes The Washington Post (“the Post”), which is the largest and most widely circulated morning daily and Sunday newspaper, primarily distributed by home delivery in the Washington, DC, metropolitan area (including large portions of Maryland and northern Virginia). Washington Post Media also produces washingtonpost.com, an Internet site that features news and information products, as well as the full editorial content of The Washington Post. Through the Company’s other newspaper publishing businesses, the Company also publishes weekly publications and tabloids distributed nationally and within the Washington, DC, metropolitan area and produces other websites and online magazines.
Television broadcasting: The Company owns six VHF television stations located in Houston, TX; Detroit, MI; Miami, FL; Orlando, FL; San Antonio, TX; and Jacksonville, FL. Other than the Company’s Jacksonville station, WJXT, the Company’s television stations are affiliated with one of the major national networks.
Magazine publishing: Newsweek, Inc. publishes Newsweek, a weekly newsmagazine published both domestically and internationally. The magazine publishing division also includes newsweek.com.
| B. | SUMMARY OF SIGNIFICANT ACCOUNTING POLICIES |
Fiscal Year—The Company reports on a 52 to 53-week fiscal year ending on the Sunday nearest December 31. Fiscal year 2009, which ended on January 3, 2010, included 53 weeks. The fiscal years 2008 and 2007, which ended on December 28, 2008, and December 30, 2007, respectively, included 52 weeks. With the exception of most of the newspaper publishing operations and corporate office, subsidiaries of the Company report on a calendar-year basis.
Basis of Presentation and Principles of Consolidation—The accompanying consolidated financial statements have been prepared in accordance with generally accepted accounting principles (“GAAP”) in the United States and include the assets, liabilities, results of operations and cash flows of the Company and its majority-owned and controlled subsidiaries. All significant intercompany accounts and transactions have been eliminated in consolidation.
Reclassifications—Certain amounts in previously issued financial statements have been reclassified to conform with the 2009 presentation.
Use of Estimates—The preparation of financial statements in conformity with GAAP requires management to make estimates and judgments that affect the amounts reported in the financial statements. On an ongoing basis, the Company evaluates its estimates and assumptions. Actual results could differ from these estimates.
Business Combinations—The purchase price of an acquisition is allocated to the assets acquired, including intangible assets, and liabilities assumed, based on their respective fair values at the acquisition date. Starting in 2009, acquisition-related costs are expensed as incurred. The excess of the cost of an acquired entity over the net of the amounts assigned to the assets acquired and liabilities assumed is recognized as goodwill. The net assets and results of operations of an acquired entity are included in the Company’s consolidated financial statements from the acquisition date.
Cash and Cash Equivalents—Cash and cash equivalents consist of cash on hand, short-term investments with original maturities of three months or less and investments in money market funds with weighted average maturities of three months or less.
Concentration of Credit Risk—Cash and cash equivalents are maintained with several financial institutions domestically and internationally. Deposits held with banks may exceed the amount of insurance provided on such deposits. Generally, these deposits may be redeemed upon demand and are maintained with financial institutions with investment grade credit ratings. The Company routinely assesses the financial strength of significant customers, and this assessment, combined with the large number and geographical diversity of its customers, limits the Company’s concentration of risk with respect to trade accounts receivable.
Allowance for Doubtful Accounts—Accounts receivable have been reduced by an allowance for amounts that may be uncollectible in the future. This estimated allowance is based primarily on the aging category, historical trends and management’s evaluation of the financial condition of the customer. Accounts receivable also have been reduced by an estimate of advertising rate adjustments and discounts, based on estimates of advertising volumes for contract customers who are eligible for advertising rate adjustments and discounts.
Investments in Marketable Equity Securities—The Company’s investments in marketable equity securities are classified as available-for-sale and therefore are recorded at fair value in the consolidated financial statements, with the change in fair value during the period excluded from earnings and recorded net of income taxes as a separate component of other comprehensive income. If the fair value of a marketable equity security declines below its cost basis
2009 FORM 10-K 59
Table of Contents
and the decline is considered other than temporary, the Company will record a write-down, which is included in earnings.
Fair Value of Financial Instruments—The carrying amount reported in the Company’s consolidated financial statements for cash and cash equivalents, accounts receivable, accounts payable and accrued liabilities, the current portion of deferred revenue and the current portion of debt approximate fair value because of the short-term nature of these financial instruments. The fair value of long-term debt is determined based on a number of observable inputs, including the current market activity of the Company’s publicly traded notes, trends in investor demands and market values of comparable publicly traded debt.
Inventories—Inventories are stated at the lower of cost or current market value. Cost of newsprint is determined on the first-in, first-out (“FIFO”) method, and cost of magazine paper is determined on the specific-cost method.
Property, Plant and Equipment—Property, plant and equipment is recorded at cost and includes interest capitalized in connection with major long-term construction projects. Replacements and major improvements are capitalized; maintenance and repairs are expensed as incurred. Depreciation is calculated using the straight- line method over the estimated useful lives of the property, plant and equipment: 3 to 20 years for machinery and equipment, and 20 to 50 years for buildings. The costs of leasehold improvements are amortized over the lesser of their useful lives or the terms of the respective leases.
The cable television division capitalizes costs associated with the construction of cable transmission and distribution facilities and new cable service installations. Costs include all direct labor and materials, as well as certain indirect costs. The cost of subsequent disconnects and reconnects are expensed as they are incurred.
Evaluation of Long-Lived Assets—The recoverability of long-lived assets and finite-lived intangibles is assessed whenever adverse events or changes in circumstances indicate that recorded values may not be recoverable. A long-lived asset is considered to be not recoverable when the undiscounted estimated future cash flows are less than the asset’s recorded value. An impairment charge is measured based on estimated fair market value, determined primarily using estimated future cash flows on a discounted basis. Losses on long-lived assets to be disposed of are determined in a similar manner, but the fair market value would be reduced for estimated costs to dispose.
Goodwill and Other Intangible Assets—Goodwill is the excess of purchase price over the fair value of identified net assets of businesses acquired. The Company’s intangible assets with an indefinite life are principally from franchise agreements at its cable television division, as the Company expects its cable franchise agreements to provide the Company with substantial benefit for a period that extends beyond the foreseeable horizon, and the Company’s cable television division historically has obtained renewals and extensions of such agreements for nominal costs and without any material modifications to the agreements. Amortized intangible assets are primarily student and customer relationship intangibles, noncompete agreements, trademarks and databases, with amortization periods up to 15 years.
The Company reviews goodwill and indefinite-lived intangible assets at least annually, as of November 30, for possible impairment. Goodwill and indefinite-lived intangibles are reviewed for possible impairment between annual tests if an event occurred or circumstances changed that would more likely than not reduce the fair value of the reporting unit below its carrying value. All other intangible assets are amortized over their useful lives. The Company tests its goodwill and indefinite-lived intangible assets at the reporting unit level, which is an operating segment or one level below an operating segment. In reviewing the carrying value of indefinite-lived intangible assets at the cable television division, the Company aggregates its cable systems on a regional basis. The Company reviews the carrying value of goodwill and indefinite-lived intangible assets utilizing a discounted cash flow model, and, where appropriate, a market value approach is also utilized to supplement the discounted cash flow model. The Company makes assumptions regarding estimated future cash flows, discount rates, long-term growth rates and market values to determine each reporting unit’s estimated fair value. If these estimates or related assumptions change in the future, the Company may be required to record impairment charges.
Investments in Affiliates—The Company uses the equity method of accounting for its investments in and earnings or losses of affiliates that it does not control, but over which it exerts significant influence. The Company considers whether the fair values of any of its equity method investments have declined below their carrying value whenever adverse events or changes in circumstances indicate that recorded values may not be recoverable. If the Company considered any such decline to be other than temporary (based on various factors, including historical financial results, product development activities and the overall health of the affiliate’s industry), a write-down would be recorded to estimated fair value.
Cost Method Investments—The Company uses the cost method of accounting for its minority investments in nonpublic companies where it does not have significant influence over the operations and management of the investee. Investments are recorded at the lower of cost or fair value as estimated by management. Charges recorded to write down cost method investments to their estimated fair value and gross realized gains or losses upon the sale of cost method investments are included in other (expense) income, net, in the Company’s consolidated financial statements. Fair value estimates are based on a review of the investees’ product development activities, historical financial results and projected discounted cash flows.
Revenue Recognition—Revenue is recognized when persuasive evidence of an arrangement exists, the fees are fixed or determinable, the product or service has been delivered and collectability is reasonably assured. The Company considers the terms of each arrangement to determine the appropriate accounting treatment.
Education revenues: Tuition revenue is recognized ratably over the period of instruction as services are delivered to students, net of any refunds, corporate discounts, scholarships and employee tuition discounts. At Kaplan’s Test Preparation and International divisions, estimates of average student course length are developed for each course, and these estimates are evaluated on an ongoing basis and adjusted as necessary. Online access revenue is recognized ratably
60 THE WASHINGTON POST COMPANY
Table of Contents
over the period of access. Course material revenue is recognized over the same period as the tuition or online access, if related, or when the products are delivered, if not related. Other revenues, such as student support services, are recognized when the services are provided.
Cable revenues: Cable revenues are primarily derived from subscriber fees for video, high-speed Internet and phone services, and from advertising. Cable subscriber revenue is recognized monthly as services are delivered. Advertising revenue is recognized when the commercials or programs are aired.
Newspaper and magazine publishing and television broadcasting revenues: Media advertising revenues are recognized, net of agency commissions, when the underlying advertisement is published or broadcast. Revenues from newspaper and magazine subscriptions and retail sales are recognized upon the later of delivery or cover date, with adequate provision made for anticipated sales returns.
Sales returns: Consistent with industry practice, certain of the Company’s products, such as newspapers, magazines and books, are sold with the right of return. The Company records, as a reduction of revenue, the estimated impact of such returns. The Company bases its estimates for sales returns on historical experience and has not experienced significant fluctuations between estimated and actual return activity.
Deferred revenue: Amounts received from customers in advance of revenue recognition are deferred as liabilities. Deferred revenue to be earned after one year is included in other liabilities in the Company’s consolidated financial statements.
Leases—The Company leases substantially all of its educational facilities and enters into various other lease agreements in conducting its business. At the inception of each lease, the Company evaluates the lease agreement to determine whether the lease is an operating or capital lease. Additionally, many of the Company’s lease agreements contain renewal options, tenant improvement allowances, rent holidays and/or rent escalation clauses. When such items are included in a lease agreement, the Company records a deferred rent asset or liability in the consolidated financial statements and records these items in rent expense evenly over the terms of the lease.
The Company is also required to make additional payments under operating lease terms for taxes, insurance and other operating expenses incurred during the operating lease period; such items are expensed as incurred. Rental deposits are included as other assets in the consolidated financial statements for lease agreements that require payments in advance or deposits held for security that are refundable, less any damages, at the end of the respective lease.
Pensions and Other Postretirement Benefits—The Company maintains various pension and incentive savings plans and contributes to several multiemployer plans on behalf of certain union-represented employee groups. Substantially all of the Company’s employees are covered by these plans. The Company also provides health care and life insurance benefits to certain retired employees. These employees become eligible for benefits after meeting age and service requirements.
The Company recognizes the overfunded or underfunded status of a defined benefit postretirement plan (other than a multiemployer plan) as an asset or liability in its statement of financial position and recognizes changes in that funded status in the fiscal year in which the changes occur through comprehensive income. The Company measures changes in the funded status of its plans using the projected unit credit method and several actuarial assumptions, the most significant of which are the discount rate, the long-term rate of asset return and rate of compensation increase. The Company uses a measurement date of December 31 for its pension and other postretirement benefit plans.
Self-Insurance—The Company uses a combination of insurance and self-insurance for a number of risks, including claims related to employee health care and dental care, disability benefits, workers’ compensation, general liability, property damage and business interruption. Liabilities associated with these plans are estimated based on, among other things, the Company’s historical claims experience, severity factors and other actuarial assumptions. The expected loss accruals are based on estimates, and while the Company believes the amounts accrued are adequate, the ultimate loss may differ from the amounts provided.
Income Taxes—The Company accounts for income taxes under the asset and liability method, which requires the recognition of deferred tax assets and liabilities for the expected future tax consequences of events that have been included in the financial statements. Under this method, deferred tax assets and liabilities are determined based on the differences between the financial statements and tax basis of assets and liabilities using enacted tax rates in effect for the year in which the differences are expected to reverse. The effect of a change in tax rates on deferred tax assets and liabilities is recognized in income in the period that includes the enactment date.
The Company records net deferred tax assets to the extent that it believes these assets will more likely than not be realized. In making such determination, the Company considers all available positive and negative evidence, including future reversals of existing taxable temporary differences, projected future taxable income, tax planning strategies and recent financial operations; this evaluation is made on an ongoing basis. In the event the Company were to determine that it was able to realize net deferred income tax assets in the future in excess of their net recorded amount, the Company would record an adjustment to the valuation allowance, which would reduce the provision for income taxes.
The Company recognizes a tax benefit from an uncertain tax position when it is more likely than not that the position will be sustained upon examination, including resolutions of any related appeals or litigation processes, based on the technical merits. The Company records a liability for the difference between the benefit recognized and measured for financial statement purposes and the tax position taken or expected to be taken on the Company’s tax return. Changes in the estimate are recorded in the period in which such determination is made.
Foreign Currency Translation—Income and expense accounts of the Company’s foreign operations where the local currency is the
2009 FORM 10-K 61
Table of Contents
functional currency are translated into U.S. dollars using the current rate method, whereby operating results are converted at the average rate of exchange for the period, and assets and liabilities are converted at the closing rates on the period end date. Gains and losses on translation of these accounts and the Company’s equity investment in its foreign affiliates are accumulated and reported as a separate component of equity and other comprehensive income. Gains and losses on foreign currency transactions are recognized in the Consolidated Statements of Income.
Equity-Based Compensation—The Company measures compensation expense for awards settled in shares based on the grant date fair value of the award. The Company measures compensation expense for awards settled in cash, or that may be settled in cash, based on the fair value at each reporting date. The Company recognizes the expense over the requisite service period, which is generally the vesting period of the award.
Earnings Per Share—Earnings per share is calculated under the two-class method. Basic earnings per share is calculated using the weighted average number of common shares outstanding during the period. Diluted earnings per share is calculated similarly except that the computation includes the dilutive effect of the assumed exercise of options and restricted stock issuable under the Company’s stock plans.
Comprehensive Income—Comprehensive income consists of net income, foreign currency translation adjustments, the change in unrealized gains (losses) on investments in marketable equity securities and pension and other postretirement plan adjustments.
Recently Adopted and Issued Accounting Pronouncements—In June 2009, the Financial Accounting Standards Board (“FASB”) issued an Accounting Standards Update (“ASU”) that establishes the FASB Accounting Standards Codification (“the Codification”) as the official single source of authoritative GAAP. The Codification superseded all existing accounting standards. All other accounting guidance not included in the Codification will be considered nonauthoritative. The Codification also includes all relevant Securities and Exchange Commission (“SEC”) guidance organized using the same topical structure in separate sections within the Codification. Following the Codification, the Board will not issue new standards in the form of Statements, FASB Staff Positions or Emerging Issues Task Force Abstracts. Instead, it will issue ASUs that will serve to update the Codification, provide background information about the guidance and provide the basis for conclusions on the changes to the Codification. The Codification does not change GAAP, but it changes the way GAAP is organized and presented. The Codification is effective for interim and annual periods ending after September 15, 2009. The impact of the Codification on the Company’s consolidated financial statements is limited to disclosures.
In September 2006, the FASB issued new guidance that defines fair value, establishes a framework for measuring fair value in accordance with GAAP and expands disclosures about fair value measurements. The guidance was effective for the Company at the beginning of fiscal year 2008 for all financial assets and liabilities and for nonfinancial assets and liabilities recognized or disclosed at fair value in the Company’s consolidated financial statements on a recurring basis (at least annually). The adoption of these provisions did not have any impact on the Company’s consolidated financial statements, as the Company’s existing fair value measurements were consistent with the new guidance. The FASB deferred the effective date of the fair value guidance for nonfinancial assets and liabilities that are not remeasured at fair value on a recurring basis to fiscal years beginning after November 15, 2008. The implementation of the fair value guidance for nonfinancial assets and nonfinancial liabilities at the beginning of the Company’s 2009 fiscal year did not have a material impact on the Company’s consolidated financial statements. See Note P for additional disclosures about fair value measurements.
In December 2007, the FASB issued new guidance for business combinations that requires that the acquisition method of accounting be applied to all business combinations, which significantly changes the accounting for certain aspects of business combinations. Under this guidance, an acquiring entity is required to recognize all of the assets acquired and liabilities assumed in a transaction at the acquisition-date fair value, with limited exceptions. The guidance changes the accounting treatment for certain specific acquisition-related items, including (i) expensing acquisition-related costs as incurred; (ii) valuing noncontrolling interests at fair value at the acquisition date and (iii) expensing restructuring costs associated with an acquired business. The guidance also includes a substantial number of new disclosure requirements. The guidance also amends GAAP for income taxes such that adjustments made to valuation allowances on deferred taxes and acquired tax contingencies associated with acquisitions that closed prior to the effective date of the new guidance would also apply the provisions included in the guidance. The guidance did not have any impact on the Company’s consolidated financial statements upon adoption at the beginning of fiscal year 2009. The Company expects the guidance to have an impact on its accounting for future business combinations, but the effect is dependent upon acquisitions that are made in the future.
In April 2009, the FASB issued guidance that amends and clarifies GAAP for business combinations to address application issues associated with initial recognition and measurement, subsequent measurement and accounting, and disclosure of assets and liabilities arising from contingencies in a business combination. This guidance is effective for assets or liabilities arising from contingencies in business combinations for which the acquisition date is subsequent to the beginning of fiscal year 2009. This guidance did not have any impact on the Company’s consolidated financial statements upon adoption. The Company expects the guidance to have an impact on its accounting for future business combinations, but the effect is dependent upon the acquisitions that are made in the future.
In December 2007, the FASB issued guidance that establishes new accounting and reporting standards for the noncontrolling interest in a subsidiary and for the deconsolidation of a subsidiary. It clarifies that a noncontrolling interest in a subsidiary (minority interest) is an ownership interest in the consolidated entity that should be reported as equity in the consolidated financial statements and separate from the parent company’s equity. Among other requirements, this
62 THE WASHINGTON POST COMPANY
Table of Contents
guidance requires consolidated net income to be reported at amounts that include the amounts attributable to both the parent company and the noncontrolling interest. This guidance also requires disclosure, on the face of the consolidated financial statements, of the amounts of consolidated net income attributable to the parent and to the noncontrolling interest. The Company adopted the guidance at the beginning of fiscal year 2009 and reclassified $17.4 million from other liabilities to redeemable noncontrolling interest outside permanent equity and $0.9 million of noncontrolling interest from other liabilities to a separate component of shareholders equity in our consolidated balance sheet as of December 28, 2008. Previously, the Company presented minority interest in “Other income (expense)” in the consolidated statements of income. The consolidated statements of income for fiscal years 2008 and 2007 were adjusted to reflect 100% of the results of subsidiaries not wholly owned. The “net income” for fiscal years 2008 and 2007 were adjusted to remove the noncontrolling interest of $74,000 and $358,000, respectively, to arrive at “Net income attributable to The Washington Post Company.”
In June 2008, the FASB issued new guidance for the calculation of earnings per share. The guidance clarifies that unvested share-based payment awards that contain nonforfeitable rights to dividends or dividend equivalents (whether paid or unpaid) are participating securities and are to be included in the computation of earnings per share under the two-class method. The Company adopted this guidance at the beginning of fiscal year 2009 and applied its provisions retrospectively to all earnings per share data presented in the Company’s consolidated financial statements. The implementation of this guidance did not have a material impact on the earnings per share data of the Company.
In December 2008, the FASB issued new guidance on an employer’s disclosures about plan assets of a defined benefit pension or other postretirement plan. The additional disclosure requirements under this guidance include expanded disclosures about an entity’s investment policies and strategies, the categories of plan assets, concentrations of credit risk and fair value measurements of plan assets. This new guidance is effective for fiscal years ending after December 15, 2009, and does not require comparative information for earlier periods presented. See Note L for additional disclosures following the implementation of this new guidance.
In May 2009, the FASB issued new guidance that established general standards of accounting for and disclosure of events that occur after the balance sheet date but before financial statements are issued or available to be issued. The new guidance is effective prospectively for interim and annual periods ending after June 15, 2009. The implementation of this guidance had no impact on the consolidated financial statements as the Company already followed a similar approach prior to the implementation of this guidance.
In October 2009, the FASB issued new guidance that modifies the fair value requirement of multiple element revenue arrangements. The new guidance allows the use of the “best estimate of selling price” in addition to vendor-specific objective evidence (“VSOE”) and third-party evidence (“TPE”) for determining the selling price of a deliverable. A vendor is now required to use its best estimate of the selling price when VSOE or TPE of the selling price cannot be determined. In addition, the residual method of allocating arrangement consideration is no longer permitted. The guidance requires expanded qualitative and quantitative disclosures and is effective for revenue arrangements entered into or materially modified in fiscal years beginning on or after June 15, 2010. Early application is permitted. The Company is in the process of evaluating the impact of this new guidance on its consolidated financial statements.
| C. | ACCOUNTS RECEIVABLE AND ACCOUNTS PAYABLE AND ACCRUED LIABILITIES |
Accounts receivable at January 3, 2010 and December 28, 2008 consist of the following:
| (in thousands) | 2009 | 2008 | ||||
| Trade accounts receivable, less estimated returns, doubtful accounts and allowances of $106,781 and $104,653 |
$ | 415,688 | $ | 466,702 | ||
| Other accounts receivable |
14,981 | 12,659 | ||||
| $ | 430,669 | $ | 479,361 | |||
Accounts payable and accrued liabilities at January 3, 2010 and December 28, 2008 consist of the following:
| (in thousands) | 2009 | 2008 | ||||
| Accounts payable and accrued liabilities |
$ | 374,650 | $ | 358,623 | ||
| Accrued compensation and related benefits |
178,694 | 175,429 | ||||
| Due to affiliates (newsprint) |
2,134 | 10,868 | ||||
| $ | 555,478 | $ | 544,920 | |||
Cash overdrafts of $30.4 million and $25.0 million are included in accounts payable and accrued expenses at January 3, 2010 and December 28, 2008, respectively.
The changes in allowance for doubtful accounts and returns and allowance for advertising rate adjustments and discounts during 2009, 2008 and 2007 were as follows:
| (in thousands) | Balance at Beginning of Period |
Additions – Costs and Expenses |
Deductions | Balance End of Period | |||||||||
| Year Ended January 3, 2010 |
|||||||||||||
| Allowance for doubtful accounts and returns |
$ | 95,425 | $ | 168,455 | $ | (165,594 | ) | $ | 98,286 | ||||
| Allowance for advertising rate adjustments and discounts |
9,228 | 24,208 | (24,941 | ) | 8,495 | ||||||||
| $ | 104,653 | $ | 192,663 | $ | (190,535 | ) | $ | 106,781 | |||||
| Year Ended December 28, 2008 |
|||||||||||||
| Allowance for doubtful accounts and returns |
$ | 77,585 | $ | 155,288 | $ | (137,448 | ) | $ | 95,425 | ||||
| Allowance for advertising rate adjustments and discounts |
4,318 | 30,751 | (25,841 | ) | 9,228 | ||||||||
| $ | 81,903 | $ | 186,039 | $ | (163,289 | ) | $ | 104,653 | |||||
| Year Ended December 30, 2007 |
|||||||||||||
| Allowance for doubtful accounts and returns |
$ | 80,362 | $ | 135,936 | $ | (138,713 | ) | $ | 77,585 | ||||
| Allowance for advertising rate adjustments and discounts |
5,865 | 13,492 | (15,039 | ) | 4,318 | ||||||||
| $ | 86,227 | $ | 149,428 | $ | (153,752 | ) | $ | 81,903 | |||||
2009 FORM 10-K 63
Table of Contents
| D. | PROPERTY, PLANT AND EQUIPMENT |
Property, plant and equipment at January 3, 2010 and December 28, 2008 consist of the following:
| (in thousands) | 2009 | 2008 | ||||||
| Land |
$ | 47,700 | $ | 49,859 | ||||
| Buildings |
375,728 | 349,785 | ||||||
| Machinery, equipment and fixtures |
2,428,595 | 2,337,149 | ||||||
| Leasehold improvements |
290,951 | 256,866 | ||||||
| Construction in progress |
51,022 | 114,294 | ||||||
| 3,193,996 | 3,107,953 | |||||||
| Less accumulated depreciation |
(1,954,304 | ) | (1,805,619 | ) | ||||
| $ | 1,239,692 | $ | 1,302,334 | |||||
Depreciation expense was $295.9 million, $265.6 million and $221.2 million in 2009, 2008 and 2007, respectively. Total interest capitalized during 2008 was $0.5 million and was related to the construction of a qualified asset. No interest expense was capitalized in 2009 and 2007.
| E. | INVESTMENTS |
Investments in Marketable Equity Securities. Investments in marketable equity securities at January 3, 2010 and December 28, 2008 consist of the following:
| (in thousands) | 2009 | 2008 | ||||
| Total cost |
$ | 223,064 | $ | 212,242 | ||
| Gross unrealized gains |
130,820 | 121,077 | ||||
| $ | 353,884 | $ | 333,319 | |||
At January 3, 2010 and December 28, 2008, the Company owned 2,214 shares of Berkshire Hathaway Inc. (“Berkshire”) Class A common stock and 8,485 and 3,870 shares of Berkshire Class B common stock, respectively. The Company’s ownership of Berkshire accounted for $247.5 million, or 70%, and $218.8 million, or 66%, of the total fair value of the Company’s investments in marketable equity securities at January 3, 2010 and December 28, 2008, respectively.
Berkshire is a holding company owning subsidiaries engaged in a number of diverse business activities, the most significant of which consists of property and casualty insurance businesses conducted on both a direct and reinsurance basis. Berkshire also owns approximately 19% of the common stock of the Company. The chairman, chief executive officer and largest shareholder of Berkshire, Mr. Warren Buffett, is a member of the Company’s Board of Directors. The Company’s investment in Berkshire common stock is less than 1% of the consolidated equity of Berkshire. At January 3, 2010 and December 28, 2008, the gross unrealized gain related to the Company’s Berkshire stock investment totaled $90.2 million and $72.4 million, respectively. During 2009, the Company invested $10.8 million in the Class B common stock of Berkshire. During 2008, the Company sold 420 and 5,975 shares of Berkshire Class A and Class B common stock, respectively. Total proceeds were $64.4 million, and the net realized gains were $26.0 million.
During 2009 and 2008, the Company invested $10.8 million and $65.8 million in marketable equity securities, respectively. There were no new investments in marketable equity securities in 2007. During 2008 and 2007, proceeds from the sales of marketable equity securities were $114.4 million and $0.5 million, respectively, and net realized gains on such sales were $47.3 million and $0.4 million, respectively. There were no sales of marketable equity securities during 2009.
Investments in Affiliates. At the end of 2009, the Company’s investments in affiliates consisted of a 49% interest in the common stock of Bowater Mersey Paper Company Limited, which owns and operates a newsprint mill in Nova Scotia, and other investments.
During 2009 and 2008, the Company recorded $29.0 million and $6.8 million of impairment charges at the Company’s affiliates, respectively. The 2009 charges primarily relate to an impairment charge recorded on the Company’s interest in Bowater Mersey Paper Company as a result of the challenging economic environment for newsprint producers. In the second quarter of 2008, the Company recorded $6.8 million in impairment charges at two of the Company’s other affiliates.
| F. | ACQUISITIONS AND DISPOSITIONS |
The Company completed business acquisitions totaling approximately $26.1 million in 2009, $123.5 million in 2008 and $296.3 million in 2007. The assets and liabilities of the companies acquired have been recorded at their estimated fair values at the date of acquisition; the purchase price allocations mostly comprised goodwill and other intangibles, and property, plant and equipment. Any additional purchase consideration related to a 2008 acquisition is expected to be recorded as goodwill.
During 2009, the Company acquired three businesses for $22.9 million. Kaplan acquired one business in each of its International and Test Preparation divisions, and the newspaper division acquired a small local publication. The purchase price allocations for these acquisitions mostly comprised goodwill and other intangible assets. Also in 2009, the Company recorded $3.2 million of additional purchase consideration in connection with the achievement of certain operating results by a company acquired in 2007 and allocated the additional purchase consideration to goodwill.
In December 2009, the Company completed the sale of Newsweek’s Budget Travel, which was part of the Company’s magazine publishing segment, and recorded a gain.
During 2008, the Company acquired ten businesses within its education and newspaper segments, for a total of $93.1 million, financed with cash and $3.2 million in debt. Kaplan acquired nine businesses in its International, Test Preparation, and Ventures divisions. These included Kaplan International’s acquisition of a majority interest in Shanghai Kai Bo Education Management Investment Co., Ltd. (“Kaplan China”), a provider of education in China that offers preparation courses for entry to U.K. universities, along with degree and professional training programs at campuses throughout China. In 2007, Kaplan purchased a 40% interest in Kaplan China. In the first quarter of 2008, Kaplan exercised an
64 THE WASHINGTON POST COMPANY
Table of Contents
option to increase its investment in Kaplan China to an 85% majority interest. The transaction was completed in November 2008, and Kaplan China’s results from the transaction date forward have been included in the Company’s consolidated financial statements. The purchase price allocations for these acquisitions mostly comprised goodwill and other intangible assets.
Also in 2008, the cable television division acquired subscribers primarily in the Mississippi area for $15.3 million. The purchase price allocations for these transactions mostly comprised intangible assets and property, plant and equipment.
In connection with a 2008 acquisition, additional purchase consideration of approximately $1.5 million was contingent on the achievement of certain future operating results and was not included in the Company’s purchase accounting as of December 28, 2008. During 2008, the Company recorded $15.1 million of additional purchase consideration in connection with the achievement of certain operating results by a company acquired in 2007 and allocated the additional purchase consideration to goodwill.
During 2007, the Company acquired 11 businesses within its education, newspaper and other businesses and corporate office segments for a total of $292.0 million, financed with cash and $2.0 million in debt. Kaplan acquired 9 businesses in its International, Test Preparation and Ventures divisions, of which the largest two were Kaplan Ventures’ acquisition of EduNeering Holdings, Inc., a Princeton, NJ-based provider of knowledge management solutions for organizations in the pharmaceutical, medical device, health care, energy and manufacturing sectors; and Kaplan International’s acquisition of the education division of Financial Services Institute of Australasia. In October 2007, the Company acquired the outstanding stock of Avenue100 Media Solutions (formerly CourseAdvisor, Inc.), a premier online lead generation provider, headquartered in Wakefield, MA. Through its search engine marketing expertise and proprietary technology platform, Avenue100 generates student leads for the postsecondary education market. Avenue100 operates as an independent subsidiary of the Company. The purchase price allocations for these acquisitions mostly comprised goodwill and other intangible assets. Also in 2007, the cable television division acquired subscribers in the Boise, ID, area for $4.3 million. Most of the purchase price for this transaction was allocated to indefinite-lived intangible assets and property, plant and equipment.
In connection with certain 2007 acquisitions, additional purchase consideration of approximately $22 million was contingent on the achievement of certain future operating results; such amounts were largely funded in escrow in 2007 and were not included in the Company’s purchase accounting as of December 30, 2007. In July 2007, the television broadcasting division entered into a transaction to sell and lease back its current Miami television station facility; a $9.5 million gain was recorded as a reduction to expense in the third quarter. An additional $1.9 million deferred gain was amortized over the leaseback period. The television broadcasting division purchased land and built a new Miami television station facility that was completed in 2009.
| G. | GOODWILL AND OTHER INTANGIBLE ASSETS |
The education division reorganized its operations in the third quarter of 2009 into the following four operating segments for the purpose of making operating decisions and assessing performance: Higher Education, Test Preparation, Kaplan International and Kaplan Ventures (see Note Q). The reorganization changed the composition of the reporting units within the education division and resulted in the reassignment of the assets and liabilities. The goodwill was allocated to the reporting units using the relative fair value approach. As a result of the reassignment and allocation, the Company performed an interim review of the carrying value of goodwill at the education division for possible impairment on both a prereorganization and postreorganization basis. No impairment of goodwill was indicated at the prereorganization reporting units. On a postreorganization basis, the Company failed the step one goodwill impairment test at two reporting units (Kaplan EduNeering and Kaplan Compliance Solutions) within the Kaplan Ventures operating segment and performed a step two analysis. The Company recorded a goodwill and other long-lived asset impairment charge of $25.4 million related to these two reporting units. The fair value of Kaplan EduNeering was determined utilizing a discounted cash flow model; the fair value of Kaplan Compliance Solutions was determined using a cost approach.
In 2008, the Company recorded goodwill and other intangible asset impairment charges of $135.4 million. As a result of the challenging advertising environment at the Company’s community newspapers and The Herald, which are part of the newspaper publishing segment, the Company performed an interim review of
the carrying value of goodwill and recorded a $59.7 million goodwill impairment charge. The Company estimated the fair value utilizing a discounted cash flow model. As part of the Company’s annual impairment review, a $69.7 million goodwill and other intangible assets impairment charge was recorded at the Company’s online lead generation business within the other businesses and corporate office segment, due to lower than expected revenue and operating income growth since its acquisition. The Company estimated the fair value utilizing a discounted cash flow model. The Company also recorded a goodwill impairment charge of $6.1 million in the newspaper publishing segment as part of its annual impairment review. The Company estimated the fair value utilizing a market approach. Also in the fourth quarter of 2008, the Company recorded a $28.4 million amortized intangible asset in connection with a noncompetition and nonsolicitation agreement entered into between the Company and the former Kaplan chief executive officer, who resigned in November 2008. This asset is being amortized over three years.
The Company amortizes the recorded values of its amortized intangible assets over their estimated useful lives. Amortization of intangible assets was $26.6 million in 2009 and is estimated to be approximately $24.6 million in 2010, $20.7 million in 2011, $9.2 million in 2012, $4.9 million in 2013, $3.2 million in 2014 and $8.7 million thereafter.
2009 FORM 10-K 65
Table of Contents
The changes in the carrying amount of goodwill, by segment, during 2009 are detailed below:
| (in thousands) | Education | Cable Television |
Newspaper Publishing |
Television Broadcasting |
Magazine Publishing |
Other Businesses and Corporate |
Total | |||||||||||||||||||
| Balance as of December 28, 2008 |
||||||||||||||||||||||||||
| Goodwill |
$ | 1,022,671 | $ | 85,488 | $ | 81,186 | $ | 203,165 | $ | 25,015 | $ | 99,189 | $ | 1,516,714 | ||||||||||||
| Accumulated impairment losses |
— | — | (65,772 | ) | — | — | (60,785 | ) | (126,557 | ) | ||||||||||||||||
| 1,022,671 | 85,488 | 15,414 | 203,165 | 25,015 | 38,404 | 1,390,157 | ||||||||||||||||||||
| Acquisitions |
14,006 | — | — | — | — | (935 | ) | 13,071 | ||||||||||||||||||
| Disposition |
— | — | — | — | (500 | ) | — | (500 | ) | |||||||||||||||||
| Impairment |
(15,529 | ) | — | — | — | — | — | (15,529 | ) | |||||||||||||||||
| Foreign currency exchange rate changes and other |
37,175 | — | — | — | — | (912 | ) | 36,263 | ||||||||||||||||||
| Balance as of January 3, 2010 |
||||||||||||||||||||||||||
| Goodwill |
1,073,852 | 85,488 | 81,186 | 203,165 | 24,515 | 97,342 | 1,565,548 | |||||||||||||||||||
| Accumulated impairment losses |
(15,529 | ) | — | (65,772 | ) | — | — | (60,785 | ) | (142,086 | ) | |||||||||||||||
| $ | 1,058,323 | $ | 85,488 | $ | 15,414 | $ | 203,165 | $ | 24,515 | $ | 36,557 | $ | 1,423,462 | |||||||||||||
| (in thousands) | Higher Education |
Test Preparation |
Professional | Kaplan International |
Kaplan Ventures |
Kaplan Corporate and Other |
Total | |||||||||||||||||||
| Balance as of December 28, 2008 |
||||||||||||||||||||||||||
| Goodwill |
$ | 343,332 | $ | 185,876 | $ | 493,463 | $ | — | $ | — | $ | — | $ | 1,022,671 | ||||||||||||
| Accumulated impairment losses |
— | — | — | — | — | — | — | |||||||||||||||||||
| 343,332 | 185,876 | 493,463 | — | — | — | 1,022,671 | ||||||||||||||||||||
| Acquisitions |
28 | (227 | ) | 3,212 | — | — | — | 3,013 | ||||||||||||||||||
| Foreign currency exchange rate changes and other |
916 | (894 | ) | 28,412 | — | — | — | 28,434 | ||||||||||||||||||
| Balance as of July 1, 2009 |
344,276 | 184,755 | 525,087 | — | — | — | 1,054,118 | |||||||||||||||||||
| Reallocation (Note Q) |
(9,050 | ) | 44,508 | (525,087 | ) | 422,245 | 67,384 | — | — | |||||||||||||||||
| Acquisitions |
— | 7,135 | — | 3,858 | — | — | 10,993 | |||||||||||||||||||
| Impairment |
— | — | — | — | (15,529 | ) | — | (15,529 | ) | |||||||||||||||||
| Foreign currency exchange rate changes and other |
— | 381 | — | 6,870 | 1,490 | — | 8,741 | |||||||||||||||||||
| Balance as of January 3, 2010 |
||||||||||||||||||||||||||
| Goodwill |
335,226 | 236,779 | — | 432,973 | 68,874 | — | 1,073,852 | |||||||||||||||||||
| Accumulated impairment losses |
— | — | — | — | (15,529 | ) | — | (15,529 | ) | |||||||||||||||||
| $ | 335,226 | $ | 236,779 | $ | — | $ | 432,973 | $ | 53,345 | $ | — | $ | 1,058,323 | |||||||||||||
Other intangible assets consists of the following:
| As of January 3, 2010 | As of December 28, 2008 | |||||||||||||||||
| (in thousands) | Gross Carrying Amount |
Accumulated Amortization |
Net Carrying Amount |
Gross Carrying Amount |
Accumulated Amortization |
Net Carrying Amount | ||||||||||||
| Amortized intangible assets: |
||||||||||||||||||
| Noncompete agreements |
$ | 43,886 | $ | 24,093 | $ | 19,793 | $ | 48,160 | $ | 17,958 | $ | 30,202 | ||||||
| Student and customer relationships |
67,360 | 35,475 | 31,885 | 70,926 | 31,922 | 39,004 | ||||||||||||
| Databases and technology |
12,195 | 3,889 | 8,306 | 15,425 | 5,324 | 10,101 | ||||||||||||
| Trade names and trademarks |
19,978 | 10,639 | 9,339 | 20,190 | 7,164 | 13,026 | ||||||||||||
| Other |
7,797 | 5,806 | 1,991 | 7,027 | 5,100 | 1,927 | ||||||||||||
| $ | 151,216 | $ | 79,902 | $ | 71,314 | $ | 161,728 | $ | 67,468 | $ | 94,260 | |||||||
| Indefinite-lived intangible assets: |
||||||||||||||||||
| Franchise agreements |
$ | 496,047 | $ | 495,570 | ||||||||||||||
| Wireless licenses |
22,150 | 22,150 | ||||||||||||||||
| Licensure and accreditation |
7,862 | 8,362 | ||||||||||||||||
| Other |
13,953 | 5,241 | ||||||||||||||||
| $ | 540,012 | $ | 531,323 | |||||||||||||||
66 THE WASHINGTON POST COMPANY
Table of Contents
| H. | INCOME TAXES |
Income before income taxes consists of the following:
| (in thousands) | 2009 | 2008 | 2007 | |||||||
| Domestic |
$ | 152,397 | $ | 103,750 | $ | 429,913 | ||||
| Foreign |
(3,597 | ) | 41,446 | 51,552 | ||||||
| $ | 148,800 | $ | 145,196 | $ | 481,465 | |||||
Foreign results for 2009 include losses of a foreign affiliate associated with a $27.4 million impairment charge.
The provision for income taxes consists of the following:
| (in thousands) | Current | Deferred | Total | |||||||
| 2009 |
||||||||||
| U.S. Federal |
$ | 32,541 | $ | 7,229 | $ | 39,770 | ||||
| State and local |
16,623 | (4,819 | ) | 11,804 | ||||||
| Foreign |
8,403 | (2,377 | ) | 6,026 | ||||||
| $ | 57,567 | $ | 33 | $ | 57,600 | |||||
| 2008 |
||||||||||
| U.S. Federal |
$ | 55,884 | $ | 2,006 | $ | 57,890 | ||||
| State and local |
14,540 | (3,691 | ) | 10,849 | ||||||
| Foreign |
13,172 | (2,511 | ) | 10,661 | ||||||
| $ | 83,596 | $ | (4,196 | ) | $ | 79,400 | ||||
| 2007 |
||||||||||
| U.S. Federal |
$ | 132,235 | $ | 32,673 | $ | 164,908 | ||||
| State and local |
16,963 | (642 | ) | 16,321 | ||||||
| Foreign |
10,261 | 1,010 | 11,271 | |||||||
| $ | 159,459 | $ | 33,041 | $ | 192,500 | |||||
The provision for income taxes exceeds the amount of income tax determined by applying the U.S. Federal statutory rate of 35% to income before taxes as a result of the following:
| (in thousands) | 2009 | 2008 | 2007 | |||||||||
| U.S. Federal taxes at statutory rate |
$ | 52,080 | $ | 50,793 | $ | 168,387 | ||||||
| State and local taxes (benefit), net of U.S. Federal tax |
(4,484 | ) | (2,401 | ) | 10,161 | |||||||
| Valuation allowance against state tax benefits, net of U.S. Federal tax |
12,157 | 9,453 | 448 | |||||||||
| Goodwill impairments |
2,972 | 26,795 | — | |||||||||
| Tax provided on foreign subsidiary earnings and distributions at less than the expected U.S. Federal statutory tax rate |
(1,035 | ) | (4,501 | ) | (1,777 | ) | ||||||
| Tax provided on foreign affiliate earnings at more than the expected U.S. Federal statutory tax rate |
— | — | 13,254 | |||||||||
| Other, net |
(4,090 | ) | (739 | ) | 2,027 | |||||||
| Provision for income taxes |
$ | 57,600 | $ | 79,400 | $ | 192,500 | ||||||
Results for 2009 include $3.1 million of prior-year tax benefits. Results for 2008 include a $4.6 million provision to return adjustment from 2007. Results for 2007 include an additional $12.9 million in income tax expense related to Bowater Mersey, the Company’s 49% owned affiliate based in Canada. The Company concluded that the 2008 provision to return adjustment and the 2007 Bowater Mersey adjustment were not material to the Company’s financial position or results of operations for 2008, 2007 and prior years, based on its consideration of quantitative and qualitative factors. Results for 2007 also include a $6.3 million income tax benefit related to a change in certain state income tax laws enacted in the second quarter of 2007.
Deferred income taxes at January 3, 2010 and December 28, 2008, consist of the following:
| (in thousands) | 2009 | 2008 | ||||||
| Accrued postretirement benefits |
$ | 30,865 | $ | 29,527 | ||||
| Other benefit obligations |
103,691 | 108,427 | ||||||
| Accounts receivable |
35,030 | 31,100 | ||||||
| State income tax loss carryforwards |
26,882 | 16,859 | ||||||
| U.S. Federal income tax loss carryforwards |
8,771 | 10,494 | ||||||
| Foreign income tax loss carryforwards |
8,882 | 8,278 | ||||||
| Other |
36,272 | 27,844 | ||||||
| Deferred tax assets |
250,393 | 232,529 | ||||||
| Valuation allowance |
(26,239 | ) | (13,197 | ) | ||||
| Deferred tax assets, net |
$ | 224,154 | $ | 219,332 | ||||
| Property, plant and equipment |
149,529 | 137,935 | ||||||
| Prepaid pension cost |
160,199 | 126,805 | ||||||
| Unrealized gain on available-for-sale securities |
52,338 | 48,441 | ||||||
| Affiliate operations |
8,672 | 16,197 | ||||||
| Goodwill and other intangible assets |
261,621 | 239,346 | ||||||
| Deferred tax liabilities |
$ | 632,359 | $ | 568,724 | ||||
| Deferred income tax liabilities, net |
$ | 408,205 | $ | 349,392 | ||||
Deferred U.S. and state income taxes have been recorded for undistributed earnings of investments in foreign subsidiaries to the extent taxable dividend income would be recognized if such earnings were distributed. Deferred income taxes recorded for undistributed earnings of investments in foreign subsidiaries are net of foreign tax credits estimated to be available.
Deferred U.S. and state income taxes have not been recorded for the full book value and tax basis differences related to investments in foreign subsidiaries because such investments are expected to be indefinitely held. The book value exceeded the tax basis of investments in foreign subsidiaries by approximately $67.0 million and $77.6 million at January 3, 2010 and December 28, 2008, respectively. If the investments in foreign subsidiaries were held for sale instead of expected to be held indefinitely, additional U.S. and state deferred income tax liabilities, net of foreign tax credits estimated to be available on undistributed earnings, of approximately $16.4 million and $16.6 million would have been recorded at January 3, 2010 and December 28, 2008, respectively.
The Company has approximately $525.6 million of state income tax loss carryforwards available to offset future state taxable income and has established, with respect to these losses, approximately $26.9 million in deferred state income taxes, net of U.S. Federal income tax. The Company has also established approximately
2009 FORM 10-K 67
Table of Contents
$10.7 million in valuation allowances against net deferred state taxes for the portion of state tax loss carryforwards that may not be fully utilized to reduce future state taxable income. State income tax loss carryforwards, if unutilized, will start to expire approximately as follows:
| (in millions) | |||
| 2010 |
$ | 7.2 | |
| 2011 |
5.3 | ||
| 2012 |
3.8 | ||
| 2013 |
7.2 | ||
| 2014 |
6.4 | ||
| 2015 and after |
495.7 | ||
| Total |
$ | 525.6 | |
The Company has approximately $25.0 million of U.S. Federal income tax loss carryforwards obtained as a result of prior stock acquisitions. These U.S. Federal income tax loss carryforwards are expected to be fully utilized; during 2010 through 2013, approximately $5.0 million a year is expected to be utilized, and during 2014 through 2025, the balance is expected to be utilized. The Company has established approximately $8.8 million in deferred U.S. Federal tax benefits with respect to these losses.
The Company has approximately $31.0 million of foreign income tax loss carryforwards, mainly as a result of prior stock acquisitions, that are available to offset future foreign taxable income, and has established, with respect to these losses, approximately $8.9 million in deferred foreign income tax benefits. The Company has also established approximately $3.0 million in valuation allowances against the deferred tax benefits recorded for the portion of foreign tax losses that may not be fully utilized to reduce future foreign taxable income. Approximately $28.0 million of foreign income tax loss carryforwards may be carried forward indefinitely, and $3.0 million of foreign loss carryforwards, if unutilized, will start to expire in 2012.
The Company has established $23.3 million in valuation allowances against state income tax benefits recognized, net of U.S. Federal income tax. As stated above, approximately $10.7 million of the valuation allowances, net of U.S. Federal income tax, relate to state income tax loss carryforwards. The Company has established valuation allowances against state income tax benefits recognized, without considering potentially offsetting deferred tax liabilities established with respect to prepaid pension cost and goodwill. Prepaid pension cost and goodwill have not been considered a source of future taxable income for realizing deferred tax benefits recognized since these temporary differences are not likely to reverse in the foreseeable future. The valuation allowances established against state income tax benefits recorded may increase or decrease within the next 12 months, based on operating results or the market value of investment holdings; as a result, the Company is unable to estimate the potential tax impact, given the uncertain operating and market environment. The Company has not recorded valuation allowances against any U.S. Federal income tax benefits and has established valuation allowances against foreign income tax benefits recorded only with respect to certain foreign tax loss carryforwards. The Company does not currently anticipate that within the next twelve months there will be any events requiring significant increases or decreases in U.S. Federal or foreign valuation allowances.
The changes in deferred tax valuation allowances during 2009 and 2008 were as follows:
| (in thousands) |
Balance at Beginning of Period |
Additions – Costs and Expenses |
Deductions | Balance at End of Period | |||||||||
| Year Ended January 3, 2010 |
$ | 13,197 | $ | 13,042 | — | $ | 26,239 | ||||||
| Year Ended December 28, 2008 |
$ | 5,535 | $ | 9,453 | $ | (1,791 | ) | $ | 13,197 | ||||
The Company files income tax returns with the U.S. Federal government and various state and foreign jurisdictions, with the U.S. Federal considered the only major tax jurisdiction. The statute of limitations has expired on all consolidated U.S. Federal corporate income tax returns filed through 2005, and the Internal Revenue Service is not currently examining any of the post-2005 returns filed by the Company.
The Company has determined that there are no material transactions or material tax positions taken by the Company that would fail to meet the more-likely-than-not threshold for recognizing transactions or tax positions in the financial statements. In making this determination, the Company presumes that all matters will be examined with full knowledge of all relevant information by appropriate taxing authorities and that the Company will pursue, if necessary, resolution by related appeals or litigation. The Company has accrued a tax liability for various tax positions reflected in the consolidated financial statements where it is uncertain whether the tax benefit associated with the tax positions will ultimately be recognized in full. The amount of, and changes to, this accrued tax liability are not material to the Company’s financial position or results of operations, and the Company does not expect the total amount of this accrued tax liability or the gross amount of any unrecognized tax benefits to significantly increase or decrease within the next 12 months.
| I. | DEBT |
Long-term debt consists of the following:
| (in millions) | January 3, 2010 |
December 28, 2008 |
||||||
| Commercial paper borrowings |
$ | — | $ | 150.0 | ||||
| 7.25% unsecured notes due February 1, 2019 |
396.2 | — | ||||||
| 5.5% unsecured notes due February 15, 2009 |
— | 399.9 | ||||||
| Other indebtedness |
3.1 | 3.9 | ||||||
| Total |
399.3 | 553.8 | ||||||
| Less current portion |
(3.1 | ) | (153.8 | ) | ||||
| Total long-term debt |
$ | 396.2 | $ | 400.0 | ||||
At December 28, 2008, the average interest rate on the Company’s outstanding commercial paper borrowings was 0.2%. The Company’s other indebtedness at January 3, 2010 and
68 THE WASHINGTON POST COMPANY
Table of Contents
December 28, 2008 is at interest rates of 5% to 6% and matures in 2010. The final interest payment on the 5.5% unsecured notes was made in February 2009.
In January 2009, the Company issued $400 million in unsecured ten-year fixed-rate notes due February 1, 2019 (“the Notes”). The Notes have a coupon rate of 7.25% per annum, payable semi-annually on February 1 and August 1, beginning August 1, 2009. The Company used the net proceeds from the sale of the Notes and other cash to repay $400 million of 5.5% notes that matured on February 15, 2009. Under the terms of the Notes, unless the Company has exercised its right to redeem the Notes, the Company is required to offer to repurchase the Notes in cash at 101% of the principal amount, plus accrued and unpaid interest, upon the occurrence of both a Change of Control and Below Investment Grade Rating Events as described in the Prospectus Supplement of January 27, 2009.
The Company entered a $500 million five-year revolving credit agreement with a group of banks on August 8, 2006 (the “2006 Credit Agreement”). This agreement supports the issuance of the Company’s commercial paper, but the Company may also draw on the facility for general corporate purposes. The 2006 Credit Agreement will expire on August 8, 2011. The Company has not borrowed any money under this agreement. Any borrowings that are outstanding under the 2006 Credit Agreement would have to be repaid on or prior to the final termination date.
Under the terms of the 2006 Credit Agreement, the Company is required to pay a facility fee at an annual rate of between 0.04% and 0.10% of the amount of the facility, depending on the Company’s long-term debt ratings. Any borrowings are made on an unsecured basis and bear interest, at the Company’s option, at Citibank’s base rate or at a rate based on LIBOR plus an applicable margin that also depends on the Company’s long-term debt ratings. The 2006 Credit Agreement contains terms and conditions, including remedies in the event of a default by the Company, typical of facilities of this type and, among other things, requires the Company to maintain at least $1 billion of consolidated shareholders’ equity.
During 2009 and 2008, the Company had average borrowings outstanding of approximately $426.7 million and $492.3 million, respectively, at average annual interest rates of approximately 6.9% and 4.9%, respectively. The Company incurred net interest costs on its borrowings of $29.0 million, $19.0 million and $12.7 million during 2009, 2008 and 2007, respectively.
At January 3, 2010, the fair value of the Company’s 7.25% unsecured notes, based on quoted market prices, totaled $443.1 million, compared with the carrying amount of $396.2 million. At December 28, 2008, the fair value of the Company’s 5.5% unsecured notes, based on quoted market prices, totaled $397.8 million, compared with the carrying amount of $399.9 million. The carrying value of the Company’s other unsecured debt at January 3, 2010 approximates fair value.
| J. | REDEEMABLE PREFERRED STOCK |
In connection with the acquisition of a cable television system in 1996, the Company issued 11,947 shares of its Series A preferred stock. On February 23, 2000, the Company issued an additional 1,275 shares related to this transaction. From 1998 to 2009, 1,696 shares of Series A preferred stock were redeemed at the request of Series A preferred stockholders.
The Series A preferred stock has a par value of $1.00 per share and a liquidation preference of $1,000 per share; it is redeemable by the Company at any time on or after October 1, 2015, at a redemption price of $1,000 per share. In addition, the holders of such stock have a right to require the Company to purchase their shares at the redemption price during an annual 60-day election period; the first such period began on February 23, 2001. Dividends on the Series A preferred stock are payable four times a year at the annual rate of $80.00 per share and in preference to any dividends on the Company’s common stock. The Series A preferred stock is not convertible into any other security of the Company, and the holders thereof have no voting rights except with respect to any proposed changes in the preferences and special rights of such stock.
| K. | CAPITAL STOCK, STOCK AWARDS AND STOCK OPTIONS |
Capital Stock. Each share of Class A common stock and Class B common stock participates equally in dividends. The Class B stock has limited voting rights and as a class has the right to elect 30% of the Board of Directors; the Class A stock has unlimited voting rights, including the right to elect a majority of the Board of Directors. In the third quarter of 2007, a majority of the Company’s Class A shareholders voted to convert 430,557, or 25%, of the Class A shares of the Company to an equal number of Class B shares. The conversion had no impact on the voting rights of the Class A and Class B common stock.
During 2009, 2008 and 2007, the Company purchased a total of 145,040, 167,642 and 54,506 shares, respectively, of its Class B common stock at a cost of approximately $61.0 million, $99.0 million and $42.0 million, respectively. At January 3, 2010, the Company had authorization from the Board of Directors to purchase up to 100,916 shares of Class B common stock. In January 2010, the Board of Directors increased the authorization to a total of 750,000 shares of Class B common stock.
Stock Awards. In 1982, the Company adopted a long-term incentive compensation plan, which, among other provisions, authorizes the awarding of Class B common stock to key employees. Stock awards made under this incentive compensation plan are primarily subject to the general restriction that stock awarded to a participant will be forfeited and revert to Company ownership if the participant’s employment terminates before the end of a specified period of service to the Company. Some of the awards are also subject to performance conditions and will be forfeited and revert to Company ownership if the conditions are not met. At January 3, 2010, there were 151,395 shares reserved for issuance under the incentive compensation plan. Of this number,
2009 FORM 10-K 69
Table of Contents
66,020 shares were subject to awards outstanding and 85,375 shares were available for future awards. Activity related to stock awards under the long-term incentive compensation plan for the years ended January 3, 2010, December 28, 2008 and December 30, 2007, was as follows:
| 2009 | 2008 | 2007 | ||||||||||||||||
| Number of Shares |
Average Award Price |
Number of Shares |
Average Award Price |
Number of Shares |
Average Award Price | |||||||||||||
| Beginning of year, unvested |
32,785 | $ | 796.52 | 34,355 | $ | 813.99 | 29,105 | $ | 815.55 | |||||||||
| Awarded |
48,440 | 415.08 | 3,550 | 685.00 | 19,260 | 759.66 | ||||||||||||
| Vested |
(13,386 | ) | 920.32 | (1,147 | ) | 968.05 | (12,838 | ) | 726.94 | |||||||||
| Forfeited |
(1,819 | ) | 672.40 | (3,973 | ) | 798.37 | (1,172 | ) | 913.33 | |||||||||
| End of year, unvested |
66,020 | $ | 494.97 | 32,785 | $ | 796.52 | 34,355 | $ | 813.99 | |||||||||
For the share awards outstanding at January 3, 2010, the aforementioned restriction will lapse in 2010 for 825 shares, in 2011 for 13,620 shares, in 2012 for 3,850 shares and in 2013 for 36,725 shares. Also, 11,000 shares have restrictions that will lapse once performance conditions associated with the awards have been met. Stock-based compensation costs resulting from Company stock awards reduced net income by $4.6 million, $3.7 million and $3.7 million in 2009, 2008 and 2007, respectively.
As of January 3, 2010, there was $20.5 million of total unrecognized compensation expense related to this plan. That cost is expected to be recognized on a straight-line basis over a weighted average period of 1.9 years.
Stock Options. The Company’s employee stock option plan reserves 1,900,000 shares of the Company’s Class B common stock for options to be granted under the plan. The purchase price of the shares covered by an option cannot be less than the fair value on the granting date. Options generally vest over four years and have a maximum term of ten years. At January 3, 2010, there were 362,525 shares reserved for issuance under the stock option plan, of which 90,569 shares were subject to options outstanding and 271,956 shares were available for future grants.
Activity related to options outstanding for the years ended January 3, 2010, December 28, 2008 and December 30, 2007 was as follows:
| 2009 | 2008 | 2007 | ||||||||||||||||
| Number of Shares |
Average Option Price |
Number Shares |
Average Option Price |
Number Shares |
Average Option Price | |||||||||||||
| Beginning of year |
87,025 | $ | 581.17 | 92,275 | $ | 606.89 | 109,175 | $ | 593.82 | |||||||||
| Granted |
24,294 | 421.95 | 17,000 | 402.71 | — | — | ||||||||||||
| Exercised |
— | — | (17,250 | ) | 533.94 | (16,275 | ) | 519.12 | ||||||||||
| Expired or forfeited |
(20,750 | ) | 637.99 | (5,000 | ) | 612.00 | (625 | ) | 609.62 | |||||||||
| End of year |
90,569 | $ | 525.44 | 87,025 | $ | 581.17 | 92,275 | $ | 606.89 | |||||||||
Of the shares covered by options outstanding at the end of 2009, 51,775 are now exercisable; 12,073 will become exercisable in 2010; 10,323 will become exercisable in 2011; 10,324 will become exercisable in 2012; and 6,074 will become exercisable in 2013. For 2009, 2008 and 2007, the Company recorded expense of $1.4 million, $1.1 million and $1.2 million related to this plan, respectively. Information related to stock options outstanding and exercisable at January 3, 2010 is as follows:
| Options Outstanding | Options Exercisable | |||||||||||||
| Range of Exercise Prices |
Shares Outstanding at 01/03/2010 |
Weighted Average Remaining Contractual Life (yrs.) |
Weighted Average Exercise Price |
Shares Exercisable at 01/03/2010 |
Weighted Average Remaining Contractual Life (yrs.) |
Weighted Average Exercise Price | ||||||||
| $369–392 |
16,000 | 9.1 | $ | 370.86 | 3,750 | 9.0 | $ | 369.48 | ||||||
| 419–439 |
23,294 | 10.0 | 423.25 | — | — | — | ||||||||
| 503–586 |
29,400 | 1.4 | 515.28 | 29,400 | 1.4 | 515.28 | ||||||||
| 652–693 |
2,500 | 8.0 | 660.03 | 1,000 | 6.5 | 672.21 | ||||||||
| 729–763 |
14,875 | 5.3 | 733.54 | 13,125 | 5.0 | 734.05 | ||||||||
| 816 |
1,500 | 4.0 | 816.05 | 1,500 | 4.0 | 816.05 | ||||||||
| 954 |
3,000 | 5.0 | 953.50 | 3,000 | 5.0 | 953.50 | ||||||||
| 90,569 | 5.9 | $ | 525.44 | 51,775 | 3.2 | $ | 597.32 | |||||||
At January 3, 2010, the intrinsic value for all options outstanding, exercisable and unvested was $1.5 million, $0.3 million and $1.2 million, respectively. The intrinsic value of a stock option is the amount by which the market value of the underlying stock exceeds the exercise price of the option. The market value of the Company’s stock was $439.60 at January 3, 2010. At January 3, 2010, there were 38,794 unvested options related to this plan with an average exercise price of $429.51 and a weighted average remaining contractual term of 9.5 years. At December 28, 2008, there were 22,219 unvested options with an average exercise price of $480.57.
As of January 3, 2010, total unrecognized stock-based compensation expense related to this plan was $3.7 million, which is expected to be recognized on a straight-line basis over a weighted average period of approximately 2.1 years. There were no options exercised during 2009. The total intrinsic value of options exercised during 2008 and 2007 was $2.4 million and $4.7 million, respectively; a tax benefit from these stock option exercises of $1.0 million and $1.9 million was realized during 2008 and 2007, respectively.
During 2009 and 2008, all options were granted at an exercise price equal to the fair market value of the Company’s common stock at the date of grant. During 2009, the Company granted options of 1,000, 11,944, 10,000 and 1,350, with a weighted average fair value of $95.05, $100.27, $118.98 and $121.29, respectively. During 2008, the Company granted options of 2,000 and 15,000, with a weighted average fair value of $159.93 and $79.24, respectively. There were no options granted during 2007.
70 THE WASHINGTON POST COMPANY
Table of Contents
The fair value of options at date of grant was estimated using the Black-Scholes method utilizing the following assumptions:
| 2009 | 2008 | |||
| Expected life (years) |
7 | 7 | ||
| Interest rate |
2.29%–3.08% | 1.91%–3.31% | ||
| Volatility |
26.13%–28.62% | 20.41%–25.39% | ||
| Dividend yield |
1.96%–2.20% | 1.32%–2.33% |
The Company also maintains a stock option plan at Kaplan that provides for the issuance of Kaplan stock options to certain members of Kaplan’s management. The Kaplan stock option plan was adopted in 1997 and initially reserved 15%, or 150,000 shares, of Kaplan’s common stock for awards to be granted under the plan. Under the provisions of this plan, options are issued with an exercise price equal to the estimated fair value of Kaplan’s common stock, and options vest ratably over the number of years specified (generally four to five years) at the time of the grant. Upon exercise, an option holder may receive Kaplan shares or cash equal to the difference between the exercise price and the then fair value. The fair value of Kaplan’s common stock is determined by the Company’s compensation committee of the Board of Directors. In January 2010, the committee set the fair value price at $1,975 per share. Option holders have a 30-day window in which they may exercise at this price, after which time the compensation committee has the right to determine a new price in the event of an exercise.
In November 2008, Kaplan’s chief executive officer resigned. The executive exercised 40,805 Kaplan stock options, sold 6,572 Kaplan shares and forfeited 21,526 unvested Kaplan stock options at the time of his resignation. A Kaplan senior manager continues to hold the remaining 2,000 outstanding Kaplan stock options, which expire in 2011.
Activity related to Kaplan stock options outstanding for the years ended January 3, 2010, December 28, 2008 and December 30, 2007 was as follows:
| 2009 | 2008 | 2007 | |||||||||||||||
| Number Shares |
Average Price |
Number Shares |
Average Price |
Number Shares |
Average Price | ||||||||||||
| Beginning of year |
2,000 | $ | 652.00 | 69,662 | $ | 1,611.89 | 73,352 | $ | 1,480.11 | ||||||||
| Granted |
— | — | 21,325 | 2,700.00 | 3,262 | 2,115.00 | |||||||||||
| Exercised |
— | — | (67,461 | ) | 1,701.38 | (6,952 | ) | 457.55 | |||||||||
| Forfeited |
— | — | (21,526 | ) | 2,498.56 | — | — | ||||||||||
| End of year |
2,000 | $ | 652.00 | 2,000 | $ | 652.00 | 69,662 | $ | 1,611.89 | ||||||||
The compensation committee awarded a Kaplan senior manager Kaplan shares equal in value to $4.8 million for the 2007 fiscal year, and the expense of this award was recorded in the Company’s results of operations for the 2007 fiscal year. As a result, in the first quarter of 2008, 1,778 Kaplan shares were issued related to the 2007 Kaplan share awards. In the fourth quarter of 2007, a Kaplan senior manager exercised Kaplan stock options and received 1,750 Kaplan shares. In February 2010 and 2009, a Kaplan senior manager was granted 2,278 and 1,176 shares, respectively, of Kaplan restricted stock that vest over a three- year period.
Kaplan recorded stock compensation expense of $0.9 million for 2009, compared to a credit of $7.8 million for 2008 and expense of $41.3 million for 2007. There were no payouts in 2009. In 2008 and 2007, total net payouts were $85.1 million and $8.1 million, respectively. At December 31, 2009, the Company’s accrual balance related to Kaplan stock-based compensation totaled $9.2 million. At December 31, 2009, there was no unrecognized stock-based compensation expense related to stock options. The total intrinsic value of options exercised during 2008 was $67.4 million; a tax benefit from these stock option exercises of $26.3 million was realized during 2008.
Earnings Per Share. Basic earnings per share is based on the weighted average number of shares of common stock outstanding during each year. Diluted earnings per common share is based on the weighted average number of shares of common stock outstanding each year, adjusted for the dilutive effect of shares issuable under outstanding stock options and restricted stock.
The Company’s earnings per share (basic and diluted) for 2009, 2008 and 2007 are presented below:
| Fiscal Year Ended | |||||||||
| (in thousands, except per share amounts) |
January 3, 2010 |
December 28, 2008 |
December 30, 2007 | ||||||
| Net income available for common shares |
$ | 91,846 | $ | 64,776 | $ | 287,655 | |||
| Weighted average shares outstanding — basic |
9,332 | 9,408 | 9,492 | ||||||
| Effect of dilutive shares: |
|||||||||
| Stock options and restricted stock |
60 | 22 | 36 | ||||||
| Weighted average shares outstanding — diluted |
9,392 | 9,430 | 9,528 | ||||||
| Basic earnings per common share |
$ | 9.78 | $ | 6.89 | $ | 30.31 | |||
| Diluted earnings per common share |
$ | 9.78 | $ | 6.87 | $ | 30.19 | |||
The 2009, 2008 and 2007 diluted earnings per share amounts exclude the effects of 74,569, 29,875 and 7,500 stock options outstanding, respectively, as their inclusion would be antidilutive.
In 2009, the Company adopted new guidance which provides that unvested share-based payment awards that contain nonforfeitable rights to dividends are treated as participating securities and are
2009 FORM 10-K 71
Table of Contents
included in the computation of earnings per share under the two- class method. The amount attributable to the unvested restricted stock awards of the Company for 2009 was $612,000, reducing the net income available for common shares in the basic earnings per common share computation to $91.2 million. The implementation of this guidance did not have a material impact on the earnings per share data of the Company for 2008 and 2007.
| L. | PENSIONS AND OTHER POSTRETIREMENT PLANS |
The Company maintains various pension and incentive savings plans and contributes to several multiemployer plans on behalf of certain union-represented employee groups. Most of the Company’s employees are covered by these plans.
The Company also provides health care and life insurance benefits to certain retired employees. These employees become eligible for benefits after meeting age and service requirements.
The Company uses a measurement date of December 31 for its pension and other postretirement benefit plans.
Defined Benefit Plans. The Company’s defined benefit pension plans consist of various pension plans and a Supplemental Executive Retirement Plan (SERP) offered to certain executives of the Company.
In November 2008, Newsweek offered a Voluntary Retirement Incentive Program to certain employees, and 44 employees accepted the offer in the first quarter of 2009. Early retirement program expense of $6.6 million was recorded in 2009, which will be funded primarily from the assets of the Company’s pension plans. Newsweek offered a Voluntary Retirement Incentive Program to certain employees in the first quarter of 2008, and 117 employees accepted the offer. The early retirement program expense in 2008 totaled $28.3 million, which is being funded mostly from the assets of the Company’s pension plans.
The Company offered a Voluntary Retirement Incentive Program to certain employees of The Washington Post newspaper in the first quarter of 2009. A total of 221 employees accepted the offer, and early retirement program expense of $56.8 million was recorded in the second quarter of 2009, which will be funded primarily from the assets of the Company’s pension plans. In the third quarter of 2009, the Company offered a Voluntary Retirement Incentive Program to certain employees at Robinson Terminal Warehouse Corporation; $1.1 million in early retirement program expense was recorded in the third quarter of 2009, also to be funded from the assets of the Company’s pension plans. In the first quarter of 2008, a Voluntary Retirement Incentive Program was also offered to certain employees of The Washington Post newspaper and the corporate office; 236 employees accepted the offer; $82.8 million in early retirement program expense was recorded in 2008, also funded primarily from the assets of the Company’s pension plans.
The following table sets forth obligation, asset and funding information for the Company’s defined benefit pension plans at January 3, 2010 and December 28, 2008:
| Pension Plans | SERP | |||||||||||||||
| (in thousands) | 2009 | 2008 | 2009 | 2008 | ||||||||||||
| Change in Benefit Obligation |
||||||||||||||||
| Benefit obligation at beginning of year |
$ | 1,007,277 | $ | 840,170 | $ | 69,587 | $ | 57,462 | ||||||||
| Service cost |
29,214 | 27,169 | 1,334 | 1,404 | ||||||||||||
| Interest cost |
56,994 | 52,986 | 4,128 | 4,141 | ||||||||||||
| Amendments |
64,541 | 105,174 | — | 5,903 | ||||||||||||
| Actuarial (gain) loss |
(45,498 | ) | 61,139 | 2,778 | 7,304 | |||||||||||
| Benefits paid and other |
(81,157 | ) | (79,361 | ) | (3,982 | ) | (6,627 | ) | ||||||||
| Benefit obligation at end of year |
$ | 1,031,371 | $ | 1,007,277 | $ | 73,845 | $ | 69,587 | ||||||||
| Change in Plan Assets |
||||||||||||||||
| Fair value of assets at beginning of year |
$ | 1,327,329 | $ | 1,874,959 | $ | — | $ | — | ||||||||
| Actual return (loss) on plan assets |
194,644 | (468,269 | ) | — | — | |||||||||||
| Employer contributions and other |
— | — | 3,982 | 6,627 | ||||||||||||
| Benefits paid and other |
(81,157 | ) | (79,361 | ) | (3,982 | ) | (6,627 | ) | ||||||||
| Fair value of assets at end of year |
$ | 1,440,816 | $ | 1,327,329 | $ | — | $ | — | ||||||||
| Funded status |
$ | 409,445 | $ | 320,052 | $ | (73,845 | ) | $ | (69,587 | ) | ||||||
The accumulated benefit obligation for the Company’s pension plans at January 3, 2010 and December 28, 2008, was $954.8 million and $917.3 million, respectively. The accumulated benefit obligation for the Company’s SERP at January 3, 2010 and December 28, 2008 was $67.8 million and $57.8 million, respectively. The amounts recognized in the Company’s Consolidated Balance Sheets for its defined benefit pension plans at January 3, 2010 and December 28, 2008 are as follows:
| Pension Plans | SERP | ||||||||||||||
| (in thousands) | 2009 | 2008 | 2009 | 2008 | |||||||||||
| Noncurrent asset |
$ | 409,445 | $ | 346,325 | $ | — | $ | — | |||||||
| Current liability |
— | — | (3,472 | ) | (3,545 | ) | |||||||||
| Noncurrent liability |
— | (26,273 | ) | (70,373 | ) | (66,042 | ) | ||||||||
| Recognized asset (liability) |
$ | 409,445 | $ | 320,052 | $ | (73,845 | ) | $ | (69,587 | ) | |||||
Key assumptions utilized for determining the benefit obligation at January 3, 2010 and December 28, 2008 are as follows:
| Pension Plans | SERP | |||||||||||
| 2009 | 2008 | 2009 | 2008 | |||||||||
| Discount rate |
6.0 | % | 5.75 | % | 6.0 | % | 6.0 | % | ||||
| Rate of compensation increase |
4.0 | % | 4.0 | % | 4.0 | % | 4.0 | % | ||||
The Company made no contributions to its pension plans in 2009, 2008 and 2007, and the Company does not expect to make any contributions in 2010. The Company made contributions to its SERP of $4.0 million and $6.6 million for the years ended January 3, 2010 and December 28, 2008, respectively, as the plan is unfunded, and the Company covers benefit payments. The Company makes contributions to the SERP based on actual benefit payments.
At January 3, 2010, future estimated benefit payments, excluding charges for early retirement programs, are as follows:
| (in millions) | Pension Plans | SERP | ||||
| 2010 |
$ | 54.2 | $ | 3.6 | ||
| 2011 |
$ | 53.2 | $ | 3.7 | ||
| 2012 |
$ | 54.8 | $ | 4.3 | ||
| 2013 |
$ | 55.9 | $ | 4.4 | ||
| 2014 |
$ | 58.2 | $ | 4.6 | ||
| 2015–2019 |
$ | 323.6 | $ | 26.3 | ||
72 THE WASHINGTON POST COMPANY
Table of Contents
The total cost (benefit) arising from the Company’s defined benefit pension plans for the years ended January 3, 2010, December 28, 2008 and December 30, 2007 consists of the following components:
| Pension Plans | SERP | |||||||||||||||||||||||
| (in thousands) | 2009 | 2008 | 2007 | 2009 | 2008 | 2007 | ||||||||||||||||||
| Service cost |
$ | 29,214 | $ | 27,169 | $ | 28,115 | $ | 1,334 | $ | 1,404 | $ | 1,542 | ||||||||||||
| Interest cost |
56,994 | 52,986 | 47,201 | 4,128 | 4,141 | 3,213 | ||||||||||||||||||
| Expected return on assets |
(98,780 | ) | (104,229 | ) | (98,066 | ) | — | — | — | |||||||||||||||
| Amortization of transition asset |
(42 | ) | (42 | ) | (53 | ) | — | — | — | |||||||||||||||
| Amortization of prior service cost |
4,505 | 4,633 | 5,057 | 446 | 446 | 446 | ||||||||||||||||||
| Recognized actuarial |
40 | (6,168 | ) | (4,534 | ) | 1,676 | 2,325 | 1,565 | ||||||||||||||||
| Net periodic (benefit) cost for the year |
(8,069 | ) | (25,651 | ) | (22,280 | ) | 7,584 | 8,316 | 6,766 | |||||||||||||||
| Early retirement programs expense |
64,541 | 105,174 | — | — | 5,903 | — | ||||||||||||||||||
| Total cost (benefit) for the year |
$ | 56,472 | $ | 79,523 | $ | (22,280 | ) | $ | 7,584 | $ | 14,219 | $ | 6,766 | |||||||||||
| Other Changes in Plan Assets and Benefit Obligations Recognized in Other Comprehensive Income: |
||||||||||||||||||||||||
| Current year actuarial (gain) loss |
$ | (141,362 | ) | $ | 633,639 | $ | (36,568 | ) | $ | 2,778 | $ | 7,304 | $ | 53 | ||||||||||
| Current year prior service credit |
— | — | (179 | ) | — | — | — | |||||||||||||||||
| Amortization of transition asset |
42 | 42 | 53 | — | — | — | ||||||||||||||||||
| Amortization of prior service cost |
(4,505 | ) | (4,633 | ) | (5,057 | ) | (446 | ) | (446 | ) | (446 | ) | ||||||||||||
| Recognized actuarial (loss) gain |
(40 | ) | 6,168 | 4,534 | (1,676 | ) | (2,325 | ) | (1,565 | ) | ||||||||||||||
| Total recognized in other comprehensive income (before tax effects) |
$ | (145,865 | ) | $ | 635,216 | $ | (37,217 | ) | $ | 656 | $ | 4,533 | $ | (1,958 | ) | |||||||||
| Total recognized in total (benefit) cost and other comprehensive income (before tax effects) |
$ | (89,393 | ) | $ | 714,739 | $ | (59,497 | ) | $ | 8,240 | $ | 18,752 | $ | 4,808 | ||||||||||
The costs for the Company’s defined benefit pension plans are actuarially determined. Below are the key assumptions utilized to determine periodic cost for the years ended January 3, 2010, December 28, 2008 and December 30, 2007:
| Pension Plans | SERP | |||||||||||||||||
| 2009 | 2008 | 2007 | 2009 | 2008 | 2007 | |||||||||||||
| Discount rate |
5.75 | % | 6.0 | % | 6.0 | % | 5.75 | % | 6.0 | % | 6.0 | % | ||||||
| Expected return on plan assets |
6.5 | % | 6.5 | % | 6.5 | % | — | — | — | |||||||||
| Rate of compensation increase |
4.0 | % | 4.0 | % | 4.0 | % | 4.0 | % | 4.0 | % | 4.0 | % | ||||||
At January 3, 2010 and December 28, 2008, accumulated other comprehensive income (AOCI) includes the following components of unrecognized net periodic cost for the defined benefit plans:
| Pension Plans | SERP | |||||||||||||||
| (in thousands) | 2009 | 2008 | 2009 | 2008 | ||||||||||||
| Unrecognized actuarial loss |
$ | 14,472 | $ | 155,874 | $ | 17,155 | $ | 16,053 | ||||||||
| Unrecognized prior service cost |
27,659 | 32,164 | 720 | 1,166 | ||||||||||||
| Unrecognized transition asset |
(29 | ) | (71 | ) | — | — | ||||||||||
| Gross amount |
42,102 | 187,967 | 17,875 | 17,219 | ||||||||||||
| Deferred tax benefit |
(16,841 | ) | (75,187 | ) | (7,150 | ) | (6,888 | ) | ||||||||
| Net amount |
$ | 25,261 | $ | 112,780 | $ | 10,725 | $ | 10,331 | ||||||||
During 2010, the Company expects to recognize the following amortization components of net periodic cost for the defined benefit plans:
| 2010 | |||||||
| (in thousands) | Pension Plans | SERP | |||||
| Actuarial loss recognition |
$ | — | $ | 1,154 | |||
| Prior service cost recognition |
4,413 | 386 | |||||
| Transition asset recognition |
(29 | ) | — | ||||
Defined Benefit Plan Assets. The Company’s defined benefit pension obligations are funded by a portfolio made up of a relatively small number of stocks and high-quality fixed-income securities that are held by a third-party trustee. As of December 31, 2009 and December 31, 2008, the assets of the Company’s pension plans were allocated as follows:
| Pension Plan Asset Allocations | ||||||||||
| December 31, 2009 |
December 31, 2008 |
|||||||||
| U.S. equities |
74 | % | 73 | % | ||||||
| U.S. fixed income |
18 | % | 22 | % | ||||||
| International equities |
8 | % | 5 | % | ||||||
| Total |
100 | % | 100 | % | ||||||
Essentially all of the assets are actively managed by two investment companies. The goal of the investment managers is to produce moderate long-term growth in the value of these assets, while protecting them against large decreases in value. Both of these managers may invest in a combination of equity and fixed-income securities and cash. The managers are not permitted to invest in securities of the Company or in alternative investments. The investment
2009 FORM 10-K 73
Table of Contents
managers cannot invest more than 20% of the assets at the time of purchase in the stock of Berkshire Hathaway or more than 10% of the assets in the securities of any other single issuer, except for obligations of the U.S. Government, without receiving prior approval by the Plan administrator. As of December 31, 2009, up to 13% of the assets could be invested in international stocks, and no less than 9% of the assets could be invested in fixed-income securities. None of the assets is managed internally by the Company.
In determining the expected rate of return on plan assets, the Company considers the relative weighting of plan assets, the historical performance of total plan assets and individual asset classes and economic and other indicators of future performance. In addition, the Company may consult with and consider the input of financial and other professionals in developing appropriate return benchmarks.
The Company evaluated its defined benefit pension plans’ asset portfolios for the existence of significant concentrations (defined as greater than 10% of plan assets) of credit risk as of January 3, 2010. Types of concentrations that were evaluated include, but are not limited to, investment concentrations in a single entity, type of industry, foreign country and individual fund. Included in the assets are $274.3 million and $267.2 million of Berkshire Hathaway Class A and Class B common stock at December 31, 2009 and December 31, 2008, respectively. Approximately 41% of the Berkshire Hathaway common stock was subsequently sold in February 2010.
The following table presents the Company’s pension plan assets using the fair value hierarchy as of January 3, 2010. The fair value hierarchy has three levels based on the reliability of the inputs used to determine fair value. Level 1 refers to fair values determined based on quoted prices in active markets for identical assets. Level 2 refers to fair values estimated using significant other observable inputs, and Level 3 includes fair values estimated using significant unobservable inputs.
| (in thousands) | Level 1 | Level 2 | Level 3 | Total | ||||||||
| Cash equivalents and other short-term investments |
$ | 189,986 | $ | 42,419 | $ | — | $ | 232,405 | ||||
| Equity securities |
||||||||||||
| U.S. equities |
1,061,957 | — | — | 1,061,957 | ||||||||
| International equities |
115,153 | — | — | 115,153 | ||||||||
| Fixed-income securities |
||||||||||||
| Federal agency mortgage-backed securities |
— | 4,122 | — | 4,122 | ||||||||
| Corporate debt securities |
— | 17,270 | — | 17,270 | ||||||||
| Other fixed income |
— | 7,987 | — | 7,987 | ||||||||
| Total investments |
$ | 1,367,096 | $ | 71,798 | $ | — | 1,438,894 | |||||
| Cash |
247 | |||||||||||
| Receivables |
1,675 | |||||||||||
| Total |
$ | 1,440,816 | ||||||||||
Cash equivalents and other short-term investments—These investments are primarily held in U.S Treasury securities and registered money market funds. These investments are valued using a market approach based on the quoted market prices of the security, or inputs that include quoted market prices for similar instruments, and are classified as either Level 1 or Level 2 in the valuation hierarchy.
U.S. equities—These investments are held in common and preferred stock of U.S. and non-U.S. corporations traded on U.S. exchanges. Common and preferred shares are traded actively on exchanges, and price quotes for these shares are readily available. These investments are classified as Level 1 in the valuation hierarchy.
International equities—These investments are held in common and preferred stock issued by non-U.S. corporations. Common and preferred shares are traded actively on exchanges, and price quotes for these shares are readily available. These investments are classified as Level 1 in the valuation hierarchy.
Federal agency mortgage-backed securities—These investments consist of fixed-income securities issued by Federal Agencies and are valued using a bid evaluation process, with bid data provided by independent pricing sources. These investments are classified as Level 2 in the valuation hierarchy.
Corporate debt securities—These investments consist of fixed- income securities issued by U.S. corporations and are valued using a bid evaluation process, with bid data provided by independent pricing sources. These investments are classified as Level 2 in the valuation hierarchy.
Other fixed income—These investments consist of fixed-income securities issued in private placements and are valued using a bid evaluation process, with bid data provided by independent pricing sources. These investments are classified as Level 2 in the valuation hierarchy.
Other Postretirement Plans. The following table sets forth obligation, asset and funding information for the Company’s other postretirement plans at January 3, 2010 and December 28, 2008:
| Postretirement Plans | ||||||||
| (in thousands) | 2009 | 2008 | ||||||
| Change in Benefit Obligation |
||||||||
| Benefit obligation at beginning of year |
$ | 75,402 | $ | 86,132 | ||||
| Service cost |
3,871 | 3,770 | ||||||
| Interest cost |
4,168 | 4,846 | ||||||
| Amendments |
(1,399 | ) | 2,051 | |||||
| Actuarial loss (gain) |
10,564 | (17,436 | ) | |||||
| Curtailment gain |
(9,073 | ) | — | |||||
| Benefits paid, net of Medicare subsidy |
(4,502 | ) | (3,961 | ) | ||||
| Benefit obligation at end of year |
$ | 79,031 | $ | 75,402 | ||||
| Change in Plan Assets |
||||||||
| Fair value of assets at beginning of year |
$ | — | $ | — | ||||
| Employer contributions |
4,612 | 4,238 | ||||||
| Benefits paid |
(4,612 | ) | (4,238 | ) | ||||
| Fair value of assets at end of year |
$ | — | $ | — | ||||
| Funded status |
$ | (79,031 | ) | $ | (75,402 | ) | ||
74 THE WASHINGTON POST COMPANY
Table of Contents
The amounts recognized in the Company’s Consolidated Balance Sheets for its other postretirement plans at January 3, 2010 and December 28, 2008 are as follows:
| Postretirement Plans | ||||||||
| (in thousands) | 2009 | 2008 | ||||||
| Current liability |
$ | (5,359 | ) | $ | (4,410 | ) | ||
| Noncurrent liability |
(73,672 | ) | (70,992 | ) | ||||
| Recognized liability |
$ | (79,031 | ) | $ | (75,402 | ) | ||
In 2009, the Company made changes to the cable division’s retiree health care benefits program, resulting in a $7.7 million curtailment gain. Also in 2009, the Company eliminated life insurance benefits for new retirees on or after January 1, 2009, resulting in a $0.7 million curtailment gain.
The discount rates utilized for determining the benefit obligation at January 3, 2010 and December 28, 2008 for the post-retirement plans were 5.25% and 5.75%, respectively. The assumed health care cost trend rate used in measuring the postretirement benefit obligation at January 3, 2010 was 9.5% for pre-age 65, decreasing to 5.0% in the year 2019 and thereafter, and was 8.5% for post-age 65 benefits, decreasing to 5.0% in the year 2017 and thereafter.
Assumed health care cost trend rates have a significant effect on the amounts reported for the health care plans. A change of one percentage point in the assumed health care cost trend rates would have the following effects:
| (in thousands) | 1% Increase |
1% Decrease |
|||||
| Benefit obligation at end of year |
$ | 6,501 | $ | (5,763 | ) | ||
| Service cost plus interest cost |
$ | 917 | $ | (707 | ) | ||
The Company made contributions to its postretirement benefit plans of $4.6 million and $4.2 million for the years ended January 3, 2010 and December 28, 2008, respectively, as the plans are unfunded, and the Company covers benefit payments. The Company makes contributions to its postretirement plans based on actual benefit payments.
At January 3, 2010, future estimated benefit payments, net of Medicare subsidy, are as follows:
| (in millions) | Postretirement Plans | ||
| 2010 |
$ | 5.4 | |
| 2011 |
$ | 5.6 | |
| 2012 |
$ | 5.9 | |
| 2013 |
$ | 6.2 | |
| 2014 |
$ | 6.4 | |
| 2015–2019 |
$ | 36.4 | |
The total cost arising from the Company’s postretirement plans for the years ended January 3, 2010, December 28, 2008 and December 30, 2007, consists of the following components:
| Postretirement Plans | ||||||||||||
| (in thousands) | 2009 | 2008 | 2007 | |||||||||
| Service cost |
$ | 3,871 | $ | 3,770 | $ | 3,558 | ||||||
| Interest cost |
4,168 | 4,846 | 4,832 | |||||||||
| Amortization of prior service credit |
(4,607 | ) | (5,144 | ) | (4,860 | ) | ||||||
| Recognized actuarial gain |
(3,128 | ) | (1,485 | ) | (1,671 | ) | ||||||
| Net periodic cost |
304 | 1,987 | 1,859 | |||||||||
| Curtailment gain |
(8,353 | ) | — | — | ||||||||
| Total (benefit) cost for the year |
$ | (8,049 | ) | $ | 1,987 | $ | 1,859 | |||||
| Other changes in plan assets and benefit obligations recognized in other comprehensive income: |
||||||||||||
| Current year actuarial loss (gain) |
$ | 10,673 | $ | (17,158 | ) | $ | (329 | ) | ||||
| Current year prior service (credit) cost |
(1,399 | ) | 2,051 | (4,234 | ) | |||||||
| Amortization of prior service credit |
4,607 | 5,144 | 4,860 | |||||||||
| Recognized actuarial gain |
3,128 | 1,485 | 1,671 | |||||||||
| Curtailment gain |
(719 | ) | — | — | ||||||||
| Total recognized in other comprehensive income (before tax effects) |
$ | 16,290 | $ | (8,478 | ) | $ | 1,968 | |||||
| Total recognized in net periodic cost (benefit) and other comprehensive income (before tax effects) |
$ | 8,241 | $ | (6,491 | ) | $ | 3,827 | |||||
The costs for the Company’s postretirement plans are actuarially determined. The discount rates utilized to determine periodic cost for the years ended January 3, 2010, December 28, 2008 and December 30, 2007 were 5.75%, 5.80% and 5.85%, respectively.
At January 3, 2010 and December 28, 2008, accumulated other comprehensive income (AOCI) included the following components of unrecognized net periodic benefit for the postretirement plans, respectively:
| (in thousands) | January 3, 2010 |
December 28, 2008 |
||||||||||
| Unrecognized actuarial gain |
$ | (16,336 | ) | $ | (28,734 | ) | ||||||
| Unrecognized prior service credit |
(41,028 | ) | (44,920 | ) | ||||||||
| Gross amount |
(57,364 | ) | (73,654 | ) | ||||||||
| Deferred tax liability |
22,946 | 29,462 | ||||||||||
| Net amount |
$ | (34,418 | ) | $ | (44,192 | ) | ||||||
2009 FORM 10-K 75
Table of Contents
During 2010, the Company expects to recognize the following amortization components of net periodic cost for the postretirement plans:
| (in thousands) | 2010 | |||
| Actuarial gain recognition |
$ | (2,051 | ) | |
| Prior service credit recognition |
$ | (5,150 | ) | |
Multiemployer Pension Plans. Contributions to multiemployer pension plans, which are generally based on hours worked, amounted to $1.3 million in 2009, $1.3 million in 2008 and $1.5 million in 2007.
The Washington Post newspaper contributes to multiemployer pension plans on behalf of three union-represented employee groups: the CWA-ITU National Pension Plan on behalf of Post mailers, helpers and utility mailers; the IAM National Pension Fund on behalf of Post machinists; and the Central Pension Fund of the International Union of Operating Engineers on behalf of Post engineers, carpenters and painters. Contributions are made in accordance with the relevant collective bargaining agreements and are generally based on straight-time hours.
The Post has negotiated in collective bargaining the contractual right to withdraw from the IAM National Pension Fund and from the IUOE Central Pension Fund. The right to withdraw from the CWA-ITU National Pension Plan is the subject of contract negotiations. Of these multiemployer plans, the Post is a significant participant in only the CWA-ITU National Pension Plan. According to the most recent withdrawal liability estimate from the CWA-ITU National Pension Plan, the Post would have owed approximately $19 million in the event of a 2009 withdrawal. The Post expects to receive an updated withdrawal liability estimate from the CWA-ITU National Pension Plan by the end of the third quarter of 2010.
Savings Plans. The Company recorded expense associated with retirement benefits provided under incentive savings plans (primarily 401(k) plans) of approximately $21.0 million in 2009, $21.9 million in 2008 and $20.7 million in 2007.
| M. | LEASE AND OTHER COMMITMENTS |
The Company leases real property under operating agreements. Many of the leases contain renewal options and escalation clauses that require payments of additional rent to the extent of increases in the related operating costs.
At January 3, 2010, future minimum rental payments under noncancelable operating leases approximate the following:
| (in thousands) | |||
| 2010 |
$ | 140,665 | |
| 2011 |
119,537 | ||
| 2012 |
104,202 | ||
| 2013 |
91,206 | ||
| 2014 |
75,890 | ||
| Thereafter |
310,135 | ||
| $ | 841,635 | ||
Minimum payments have not been reduced by minimum sublease rentals of $0.8 million due in the future under noncancelable subleases.
Rent expense under operating leases included in operating costs was approximately $145.8 million, $142.6 million and $138.7 million in 2009, 2008 and 2007, respectively. Sublease income was approximately $0.7 million, $0.7 million and $1.9 million in 2009, 2008 and 2007, respectively.
The Company’s broadcast subsidiaries are parties to certain agreements that commit them to purchase programming to be produced in future years. At January 3, 2010, such commitments amounted to approximately $71.9 million. If such programs are not produced, the Company’s commitment would expire without obligation.
| N. | OTHER NON-OPERATING INCOME (EXPENSE) |
A summary of non-operating income (expense) for the years ended January 3, 2010, December 28, 2008 and December 30, 2007 follows:
| (in millions) | 2009 | 2008 | 2007 | ||||||||
| Foreign currency gains (losses), net |
$ | 16.9 | $ | (46.3 | ) | $ | 8.8 | ||||
| Impairment write-downs on cost method investments |
(3.8 | ) | (2.9 | ) | — | ||||||
| Gain on sales of marketable equity securities |
— | 47.3 | 0.4 | ||||||||
| Other gains (losses) |
0.1 | (0.3 | ) | 2.0 | |||||||
| Total |
$ | 13.2 | $ | (2.2 | ) | $ | 11.2 | ||||
As noted above, a large part of the Company’s non-operating income (expense) is from unrealized foreign currency gains or losses arising from the translation of British pound and Australian dollar-denominated intercompany loans into U.S. dollars. The unrealized foreign currency gains in 2009 and 2007 were the result of a weakening of the U.S. dollar against the British pound and the Australian dollar; the unrealized foreign currency losses in 2008 were the result of a significant strengthening of the U.S. dollar against the British pound and the Australian dollar.
| O. | CONTINGENCIES AND LOSSES |
Litigation and Legal Matters. Kaplan, Inc., a subsidiary of the Company, is a party to a previously disclosed class action antitrust lawsuit filed on April 29, 2005, by purchasers of BAR/BRI bar review courses from fall 1997 through July 2006 in the U.S. District Court for the Central District of California. On February 2, 2007, the parties filed a settlement agreement with the court, together with documents setting forth a procedure for class notice. The court approved the terms of the settlement on July 9, 2007. Certain class members filed an appeal to the case to the U.S. Court of Appeals for the Ninth Circuit. On April 23, 2009, the Ninth Circuit affirmed the approval of the settlement. The Ninth Circuit also vacated the district court’s award of attorney’s fees to class counsel and counsel to various objectors to the settlement and remanded to the U.S.
76 THE WASHINGTON POST COMPANY
Table of Contents
District Court to consider the attorney’s fees issue anew. That issue continues to be litigated; however, the attorney’s fees award will be paid from the escrowed settlement funds, so Kaplan should not be affected by the ultimate determination of the attorney’s fees issue. Effectiveness of the settlement is subject to court approval. On February 6, 2008, Kaplan was served with another purported class action lawsuit in the U.S. District Court for the Central District of California alleging claims substantially similar to those alleged in the previously settled lawsuit but on behalf of a putative class that included all persons who purchased a bar review course from BAR/BRI in the United States after the July 2006 cut-off for class membership in the prior action. West Publishing Corporation, which owns BAR/BRI, is a co-defendant. On April 15, 2008, the court granted defendants’ motion to dismiss. On May 20, 2008, the plaintiffs filed an appeal. The appeal is pending in the U.S. Court of Appeals for the Ninth Circuit. On November 20, 2009, Kaplan entered into a stipulation of settlement with the plaintiffs that would resolve the case as to Kaplan on a class-wide basis. The stipulation of settlement requires court approval to become effective. On April 29, 2009, Kaplan was served with a purported class action lawsuit by a purchaser of Kaplan’s LSAT preparation course, alleging that in 1997, BAR/BRI and Kaplan entered into a market allocation agreement in violation of U.S. antitrust laws. Kaplan has moved to dismiss this complaint and will continue to vigorously defend this lawsuit.
Several Kaplan subsidiaries are also subject to four complaints that include, among other allegations, claims under the federal False Claims Act (31U.S.C. § 3729, et seq.), relating to eligibility for Title IV funding. The U.S. Government declined to intervene in all four cases, which are captioned:
United States of America ex rel. Carlos Urquilla-Diaz, et al. v. Kaplan University et al. (unsealed March 25, 2008); United States of America ex rel. Jorge Torres v. Kaplan Higher Education Corp. (unsealed April 7, 2008); United States of America ex rel. Victoria Gatsiopoulos et al. v. ICM School of Business & Medical Careers et al. (unsealed September 2, 2008); and United States of America ex rel. Charles Jajdelski v. Kaplan Higher Education Corp. et al. (unsealed January 6, 2009).
The Diaz, Torres and Gatsiopoulos cases have been transferred to the U.S. District Court for the Southern District of Florida, where motions to dismiss have been filed in each case and await decision by the Court. The Jajdelski case is pending in the U.S. District Court for the District of Nevada, where a motion to dismiss also has been filed and awaits decision by the Court. The Company will continue to vigorously defend each of these actions.
The Company and its subsidiaries are parties to various other civil lawsuits and administrative proceedings that have arisen in the ordinary course of their businesses, including contract disputes, actions alleging libel, invasion of privacy, patent infringement, violations of applicable wage and hour laws and claims involving current and former students and employees. Management does not believe that any litigation pending against the Company will have a material adverse effect on its business or financial condition.
Student Financial Aid. The Company’s education division derives a portion of its net revenues from financial aid received by its students under Title IV programs administered by the U.S. Department of Education (the “Department of Education”) pursuant to the Federal Higher Education Act of 1965 (HEA), as amended. In order to participate in Title IV programs, the Company must comply with extensive statutory and regulatory requirements relating to its financial aid management, educational programs, financial strength, facilities, recruiting practices and various other matters. Among other things, the school must be licensed or otherwise authorized to offer its educational programs by the appropriate governmental body in the state or states in which it is physically located, be accredited by an accrediting agency recognized by the Department of Education and be certified to participate in the Title IV programs by the Department of Education. Schools are required periodically to apply for renewal of their authorization, accreditation or certification with the applicable state governmental bodies, accrediting agencies and the Department of Education. In accordance with Department of Education regulations, a number of the schools in Kaplan’s Higher Education division are combined into groups of two or more schools for the purpose of determining compliance with certain Title IV requirements. Including schools that are not combined with other schools for that purpose, the Higher Education Division has 33 Title IV reporting units. Failure to comply with the requirements of HEA or the Regulations could result in the restriction or loss of the ability to participate in Title IV programs and subject the Company to financial penalties.
Financial aid and assistance programs are subject to political and governmental budgetary considerations. There is no assurance that such funding will be maintained at current levels. Extensive and complex regulations in the United States govern all of the government financial assistance programs in which students participate.
For the years ended January 3, 2010, December 28, 2008 and December 30, 2007, approximately $1,283 million, $904 million and $745 million, respectively, of the Company’s education division revenue was derived from financial aid received by students under Title IV programs. Management believes that the Company’s education division schools that participate in Title IV programs are in material compliance with standards set forth in the HEA and the Regulations.
Department of Education Program Reviews. From 2007 through 2010, the Department of Education undertook program reviews at four of Kaplan Higher Education’s campus locations and at Kaplan University. The Department of Education has issued a final report with respect to one of the campus locations with no action taken. No final reports with respect to the other reviews have been issued. Therefore, the results of these reviews and their impact on Kaplan’s operations is uncertain.
| P. | FAIR VALUE MEASUREMENTS |
Fair value measurements are determined based on the assumptions that a market participant would use in pricing an asset or liability based on a three-tiered hierarchy that draws a distinction between market participant assumptions based on (i) observable inputs, such as quoted prices in active markets (Level 1); (ii) inputs other than quoted prices in active markets that are observable either directly
2009 FORM 10-K 77
Table of Contents
or indirectly (Level 2) and (iii) unobservable inputs that require the Company to use present value and other valuation techniques in the determination of fair value (Level 3). Financial assets and liabilities are classified in their entirety based on the lowest level of input that is significant to the fair value measure. The Company’s assessment of the significance of a particular input to the fair value measurements requires judgment and may affect the valuation of the assets and liabilities being measured and their placement within the fair value hierarchy.
The Company’s financial assets and liabilities measured at fair value on a recurring basis as of January 3, 2010 were as follows:
| Fair Value Measurements at January 3, 2010 | |||||||||
| (in millions) | Fair Value at January 3, 2010 |
Quoted Prices in Active Markets for Identical Items (Level 1) |
Significant Observable (Level 2) | ||||||
| Assets: |
|||||||||
| Money market investments |
$ | 327.8 | $ | — | $ | 327.8 | |||
| Marketable equity securities(1) |
353.9 | 353.9 | — | ||||||
| Other current investments(2) |
31.1 | 30.4 | 0.7 | ||||||
| Total financial assets |
$ | 712.8 | $ | 384.3 | $ | 328.5 | |||
| Liabilities: |
|||||||||
| Deferred compensation plan liabilities(3) |
$ | 66.6 | $ | — | $ | 66.6 | |||
| 7.25% unsecured notes |
443.1 | — | 443.1 | ||||||
| Total financial liabilities |
$ | 509.7 | $ | — | $ | 509.7 | |||
| (1) | The Company’s investments in marketable equity securities are classified as available-for-sale. |
| (2) | Includes U.S. Government Securities, corporate bonds, mutual funds and time deposits (with original maturities greater than 90 days, but less than one year). |
| (3) | Includes The Washington Post Company Deferred Compensation Plan and supplemental savings plan benefits under The Washington Post Company Supplemental Executive Retirement Plan, which are included in accrued compensation and related benefits. |
For assets that are measured using quoted prices in active markets, the total fair value is the published market price per unit multiplied by the number of units held without consideration of transaction costs. Assets and liabilities that are measured using significant other observable inputs are primarily valued by reference to quoted prices of similar assets or liabilities in active markets, adjusted for any terms specific to that asset or liability.
| Q. | BUSINESS SEGMENTS |
Through its subsidiary Kaplan, Inc., the Company provides educational services for individuals, schools and businesses. The Company also operates principally in four areas of the media business: cable television, newspaper publishing, television broadcasting and magazine publishing.
Kaplan reorganized its operations effective in the third quarter of 2009 into the following four operating segments for the purpose of making operating decisions and assessing performance: Higher Education, Test Preparation, Kaplan International and Kaplan Ventures. Kaplan International was organized primarily from the non-U.S. businesses previously included in the Higher Education, Test Preparation and Professional operating segments. Most of the U.S.-based businesses previously included in the Professional operating segment were moved into the operations of Test Preparation. The Kaplan Ventures operating segment was organized to manage and develop new and more recently acquired businesses. Kaplan’s organizational structure is based on a number of factors that management uses to evaluate, view and run its business operations, which include, but are not limited to, customers, the nature of products and services and use of resources. The business segments disclosed in the condensed consolidated financial statements are based on this new organizational structure and information reviewed by the Company’s management to evaluate the business segment results. Segment operating results of the education division for fiscal years ended 2008 and 2007 have been restated to reflect this organization change.
In the third quarter of 2009, Kaplan Higher Education (KHE) modified its method of recognizing revenue ratably over the period of instruction as services are delivered to students from a weekly convention to a daily convention, on a prospective basis. If KHE’s revenue recognition convention had been on a daily convention in prior periods, revenues and operating income in the first quarter of 2009 would have increased by $7.0 million and $6.5 million, respectively, and revenues and operating income in the fourth quarter of 2008 would have decreased by $7.8 million and $7.3 million, respectively. The Company has concluded that the impact of this change was not material to the Company’s financial position or results of operations for 2009, 2008 and 2007 and the related interim periods, based on its consideration of quantitative and qualitative factors.
In 2007, Kaplan announced plans to restructure the Score business. The Score restructuring included the closing of 75 Score centers and relocating certain management and terminating certain employees from closed centers; Score incurred approximately $11.2 million in expenses in the fourth quarter of 2007 related to lease obligations, severance and accelerated depreciation of fixed assets. After closings and consolidations, Score operated 78 centers.
At the end of March 2009, the Company approved a plan to offer tutoring services, previously provided at Score, in Kaplan test preparation centers. The plan was substantially completed by the end of the second quarter of 2009. In conjunction with this plan, 14 existing Score centers were converted into Kaplan test preparation centers, and the remaining 64 Score centers were closed. The Company recorded $24.9 million in asset write-downs, lease terminations, severance and accelerated depreciation of fixed assets in the first half of 2009. This amount includes a $9.2 million write-down of Score’s software product to its fair value following an impairment review.
78 THE WASHINGTON POST COMPANY
Table of Contents
In 2007, Kaplan announced restructuring plans at its professional domestic training businesses that involved product changes and decentralization of certain operations, in addition to employee terminations. These businesses are now part of Kaplan’s Test Preparation division. A charge of $6.0 million was recorded in the fourth quarter of 2007 related to the write-off of an integrated software product under development and severance costs in connection with the restructuring. In the fourth quarter of 2008, Kaplan expanded this restructuring to include additional operations. Total restructuring-related expenses of $8.3 million and $11.0 million were recorded in 2009 and 2008, respectively, related to lease termination, accelerated depreciation of fixed assets and severance costs.
Cable television operations consist of cable systems offering video, Internet, phone and other services to subscribers in midwestern, western and southern states. The principal source of revenue is monthly subscription fees charged for services.
Newspaper publishing includes the publication of newspapers in the Washington, DC, area and Everett, WA; newsprint ware- housing and recycling facilities; and the Company’s electronic media publishing business (primarily washingtonpost.com).
The magazine publishing division consists of the publication of a weekly newsmagazine, Newsweek, which has one domestic and three English-language international editions (and, in conjunction with others, publishes seven foreign-language editions around the world) and certain online media publishing businesses (newsweek.com). In December 2009, Newsweek sold its Newsweek Budget Travel magazine and realized a gain on the transaction. Budget Travel revenues for 2009, 2008 and 2007 were $18.7 million, $23.5 million and $22.7 million, respectively. Including the gain on the sale transaction, Budget Travel incurred operating losses of $1.2 million in 2009, operating losses of $0.7 million in 2008 and operating income of $2.3 million in 2007.
Revenues from both newspaper and magazine publishing operations are derived from advertising and, to a lesser extent, from circulation.
Television broadcasting operations are conducted through six VHF television stations serving the Detroit, Houston, Miami, San Antonio, Orlando and Jacksonville television markets. All stations are network- affiliated (except for WJXT in Jacksonville), with revenues derived primarily from sales of advertising time.
Other businesses and corporate office includes the expenses associated with the Company’s corporate office and the operating results of Avenue100 Media Solutions (formerly CourseAdvisor).
The Company’s foreign revenues in 2009, 2008 and 2007 totaled approximately $547 million, $582 million and $488 million, respectively, principally from Kaplan’s foreign operations and the publication of the international editions of Newsweek. The Company’s long-lived assets in foreign countries (excluding goodwill and other intangible assets), principally in the United Kingdom, totaled approximately $58 million at January 3, 2010 and $56 million at December 28, 2008.
In computing income from operations by segment, the effects of equity in (losses) earnings of affiliates, interest income, interest expense, other non-operating income and expense items and income taxes are not included.
Identifiable assets by segment are those assets used in the Company’s operations in each business segment. Investments in marketable equity securities are discussed in Note E.
2009 FORM 10-K 79
Table of Contents
| Fiscal Year Ended | ||||||||||||
| (in thousands) | 2009 |
2008 | 2007 | |||||||||
| Operating revenues |
||||||||||||
| Education |
$ | 2,636,638 | $ | 2,331,580 | $ | 2,030,889 | ||||||
| Cable television |
750,409 | 719,070 | 626,446 | |||||||||
| Newspaper publishing |
679,282 | 801,265 | 889,827 | |||||||||
| Television broadcasting |
272,651 | 325,146 | 339,969 | |||||||||
| Magazine publishing |
184,215 | 250,900 | 288,449 | |||||||||
| Other businesses and corporate office |
53,921 | 39,411 | 6,586 | |||||||||
| Intersegment elimination |
(7,385 | ) | (5,792 | ) | (1,760 | ) | ||||||
| $ | 4,569,731 | $ | 4,461,580 | $ | 4,180,406 | |||||||
| Income (loss) from operations |
||||||||||||
| Education |
$ | 194,761 | $ | 206,302 | $ | 149,037 | ||||||
| Cable television |
169,051 | 162,202 | 123,664 | |||||||||
| Newspaper publishing |
(163,549 | ) | (192,739 | ) | 66,434 | |||||||
| Television broadcasting |
70,506 | 123,495 | 142,092 | |||||||||
| Magazine publishing |
(29,251 | ) | (16,060 | ) | 31,388 | |||||||
| Other businesses and corporate office |
(47,526 | ) | (108,992 | ) | (35,599 | ) | ||||||
| $ | 193,992 | $ | 174,208 | $ | 477,016 | |||||||
| Equity in (losses) earnings of affiliates |
(29,421 | ) | (7,837 | ) | 5,975 | |||||||
| Interest expense, net |
(28,968 | ) | (18,986 | ) | (12,708 | ) | ||||||
| Other, net |
13,197 | (2,189 | ) | 11,182 | ||||||||
| Income before income taxes |
$ | 148,800 | $ | 145,196 | $ | 481,465 | ||||||
| Depreciation of property, plant and equipment |
||||||||||||
| Education |
$ | 81,478 | $ | 67,329 | $ | 60,986 | ||||||
| Cable television |
124,207 | 121,310 | 108,453 | |||||||||
| Newspaper publishing |
72,870 | 64,983 | 38,659 | |||||||||
| Television broadcasting |
12,299 | 9,400 | 9,489 | |||||||||
| Magazine publishing |
4,187 | 2,052 | 2,177 | |||||||||
| Other businesses and corporate office |
830 | 532 | 1,475 | |||||||||
| $ | 295,871 | $ | 265,606 | $ | 221,239 | |||||||
| Amortization of intangible assets |
||||||||||||
| Education |
$ | 22,223 | $ | 15,472 | $ | 14,670 | ||||||
| Cable television |
310 | 307 | 442 | |||||||||
| Newspaper publishing |
1,010 | 625 | 1,162 | |||||||||
| Television broadcasting |
— | — | — | |||||||||
| Magazine publishing |
— | — | — | |||||||||
| Other businesses and corporate office |
3,099 | 6,121 | 1,297 | |||||||||
| $ | 26,642 | $ | 22,525 | $ | 17,571 | |||||||
| Impairment of goodwill and other long-lived assets |
||||||||||||
| Education |
$ | 25,387 | $ | — | $ | — | ||||||
| Cable television |
— | — | — | |||||||||
| Newspaper publishing |
— | 65,772 | — | |||||||||
| Television broadcasting |
— | — | — | |||||||||
| Magazine publishing |
— | — | — | |||||||||
| Other businesses and corporate office |
— | 69,667 | — | |||||||||
| $ | 25,387 | $ | 135,439 | $ | — | |||||||
| Net pension (expense) credit |
||||||||||||
| Education |
$ | (5,414 | ) | $ | (4,255 | ) | $ | (3,536 | ) | |||
| Cable television |
(1,851 | ) | (1,534 | ) | (1,405 | ) | ||||||
| Newspaper publishing |
(75,925 | ) | (87,962 | ) | (10,010 | ) | ||||||
| Television broadcasting |
(418 | ) | 1,041 | 888 | ||||||||
| Magazine publishing |
28,018 | 15,079 | 36,343 | |||||||||
| Other businesses and corporate office |
(882 | ) | (1,892 | ) | — | |||||||
| $ | (56,472 | ) | $ | (79,523 | ) | $ | 22,280 | |||||
| Capital expenditures |
||||||||||||
| Education |
$ | 106,337 | $ | 99,291 | $ | 97,123 | ||||||
| Cable television |
84,027 | 114,176 | 138,258 | |||||||||
| Newspaper publishing |
18,856 | 28,428 | 36,020 | |||||||||
| Television broadcasting |
13,559 | 40,729 | 17,688 | |||||||||
| Magazine publishing |
34,053 | 4,675 | 448 | |||||||||
| Other businesses and corporate office |
926 | 1,624 | 470 | |||||||||
| $ | 257,758 | $ | 288,923 | $ | 290,007 | |||||||
| Identifiable assets |
||||||||||||
| Education |
$ | 2,188,328 | $ | 2,080,037 | $ | 1,930,525 | ||||||
| Cable television |
1,164,209 | 1,204,373 | 1,205,374 | |||||||||
| Newspaper publishing |
207,234 | 383,849 | 832,655 | |||||||||
| Television broadcasting |
433,705 | 412,129 | 464,815 | |||||||||
| Magazine publishing |
658,731 | 547,239 | 837,527 | |||||||||
| Other businesses and corporate office |
125,393 | 121,051 | 161,755 | |||||||||
| $ | 4,777,600 | $ | 4,748,678 | $ | 5,432,651 | |||||||
| Investments in marketable equity securities |
353,884 | 333,319 | 469,459 | |||||||||
| Investments in affiliates |
54,722 | 76,437 | 102,399 | |||||||||
| Total Assets |
$ | 5,186,206 | $ | 5,158,434 | $ | 6,004,509 | ||||||
80 THE WASHINGTON POST COMPANY
Table of Contents
The Company’s education division comprises the following operating segments:
| Fiscal Year Ended | ||||||||||||
| (in thousands) | 2009 | 2008 | 2007 | |||||||||
| Operating revenues |
||||||||||||
| Higher education |
$ | 1,539,587 | $ | 1,160,062 | $ | 933,286 | ||||||
| Test preparation1 |
444,995 | 507,112 | 554,840 | |||||||||
| Kaplan international |
537,238 | 545,070 | 442,200 | |||||||||
| Kaplan ventures |
124,250 | 126,242 | 105,806 | |||||||||
| Kaplan corporate and other |
1,354 | 1,426 | 1,261 | |||||||||
| Intersegment elimination |
(10,786 | ) | (8,332 | ) | (6,504 | ) | ||||||
| $ | 2,636,638 | 2,331,580 | $ | 2,030,889 | ||||||||
| Income (loss) from operations |
||||||||||||
| Higher education |
$ | 274,753 | $ | 172,897 | $ | 123,535 | ||||||
| Test preparation1 |
(15,582 | ) | 34,302 | 57,987 | ||||||||
| Kaplan international |
53,772 | 59,957 | 54,962 | |||||||||
| Kaplan ventures |
(16,332 | ) | (3,844 | ) | 1,596 | |||||||
| Kaplan corporate and other |
(102,160 | ) | (56,786 | ) | (88,736 | ) | ||||||
| Intersegment elimination |
310 | (224 | ) | (307 | ) | |||||||
| $ | 194,761 | $ | 206,302 | $ | 149,037 | |||||||
| Depreciation of property, plant and equipment |
||||||||||||
| Higher education |
$ | 37,874 | $ | 30,637 | $ | 27,120 | ||||||
| Test preparation |
22,852 | 16,427 | 16,459 | |||||||||
| Kaplan international |
11,438 | 11,282 | 9,818 | |||||||||
| Kaplan ventures |
5,099 | 4,907 | 4,212 | |||||||||
| Kaplan corporate and other |
4,215 | 4,076 | 3,377 | |||||||||
| $ | 81,478 | $ | 67,329 | $ | 60,986 | |||||||
| Amortization of intangible assets |
$ | 22,223 | $ | 15,472 | $ | 14,670 | ||||||
| Impairment of goodwill and other long-lived assets |
$ | 25,387 | $ | — | $ | — | ||||||
| Kaplan stock-based incentive compensation expense |
$ | 933 | $ | (7,829 | ) | $ | 41,294 | |||||
| Capital expenditures |
||||||||||||
| Higher education |
$ | 67,233 | $ | 46,399 | $ | 27,457 | ||||||
| Test preparation |
18,397 | 27,942 | 37,541 | |||||||||
| Kaplan international |
13,900 | 14,767 | 20,068 | |||||||||
| Kaplan ventures |
5,374 | 5,347 | 4,576 | |||||||||
| Kaplan corporate and other |
1,433 | 4,836 | 7,481 | |||||||||
| $ | 106,337 | $ | 99,291 | $ | 97,123 | |||||||
| Identifiable assets |
||||||||||||
| Higher education |
$ | 865,691 | $ | 720,717 | $ | 628,778 | ||||||
| Test preparation |
333,591 | 345,647 | 336,042 | |||||||||
| Kaplan international |
625,662 | 607,194 | 574,135 | |||||||||
| Kaplan ventures |
304,985 | 332,361 | 338,418 | |||||||||
| Kaplan corporate and other |
58,399 | 74,118 | 53,152 | |||||||||
| $ | 2,188,328 | $ | 2,080,037 | $ | 1,930,525 | |||||||
| 1 | Test preparation amounts include revenues and operating losses from Score as follows (in thousands): |
| Revenue | Operating Loss |
||||||
| 2009 |
$ | 8,557 | $ | (36,787 | ) | ||
| 2008 |
28,672 | (13,278 | ) | ||||
| 2007 |
55,830 | (23,228 | ) | ||||
2009 FORM 10-K 81
Table of Contents
| R. | SUMMARY OF QUARTERLY OPERATING RESULTS AND COMPREHENSIVE INCOME (UNAUDITED) |
Quarterly results of operations and comprehensive income for the years ended January 3, 2010 and December 28, 2008 are as follows:
| (in thousands, except per share amounts) | First Quarter |
Second Quarter |
Third Quarter |
Fourth Quarter |
||||||||||||
| 2009 Quarterly Operating Results |
||||||||||||||||
| Operating revenues |
||||||||||||||||
| Education |
$ | 593,530 | $ | 649,323 | $ | 684,516 | $ | 709,269 | ||||||||
| Advertising |
197,310 | 211,493 | 195,320 | 253,986 | ||||||||||||
| Circulation and subscriber |
231,882 | 231,252 | 232,440 | 236,828 | ||||||||||||
| Other |
31,398 | 36,400 | 36,435 | 38,349 | ||||||||||||
| 1,054,120 | 1,128,468 | 1,148,711 | 1,238,432 | |||||||||||||
| Operating costs and expenses |
||||||||||||||||
| Operating |
495,093 | 513,938 | 491,457 | 502,450 | ||||||||||||
| Selling, general and administrative |
494,005 | 517,581 | 493,773 | 519,542 | ||||||||||||
| Depreciation of property, plant and equipment |
77,980 | 83,577 | 70,094 | 64,220 | ||||||||||||
| Amortization of intangible assets |
6,648 | 7,191 | 6,767 | 6,036 | ||||||||||||
| Impairment of goodwill and other long-lived assets |
— | — | 25,387 | — | ||||||||||||
| 1,073,726 | 1,122,287 | 1,087,478 | 1,092,248 | |||||||||||||
| (Loss) income from operations |
(19,606 | ) | 6,181 | 61,233 | 146,184 | |||||||||||
| Equity in (losses) earnings of affiliates |
(762 | ) | (206 | ) | (27,192 | ) | (1,261 | ) | ||||||||
| Interest income |
808 | 475 | 555 | 759 | ||||||||||||
| Interest expense |
(7,880 | ) | (7,701 | ) | (7,533 | ) | (8,451 | ) | ||||||||
| Other (expense) income, net |
(4,043 | ) | 19,719 | 103 | (2,582 | ) | ||||||||||
| (Loss) income before income taxes |
(31,483 | ) | 18,468 | 27,166 | 134,649 | |||||||||||
| (Benefit) provision for income taxes |
(12,000 | ) | 7,100 | 10,100 | 52,400 | |||||||||||
| Net (loss) income |
(19,483 | ) | 11,368 | 17,066 | 82,249 | |||||||||||
| Net loss (income) attributable to noncontrolling interests |
788 | 1,106 | 214 | (534 | ) | |||||||||||
| Net (loss) income attributable to The Washington Post Company |
(18,695 | ) | 12,474 | 17,280 | 81,715 | |||||||||||
| Redeemable preferred stock dividends |
(473 | ) | (225 | ) | (230 | ) | — | |||||||||
| Net (loss) income available for common shares |
$ | (19,168 | ) | $ | 12,249 | $ | 17,050 | $ | 81,715 | |||||||
| Basic (loss) earnings per common share |
$ | (2.04 | ) | $ | 1.30 | $ | 1.81 | $ | 8.71 | |||||||
| Diluted (loss) earnings per common share |
$ | (2.04 | ) | $ | 1.30 | $ | 1.81 | $ | 8.71 | |||||||
| Basic average shares outstanding |
9,339 | 9,340 | 9,340 | 9,311 | ||||||||||||
| Diluted average shares outstanding |
9,339 | 9,400 | 9,401 | 9,372 | ||||||||||||
| 2009 Quarterly comprehensive (loss) income |
$ | (12,580 | ) | $ | 23,835 | $ | 52,628 | $ | 144,083 | |||||||
The sum of the four quarters may not necessarily be equal to the annual amounts reported in the Consolidated Statements of Income due to rounding.
Refer to page 84 for quarterly impact from certain unusual items in 2009.
82 THE WASHINGTON POST COMPANY
Table of Contents
| First Quarter |
Second Quarter |
Third Quarter |
Fourth Quarter |
|||||||||||||
| 2008 Quarterly Operating Results |
||||||||||||||||
| Operating revenues |
||||||||||||||||
| Education |
$ | 543,256 | $ | 576,464 | $ | 602,739 | $ | 609,121 | ||||||||
| Advertising |
267,726 | 268,699 | 261,475 | 285,184 | ||||||||||||
| Circulation and subscriber |
218,608 | 224,214 | 226,186 | 232,890 | ||||||||||||
| Other |
33,550 | 36,840 | 38,258 | 36,370 | ||||||||||||
| 1,063,140 | 1,106,217 | 1,128,658 | 1,163,565 | |||||||||||||
| Operating costs and expenses |
||||||||||||||||
| Operating |
491,153 | 507,985 | 516,115 | 508,563 | ||||||||||||
| Selling, general and administrative |
440,048 | 525,655 | 434,150 | 440,133 | ||||||||||||
| Depreciation of property, plant and equipment |
60,460 | 61,479 | 73,524 | 70,143 | ||||||||||||
| Amortization of intangible assets |
4,610 | 6,282 | 4,912 | 6,721 | ||||||||||||
| Impairment of goodwill and other intangible assets |
— | — | 59,690 | 75,749 | ||||||||||||
| 996,271 | 1,101,401 | 1,088,391 | 1,101,309 | |||||||||||||
| Income from operations |
66,869 | 4,816 | 40,267 | 62,256 | ||||||||||||
| Equity in (losses) earnings of affiliates |
(3,243 | ) | (5,653 | ) | (609 | ) | 1,668 | |||||||||
| Interest income |
2,096 | 1,286 | 1,173 | 1,117 | ||||||||||||
| Interest expense |
(6,534 | ) | (6,098 | ) | (6,882 | ) | (5,144 | ) | ||||||||
| Other income (expense), net |
4,134 | 2,897 | (21,083 | ) | 11,863 | |||||||||||
| Income (loss) before income taxes |
63,322 | (2,752 | ) | 12,866 | 71,760 | |||||||||||
| Provision (benefit) for income taxes |
24,000 | (100 | ) | 2,500 | 53,000 | |||||||||||
| Net income (loss) |
39,322 | (2,652 | ) | 10,366 | 18,760 | |||||||||||
| Net (income) loss attributable to noncontrolling interests |
(55 | ) | (49 | ) | (37 | ) | 67 | |||||||||
| Net income (loss) attributable to The Washington Post Company |
39,267 | (2,701 | ) | 10,329 | 18,827 | |||||||||||
| Redeemable preferred stock dividends |
(473 | ) | (237 | ) | (236 | ) | — | |||||||||
| Net income (loss) available for common shares |
$ | 38,794 | $ | (2,938 | ) | $ | 10,093 | $ | 18,827 | |||||||
| Basic earnings (loss) per common share |
$ | 4.09 | $ | (0.31 | ) | $ | 1.08 | $ | 2.02 | |||||||
| Diluted earnings (loss) per common share |
$ | 4.08 | $ | (0.31 | ) | $ | 1.08 | $ | 2.01 | |||||||
| Basic average shares outstanding |
9,484 | 9,480 | 9,334 | 9,332 | ||||||||||||
| Diluted average shares outstanding |
9,513 | 9,480 | 9,358 | 9,354 | ||||||||||||
| 2008 Quarterly comprehensive income (loss) |
$ | 14,611 | $ | 3,943 | $ | 33,549 | $ | (491,597 | ) | |||||||
The sum of the four quarters may not necessarily be equal to the annual amounts reported in the Consolidated Statements of Income due to rounding.
Refer to page 84 for quarterly impact from certain unusual items in 2008.
2009 FORM 10-K 83
Table of Contents
Quarterly impact from certain unusual items in 2009 (after-tax and diluted EPS amounts):
| First Quarter |
Second Quarter |
Third Quarter |
Fourth Quarter |
|||||||||||||
| Charges of $40.0 million primarily related to early retirement program expense at The Washington Post and Newsweek ($4.1 million, $35.2 million and $0.7 million in the first, second and third quarters, respectively) |
$ | (0.44 | ) | $ | (3.77 | ) | $ | (0.05 | ) | |||||||
| Charges of $20.6 million in connection with the restructuring of Kaplan’s Score and Test Preparation operations ($10.5 million, $ 9.4 million, $0.6 million and $0.1 million in the first, second, third and fourth quarters, respectively) |
$ | (1.12 | ) | $ | (1.01 | ) | $ | (0.05 | ) | $ | (0.01 | ) | ||||
| Charges of $21.0 million for accelerated depreciation related to the closing of The Washington Post’s College Park, MD, plant and the consolidation of operations at The Washington Post newspaper ($8.3 million, $8.8 million and $3.8 million in the first, second and third quarters, respectively) |
$ | (0.89 | ) | $ | (0.95 | ) | $ | (0.40 | ) | |||||||
| Goodwill, intangible assets and other impairment charges of $18.8 million related to Kaplan Ventures |
$ | (2.00 | ) | |||||||||||||
| Impairment charges of $18.8 million at two of the Company’s affiliates |
$ | (2.00 | ) | |||||||||||||
| Gains, net, of $10.3 million for non-operating unrealized foreign currency (losses) gains on intercompany loans arising from the weakening of the U.S. dollar ($0.9 million loss, $12.3 million gain and $0.9 million loss in the first, second and fourth quarters, respectively) |
$ | (0.09 | ) | $ | 1.31 | $ | (0.10 | ) | ||||||||
Quarterly impact from certain unusual items in 2008 (after-tax and diluted EPS amounts):
| First Quarter |
Second Quarter |
Third Quarter |
Fourth Quarter |
|||||||||||||
| Charges of $67.2 million related to early retirement program expense at The Washington Post newspaper, the corporate office and Newsweek ($14.3 million and $52.9 million in the first and second quarters, respectively) |
$ | (1.49 | ) | $ | (5.58 | ) | ||||||||||
| Goodwill, intangible assets and other impairment charges of $115.7 million at the Company’s online lead generation business, included in the other businesses and corporate office segment; at the Company’s community newspapers, The Herald and other operations, included in the newspaper publishing segment; and at two of the Company’s equity affiliates ($4.1 million, $41.9 million and $69.6 million in the second, third and fourth quarters, respectively) |
$ | (0.43 | ) | $ | (4.48 | ) | $ | (7.44 | ) | |||||||
| Charge of $13.9 million for accelerated depreciation related to the planned closing of The Washington Post’s College Park, MD, plant ($0.7 million, $7.9 million and $5.3 million in the second, third and fourth quarters, respectively) |
$ | (0.08 | ) | $ | (0.84 | ) | $ | (0.56 | ) | |||||||
| Expenses and charges of $6.8 million in connection with the restructuring of Test Preparation’s professional training businesses ($0.9 million, $1.1 million, $0.4 million and $4.3 million in the first, second, third and fourth quarters, respectively) |
$ | (0.09 | ) | $ | (0.12 | ) | $ | (0.05 | ) | $ | (0.46 | ) | ||||
| Gains of $28.9 million from the sales of marketable equity securities |
$ | 3.09 | ||||||||||||||
| Losses, net, of $28.5 million for non-operating unrealized foreign currency losses on intercompany loans arising from the strengthening of the U.S. dollar ($2.8 million gain, $1.8 million gain, $13.0 million loss and $20.1 million loss in the first, second, third and fourth quarters, respectively) |
$ | 0.30 | $ | 0.20 | $ | (1.39 | ) | $ | (2.15 | ) | ||||||
| Charge of $9.5 million in income tax expense related to valuation allowances provided against certain state and local income tax benefits, net of U.S. federal income tax benefits |
$ | (1.01 | ) | |||||||||||||
84 THE WASHINGTON POST COMPANY
Table of Contents
[THIS PAGE INTENTIONALLY LEFT BLANK]
2009 FORM 10-K 85
Table of Contents
TEN-YEAR SUMMARY OF SELECTED HISTORICAL FINANCIAL DATA
See Notes to consolidated financial statements for the summary of significant accounting policies and additional information relative to the years 2007–2009. Operating results prior to 2002 include amortization of goodwill and certain other intangible assets that are no longer amortized under GAAP.
| (in thousands, except per share amounts) | 2009 | 2008 | 2007 | |||||||
| Results of Operations |
||||||||||
| Operating revenues |
$ | 4,569,731 | $ | 4,461,580 | $ | 4,180,406 | ||||
| Income from operations |
$ | 193,992 | $ | 174,208 | $ | 477,016 | ||||
| Income before cumulative effect of change in accounting principle |
$ | 92,774 | $ | 65,722 | $ | 288,607 | ||||
| Cumulative effect of change in method of accounting |
— | — | — | |||||||
| Net income attributable to The Washington Post Company |
$ | 92,774 | $ | 65,722 | $ | 288,607 | ||||
| Per Share Amounts |
||||||||||
| Basic earnings per common share: |
||||||||||
| Before cumulative effect of change in accounting principle |
$ | 9.78 | $ | 6.89 | $ | 30.31 | ||||
| Cumulative effect of change in accounting principle |
— | — | — | |||||||
| Net income available for common shares |
$ | 9.78 | $ | 6.89 | $ | 30.31 | ||||
| Basic average shares outstanding |
9,322 | 9,408 | 9,492 | |||||||
| Diluted earnings per share: |
||||||||||
| Before cumulative effect of change in accounting principle |
$ | 9.78 | $ | 6.87 | $ | 30.19 | ||||
| Cumulative effect of change in accounting principle |
— | — | — | |||||||
| Net income available for common shares |
$ | 9.78 | $ | 6.87 | $ | 30.19 | ||||
| Diluted average shares outstanding |
9,392 | 9,430 | 9,528 | |||||||
| Cash dividends |
$ | 8.60 | $ | 8.60 | $ | 8.20 | ||||
| Common shareholders’ equity |
$ | 317.21 | $ | 305.12 | $ | 363.72 | ||||
| Financial Position |
||||||||||
| Current assets |
$ | 1,388,064 | $ | 1,351,540 | $ | 994,970 | ||||
| Working capital |
398,481 | 257,292 | (18,503 | ) | ||||||
| Property, plant and equipment |
1,239,692 | 1,302,334 | 1,280,737 | |||||||
| Total assets |
5,186,206 | 5,158,434 | 6,004,509 | |||||||
| Long-term debt |
396,236 | 400,003 | 400,519 | |||||||
| Common shareholders’ equity |
2,939,550 | 2,857,540 | 3,461,159 | |||||||
Impact from certain unusual items (after-tax and diluted EPS amounts):
2009
| • | charges of $40.0 million ($4.26 per share) related to early retirement program expense, primarily at The Washington Post and Newsweek |
| • | charges of $20.6 million ($2.19 per share) in connection with the restructuring of Kaplan’s Score and Test Preparation operations |
| • | $21.0 million ($2.23 per share) in accelerated depreciation related to the closing of The Washington Post’s College Park, MD, plant and the consolidation of operations at The Washington Post newspaper |
| • | goodwill and other long-lived assets impairment charge of $18.8 million ($2.00 per share) related to Kaplan Ventures |
| • | impairment charges of $18.8 million ($2.00 per share) at two of the Company’s affiliates |
| • | gains, net, $10.3 million ($1.10 per share) from non-operating unrealized foreign currency gains on intercompany loans arising from the weakening of the U.S. dollar |
2008
| • | goodwill, intangible assets and other impairment charges of $115.7 million ($12.35 per share) at the Company’s online lead generation business, included in other businesses and corporate office segment; at the Company’s community newspapers, The Herald and other operations included in the newspaper publishing segment; and at two of the Company’s equity affiliates |
| • | charges of $67.2 million ($7.07 per share) related to early retirement program expense at The Washington Post newspaper, the corporate office and Newsweek |
| • | $13.9 million ($1.48 per share) in accelerated depreciation related to the planned closing of The Washington Post’s College Park, MD, plant |
| • | charges of $6.8 million ($0.72 per share) in connection with the restructuring of Test Preparation’s professional training businesses |
| • | gains of $28.9 million ($3.09 per share) from the sales of marketable securities |
| • | losses, net, of $28.5 million ($3.04 per share) from non-operating unrealized foreign currency losses on intercompany loans arising from the strengthening of the U.S. dollar |
| • | charge of $9.5 million ($1.01 per share) in income tax expense related to valuation allowances provided against certain state and local income tax benefits, net of U.S. Federal income tax benefits |
2007
| • | charge of additional net income tax expense of $6.6 million ($0.70 per share), as the result of a $12.9 million increase in taxes associated with Bowater Mersey, offset by a tax benefit of $6.3 million associated with changes in certain state income tax laws |
| • | charges of $10.3 million ($1.08 per share) in connection with the restructuring of Kaplan’s Score and Test Preparation operations |
| • | gain of $5.9 million ($0.62 per share) from the sale of property at the Company’s television station in Miami |
| • | gains of $5.5 million ($0.58 per share) from non-operating unrealized foreign currency gains on intercompany loans |
86 THE WASHINGTON POST COMPANY
Table of Contents
| 2006 | 2005 | 2004 | 2003 | 2002 | 2001 | 2000 | ||||||||||||||||||||
| Results of Operations |
||||||||||||||||||||||||||
| Operating revenues |
$ | 3,904,927 | $ | 3,553,887 | $ | 3,300,104 | $ | 2,838,911 | $ | 2,584,203 | $ | 2,411,024 | $ | 2,409,633 | ||||||||||||
| Income from operations |
$ | 459,805 | $ | 514,914 | $ | 563,006 | $ | 363,820 | $ | 377,590 | $ | 219,932 | $ | 339,882 | ||||||||||||
| Income before cumulative effect of change in accounting principle |
$ | 329,534 | $ | 314,344 | $ | 332,732 | $ | 241,088 | $ | 216,368 | $ | 229,639 | $ | 136,470 | ||||||||||||
| Cumulative effect of change in method of accounting |
(5,075 | ) | — | — | — | (12,100 | ) | — | — | |||||||||||||||||
| Net income attributable to The Washington Post Company |
$ | 324,459 | $ | 314,344 | $ | 332,732 | $ | 241,088 | $ | 204,268 | $ | 229,639 | $ | 136,470 | ||||||||||||
| Per Share Amounts |
||||||||||||||||||||||||||
| Basic earnings per common share: |
||||||||||||||||||||||||||
| Before cumulative effect of change in accounting principle |
$ | 34.34 | $ | 32.66 | $ | 34.69 | $ | 25.19 | $ | 22.65 | $ | 24.10 | $ | 14.34 | ||||||||||||
| Cumulative effect of change in accounting principle |
(0.53 | ) | — | — | — | (1.27 | ) | — | — | |||||||||||||||||
| Net income available for common shares |
$ | 33.81 | $ | 32.66 | $ | 34.69 | $ | 25.19 | $ | 21.38 | $ | 24.10 | $ | 14.34 | ||||||||||||
| Basic average shares outstanding |
9,568 | 9,594 | 9,563 | 9,530 | 9,504 | 9,486 | 9,445 | |||||||||||||||||||
| Diluted earnings per share: |
||||||||||||||||||||||||||
| Before cumulative effect of change in accounting principle |
$ | 34.21 | $ | 32.59 | $ | 34.59 | $ | 25.12 | $ | 22.61 | $ | 24.06 | $ | 14.32 | ||||||||||||
| Cumulative effect of change in accounting principle |
(0.53 | ) | — | — | — | (1.27 | ) | — | — | |||||||||||||||||
| Net income available for common shares |
$ | 33.68 | $ | 32.59 | $ | 34.59 | $ | 25.12 | $ | 21.34 | $ | 24.06 | $ | 14.32 | ||||||||||||
| Diluted average shares outstanding |
9,606 | 9,616 | 9,592 | 9,555 | 9,523 | 9,500 | 9,460 | |||||||||||||||||||
| Cash dividends |
$ | 7.80 | $ | 7.40 | $ | 7.00 | $ | 5.80 | $ | 5.60 | $ | 5.60 | $ | 5.40 | ||||||||||||
| Common shareholders’ equity |
$ | 331.32 | $ | 274.79 | $ | 251.11 | $ | 216.17 | $ | 192.45 | $ | 177.30 | $ | 156.55 | ||||||||||||
| Financial Position |
||||||||||||||||||||||||||
| Current assets |
$ | 934,825 | $ | 818,326 | $ | 750,509 | $ | 550,571 | $ | 407,347 | $ | 426,603 | $ | 405,067 | ||||||||||||
| Working capital |
123,184 | 123,005 | 62,348 | (190,426 | ) | (356,644 | ) | (37,233 | ) | (3,730 | ) | |||||||||||||||
| Property, plant and equipment |
1,218,309 | 1,142,632 | 1,089,952 | 1,051,373 | 1,094,400 | 1,098,211 | 927,061 | |||||||||||||||||||
| Total assets |
5,381,372 | 4,584,773 | 4,308,765 | 3,949,798 | 3,604,866 | 3,588,844 | 3,200,743 | |||||||||||||||||||
| Long-term debt |
401,571 | 403,635 | 425,889 | 422,471 | 405,547 | 883,078 | 873,267 | |||||||||||||||||||
| Common shareholders’ equity |
3,159,514 | 2,638,423 | 2,404,606 | 2,062,681 | 1,830,386 | 1,683,485 | 1,481,007 | |||||||||||||||||||
2006
| • | charge of $31.7 million ($3.30 per share) related to early retirement plan buyouts |
| • | charge of $9.0 million ($0.94 per share) from the write-down of a marketable equity security |
| • | charge of $8.3 million ($0.86 per share) related to an agreement to settle a lawsuit at Kaplan |
| • | goodwill impairment charge of $6.3 million ($0.65 per share) at PostNewsweek Tech Media and a loss of $1.0 million ($0.10 per share) on the sale of PostNewsweek Tech Media |
| • | transition costs and operating losses at Kaplan related to acquisitions and startups for 2006 of $8.0 million ($0.83 per share) |
| • | charge of $5.1 million ($0.53 per share) for the cumulative effect of a change in accounting for Kaplan equity awards in connection with the Company’s adoption of a new accounting standard on stock-based compensation |
| • | gain of $27.4 million ($2.86 per share) on the sale of the Company’s 49% interest in BrassRing |
| • | insurance recoveries of $6.4 million ($0.67 per share) from cable division losses related to Hurricane Katrina |
| • | gains of $21.1 million ($2.19 per share) from the sales of marketable equity securities |
2005
| • | charges and lost revenue of $17.3 million ($1.80 per share) associated with Hurricane Katrina and other hurricanes |
| • | gain of $11.2 million ($1.16 per share) from sales of non-operating land and marketable equity securities |
2003
| • | gain of $32.3 million ($3.38 per share) on the sale of the Company’s 50% interest in the International Herald Tribune |
| • | gain of $25.5 million ($2.66 per share) on sale of land at The Washington Post newspaper |
| • | charge of $20.8 million ($2.18 per share) for early retirement programs at The Washington Post newspaper |
| • | Kaplan stock compensation expense of $6.4 million ($0.67 per share) for the 10% premium associated with the purchase of outstanding Kaplan stock options |
| • | charge of $3.9 million ($0.41 per share) in connection with the establishment of the Kaplan Educational Foundation |
2002
| • | gain of $16.7 million ($1.75 per share) on the exchange of certain cable systems |
| • | charge of $11.3 million ($1.18 per share) for early retirement programs at Newsweek and The Washington Post newspaper |
2001
| • | gain of $196.5 million ($20.69 per share) on the exchange of certain cable systems |
| • | noncash goodwill and other intangibles impairment charge of $19.9 million ($2.10 per share) recorded in conjunction with the Company’s BrassRing investment |
| • | charges of $18.3 million ($1.93 per share) from the write-down of a non-operating parcel of land and certain cost method investments to their estimated fair value |
2000
| • | charge of $16.5 million ($1.74 per share) for an early retirement program at The Washington Post newspaper |
2009 FORM 10-K 87
Table of Contents
[THIS PAGE INTENTIONALLY LEFT BLANK]
88 THE WASHINGTON POST COMPANY
Table of Contents
| Exhibit Number |
Description | |
| 3.1 | Restated Certificate of Incorporation of the Company dated November 13, 2003 (incorporated by reference to Exhibit 3.1 to the Company’s Annual Report on Form 10-K for the fiscal year ended December 28, 2003). | |
| 3.2 | Certificate of Designation for the Company’s Series A Preferred Stock dated September 22, 2003 (incorporated by reference to Exhibit 3.2 to Amendment No. 1 to the Company’s Current Report on Form 8-K dated September 22, 2003). | |
| 3.3 | By-Laws of the Company as amended and restated through November 8, 2007 (incorporated by reference to Exhibit 3.1 to the Company’s Current Report on Form 8-K dated November 14, 2007). | |
| 4.1 | Second Supplemental Indenture dated January 30, 2009, between the Company and The Bank of New York Mellon Trust Company, N.A., as successor to The First National Bank of Chicago, as Trustee (incorporated by reference to Exhibit 10.2 to the Company’s Current Report on Form 8-K dated January 30, 2009). | |
| 4.2 | Five Year Credit Agreement dated as of August 8, 2006, among the Company, Citibank, N.A., JPMorgan Chase Bank, N.A., Wachovia Bank, National Association, SunTrust Bank, The Bank of New York, PNC Bank, National Association, Bank of America, N.A. and Wells Fargo Bank, N.A. (incorporated by reference to Exhibit 4.4 to the Company’s Quarterly Report on Form 10-Q for the quarter ended July 2, 2006). | |
| 10.1 | The Washington Post Company Incentive Compensation Plan as amended and restated on May 14, 2009 (incorporated by reference to Exhibit 10.1 to the Company’s Quarterly Report on Form 10-Q for the quarter ended June 28, 2009).* | |
| 10.2 | The Washington Post Company Stock Option Plan as amended and restated effective May 31, 2003 (incorporated by reference to Exhibit 10.1 to the Company’s Quarterly Report on Form 10-Q for the quarter ended September 28, 2003).* | |
| 10.3 | The Washington Post Company Supplemental Executive Retirement Plan as amended and restated on September 10, 2008, and amended December 18, 2009.* | |
| 10.4 | The Washington Post Company Deferred Compensation Plan as amended and restated through December 2007 (incorporated by reference to Exhibit 10.4 to the Company’s Annual Report on Form 10-K for the fiscal year ended December 30, 2007).* | |
| 21 | List of subsidiaries of the Company. | |
| 23 | Consent of independent registered public accounting firm. | |
| 24 | Power of attorney dated February 23, 2010. | |
| 31.1 | Rule 13a-14(a)/15d-14(a) Certification of the Chief Executive Officer. | |
| 31.2 | Rule 13a-14(a)/15d-14(a) Certification of the Chief Financial Officer. | |
| 32 | Section 1350 Certification of the Chief Executive Officer and the Chief Financial Officer. |
*A management contract or compensatory plan or arrangement required to be included as an exhibit hereto pursuant to Item 15(b) of Form 10-K.
2009 FORM 10-K 89