Attached files
| file | filename |
|---|---|
| 8-K - WALTER INVESTMENT MANAGEMENT CORP. - DITECH HOLDING Corp | b79882e8vk.htm |
Exhibit 99.1

| WIMC Review 4th Quarter 2009 |

| 2 Table of Contents Safe Harbor Statement..................................... 3 Introduction............................................................... 4 Balance Sheet........................................................ 5 Income Statement.............................................. 8 Portfolio Metrics........................................................ 12 |

| Safe Harbor Statement Certain statements in this presentation and in our public documents to which we refer, contain or incorporate by reference "forward-looking" statements as defined in Section 27A of the Securities Act of 1933, as amended and Section 21E of the Securities Exchange Act of 1934, as amended. Walter Investment Management Corp. is including this cautionary statement to make applicable and take advantage of the safe harbor provisions of the Private Securities Litigation Reform Act of 1995. Statements that are not historical fact are forward-looking statements. Words such as "expect," "believe," "anticipate," "project," "estimate," "forecast," "objective," "plan," "goal," "may," "should," "will" and similar expressions are intended to identify forward-looking statements. Forward-looking statements are based on the Company's current belief, intentions and expectations; however, forward-looking statements involve known and unknown risks, uncertainties and other important factors that could cause actual results, performance or achievements, to differ materially from those reflected in the statements made or incorporated in this release. Thus, these forward-looking statements are not guarantees of future performance and should not be relied upon as predictions of future events. These risks and uncertainties are contained in Walter Investment Management Corp.'s Annual Report on Form 10-K dated March 2, 2010, and Walter Investment Management Corp.'s other filings with the Securities and Exchange Commission. In particular (but not by way of limitation), the following important factors and assumptions could affect the Company's future results and could cause actual results to differ materially from those expressed in the forward-looking statements: local, regional, national and global economic trends and developments in general, and local, regional and national real estate and residential mortgage market trends and developments in particular; the availability of suitable qualifying investments for the proceeds of the Company's secondary offering and risks associated with any such investments we may pursue; the availability of additional investment capital and suitable qualifying investments, and risks associated with the expansion of our business activities; risks associated with the expansion of our business activities, including risks associated with expanding our business outside of our current geographic footprint and/or expanding the scope of our business to include activities not currently undertaken by our business; limitations imposed on the Company's business due to its REIT status and the Company's continued qualification as a REIT for federal income tax purposes; financing sources and availability, and future interest expense; fluctuations in interest rates and levels of mortgage prepayments; increases in costs and other general competitive factors; natural disasters and adverse weather conditions, especially to the extent they result in material payouts under insurance policies placed with our captive insurance subsidiary; changes in federal, state and local policies, laws and regulations affecting our business, including, without limitation, mortgage financing or servicing, and/or the rights and obligations of property owners, mortgagees and tenants; the effectiveness of risk management strategies; unexpected losses resulting from pending, threatened or unforeseen litigation or other third party claims against the Company; the ability or willingness of Walter Energy and other counterparties to satisfy its/their material obligations under its/their agreements with the Company; the Company's continued listing on the NYSE Amex; uninsured losses or losses in excess of insurance limits and the availability of adequate insurance coverage at reasonable costs; the integration of the former Hanover Capital Mortgage Holdings, Inc. business into that of Walter Investment Management, LLC and its affiliates (the "Merger"), and the realization of anticipated synergies, cost savings and growth opportunities from the Merger; future performance generally; and other presently unidentified factors. This WIMC Review contains or references certain non-GAAP financial measures which are intended to assist in the evaluation of certain financial information provided by the Company. Information regarding non-GAAP financial measures and the reconciliation of them to GAAP measures are provided within this document. The financial information presented is unaudited. Should any of the financial information upon which a forward-looking statement is based change upon audit, the forward-looking statement may also change. All forward looking statements set forth herein are qualified by these cautionary statements and are made only as of the date hereof. The Company undertakes no obligation to update or revise the information contained herein, including without limitation any forward-looking statements whether as a result of new information, subsequent events or circumstances, or otherwise, unless otherwise required by law. |

| Introduction Note to Readers: Results for the year ended December 31, 2009 for Walter Investment Management Corp. ("WIMC") were filed with the Securities and Exchange Commission ("SEC") in a Form 10-K on March 2, 2010. Results for the quarters ended September 30, 2009 and June 30, 2009 were filed with the SEC in a Form 10-Q on November 12, 2009 and August 14, 2009, respectively. Results as of and for the three year period ended December 31, 2008 and the quarter ended March 31, 2009 for Walter Investment Management, LLC ("WIM LLC"), the accounting predecessor to WIMC, were presented in a Form 8-K/A on July 10, 2009. Results for the quarter ended March 31, 2009 are available for Hanover Capital Mortgage Holdings Inc. ("Hanover") in their Form 10-Q filed with the SEC on May 15, 2009. These filings and our earnings press releases provide information about our financial results in accordance with generally accepted accounting principles (GAAP). We urge you to review these documents, which are available through our web site, www.walterinvestment.com. This document, called the WIMC Review, provides supplemental information about WIMC through a discussion of many GAAP, as well as non-GAAP measures. We believe that these figures provide additional insight into WIMC's business and future prospects. In each case in which we discuss a non-GAAP measure, you will find an explanation of how it has been calculated, why we think the figure is important, and a reconciliation between the GAAP and non-GAAP figures. We hope you find the WIMC Review helpful to your understanding of our business. |

| 5 Balance Sheet The following table reflects a comparison of the GAAP balance sheets as of December 31, 2009 and September 30, 2009. |
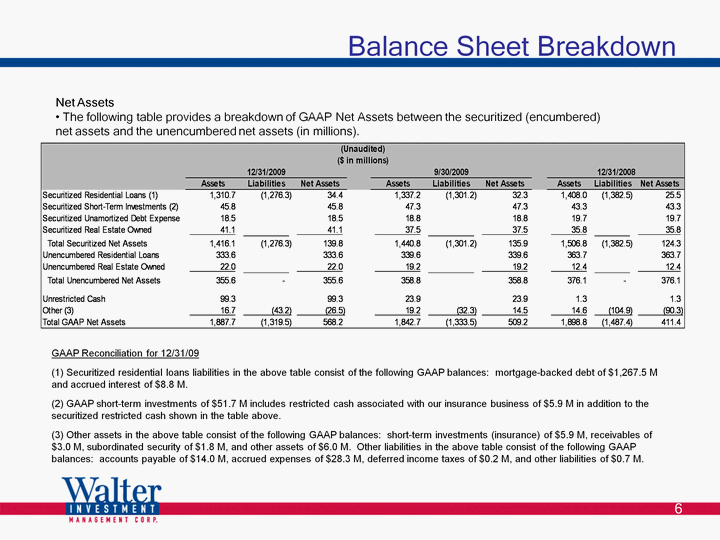
| 6 Balance Sheet Breakdown Net Assets The following table provides a breakdown of GAAP Net Assets between the securitized (encumbered) net assets and the unencumbered net assets (in millions). GAAP Reconciliation for 12/31/09 (1) Securitized residential loans liabilities in the above table consist of the following GAAP balances: mortgage-backed debt of $1,267.5 M and accrued interest of $8.8 M. (1) Securitized residential loans liabilities in the above table consist of the following GAAP balances: mortgage-backed debt of $1,267.5 M and accrued interest of $8.8 M. (1) Securitized residential loans liabilities in the above table consist of the following GAAP balances: mortgage-backed debt of $1,267.5 M and accrued interest of $8.8 M. (1) Securitized residential loans liabilities in the above table consist of the following GAAP balances: mortgage-backed debt of $1,267.5 M and accrued interest of $8.8 M. (1) Securitized residential loans liabilities in the above table consist of the following GAAP balances: mortgage-backed debt of $1,267.5 M and accrued interest of $8.8 M. (1) Securitized residential loans liabilities in the above table consist of the following GAAP balances: mortgage-backed debt of $1,267.5 M and accrued interest of $8.8 M. (1) Securitized residential loans liabilities in the above table consist of the following GAAP balances: mortgage-backed debt of $1,267.5 M and accrued interest of $8.8 M. (1) Securitized residential loans liabilities in the above table consist of the following GAAP balances: mortgage-backed debt of $1,267.5 M and accrued interest of $8.8 M. (1) Securitized residential loans liabilities in the above table consist of the following GAAP balances: mortgage-backed debt of $1,267.5 M and accrued interest of $8.8 M. (2) GAAP short-term investments of $51.7 M includes restricted cash associated with our insurance business of $5.9 M in addition to the securitized restricted cash shown in the table above. (2) GAAP short-term investments of $51.7 M includes restricted cash associated with our insurance business of $5.9 M in addition to the securitized restricted cash shown in the table above. (2) GAAP short-term investments of $51.7 M includes restricted cash associated with our insurance business of $5.9 M in addition to the securitized restricted cash shown in the table above. (2) GAAP short-term investments of $51.7 M includes restricted cash associated with our insurance business of $5.9 M in addition to the securitized restricted cash shown in the table above. (2) GAAP short-term investments of $51.7 M includes restricted cash associated with our insurance business of $5.9 M in addition to the securitized restricted cash shown in the table above. (2) GAAP short-term investments of $51.7 M includes restricted cash associated with our insurance business of $5.9 M in addition to the securitized restricted cash shown in the table above. (2) GAAP short-term investments of $51.7 M includes restricted cash associated with our insurance business of $5.9 M in addition to the securitized restricted cash shown in the table above. (2) GAAP short-term investments of $51.7 M includes restricted cash associated with our insurance business of $5.9 M in addition to the securitized restricted cash shown in the table above. (2) GAAP short-term investments of $51.7 M includes restricted cash associated with our insurance business of $5.9 M in addition to the securitized restricted cash shown in the table above. (3) Other assets in the above table consist of the following GAAP balances: short-term investments (insurance) of $5.9 M, receivables of $3.0 M, subordinated security of $1.8 M, and other assets of $6.0 M. Other liabilities in the above table consist of the following GAAP balances: accounts payable of $14.0 M, accrued expenses of $28.3 M, deferred income taxes of $0.2 M, and other liabilities of $0.7 M. (3) Other assets in the above table consist of the following GAAP balances: short-term investments (insurance) of $5.9 M, receivables of $3.0 M, subordinated security of $1.8 M, and other assets of $6.0 M. Other liabilities in the above table consist of the following GAAP balances: accounts payable of $14.0 M, accrued expenses of $28.3 M, deferred income taxes of $0.2 M, and other liabilities of $0.7 M. (3) Other assets in the above table consist of the following GAAP balances: short-term investments (insurance) of $5.9 M, receivables of $3.0 M, subordinated security of $1.8 M, and other assets of $6.0 M. Other liabilities in the above table consist of the following GAAP balances: accounts payable of $14.0 M, accrued expenses of $28.3 M, deferred income taxes of $0.2 M, and other liabilities of $0.7 M. (3) Other assets in the above table consist of the following GAAP balances: short-term investments (insurance) of $5.9 M, receivables of $3.0 M, subordinated security of $1.8 M, and other assets of $6.0 M. Other liabilities in the above table consist of the following GAAP balances: accounts payable of $14.0 M, accrued expenses of $28.3 M, deferred income taxes of $0.2 M, and other liabilities of $0.7 M. (3) Other assets in the above table consist of the following GAAP balances: short-term investments (insurance) of $5.9 M, receivables of $3.0 M, subordinated security of $1.8 M, and other assets of $6.0 M. Other liabilities in the above table consist of the following GAAP balances: accounts payable of $14.0 M, accrued expenses of $28.3 M, deferred income taxes of $0.2 M, and other liabilities of $0.7 M. (3) Other assets in the above table consist of the following GAAP balances: short-term investments (insurance) of $5.9 M, receivables of $3.0 M, subordinated security of $1.8 M, and other assets of $6.0 M. Other liabilities in the above table consist of the following GAAP balances: accounts payable of $14.0 M, accrued expenses of $28.3 M, deferred income taxes of $0.2 M, and other liabilities of $0.7 M. (3) Other assets in the above table consist of the following GAAP balances: short-term investments (insurance) of $5.9 M, receivables of $3.0 M, subordinated security of $1.8 M, and other assets of $6.0 M. Other liabilities in the above table consist of the following GAAP balances: accounts payable of $14.0 M, accrued expenses of $28.3 M, deferred income taxes of $0.2 M, and other liabilities of $0.7 M. (3) Other assets in the above table consist of the following GAAP balances: short-term investments (insurance) of $5.9 M, receivables of $3.0 M, subordinated security of $1.8 M, and other assets of $6.0 M. Other liabilities in the above table consist of the following GAAP balances: accounts payable of $14.0 M, accrued expenses of $28.3 M, deferred income taxes of $0.2 M, and other liabilities of $0.7 M. (3) Other assets in the above table consist of the following GAAP balances: short-term investments (insurance) of $5.9 M, receivables of $3.0 M, subordinated security of $1.8 M, and other assets of $6.0 M. Other liabilities in the above table consist of the following GAAP balances: accounts payable of $14.0 M, accrued expenses of $28.3 M, deferred income taxes of $0.2 M, and other liabilities of $0.7 M. |

| 7 Mortgage Portfolio The following table provides a breakout of certain balances related to the residential loan portfolio by securitization trust and by vintage category at December 31, 2009. |

| 8 GAAP Income Statement The table below provides a summary of GAAP income for the three and twelve months ended December 31, 2009 and 2008. Taxable income is pre-tax income as calculated for tax purposes. Taxable income differs from GAAP income. REIT taxable income is the primary determinant of the minimum amount of dividends that must be distributed in order to maintain the tax status as a REIT. REIT taxable income is pre-tax profit, as calculated for tax purposes, excluding taxable income earned at taxable subsidiaries. REITs are required to distribute at least 90% of their REIT taxable income as dividends. In order to provide comparability between periods presented, certain amounts have been reclassified from the previously reported unaudited consolidated financial statements to conform to the unaudited consolidated financial statement presentation of the current period. |

| Profitability Ratios |

| 10 Non-Interest Expenses The table below provides a summary of overhead and servicing costs by function for the three months ended December 31, 2009 and 2008. (1) Increase is primarily attributable to additional costs associated with operating as a standalone, public company and the addition of overhead associated with Hanover's operations. |

| 11 Non-Interest Expenses The table below provides a summary of overhead and servicing costs by function for the year ended December 31, 2009 and 2008. (1) Increase is primarily attributable to additional costs associated with operating as a standalone, public company and the addition of overhead associated with Hanover's operations. |

| 12 Summary Portfolio Metrics - Total Portfolio |
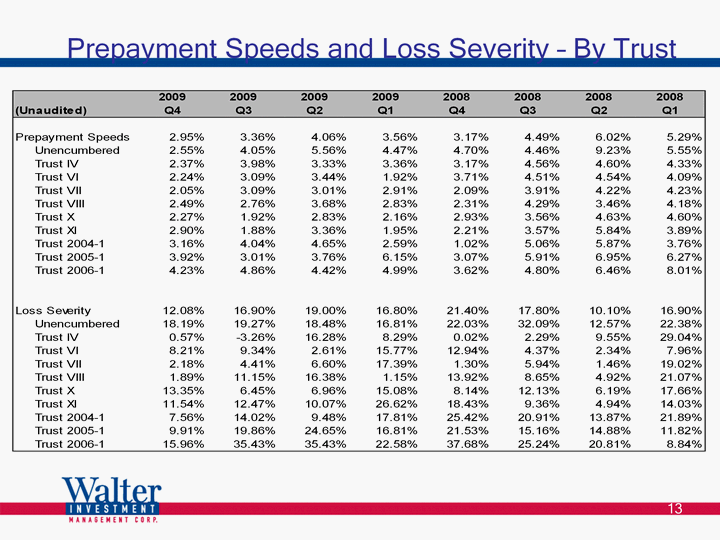
| 13 Prepayment Speeds and Loss Severity - By Trust |

| 14 Static Pool Data - Cumulative Losses Initial balances for WIMC Unpledged and Trusts XI, 2004-1, 2005-1, and 2006-1 are based on initial principal balance. For Trusts II, IV, VI, VII, VIII, and X, initial balances are based on initial economic balance. Economic balance, as defined in the trust agreements, is the present value of scheduled remaining monthly payments. |

| 15 Static Pool Data - Cumulative Repossessions Initial balances for WIMC Unpledged and Trusts XI, 2004-1, 2005-1, and 2006-1 are based on initial principal balance. For Trusts II, IV, VI, VII, VIII, and X, initial balances are based on initial economic balance. Economic balance, as defined in the trust agreements, is the present value of scheduled remaining monthly payments. |

| 16 Static Pool Data - 90+ Delinquency Delinquency rates for WIMC Unpledged and Trusts XI, 2004-1, 2005-1, and 2006-1 are based on outstanding principal balance. Delinquency rates for Trusts II, IV, VI, VII, VIII, and X are based on gross balance, as reported historically. Gross balances include unearned interest. |

| 17 Static Pool Data - Prepayment Rates |

| 18 Total Portfolio Note: Portfolio characteristics data relates to the servicing portfolio only. |

| 19 Unencumbered Assets |

| 20 Trust II |
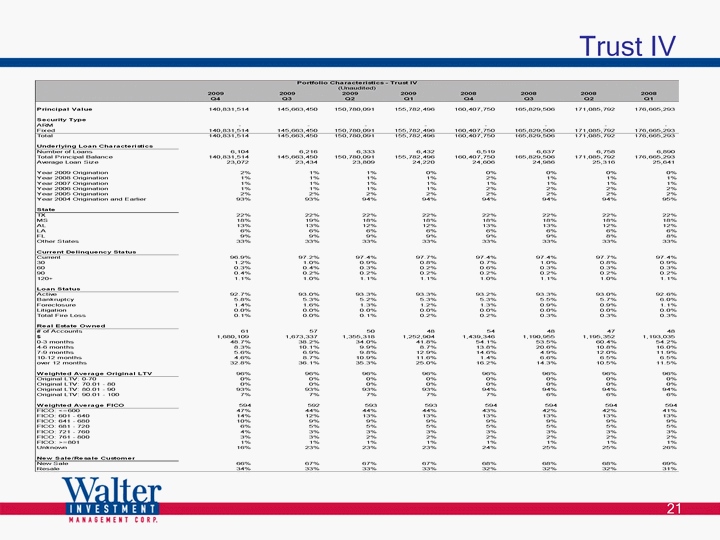
| 21 Trust IV |
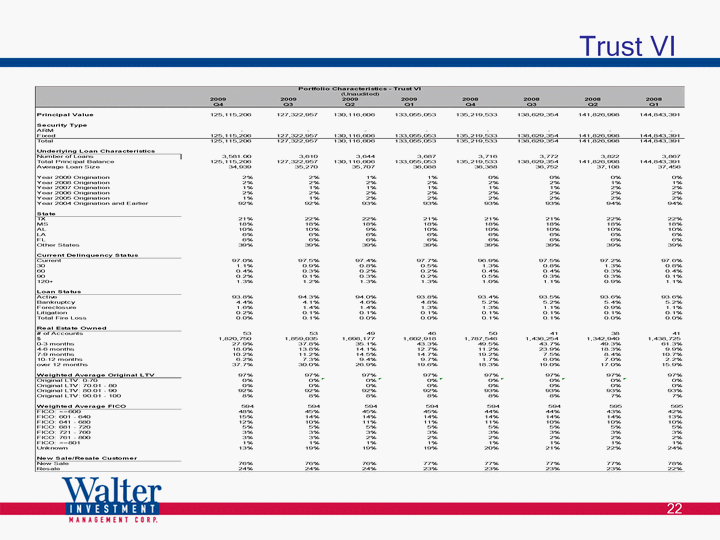
| 22 Trust VI |

| 23 Trust VII |

| 24 Trust VIII |

| 25 Trust X |

| 26 Trust XI |

| 27 Trust 2004-1 |
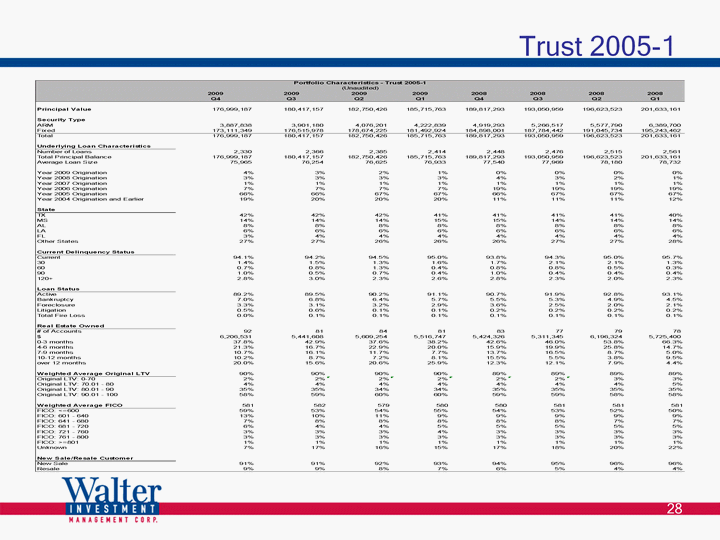
| 28 Trust 2005-1 |

| 29 Trust 2006-1 |

| 30 Securitization Triggers Refer to indenture and all other securitization documents for further details on covenants and servicer requirements. |