Attached files
| file | filename |
|---|---|
| 8-K - FORM 8-K - TAYLOR CAPITAL GROUP INC | d8k.htm |
 Exhibit 99.1 |
 2 2 Forward-Looking Statement This presentation contains certain forward-looking statements within the meaning
of the Private Securities Litigation Reform Act of 1995.
Forward-looking statements include expressions such as “may,” “might,” “plan,” “prudent,” “potential,” “should,” “will,” “expect,” “anticipate,” “believe,” “intend,” “could,” and “estimate,” and reflect our current expectations and projections about future events. Actual results could materially differ from those presented due to a variety of internal and external factors. Except as required by the SEC, we undertake no obligation to release revisions or report events or circumstances after the date of this presentation. Additional information concerning factors that
could cause actual results to differ materially from those in the
forward-looking statements is contained from time to time in our SEC
filings, including, but not limited to, our report on Form 10-K; our
reports on Form 10-Q; and other filings. Copies of these filings may be
obtained on our website at www.taylorcapitalgroup.com or the SEC’s website at www.sec.gov. |
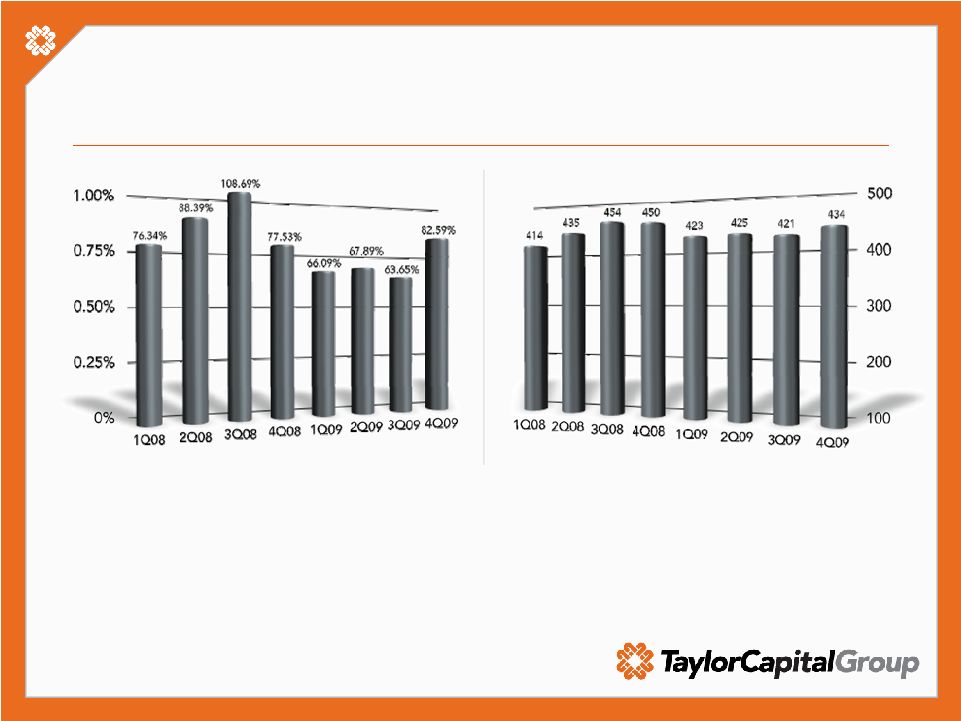
 3 3 Overview: Taylor Capital Group • Holding company for Cole Taylor Bank – Founded by business owners for business owners in 1929 – Evolved through three generations of family leadership – Chicago’s ninth largest bank – 434 employees – Nine banking centers – $4.4 billion in assets • Segment-focused commercial lender – Chicago’s banking specialist for closely-held businesses |
 4 4 Financial Summary Capital Ratios |
 |
 6 6 Strategically Restructured for Growth • Restructured senior management team • Recruited approximately 50 experienced bankers • Established 180 new commercial banking relationships • Added experienced, locally-connected board members • Raised $120 million of capital in September, 2008 – $60 million convertible preferred stock at Taylor Capital Group – $60 million in units composed of: • Subordinated debt at Cole Taylor Bank • Warrants to purchase shares of Taylor Capital Group • Received $105 million in TARP • Grew loans and improved portfolio mix |
 7 7 Increased Loans, Improved Mix |
 |
 9 9 Refocus on Asset Quality, Expense Control • 200+ relationships added • Loans down $200 million – Strategically exited certain market categories – Commitments up, utilization down • Great success in growing deposits – DDA up $188 million, or 40% – Brokered deposits down $50 million • Reduced funding costs • Quarterly NIM up from 2.37% in Q408 to 3.10% in Q409 • Total revenue up $52 million • Expenses, after NPA & FDIC increases, down $10 million |
 10 10 2009 Asset Quality Improvements • NPLs down $59 million or 29% • NPAs down $46 million or 21% • Total Classified Assets down $30 million • Inflows to nonaccruals the lowest it has been in over 2 years at $21 million • Coverage of ALLL to NPLs strong at 75% |
 11 11 Controlled Growth Strategic Loan Growth |
 12 Reduced Funding Costs • Increased core relationship deposits • Decreased reliance on wholesale & brokered funding 12 |
 13 Reduced Funding Costs Improved Net Interest Margin 13 |
 Revenues increased throughout 2009 14 Total Revenues in millions |
 15 15 Controlling Expenses Improved Efficiency Ratio Full Time Employees |
 16 Overall Growth in Relationships • Commercial Banking, led by Larry Ryan – 391 new commercial banking relationships – $1.325 billion in new loan fundings – $351 million in new deposits • Asset Based Lending, led by Mike Sharkey – $403 million in new loan commitments – $203 million in new loan fundings – $5.7 million in closing fees – $18.2 million in deposits 16 |
 |
 2010
Strategic Focus • Asset quality • Deposit generation • Pricing discipline • Controlled growth • Growth in revenues – Cash management / fee income – Cole Taylor Mortgage |
 |
 20 20 Asset Quality • Economic challenges serious and ongoing • Experienced lenders know clients, market • Aggressive approach towards recognizing, reserving and charging off problem credits • Enhanced loss mitigation through ABL • Reserve to nonaccruals above peers • Proactive approach to disposition of NPA |
 21 Continued reduction in residential construction exposure |
 22 Smaller CRE Portfolio Concentrations • Other CRE concentrations, post residential construction not nearly so large |
 23 23 Early recognition of issues NPLs / Loans: Summary Source: SNL Financial; 2009Q4 from press releases. |
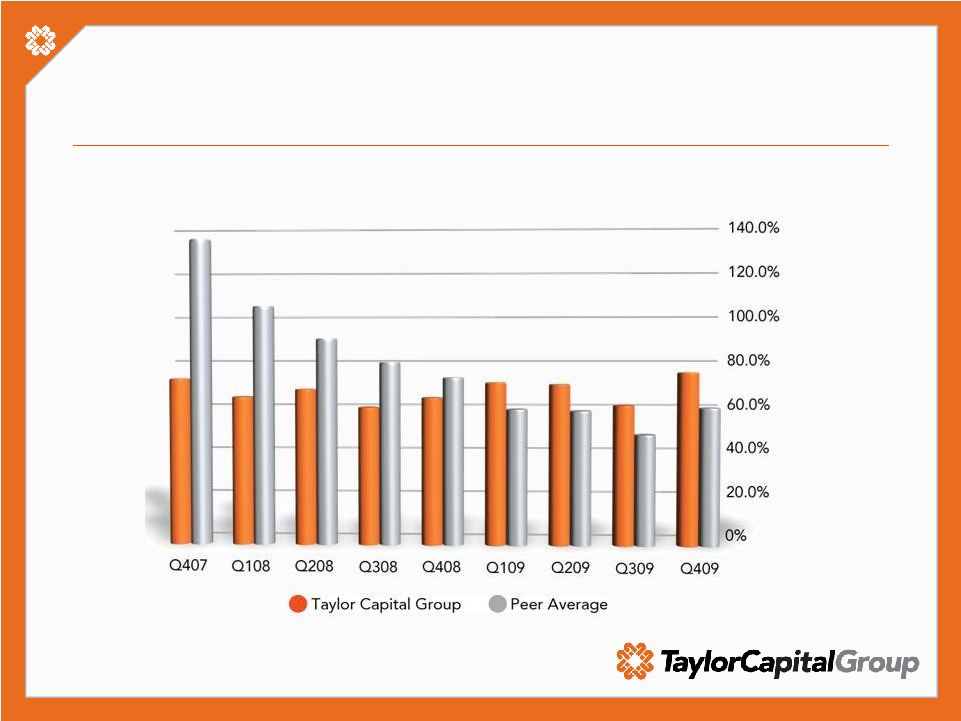
 24 24 24 Most improved among our peers since 2008 1 Source: SNL Financial; 2009Q4 from press releases. 1 TAYC has decreased this ratio by 1.5 points or 25% since Q408; our peers, on
average, have increased 3.2 points or nearly 140% in the same period.
NPLs / Loans: Detail |
 25 25 Aggressive reserves as compared to peers Reserves / Loans: Summary Source: SNL Financial; 2009Q4 from press releases. |
 26 …and it shows in our coverage as well Reserves / NPLs: Summary Source: SNL Financial; 2009Q4 from press releases. |
 27 27 27 Reserve coverage to NPLs is #1 among our peers Source: SNL Financial; 2009Q4 from press releases. Reserves / NPLs: Detail |
 28 28 Summary • Challenging economic conditions – Priority #1 is asset quality • Strong and clearly defined strategy – Focused on building our core business (Continued organic growth) – Need for prudent growth – Grow revenue streams – Return to profitability |
 29 29 Questions ? |
 30 30 Thank you |