Attached files
| file | filename |
|---|---|
| 8-K - 8-K - SCIENTIFIC GAMES CORP | a10-3462_38k.htm |
| EX-99.1 - PRESS RELEASE OF SCIENTIC GAMES DTD MARCH 1, 2010 - SCIENTIFIC GAMES CORP | a10-3462_3ex99d1.htm |
Exhibit 99.2
|
|
Fourth Quarter and Full Year 2009 Earnings Results |

|
|
Safe Harbor Statement In this presentation and the related discussion, Scientific Games Corporation (“Scientific Games” or the “Company”) makes “forward-looking statements” within the meaning of the U.S. Private Securities Litigation Reform Act of 1995. Forward-looking statements describe future expectations, plans, results or strategies and can often be identified by the use of terminology such as “may,” “will,” “estimate,” “intend,” “continue,” “believe,” “expect,” “anticipate,” “could,” “potential,” “opportunity,” or similar terminology. These statements are based upon management’s current expectations, assumptions and estimates and are not guarantees of future results or performance. Actual results may differ materially from those projected in these statements due to a variety of risks and uncertainties and other factors, including, among other things: competition; material adverse changes in economic and industry conditions; technological change; retention and renewal of existing contracts and entry into new or revised contracts; availability and adequacy of cash flow to satisfy obligations and indebtedness or future needs; protection of intellectual property; security and integrity of software and systems; laws and government regulation, including those relating to gaming licenses, permits and operations; inability to identify, complete and integrate future acquisitions; inability to benefit from, and risks associated with, our joint ventures and strategic investments and relationships; inability to complete the proposed sale of the Racing and Venue Management businesses; seasonality; inability to enhance and develop successful gaming concepts; dependence on suppliers and manufacturers; liability for product defects; factors associated with foreign operations; influence of certain stockholders; dependence on key personnel; failure to perform on contracts; resolution of pending or future litigation; labor matters; and stock price volatility. Additional information regarding risks and uncertainties and other factors that could cause actual results to differ materially from those contemplated in forward-looking statements is included from time to time in Scientific Games’ filings with the Securities and Exchange Commission. The date of this presentation is as of March 1, 2010, and the information provided herein is presented through the dates indicated on the applicable slides. Forward-looking statements speak only as of the date they are made, and, except for Scientific Games’ ongoing obligations under the U.S. federal securities laws, Scientific Games undertakes no obligation to publicly update any forward-looking statements whether as a result of new information, future events or otherwise. Note Regarding Presentation of Non-GAAP Financial Measures: This presentation and the related discussion include certain financial measures that were not prepared in accordance with U.S. generally accepted accounting principles. Additional information regarding these non-GAAP financial measures, including reconciliations to the most directly comparable U.S. GAAP financial measures, can be found in Scientific Games’ press release dated March 1, 2010. This press release is available on Scientific Games’ website at www.scientificgames.com in the “Investor Information – Recent News” section. 2 |
|
|
Lottery industry proved to be recession-resistant, with U.S. lottery sales +1%, French lottery sales +9% and double-digit instant ticket growth in Portugal (+13%) and Netherlands (+16%) in the context of a severe global recession 7% decline in U.S. retail sales(1) High single-digit percentage declines reported for U.S.-based casinos (Las Vegas; Atlantic City) Confluence of factors masked underlying resiliency of our business: Large contract re-pricings Unfavorable foreign currency translation Achieved solid adjusted EBITDA(2) performance in light of these factors and in a difficult environment Overview 2009 was a challenging year, but resiliency of core underlying business and new initiatives position us for success moving forward... 3 Source: U.S. Census Bureau. Adjusted EBITDA is non-GAAP measure, defined as net income (loss) plus income tax expense, depreciation and amortization expense, and interest expense, net of other income (loss) and is adjusted to add back certain items identified in our press release dated March 1, 2010. A reconciliation of adjusted EBITDA to net income (loss) is included in our March 1, 2010 press release. |
|
|
Exceeded Profitability Improvement Program savings and Free Cash Flow(1) targets Strengthened liquidity profile and extended weighted average debt maturity Made significant progress in China Positioned Racing and Venue Management businesses for sale Negotiated strategic partnerships with Playtech Beginning to see evidence of strengthening trends: Growth in key instant ticket jurisdictions New Lottery Systems initiatives driven by cross-selling efforts underway Improving Global Draw win per day Retail sales increasing in China Overview 2009 was a challenging year, but resiliency of core underlying business and new initiatives position us for success moving forward... 4 (1) Free Cash Flow is a non-GAAP financial measure and represents net cash provided by operating activities less total capital expenditures (which includes wagering systems expenditures and other intangible assets and software expenditures). A reconciliation of Free Cash Flow to net cash provided by operating activities is included in our March 1, 2010 press release. |
|
|
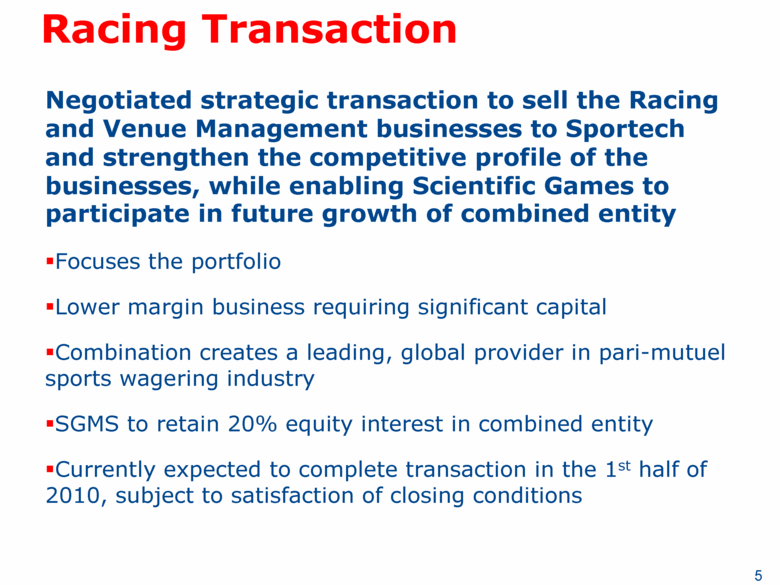
Racing Transaction Negotiated strategic transaction to sell the Racing and Venue Management businesses to Sportech and strengthen the competitive profile of the businesses, while enabling Scientific Games to participate in future growth of combined entity Focuses the portfolio Lower margin business requiring significant capital Combination creates a leading, global provider in pari-mutuel sports wagering industry SGMS to retain 20% equity interest in combined entity Currently expected to complete transaction in the 1st half of 2010, subject to satisfaction of closing conditions 5 |
|
|
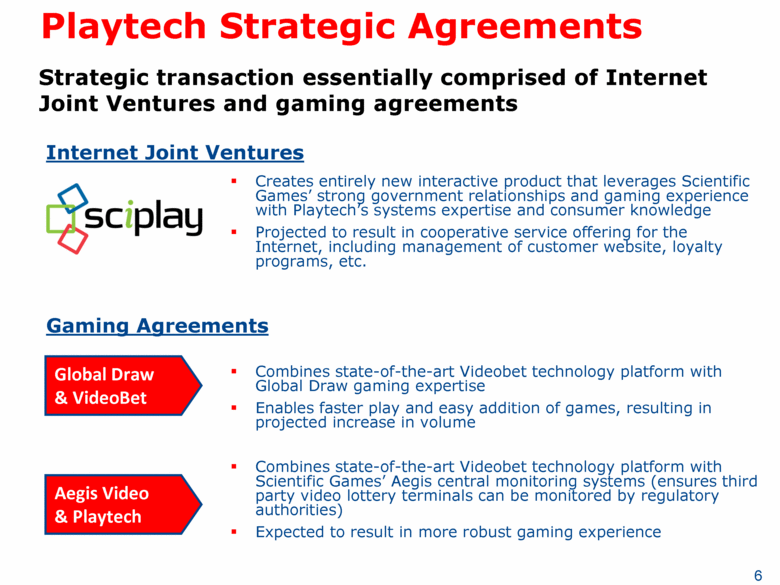
Playtech Strategic Agreements Internet Joint Ventures Creates entirely new interactive product that leverages Scientific Games’ strong government relationships and gaming experience with Playtech’s systems expertise and consumer knowledge Projected to result in cooperative service offering for the Internet, including management of customer website, loyalty programs, etc. Gaming Agreements Combines state-of-the-art Videobet technology platform with Global Draw gaming expertise Enables faster play and easy addition of games, resulting in projected increase in volume Combines state-of-the-art Videobet technology platform with Scientific Games’ Aegis central monitoring systems (ensures third party video lottery terminals can be monitored by regulatory authorities) Expected to result in more robust gaming experience Global Draw & VideoBet Aegis Video & Playtech Strategic transaction essentially comprised of Internet Joint Ventures and gaming agreements 6 |
|
|
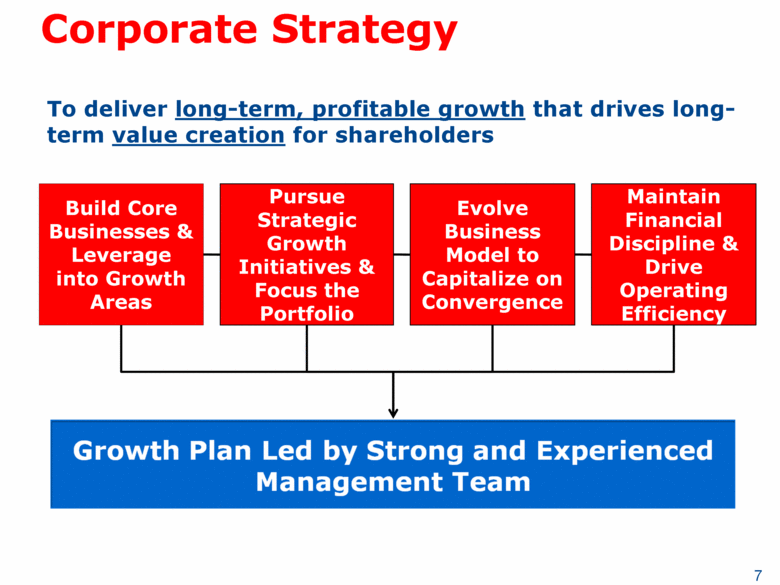
Corporate Strategy To deliver long-term, profitable growth that drives long-term value creation for shareholders Build Core Businesses & Leverage into Growth Areas Pursue Strategic Growth Initiatives & Focus the Portfolio Evolve Business Model to Capitalize on Convergence Maintain Financial Discipline & Drive Operating Efficiency 7 |
|
|
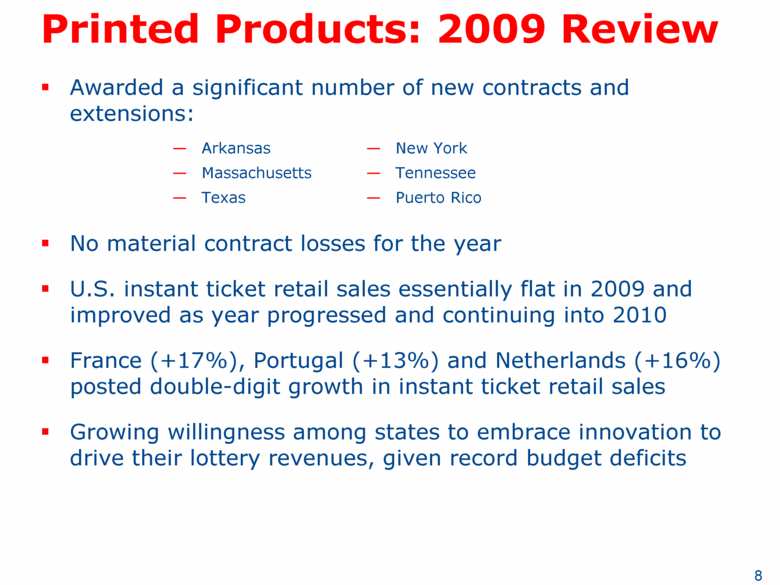
Printed Products: 2009 Review Awarded a significant number of new contracts and extensions: No material contract losses for the year U.S. instant ticket retail sales essentially flat in 2009 and improved as year progressed and continuing into 2010 France (+17%), Portugal (+13%) and Netherlands (+16%) posted double-digit growth in instant ticket retail sales Growing willingness among states to embrace innovation to drive their lottery revenues, given record budget deficits New York Tennessee Puerto Rico Arkansas Massachusetts Texas 8 |
|
|
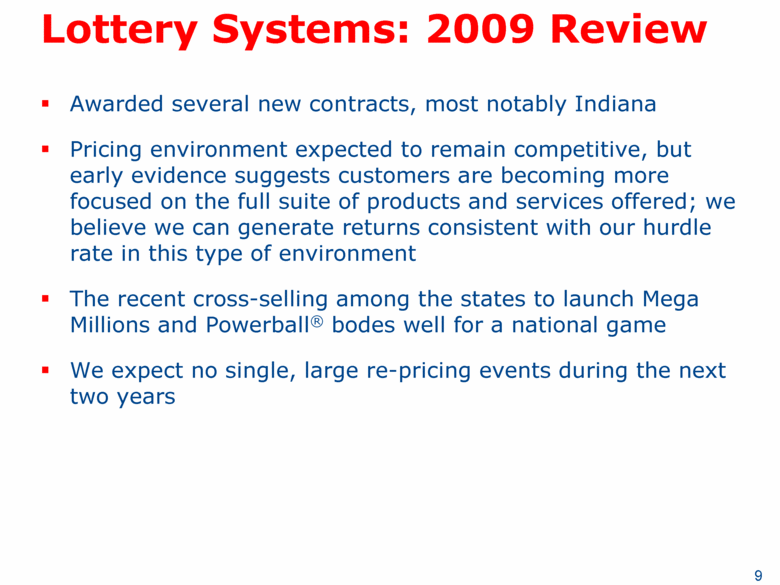
Lottery Systems: 2009 Review Awarded several new contracts, most notably Indiana Pricing environment expected to remain competitive, but early evidence suggests customers are becoming more focused on the full suite of products and services offered; we believe we can generate returns consistent with our hurdle rate in this type of environment The recent cross-selling among the states to launch Mega Millions and Powerball® bodes well for a national game We expect no single, large re-pricing events during the next two years 9 |
|
|
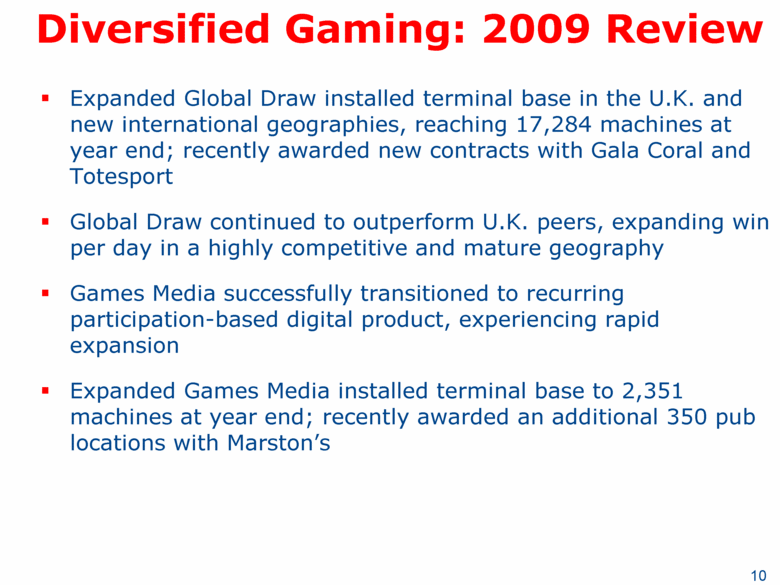
Diversified Gaming: 2009 Review Expanded Global Draw installed terminal base in the U.K. and new international geographies, reaching 17,284 machines at year end; recently awarded new contracts with Gala Coral and Totesport Global Draw continued to outperform U.K. peers, expanding win per day in a highly competitive and mature geography Games Media successfully transitioned to recurring participation-based digital product, experiencing rapid expansion Expanded Games Media installed terminal base to 2,351 machines at year end; recently awarded an additional 350 pub locations with Marston’s 10 |
|
|
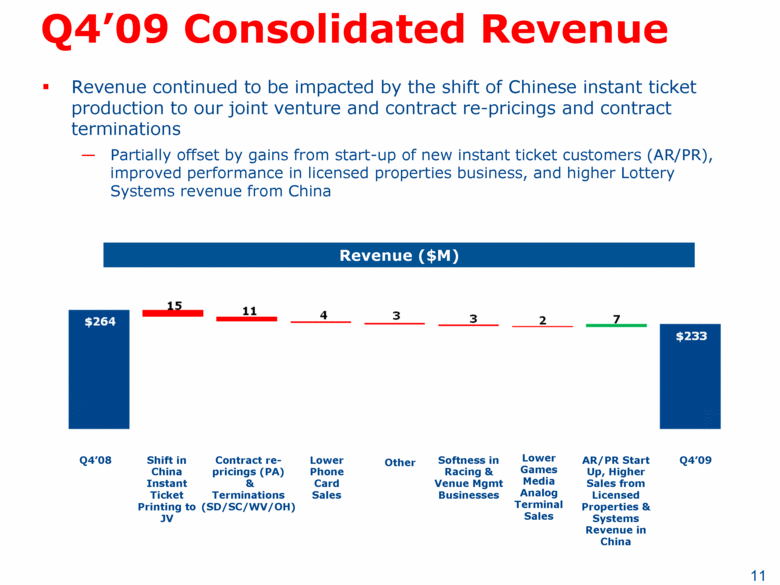
Q4’09 Consolidated Revenue Revenue ($M) Revenue continued to be impacted by the shift of Chinese instant ticket production to our joint venture and contract re-pricings and contract terminations Partially offset by gains from start-up of new instant ticket customers (AR/PR), improved performance in licensed properties business, and higher Lottery Systems revenue from China Q4’08 Q4’09 11 Shift in China Instant Ticket Printing to JV Contract re-pricings (PA) & Terminations (SD/SC/WV/OH) Lower Phone Card Sales Softness in Racing & Venue Mgmt Businesses Lower Games Media Analog Terminal Sales Other AR/PR Start Up, Higher Sales from Licensed Properties & Systems Revenue in China |
|
|
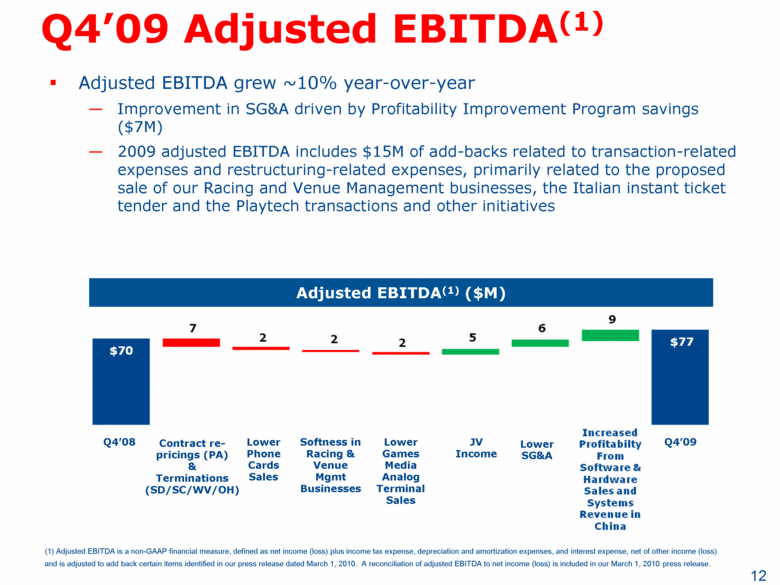
Q4’09 Adjusted EBITDA(1) Adjusted EBITDA grew ~10% year-over-year Improvement in SG&A driven by Profitability Improvement Program savings ($7M) 2009 adjusted EBITDA includes $15M of add-backs related to transaction-related expenses and restructuring-related expenses, primarily related to the proposed sale of our Racing and Venue Management businesses, the Italian instant ticket tender and the Playtech transactions and other initiatives Adjusted EBITDA(1) ($M) Q4’08 Lower Phone Cards Sales JV Income Q4’09 Softness in Racing & Venue Mgmt Businesses Lower SG&A Contract re-pricings (PA) & Terminations (SD/SC/WV/OH) Lower Games Media Analog Terminal Sales 12 (1) Adjusted EBITDA is a non-GAAP financial measure, defined as net income (loss) plus income tax expense, depreciation and amortization expenses, and interest expense, net of other income (loss) and is adjusted to add back certain items identified in our press release dated March 1, 2010. A reconciliation of adjusted EBITDA to net income (loss) is included in our March 1, 2010 press release. |
|
|
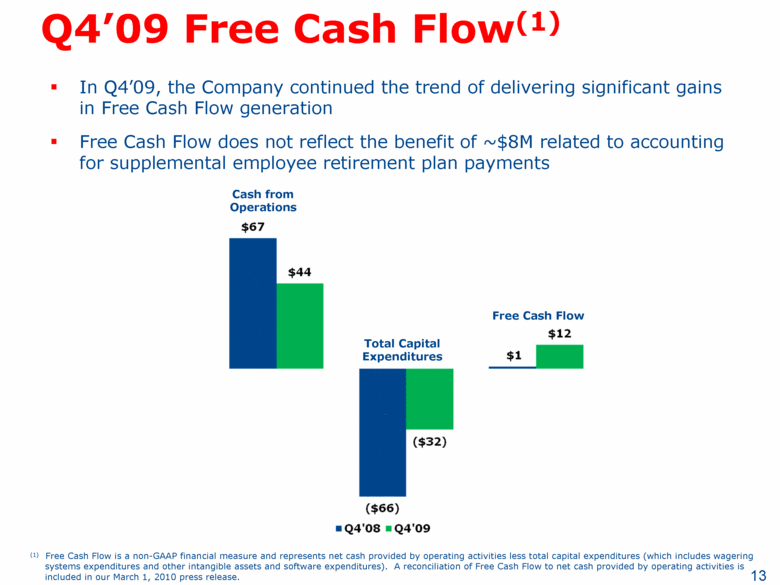
Q4’09 Free Cash Flow(1) (1) Free Cash Flow is a non-GAAP financial measure and represents net cash provided by operating activities less total capital expenditures (which includes wagering systems expenditures and other intangible assets and software expenditures). A reconciliation of Free Cash Flow to net cash provided by operating activities is included in our March 1, 2010 press release. In Q4’09, the Company continued the trend of delivering significant gains in Free Cash Flow generation Free Cash Flow does not reflect the benefit of ~$8M related to accounting for supplemental employee retirement plan payments Cash from Operations Total Capital Expenditures Free Cash Flow 13 |
|
|
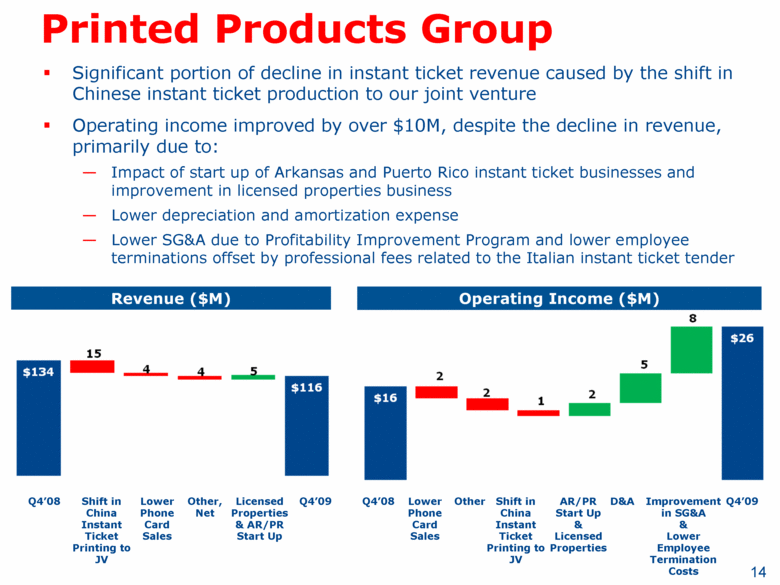
Printed Products Group Operating Income ($M) Revenue ($M) Significant portion of decline in instant ticket revenue caused by the shift in Chinese instant ticket production to our joint venture Operating income improved by over $10M, despite the decline in revenue, primarily due to: Impact of start up of Arkansas and Puerto Rico instant ticket businesses and improvement in licensed properties business Lower depreciation and amortization expense Lower SG&A due to Profitability Improvement Program and lower employee terminations offset by professional fees related to the Italian instant ticket tender Q4’09 Q4’08 Lower Phone Card Sales Lower Phone Card Sales Q4’08 D&A Improvement in SG&A & Lower Employee Termination Costs Q4’09 Licensed Properties & AR/PR Start Up Other, Net 14 Shift in China Instant Ticket Printing to JV Shift in China Instant Ticket Printing to JV Other AR/PR Start Up & Licensed Properties |
|
|
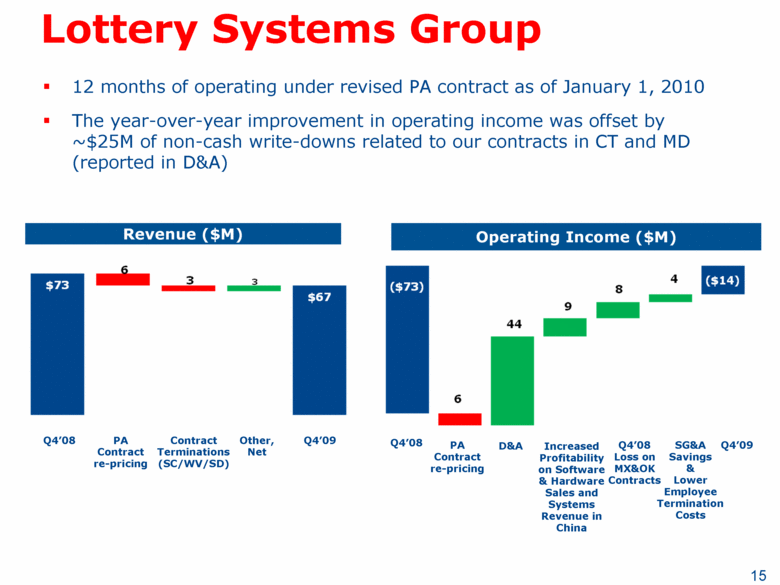
Lottery Systems Group Operating Income ($M) Revenue ($M) 12 months of operating under revised PA contract as of January 1, 2010 The year-over-year improvement in operating income was offset by ~$25M of non-cash write-downs related to our contracts in CT and MD (reported in D&A) Q4’09 Q4’08 PA Contract re-pricing Contract Terminations (SC/WV/SD) D&A Q4’08 Increased Profitability on Software & Hardware Sales and Systems Revenue in China SG&A Savings & Lower Employee Termination Costs Q4’09 Other, Net 15 PA Contract re-pricing Q4’08 Loss on MX&OK Contracts |
|
|
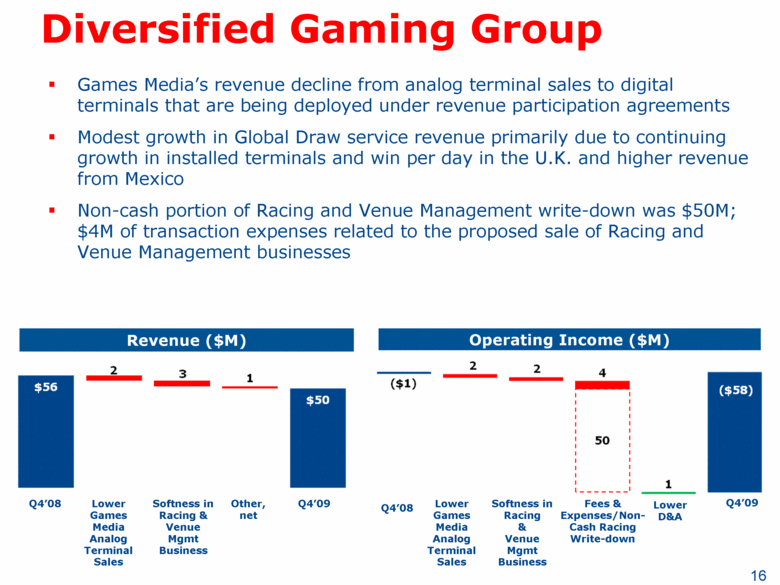
Diversified Gaming Group Operating Income ($M) Revenue ($M) Games Media’s revenue decline from analog terminal sales to digital terminals that are being deployed under revenue participation agreements Modest growth in Global Draw service revenue primarily due to continuing growth in installed terminals and win per day in the U.K. and higher revenue from Mexico Non-cash portion of Racing and Venue Management write-down was $50M; $4M of transaction expenses related to the proposed sale of Racing and Venue Management businesses Q4’09 Q4’08 Lower Games Media Analog Terminal Sales Softness in Racing & Venue Mgmt Business Q4’08 Lower Games Media Analog Terminal Sales Softness in Racing & Venue Mgmt Business Other, net Q4’09 Lower D&A 16 Fees & Expenses/Non-Cash Racing Write-down |
|
|
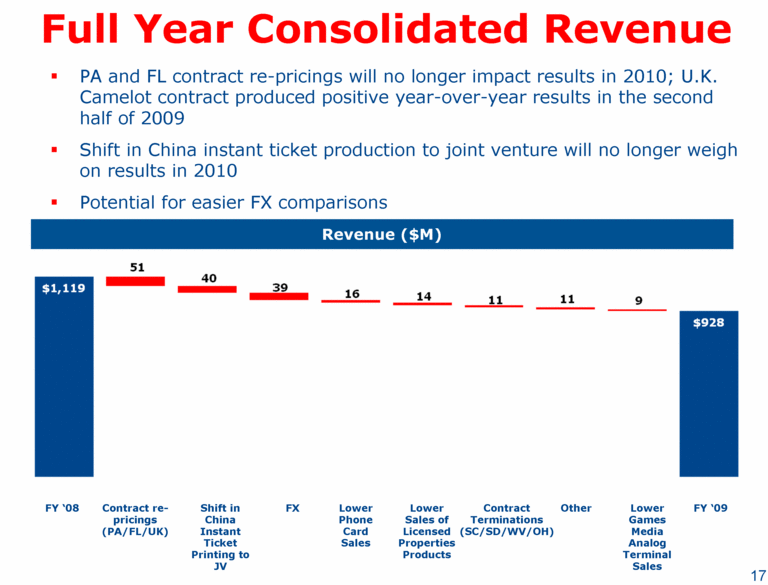
Full Year Consolidated Revenue Revenue ($M) FY ‘08 Contract re-pricings (PA/FL/UK) FX FY ‘09 17 Lower Phone Card Sales Lower Sales of Licensed Properties Products Contract Terminations (SC/SD/WV/OH) Other PA and FL contract re-pricings will no longer impact results in 2010; U.K. Camelot contract produced positive year-over-year results in the second half of 2009 Shift in China instant ticket production to joint venture will no longer weigh on results in 2010 Potential for easier FX comparisons Shift in China Instant Ticket Printing to JV Lower Games Media Analog Terminal Sales |
|
|
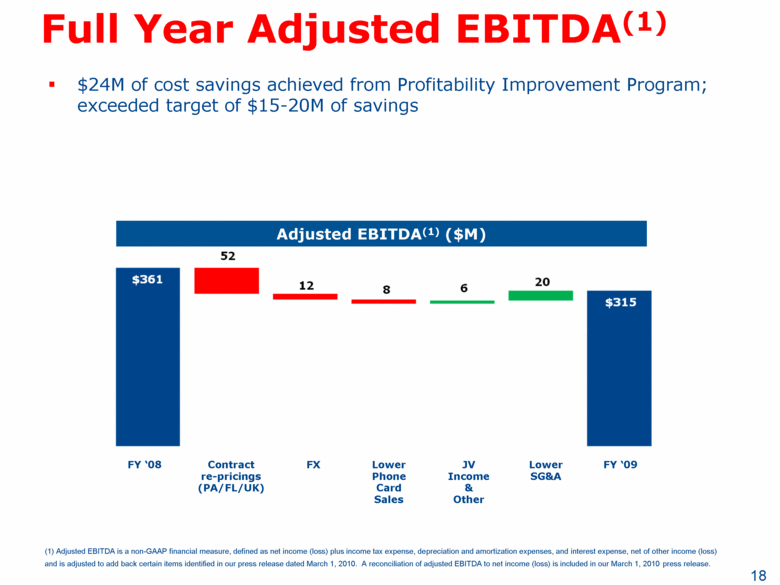
Full Year Adjusted EBITDA(1) 18 Adjusted EBITDA(1) ($M) FY ‘08 Contract re-pricings (PA/FL/UK) Lower Phone Card Sales JV Income & Other FY ‘09 FX Lower SG&A $24M of cost savings achieved from Profitability Improvement Program; exceeded target of $15-20M of savings (1) Adjusted EBITDA is a non-GAAP financial measure, defined as net income (loss) plus income tax expense, depreciation and amortization expenses, and interest expense, net of other income (loss) and is adjusted to add back certain items identified in our press release dated March 1, 2010. A reconciliation of adjusted EBITDA to net income (loss) is included in our March 1, 2010 press release. |
|
|
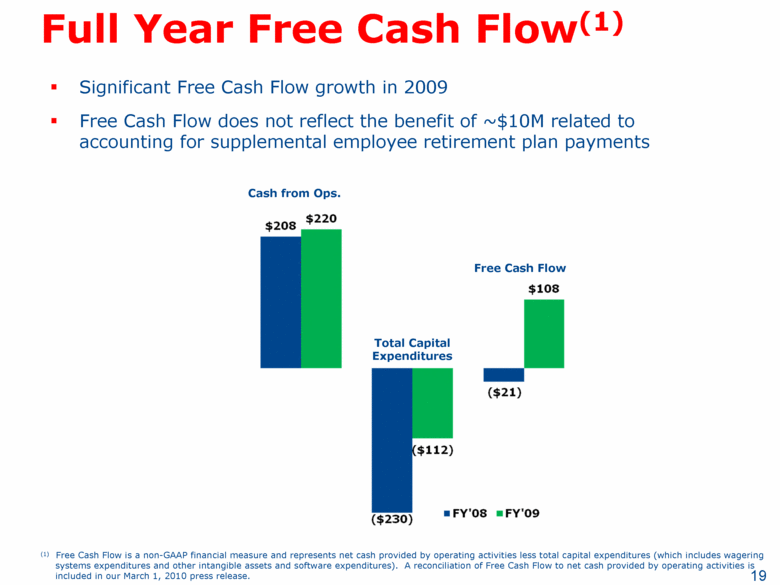
Full Year Free Cash Flow(1) Cash from Ops. Free Cash Flow Total Capital Expenditures Significant Free Cash Flow growth in 2009 Free Cash Flow does not reflect the benefit of ~$10M related to accounting for supplemental employee retirement plan payments 19 (1) Free Cash Flow is a non-GAAP financial measure and represents net cash provided by operating activities less total capital expenditures (which includes wagering systems expenditures and other intangible assets and software expenditures). A reconciliation of Free Cash Flow to net cash provided by operating activities is included in our March 1, 2010 press release. |
|
|
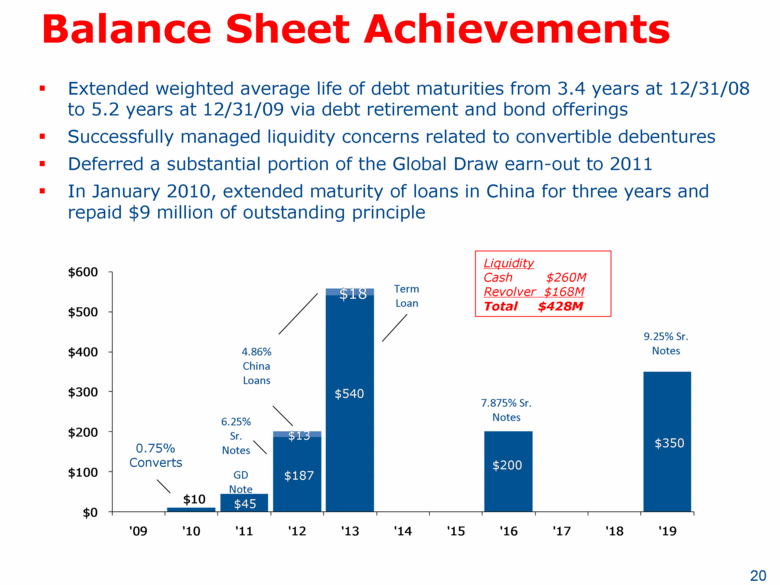
Balance Sheet Achievements Extended weighted average life of debt maturities from 3.4 years at 12/31/08 to 5.2 years at 12/31/09 via debt retirement and bond offerings Successfully managed liquidity concerns related to convertible debentures Deferred a substantial portion of the Global Draw earn-out to 2011 In January 2010, extended maturity of loans in China for three years and repaid $9 million of outstanding principle 20 0.75% Converts GD Note 6.25% Sr. Notes 7.875% Sr. Notes Term Loan 9.25% Sr. Notes 4.86% China Loans Liquidity Cash $260M Revolver $168M Total $428M $10 $45 $187 $540 $200 $350 $13 $18 $0 $100 $200 $300 $400 $500 $600 '09 '10 '11 '12 '13 '14 '15 '16 '17 '18 '19 |