Attached files
| file | filename |
|---|---|
| 8-K - FORM 8-K - Chaparral Energy, Inc. | d8k.htm |
 Exhibit 99.1 JP Morgan High Yield Conference Miami, Florida March 2010 JP Morgan High Yield Conference Miami, Florida March 2010 |
 2 2 Disclaimer - Forward Looking Statements Disclaimer - Forward Looking Statements This presentation contains forward-looking statements. These forward-looking statements relate to,
among other things, our financial and operating performance and results, our business strategy,
market prices, our future commodity price risk management activities, and our plans and
forecasts. We have based these forward-looking statements on our current assumptions,
expectations and projections about future events. We may use the words “may,” “expect,” “anticipate,” “estimate,” “believe,” “target,” “continue,” “intend,” “plan,” “budget” and other similar words to identify forward-looking statements. You should read statements that contain
these words carefully because they discuss future expectations, contain projections of results of operations or of our financial condition and/or state other “forward-looking” information. We do not undertake any obligation to update or revise publicly any forward- looking statements, except as required by law. These statements also involve risks and uncertainties that
could cause our actual results or financial condition to materially differ from our
expectations in this presentation, including, but not limited to fluctuations in prices of oil
and natural gas, future capital requirements and availability of financing, estimates of reserves, geological concentration of our reserves, risks associated with drilling and operating wells, discovery,
acquisition, development and replacement of oil and natural gas reserves, cash flow and
liquidity, timing and amount of future production of oil and natural gas, availability of
drilling and production equipment, marketing of oil and natural gas, developments in
oil-producing and natural gas-producing countries, competition, general economic conditions, governmental regulations, receipt of amounts owed to us by purchasers of our production and counterparties
to our commodity price risk management contracts, hedging decisions, including whether or not
to enter into derivative financial instruments, terrorist attacks, actions by third-party
co-owners of interests in properties in which we also own an interest, and fluctuations in
interest rates. We believe it is important to communicate our expectations of future performance
to our investors. However, events may occur in the future that we are unable to accurately predict, or over which we have no control. When considering our forward-looking statements, you should keep in mind the risk factors and other cautionary statements found in our annual and quarterly reports filed with the Securities and Exchange Commission. The risks noted therein provide examples of risks, uncertainties and events that may cause our actual results to differ materially from those contained in any
forward-looking statement. |
 3 3 Management Representatives Management Representatives Joe Evans, Chief Financial Officer & Executive Vice President Mark Fischer, Chief Executive Officer & President Diane Montgomery Director, Corporate Finance |
 4 4 Company Overview Company Overview |
 5 5 Chaparral Overview Chaparral Overview Founded in 1988, based in Oklahoma City Core areas are Mid-Continent and Permian Basin Comprise 90% of reserves and 87% of 2009 production Third largest oil producer in Oklahoma Substantial resource potential Long-lived, shallow-decline conventional reserve base – R/P 21 yrs Significant near-term high-potential growth opportunities in major plays
Significant resource potential Enhanced Oil Recovery Woodford shale gas opportunities Experienced management team with high ownership stake Ownership Summary Key Financial Initiatives Improve liquidity and financial flexibility Complete Equity Transaction Signed term Sheet Private equity provider Exclusive negotiations Minority Investment Execute new credit facility $300 - $500 million 3 to 4 year term Mark A. Fischer 42.5% Altoma Energy G.P. 25.6% CHK Holdings, L.L.C. 31.9% |
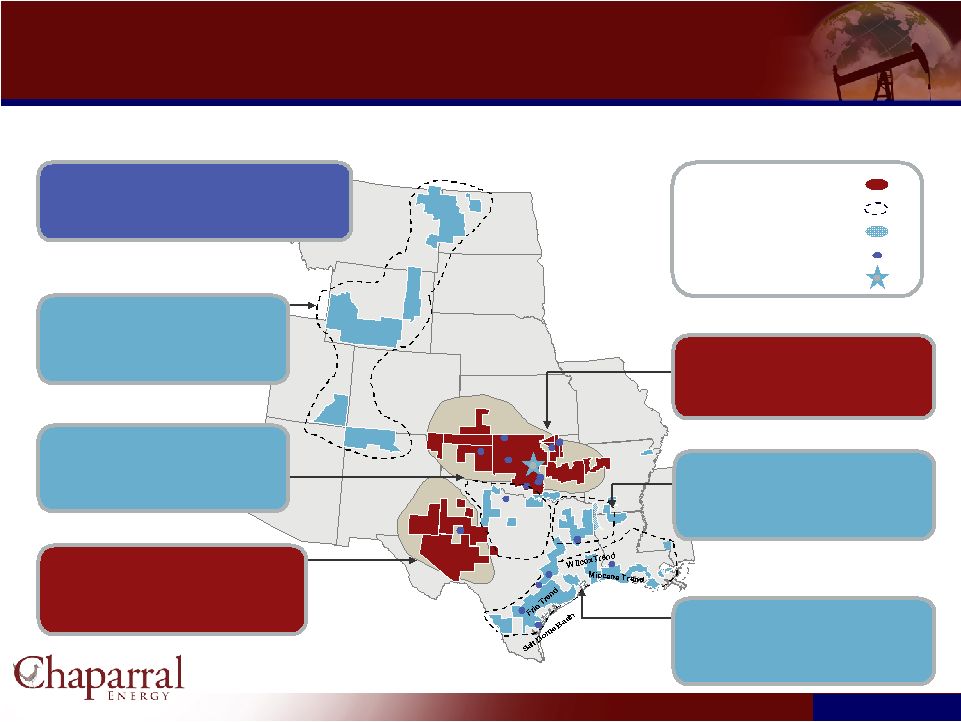 6 6 Operating Areas Operating Areas As of December 31, 2009 (SEC) Core Area Growth Area Acreage Field Offices Headquarters North Texas Reserves: 2.4 MMBoe, 2% of total Production: 0.4 MBoe/d, 2% of total Acreage (gross / net): 26,254 / 18,360 Permian Basin Reserves: 16.2 MMBoe, 11% of total Production: 4.4 MBoe/d, 21% of total Acreage (gross / net): 90,063 / 66,285 Rocky Mountains Reserves: 2.2 MMBoe, 1% of total Production: 0.4 MBoe/d, 2% of total Acreage (gross / net): 52,088 / 18,532 Company Total December 2009 proved reserves – 142 MMBoe 2009 average daily production – 21 MBoe/d Acreage (gross / net): 1,248,929 / 620,557 Val Verde Basin Gulf Coast Reserves: 6.8 MMBoe, 5% of total Production: 1.3 MBoe/d, 6% of total Acreage (gross / net): 98,902 / 63,367 Mid-Continent Reserves: 111.6 MMBoe, 79% of total Production: 13.7 MBoe/d, 66% of total Acreage (gross / net): 959,256 / 443,907 Ark-La-Tex Reserves: 2.7 MMBoe, 2% of total Production: 0.7 MBoe/d, 3% of total Acreage (gross / net): 22,366 / 10,106 Sabine Uplift Midland Basin Delaware Basin Ouachita Uplift Arkoma Basin Fort Worth Basin Williston Basin Powder River Basin Greater Green River Basin San Juan Basin Anadarko Woodford Basin OKC |
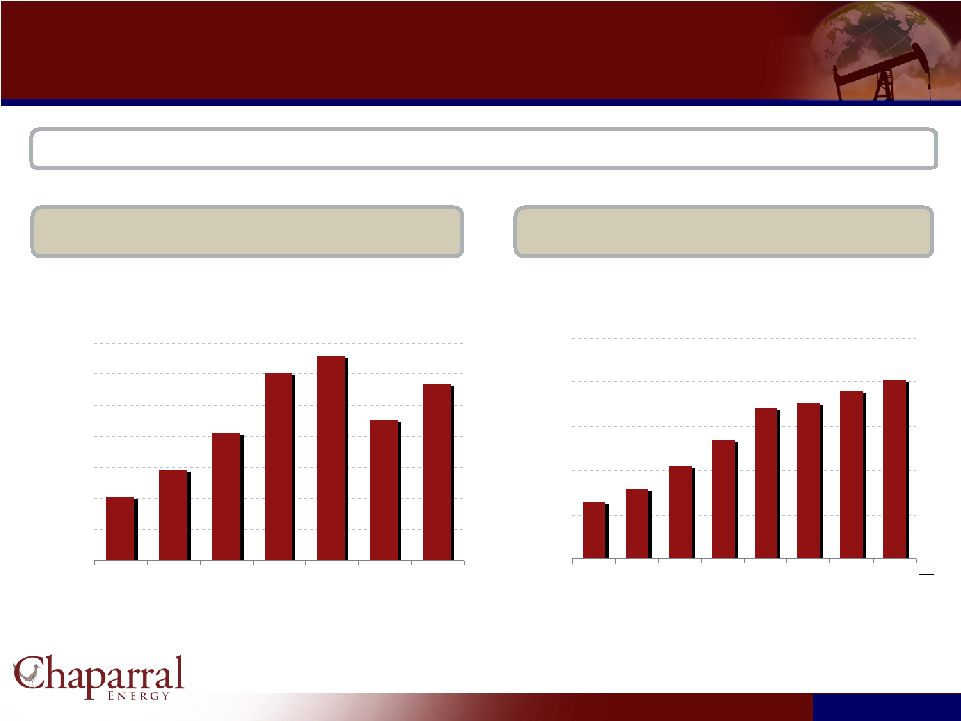 7 7 Strong Record of Reserve and Production Growth Strong Record of Reserve and Production Growth Year-End SEC Reserves (MMBoe) (1)(2) 2003 –2009 CAGR = 19% Annual Production (MMBoe) 2003 – 2009 CAGR = 20% Chaparral’s reserve replacement ratio averaged 599% per year from 2002 to 2008 142 51 73 103 151 164 113 0 25 50 75 100 125 150 175 2003 2004 2005 2006 2007 2008 2009 2.6 3.2 4.2 5.4 6.8 7.1 7.6 8.1 0 2 4 6 8 10 2003 2004 2005 2006 2007 2008 2009E 2010E (3) Notes: 1)Reserves as of December 31, 2008 are based on flat SEC pricing of $44.60/Bbl and $5.61.Mcf
2)Reserves as of December 31, 2009 are based on flat SEC pricing of $61.18/Bbl and $3.87/Mcf
3)Production of 8.1 MMBoe represents midpoint of current production guidance for 2010 |
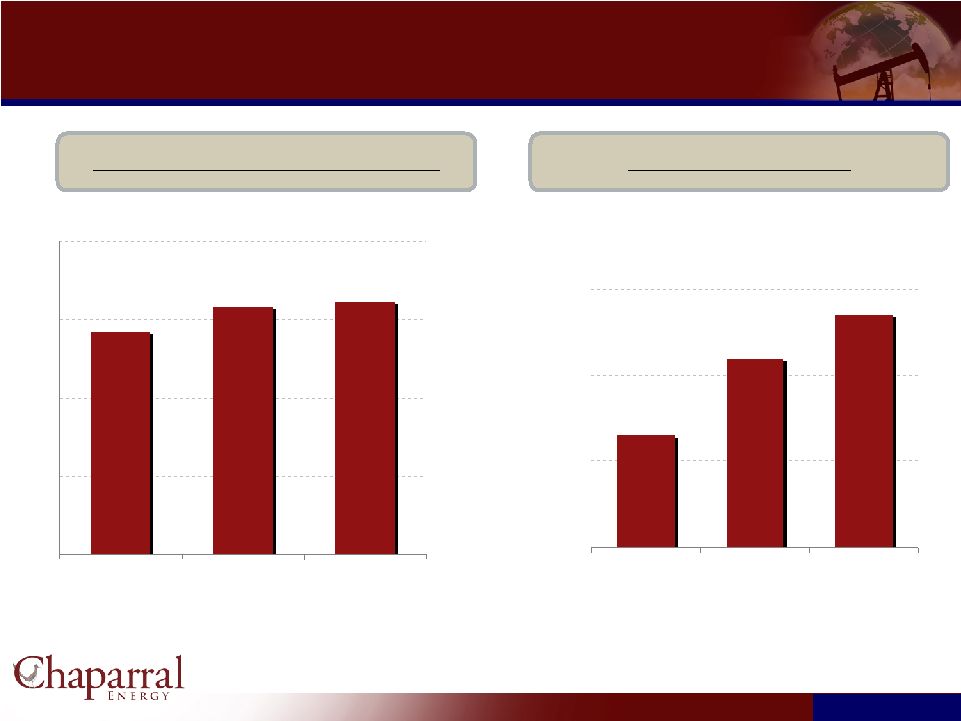 8 8 Reserve Price Sensitivity Reserve Price Sensitivity Note: 1) New SEC pricing method - $61.18 oil and $3.87 gas 2) Old SEC pricing method - $79.36 oil and $5.79 gas 3) Average Wellhead of $94.77 oil and $6.27 gas 142 158 161 0 50 100 150 200 New SEC Pricing Old SEC Pricing Nymex Strip 1/14/2010 (3) (3) December 31, 2009 Reserves (MMBoe) (1)(2) PV-10 Value ($Billions) (1)(2) $1.3 $2.2 $2.7 $- $1.0 $2.0 $3.0 New SEC Pricing Old SEC Pricing Nymex Strip 1/14/2010 |
 9 9 Operating and Financial Strategy Operating and Financial Strategy Increase reserves and production through drilling of large inventory of near-
term, high potential drilling opportunities Expand EOR field operations and CO 2 infrastructure Selectively pursue strategic acquisition opportunities with significant upside
potential Hedge production to stabilize cash flow Achieve growth objectives while maintaining strong liquidity position
|
 10 10 Stable Base and Growth Potential Stable Base and Growth Potential Stable Producing Base Long-lived reserve base • 8.8% projected annual decline in PDP production from 2010 to 2023 (1) 63% oil concentration (SEC pricing) 66% proved developed reserves 86% of proved reserves operated 85% of PDP production hedged over the next two years to stabilize cash flow Highly diversified production across fields (8,174 wells) Note: 1) Percent decline is average annual decline rate of PDP production from third-party reserve reports Low-Risk Long-Term Upside Significant Near-Term Growth 180 MMbo potentially recoverable through EOR properties Reserve growth through CO 2 infrastructure Woodford Shale developments 3,485 identified additional potential drilling locations 16-year inventory of drilling locations at 2010 drilling rate of 295 wells (113 operated wells and 182 outside operated wells) 840 enhancement projects 295 wells planned for 2010 with expected net exit rate production of 7.0 MBoepd Low-risk infill or step-out wells (99% success rate in 2007- 2009) 1,333 identified proved undeveloped drilling locations • Primarily focused on the Mid-Continent region with 1,061 locations Undeveloped acreage: 84,396 net acres |
 11 11 Strong Inventory of Drilling Locations Strong Inventory of Drilling Locations Chaparral has experienced a high historical drilling success rate of 99% on a
weighted average basis during 2007, 2008 and 2009 1,333 Identified Proven Undeveloped Drilling Locations 3,485 Additional Potential Drilling Locations Rocky Mountains 111 Mid- Continent 2,633 Permian Basin 480 Gulf Coast 44 Ark-La-Tex 34 North Texas 183 Rocky Mountains 87 Mid- Continent 1,061 Permian Basin 47 Gulf Coast 7 Ark-La-Tex 3 North Texas 128 |
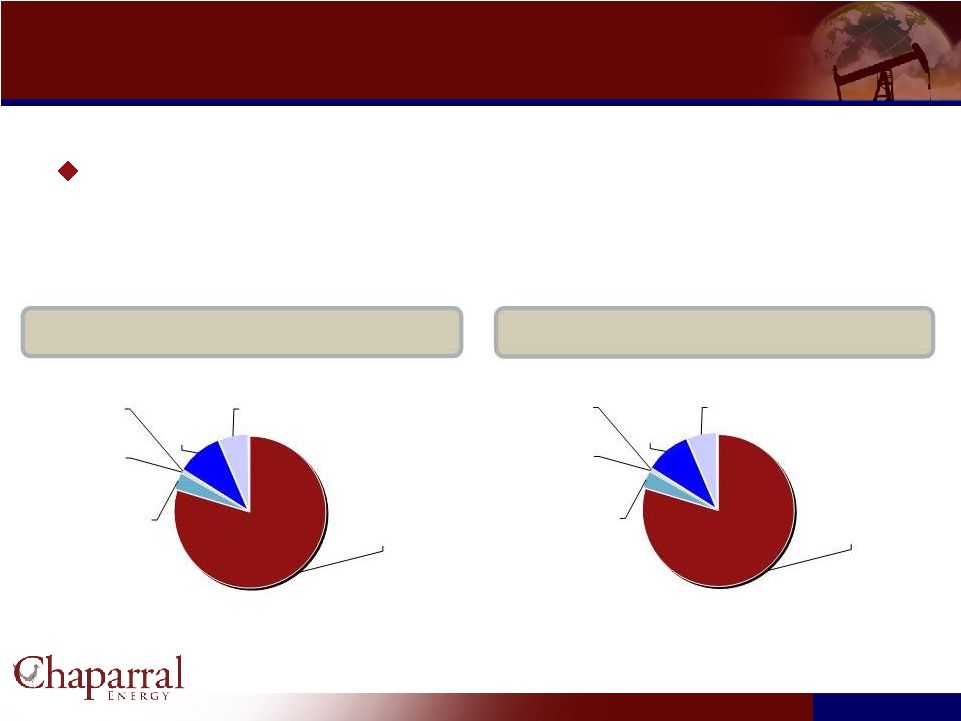
 12 12 Capital Budget Capital Budget Component 2006 2007 2008 2009E 2010 Budget Drilling 134 121 176 83 121 Enhancements 31 44 55 34 11 Acquisitions (1) 489 50 46 19 2 Tertiary Recovery 13 15 25 15 40 Total 667 230 302 151 174 Note: (1) 2006 Includes major acquisition of Calumet Oil Company 2010E Oil and Gas Capital Expenditures 2010E Drilling CAPEX by Major Plays ($MM) Conventional Drilling EOR Drilling Oil & Gas Capital Expenditures ($MM) $3.5 $4.8 $5.3 $5.3 $8.1 $17.9 $19.1 $30.8 0 5 10 15 20 25 30 35 40 45 50 SWAGSU Woodford Shale Camrick Haley Tunstill Osage County Granite Wash Cleveland Sand Drilling EOR Enhancements Acquisitions 1% Mid-Continent Other Gulf Coast Permian Basin |
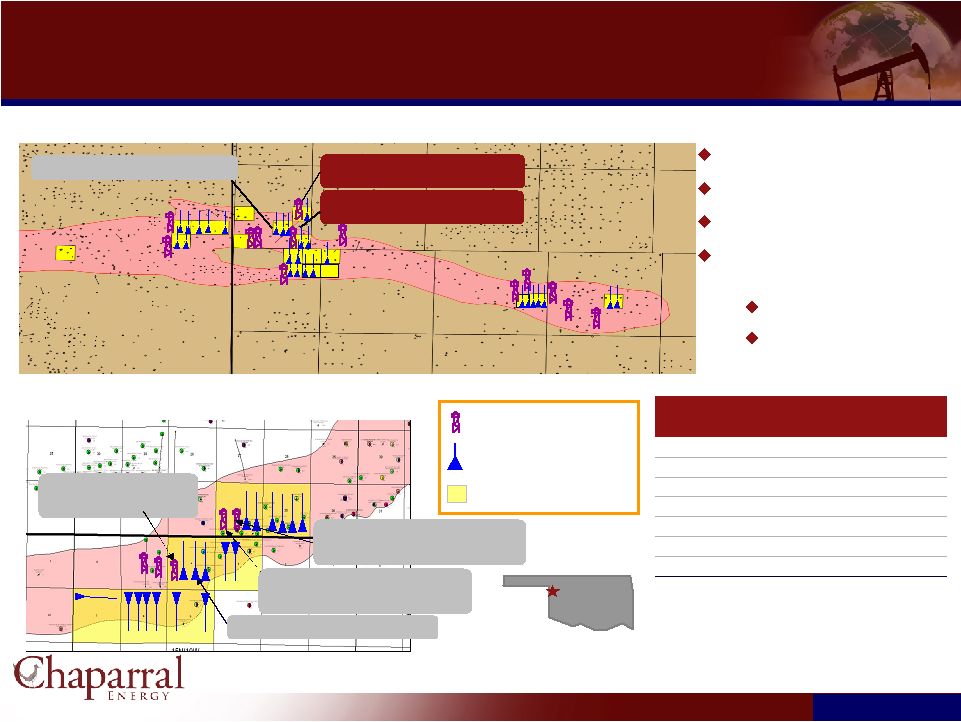 13 13 Cleveland Sand Play Cleveland Sand Play Ellis County Area Horizontal drilling Tight sand play Depth: 7,900 – 9,700 feet Scheduled to drill 19 wells in 2010 10 operated, avg WI 85% 9 non-op, avg WI 10% Aledo-Bray Area Gilson 2H-24, Chap Op with 100% WI 1.8 MMcf/d, 240 BOPD State A 6H-36, Chap Op with 100% WI 2.8 MMcf/d, 250 BOPD Bray #3-4H Chap Op 98% IP 3.2 MMcf/d, 320 BOPD Play Statistics Gross reserves / well (MMboe): 0.3 – 0.5 Gross CapEx / well ($MM): $2.6 - $4.4 Chaparral net acres: 9,000 Avg working interest: 57% Potential drill locations: 91 ROI: (2010 Op Drilling) 4.26 ROR: (2010 Op Drilling) 70% Robertson #3-34H Chap Op 100% WI Waiting on Completion Bray #4-4H Proposed Chap Op 98% WI Milton #3H-26 Recently Completed Recently Drilled Wells Proposed Wells Sections w/Chap Interests Robertson #4-34H Chap Op 100% WI Drilling |
 14 14 Granite Wash Play Granite Wash Play Current Producing Net Acreage: 12,634 Acres Stiles Ranch Area Colony Wash Area |
 Washita County,
OK Granite Wash “A”, “B” & “C” Zones Horizontal drilling, 12,500’ depth Initial production rates: – 3 – 5 MMcf/d & 200 – 500 Bbl/d Scheduled to drill 9 wells in 2010 2 operated 7 non-operated Recently Drilled Wells Proposed Wells Sections w/Chap Interests Granite Wash Play – Colony Wash Area Granite Wash Play – Colony Wash Area Play Statistics Gross reserves / well (MMBoe): 0.7 Gross CapEx / well ($MM): $6.4 Chaparral net acres: 1,620 Avg working interest: 23.7% Potential drill locations: 24 ROI: (2010 Op Drilling) 3.67 ROR: (2010 Op Drilling) 98.6% 15 15 Gunter 2H-14 Chap Op & 70% WI IP: 6.5 MMcf/d, 500 BOPD Kliewer #1-18H CHK Op, Chap: 18% WI IP: 11.6 MMcf/d, 700 BOPD Roxanne –3-17H and 4-17H Questar Op, Chap 25% WI Drilling Roxanne 1-17H Chap Op & 25% WI IP: 7.7 MMcf/d, 736 BOPD Roxanne 2-17H Questar Op, Chap 25% WI IP: 5 MMcf/d, 600 BOPD Kliewer 18H (#,2,3,4) CHK Op, Chap: 18% WI Avg IP 5.5 MMcf/d, 400 BOPD/well 2 producing, 2 drilling Riley #1-20H CHK Op, Chap 14% WI completing Simpson 4-26H St. Mary’s Op, Chap: 16% WI IP: 5 MMcf/d, 200 BOPD Peters 2H-19 Chap Op & 70% WI IP: 4.8 MMcf/d, 240 BOPD West 7-35H, St. Mary’s Op, Chap: 11% WI IP: 5.2 MMcf/d, 480 BOPD |
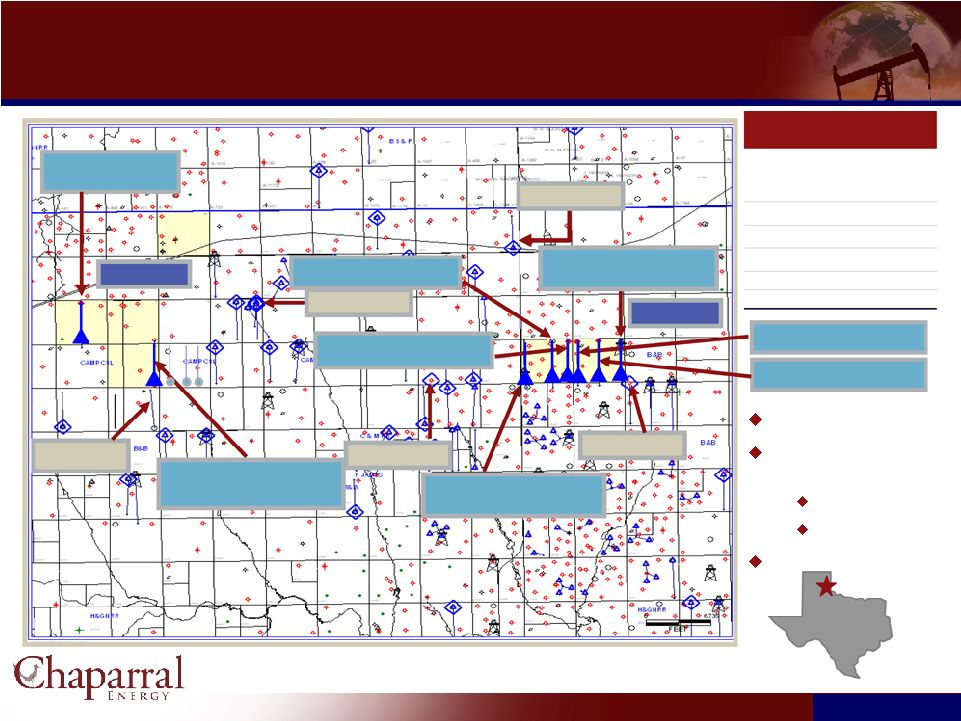 Granite Wash Play – Stiles Ranch Area Granite Wash Play – Stiles Ranch Area Britt #8-6H Drilling WI 12.5% Completing Britt #8-4H Drilling WI 12.5% 2/2/10 IP: 17,624 Mcfe/d Play Statistics Gross reserves / well (MMBoe): 1.0 Gross CapEx / well ($MM): $7.38 Chaparral net acres: 855 Avg working interest: 51.2% Potential drill locations: 21 ROI: (2010 Op Drilling) 6.4 ROR: (2010 Op Drilling) 100% Horizontal Drilling Scheduled to drill 2 wells in 2010 1 op – WI 50% 1 nonop – WI 25% Depth 14,500’ 16 16 Brown “6” #2H WI 25% Proposed Brown Area 18MMcfe/d 1,000 Bopd Britt #7-12H Drilling WI 41% On line 2/13/10 10MMcfe/d Britt #7-11H Drilling WI 40% Frac date 2/12/10 Britt 8-5H WI 12.5% 2/4/10 IP: 21,000 Mcfe/d Britt Area 21MMcfe/d 27.1MMcfe/d Brown “8” #2H WI 50%BPO, 50% WI - Proposed Britt 7-9H WI 40% Flowing back 2/4/10 17MMcfe/d |
 North Burbank Unit South Burbank Unit FEET 0 12,441 PETRA 1/18/2010 4:24:50 PM 17 17 Osage And Creek Counties, OK Osage And Creek Counties, OK Osage County, OK West Fairfax Chat Formations: Burbank, Miss. Chat Producing depth: 3,000ft. 1 company rig currently running Scheduled to drill 45 Chaparral operated wells in 2010 Play Statistics Gross reserves / well (MMBoe): 0.1 Gross CapEx / well ($MM): $0.4 Chaparral net acres: 66,380 Avg working interest: 89.4% Potential drill locations: 347 ROI: (2010 Op Drilling) 5.6 ROR: (2010 Op Drilling) 96.2% Held by production Leasehold FEET 0 2,643 PETRA 1/18/2010 4:37:45 PM SBU Area Burbank & Chat FEET 0 1,471 |
 18 18 Tunstill Field Play Tunstill Field Play BELL CANYON SAND Loving Co. Reeves Co. Formation Gross reserves / well (MMBoe): 0.1 Gross CapEx / well ($MM): $0.9 Chaparral net acres: 20,640 Total seismic sq.mi.: 10 Avg working interest: 100% Potential drill locations: 222 Recently Drilled Locations Farm-In Acreage: 10,920 acres Existing Acreage: 9.400 acres Location: Loving County, Texas Substantial Bone Springs potential Delaware Basin Multi-pay environment Depth: 3300-5200 feet Scheduled to drill 10 Chaparral operated wells in 2010 CHERRY CANYON SAND |
 19 19 Haley Play Area Haley Play Area Atoka and Morrow Play (17,700’ depth) Expensive wells High production rates Large reserve potential Play Statistics Atoka Morrow Gross reserves / well (MMBoe): 1.9 Gross CapEx / well ($MM): $10.2 Chaparral net acres: 2,605 Avg working interest: 74% 2010 Scheduled drill locations: (Chaparral operated) 1 ROI: (2010 Op Drilling) 3.91 ROR: (2010 Op Drilling) 100% Play Statistics Bone Springs Gross reserves / well (MMBoe): 0.3 Gross CapEx / well ($MM): $2.1 Chaparral net acres: 2,605 Avg working interest: 74% 2010 Scheduled drill locations: (Chaparral Operated) 1 ROI: (2010 Op Drilling) 4.2 ROR: (2010 Op Drilling) 38.7% Haley 36-4, Chap Op, 91% WI, IP Aug ’06 IP: 8.1 MMcfe/d Haley 36-5, Chap op, 78% WI, Next proposed location Bowdle 47-4, Chap Op & 98% WI Currently drilling Bowdle 47-2, Chap Op & 98% WI TD: 3Q08, IP 18.8 MMcfe/d Deep Drilling Locations Drilling or Recent Completions Chaparral Acreage |
 20 20 Anadarko Basin - Woodford Shale Anadarko Basin - Woodford Shale Chaparral Operated Wells Chaparral Non-Operated Wells Industry Recently Permitted or Currently Drilling Locations Industry Completed Woodford Horizontal Wells Ellis Blaine Dewey Kingfisher Grady Caddo Washita Beckham Roger Mills Custer Canadian Chaparral’s Acreage 21,600 (+/-) net acres held by production (HBP), 1,080 non-producing acres Potential drilling locations 787 (162 net) Play Economics (1) 4.0 – 6.0 Bcfe gross per well with 4,000 foot lateral Completed well costs: $7 – $9 million Recent Industry Woodford Gross IPs Golden 1 – 3H: 8.3 MMcfe/d Guinn 1 – 10H: 7.1 MMcfe/d Dixie 1 – 4H: 5.9 MMcfe/d Young 2-22H: 6.8 MMcfe/d Drilling Activity Expect to drill 1 operated well in 2010: ROR 100%, ROI 7.68 Expect to drill 6 non-operated wells in 2010 Note: 1) Play economics sourced from Cimarex May 2009 presentation |
 21 21 Enhanced Oil Recovery Opportunities Enhanced Oil Recovery Opportunities The Oil is There - U.S. Oil - Chaparral utilizes CO 2 and polymer EOR techniques CO 2 EOR involves injection of CO 2 and water to enhance hydrocarbon mobility to drive hydrocarbons to wells Polymer EOR improves areal sweep efficiency and minimizes channeling
|
 22 22 North Burbank Unit – Polymer & CO 2 Tertiary Recovery North Burbank Unit – Polymer & CO 2 Tertiary Recovery North Burbank Improved Recovery 60 70 80 90 100 110 120 130 140 150 160 — — — — Phillips’ Polymer Project Chaparral Polymer Pilot WI - 99.25% (operated property) Size - 23,080 acres; Depth - 3,000’ OOIP – 824 MMBO Cum. Recovery - 317 MMBO (primary & secondary) Producing zone - Bartlesville Reservoir – 2 Tier Wells - 269 producing, 193 injection, 493 TA Upside Potential - Polymer EOR Phillips instituted polymer EOR Program on 1,440 acres from 1980 - 1986 as pilot area Production increased from 500 BOPD to 1,200 BOPD Phillips incremental oil recovery 2.4MMBO Reinstituted polymer flood on 485 acres; $6MM cost, 19 well pattern Return 349 wells to production; 8-33 BOPD per well CO2 EOR Potential |
 23 23 Camrick Area CO 2 Tertiary Recovery Camrick Area CO 2 Tertiary Recovery Consists of three unitized fields Operated with an average working interest of 54% CO 2 injection has improved gross production in Camrick Area from 175 Bbls/day to 1,800 Bbls/day Expansion of CO 2 injection operations from 15 MMcfpd to 25 MMcfpd has been completed NW Camrick, Camrick and Perryton Units: 8/8 Basis Reservoir Morrow Net Acreage 15,200 OOIP (MMbo) 125.6 Primary oil recovery (MMbo) 16.6 Secondary oil recovery (MMbo) 13.1 Estimated tertiary CO2 recovery (MMbo) 14.4 Beaver & Texas Counties, OK Lipscomb County, TX Camrick Area, OK Projected and Actual Response |
 24 24 Substantial Upside With CO 2 Tertiary Recovery Substantial Upside With CO 2 Tertiary Recovery CO 2 project inventory 7 units with proved reserves 65 units with 2P & 3P EOR reserves 10 units with CO 2 injection CO 2 Infrastructure 374 miles of existing line 49 MMcfe/d of CO 2 supply Includes connecting 14 - 17 MMcf/d of CO 2 from Arkalon 16 mile expansion in 2008 $20 million spent in 2008 $84.7 million investment $272.8 million net cash flow $104.3 million PV-10 4.22x ROI 51.1% IRR CO 2 Tertiary Recovery Projects Economics (5 Proved Reserves Projects)(1) (1) Economics based on 12/31/09 reserves at 12/31/09 NYMEX pricing .
|
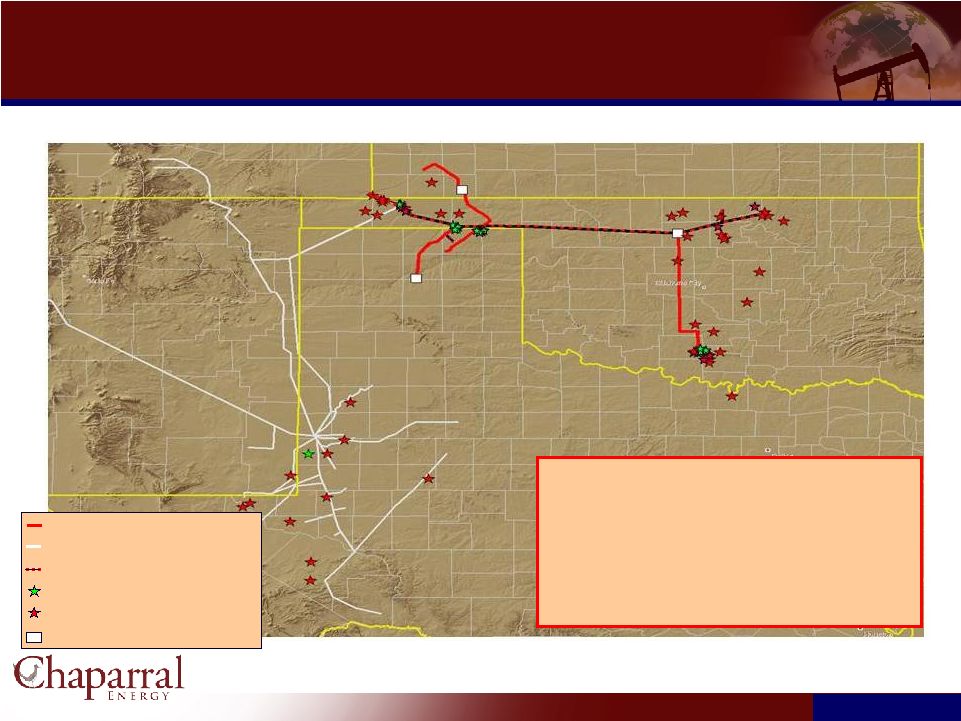 25 25 Currently Owned CO 2 Development Potential Currently Owned CO 2 Development Potential Total OOIP 3250 MMBO Primary Production 506 MMBO Secondary Recovery 530 MMBO Tertiary Potential 312 MMBO Net Tertiary Potential 180 MMBO Existing CELLC CO 2 Pipelines Existing Third Party CO 2 Pipelines Proposed CELLC CO 2 Pipelines Owned Active CO 2 fields Owned Potential CO 2 fields CO 2 Source Locations |
 26 26 CO 2 Infrastructure & Resource Potential CO 2 Infrastructure & Resource Potential Chaparral CO2 Pipelines Proposed Chaparral Pipelines Third Party Pipelines Cum. Recovered 1-3 MMBO Cum. Recovered 3-5 MMBO Cum. Recovered 5-10 MMBO Cum. Recovered 10+ MMBO |
 27 27 EOR Potential EOR Potential CO 2 - EOR is the fastest growing form of Enhanced Oil Recovery in the US 240,000 BOPD in 2008, mostly in Permian Basin and New Mexico 4.7% of US crude oil production Traditional oil recovery methods leave behind 390 billion barrels already
discovered U.S. Department of Energy – Office of Fossil Energy – Office of Oil and Natural Gas CO 2 – EOR Technically Recoverable Resource Potential Basin / Area No. Large Reservoirs Assessed All Reservoirs (Ten Basins / Areas Assessed) OOIP (Billion Barrels) ROIP (Billion Barrels) Technically Recoverable (Billion Barrels) Alaska 34 67.3 45.0 12.4 California 172 83.3 57.3 5.2 Gulf Coast 239 44.4 27.5 6.9 Mid-Continent 222 89.6 65.6 11.8 Illinois & Michigan 154 17.8 11.5 1.5 Permian 207 95.4 61.7 20.8 Rocky Mountains 162 33.6 22.6 4.2 Texas: East & Central 199 109.0 73.6 17.3 Williston 93 13.2 9.5 2.7 Louisiana Offshore 99 28.1 15.7 5.9 Total 1,581 581.7 390.0 88.7 Source: Advanced Resources International, February 2006 Notes: (1)Original oil in place, in all reservoirs in basins / areas (2)Remaining oil in place, in all reservoirs in basins / areas (1) (2) |
 28 28 Financial Overview Financial Overview |
 29 29 Summary Financial Data Summary Financial Data 2007 2008 2009E Price Oil – Wellhead ($/Bbl) 69.85 96.23 57.37 Gas – Wellhead ($/Mcf) (1) 6.41 7.72 3.51 NGL – Wellhead ($/Bbl) --- 57.61 35.38 Production (MMBoe) 6.7 7.1 7.6 Oil (MMBbls) 3.3 3.4 3.4 Gas (Bcf) (1) 20.5 19.8 22.6 NGL (MMBbls) --- .4 .4 Revenue Including Cash Settled Derivatives ($MM) 345.4 450.2 348.0 Lease Operating Expenses 104.5 120.5 94.2 Production and Ad Valorem Taxes 26.2 33.8 20.3 General and Administrative Expenses 21.8 22.4 23.7 Operating Expenses 152.5 176.7 138.2 Interest (Expense) (87.7) (86.0) (90.1) Other Income / (Expense) 3.8 6.7 14.4 EBITDA 196.7 280.2 223.7 Discretionary Cash Flow 109.0 194.2 133.6 Total Capex (2) 230.2 302.7 150.6 Notes: 1 Prior to 2008, NGL volumes and sales were included in gas volumes and
sales 2. Includes oil & gas capex, non-drilling capex, and capitalized
general and administrative expenses |
 30 30 Strong Historical Growth and Improving Cost Structure Strong Historical Growth and Improving Cost Structure Production (BOE) / Day LOE / BOE Production & Ad Valorem Taxes / BOE G&A / BOE $3.47 $3.87 $4.78 $2.66 $3.88 $0.00 $2.00 $4.00 $6.00 2006 2007 2008 2009E 2010E $2.72 $3.22 $3.16 $3.40 $3.11 $0.00 $1.00 $2.00 $3.00 $4.00 2006 2007 2008 2009E 2010E Chart Title 14,788 18,558 19,323 20,926 22,200 0 10,000 20,000 30,000 2006 2007 2008 2009E 2010E $0.00 $5.00 $10.00 $15.00 $20.00 2006 2007 2008 2009E 2010E $13.28 $15.42 $17.05 $12.33 $12.50 |
 31 31 Debt and Liquidity Debt and Liquidity Net Secured Debt / EBITDA Liquidity Current Maturity Profile ($mm) 5.34x 2.28x 2.01x 2.04x 0 1 2 3 4 5 6 2006 2007 2008 2009E 120.9m 88.0m 55.4m 73.0m 0 50 100 150 2006 2007 2008 2009E 0 100 200 300 400 500 600 2010 2011 2012 2013 2014 2015 2016 2017 507 324 324 |
 32 32 Hedge Portfolio Hedge Portfolio Provides financial security for next two volatile price years Leaves upside pricing potential for outer years Note: 1) Dollars represent average strike price of hedges (includes all derivative
instruments) (2) Gas Basis Hedges Price % Gas PDP Jan-Dec 2010 $0.79 74% Jan-Dec 2011 $0.74 73% 2010 2011 2012 $7.07 $7.24 $7.34 $68.46 $68.40 $68.40 $10.00 $110.00 $110.00 $11.53 $168.55 $152.71 Oil Collars Oil Swaps Gas Swaps Gas Collars 2Q 2009 - monetized 2012 & 2013 contracts, net cash proceeds $102 million 4Q 2008 and 1Q 2009 – monetized portion of 2009 contract, net cash proceeds $42 million Recently completed 2010 gas production hedging at $5.60 and 2011 gas at $6.48 mmbtu Recently completed 2010 oil production hedging at $80.50 bbl $90.46 % of Proved Developed Producing Hedged (As of February 24, 2010) 0% 10% 20% 30% 40% 50% 60% 70% 80% 90% 100% |
 33 33 2010 Guidance 2010 Guidance Oil and Gas CAPEX $174 million Production 8.0 - 8.2 MMBoe General and Administrative $3.30 – $3.50/Boe Lease Operating Expense $12.00 - $13.00/Boe |