Attached files
Table of Contents
UNITED STATES
SECURITIES AND EXCHANGE COMMISSION
Washington, D.C. 20549
Form 10-K
| þ | ANNUAL REPORT PURSUANT TO SECTION 13 OR 15(d) OF THE SECURITIES EXCHANGE ACT OF 1934 |
For the year ended December 31, 2009
| ¨ | TRANSITION REPORT PURSUANT TO SECTION 13 OR 15(d) OF THE SECURITIES EXCHANGE ACT OF 1934 |
Commission file number 001-33755
SuccessFactors, Inc.
(Exact Name of Registrant as Specified in Its Charter)
| Delaware | 7372 | 94-3398453 | ||
| (State or Other Jurisdiction of Incorporation or Organization) |
(Primary Standard Industrial Classification Code Number) |
(I.R.S. Employer Identification Number) |
1500 Fashion Island Blvd., Suite 300
San Mateo, CA 94404
(Address of Principal Executive Offices)
(650) 645-2000
(Registrant’s telephone number)
Securities registered pursuant to Section 12(b) of the Exchange Act:
| Title of Each Class |
Name of Each Exchange on Which Registered | |
| Common Stock, $0.001 par value | The NASDAQ Stock Market LLC |
Securities registered pursuant to Section 12(g) of the Exchange Act:
None
Indicate by check mark if the registrant is a well-known seasoned issuer, as defined in Rule 405 of the Securities Act. Yes ¨ No þ
Indicate by check mark if the registrant is not required to file reports pursuant to Section 13 or Section 15(d) of the Exchange Act. Yes ¨ No þ
Indicate by check mark whether the registrant (1) has filed all reports required to be filed by Section 13 or 15(d) of the Exchange Act during the preceding 12 months (or for such shorter period that the registrant was required to file such reports), and (2) has been subject to such filing requirements for the past 90 days. Yes þ No ¨
Indicate by check mark whether the registrant has submitted electronically and posted on its corporate Web site, if any, every Interactive Data File required to be submitted and posted pursuant to Rule 405 of Regulation S-T (232.405 of this chapter) during the preceding 12 months (or for such shorter period that the registrant was required to submit and post such files). Yes ¨ No ¨
Indicate by check mark if disclosure of delinquent filers pursuant to Item 405 of Regulation S-K is not contained herein, and will not be contained, to the best of registrant’s knowledge, in definitive proxy or information statements incorporated by reference in Part III of this Form 10-K or any amendment to this Form 10 K. ¨
Indicate by check mark whether the registrant is a large accelerated filer, an accelerated filer, a non-accelerated filer, or a smaller reporting company. See the definitions of “large accelerated filer,” “accelerated filer” and “smaller reporting company” in Rule 12b-2 of the Exchange Act. (Check one):
| Large accelerated filer | ¨ | Accelerated filer | þ | |||
| Non-accelerated filer | ¨ (Do not check if a smaller reporting company) | Smaller reporting company | ¨ | |||
Indicate by check mark whether the registrant is a shell company (as defined in Rule 12b-2 of the Exchange Act). Yes ¨ No þ
The aggregate market value of the registrant’s common stock held by non-affiliates of the registrant at June 30, 2009, based on the closing price of such stock on the NASDAQ Global Market on such date, was approximately $426 million.
The number of shares of the registrant’s common stock outstanding on February 19, 2010, was 71,990,566.
Portions of the registrant’s Proxy Statement relating to the registrant’s 2010 Annual Meeting of Stockholders to be held on or about May 21, 2010 are incorporated by reference into Part III of this Report.
Table of Contents

2009 ANNUAL REPORT ON FORM 10-K
| PART I | ||||
| Item 1. |
3 | |||
| Item 1A. |
17 | |||
| Item 1B. |
29 | |||
| Item 2. |
29 | |||
| Item 3. |
30 | |||
| Item 4. |
30 | |||
| PART II | ||||
| Item 5. |
31 | |||
| Item 6. |
35 | |||
| Item 7. |
Management’s Discussion and Analysis of Financial Condition and Results of Operations |
37 | ||
| Item 7A. |
50 | |||
| Item 8. |
50 | |||
| Item 9. |
Changes in and Disagreements with Accountants on Accounting and Financial Disclosure |
50 | ||
| Item 9A. |
51 | |||
| Item 9B. |
51 | |||
| PART III | ||||
| Item 10. |
52 | |||
| Item 11. |
52 | |||
| Item 12. |
Security Ownership of Certain Beneficial Owners and Management and Related Stockholder Matters |
52 | ||
| Item 13. |
Certain Relationships and Related Transactions, and Director Independence |
52 | ||
| Item 14. |
52 | |||
| PART IV | ||||
| Item 15. |
53 | |||
| 80 | ||||
“SuccessFactors,” the SuccessFactors logo, “People Performance,” “SuccessCloud,” “SuccessFactory,” “IdeaFactory,” “SuccessConnect,” and “SuccessFactors University” are trademarks of SuccessFactors. Other service marks, trademarks and tradenames referred to in this report are the property of their respective owners.
2
Table of Contents
PART I
FORWARD-LOOKING STATEMENTS
This Annual Report on Form 10-K includes forward-looking statements. All statements contained in this Annual Report on Form 10-K other than statements of historical fact, including statements regarding our future results of operations and financial position, our business strategy and plans and our objectives for future operations, are forward-looking statements. The words “believe,” “may,” “will,” “estimate,” “continue,” “anticipate,” “intend,” “expect” and similar expressions are intended to identify forward-looking statements. We have based these forward-looking statements largely on our current expectations and projections about future events and financial trends that we believe may affect our financial condition, results of operations, business strategy, short-term and long-term business operations and objectives, and financial needs. These forward-looking statements are subject to a number of risks, uncertainties and assumptions, including those described in “Risk Factors.” In light of these risks, uncertainties and assumptions, the future events and trends discussed in this Annual Report on Form 10-K may not occur, and actual results could differ materially and adversely from those anticipated or implied in the forward-looking statements.
We cannot guarantee future results, levels of activity, performance or achievements. We are under no duty and do not intend to update any of these forward-looking statements after the date of this Annual Report on Form 10-K to conform these statements to actual results or revised expectations.
Except where the context requires otherwise, in this report “company,” “SuccessFactors,” “we,” “us” and “our” refer to SuccessFactors, Inc., a Delaware corporation, and where appropriate, its subsidiaries.
| Item 1. | Business |
Our Mission
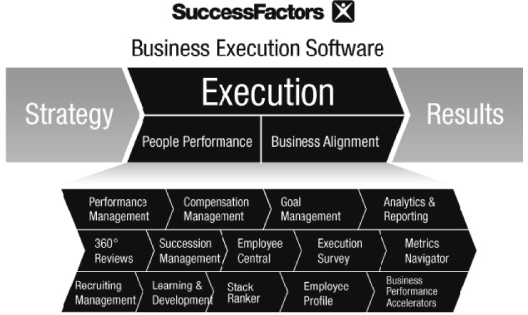
Execution is the difference. It is the critical success factor. But for most companies there is a significant execution deficit. While every company has a strategy, most companies do not execute on their strategy as well as they can or should, for one simple reason: It is just not that easy to get everyone in an organization to take the right actions, at the right time, to produce the right results, every day. That’s where SuccessFactors comes in. We help companies execute effectively on their strategy in two important ways: by making sure everyone in the organization is completely aligned and working on the right things (Business Alignment), and by ensuring every employee is working to his or her full potential (People Performance). We are on a remarkable mission—to help companies close the gap between strategy and execution and help them drive breakthrough business results each and every day.
Our Solution
SuccessFactors is the leading provider of cloud-based Business Execution Software (BizX) solutions to organizations of all sizes, with more than 6 million users across multiple industries and geographies. We strive to delight our customers by delivering innovative solutions, a broad range of content, process expertise and best practices knowledge gained from serving our large and varied customer base. Today we have more than 3,100 customers across more than 60 industries in more than 185 countries using our application suite in 32 languages. Our customer base includes organizations with as few as three and as many as 420,000 end users.
3
Table of Contents
Compared to traditional approaches, our solution offers customers rapid benefits and return on investment, enabling them to:
Key benefits of our solution include:
| • | Tangible Business Impact. Our solutions enable our customers to bridge the execution gap between strategy and achieving results by systematically aligning human resources to organizational strategy and optimizing workforce performance. By optimizing workforce performance and ensuring the collective efforts of their people are aligned to business strategy, we help customers achieve superior business results by: |
| • | communicating strategy changes more quickly; |
| • | increasing time spent on strategic priorities; |
| • | increasing the rate of project completion; |
| • | increasing the number of high performers and decreasing the number of low performers; and |
| • | increasing overall productivity. |
| • | Core Performance Management and Goal Management to Drive Business Results. We designed our solution around our core Goal Management and Performance Management modules because we believe they serve as the foundation for the two key components of effective business execution: Business Alignment and People Performance. |
| • | Organically Built, Not Just Functionally Integrated, Modular Suite. We built our modules organically using the same code base so that customers can provide their employees with a common user experience, leverage common data and processes, and easily add modules over time. |
| • | Continuous Customer-Driven Development. We capture and incorporate best practices knowledge we gain from interactions with our customer base. Our customer-centric development focus, together with our cloud-based model, have enabled us to release significant enhancements several times a year over the past seven years. |
| • | Ease-of-Use Drives Adoption. Our user interface is designed to be highly intuitive, requiring limited training for end users. |
4
Table of Contents
| • | Relentless User-Centric Innovation. We focus on end users across all business functions and strive to deliver business applications that are as engaging as popular consumer web applications by incorporating features and content such as real-time coaching, goal and performance review writing assistants, personal dashboards and best-practice wizards. |
| • | Highly Configurable Cloud-based Application Suite. Our cloud-based application suite requires no installation of software or equipment on premises, which significantly reduces the costs and risks of traditional enterprise software. Our scalable solution is highly configurable, allowing customers to tailor their deployment to reflect their identity, unique business processes, and existing forms and templates. We believe our architecture allows us to offer a more flexible, scalable, and secure service offering at a lower cost than other cloud-based vendors. |
| • | Broad Applicability Within Organizations of All Sizes and Industries. Our solution is designed to be used by all employees at all levels within an organization, and we offer multiple editions to meet the needs of organizations of all sizes. |
| • | Integration with Third-Party Applications through the Cloud. Our SuccessCloud initiative allows third-party applications and data from other business systems to connect and integrate with the SuccessFactors Business Execution Software Suite. This enables customers to get the most from their existing technology investments and tap a broad ecosystem of SuccessFactors partners to enable effective business execution. |
Our Application Suite
We offer a suite of Business Execution Software applications, delivered over the Internet, that enable organizations to optimize business alignment and the performance of their people to drive business results. Our modules utilize a single code base and reside on a multi-tenant architecture. To address the varied needs of different-sized organizations, we market different editions of our application suite:
| • | Enterprise. For organizations with 2,500 or more employees, we offer Enterprise Edition. Enterprise Edition is our most fully-featured offering, providing functionality and configurability that can scale to support the complex needs of large, global enterprises with tens to hundreds of thousands of employees. |
| • | Mid-Sized Business. For organizations with 501 to 2,499 employees, we offer SuccessPractices. Mid-sized organizations typically need a robust solution but may not require the advanced functionality of our Enterprise Edition. Each of the SuccessPractices modules is pre-configured with best-practice workflows, form templates and other content tailored for the needs of mid-sized organizations and designed to allow for rapid implementations. |
| • | Small Business. For organizations with 50 to 500 employees, we offer Professional Edition. Small businesses typically need an automated solution but may not require the more advanced functionality of our other editions. Professional Edition includes modules pre-configured with the best practices of smaller organizations. |
| • | Emerging Business. For organizations with fewer than 50 employees, we offer our Express Edition, an out-of-the-box performance review solution. Express Edition is a web-based, user-friendly system that can be rolled out instantly, without implementation support. |
We offer the following modules as part of our application suite:
Performance Management. Our Performance Management module streamlines the performance appraisal process and transforms the often rushed and tedious performance review process into an ongoing method of tying employee performance to business results. The module is highly configurable, allowing customers to design performance review templates and workflows that best meet their needs. Performance Management also delivers
5
Table of Contents
rich content that enables managers to provide meaningful and productive feedback to their subordinates. Performance Management is tightly integrated with our other modules, allowing organizations to:
| • | assess performance accurately, allowing for goal adjustments in real time; |
| • | set relevant development goals based on accurate competency assessments; |
| • | compensate employees based on objective performance evaluations; |
| • | assess key performance data as part of the succession planning process; and |
| • | understand characteristics of strong performance to optimize recruiting. |
Goal Management. Our Goal Management module supports the process of creating, monitoring and assessing employee goals across the organization. Goal Management allows executives and managers to align employee goals to the priorities of the organization. Customers can improve overall employee performance and agility by using Goal Management to focus employees on shared goals as these goals evolve. Goal Management can continually track progress against high-level strategic goals across the organization. Goal Management is tightly integrated with our other modules, allowing organizations to:
| • | design competency development programs based on skills needed to achieve key goals; |
| • | evaluate individual performance against agreed upon goals; |
| • | make merit increase and bonus distribution decisions based on accomplishment of goals; |
| • | make informed succession planning decisions based on historical goal attainment data; and |
| • | expedite on-boarding of newly-hired employees with clearly articulated goals. |
Compensation Management. Our Compensation Management module helps our customers establish a pay-for-performance culture. Compensation Management facilitates the processes of merit pay adjustments, bonus allocations and distribution of stock-based awards. It also includes a variable pay management component that takes overall organizational and department performance into account in making individual compensation decisions. Compensation Management supports multiple currency conversion capabilities, which is particularly critical for customers with a global presence. Compensation Management is tightly integrated with our other modules, allowing organizations to:
| • | influence employee engagement and thereby goal attainment by supporting a pay-for-performance culture; |
| • | directly link compensation distribution decisions to tracked performance; |
| • | access compensation history to inform succession management decisions; |
| • | allocate compensation based on skill development and anticipated performance; and |
| • | design hiring requisitions based on compensation guidelines. |
Succession Management. Our Succession Management module provides real-time visibility into an organization’s talent pool from senior executives to individual contributors. This allows customers to plan for staffing changes by identifying key contributors throughout the organization and providing current profiles and readiness rankings for each candidate. This process enables customers to proactively develop and assure the readiness of employee talent at all levels. Succession Management is tightly integrated with our other modules, allowing organizations to:
| • | improve talent readiness in anticipation of evolving business goals and strategies; |
| • | incorporate employee development activities into the succession planning process; |
| • | view history of employee performance and assessments of potential as part of succession planning decisions; |
6
Table of Contents
| • | adjust compensation based on succession planning decisions; and |
| • | identify gaps in internal talent to optimize external recruiting. |
Learning and Development. Our Learning and Development module aligns learning activities with an employee’s competency gaps required to achieve key goals. This allows customers to avoid costly, non-strategic training programs while facilitating the attainment of skills required for current and future job requirements. Learning and Development is tightly integrated with our other modules, allowing organizations to:
| • | consider development accomplishments as part of compensation decisions; |
| • | link employee career development goals with succession planning activities; |
| • | take organizational competency data into account when planning for external hiring; |
| • | include competency assessments and development plans in performance reviews; and |
| • | ensure that employees have the skills required to execute on strategic objectives. |
Recruiting Management. Our Recruiting Management module streamlines the process of identifying, screening, selecting, hiring and on-boarding job applicants. Hiring managers can identify talent gaps and initiate the process of creating hiring requisitions based on organizational needs. These detailed hiring requisitions can automatically be passed through a customer’s internal approval process and routed to the appropriate internal or external recruiters. Recruiting Management is tightly integrated with our other modules, allowing organizations to:
| • | improve hiring effectiveness for better execution of organizational goals; |
| • | identify performance expectations for newly-hired employees; |
| • | predefine compensation benchmarks for employees in newly-hired positions; |
| • | expose hiring needs as part of periodic succession planning sessions; and |
| • | predefine development programs for newly-hired employees. |
Employee Central. Our Employee Central module provides the single point to manage HR-related employee information, enable employees to collaborate and share information across the organization, and empower business leaders to leverage key talent insights to make better business decisions. Some key capabilities include robust core HR data management and process automation, HR reporting and compliance, rich aggregate employee profile information, collaboration tools like tagging, badges and directory search, and talent search, which puts key talent information at the fingertips of managers and executives.
Our application suite also includes:
Analytics and Reporting. Our Analytics and Reporting capability provides visibility into key performance and talent data across the organization. Executives can access global views of the entire organization’s performance data, including goal status, performance review ratings and compensation in real time. This capability offers insights to critical performance management trends through clear and easy-to-understand dashboards that summarize results while also linking to underlying data. All data can be seamlessly exported to spreadsheets for additional offline analysis.
Employee Profile. Our Employee Profile capability aggregates employee profile information, such as work experience and educational background, and stores it in a centralized, master data repository that can be accessed at any time by authorized personnel. When more of our modules are used, the richness of data on each employee builds in the Employee Profile, making it increasingly robust and valuable. Each employee’s information can easily be accessed via an intuitive employee directory search capability. Employee Profile allows users to create relevant tags making it easier for anyone to identify them based on work-related activities or functions.
7
Table of Contents
360-Degree Review. Our 360-Degree Review capability supports the collection of feedback from an employee’s peers, subordinates and superiors. Once collected, the feedback can be aggregated, providing a comprehensive view of an employee’s strengths, weaknesses and areas of improvement. This capability allows for an insightful and comprehensive assessment of employees, resulting in a better understanding of competency gaps and development needs.
Employee Survey. Our Employee Survey capability provides management with actionable insights to help them separate the perception from the reality of what matters most to employees. It provides managers with a fast and efficient way to fine-tune initiatives, solidify workgroup alignment, take the pulse of their teams or quickly gain perspective on employee engagement, satisfaction, and other relevant employee data. Our Business Transformation Services team often works with customers to help them interpret survey results and recommend actions to ensure overall organizational success.
Stack Ranker. Our Stack Ranker capability lets managers quickly assess and create a visual and intuitive stack ranking of their teams across detailed criteria—in real time—to identify top and lower performers. Whether performing talent reviews or ad hoc assessments, Stack Ranker gives managers a powerful tool to optimize their teams by, for example, enabling them to target limited rewards to top employees that deserve extra recognition, or quickly identify low performers to let go when faced with difficult layoff decisions.
Business Performance Accelerators. Our Business Performance Accelerators offering helps organizations get the most out of their people to drive business performance by ensuring effective interactions with employees at key inflection points throughout the employee lifecycle. Customers can take advantage of one or more of the components that make up our Business Performance Accelerator offering that, in aggregate, facilitate effective on-boarding and off-boarding, ensure compliance with company and industry regulations, and enable managers to take swift corrective action and optimize their teams.
Proprietary and Third-Party Content. Our application suite incorporates proprietary and third-party content that is tailored to a wide range of business roles and industries. This content provides customers with valuable insights and information to increase the effectiveness of their performance and talent management. For example, we have proprietary libraries for competencies, goals, job descriptions, skills, surveys and wage data, and other content such as:
| • | Writing Assistant for performance and 360-degree reviews, which helps eliminate “writer’s block” and facilitates creating concise, meaningful feedback for employees; |
| • | Coaching Advisor, which enables managers to proactively provide relevant coaching and support for their subordinates based on identified competency gaps; |
| • | SuccessFactors Coach, which integrates coaching and mentoring into an employee’s daily routine; and |
| • | Interview Question Library, which helps hiring managers interview effectively and facilitates a standard approach to talent assessment and selection. |
Professional Services
Our professional services team’s mission is to deliver on the Business Execution solutions value proposition by helping our customers rapidly achieve the best results from our solution. With our cloud-based model, we have eliminated the need for lengthy and complex technology-focused tasks such as customizing code, deploying equipment, and managing unique network and application environments for each customer. Instead, we focus on business and HR best practices and business process review. Our implementation consultants are experienced performance management and HR professionals, rather than computer programmers, and many of them hold PhDs, MBAs and other advanced degrees.
Implementation Services. Our implementation services consultants, who are aligned by market segment, use our proprietary implementation methodology to implement our solution quickly and effectively. For small and mid-sized customers, our solution can be configured in a matter of days or weeks. Our implementation approach
8
Table of Contents
is based upon best practice templates that give customers flexibility within a proven configuration framework. For our larger customers, implementations typically take a few months. Our experienced project managers partner with customers to successfully manage projects using our proven project methodology. Most of our projects are priced on a fixed-fee basis, which reduces the risk of implementation cost overruns often associated with on-premise software. We also provide follow-on services, including end-user training and business transformation services.
SuccessFactors University. SuccessFactors University provides training to enhance the end-user experience and drive business results for our customers. We offer a variety of packaged training content, such as course curricula, training guides and reference materials. We offer courses online or in person at customer locations. Our training professionals will also work with customers to develop tailored curricula and materials to suit their specific needs.
Business Transformation Services. We leverage our understanding of business and HR best practices to help customers gain additional business value from our solution. Example services include developing and implementing change management programs, defining metrics-based processes for performance and talent management, and guiding executive teams on goal setting and goal cascading.
Customer Support
We relentlessly pursue customer success and satisfaction. We believe this has significantly contributed to our maintaining a greater than 90% customer retention rate during 2008 and through 2009.
At the center of our customer success effort is our Customer Success Organization. Staffed with skilled SuccessFactors product professionals, this team provides post-implementation support services that assist customers by answering functionality questions and resolving issues they may encounter. Our focus is on ensuring effective and successful use of SuccessFactors’ suite of Business Execution solutions.
Customers can choose between our Standard and Platinum support program options. Our Standard support program is included as part of the basic subscription fee. This includes assistance from our knowledgeable support staff during normal business hours, as well as access to many online resources. Our Platinum support program provides enhanced support services, including 24x7x365 access to our support staff, and offers a proactive relationship with planning and review meetings, demonstration of new product functionality, and proactive alignment with our customers’ business execution objectives.
To ensure we deliver consistent and reliable support services, we leverage sophisticated technology systems for customer and case management, performance analytics, online service, and telephone response. In addition, we have developed proprietary customer adoption and usage monitoring mechanisms that help us proactively engage with customers to ensure they are getting value from our solutions. We provide our customers an online platform to reliably submit, update, and manage service requests. Our support services offerings are global and leverage phone, email, and online communication channels. Customer satisfaction surveys and key performance metrics are reviewed regularly to ensure that we maintain a high level of responsiveness and satisfaction.
9
Table of Contents
Customers
As of December 31, 2009, we had approximately 3,100 end customers of all sizes in over 60 industries. The following table sets forth a representative list of some of our largest end customers by industry category, based on number of end users:
| Consumer |
Energy |
Financial Services | ||
| Cadbury Schweppes Plc Coca-Cola Enterprises Inc. LG Electronics PepsiCo Whirlpool Corporation |
American Electric Power Services Corp. Duke Energy Republic Services United States Steel Vale Inco Technical Services Limited |
Mellon Bank N.A MetLife Insurance Company Morgan Stanley & Co. Incorporated The Toronto—Dominion Bank Wachovia (a Wells Fargo company) | ||
| Government and Education |
Healthcare |
Life Sciences | ||
| Corinthian Colleges Inc. Jet Propulsion Laboratory Kaplan Inc. Montgomery County Maryland United Nations Development Programme |
Baylor Health Care System GGNSC Administrative Services LLC Henry Ford Health System Inova Health System Sutter Health |
Allergan, Inc. Becton, Dickinson Pfizer, Inc. Sanofi-Aventis U.S. LLC Takeda Pharmaceutical Company Limited | ||
| Manufacturing |
Retail |
Telecommunications and Technology | ||
| Baker Hughes Flextronics International USA Inc. General Motors Corporation Ingersoll Rand Company Textron Inc. |
Harris Teeter Inc. LensCrafters, Inc. Pep Boys-Manny, Moe & Jack Sears, Roebuck and Co. The Gap Inc. |
EMC Corporation Nokia Siemens Networks Oy Orange Personal Communication Services Rogers Communications Inc. Symantec Corporation | ||
Sales and Marketing
We sell our application suite primarily through our global direct sales organization. Our sales force is organized by geographic regions, including North America, Latin America, Europe and the Middle East, and Asia Pacific. We further organize our sales force into teams focused on selling to specific customer segments, based on the size of our prospective customers, such as small, mid-sized and enterprise, as well as vertical industry, to provide a higher level of service and understanding of our customers’ unique needs. We work with channel partners, including leading global human resources outsourcing vendors, such as Ceridian Corporation and International Business Machines Corp., or IBM, who resell our application suite. For 2008 and 2009, revenue through third-party resellers grew from $7.9 million to $9.4 million and accounted for approximately 7% and 6% of our total revenue respectively.
We generate customer leads, accelerate sales opportunities and build brand awareness through our marketing programs. Our marketing programs target HR executives, technology professionals, senior line-of-business leaders, and corporate or institutional executives. Like our sales teams, our marketing team and programs are organized by geography, company size and industry segment to focus on the unique needs of customers within the target markets. Our principal marketing programs include:
| • | field marketing events for customers and prospects; |
| • | participation in, and sponsorship of, user conferences, trade shows and industry events; |
| • | customer programs, including user meetings and our online customer community; |
| • | online marketing activities, including direct email, online web advertising, pay-per-click, blogs and webinars; |
| • | public and analyst relations; |
| • | cooperative marketing efforts with partners, including joint press announcements, joint trade show activities, channel marketing campaigns and joint seminars; |
10
Table of Contents
| • | use of our website to provide product and company information, as well as learning opportunities for potential customers; and |
| • | inbound lead generation representatives who respond to incoming leads to convert them into new sales opportunities. |
We host SuccessConnect user conferences globally, where customers both participate in and deliver a variety of programs designed to help accelerate business performance through the use of our application suite. The conferences feature a variety of prominent keynote and customer speakers, panelists and presentations focused on businesses of all sizes, across a wide range of industries. The events also bring together partners, customers and other key participants in the human resources area to exchange ideas and best practices for improving business performance. Attendees gain insight into our product plans and participate in interactive sessions that give them the opportunity to express opinions on new features and functionality.
Strategic Relationships
An important element of our strategy is establishing deep relationships with key industry leaders to enable the widespread adoption of our application suite. We have established a network of relationships that expand our capabilities in multiple areas, such as: distribution of our solution through resellers and referral partners; implementation and consulting services through professional services and consulting organizations; and expanded features and functionality through content and product partners. This approach enables us to focus on our core competencies while, at the same time, providing additional value to our customers.
Outsourcing and Distribution Relationships
We have a network of third parties that resell our application suite directly, refer customer prospects to us and assist our internal sales force. These include leading global human resource outsourcing vendors such as Ceridian, Hewitt Associates and IBM. Outsourcing partners allow customers that desire to outsource multiple HR processes to leverage the benefits of our solution.
Consulting and Implementation Relationships
We work with leading human resources consulting firms to expand our delivery capabilities as well as to offer additional value-added services. These include relationships with industry leaders such as Hewitt Associates, IBM, Mercer Human Resources Consulting LLC, Aasonn, LLC, and Learn2Perform, Inc. dba SystemLink, and PriceWaterhouseCoopers Japan.
Content and Product Relationships
We have relationships with leading content and product companies that complement our solution by making specialized content and functionality available to our customers. These include competency vendors such as Development Dimensions International, Inc., ITG Competency Group, LLC, Lominger International (a Korn/Ferry company), and Personnel Decisions International Corp. We also have integration relationships with vendors of complementary products, such as eQuest LLC, GeoLearning, Inc., HireRight Inc. and Xactly Corporation, that provide additional functionality, such as job boards, learning management systems, background check services, and sales incentive compensation solutions.
Technology
Our solution was architected from the outset to be cloud-based multi-tenant, highly scalable, highly secure, highly configurable and high performance, in order to rapidly deliver value to our customers. Customers can access our solution via a standard web browser without requiring any changes in their network or IT infrastructure.
11
Table of Contents
In designing our solution, we set out to achieve a number of goals. First, the technology had to be highly scalable to accommodate customer growth while continuing to provide high application availability. Second, the data and transactions had to be highly secure, using advanced security technologies and protocols. Third, the solution architecture had to be multi-tenant, allowing us to maintain only one current release that all of our customers use, eliminating the overhead associated with software upgrades or migrations common to many on-premise or other hosted software environments. Fourth, the solution had to allow for rapid response times during heavy usage.
Our solution is architected to deliver a user experience that feels highly customized without requiring custom code changes. Many customers can be configured in a few days or weeks as compared to the months that may be required for traditional enterprise software implementations, allowing the customer to quickly start using our solution. Since our solution is easy to configure, our professional services personnel are not programmers but rather performance and talent management specialists who can focus on providing value to customers.
Our solution is also designed to satisfy strict security requirements. In addition to including extensive roles and permissions capabilities and audit histories of transactions, our architecture segregates each customer’s data from other customers’ data. This data segregation also allows our solution to easily scale horizontally at the database level by load balancing customer instances across database servers.
We use a hybrid approach to our multi-tenant database architecture, which we believe is unique compared to other cloud-based, multi-tenant applications. While the core of the approach is multi-tenant with identical database table schemas for each customer, we leverage the self-describing attributes of XML to abstract many of the unique customer data requirements into an object model. While all of the data is stored in a standard RDBMS, the table structure itself is simplified, with all of the core entity data self-described within an XML-based object model. This approach allows for a highly-configurable user experience, allowing customers to provide their users with a web-based performance and talent management system that is familiar and easy to adopt because it can mimic the layout of a prior paper-based system. Users can also enter goals, tasks, targets and milestones into different goal plan templates and layouts, all while leveraging a common permission control model for access to public and private goals within their organization. This approach also allows us to interface with services across a service oriented architecture, or SOA, environment. With our approach, we are able to retain the scalability advantages of a multi-tenant model with identical schemas while still offering customers the ability to benefit from a highly configurable application. As a result, customers can benefit from lower costs as compared to on-premise software, while at the same time achieving higher levels of configurability than we believe are achievable with other cloud-based architectures.
Another key feature of our application architecture is its ability to understand the hierarchical structure of employee relationships within an organization. This is essential for a performance and talent management application, but difficult to accomplish using traditional flat table-based database software applications, which must traverse the entire employee hierarchy in order to effectively query across the dataset using standard SQL. Our proprietary implementation of a “Left/Right Algorithm” allows our solution to optimize these queries and quickly search and retrieve hierarchical data. This approach allows managers to cascade goals to team members and allows each team member to personalize these goals for their particular goal plan, all while the system seamlessly maintains the relationship between the original and cascaded goals in the employee hierarchy.
We are standardized on the J2EE technology stack with the majority of our software written in industry-standard software programming languages, such as Java. We also make extensive use of Web 2.0 technologies, such as AJAX and Flash, for improved usability and performance and to deliver a rich and highly interactive experience. Our hardware consists primarily of industry standard web servers, application servers, database servers and storage and networking equipment. We support recent versions of major web browsers on major operating systems.
12
Table of Contents
Development
We work closely with our customers and user community to continually improve and enhance our existing offerings and develop new modules and features. Our overall SuccessFactory development approach focuses on rapid innovation and development in order to quickly deliver the features most desired by our customers. SuccessFactory emphasizes collaboration with customers and throughout all areas of our organization in the development process. A key part of this focus is our IdeaFactory, which resides on our web-based Customer Community portal and allows customers and employees to suggest, collaborate on and vote on new features and functionality. This input drives many of the development plans and priorities of our engineering team. We also conduct frequent user meetings, maintain a customer advisory board, and offer other events to provide customers with the opportunity to provide ideas and feedback in our collaborative development process.
Our engineering process is based on a combination of three methodologies: traditional “waterfall” for long-term product release planning; a SCRUM development methodology for agility—supporting our frequent release process and fast reaction to urgent customer and market needs; and the “Extreme Programming” methodology to focus on rapid development, tight connection to business requirements, and quality. Leveraging our multi-tenant platform architecture, we can quickly introduce new features across our entire customer base without the need for customers to install or implement any software.
Our research and development expenses were $16.7 million in 2007, $23.1 million in 2008 and $24.4 million in 2009.
Operations
We serve our customers and end users from four secure data centers—two located in the United States and two in Europe. Physical security features at these facilities include a 24x7x365 manned security station and biometric and man-trap access controls. The systems at these facilities are protected by firewalls and encryption technology. Operational redundancy features include redundant power, on-site backup generators, and environmental controls and monitoring.
We employ a wide range of security features, including two-factor authentication, data encryption, encoded session identifications and passwords. We contract with specialized security vendors to conduct regular security audits of our infrastructure. We also employ outside vendors for 24x7x365 managed network security and monitoring. Every page we serve is delivered encrypted to the end user via a Secure Socket Layer, or SSL, transaction. We also use encryption technology in our storage systems and backup tapes.
We continuously monitor the performance of our application suite using a variety of automated tools. We designed our infrastructure with built-in redundancy for key components. Our network includes firewalls, switches and intrusion detection systems, and incorporates failover backup for maximum uptime. We load balance at each tier in the network infrastructure. We also designed our application server clusters so that servers can fail without interrupting the user experience, and our database servers are clustered for failover. We regularly back up and store customer data on-site and off-site in secure locations to minimize the risk of data loss at any facility.
Competition
The overall market for business execution solutions is nascent and therefore fragmented, rapidly evolving and highly competitive, with relatively low barriers to entry in some segments.
Within the business execution market, the most common type of competitive solution consists of paper-based processes or desktop software tools that are not specifically designed for performance and talent management. We also face competition from custom-built software that is designed to support the needs of a single organization, and from third-party human resource application providers. These software vendors include, Authoria, Inc., Cornerstone OnDemand, Inc., Halogen Software Inc., Kenexa Corporation, Oracle Corporation, Plateau Systems, Ltd., Salary.com, Inc., SAP AG, Softscape, Inc., StepStone Solutions, SumTotal Systems Inc., Taleo Corporation, and Workday, Inc.
13
Table of Contents
We expect that the competitive landscape will change as the market for performance and talent management software and services consolidates and matures.
We believe the principal competitive factors in our industry include the following:
| • | total cost of ownership; |
| • | breadth and depth of product functionality; |
| • | brand awareness and reputation; |
| • | ease of deployment and use of solutions; |
| • | level of integration, configurability, security, scalability and reliability of solutions; |
| • | ability to innovate and respond to customer needs rapidly; |
| • | size of customer base and level of user adoption; |
| • | ability to integrate with third-party applications; and |
| • | the level of sales, marketing and financial resources. |
We believe we compete favorably with respect to most of these factors. However, some of our competitors and potential competitors have substantially greater name recognition, longer operating histories, larger marketing budgets and significantly greater resources. They may be able to devote greater resources to the development, promotion and sale of their products and services than we can to ours, which could allow them to respond more quickly and effectively to new technologies and changes in customer needs. Additionally, our competitors may offer or develop products or services that are superior to ours or that achieve greater market acceptance.
Intellectual Property
We rely upon a combination of patent, copyright, trade secret and trademark laws and contractual restrictions, such as confidentiality agreements and licenses, to establish and protect our proprietary rights. We currently have one issued U.S. patent. Although we rely on patent, copyright, trade secret and trademark laws to protect our technology, we believe that factors such as the technological and creative skills of our personnel, creation of new modules, features and functionality and frequent enhancements to our solution are more essential to establishing and maintaining a technology leadership position.
Despite our efforts to protect our proprietary rights, unauthorized parties may attempt to copy or obtain and use our technology to develop products with the same functionality as our solution. Policing unauthorized use of our technology is difficult. The laws of other countries in which we market our application suite may offer little or no effective protection of our proprietary technology. Our competitors could also independently develop technologies equivalent to ours, and our intellectual property rights may not be broad enough for us to prevent competitors from selling products incorporating those technologies. Reverse engineering, unauthorized copying or other misappropriation of our proprietary technology could enable third parties to benefit from our technology without paying us for it, which would significantly harm our business.
We expect that software in our industry may be subject to third-party infringement claims as the number of competitors grows and the functionality of products in different industry segments overlaps. Such competitors could make a claim of infringement against us with respect to our application suite and underlying technology. Third parties may currently have, or may eventually be issued, patents upon which our current solution or future technology infringe. Any of these third parties might make a claim of infringement against us at any time.
Employees
We utilize our application suite to recruit and manage our team throughout our entire organization, which we believe has significantly helped us build a team with superior skills, competencies and aptitude. As of December 31, 2009, we had 664 employees. None of our employees is represented by a labor union or is covered by a collective bargaining agreement. We consider our relations with our employees to be good.
14
Table of Contents
Executive Officers
The following table provides information regarding our executive officers and key employees as of February 26, 2010:
| Name |
Age | Position(s) | ||
| Lars Dalgaard |
42 | Founder, Chief Executive Officer, President and Director | ||
| Bruce C. Felt, Jr |
51 | Chief Financial Officer | ||
| Paul L. Albright |
47 | General Manager, Small and Mid-Sized Business Unit and Chief Marketing Officer | ||
| Luen Au |
36 | Chief Technology Officer | ||
| James B. Larson |
51 | Vice President, Global Enterprise Sales | ||
| Julian K. Ong |
43 | Vice President, General Counsel and Secretary | ||
| Randall J. Womack |
45 | Chief Information Officer and Vice President, Operations | ||
| Victoria A. Bernholz |
56 | Chief People Officer |
Lars Dalgaard founded SuccessFactors in May 2001 and has served as a director and our President and Chief Executive Officer since May 2001. From 1994 to 1998, Mr. Dalgaard served in various general management positions at Unilever N.V., a global packaged consumer and industrial goods company, in the Netherlands, Germany and Denmark. From 1991 until 1993, Mr. Dalgaard held various positions at Novartis (formerly known as Sandoz), a pharmaceutical company, including Sales Representative, Product Manager and Corporate Finance Controller, in the United States and Switzerland. Mr. Dalgaard holds a B.A. from Copenhagen Business School, Denmark and an M.S. from Stanford University Graduate School of Business as a Sloan Fellow.
Bruce C. Felt, Jr. has served as our Chief Financial Officer since October 2006. From February 2005 through August 2006, Mr. Felt served as Chief Financial Officer of LANDesk Software, Inc., a security and systems management software company. Mr. Felt’s responsibilities at LANDesk included financial management. Subsequent to LANDesk’s acquisition by Avocent Corp. in August 2006, Mr. Felt was retained by Avocent through February 2007 on a transitional basis to manage certain matters. From April 1999 to February 2005, Mr. Felt served as Chief Financial Officer of Integral Development Corporation, an on-demand software company. Mr. Felt holds a B.S. in accounting from the University of South Carolina and an M.B.A. from Stanford University Graduate School of Business.
Paul L. Albright has served as our General Manager, Small and Mid-sized Business Unit and Chief Marketing Officer since July 2007. From September 2004 to February 2007, Mr. Albright served as Senior Vice President, Worldwide Marketing at Network Appliance, Inc., a data management solutions company. Mr. Albright’s responsibilities at Network Appliance included marketing management. From January 2004 to September 2004 and from 1995 to 1998, Mr. Albright was Executive Vice President, Channel Sales and Chief Marketing Officer at Informatica Corporation, an enterprise data software company. From January 2003 to December 2003, Mr. Albright was CEO-in-Residence at Greylock Partners, a venture capital firm. From October 1998 to December 2002, Mr. Albright served as President, Chief Executive Officer and Chairman of the Board of Directors at SeeCommerce, a performance management software company. Mr. Albright holds a B.S. in information (computer) sciences and a B.A. in management from James Madison University.
Luen Au has served as our Chief Technology Officer since February 2009 and was our Vice President, Engineering since September 2006. From May 2001 to September 2006, Mr. Au served in a number of engineering roles, including Director of Engineering and Senior Director of Engineering. Mr. Au holds a B.A. in computer science from the University of California, Berkeley.
James B. Larson has served as our Vice President, Global Enterprise Sales since September 2007. From June 2000 until January 2007, Mr. Larson served in various positions at Mercury Interactive Corporation, an
15
Table of Contents
enterprise software company, most recently as Senior Vice President of Worldwide Field Operations, including following the acquisition of Mercury Interactive by Hewlett-Packard Company. Mr. Larson’s responsibilities at Mercury Interactive included sales management. Prior to Mercury Interactive, Mr. Larson held various sales and management positions at various technology companies, including Siebel Systems, Inc. and Oracle Corporation. Mr. Larson holds a B.A. in economics from Harvard College and an M.B.A. from the Anderson School of Management at the University of California, Los Angeles.
Julian K. Ong has served as our Vice President, General Counsel and Secretary since August 2006. From September 2002 to July 2006, Mr. Ong served in various capacities in the legal department of salesforce.com, inc., an on-demand customer relationship management application company, most recently as Deputy General Counsel. Mr. Ong’s responsibilities at salesforce.com included legal support. From January 2000 to August 2002, Mr. Ong was an associate at the law firm of Skadden, Arps, Slate, Meagher & Flom LLP. Mr. Ong holds a B.S. and an M.S. in electrical engineering from Stanford University and a J.D. from Boalt Hall School of Law at the University of California, Berkeley.
Randall J. Womack has served as our Chief Information Officer and Vice President, Operations since April 2003. From May 2000 to April 2003, Mr. Womack served as a partner in the Fast Forward Group at Greylock Partners, a venture capital firm. Prior to that, from 1997 to May 2000, Mr. Womack served as Chief Information Officer of Digital River, Inc., an e-commerce ASP company. Mr. Womack attended the University of Texas at Austin.
Victoria A Bernholz has served as our Chief People Officer since September 2009. From December, 2005 to August, 2009, Ms. Bernholz was with Gap, Inc. as the VP of HR Operations and the VP of Field HR. Ms. Bernholz’s responsibilities at Gap included human resources management. Prior to that, Ms. Bernholz was with Wild Oats, Inc. and held various business and human resources positions at the early stages of Blockbuster Video, Boston Market, and Waldo’s Dollar Mart de Mexico. Ms. Bernholz holds a B.S. in psychology from the University of Houston and an M.B.A. from the University of Dallas.
AVAILABLE INFORMATION
You can access financial and other information at our Investor Relations website. Our website is located at www.successfactors.com/investor. We make available free of charge on our web site our Annual Reports on Form 10-K, our Quarterly Reports on Form 10-Q, our Current Reports on Form 8-K and amendments to those reports filed or furnished pursuant to Section 13(a) or 15(d) of the Securities Exchange Act of 1934, as amended, as soon as reasonably practicable after we electronically file them with or furnish them to the SEC. Information contained on our web site is not part of this Annual Report on Form 10-K or our other filings with the SEC.
The charters of our Audit Committee, our Compensation Committee, and our Nominating and Corporate Governance Committee, as well as our Code of Business Conduct and Ethics, are available on the Investor Relations section of our website under Corporate Governance. This information is also available by writing to us at the address on the cover of this Annual Report on Form 10-K.
16
Table of Contents
| Item 1A. | Risk Factors |
Investing in our common stock involves a high degree of risk. You should consider carefully the risks and uncertainties described below, together with all of the other information in this annual report, including the consolidated financial statements and the related notes included elsewhere in this annual report. If any of the following risks actually occurs, our business, financial condition, results of operations and future prospects could be materially and adversely affected. In that event, the market price of our common stock could decline and you could lose part or even all of your investment.
The risks and uncertainties described below are not the only ones facing us. Other events that we do not currently anticipate or that we currently deem immaterial also may affect our results of operations and financial condition.
We have a history of losses and we may not achieve or sustain profitability in the future.
We have incurred significant losses in each fiscal period since our inception in 2001. We experienced a net loss of $12.6 million for the year ended December 31, 2009. At December 31, 2009, we had an accumulated deficit of $218.9 million. The losses and accumulated deficit were due to the substantial investments we made to grow our business and acquire customers. Despite recent moderation in spending, we still expect to incur significant operating expenses in the future due to our investment in sales and marketing, research and development expenses, and operations costs, expenses related to stock-based compensation and acquisition related charges arising from the purchase of Inform Business Impact (“Inform”) and therefore we may continue to incur losses for the foreseeable future. In pursuing acquisitions, it is also likely that our operating expenses will increase. Furthermore, to the extent we are successful in increasing our customer base, we could also incur increased losses because costs associated with generating customer agreements are generally incurred up front, while revenue is generally recognized ratably over the term of the agreement. You should not consider our historic revenue growth as indicative of our future performance. Accordingly, we cannot assure you that we will achieve profitability in the future or that, if we do become profitable, we will sustain profitability.
Current uncertainty in global economic conditions makes it particularly difficult to predict demand and other related matters and makes it more likely that our actual results could differ materially from expectations.
Our operations and performance depend on worldwide economic conditions, which have deteriorated significantly in the United States and other countries, and may remain depressed for the foreseeable future. These conditions make it difficult for our customers and potential customers to accurately forecast and plan future business activities, and are causing our customers and potential customers to slow or reduce spending on our application suite. Furthermore, during these challenging economic times, our customers face issues gaining timely access to sufficient credit and decreasing cash flow, which are impacting their willingness to make purchases and their ability to make timely payments to us. We cannot predict the timing, strength or duration of the economic slowdown or any subsequent economic recovery, worldwide, in the United States, or in our industry. These and other economic factors are having an adverse effect on demand for our application suite, including new bookings and renewal and upsell rates, on our ability to predict future operating results, and on our financial condition and operating results.
Because we recognize revenue from our customers over the term of their agreements, downturns or upturns in sales may not be immediately reflected in our operating results.
We recognize revenue over the terms of our customer agreements, which typically range from one to three years, with some up to five years. As a result, most of our quarterly revenue results from agreements entered into during previous quarters. Consequently, a shortfall in demand for our application suite in any quarter may not significantly reduce our revenue for that quarter, but could negatively affect revenue in future quarters. In
17
Table of Contents
particular, if such a shortfall were to occur in our fourth quarter, it may be more difficult for us to increase our customer sales to recover from such a shortfall as we have historically entered into a significant portion of our customer agreements during the fourth quarter. In addition, we may be unable to adjust our cost structure to reflect this potential reduction in revenue. Accordingly, the effect of significant downturns in sales of our application suite may not be fully reflected in our results of operations until future periods. Our subscription model also makes it difficult for us to rapidly increase our revenue through additional sales in any period, as revenue from new customers must be recognized over the applicable subscription term.
Because we recognize revenue from our customers over the term of their agreements but incur most costs associated with generating customer agreements upfront, rapid growth in our customer base will result in increased losses.
Because the expenses associated with generating customer agreements are generally incurred up front, but the resulting revenue is recognized over the life of the customer agreement, increased growth in the number of customers will result in our recognition of more costs than revenue in the earlier periods of the terms of our agreements even though the customer is expected to be profitable for us over the term of the agreement.
Our business depends substantially on customers renewing their agreements and purchasing additional modules or users from us. Any decline in our customer renewals would harm our future operating results.
In order for us to improve our operating results, it is important that our customers renew their agreements with us when the initial contract term expires and also purchase additional modules or additional users. Our customers have no obligation to renew their subscriptions after the initial subscription period, and we cannot assure you that customers will renew subscriptions at the same or higher level of service, if at all. Although our renewal rates have been high historically and above 90% for 2009, some of our customers have elected not to renew their agreements with us, and some are declining to renew as a result of the global economic slowdown. Moreover, under some circumstances, some of our customers have the right to cancel their agreements prior to the expiration of the term. Our customers’ renewal rates may decline or fluctuate as a result of a number of factors, including their satisfaction or dissatisfaction with our application suite, pricing, the prices of competing products or services, mergers and acquisitions affecting our customer base, the effects of economic downturns, including the current global economic recession, and global economic conditions, or reductions in our customers’ spending levels. If our customers do not renew their subscriptions, renew on less favorable terms or fail to purchase additional modules or users, our revenue may decline, and we may not realize significantly improved operating results from our customer base.
We have recently launched our business execution strategy and this strategy may not result in additional customers or revenues.
We recently launched our business execution product and marketing strategy in order to expand our reach beyond the People Performance solutions market. We did this in part, because we believe that the market for business execution software presents a significantly larger potential market opportunity than the market for People Performance solutions. This belief is based on a number of assumptions that may vary materially from actual future results. These assumptions include user adoption by a substantial majority of the estimated current worldwide work force, with estimated long-term per user rates that are significantly higher than the current average per user rates. The business execution solutions market is an emerging market, and therefore, its ultimate size and any share of this new market that we might obtain is inherently unpredictable and will likely be impacted by, among other factors, the breadth and depth of our solutions, the productivity enhancements realized by customers using these solutions and emergence of competitive solutions. It is possible that our assumptions and estimates as to market size could be incorrect and inaccurate or otherwise not come to fruition, in which case we may not realize the benefits of this anticipated market opportunity. Accordingly, you should not place undue reliance on these estimates.
18
Table of Contents
We are still developing a full suite of business execution solutions, and we will need to develop or acquired additional software solutions as well as content and best practices knowledge. Accordingly, we intend to continue to invest heavily in sales and marketing and product development and intend to pursue acquisitions to implement and execute on this strategy. These activities have required significant time and attention of our management and employees. We expect to incur significant expenses to pursue this strategy. We cannot assure you that these efforts will result in significant additional customers, revenues or profitability. Moreover, these efforts may adversely impact our existing business by diverting management attention and other resources. If we are not successful in these efforts, or if the market does not develop as we anticipate, our business will not grow as we expect and our future operating results could be negatively affected.
The market in which we participate is intensely competitive, and if we do not compete effectively, our operating results could be harmed.
The market for business execution applications is fragmented, rapidly evolving and highly competitive, with relatively low barriers to entry in some segments. Many of our competitors and potential competitors are larger and have greater name recognition, much longer operating histories, larger marketing budgets and significantly greater resources than we do, and with the introduction of new technologies and market entrants, we expect to intensify in the future. If we fail to compete effectively, our business will be harmed. Some of our principal competitors offer their products or services at a lower price, which has resulted in pricing pressures. If we are unable to achieve our target pricing levels, our operating results would be negatively impacted. In addition, pricing pressures and increased competition generally could result in reduced sales, reduced margins, losses or the failure of our application suite to achieve or maintain more widespread market acceptance, any of which could harm our business.
We face competition from paper-based processes and desktop software tools. We also face competition from custom-built software that is designed to support the needs of a single organization, and from third-party human resources application providers. These software vendors include, without limitation, Authoria, Inc., Cornerstone OnDemand, Inc., Halogen Software Inc., Kenexa Corporation, Oracle Corporation, Plateau Systems, Ltd., Salary.com, Inc., SAP AG, Softscape, Inc., StepStone Solutions, SumTotal Systems Inc., Taleo Corporation and Workday, Inc.
Many of our competitors are able to devote greater resources to the development, promotion and sale of their products and services. In addition, many of our competitors have established marketing relationships, access to larger customer bases and major distribution agreements with consultants, system integrators and resellers. Moreover, many software vendors could bundle human resources products or offer them at a low price as part of a larger product sale. In addition, some competitors may offer software that addresses one or a limited number of strategic human resource functions at lower prices or with greater depth than our application suite. As a result, our competitors might be able to respond more quickly and effectively than we can to new or changing opportunities, technologies, standards or customer requirements. Further, some potential customers, particularly large enterprises, may elect to develop their own internal solutions. For all of these reasons, we may not be able to compete successfully against our current and future competitors.
We recently entered into an agreement to acquire a company and expect to acquire other companies or technologies, which could divert our management’s attention, result in additional dilution to our stockholders and otherwise disrupt our operations and harm our operating results.
We recently entered into an agreement to acquire Inform, and we expect to acquire or invest in other businesses, products or technologies that we believe could complement or expand our application suite, enhance our technical capabilities or otherwise offer growth opportunities. The pursuit of potential acquisitions may divert the attention of management and cause us to incur various expenses in identifying, investigating and pursuing suitable acquisitions, whether or not they are consummated.
19
Table of Contents
There are inherent risks in integrating and managing corporate acquisitions, and the Company has limited experience with acquisitions. If we acquire additional businesses, we may not be able to integrate the acquired personnel, operations and technologies successfully, or effectively manage the combined business following the acquisition. We also may not achieve the anticipated benefits from the acquired business due to a number of factors, including:
| • | unanticipated costs or liabilities associated with the acquisition; |
| • | incurrence of acquisition-related costs, which would be recognized as a current period expense under FASB Accounting Standards Codification (“ASC”) 805-20, Business Combinations; |
| • | diversion of management’s attention from other business concerns; |
| • | harm to our existing business relationships with business partners and customers as a result of the acquisition; |
| • | the potential loss of key employees; |
| • | use of resources that are needed in other parts of our business; and |
| • | use of substantial portions of our available cash to consummate the acquisition. |
In addition, a significant portion of the purchase price of companies we acquire may be allocated to goodwill and other indefinite lived intangible assets, which must be assessed for impairment at least annually. In the future, if our acquisitions do not yield expected returns, we may be required to take charges to our operating results based on this impairment assessment process, which could harm our results of operations.
Acquisitions could also result in dilutive issuances of equity securities or the incurrence of debt, which could adversely affect our operating results. In addition, if an acquired business fails to meet our expectations, our operating results, business and financial condition may suffer.
Although we have entered into an agreement to acquire Inform, the closing of this acquisition is subject to a number of closing conditions, including an audit of Inform’s financial statements. Accordingly, we cannot assure you as to when this acquisition will be completed. In addition, we cannot assure you that we will realize the anticipated benefits of this acquisition.
If our security measures are breached or unauthorized access to customer data is otherwise obtained, our application suite may be perceived as not being secure, customers may curtail or stop using our application suite, and we may incur significant liabilities.
Our operations involve the storage and transmission of our customers’ confidential information, and security breaches could expose us to a risk of loss of this information, litigation, indemnity obligations and other liability. If our security measures are breached as a result of third-party action, employee error, malfeasance or otherwise, and, as a result, someone obtains unauthorized access to our customers’ data, including personally identifiable information regarding users, our reputation will be damaged, our business may suffer and we could incur significant liability. Because techniques used to obtain unauthorized access or to sabotage systems change frequently and generally are not recognized until launched against a target, we may be unable to anticipate these techniques or to implement adequate preventative measures. If an actual or perceived breach of our security occurs, the market perception of the effectiveness of our security measures could be harmed and we could lose potential sales and existing customers.
Because our application suite collects, stores and reports personal information of job applicants and employees, privacy concerns could result in liability to us or inhibit sales of our application suite.
Many federal, state and foreign government bodies and agencies have adopted or are considering adopting laws and regulations regarding the collection, use and disclosure of personal information. Because many of the features of our application suite collect, store and report on personal information, any inability to adequately address privacy concerns, even if unfounded, or comply with applicable privacy laws, regulations and policies, could result in liability to us, damage our reputation, inhibit sales and harm our business.
20
Table of Contents
Furthermore, the costs of compliance with, and other burdens imposed by, such laws, regulations and policies that are applicable to the businesses of our customers may limit the use and adoption of our application suite and reduce overall demand for it. Privacy concerns, whether or not valid, may inhibit market adoption of our application suite in certain industries.
We have experienced rapid changes in our organization in recent periods. If we fail to manage these changes effectively, we may be unable to execute our business plan, maintain high levels of service or adequately address competitive challenges.
We have experienced rapid changes in our headcount and operations in recent periods. For example, we grew from 188 employees at December 31, 2005 to 664 employees as of December 31, 2009. We have increased the size of our customer base from 341 customers at December 31, 2005 to approximately 3,100 customers at December 31, 2009. In addition, Inform has approximately 120 employees and locations in Australia, the UK and the U.S. The growth in our customer base has placed, and any future growth will place, a significant strain on our management, administrative, operational and financial infrastructure. Our success will depend in part on our ability to manage these changes effectively. We will need to continue to improve our operational, financial and management controls and our reporting systems and procedures. Failure to effectively manage organizational changes could result in difficulty in implementing customers, declines in quality or customer satisfaction, increases in costs, difficulties in introducing new features or other operational difficulties, and any of these difficulties could adversely impact our business performance and results of operations.
Failure to adequately expand and ramp our direct sales force and develop and expand our indirect sales channel will impede our growth.
We will need to continue to optimize our sales and marketing infrastructure in order to grow our customer base and our business. We plan to continue to expand and ramp our direct sales force and engage additional third-party channel partners, both domestically and internationally. Identifying and recruiting these people and entities and training them in the use of our application suite require significant time, expense and attention. This expansion will require us to invest significant financial and other resources. We typically have no long-term agreements or minimum purchase commitments with any of our channel partners, and our agreements with these channel partners do not prohibit them from offering products or services that compete with ours. Our business will be seriously harmed if our efforts to expand and ramp our direct sales force and expand our indirect sales channels do not generate a corresponding significant increase in revenue. In particular, if we are unable to hire, develop and retain talented sales personnel or if new direct sales personnel are unable to achieve desired productivity levels in a reasonable period of time, whether due to the global economic slowdown or for other reasons, we may not be able to significantly increase our revenue and grow our business.
The market for our application suite depends on widespread adoption of business execution.
Widespread adoption of our solution depends on the widespread adoption of business execution by organizations. It is uncertain whether they will purchase software or on-demand applications for this function. Accordingly, we cannot assure you that an on-demand model for business execution will achieve and sustain the high level of market acceptance that is critical for the success of our business.
We have historically derived a significant portion of our subscription revenue from sales of our performance management and goal management modules. If these modules are not widely accepted by new customers, our operating results will be harmed.
We have historically derived a significant portion of our historical revenue from sales of our Performance Management and Goal Management modules. If these modules do not remain competitive, or if we experience pricing pressure or reduced demand for these modules, our future revenue could be negatively affected, which would harm our future operating results.
21
Table of Contents
The market for on-demand applications is at an early stage of development, and if it does not develop or develops more slowly than we expect, our business will be harmed.
The market for on-demand applications is at an early stage of development, and these applications may not achieve and sustain high levels of demand and market acceptance. Our success will depend on the willingness of organizations to increase their use of on-demand applications. Many companies have invested substantial personnel and financial resources to integrate traditional enterprise software into their businesses, and therefore may be reluctant or unwilling to migrate to on-demand applications. We have encountered customers in the past that have been unwilling to subscribe to our application suite because they could not install it on their premises. Other factors that may affect the market acceptance of on-demand applications include:
| • | perceived security capabilities and reliability; |
| • | perceived concerns about ability to scale operations for large enterprise customers; |
| • | concerns with entrusting a third party to store and manage critical employee data; and |
| • | the level of configurability of on-demand applications. |
If organizations do not perceive the benefits of on-demand applications, then the market for these applications may not develop further, or it may develop more slowly than we expect, either of which would adversely affect our business.
Our quarterly results can fluctuate and, if we fail to meet the expectations of analysts or investors, our stock price and the value of your investment could decline substantially.
Our quarterly financial results may fluctuate as a result of a variety of factors, many of which are outside of our control. If our quarterly financial results fall below the expectations of investors or any securities analysts who follow our stock, the price of our common stock could decline substantially. Fluctuations in our quarterly financial results may be caused by a number of factors, including, but not limited to, those listed below:
| • | our ability to attract new customers; |
| • | customer renewal rates; |
| • | the extent to which customers increase or decrease the number of modules or users upon any renewal of their agreements; |
| • | the effects of changes in global economic conditions and announcements of economic data and government initiatives to address the global economic downturn; |
| • | the level of new customers as compared to renewal customers in a particular period; |
| • | the addition or loss of large customers, including through acquisitions or consolidations; |
| • | the mix of customers between small, mid-sized and enterprise customers; |
| • | changes in our pricing policies or those of our competitors; |
| • | seasonal variations in the demand for our application suite, which has historically been highest in the fourth quarter of a year; |
| • | the amount and timing of operating expenses, particularly sales and marketing, related to the maintenance and expansion of our business, operations and infrastructure; |
| • | the timing and success of new product and service introductions by us or our competitors or any other change in the competitive dynamics of our industry, including consolidation among competitors, customers or strategic partners; |
| • | network outages or security breaches; |
22
Table of Contents
| • | the timing of expenses related to the development or acquisition of technologies or businesses and potential future charges for impairment of goodwill from acquired companies; and |
| • | other general economic, industry and market conditions. |
We believe that our quarterly results of operations, including the levels of our revenue and changes in deferred revenue, may vary significantly in the future and that period-to-period comparisons of our operating results may not be meaningful. You should not rely on the results of any one quarter as an indication of future performance.
The market for our application suite among large customers may be limited if they require customized features or functions that we do not intend to provide.
Prospective customers, especially large enterprise customers, may require customized features and functions unique to their business processes. If prospective customers require customized features or functions that we do not offer, then the market for our application suite will be more limited among these types of customers and our business could suffer.
We depend on our management team, particularly our Chief Executive Officer and our development personnel, and the loss of one or more key employees or groups could harm our business and prevent us from implementing our business plan in a timely manner.
Our success depends largely upon the continued services of our executive officers, particularly our Chief Executive Officer, and other key employees, including key development personnel. From time to time, there may be changes in our executive management team resulting from the hiring or departure of executives, which could disrupt our business. We are also substantially dependent on the continued service of our existing development personnel because of the complexity of our application suite and technologies.
We do not have employment agreements with any of our personnel that require these personnel to continue to work for us for any specified period and, therefore, they could terminate their employment with us at any time. We do not maintain key person life insurance policies on any of our employees. The loss of one or more of our key employees or groups could seriously harm our business.
If we cannot maintain our corporate culture as we grow, we could lose the innovation, teamwork, passion and focus on execution that we believe contribute to our success, and our business may be harmed.
We believe that a critical contributor to our success has been our corporate culture, which we believe fosters innovation, teamwork, passion for customers and focus on execution. As we grow and change, we may find it difficult to maintain these important aspects of our corporate culture. Any failure to preserve our culture could also negatively affect our ability to retain and recruit personnel, and otherwise adversely affect our future success.
Our growth depends in part on the success of our strategic relationships with third parties.
We anticipate that we will continue to depend on various third-party relationships in order to grow our business. In addition to growing our indirect sales channels, we intend to pursue additional relationships with other third parties, such as technology and content providers and implementation partners. Identifying partners, negotiating and documenting relationships with them require significant time and resources as does integrating third-party content and technology. Our agreements with technology and content providers are typically non-exclusive and do not prohibit them from working with our competitors or from offering competing services. Our competitors may be effective in providing incentives to third parties to favor their products or services or to prevent or reduce subscriptions to our application suite. In addition, the current global economic slowdown could adversely affect the businesses of our partners, and it is possible that they may not be able to devote the resources we expect to the relationship.
23
Table of Contents
If we are unsuccessful in establishing or maintaining our relationships with these third parties, our ability to compete in the marketplace or to grow our revenue could be impaired and our operating results would suffer. Even if we are successful, we cannot assure you that these relationships will result in increased customer usage of our application suite or revenue.
We rely on a small number of third-party service providers to host and deliver our application suite and any interruptions or delays in services from these third parties could impair the delivery of our application suite and harm our business.
We currently host our application suite from four data centers—two located in the United States and two in Europe. We do not control the operation of any of these facilities. These facilities are vulnerable to damage or interruption from natural disasters, fires, power loss, telecommunications failures and similar events. They are also subject to break-ins, computer viruses, sabotage, intentional acts of vandalism and other misconduct. The occurrence of a natural disaster or an act of terrorism, a decision to close the facilities without adequate notice or other unanticipated problems could result in lengthy interruptions, which would have a serious adverse impact on our business. Additionally, our data center agreements are of limited duration and are subject to early termination rights in certain circumstances, and the providers of our data centers have no obligation to renew their agreements with us on commercially reasonable terms, or at all.
We also depend on access to the Internet through third-party bandwidth providers to operate our business. If we lose the services of one or more of our bandwidth providers for any reason, we could experience disruption in delivering our application suite or we could be required to retain the services of a replacement bandwidth provider.
Our operations also rely heavily on the availability of electricity, which also comes from third-party providers. If we or the third-party data center facilities that we use to deliver our services were to experience a major power outage or if the cost of electricity were to increase significantly, our operations could be harmed. If we or our third-party data centers were to experience a major power outage, we would have to rely on back-up generators, which might not work properly or might not provide an adequate supply during a major power outage. Such a power outage could result in a disruption of our business.
If our application suite becomes unavailable or otherwise fails to perform properly, our reputation will be harmed, our market share would decline and we could be subject to liability claims.
The software used in our application suite is inherently complex and may contain material defects or errors. Any defects in product functionality or that cause interruptions in the availability of our application suite could result in:
| • | lost or delayed market acceptance and sales; |
| • | breach of warranty claims; |
| • | sales credits or refunds to our customers; |
| • | loss of customers; |
| • | diversion of development and customer service resources; and |
| • | injury to our reputation. |
The costs incurred in correcting any material defects or errors might be substantial and could adversely affect our operating results.
Because of the large amount of data that we collect and manage, it is possible that hardware failures or errors in our systems could result in data loss or corruption, or cause the information that we collect to be
24
Table of Contents
incomplete or contain inaccuracies that our customers regard as significant. Furthermore, the availability of our application suite could be interrupted by a number of factors, including customers’ inability to access the Internet, the failure of our network or software systems due to human or other error, security breaches or variability in user traffic for our application suite. We may be required to issue credits or refunds or indemnify or otherwise be liable to our customers for damages they may incur resulting from certain of these events. In addition to potential liability, if we experience interruptions in the availability of our application suite, our reputation could be harmed and we could lose customers.
Our errors and omissions insurance may be inadequate or may not be available in the future on acceptable terms, or at all. In addition, our policy may not cover any claim against us for loss of data or other indirect or consequential damages and defending a suit, regardless of its merit, could be costly and divert management’s attention.
We rely on third-party computer hardware and software that may be difficult to replace or which could cause errors or failures of our service.
We rely on computer hardware, purchased or leased, and software licensed from third parties in order to deliver our application suite. This hardware and software may not continue to be available on commercially reasonable terms, or at all. Any loss of the right to use any of this hardware or software could result in delays in our ability to provide our application suite until equivalent technology is either developed by us or, if available, identified, obtained and integrated, which could harm our business. In addition, errors or defects in third-party hardware or software used in our application suite could result in errors or a failure of our application suite, which could harm our business.
If we are not able to develop enhancements and new features that achieve market acceptance or that keep pace with technological developments, our business will be harmed.
Our ability to attract new customers and increase revenue from existing customers will depend in large part on our ability to enhance and improve our existing application suite and to introduce new features. The success of any enhancement or new product depends on several factors, including timely completion, introduction and market acceptance. Any new feature or module that we develop or acquire may not be introduced in a timely or cost-effective manner and may not achieve the broad market acceptance necessary to generate significant revenue. If we are unable to successfully develop or acquire new features or modules or to enhance our existing application suite to meet customer requirements, our business and operating results will be adversely affected.
Because we designed our application suite to operate on a variety of network, hardware and software platforms using standard Internet tools and protocols, we will need to continuously modify and enhance our application suite to keep pace with changes in Internet-related hardware, software, communication, browser and database technologies. If we are unable to respond in a timely manner to these rapid technological developments in a cost-effective manner, our application suite may become less marketable and less competitive or obsolete and our operating results may be negatively impacted.
If we fail to develop widespread brand awareness cost-effectively, our business may suffer.
We believe that developing and maintaining widespread awareness of our brand in a cost-effective manner is critical to achieving widespread acceptance of our application suite and attracting new customers, particularly in light of the current global economic downturn. Brand promotion activities may not generate customer awareness or increase revenue, and even if they do, any increase in revenue may not offset the expenses we incur in building our brand. If we fail to successfully promote and maintain our brand, or incur substantial expenses, we may fail to attract or retain customers necessary to realize a sufficient return on our brand-building efforts, or to achieve the widespread brand awareness that is critical for broad customer adoption of our application suite.
25
Table of Contents
Because our long-term success depends, in part, on our ability to expand the sales of our application suite to customers located outside of the United States, our business will be susceptible to risks associated with international operations.
A key element of our growth strategy is to expand our international operations and develop a worldwide customer base. In addition, with the acquisition of Inform, we will add employees, offices and customers internationally. Operating in international markets requires significant resources and management attention and will subject us to regulatory, economic and political risks that are different from those in the United States. Because of our limited experience with international operations, we cannot assure you that our international expansion efforts will be successful. In addition, we will face risks in doing business internationally that could adversely affect our business, including:
| • | our ability to comply with differing technical and certification requirements outside the United States |
| • | difficulties and costs associated with staffing and managing foreign operations; |
| • | greater difficulty collecting accounts receivable and longer payment cycles; |
| • | unexpected changes in regulatory requirements; |
| • | the need to adapt our application suite for specific countries; |
| • | difficulties in understanding and complying with local laws, regulations and customs in foreign jurisdictions; |
| • | tariffs, export controls and other non-tariff barriers such as quotas and local content rules; |
| • | more limited protection for intellectual property rights in some countries; |
| • | adverse tax consequences; |
| • | fluctuations in currency exchange rates; |
| • | restrictions on the transfer of funds; and |
| • | new and different sources of competition. |
Our failure to manage any of these risks successfully could harm our existing and future international operations and seriously impair our overall business.
Because competition for our target employees is intense, we may not be able to attract and retain the quality employees we need to support our planned growth.
Our future success will depend, to a significant extent, on our ability to attract and retain high quality personnel. Despite the global economic downturn, competition for qualified management, technical and other personnel is intense, and we may not be successful in attracting and retaining such personnel. If we fail to attract and retain qualified employees, our ability to grow our business could be harmed.
Any failure to protect our intellectual property rights could impair our ability to protect our proprietary technology and our brand.
Our success and ability to compete depend in part upon our intellectual property. We primarily rely on patent, copyright, trade secret and trademark laws, trade secret protection and confidentiality or license agreements with our employees, customers, partners and others to protect our intellectual property rights. However, the steps we take to protect our intellectual property rights may be inadequate. We currently have only one issued patent.
In order to protect our intellectual property rights, we may be required to spend significant resources to monitor and protect these rights. Litigation to protect and enforce our intellectual property rights could be costly,
26
Table of Contents
time-consuming and distracting to management and could result in the impairment or loss of portions of our intellectual property. Furthermore, our efforts to enforce our intellectual property rights may be met with defenses, counterclaims and countersuits attacking the validity and enforceability of our intellectual property rights. Our failure to secure, protect and enforce our intellectual property rights could seriously harm our brand and adversely impact our business.
We may be sued by third parties for alleged infringement of their proprietary rights.
There is considerable patent and other intellectual property development activity in our industry. Our success depends upon our not infringing upon the intellectual property rights of others. Our competitors, as well as a number of other entities and individuals, may own or claim to own intellectual property relating to our industry. From time to time, third parties may claim that we are infringing upon their intellectual property rights, and we may be found to be infringing upon such rights. In the future, we may receive claims that our application suite and underlying technology infringe or violate the claimant’s intellectual property rights. However, we may be unaware of the intellectual property rights of others that may cover some or all of our technology or application suite. Any claims or litigation could cause us to incur significant expenses and, if successfully asserted against us, could require that we pay substantial damages or ongoing royalty payments, prevent us from offering our services, or require that we comply with other unfavorable terms. We may also be obligated to indemnify our customers or business partners in connection with any such litigation and to obtain licenses, modify products, or refund fees, which could further exhaust our resources. In addition, we may pay substantial settlement costs which could include royalty payments in connection with any such litigation and to obtain licenses, modify products, or refund fees, which could further exhaust our resources. In addition, we may pay substantial settlement costs which could include royalty payments in connection with any claim or litigation, whether or not successfully asserted against us. Even if we were to prevail, any litigation regarding our intellectual property could be costly and time-consuming and divert the attention of our management and key personnel from our business operations.
Our use of open source and third-party technology could impose limitations on our ability to commercialize our application suite.
We use open source software in our application suite. Although we monitor our use of open source software closely, the terms of many open source licenses have not been interpreted by United States courts, and there is a risk that such licenses could be construed in a manner that imposes unanticipated conditions or restrictions on our ability to market our application suite. In such event, we could be required to seek licenses from third parties in order to continue offering our application suite, to re-engineer our technology or to discontinue offering our application suite in the event re-engineering cannot be accomplished on a timely basis, any of which could adversely affect our business, operating results and financial condition. We also incorporate certain third-party technologies into our application suite and may desire to incorporate additional third-party technologies in the future. Licenses to new third-party technology may not be available to us on commercially reasonable terms, or at all.
Changes in laws and/or regulations related to the Internet or changes in the Internet infrastructure itself may cause our business to suffer.
The future success of our business depends upon the continued use of the Internet as a primary medium for commerce, communication and business applications. Federal, state or foreign government bodies or agencies have in the past adopted, and may in the future adopt, laws or regulations affecting data privacy and the use of the Internet as a commercial medium. In addition, government agencies or private organizations may begin to impose taxes, fees or other charges for accessing the Internet. These laws or charges could limit the growth of Internet-related commerce or communications generally, result in a decline in the use of the Internet and the viability of Internet-based applications such as ours and reduce the demand for our application suite.
27
Table of Contents
The Internet has experienced, and is expected to continue to experience, significant user and traffic growth, which has, at times, caused user frustration with slow access and download times. If the Internet infrastructure is unable to support the demands placed on it, or if hosting capacity becomes scarce, our business growth may be adversely affected. If we fail to meet service level commitments, customers may be entitled to credits, refunds to the extent of cash paid for future services, or termination.
Our business is subject to changing regulations regarding corporate governance and public disclosure that will increase both our costs and the risk of noncompliance.
As a public company, we incur significant legal, accounting and other expenses. In addition, the Sarbanes-Oxley Act, and rules subsequently implemented by the SEC and The NASDAQ Stock Market, have imposed a variety of requirements and restrictions on public companies, including requiring changes in corporate governance practices. In addition, the SEC and Congress are proposing additional significant corporate governance-related rules. Our management and other personnel will need to devote a substantial amount of time to these new compliance initiatives. Moreover, these rules and regulations will increase our legal and financial compliance costs and will make some activities more time-consuming and costly.
Changes in financial accounting standards or practices may cause adverse, unexpected financial reporting fluctuations and affect our reported results of operations.
A change in accounting standards or practices can have a significant effect on our reported results and may even affect our reporting of transactions completed before the change is effective. New accounting pronouncements and varying interpretations of accounting pronouncements have occurred and may occur in the future. Changes to existing rules or the questioning of current practices may adversely affect our reported financial results or the way we conduct our business.
If there are substantial sales of shares of our common stock, the price of our common stock could decline.
As of December 31, 2009, we had approximately 71.8 million shares of common stock outstanding. Substantially all of our outstanding shares of common stock are now freely tradable, subject to volume and other limitations under Rule 144 under the Securities Act in the case of stockholders who are our “affiliates.” The price of our common stock could decline if there are substantial sales of our common stock or if there is a large number of shares of our common stock available for sale.
If securities or industry analysts do not publish research or publish inaccurate or unfavorable research about our business, our stock price and trading volume could decline.
The trading market for our common stock will depend in part on the research and reports that securities or industry analysts publish about us or our business. Industry analysts that currently cover us may cease to do so. If industry analysts cease coverage of our company, the trading price for our stock would be negatively impacted. In the event one or more of the analysts who cover us downgrade our stock or publish inaccurate or unfavorable research about our business, our stock price would likely decline. If one or more of these analysts cease coverage of our company or fail to publish reports on us regularly, demand for our stock could decrease, which might cause our stock price and trading volume to decline.
Delaware law and provisions in our restated certificate of incorporation and restated bylaws could make a merger, tender offer or proxy contest difficult, which could depress the trading price of our common stock.
We are a Delaware corporation and the anti-takeover provisions of Delaware law may discourage, delay or prevent a change of control by prohibiting us from engaging in a business combination with an interested stockholder for a period of three years after the person becomes an interested stockholder, even if a change of
28
Table of Contents
control would be beneficial to our existing stockholders. In addition, our restated certificate of incorporation and restated bylaws contain provisions that may make the acquisition of our company more difficult without the approval of our Board of Directors, including the following:
| • | our Board of Directors is classified into three classes of directors with staggered three-year terms; |
| • | only our Chairperson of the Board of Directors, our Chief Executive Officer, our President or a majority of our Board of Directors are authorized to call a special meeting of stockholders; |
| • | our stockholders can only take action at a meeting of stockholders and not by written consent; |
| • | vacancies on our Board of Directors can be filled only by our Board of Directors and not by our stockholders |
| • | our restated certificate of incorporation authorizes undesignated preferred stock, the terms of which may be established and shares of which may be issued without stockholder approval; and |
| • | advance notice procedures apply for stockholders to nominate candidates for election as directors or to bring matters before an annual meeting of stockholders. |
| Item 1B. | Unresolved Staff Comments |
None.
| Item 2. | Properties |
We currently lease approximately 42,400 square feet of space for use as our headquarters, including operations and research and development activities, located in San Mateo, California. The lease for this space expires in December 2014.
We operate several data centers in the United States and Europe. Our primary data center is located in Chandler, Arizona. The hosting agreement for this facility expires in June 2011. Two additional data centers are located in Secaucus, New Jersey and Ashburn, Virginia. The hosting agreements for these facilities expire in September 2010 and July 2010, respectively. However, the Virginia data center is currently inactive. In addition, we operate two data centers in Amsterdam, The Netherlands. The hosting agreement for these facilities expires in August 2011.
We also lease space in various locations throughout the United States for local sales and professional services personnel. Our foreign subsidiaries lease office space for their operations, including their local sales and professional services personnel.
We believe that our current offices and facilities are adequate to meet our requirements for the foreseeable future.
29
Table of Contents
| Item 3. | Legal Proceedings |
From time to time, we are involved in a variety of claims, suits, investigations and proceedings arising from the ordinary course of our business, including actions with respect to intellectual property claims, breach of contract claims, labor and employment claims, tax and other matters. Although claims, suits, investigations and proceedings are inherently uncertain and their results cannot be predicted with certainty, we believe that the resolution of our current pending matters will not have a material adverse effect on our business, consolidated financial position, results of operations or cash flow. Regardless of the outcome, litigation can have an adverse impact on us because of defense costs, diversion of management resources and other factors. In addition, it is possible that an unfavorable resolution of one or more such proceedings could in the future materially and adversely affect our financial position, results of operations or cash flows in a particular period.
| Item 4. | Submission of Matters to a Vote of Security Holders |
No matters were submitted to a vote of our security holders during the fourth quarter of 2009.
30
Table of Contents
PART II
| Item 5. | Market for the Registrant’s Common Equity, Related Stockholder Matters and Issuer Purchases of Equity Securities |
Market for Our Common Stock and Related Stockholder Matters
Our common stock has been traded on The NASDAQ Global Market under the symbol “SFSF” since November 20, 2007. The following table summarizes the high and low sales prices for our common stock as reported by The NASDAQ Stock Market, for the period indicated:
| Fiscal Year 2009 Quarters Ended: |
High | Low | ||||
| March 31, 2009 |
$ | 8.00 | $ | 4.92 | ||
| June 30, 2009 |
10.50 | 7.15 | ||||
| September 30, 2009 |
14.63 | 8.27 | ||||
| December 31, 2009 |
17.49 | 13.61 | ||||
| Fiscal Year 2008 Quarters Ended: |
High | Low | ||||
| March 31, 2008 |
$ | 12.12 | $ | 7.49 | ||
| June 30, 2008 |
12.59 | 8.83 | ||||
| September 30, 2008 |
15.00 | 9.70 | ||||
| December 31, 2008 |
10.96 | 4.61 | ||||
As of February 19, 2010, we had approximately 81 stockholders of record, although we believe there are more beneficial owners.
31
Table of Contents
STOCK PRICE PERFORMANCE GRAPH
The following graph shows the total stockholder return of an investment of $100 in cash on November 20, 2007 through December 31, 2009, the last date of trading of fiscal 2009 for (1) our common stock, (2) Morgan Stanley Technology Index, and (3) the NASDAQ Composite Index. No cash dividends have been declared on shares of our common stock. Stockholder returns over the indicated period are based on historical data and are not necessarily indicative of future stockholder returns.
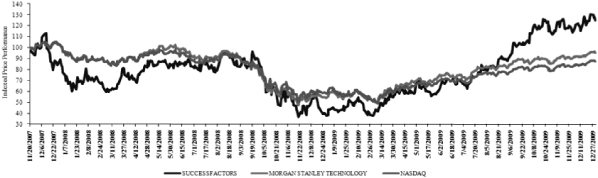
| November 20, 2007 | December 31, 2009 | |||||
| SuccessFactors |
$ | 100.00 | $ | 125.13 | ||
| Morgan Stanley Technology Index |
$ | 100.00 | $ | 95.50 | ||
| NASDAQ Composite Index |
$ | 100.00 | $ | 87.38 | ||
The information contained in the performance graph shall not be deemed to be “soliciting material” or “filed” with the SEC or subject to the liabilities of Section 18 of the Securities Exchange Act of 1934, as amended (the “Exchange Act”), except to the extent that we specifically incorporate it by reference into a document filed under the Securities Act of 1933, as amended (the “Securities Act”) or the Exchange Act.
The trading prices of the securities of technology companies have been and are expected to continue to be highly volatile. The market price of our common stock may fluctuate significantly in response to numerous factors, many of which are beyond our control, including:
| • | price and volume fluctuations in the overall stock market; |
| • | changes in operating performance and stock market valuations of other technology companies generally, or those in our industry in particular; |
| • | the impact of announcements related to the effects of the global economic downturn and programs intended to address it; |
| • | actual or anticipated fluctuations in our operating results; |
| • | the financial projections we may provide to the public, any changes in these projections or our failure to meet these projections; |
| • | changes in financial estimates by any securities analysts who follow our company, our failure to meet these estimates, or failure of those analysts to initiate or maintain coverage of our stock; |
| • | rating downgrades by any securities analysts who follow our company; |
| • | announcements by us or our competitors of significant technical innovations, acquisitions, strategic partnerships, joint ventures or capital commitments; |
32
Table of Contents
| • | the public’s response to our press releases or other public announcements, including our filings with the SEC; |
| • | market conditions or trends in our industry or the economy as a whole; |
| • | the loss of key personnel; |
| • | lawsuits threatened or filed against us; |
| • | future sales of our common stock by our executive officers, directors and significant stockholders; and |
| • | other events or factors, including those resulting from war, incidents of terrorism or responses to these events. |
In addition, the stock markets have experienced significant price and volume fluctuations that have affected and continue to affect the market prices of equity securities of many technology companies. Stock prices of many technology companies have fluctuated in a manner unrelated or disproportionate to the operating performance of those companies. In the past, stockholders have instituted securities class action litigation following a decline in stock price. If we were to become involved in securities litigation, it could subject us to substantial costs, divert resources and the attention of management from our business and adversely affect our business, operating results and financial condition.
EQUITY COMPENSATION PLAN INFORMATION
The following table summarizes information about our equity compensation plans as of December 31, 2009. All outstanding awards relate to our common stock.
| Plan Category |
(a) Number of Securities to be Issued Upon Exercise of Outstanding Options, Warrants and Rights(1) |
(b) Weighted-average Exercise Price of Outstanding Options, Warrants and Rights(2) |
(c) Number of Securities Remaining Available for Future Issuances Under Equity Compensation Plans (Excluding Securities Reflected in Column (a)) | ||||
| Equity compensation plans approved by security holders(1) |
12,268,516 | $ | 6.58 | 5,158,534 | |||
| Equity compensation plans not approved by security holders |
— | — | — | ||||
| Total |
12,268,516 | $ | 6.58 | 5,158,534 | |||
| (1) | Prior to our initial public offering, we issued securities under our 2001 Stock Option Plan. Following our initial public offering, we issued securities under our 2007 Equity Incentive Plan (“2007 Plan”) and we may issue stock awards, including but not limited to restricted stock awards, restricted stock units, stock bonus awards, stock appreciation rights and performance share awards under this plan. The 2007 Plan contains a provision that the number of shares available for grant and issuance will be increased on January 1 of each of 2008-2016 by an amount equal to 5% of our shares outstanding on the immediately preceding December, 31, unless our Board of Directors, in its discretion determines to make a smaller increase. |
| (2) | The weighted average exercise price does not reflect the shares that will be issued upon issuance of common stock under RSUs. |
33
Table of Contents
Dividend Policy
We have never declared or paid cash dividends on our capital stock. We currently intend to retain any future earnings and do not expect to pay any dividends in the foreseeable future. Any future determination to pay dividends on our capital stock will be at the discretion of our Board of Directors and will depend on our financial condition, results of operations, capital requirements and other factors that our Board of Directors considers relevant.
Use of Proceeds
The Form S-1 Registration Statement (Registration No. 333-144758) relating to our IPO was declared effective by the SEC on November 19, 2007, and the offering commenced November 19, 2007. As of December 31 2009, we used approximately $40.5 million of the proceeds from this offering for working capital. We expect to use the remaining net proceeds of this offering for general corporate purposes, including working capital and potential capital expenditures and acquisitions.
Our management will retain broad discretion in the allocation and use of the net proceeds of this offering, and investors will be relying on the judgment of our management regarding the application of the net proceeds. Pending specific utilization of the net proceeds as described above, we have invested the net proceeds of the offerings in short-term, interest-bearing obligations, investment grade securities, certificates of deposit or direct or guaranteed obligations of the United States. The goal with respect to the investment of the net proceeds is capital preservation and liquidity so that such funds are readily available to fund our operations.
34
Table of Contents
| Item 6. | Selected Financial Data |
We derived the statements of operations data for the years ended December 31, 2009, 2008 and 2007 and the balance sheet data as of December 31, 2009 and 2008 from our audited consolidated financial statements and related notes, which are included elsewhere in this Annual Report on Form 10-K. We derived the statements of operations data for the years ended December 31, 2006 and 2005 and the balance sheet data as of December 31, 2007, 2006 and 2005 from our audited consolidated financial statements and related notes which are not included in this Annual Report. The information set forth below is not necessarily indicative of results of future operations, is qualified by reference to, and should be read in conjunction with, Item 7, “Management’s Discussion and Analysis of Financial Condition and Results of Operations,” and the consolidated financial statements and related notes thereto included in Item 8 of this Annual Report on Form 10-K.
| Year Ended December 31, | ||||||||||||||||||||
| 2009 | 2008 | 2007 | 2006 | 2005 | ||||||||||||||||
| Consolidated Statement of Operations Data (in thousands, except per share data): |
||||||||||||||||||||
| Revenue |
$ | 153,054 | $ | 111,913 | $ | 63,350 | $ | 32,570 | $ | 13,028 | ||||||||||
| Cost of revenue(1) |
35,323 | 38,836 | 26,341 | 14,401 | 7,635 | |||||||||||||||
| Gross profit |
117,731 | 73,077 | 37,009 | 18,169 | 5,393 | |||||||||||||||
| Operating expenses:(1) |
||||||||||||||||||||
| Sales and marketing |
80,431 | 92,187 | 70,963 | 32,317 | 16,540 | |||||||||||||||
| Research and development |
24,427 | 23,085 | 16,725 | 10,622 | 6,120 | |||||||||||||||
| General and administrative |
24,995 | 24,744 | 19,091 | 7,483 | 3,624 | |||||||||||||||
| Gain on settlement of litigation, net |
— | (971 | ) | — | — | — | ||||||||||||||
| Total operating expenses |
129,853 | 139,045 | 106,779 | 50,422 | 26,284 | |||||||||||||||
| Loss from operations |
(12,122 | ) | (65,968 | ) | (69,770 | ) | (32,253 | ) | (20,891 | ) | ||||||||||
| Interest income (expense) and other, net(2) |
810 | 1,780 | (5,259 | ) | 249 | 80 | ||||||||||||||
| Loss before provision for income taxes |
(11,312 | ) | (64,188 | ) | (75,029 | ) | (32,004 | ) | (20,811 | ) | ||||||||||
| Provision for income taxes |
(1,322 | ) | (764 | ) | (425 | ) | (42 | ) | (9 | ) | ||||||||||
| Net loss |
$ | (12,634 | ) | $ | (64,952 | ) | $ | (75,454 | ) | $ | (32,046 | ) | $ | (20,820 | ) | |||||
| Net loss per common share, basic and diluted |
$ | (0.21 | ) | $ | (1.21 | ) | $ | (8.35 | ) | $ | (13.39 | ) | $ | (14.29 | ) | |||||
| Shares used in computing net loss per common share, basic and diluted |
59,534 | 53,803 | 9,036 | 2,393 | 1,457 | |||||||||||||||
| (1) | Includes stock-based compensation expenses as follows: |
| Year Ended December 31, | |||||||||||||||
| 2009 | 2008 | 2007 | 2006 | 2005 | |||||||||||
| Cost of revenue |
$ | 1,417 | $ | 1,053 | $ | 448 | $ | 94 | $ | 22 | |||||
| Sales and marketing |
4,451 | 4,084 | 2,269 | 351 | 129 | ||||||||||
| Research and development |
1,354 | 1,099 | 512 | 77 | 26 | ||||||||||
| General and administrative |
3,195 | 2,368 | 1,189 | 295 | 34 | ||||||||||
| $ | 10,417 | $ | 8,604 | $ | 4,418 | $ | 817 | $ | 211 | ||||||
| (2) | Interest income (expense) and other, net in 2007 included a $2.5 million expense related to the fair value adjustment of convertible preferred stock warrants through the date of our Initial Public Offering and a $1.9 million expense for amortization of debt issuance costs related to a warrant issued to a lender. |
35
Table of Contents
| As of December 31, | ||||||||||||||||||
| 2009 | 2008 | 2007 | 2006 | 2005 | ||||||||||||||
| Consolidated Balance Sheet Data (in thousands): |
||||||||||||||||||
| Cash, cash equivalents and marketable securities |
$ | 323,247 | $ | 102,364 | $ | 90,787 | $ | 26,172 | $ | 7,702 | ||||||||
| Working capital (deficit) |
209,571 | 3,882 | 25,871 | (5,087 | ) | (4,290 | ) | |||||||||||
| Total assets |
408,697 | 170,426 | 154,544 | 60,744 | 21,752 | |||||||||||||
| Deferred revenue, current and long-term |
181,624 | 149,798 | 101,010 | 52,354 | 25,212 | |||||||||||||
| Long-term debt |
— | — | — | 9,711 | — | |||||||||||||
| Convertible preferred stock warrant liability |
— | — | — | 1,496 | — | |||||||||||||
| Convertible preferred stock |
— | — | — | 45,289 | 20,383 | |||||||||||||
| Total stockholders’ equity (deficit) |
202,503 | (5,376 | ) | 19,943 | (64,095 | ) | (33,089 | ) | ||||||||||
36
Table of Contents
| Item 7. | Management’s Discussion and Analysis of Financial Condition and Results of Operations |
The following Management’s Discussion and Analysis of Financial Condition and Results of Operations is intended to facilitate an understanding of our business and results of operations. You should read the following discussion and analysis of our financial condition in conjunction with the consolidated financial statements and notes thereto for the year ended December, 31, 2009 included in Item 8, “Financial Statements and Supplementary Data,” in this Annual Report on Form 10-K. The information contained in this discussion and analysis or set forth elsewhere in this Annual Report on Form 10-K, including without limitation information with respect to our plans and strategy of our business and our financial condition, includes forward-looking statements within the meaning of Section 27A of the Securities Act of 1933, as amended, and Section 21E of the Securities Exchange Act of 1934, as amended. Such statements are based upon current expectations that involve risks and uncertainties. You should review the section titled “Risk Factors” included in Item 1A of Part I of this Annual Report on Form 10-K for a discussion of important factors that could cause actual results to differ materially from the results described in or implied by the forward-looking statements contained in the following discussion and analysis.
Overview
SuccessFactors provides cloud-based Business Execution software solutions that enable organizations to bridge the gap between business strategy and results. Our goal is to enable organizations to substantially increase employee productivity worldwide by enhancing our existing People Performance solutions with Business Alignment solutions to enable customers to achieve business results. Our integrated application suite includes the following modules and capabilities: Performance Management; Goal Management; Compensation Management; Succession Management; Learning and Development; Recruiting Management; Analytics and Reporting; Employee Profile; 360-Degree Review; Execution Survey; Stack Ranker; Business Performance Accelerators; Employee Central; Metrics Navigator; Strategy Deployment and proprietary and third-party content. We deliver our application suite to organizations of all sizes across all industries and geographies. During the past twelve months our customer base has grown from 1,750 to more than 3,100 customers, across 61 industries in over 185 countries with more than 6.0 million end users.
We generate sales primarily through our global direct sales organization and, to a much lesser extent, indirectly through channel partners, with sales through channel partners constituting approximately 6% of revenue for the twelve months ended December 31, 2009. However, in the future we anticipate that revenue from channel partners will increase. For the twelve months ended December 31, 2009, we did not have any single customer that accounted for more than 5% of our revenue. We target our sales and marketing efforts at large enterprises as well as small and mid-sized organizations.
Historically, most of our revenue has been from sales of our application suite to organizations located in the United States. For the twelve months ended December 31, 2009, the percentage of our revenue generated from customers in the United States was 83%. We intend to continue to grow our international business. Accordingly, we expect the percentage of our revenue generated outside of the United States to continue to increase.
We have historically experienced significant seasonality in sales of subscriptions to our application suite, with a higher percentage of our customers renewing or entering into new subscription agreements in the fourth quarter of the year. Also, a significant percentage of our customer agreements within a given quarter are generally entered into during the last month of the quarter. We have derived a significant portion of our historical revenue from sales of our Performance Management and Goal Management modules, but the percentage of revenue from these modules has decreased over time as customers have purchased additional modules.
We believe the market for Business Execution software is large and underserved. Accordingly, we might incur additional operating expenses, particularly for sales and marketing and professional services activities to pursue this opportunity, and in research and development to develop new products. We expect operating losses to
37
Table of Contents
continue but at lower rates as we intend to continue to pursue new customers, develop new products and acquire or invest in businesses, products or technologies that we believe could complement or expand our application suite, enhance our technical capabilities or otherwise offer growth opportunities.
While we have experienced strong growth in revenues in recent periods, the overall global economy has experienced a severe downturn, with the United States and many other countries experiencing slow overall growth in 2008 and 2009. This weakening of the overall global economy has affected customers demand for our software and services. In fiscal year 2010 we believe we could possibly see an improvement in customer demand and therefore billings growth in comparison to what we experienced in 2009. However, due to the ratable nature of our revenue stream, 2010 revenue will be strongly influenced by customer activity that occurred in 2009. As a result, we expect revenue growth to continue in 2010, but most likely at a slower rate than the growth we experienced in 2009 even if customer demand does begin to improve.
Unstable or declining economic conditions make it difficult for our customers and potential customers to accurately forecast and plan future business activities and has caused and could continue to cause our customers and potential customers to slow or reduce spending on our application suite. Furthermore, during challenging economic times, our customers may face issues gaining timely access to sufficient credit, which could impact their willingness to make purchases or their ability to make timely payments to us. If that were to occur, we may experience decreased sales and/or be required to increase our allowance for doubtful accounts and our days sales outstanding could be negatively impacted. We cannot predict the timing, strength or duration of the current economic slowdown or any subsequent economic recovery, worldwide, in the United States, or in our industry. As a result, it is inherently difficult to predict how the current economic conditions will affect our business. These and other economic factors could have a material adverse affect on our ability to predict future operating results, on demand for our application suite, including new bookings and renewal and upsell rates, and on our financial condition and operating results.
Sources of Revenue
We generate revenue from subscription fees from customers accessing our application suite and other services fees, which primarily consist of fees for implementation services and, to a lesser extent, fees for enhanced support, business consulting and other services. Our subscription agreements are noncancelable, though customers typically have the right to terminate their agreements for cause if we materially fail to perform. During 2008 through 2009, our customer retention rate was greater than 90%, excluding our Manager’s Edition application which provides us with an insignificant amount of revenue. We calculate our customer retention rate by subtracting our attrition rate from 100%. We calculate our attrition rate for a period by dividing the number of customers lost during the period by the sum of the number of customers at the beginning of the period and the number of new customers acquired during the period. Although historically there has been very little variability in our retention rates, any decrease in our retention rates could negatively impact our results of operations in future periods.
Cost of Revenue
Cost of revenue primarily consists of costs related to hosting our application suite, delivering our professional services and on-going customer support. These costs include salaries, benefits, bonuses and stock-based compensation of our data center, professional services and customer support staff, outside service provider costs, data center and networking expenses, third party royalty and referral costs and allocated overhead and depreciation expenses. We allocate overhead such as rent, information technology costs and employee benefits costs to all departments based on relative headcount. As such, general overhead expenses are reflected in cost of revenue and each operating expense category. The costs associated with providing professional services are significantly higher as a percentage of revenue than the costs associated with delivering our application suite due to the labor costs associated with providing professional services. As such, the costs of implementing a new customer on our application suite or adding new modules for an existing customer are more significant than renewing a customer on existing modules.
38
Table of Contents
Our cost of revenue as a percentage of revenue has generally decreased during 2007, 2008 and 2009. Our cost of revenue as a percentage of revenue was 42% in 2007, 35% in 2008 and 23% in 2009. We expect that in the future, cost of revenue may increase depending on the growth rate of our new bookings and our need to support the implementation, hosting and support of those new bookings. We also expect that cost of revenue as a percentage of revenue could fluctuate from period to period depending on growth of our professional services business and any associated costs relating to the delivery of professional services, the timing of sales of products that have royalty and referrals associated with them and the timing of significant expenditures. To the extent that our customer base grows, we intend to continue to invest additional resources in expanding the delivery capability of our application suite and other services. The timing of these additional expenses could affect our cost of revenue, both in terms of absolute dollars and as a percentage of revenue, in any particular quarterly or annual period.
Operating Expenses
We classify our operating expenses as follows:
Sales and Marketing. Sales and marketing expenses consist primarily of personnel and related expenses for our sales and marketing staff, including salaries, benefits, bonuses and stock-based compensation, commissions, travel costs, and marketing and promotional events, corporate communications, advertising, other brand building and product marketing expenses, and allocated overhead. Our sales and marketing expenses, as a percentage of revenue were 112% in 2007, 82% in 2008 and 53% in 2009. We intend to continue to invest in sales and marketing and expect the spending to increase modestly in 2010 and future periods as we continue to expand our business on a worldwide basis. We expect sales and marketing expense to continue to be our largest operating expense. Over the long term, we believe that sales and marketing expenses as a percentage of revenue will decrease, but vary depending on the mix of revenue from new and existing customers and from small, mid-sized and enterprise customers, as well as the productivity of our sales and marketing programs and our sales representatives and the respective sales commission expenses.
Research and Development. Research and development expenses consist primarily of personnel and related expenses for our research and development staff, including salaries, benefits, bonuses and stock-based compensation, the cost of certain third-party service providers and allocated overhead. Research and development expenses as a percentage of revenue were 26% in 2007, 21% in 2008 and 16% in 2009. We have focused our research and development efforts on expanding the functionality and enhancing the ease of use of our application suite. We expect research and development expenses to increase at a faster pace in 2010 and future periods as we intend to release new features and functionality on a frequent basis, expand our content offerings and continue to localize our application suite in various languages, upgrade and extend our service offerings, and develop new technologies.
General and Administrative. General and administrative expenses consist primarily of personnel and related expenses for executive, legal, finance and human resources, including wages, benefits, bonuses and stock-based compensation, professional fees, insurance premiums, other corporate expenses and allocated overhead. General and administrative expenses as a percentage of revenue were 30% in 2007, 22% in 2008 and 16% in 2009. General and administrative expenses as a percentage of revenue may increase or decrease as we continue to leverage our existing general and administrative personnel, professional fees and other expenses to support our anticipated growth. We expect general and administrative expenses in absolute dollars to increase at a faster pace in 2010 and future periods as we continue to support our business and acquisitions.
Income Taxes
As part of the process of preparing the Consolidated Financial Statements, we are required to estimate income taxes in each of the jurisdictions in which we operate. This process involves estimating the current tax liability under the most recent tax laws and assessing temporary differences resulting from differing treatment of items for tax and accounting purposes. These differences result in deferred tax assets and liabilities, which are included in the Consolidated Balance Sheets.
39
Table of Contents
Critical Accounting Policies and Estimates
Our consolidated financial statements and the related notes included elsewhere in this Form 10-K are prepared in accordance with accounting principles generally accepted in the United States. The preparation of these consolidated financial statements requires us to make estimates and assumptions that affect the reported amounts of assets, liabilities, revenue, costs and expenses and related disclosures. We base our estimates on historical experience and on various other assumptions that we believe to be reasonable under the circumstances. In many instances, we could have reasonably used different accounting estimates, and in other instances changes in the accounting estimates are reasonably likely to occur from period to period. Accordingly, actual results could differ significantly from the estimates made by our management. On an ongoing basis, we evaluate our estimates and assumptions. To the extent that there are material differences between these estimates and actual results, our future financial statement presentation, financial condition, results of operations and cash flows will be affected.
We believe that the following critical accounting policies involve a greater degree of judgment and complexity than our other accounting policies. Accordingly, these are the policies we believe are the most critical to aid in fully understanding and evaluating our consolidated financial condition and results of operations.
Revenue Recognition
Revenue consists of subscription fees for our on-demand software and fees for the provision of other services. Our customers do not have the contractual right to take possession of software in substantially all of the transactions. Instead, the software is delivered on an on-demand basis from our hosting facilities. Therefore, these arrangements are treated as service agreements. We commence revenue recognition when all of the following conditions are met:
| • | there is persuasive evidence of an arrangement; |
| • | the subscription or services have been delivered to the customer; |
| • | the collection of related fees is reasonably assured; and |
| • | the amount of related fees is fixed or determinable. |
Additionally, if an agreement contains non-standard acceptance or non-standard performance criteria to be met, we defer revenues until the satisfaction of these conditions.
Signed agreements are used as evidence of an arrangement. We assess cash collectability based on a number of factors such as past collection history with the customer and creditworthiness of the customer. If we determine that collectability is not reasonably assured, we defer the recognition of revenue until collectability becomes reasonably assured, generally upon receipt of cash. We assess whether the fee is fixed or determinable based on the payment terms associated with the transaction and whether the sales price is subject to refund or adjustment. Our arrangements are typically noncancelable, though customers typically have the right to terminate their agreement for cause if we fail to perform.
Our other services include implementation assistance, including installation and training related to the application suite. These other services are generally sold in conjunction with our subscriptions, and we have determined that we have neither stand-alone value for the installation services nor objective and reliable evidence of fair value for each element of our arrangements. As a result, these other services are not accounted for separately from our subscriptions. As these other services do not qualify for separate accounting, we recognize the other services revenue together with the subscription fees ratably over the contract term of the subscription agreement, generally one to three years although terms can extend to as long as five years, commencing on the later of the start date specified in the subscription arrangement, the date the customer’s instance is provisioned (“initial access date”) or when all of the revenue recognition criteria have been met. We generally consider delivery to have occurred on the initial access date, which is the point in time that a customer is provided access
40
Table of Contents
to use our on-demand application suite. In the infrequent circumstance in which a customer has the contractual right to take possession of the software, we have determined that the customer would incur a significant penalty to take possession of the software. Therefore, these agreements have been accounted for as service contracts. Indirect taxes, including sales and use tax amounts and goods and service tax amounts, collected from customers have been recorded on a net basis.
Accounting for Commission Payments
We defer commissions that are the incremental costs that are directly associated with noncancelable service contracts and consist of sales commissions paid to our direct sales force. The commissions are deferred and amortized over the noncancelable terms of the related customer agreements. The deferred commission amounts are recoverable from the future revenue streams under the customer agreements. We believe this is the appropriate method of accounting, as the commission costs are so closely related to the revenue from the customer agreements that they should be recorded as an asset and charged to expenses over the same period that the related revenue is recognized. If we did not defer these commission payments, we would expense them up front upon entering into the customer agreement. Amortization of deferred commissions is included in sales and marketing expenses.
During 2008, we capitalized $7.0 million of deferred commissions and amortized $6.6 million to sales and marketing expenses. During 2009, we capitalized $10.6 million of deferred commissions and amortized $7.4 million to sales and marketing expenses. As of December 31, 2009, deferred commissions on our consolidated balance sheet totaled $15.2 million.
Accounting for Stock-Based Awards
We measure all share-based payments to employees, including grants of stock options, based on the grant date fair value of the awards and recognize these amounts in our consolidated statement of operations over the period during which the employee is required to perform services in exchange for the award (generally over the vesting period of the award). We amortize the fair value of share-based payments on a straight-line basis. We have never capitalized stock-based employee compensation cost or recognized any tax benefits related to these costs.
To estimate the fair value of an award, we use the Black-Scholes pricing model. This model requires inputs such as expected term, expected volatility and risk-free interest rate. These inputs are subjective and generally require significant analysis and judgment to develop. For all grants during 2007, 2008 and 2009, we calculated the expected term based on our historical experience from previous stock option grants. We estimate the volatility of our common stock by analyzing our historical volatility and considering volatility data of our peer group and their implied volatility. We estimate the forfeiture rate based on historical experience of our stock-based awards that are granted, exercised, and cancelled.
We will continue to use judgment in evaluating the expected term, volatility and forfeiture rate related to our own stock-based compensation on a prospective basis, and incorporate these factors into the Black-Scholes pricing model. As a result, if factors change, our stock-based compensation expense could be materially different in the future. We recorded stock-based compensation of $4.4 million, $8.6 million and $10.4 million during 2007, 2008 and 2009, respectively.
Allowance for Doubtful Accounts
Based on a review of the current status of our existing accounts receivable and historical collection experience, we have established an estimate of our allowance for doubtful accounts. We make judgments as to our ability to collect outstanding receivables and provide allowances for the portion of receivables when collection becomes doubtful. Provisions are made based upon a specific review of all significant outstanding invoices. For those invoices not specifically reviewed, provisions are provided based on our collection history
41
Table of Contents
and current economic trends. As a result, if our actual collections are lower than expected, additional provisions for doubtful accounts may be needed and our future results of operations and cash flows could be negatively affected. Write-offs of accounts receivable and recoveries were not significant during each of 2007, 2008 and 2009.
Results of Operations
The following table sets forth selected consolidated statements of operations data for the specified periods as a percentage of revenue for each of those periods. The period-to-period comparison of financial results is not necessarily indicative of future results.
| Year Ended December 31, | |||||||||
| 2009 | 2008 | 2007 | |||||||
| Revenue |
100 | % | 100 | % | 100 | % | |||
| Cost of revenue |
23 | 35 | 42 | ||||||
| Gross margin |
77 | 65 | 58 | ||||||
| Operating expenses: |
|||||||||
| Sales and marketing |
53 | 82 | 112 | ||||||
| Research and development |
16 | 21 | 26 | ||||||
| General and administrative |
16 | 22 | 30 | ||||||
| Gain on settlement of litigation, net |
— | (1 | ) | — | |||||
| Total operating expenses |
85 | 124 | 168 | ||||||
| Loss from operations |
(8 | ) | (59 | ) | (110 | ) | |||
| Interest income (expense) and other, net |
1 | 2 | (8 | ) | |||||
| Loss before provision for income taxes |
(7 | ) | (57 | ) | (118 | ) | |||
| Provision for income taxes |
(1 | ) | (1 | ) | (1 | ) | |||
| Net loss |
(8 | )% | (58 | )% | (119 | )% | |||
Due to rounding to the nearest percent, totals may not equal the sum of the line items in the table above.
Year Ended December 31, 2009, 2008 and 2007
Revenue
| Year Ended December 31, | |||||||||
| 2009 | 2008 | 2007 | |||||||
| (Dollars in thousands) | |||||||||
| Revenue |
$ | 153,054 | $ | 111,913 | $ | 63,350 | |||
2009 Compared to 2008. Revenue increased primarily due to a $40.8 million increase from existing customers as a result of increased focus on selling to existing customers. Revenue from existing customers includes renewals and subscriptions for additional modules and end users. In addition, revenue from new customers increased $0.3 million. As of December 31, 2009, we had approximately 3,100 customers, as compared to 2,608 at December 31, 2008. In the future, we expect the revenue from existing customers to increase at a higher rate than from new customers.
Revenue from customers in the United States accounted for $126.6 million, or 83% of revenue, in 2009, compared to $96.0 million, or 86% of revenue, in 2008.
42
Table of Contents
2008 Compared to 2007. Revenue increased primarily due to a $29.8 million increase in revenue from existing customers and a $18.8 million increase from new customers. As of December 31, 2008, we had over 2,600 customers, as compared to 1,750 at December 31, 2007.
Revenue from customers in the United States accounted for $96.0 million or 86%, of revenue in 2008, compared to $57.3 million, or 90% of revenue, in 2007.
Cost of Revenue and Gross Margin
| Year Ended December 31, | ||||||||||||
| 2009 | 2008 | 2007 | ||||||||||
| (Dollars in thousands) | ||||||||||||
| Revenue |
$ | 153,054 | $ | 111,913 | $ | 63,350 | ||||||
| Cost of revenue |
35,323 | 38,836 | 26,341 | |||||||||
| Gross profit |
$ | 117,731 | $ | 73,077 | $ | 37,009 | ||||||
| Gross margin |
77 | % | 65 | % | 58 | % | ||||||
2009 Compared to 2008. The decrease in cost of revenue was primarily driven by a shift in revenue mix. Revenue from existing customers has a lower cost of revenue compared to revenue generated from new business. In addition, employee-related costs decreased by $3.7 million due to lower headcount, professional and outside services decreased by $1.1 million, and travel and entertainment decreased by $0.3 million. These decreases were offset by an increase of $0.6 million in license royalties and partner referral fees, an increase of $0.5 million related to operating our data centers, and an increase of $0.5 million in outside maintenance. Gross margin increased from 65% for 2008 to 77% for 2009. The increase in gross margin was primarily due to increased revenue, increased renewals, which have lower cost of revenue as a percentage of revenue, and a larger customer base over which to spread fixed costs. We expect cost of revenue to increase in dollars and as a percentage of revenues in 2010 and future periods as we continue to support additional customers.
2008 Compared to 2007. Cost of revenue increased primarily due to an increase of $8.1 million in employee-related costs, which includes an increase of $0.6 million in stock-based compensation expense, an increase of $1.5 million related to operating a new data center, an increase of $1.4 million in license royalties and partner referral fees, an increase of $0.5 million in depreciation expense, an increase of $0.4 million in customer training material due to an increased number of customers, and to a lesser extent, an increase in travel and entertainment, outside services and software expenses. Gross margin increased from 58% for 2007 to 65% for 2008. This increase in gross margin was primarily due to increased revenue, increased renewals, which have lower cost of revenue as a percentage of revenue, and a larger customer base over which to spread fixed costs.
Sales and Marketing
| Year Ended December 31, | ||||||||||||
| 2009 | 2008 | 2007 | ||||||||||
| (Dollars in thousands) | ||||||||||||
| Sales and marketing |
$ | 80,431 | $ | 92,187 | $ | 70,963 | ||||||
| Percent of revenue |
53 | % | 82 | % | 112 | % | ||||||
2009 Compared to 2008. Sales and marketing expenses decreased primarily due to a $5.7 million decrease in employee-related costs due to lower headcount, a decrease of $4.7 million in marketing and promotional spending, and to a lesser extent, a decrease in allocated overhead costs, facilities, depreciation and travel and entertainment costs. We expect sales and marketing spending to increase modestly in 2010 and future periods as we continue to expand our business on a worldwide basis.
43
Table of Contents
2008 Compared to 2007. Sales and marketing expenses increased primarily due to an increase of $9.5 million in employee-related costs, of which $1.8 million was an increase in stock-based compensation, an increase of $5.5 million in marketing and promotional spending, an increase of $4.8 million in sales commission expenses, as a result of increased revenue, and an increase of $1.5 million in allocated overhead costs. In addition, an increase of $0.5 million in travel and entertainment and an increase of $0.3 million in depreciation expense were offset by a decrease of $0.8 million in outside professional services.
Research and Development
| Year Ended December 31, | ||||||||||||
| 2009 | 2008 | 2007 | ||||||||||
| (Dollars in thousands) | ||||||||||||
| Research and development |
$ | 24,427 | $ | 23,085 | $ | 16,725 | ||||||
| Percent of revenue |
16 | % | 21 | % | 26 | % | ||||||
2009 Compared to 2008. Research and development expenses increased primarily due to $0.5 million increase in employee-related costs, which includes an increase of $1.4 million in bonus accrual, which was offset by cost savings from offshoring some of our research and development efforts. In addition, there was an increase of $0.5 million in outside services, and an increase of $0.3 million in allocated expenses. We expect research and development costs to increase at a faster pace in 2010 and future periods, as we continue to expand our offshore research and development efforts.
2008 Compared to 2007. Research and development expenses increased primarily due to an increase of $4.1 million in employee-related costs, which includes an increase of $0.6 million of stock-based compensation expense, as a result of an increase in research and development personnel to expand product functionality and localize our application suite into various languages. In addition, there was an increase of $1.7 million in outside services, and an increase of $0.6 million in allocated expenses.
General and Administrative
| Year Ended December 31, | ||||||||||||
| 2009 | 2008 | 2007 | ||||||||||
| (Dollars in thousands) | ||||||||||||
| General and administrative |
$ | 24,995 | $ | 24,744 | $ | 19,091 | ||||||
| Percent of revenue |
16 | % | 22 | % | 30 | % | ||||||
2009 Compared to 2008. General and administrative expenses increased primarily due to an increase of $0.7 million in employee-related costs, which includes a $1.4 million increase in bonus accrual, partially offset by a decrease in salaries, employee benefits and other employee related costs due to lower headcount. The increase in employee-related costs was partially offset by a decrease in professional and outside services. We expect general and administrative expense to increase at a faster pace in 2010 and future periods as we continue to invest in our business and acquisitions.
2008 Compared to 2007. General and administrative expenses increased primarily due to an increase of $3.3 million in employee-related costs, which includes an increase of $1.2 million in stock-based compensation expense, as a result of an increase in general and administrative headcount. In addition, there was an increase of $1.3 million in accounting and tax fees, $0.7 million in depreciation and $0.4 million in telecommunication expense. The additional personnel, professional services and accounting and tax fees were primarily the result of the growth of our business and the incremental expenses associated with the first year of Sarbanes-Oxley compliance efforts.
44
Table of Contents
Interest Income (Expense) and Other, Net
| Year Ended December 31, | |||||||||
| 2009 | 2008 | 2007 | |||||||
| (Dollars in thousands) | |||||||||
| Interest income (expense) and other, net |
810 | 1,780 | (5,259 | ) | |||||
| Percent of revenue |
1 | % | 2 | % | (8 | )% | |||
2009 Compared to 2008. Interest income (expense) and other, net decreased, primarily due to a $1.7 million decrease in interest income as a result of lower interest rates, partially offset by an increase in net foreign exchange gain of $0.9 million.
2008 Compared to 2007. Interest income (expense) and other, net increased primarily due to a $4.1 million decrease in interest expense as a result of repayment in full of the line of credit in November 2008, and a $1.7 million decrease in other income (expense), primarily due to absence of fair value expense of $2.5 million of a convertible preferred stock warrant that was outstanding in 2007, which was partially offset by foreign exchange gain of $0.8 million in 2008. In addition, interest income increased by $1.2 million, primarily due to higher cash balances in 2008, which includes the proceeds from our follow-on public offering in the second quarter of 2008.
Provision for Income Taxes
We have incurred operating losses in all periods to date and, accordingly, have not recorded a provision for income taxes for any of the periods presented other than provisions for certain state taxes and foreign income taxes. As of December 31, 2009, we had net operating loss carryforwards for federal and state income tax purposes of approximately $146.3 million and $151.8 million, respectively. In connection with our adoption of ASC 718, Stock Compensation, we use the ‘with-and-without’ approach described in ASC 740, Income Taxes, to determine the recognition and measurement of excess tax benefits. Accordingly, we have elected to recognize excess income tax benefits from stock option exercises in additional paid-in capital only if an incremental income tax benefit would be realized after considering all other tax attributes presently available to us. As of December 31, 2009, the amount of such excess tax benefits from stock options included in net operating losses was $14.5 million. In addition, we have elected to account for the indirect effects of stock-based awards on other tax attributes, such as the research and alternative minimum tax credits, through the income statement. As of December 31, 2009, the Company had U.S. federal and state research and development tax credit carryforwards of approximately $2.4 million and $2.4 million, respectively. The Company also has foreign tax credits of approximately $0.3 million which will expire between 2016 and 2017 if not utilized. Realization of deferred tax assets depends upon future earnings, if any, the timing and amount of which are uncertain. Accordingly, we have offset all of our net deferred tax assets by a valuation allowance. If not utilized, our federal net operating loss and tax credit carryforwards will begin to expire in 2021, and our state net operating losses will begin to expire in 2013. Our state research and development tax credit carryforwards will carry forward indefinitely if not utilized. For the year ended December 31, 2009, the utilization of California net operating loss is not allowed due to the suspension of California net operating loss. In addition, the utilization of our net operating loss could be subject to substantial annual limitation as a result of certain future events, such as acquisition or other significant equity events, which may be deemed as a “change in ownership” under the provisions of the Internal Revenue Code of 1986, as amended and similar state provisions. The annual limitations could result in the expiration of net operating losses and tax credits before utilization.
Liquidity and Capital Resources
To date, substantially all of our operations have been financed through the sale of equity securities, including net cash proceeds in connection with our initial public offering of common stock completed in the fourth quarter of 2007 of approximately $104.6 million, after deducting underwriting discounts and commissions
45
Table of Contents
and offering costs. In June 2008, we completed a public offering raising approximately $27.4 million in net proceeds after deducting underwriting discounts and commissions of $1.5 million and other offering expenses of approximately $0.6 million. In October 2009, we completed a follow-on public offering raising approximately $203.0 million in net proceeds, after deducting underwriting discounts and commissions of $10.4 million and other offering expenses of approximately $0.5 million. In addition, we have been generating cash flow from operations since the fourth quarter of 2008.
The following table sets forth a summary of our cash flows for the periods indicated (in thousands):
| Year Ended December 31, | ||||||||||||
| 2009 | 2008 | 2007 | ||||||||||
| Net cash provided by (used in) operating activities |
$ | 15,400 | $ | (12,025 | ) | $ | (28,468 | ) | ||||
| Net cash used in investing activities |
(216,788 | ) | (28,706 | ) | (14,018 | ) | ||||||
| Net cash provided by financing activities |
208,024 | 28,493 | 98,541 | |||||||||
Net Cash Provided by (Used in) Operating Activities
Our cash flows from operating activities are significantly influenced by the amount of cash we invest in personnel and infrastructure to support the anticipated growth of our business, increases in the number of customers using our application suite and the amount and timing of customer payments. Cash provided by (used in) operating activities has historically resulted from losses from operations, the add back of non-cash expense items such as depreciation and amortization of fixed assets, amortization of deferred commissions, and expense associated with stock-based compensation awards, and changes in working capital accounts.
Cash provided by operating activities during 2009 consisted of a net loss of $12.6 million due primarily to the significant investments we incurred to grow our business, adjusted for $14.3 million of non-cash depreciation, amortization and stock-based compensation expenses, and $7.4 million for the amortization of deferred commissions. During 2009, we experienced significant increases in deferred commissions and deferred revenue as a result of the growth in our business. The increase in our deferred revenue of $31.8 million contributed to cash provided by operating activities, although this was partially offset by a $10.6 million increase in deferred commissions. The increase in accrued employee compensation of $2.4 million, primarily due to the bonus accrual for 2009, and to a lesser extent an increase in long-term tax payable and other liabilities, were offset by $13.2 million increase in accounts receivable, due to increased revenue, $2.7 million decrease in accounts payable and accrued expenses and other current liabilities, and $2.5 million increase in prepaid expenses and other current assets.
We used $12.0 million of cash in operating activities during 2008. The cash usage was primarily from a net loss of $65.0 million due primarily to the significant investments we incurred to grow our business, adjusted for $12.5 million of non-cash depreciation, amortization and stock-based compensation expenses, and a $6.6 million non-cash expense for the amortization of deferred commissions. During 2008, we experienced significant increases in deferred commissions and deferred revenue as a result of the growth in our business. The increase in our deferred revenue of $48.8 million contributed to cash provided by operating activities, although this was partially offset by a $7.0 million increase in deferred commissions. We used $7.1 million of cash in operations resulting from a decrease in accrued employee compensation of $6.1 million, an increase in accounts receivable of $2.4 million, and a decrease in accounts payable of $1.6 million, which was partially offset by a $3.0 million increase in accrued expenses and other accrued liabilities.
We used $28.5 million of cash in operating activities during 2007. The cash usage was primarily from a net loss of $75.5 million due primarily to the significant investments we incurred to grow our business, adjusted for $6.6 million of non-cash depreciation, amortization and stock-based compensation expenses, a $4.1 million non-cash expense for the amortization of deferred commissions, a $2.5 million charge associated with the increase to the fair value of our convertible preferred stock warrants and $1.9 million of amortization of debt
46
Table of Contents
issuance costs. During 2007, we experienced significant increases in accounts receivable, deferred commissions, deferred revenue and accrued employee compensation as a result of the growth in our business. The increase in our deferred revenue of $48.7 million contributed to cash provided by operating activities, although this was partially offset by a $10.0 million increase in deferred commissions. The increase in accounts receivable used cash of $19.3 million while the increase in accrued employee compensation related to the expansion of our work force provided $6.7 million to partially offset the increase in accounts receivable. Increases in accrued expenses and accounts payable related to increased operating costs and our better utilization of payment terms contributed $6.0 million to cash.
Net Cash Used in Investing Activities
We used $216.8 million of cash in investing activities during 2009. This use of cash primarily resulted from $323.5 million of purchases of available-for-sale securities and $2.8 million in capital expenditures related to purchases of additional equipment for our expanding infrastructure and work force, partially offset by $4.5 million in sales and $104.7 million in maturities of available-for-sale securities. Other uses of cash related to restricted cash for leased space and credit cards during 2009.
We used $28.7 million of cash in investing activities during 2008. This use of cash primarily resulted from $78.1 million of purchases of available-for-sale securities and $4.5 million in capital expenditures related to purchases of additional equipment for our expanding infrastructure and work force, partially offset by $8.0 million in sales and $46.2 million in maturities of available-for-sale securities. Other uses of cash related to restricted cash for leased space and credit cards during 2008.
We used $14.0 million of cash in investing activities during 2007. This use of cash primarily resulted from $11.2 million of purchases of available-for-sale securities, partially offset by $2.7 million in sales of available-for-sale securities, and $5.5 million in capital expenditures related to purchases of additional equipment for our expanding infrastructure and work force.
Net Cash Provided by Financing Activities
Cash provided by financing activities in 2009 of $208.0 million was due primarily to net proceeds of $203.0 million from a follow-on public offering completed in October 2009 and proceeds from the exercise of stock options of $5.0 million.
Cash provided by financing activities in 2008 of $28.5 million was due primarily to net proceeds of $27.4 million from a public offering and proceeds from the exercise of stock options of $1.5 million offset by payments of $0.5 million related to offering costs from our public offering paid during the year.
In the fourth quarter of 2007, we completed our initial public offering issuing 11,618,500 shares of common stock and had net proceeds of approximately $104.6 million, after deducting underwriting discounts and commissions and offering costs. During 2006, we had entered into a loan and security agreement for a line of credit to borrow up to $20.0 million. We borrowed $10.0 million under this agreement in September 2007. We repaid the entire principal amount of $20.0 million plus interest and prepayment penalties of $1.3 million upon completion of our initial public offering. We also generated an additional $5.2 million in proceeds received from the exercise of stock options including $4.7 million from the early exercise of stock options.
Capital Resources
We believe our existing cash, cash equivalents and marketable securities and currently available resources will be sufficient to meet our working capital and capital expenditure needs over the next 12 months. Our future capital requirements will depend on many factors, including our rate of revenue and bookings growth, the level of our sales and marketing activities, the timing and extent of spending to support product development efforts
47
Table of Contents
and expansion into new territories, the timing of introductions of new services and enhancements to existing services, the timing of general and administrative expenses as we grow our administrative infrastructure, and the continuing market acceptance of our application suite. Our capital expenditures in 2010 are expected to grow in line with business activities. To the extent that existing cash and cash from operations are not sufficient to fund our future activities, we may need to raise additional funds through public or private equity or debt financing. On February 4, 2010, we announced that we had entered into a definitive agreement to acquire Inform, a privately held company focused on performance measurement and workforce planning software. We anticipate closing this transaction in July of 2010 and that we will pay approximately $25 million in cash and issue approximately 907,000 shares of common stock as consideration for 100% of the outstanding shares of Inform.
Off-Balance Sheet Arrangements
We do not have any special purpose entities and, other than operating leases for office space and computer equipment which are described below, we do not engage in off-balance sheet financing arrangements.
Contractual Obligations
Our principal commitments consist of obligations under leases for our office space, computer equipment and furniture and fixtures; and contractual commitments for hosting and other support services. The following table summarizes our contractual obligations as of December 31, 2009:
| Payment Due by Period | |||||||||||||||
| Total | Less than 1 Year |
1-3 Years |
3-5 Years |
More than 5 Years | |||||||||||
| (In thousands) | |||||||||||||||
| Capital lease obligations |
$ | — | $ | — | $ | — | $ | — | $ | — | |||||
| Operating lease obligations |
7,878 | 2,358 | 4,340 | 1,180 | — | ||||||||||
| Contractual commitments |
3,668 | 3,244 | 424 | — | — | ||||||||||
| Total |
$ | 11,546 | $ | 5,602 | $ | 4,764 | $ | 1,180 | $ | — | |||||
Recent Accounting Pronouncements
Adopted Accounting Pronouncements
Effective July 1, 2009, we adopted The FASB Accounting Standards Codification and the Hierarchy of Generally Accepted Accounting Principles. This standard establishes only two levels of GAAP, authoritative and non-authoritative. The FASB Accounting Standards Codification (the “Codification”) became the source of authoritative, non-governmental GAAP, except for rules and interpretive releases of the SEC, which are sources of authoritative GAAP for SEC registrants. All other non-grandfathered, non-SEC accounting literature not included in the Codification became non-authoritative. We began using the new guidelines and numbering system prescribed by the Codification when referring to GAAP in the third quarter of fiscal 2009. As the Codification was not intended to change or alter existing GAAP, it did not have any impact on our consolidated financial statements.
Effective April 1, 2009, we adopted three accounting standard updates which were intended to provide additional application guidance and enhanced disclosures regarding fair value measurements and impairments of securities. They also provide additional guidelines for estimating fair value in accordance with fair value accounting. The first update provides additional guidelines for estimating fair value in accordance with fair value accounting. The second accounting update changes accounting requirements for other-than-temporary-impairment (“OTTI”) for debt securities by replacing the current requirement that a holder have the positive intent and ability to hold an impaired security to recovery in order to conclude an impairment was temporary with a requirement that an entity conclude it does not intend to sell an impaired security and it will not be
48
Table of Contents
required to sell the security before the recovery of its amortized cost basis. The third accounting update increases the frequency of fair value disclosures. These updates were effective for fiscal years and interim periods ended after June 15, 2009. The adoption of these accounting updates did not have any impact on our consolidated financial statements.
Effective April 1, 2009, we adopted a new accounting standard for subsequent events. The update modifies the names of the two types of subsequent events either as recognized subsequent events (previously referred to in practice as Type I subsequent events) or non-recognized subsequent events (previously referred to in practice as Type II subsequent events). In addition, the standard modifies the definition of subsequent events to refer to events or transactions that occur after the balance sheet date, but before the financial statements are issued (for public entities) or available to be issued (for nonpublic entities). It also requires the disclosure of the date through which subsequent events have been evaluated. The update did not result in significant changes in the practice of subsequent event disclosures, and therefore the adoption did not have any impact on our consolidated financial statements.
New Accounting Pronouncements
In October 2009, the FASB issued a new accounting standard which provides guidance for arrangements with multiple deliverables. It updates the existing multiple-element revenue arrangements guidance. The revised guidance primarily provides two significant changes: 1) requires an entity to allocate consideration at the inception of an arrangement to all of its deliverables based on their relative selling prices. In the absence of either vendor-specific objective evidence or third-party evidence of the selling prices, consideration must be allocated to the deliverables based on management’s best estimate of the selling prices, and 2) eliminates the residual method to allocate the arrangement consideration. This standard will be effective for the first annual reporting period beginning on or after June 15, 2010, with early adoption permitted provided that the revised guidance is retroactively applied to the beginning of the year of adoption. We are currently evaluating both the timing and method of our adoption of this standard. We currently believe that until such time as we can establish stand-alone value for our installation services, the impact of the new standard would not be significant to our consolidated financial statements.
49
Table of Contents
| Item 7A. | Quantitative and Qualitative Disclosures About Market Risks |
Foreign Currency Exchange Risk
As we expand internationally our results of operations and cash flows will become increasingly subject to fluctuations due to changes in foreign currency exchange rates. Our revenue is generally denominated in the local currency of the contracting party. The substantial majority of our revenue has been denominated in U.S. dollars. Our expenses are generally denominated in the currencies in which our operations are located. Our expenses are incurred primarily in the United States, with a small portion of expenses incurred where our other international sales and operations offices are located. Our results of operations and cash flows are, therefore, subject to fluctuations due to changes in foreign currency exchange rates. Fluctuations in currency exchange rates could harm our business in the future. The effect of an immediate 10% adverse change in exchange rates on foreign denominated receivables as of December 31, 2009 would result in an adverse impact on income before income taxes of approximately $1.1 million. To date, we have not entered into any foreign currency hedging contracts although we may do so in the future.
Interest Rate Sensitivity
We had cash and cash equivalents of $76.6 million and marketable securities of $246.6 million as of December 31, 2009, respectively. Cash, cash equivalents and marketable securities are held for working capital purposes and restricted cash amounts are held as security against credit card deposits and various lease obligations. Our exposure to market rate risk for changes in interest rates relates to our investment portfolio. We have not used derivative financial instruments in our investment portfolio. We placed our investments with high quality issues and, by policy, limit the amount of credit exposure to any one issuer. We protect and preserve our investment funds by limiting default, market and reinvestment risk. Our investments in marketable securities consist of high-grade government securities with maturities of less than two years. Investments purchased with the remaining maturity of 90 days or less are considered to be cash equivalents. We classify all of our investments as available-for-sale. Available-for-sale securities are carried at fair value, with unrealized gains and losses, net of tax reported in a separate component of stockholder’s equity. The average maturity of our investment portfolio is approximately 190 days; therefore the movement of interest rates should not have a material impact on our consolidated balance sheet or statement of operations.
At any time, a significant increase/decrease in interest rates will have an impact on the fair market value and interest earnings of our investment portfolio. We do not currently hedge this interest exposure. We have performed a sensitivity analysis as of December 31, 2009 using a modeling technique that measures the change in the fair values arising from a hypothetical 100 basis points adverse movement in the levels of interest rates across the entire yield curve, which are representative of historical movements in the Federal Funds rate with all other variables held constant. The analysis is based on the weighted-average maturity of our investments as of December 31, 2009. The sensitivity analysis indicated that a hypothetical 100 basis points adverse movement in interest rates would result in a loss in the fair values of our investments of approximately $1.6 million as of December 31, 2009.
| Item 8. | Financial Statements and Supplementary Data |
Please refer to Item 15—Exhibits and Financial Statement Schedules.
| Item 9. | Changes in and Disagreements with Accountants on Accounting and Financial Disclosure |
None.
50
Table of Contents
| Item 9A. | Controls and Procedures |
Disclosure Controls and Procedures
Our management, with the participation of our Chief Executive Officer (“CEO”) and our Chief Financial Officer (“CFO”), has evaluated the effectiveness of our disclosure controls and procedures (as such term is defined in Rules 13a-15(e) and 15d-15(e) under the Securities Act of 1934, as amended (the “Exchange Act”)) as of the end of our fiscal year, December 31, 2009. Based on that evaluation, our CEO and CFO have concluded that our disclosure controls and procedures as of December 31, 2009 were effective to ensure that information required to be disclosed by us in the reports filed and submitted under the Securities Exchange Act of 1934 is recorded, processed, summarized and reported within the time periods specified in SEC rules and forms, and is accumulated and communicated to our management, including our Chief Executive Officer and Chief Financial Officer, as appropriate, to allow timely decisions regarding required disclosure.
Management’s Report on Internal Control Over Financial Reporting
Our management is responsible for establishing and maintaining adequate internal control over financial reporting, as such term is defined in Exchange Act Rule 13a-15(f). Our internal control over financial reporting is a process designed to provide reasonable assurance regarding the reliability of financial reporting and the preparation of consolidated financial statements for external purposes in accordance with GAAP. Our internal control over financial reporting includes those policies and procedures that:
(1) pertain to the maintenance of records that, in reasonable detail, accurately and fairly reflect our transactions and dispositions of assets;
(2) provide reasonable assurance that transactions are recorded as necessary to permit preparation of consolidated financial statements in accordance with GAAP, and that our receipts and expenditures are made only in accordance with authorizations of our management and Board of Directors; and
(3) provide reasonable assurance regarding prevention or timely detection of unauthorized acquisition, use, or disposition of our assets that could have a material effect on the Consolidated Financial Statements.
Because of its inherent limitations, internal control over financial reporting may not prevent or detect misstatements. Also, projections of any evaluation of effectiveness to future periods are subject to the risk that controls may become inadequate because of changes in conditions, or that the degree of compliance with the policies or procedures may deteriorate.
Under the supervision and with the participation of our management, including our CEO and CFO, we conducted an evaluation of the effectiveness of our internal control over financial reporting as of December 31, 2009 based on criteria set forth by the Committee of Sponsoring Organizations of the Treadway Commission in Internal Control—Integrated Framework (“COSO Framework”). Based on that evaluation, our CEO and CFO have concluded that our internal control over financial reporting was effective as of December 31, 2009.
Ernst & Young LLP has independently assessed the effectiveness of our internal controls over financial reporting and its report is included on page 55.
Changes in Internal Controls over Financial Reporting
There has been no change in our internal control over financial reporting that occurred during fiscal 2009 that has materially affected or is reasonably likely to materially affect our internal control over financial reporting.
| Item 9B. | Other Information |
None.
51
Table of Contents
PART III
| Item 10. | Directors, Executive Officers and Corporate Governance |
The information required by this item with respect to directors is incorporated by reference to our Proxy Statement for our 2009 Annual Meeting of Stockholders, and is incorporated herein by reference.
We have adopted a code of business conduct and ethics applicable to our directors, officers (including our principal executive officer and principal financial officer) and employees. The Code of Business Conduct and Ethics is available on the investor relations our website at www.successfactors.com/investor under “Corporate Governance.”
| Item 11. | Executive Compensation |
The information required by this item will be set forth in our Proxy Statement for our 2010 Annual Meeting of Stockholders, and is incorporated herein by reference.
| Item 12. | Security Ownership of Certain Beneficial Owners and Management and Related Stockholder Matters |
The information required by this item will be set forth in our Proxy Statement for our 2010 Annual Meeting of Stockholders, and is incorporated herein by reference.
| Item 13. | Certain Relationships and Related Transactions, and Director Independence |
The information required by this item will be set forth in our Proxy Statement for our 2010 Annual Meeting of Stockholders, and is incorporated herein by reference.
| Item 14. | Principal Accounting Fees and Services |
The information required by this item will be set forth in our Proxy Statement for our 2010 Annual Meeting of Stockholders, and is incorporated herein by reference.
52
Table of Contents
PART IV
| Item 15. | Exhibits and Financial Statement Schedules |
(a)(1) Financial Statements
The following financial statements are filed as part of this report:
| Page | ||
| Reports of Ernst & Young LLP, Independent Registered Public Accounting Firm |
54 | |
| 56 | ||
| 57 | ||
| Consolidated Statements of Convertible Preferred Stock and Stockholders’ Equity (Deficit) |
58 | |
| 59 | ||
| 60 |
53
Table of Contents
REPORT OF ERNST & YOUNG LLP, INDEPENDENT REGISTERED PUBLIC ACCOUNTING FIRM
The Board of Directors and Stockholders of SuccessFactors, Inc.
We have audited the accompanying consolidated balance sheets of SuccessFactors, Inc. as of December 31, 2009 and 2008, and the related consolidated statements of operations, convertible preferred stock and stockholders’ equity (deficit), and cash flows for each of the three years in the period ended December 31, 2009. These financial statements are the responsibility of the Company’s management. Our responsibility is to express an opinion on these financial statements based on our audits.
We conducted our audits in accordance with the standards of the Public Company Accounting Oversight Board (United States). Those standards require that we plan and perform the audit to obtain reasonable assurance about whether the financial statements are free of material misstatement. An audit includes examining, on a test basis, evidence supporting the amounts and disclosures in the financial statements. An audit also includes assessing the accounting principles used and significant estimates made by management, as well as evaluating the overall financial statement presentation. We believe that our audits provide a reasonable basis for our opinion.
In our opinion, the financial statements referred to above present fairly, in all material respects, the consolidated financial position of SuccessFactors, Inc. at December 31, 2009 and 2008, and the consolidated results of its operations and its cash flows for each of the three years in the period ended December 31, 2009, in conformity with U.S. generally accepted accounting principles.
We also have audited, in accordance with the standards of the Public Company Accounting Oversight Board (United States), SuccessFactors, Inc.’s internal control over financial reporting as of December 31, 2009, based on criteria established in Internal Control—Integrated Framework issued by the Committee of Sponsoring Organizations of the Treadway Commission and our report dated February 26, 2010 expressed an unqualified opinion thereon.
/s/ Ernst & Young LLP
San Francisco, California
February 26, 2010
54
Table of Contents
REPORT OF ERNST & YOUNG LLP, INDEPENDENT REGISTERED PUBLIC ACCOUNTING FIRM
The Board of Directors and Stockholders of SuccessFactors, Inc.
We have audited SuccessFactors, Inc.’s internal control over financial reporting as of December 31, 2009, based on criteria established in Internal Control—Integrated Framework issued by the Committee of Sponsoring Organizations of the Treadway Commission (the COSO criteria). SuccessFactors Inc.’s management is responsible for maintaining effective internal control over financial reporting, and for its assessment of the effectiveness of internal control over financial reporting included in the accompanying Management’s Report on Internal Control Over Financial Reporting. Our responsibility is to express an opinion on the company’s internal control over financial reporting based on our audit.
We conducted our audit in accordance with the standards of the Public Company Accounting Oversight Board (United States). Those standards require that we plan and perform the audit to obtain reasonable assurance about whether effective internal control over financial reporting was maintained in all material respects. Our audit included obtaining an understanding of internal control over financial reporting, assessing the risk that a material weakness exists, testing and evaluating the design and operating effectiveness of internal control based on the assessed risk, and performing such other procedures as we considered necessary in the circumstances. We believe that our audit provides a reasonable basis for our opinion.
A company’s internal control over financial reporting is a process designed to provide reasonable assurance regarding the reliability of financial reporting and the preparation of financial statements for external purposes in accordance with generally accepted accounting principles. A company’s internal control over financial reporting includes those policies and procedures that (1) pertain to the maintenance of records that, in reasonable detail, accurately and fairly reflect the transactions and dispositions of the assets of the company; (2) provide reasonable assurance that transactions are recorded as necessary to permit preparation of financial statements in accordance with generally accepted accounting principles, and that receipts and expenditures of the company are being made only in accordance with authorizations of management and directors of the company; and (3) provide reasonable assurance regarding prevention or timely detection of unauthorized acquisition, use, or disposition of the company’s assets that could have a material effect on the financial statements.
Because of its inherent limitations, internal control over financial reporting may not prevent or detect misstatements. Also, projections of any evaluation of effectiveness to future periods are subject to the risk that controls may become inadequate because of changes in conditions, or that the degree of compliance with the policies or procedures may deteriorate.
In our opinion, SuccessFactors, Inc. maintained, in all material respects, effective internal control over financial reporting as of December 31, 2009, based on the COSO criteria.
We also have audited, in accordance with the standards of the Public Company Accounting Oversight Board (United States), the consolidated balance sheets of SuccessFactors Inc. as of December 31, 2009 and 2008, and the related consolidated statements of operations, convertible preferred stock and stockholders’ equity (deficit), and cash flows for each of the three years in the period ended December 31, 2009 of SuccessFactors Inc. and our report dated February 26, 2010 expressed an unqualified opinion thereon.
/s/ Ernst & Young LLP
San Francisco, California
February 26, 2010
55
Table of Contents
Consolidated Balance Sheets
| As of December 31, | ||||||||
| 2009 | 2008 | |||||||
| (In thousands, except per share data) |
||||||||
| ASSETS: | ||||||||
| Current assets: |
||||||||
| Cash and cash equivalents |
$ | 76,618 | $ | 69,859 | ||||
| Marketable securities |
246,629 | 32,505 | ||||||
| Accounts receivable, net of allowance for doubtful accounts of $1,161 and $727 |
57,611 | 44,446 | ||||||
| Deferred commissions |
5,950 | 5,721 | ||||||
| Prepaid expenses and other current assets |
5,679 | 3,224 | ||||||
| Total current assets |
392,487 | 155,755 | ||||||
| Restricted cash |
931 | 1,248 | ||||||
| Property and equipment, net |
5,787 | 6,933 | ||||||
| Deferred commissions, net of current portion |
9,233 | 6,292 | ||||||
| Other assets |
259 | 198 | ||||||
| Total assets |
$ | 408,697 | $ | 170,426 | ||||
| LIABILITIES AND STOCKHOLDERS’ EQUITY (DEFICIT): | ||||||||
| Current liabilities: |
||||||||
| Accounts payable |
$ | 794 | $ | 1,960 | ||||
| Accrued expenses and other current liabilities |
7,220 | 8,814 | ||||||
| Accrued employee compensation |
14,546 | 12,159 | ||||||
| Deferred revenue |
160,356 | 128,940 | ||||||
| Total current liabilities |
182,916 | 151,873 | ||||||
| Deferred revenue, net of current portion |
21,268 | 20,858 | ||||||
| Long-term tax payable |
1,643 | 855 | ||||||
| Other long-term liabilities |
367 | 2,216 | ||||||
| Total liabilities |
206,194 | 175,802 | ||||||
| Commitments and contingencies (Note 3) |
||||||||
| Stockholders’ equity (deficit): |
||||||||
| Preferred stock, $0.001 par value, 5,000 shares authorized; no shares issued or outstanding |
— | — | ||||||
| Common stock, $0.001 par value; 200,000 shares authorized 71,748 and 55,990 shares issued and outstanding (excluding 4 and 337 legally issued and outstanding) as of December 31, 2009 and 2008, respectively) |
72 | 56 | ||||||
| Additional paid-in capital |
421,419 | 200,907 | ||||||
| Accumulated other comprehensive loss |
(89 | ) | (74 | ) | ||||
| Accumulated deficit |
(218,899 | ) | (206,265 | ) | ||||
| Total stockholders’ equity (deficit) |
202,503 | (5,376 | ) | |||||
| Total liabilities and stockholders’ equity (deficit) |
$ | 408,697 | $ | 170,426 | ||||
See accompanying notes to consolidated financial statements.
56
Table of Contents
Consolidated Statements of Operations
| Year Ended December 31, | ||||||||||||
| 2009 | 2008 | 2007 | ||||||||||
| (In thousands, except per share data) | ||||||||||||
| Revenue |
$ | 153,054 | $ | 111,913 | $ | 63,350 | ||||||
| Cost of revenue(1) |
35,323 | 38,836 | 26,341 | |||||||||
| Gross profit |
117,731 | 73,077 | 37,009 | |||||||||
| Operating expenses:(1) |
||||||||||||
| Sales and marketing |
80,431 | 92,187 | 70,963 | |||||||||
| Research and development |
24,427 | 23,085 | 16,725 | |||||||||
| General and administrative |
24,995 | 24,744 | 19,091 | |||||||||
| Gain on settlement of litigation, net |
— | (971 | ) | — | ||||||||
| Total operating expenses |
129,853 | 139,045 | 106,779 | |||||||||
| Loss from operations |
(12,122 | ) | (65,968 | ) | (69,770 | ) | ||||||
| Interest income (expense) and other, net |
810 | 1,780 | (5,259 | ) | ||||||||
| Loss before provision for income taxes |
(11,312 | ) | (64,188 | ) | (75,029 | ) | ||||||
| Provision for income taxes |
(1,322 | ) | (764 | ) | (425 | ) | ||||||
| Net loss |
$ | (12,634 | ) | $ | (64,952 | ) | $ | (75,454 | ) | |||
| Net loss per common share, basic and diluted |
$ | (0.21 | ) | $ | (1.21 | ) | $ | (8.35 | ) | |||
| Shares used in computing net loss per common share, basic and diluted |
59,534 | 53,803 | 9,036 | |||||||||
| (1) | Amounts include stock-based compensation expenses as follows: |
| Year Ended December 31, | |||||||||
| 2009 | 2008 | 2007 | |||||||
| Cost of revenue |
$ | 1,417 | $ | 1,053 | $ | 448 | |||
| Sales and marketing |
4,451 | 4,084 | 2,269 | ||||||
| Research and development |
1,354 | 1,099 | 512 | ||||||
| General and administrative |
3,195 | 2,368 | 1,189 | ||||||
| Total |
$ | 10,417 | $ | 8,604 | $ | 4,418 | |||
See accompanying notes to consolidated financial statements.
57
Table of Contents
Consolidated Statements of Convertible Preferred Stock
and Stockholders’ Equity (Deficit)
| Convertible Preferred Stock |
Common Stock | Additional Paid-in Capital |
Notes Receivable from Stockholders |
Accumulated Other Comprehensive Income |
Accumulated Deficit |
Total Stockholders’ Equity (Deficit) |
|||||||||||||||||||||||||
| Shares | Amount | Shares | Amount | ||||||||||||||||||||||||||||
| (In thousands) | |||||||||||||||||||||||||||||||
| Balances at January 1, 2007 |
32,546 | $ | 45,289 | 2,792 | $ | 6 | $ | 1,758 | $ | (9 | ) | $ | 9 | $ | (65,859 | ) | $ | (64,095 | ) | ||||||||||||
| Issuance of common stock upon exercise of stock options |
— | — | 1,242 | 1 | 412 | — | — | — | 413 | ||||||||||||||||||||||
| Issuance of convertible preferred stock upon exercise of preferred stock warrant |
4 | 20 | — | — | 25 | — | — | — | 25 | ||||||||||||||||||||||
| Stock-based compensation |
— | — | — | — | 4,418 | — | — | — | 4,418 | ||||||||||||||||||||||
| Conversion of convertible preferred stock into common stock |
(32,550 | ) | (45,309 | ) | 32,550 | 32 | 45,277 | — | — | — | 45,309 | ||||||||||||||||||||
| Conversion of preferred stock warrant liability into additional paid-in capital |
— | — | — | — | 4,534 | — | — | — | 4,534 | ||||||||||||||||||||||
| Issuance of common stock in connection with initial public offering, net of issuance costs incurred |
— | — | 11,619 | 12 | 104,045 | — | — | — | 104,057 | ||||||||||||||||||||||
| Repayment of notes receivable from stockholder |
— | — | 2,916 | — | 134 | 9 | — | — | 143 | ||||||||||||||||||||||
| Vesting of stock option shares exercised early |
— | — | 231 | — | 547 | — | — | — | 547 | ||||||||||||||||||||||
| Comprehensive loss: |
|||||||||||||||||||||||||||||||
| Foreign currency translation adjustment, net of tax |
— | — | — | — | — | — | 37 | — | 37 | ||||||||||||||||||||||
| Unrealized gain on marketable securities |
— | — | — | — | — | 9 | — | 9 | |||||||||||||||||||||||
| Net loss |
— | — | — | — | — | — | — | (75,454 | ) | (75,454 | ) | ||||||||||||||||||||
| Comprehensive loss |
— | — | — | — | — | — | — | — | (75,408 | ) | |||||||||||||||||||||
| Balances at December 31, 2007 |
— | — | 51,350 | 51 | 161,150 | — | 55 | (141,313 | ) | 19,943 | |||||||||||||||||||||
| Issuance of common stock upon exercise of stock options |
— | — | 1,496 | 1 | 1,479 | — | — | — | 1,480 | ||||||||||||||||||||||
| Stock-based compensation |
— | — | — | — | 8,604 | — | — | — | 8,604 | ||||||||||||||||||||||
| Issuance of common stock in connection with follow-on public offering, net of issuance costs incurred |
— | — | 2,500 | 3 | 27,427 | — | — | — | 27,430 | ||||||||||||||||||||||
| Vesting of stock option shares exercised early |
— | — | 357 | 1 | 2,247 | — | — | — | 2,248 | ||||||||||||||||||||||
| Issuance of common stock in connection with net exercise of common stock warrant |
— | — | 287 | — | — | — | — | — | — | ||||||||||||||||||||||
| Comprehensive loss: |
|||||||||||||||||||||||||||||||
| Foreign currency translation adjustment, net of tax |
— | — | — | — | — | — | (179 | ) | — | (179 | ) | ||||||||||||||||||||
| Unrealized gain on marketable securities |
— | — | — | — | — | — | 50 | — | 50 | ||||||||||||||||||||||
| Net loss |
— | — | — | — | — | — | — | (64,952 | ) | (64,952 | ) | ||||||||||||||||||||
| Comprehensive loss |
— | — | — | — | — | — | — | — | (65,081 | ) | |||||||||||||||||||||
| Balances at December 31, 2008 |
— | — | 55,990 | 56 | 200,907 | — | (74 | ) | (206,265 | ) | (5,376 | ) | |||||||||||||||||||
| Exercise of stock options and stock grants to board members for board services |
— | — | 1,552 | 2 | 5,023 | — | — | — | 5,025 | ||||||||||||||||||||||
| Vested restricted stock units converted to shares |
— | — | 74 | — | — | — | — | — | — | ||||||||||||||||||||||
| Stock-based compensation |
— | — | — | — | 10,417 | — | — | — | 10,417 | ||||||||||||||||||||||
| Issuance of common stock in connection with follow-on public offering, net of issuance costs incurred |
— | — | 13,800 | 14 | 203,041 | — | — | — | 203,055 | ||||||||||||||||||||||
| Vesting of stock option shares exercised early |
— | — | 332 | — | 2,031 | — | — | — | 2,031 | ||||||||||||||||||||||
| Comprehensive loss: |
|||||||||||||||||||||||||||||||
| Foreign currency translation adjustment, net of tax |
— | — | — | — | — | — | (138 | ) | — | (138 | ) | ||||||||||||||||||||
| Unrealized gain on marketable securities |
— | — | — | — | — | — | 123 | — | 123 | ||||||||||||||||||||||
| Net loss |
— | — | — | — | — | — | — | (12,634 | ) | (12,634 | ) | ||||||||||||||||||||
| Comprehensive loss |
— | — | — | — | — | — | — | — | (12,649 | ) | |||||||||||||||||||||
| Balances at December 31, 2009 |
— | $ | — | 71,748 | $ | 72 | $ | 421,419 | $ | — | $ | (89 | ) | $ | (218,899 | ) | $ | 202,503 | |||||||||||||
See accompanying notes to consolidated financial statements.
58
Table of Contents
Consolidated Statements of Cash Flows
| Year Ended December 31, | ||||||||||||
| 2009 | 2008 | 2007 | ||||||||||
| (In thousands) | ||||||||||||
| Cash flows from operating activities: |
||||||||||||
| Net loss |
$ | (12,634 | ) | $ | (64,952 | ) | $ | (75,454 | ) | |||
| Adjustments to reconcile net loss to net cash provided by (used in) operating activities: |
||||||||||||
| Depreciation and amortization |
3,964 | 3,885 | 2,173 | |||||||||
| Loss (gain) on fixed assets |
(62 | ) | 193 | 156 | ||||||||
| Amortization of deferred commissions |
7,383 | 6,572 | 4,063 | |||||||||
| Stock-based compensation expenses |
10,417 | 8,604 | 4,418 | |||||||||
| Amortization of debt issuance costs |
— | — | 1,916 | |||||||||
| Adjustment to fair value of convertible preferred stock warrants |
— | — | 2,510 | |||||||||
| Changes in assets and liabilities: |
||||||||||||
| Accounts receivable |
(13,165 | ) | (2,374 | ) | (19,268 | ) | ||||||
| Deferred commissions |
(10,553 | ) | (7,043 | ) | (9,958 | ) | ||||||
| Prepaid expenses and other current assets |
(2,455 | ) | (877 | ) | (1,309 | ) | ||||||
| Other assets |
(61 | ) | 102 | (296 | ) | |||||||
| Accounts payable |
(1,166 | ) | (1,635 | ) | 1,791 | |||||||
| Accrued expenses and other current liabilities |
(1,470 | ) | 2,142 | 4,165 | ||||||||
| Accrued employee compensation |
2,387 | (6,106 | ) | 6,699 | ||||||||
| Long-term tax payable |
788 | 855 | — | |||||||||
| Other liabilities |
201 | (179 | ) | 1,270 | ||||||||
| Deferred revenue |
31,826 | 48,788 | 48,656 | |||||||||
| Net cash provided by (used in) operating activities |
15,400 | (12,025 | ) | (28,468 | ) | |||||||
| Cash flows from investing activities: |
||||||||||||
| Restricted cash |
317 | (284 | ) | (30 | ) | |||||||
| Capital expenditures |
(2,844 | ) | (4,479 | ) | (5,475 | ) | ||||||
| Proceeds from sale of assets |
88 | — | — | |||||||||
| Purchase of available-for-sale securities |
(323,537 | ) | (78,086 | ) | (11,218 | ) | ||||||
| Maturities of available-for-sale securities |
104,654 | 46,160 | 2,705 | |||||||||
| Sale of available-for-sale securities |
4,534 | 7,983 | — | |||||||||
| Net cash used in investing activities |
(216,788 | ) | (28,706 | ) | (14,018 | ) | ||||||
| Cash flows from financing activities: |
||||||||||||
| Proceeds from exercise of stock options, net |
5,025 | 1,480 | 553 | |||||||||
| Proceeds from early exercise of stock options, net |
— | 162 | 4,674 | |||||||||
| Proceeds from exercise of preferred stock warrants |
— | — | 20 | |||||||||
| Proceeds from public offerings, net of offering costs |
203,055 | 26,885 | 104,602 | |||||||||
| Proceeds from advance on line of credit |
— | — | 10,000 | |||||||||
| Repayment of line of credit |
— | — | (21,272 | ) | ||||||||
| Principal payments on capital lease obligations |
(56 | ) | (34 | ) | (36 | ) | ||||||
| Net cash provided by financing activities |
208,024 | 28,493 | 98,541 | |||||||||
| Effect of exchange rate changes on cash and cash equivalents |
123 | (177 | ) | 47 | ||||||||
| Net (decrease) increase in cash and cash equivalents |
6,759 | (12,415 | ) | 56,102 | ||||||||
| Cash and cash equivalents at beginning of year |
69,859 | 82,274 | 26,172 | |||||||||
| Cash and cash equivalents at end of year |
$ | 76,618 | $ | 69,859 | $ | 82,274 | ||||||
| Supplemental cash flow disclosure: |
||||||||||||
| Cash paid during the period for: |
||||||||||||
| Interest |
$ | 165 | $ | 268 | $ | 946 | ||||||
| Income taxes |
392 | 95 | 4 | |||||||||
See accompanying notes to consolidated financial statements.
59
Table of Contents
Notes to Consolidated Financial Statements
1. Organization and Significant Accounting Policies
Organization
Success Acquisition Corporation was incorporated in Delaware in 2001. In April 2008, the name was changed to SuccessFactors, Inc. (the Company). The Company provides business execution software that enable organizations to optimize the performance of their people to drive business results. The Company’s application suite includes the following modules and capabilities; Performance Management; Goal Management; Compensation Management; Succession Management; Learning and Development; Recruiting Management; Analytics and Reporting; Employee Profile; 360-Degree Review; Employee Survey; Stack Ranker; Business Performance Accelerators; and proprietary and third-party content. The Company’s headquarters are located in San Mateo, California. The Company conducts its business worldwide with additional locations in Europe and Asia.
Public Offerings
In November 2007, the Company completed its initial public offering, selling approximately 11, 619,000 shares of its common stock for approximately $104 million in net proceeds. Since 2007, the Company has used the net proceeds for general corporate purposes, including the expansion of sales and marketing, research and development, working capital and capital expenditures.
In June 2008, and October 2009, the Company completed follow-on offerings, raising net proceeds of approximately $27.4 million and $203.0 million, respectively.
Principles of Consolidation
The consolidated financial statements include the accounts of the Company and its wholly-owned subsidiaries. All significant intercompany balances and transactions have been eliminated in consolidation.
Use of Estimates
The Company’s consolidated financial statements have been prepared in accordance with accounting principles generally accepted in the United States (GAAP). The preparation of these financial statements requires the Company to make estimates and judgments that affect the reported amounts in the financial statements and accompanying notes. These estimates form the basis for judgments the Company makes about the carrying values of assets and liabilities that are not readily apparent from other sources. The Company bases its estimates and judgments on historical experience and on various other assumptions that the Company believes are reasonable under the circumstances. GAAP requires the Company to make estimates and judgments in several areas, including those related to revenue recognition, recoverability of accounts receivable and the fair market value of stock-based awards, including forfeiture estimates. These estimates are based on management’s knowledge about current events and expectations about actions the Company may undertake in the future. Actual results could differ materially from those estimates.
Segments
The Company’s chief operating decision maker is its Chief Executive Officer, who reviews financial information presented on a consolidated basis. Accordingly, the Company has determined that it has a single reporting segment and operating unit structure, specifically the provision of on-demand business execution software and associated services for employee performance and business alignment.
60
Table of Contents
SUCCESSFACTORS, INC.
Notes to Consolidated Financial Statements—(Continued)
Revenue Recognition
Revenue consists of subscription fees for the Company’s cloud-based software and fees for the provision of other services. The Company’s customers do not have the contractual right to take possession of software in substantially all of the transactions. Instead, the software is delivered through the cloud from the Company’s hosting facilities. Therefore, these arrangements are treated as service agreements. The Company commences revenue recognition when all of the following conditions are met:
| • | there is persuasive evidence of an arrangement; |
| • | the subscription or services have been delivered to the customer; |
| • | the collection of related fees is reasonably assured; and |
| • | the amount of related fees is fixed or determinable. |
Additionally, if an agreement contains non-standard acceptance or non-standard performance criteria to be met, the Company defers revenues until the satisfaction of these conditions.
Signed agreements are used as evidence of an arrangement. The Company assesses cash collectability based on a number of factors such as past collection history with the customer and creditworthiness of the customer. If the Company determines that collectability is not reasonably assured, the Company defers the recognition of revenue until collectability becomes reasonably assured, generally upon receipt of cash. The Company assesses whether the fee is fixed or determinable based on the payment terms associated with the transaction and whether the sales price is subject to refund or adjustment. The Company’s arrangements are typically noncancelable, though customers typically have the right to terminate their agreement for cause if the Company fails to perform.
The Company’s other services include implementation assistance, including installation and training related to the application suite. These other services are generally sold in conjunction with the Company’s subscriptions, and the Company has determined that it has neither stand-alone value for the installation services nor objective and reliable evidence of fair value for each element of its arrangements. As a result, these other services are not able to be accounted for separately from the Company’s subscriptions. As these other services do not qualify for separate accounting, the Company recognizes the other services revenue together with the subscription fees ratably over the noncancelable term of the subscription agreement, generally one to three years although terms can extend to as long as five years, commencing on the later of the start date specified in the subscription arrangement, the date the customer’s instance is provisioned (“initial access date”) or when all of the revenue recognition criteria have been met. The Company generally considers delivery to have occurred on the initial access date, which is the point in time that a customer is provided access to use the Company’s on-demand application suite. In the infrequent circumstance in which a customer of the Company has the contractual right to take possession of the software, the Company has determined that the customers would incur a significant penalty to take possession of the software. Therefore, these agreements have been accounted for as service contracts. Indirect taxes, including sales and use tax amounts and goods and service tax amounts, collected from customers have been recorded on a net basis.
Deferred Revenue
Deferred revenue consists of billings or payments received in advance of revenue recognition from the Company’s subscription and other services described above and is recognized as revenue when all of the revenue recognition criteria are met. For subscription arrangements with terms of over one year, the Company generally invoices its customers in annual installments. Accordingly, the deferred revenue balance does not represent the total contract value of these multi-year, noncancelable subscription agreements. The Company’s other services,
61
Table of Contents
SUCCESSFACTORS, INC.
Notes to Consolidated Financial Statements—(Continued)
such as configuration assistance, are generally sold in conjunction with the subscriptions. The Company recognizes revenue from these other services, together with the subscriptions, ratably over the noncancelable term of the subscription agreement, which can extend to as long as five years. The portion of deferred revenue that the Company anticipates will be recognized after the succeeding 12-month period is recorded as non-current deferred revenue and the remaining portion is recorded as current deferred revenue. Current deferred revenue also includes subscription agreements with an initial access date that has not yet been determined. Upon determination of the initial access date timing of such arrangements, amounts estimated to be recognized after more than 12 months are reclassified to long term.
Cost of Revenue
Cost of revenue primarily consists of costs related to hosting the Company’s application suite, compensation and related expenses for data center, professional services staff and customer support staff, payments to outside service providers, allocated overhead and depreciation expenses, license royalties and partner referral fees. Allocated overhead includes rent, information technology costs and employee benefits costs and is apportioned to all departments based on relative headcount.
Deferred Commissions
Deferred commissions are the incremental costs that are directly associated with noncancelable subscription agreements and consist of sales commissions paid to the Company’s direct sales force. The commissions are deferred and amortized over the noncancelable terms of the related customer contracts, typically one to three years, with some agreements having durations of up to five years. The deferred commission amounts are recoverable from the future revenue streams under the noncancelable subscription agreements. The Company believes this is the appropriate method of accounting, as the commission costs are so closely related to the revenue from the noncancelable subscription agreements that they should be recorded as an asset and charged to expense over the same period that the subscription revenue is recognized. Amortization of deferred commissions is included in sales and marketing expense in the accompanying consolidated statements of operations. Deferred commissions associated with subscription agreements for which revenue recognition has not commenced as of December 31, 2009 are classified as long-term deferred commissions.
During the year ended December 31, 2009, the Company capitalized $10.6 million of deferred commissions and amortized $7.4 million to sales and marketing expense. As of December 31, 2009, deferred commissions on the Company’s consolidated balance sheet totaled $15.2 million.
Research and Development
The Company expenses the cost of research and development as incurred. Research and development expenses consist primarily of expenses for research and development staff, the cost of certain third-party service providers and allocated overhead.
Software Development Costs
The Company capitalizes qualifying computer software costs that are incurred during the application development stage and amortizes them over the software’s estimated useful life. Due to the Company’s delivery of product releases on a monthly basis, there have been no material qualifying costs incurred during the application development stage in any of the periods presented.
62
Table of Contents
SUCCESSFACTORS, INC.
Notes to Consolidated Financial Statements—(Continued)
Comprehensive Loss
Comprehensive loss consists of net loss and other comprehensive income (loss). Other comprehensive (loss) income includes certain changes in equity that are excluded from net loss. Specifically, cumulative foreign currency translation adjustments, net of tax, and unrealized gains (losses) on marketable securities, net of tax, are included in accumulated other comprehensive income (loss). Comprehensive loss has been reflected in the consolidated statements of convertible preferred stock and stockholders’ equity (deficit).
Income Taxes
The Company accounts for income taxes using the liability method, which requires the recognition of deferred tax assets or liabilities for the tax-effected temporary differences between the financial reporting and tax bases of our assets and liabilities, and for net operating loss and tax credit carryforwards.
Further, compliance with income tax regulations requires the Company to make decisions relating to the transfer pricing of revenue and expenses between each of its legal entities that are located in several countries. The Company’s determinations include many decisions based on management’s knowledge of the underlying assets of the business, the legal ownership of these assets, and the ultimate transactions conducted with customers and other third parties. The calculation of the Company’s tax liabilities involves dealing with uncertainties in the application of complex tax regulations in multiple tax jurisdictions. The Company may be periodically reviewed by domestic and foreign tax authorities regarding the amount of taxes due. These reviews may include questions regarding the timing and amount of deductions and the allocation of income among various tax jurisdictions. In evaluating the exposure associated with various filing positions, the Company records estimated reserves when it is not probable that an uncertain tax position will be sustained upon examination by a taxing authority. These estimates are subject to change.
Cash and Cash Equivalents
The Company considers all highly liquid investments purchased with remaining maturities at the date of purchase of 90 days or less to be cash equivalents. Cash and cash equivalents, which consist of cash on deposit with banks and money market funds, are stated at cost, which approximates fair value.
Marketable Securities
The Company classifies its marketable securities as available-for-sale. Accordingly available-for-sale securities are carried at fair value, with the unrealized gains and losses, reported as a separate component of stockholders’ equity (deficit). Fair value is determined based on quoted market rates. The cost of securities sold is based on the specific-identification method. Realized gains and losses and declines in value judged to be other-than-temporary on available-for-sale securities are included as a component of interest income (expense). Interest on securities classified as available-for-sale is included as a component of interest income. As the Company’s marketable securities are considered by the Company as available to support current operations, these securities have been classified as current assets on the consolidated balance sheets.
63
Table of Contents
SUCCESSFACTORS, INC.
Notes to Consolidated Financial Statements—(Continued)
Restricted Cash
The Company’s restricted cash balances at December 31, 2009 and 2008 were as follows (in thousands):
| As of December 31, | ||||||
| 2009 | 2008 | |||||
| Certificates of deposit and guarantees in connection with corporate leases |
$ | 524 | $ | 641 | ||
| Certificate of deposit in connection customer requirement |
— | 150 | ||||
| Credit card deposits |
407 | 457 | ||||
| $ | 931 | $ | 1,248 | |||
Fair Value of Financial Instruments
The Company accounts for certain financial assets at fair value. The Company determines fair value based upon the exit price that would be received to sell an asset or paid to transfer a liability in an orderly transaction between market participants, as determined by either the principal market or the most advantageous market. Inputs used in the valuation techniques to derive fair values are classified based on a three-level hierarchy. These levels are:
| Level 1: | Quoted prices (unadjusted) in active markets that are accessible at the measurement date for assets or liabilities. The fair value hierarchy gives the highest priority to Level 1 inputs. | |
| Level 2: | Observable prices that are based on inputs not quoted on active markets, but corroborated by market data. | |
| Level 3: | Unobservable inputs are used when little or no market data is available. The fair value hierarchy gives the lowest priority to Level 3 inputs. | |
Observable inputs are based on market data obtained from independent sources. As of December 31, 2009 the Company did not have any financial assets or liabilities without observable market values that would require a high level of judgment to determine fair value (Level 3).
Allowance for Doubtful Accounts
The Company has established an allowance for doubtful accounts based on a review of the current status of existing accounts receivable and historical collection experience. The allowance for doubtful accounts increased by $434,000 in the year ended December 31, 2009 and $246,000 in the year ended December 31, 2008. Write-offs of accounts receivable and recoveries were not significant during each of the years ended December 31, 2009 and 2008.
Impairment of Long-Lived Assets
The Company evaluates the recoverability of its long-lived assets by comparing the projected undiscounted net cash flows associated with the related asset, or group of assets, over the remaining lives against their respective carrying amounts. Long-lived assets are reviewed for possible impairment whenever events or circumstances indicate that the carrying amounts of these assets may not be recoverable. If this review indicates that the carrying amount of long-lived assets is not recoverable, the carrying amount of these assets is reduced to its fair value.
64
Table of Contents
SUCCESSFACTORS, INC.
Notes to Consolidated Financial Statements—(Continued)
In addition to the recoverability assessment, the Company routinely reviews the remaining estimated useful lives of its long-lived assets. Any reduction in the useful life assumption would result in increased depreciation and amortization expense in the period when those determinations are made, as well as in subsequent periods.
Leases
The Company leases office space under noncancelable operating leases. The terms of certain lease agreements provide for rental payments on a graduated basis. The Company recognizes rent expense on a straight-line basis over the lease period and accrues for rent expense incurred but not yet paid.
Under certain leases, the Company also received allowances for leasehold improvements. These allowances are lease incentives, which have been recognized as a liability and are being amortized on a straight-line basis over the term of the lease as a component of minimum rental expense.
Property and Equipment
Property and equipment are stated at cost, less accumulated depreciation and amortization. Depreciation is computed using the straight-line method over the estimated useful lives of the respective assets, generally three to five years. Equipment under capital leases and leasehold improvements are amortized over their respective estimated useful lives or the remaining lease term, whichever is shorter.
When assets are retired or otherwise disposed of, the cost and accumulated depreciation and amortization are removed from their respective accounts and any gain or loss on that sale or retirement is reflected in other income (expense).
Warranties and Indemnification
The Company’s application suite is generally warranted to perform in a manner consistent with industry standards and materially in accordance with the Company’s on-line help documentation under normal use and circumstances.
Additionally, the Company’s arrangements generally include provisions for indemnifying customers against liabilities if its services infringe a third party’s intellectual property rights or a breach by the Company of its confidentiality obligations harms a third party. To date, the Company has not incurred any material costs as a result of those indemnifications and has not accrued any liabilities related to these obligations in the accompanying consolidated financial statements.
The Company has entered into service level agreements with a majority of its customers warranting defined levels of uptime reliability and performance and permitting those customers to receive service credits or discounted future services, or to terminate their agreements in the event that the Company fails to meet those levels. To date, the Company has not experienced any significant failures to meet defined levels of reliability and performance as a result of those agreements and, accordingly, has not accrued any liabilities related to these agreements in the accompanying consolidated financial statements.
We also have entered into customary indemnification agreements with each of our officers and directors.
Concentrations of Credit Risk and Significant Customers and Suppliers
Financial instruments that are potentially subject to concentrations of credit risk consist primarily of cash, cash equivalents, marketable securities, restricted cash and accounts receivable. The Company maintains an
65
Table of Contents
SUCCESSFACTORS, INC.
Notes to Consolidated Financial Statements—(Continued)
allowance for doubtful accounts. The allowance is based upon historical loss patterns, the number of days that billings are past due and an evaluation of the potential risk of loss associated with problem accounts. The Company does not require its customers to provide collateral. Credit risk arising from accounts receivable is mitigated due to the large number of customers comprising the Company’s customer base and their dispersion across various industries. No customer represented more than 10% of revenue in any of the three years in the period ended December 31, 2009.
As of December 31, 2009, the Company had international subsidiaries in Denmark, United Kingdom, France, Germany, Ireland, Japan, China, India, Canada, Brazil, Australia, Hong Kong, Korea, Italy, Singapore, the Netherlands, Switzerland and the Philippines. Long-lived assets at these subsidiaries were not significant as of December 31, 2009 or December 31, 2008. Revenue by geographic region, based on billing address of the customer, was as follows (in thousands):
| Year Ended December 31, | |||||||||
| 2009 | 2008 | 2007 | |||||||
| Americas |
$ | 132,171 | $ | 99,398 | $ | 58,934 | |||
| Europe |
16,401 | 9,239 | 2,940 | ||||||
| Asia Pacific |
4,482 | 3,276 | 1,476 | ||||||
| $ | 153,054 | $ | 111,913 | $ | 63,350 | ||||
The Company’s revenue from customers based in the United States was $126.6 million, $96.0 million and $57.3 million for the years ended December 31, 2009, 2008 and 2007 and these amounts are included in the Americas line in the table above.
The Company’s cash balances are maintained at several banks. Accounts located in the United States are insured by the Federal Deposit Insurance Corporation (FDIC) up to $250,000. Certain operating cash accounts may exceed the FDIC limits.
The Company serves its customers and users from four hosting facilities, located in New Jersey, Arizona and two in Europe. The Company has internal procedures to restore services in the event of disasters at its current hosting facilities. Even with these procedures for disaster recovery in place, the Company’s service could be significantly interrupted during the implementation of the procedures to restore services.
Foreign Currency Translation
The functional currency of the Company’s foreign subsidiaries is the local currency. Adjustments resulting from translating foreign functional currency financial statements into U.S. dollars are recorded as a separate component of stockholders’ equity (deficit). Income and expense accounts are translated into U.S. dollars at average rates of exchange prevailing during the periods presented. Foreign currency transaction gains and losses are included in net loss. All assets and liabilities denominated in a foreign currency are translated into U.S. dollars at the respective exchange rates in effect on the consolidated balance sheet dates. The Company recorded $0.1 million net transaction gain and $0.8 million of net transaction loss in 2009 and 2008 respectively. Foreign currency transaction gains and losses were not material in 2007.
Advertising Expenses
Advertising is expensed as incurred as a component of sales and marketing expenses on the consolidated statement of operations. Advertising expense was $3.8 million, $8.3 million and $4.7 million for the years ended December 31, 2009, 2008 and 2007, respectively.
66
Table of Contents
SUCCESSFACTORS, INC.
Notes to Consolidated Financial Statements—(Continued)
Accounting for Stock-Based Compensation
The Company measures all share-based payments, including grants of stock options, based on the fair value of the stock options on the grant date and recognizes expense in the Company’s consolidated statement of operations over the period during which the recipient is required to perform service in exchange for the stock options (generally over the vesting period of the options). The Company uses the Black-Scholes pricing model to determine the fair values of the stock options on the grant dates. The Company amortizes the fair values of share-based payments on a straight-line basis.
Reclassification
The Company has reclassified $0.9 million of taxes payable previously reported in accrued expenses and other current liabilities as of December 31, 2008, to long-term taxes payable to conform to the current presentation.
Recent Accounting Pronouncements
Adopted Accounting Pronouncements
Effective July 1, 2009, the Company adopted The FASB Accounting Standards Codification and the Hierarchy of Generally Accepted Accounting Principles. This standard establishes only two levels of GAAP, authoritative and non-authoritative. The FASB Accounting Standards Codification (the “Codification”) became the source of authoritative, non-governmental GAAP, except for rules and interpretive releases of the SEC, which are sources of authoritative GAAP for SEC registrants. All other non-grandfathered, non-SEC accounting literature not included in the Codification became non-authoritative. The Company began using the new guidelines and numbering system prescribed by the Codification when referring to GAAP in the third quarter of fiscal 2009. As the Codification was not intended to change or alter existing GAAP, it did not have any impact on the Company’s consolidated financial statements.
Effective April 1, 2009, the Company adopted three accounting standard updates which were intended to provide additional application guidance and enhanced disclosures regarding fair value measurements and impairments of securities. They also provide additional guidelines for estimating fair value in accordance with fair value accounting. The first update provides additional guidelines for estimating fair value in accordance with fair value accounting. The second accounting update changes accounting requirements for other-than-temporary-impairment (“OTTI”) for debt securities by replacing the current requirement that a holder have the positive intent and ability to hold an impaired security to recovery in order to conclude an impairment was temporary with a requirement that an entity conclude it does not intend to sell an impaired security and it will not be required to sell the security before the recovery of its amortized cost basis. The third accounting update increases the frequency of fair value disclosures. These updates were effective for fiscal years and interim periods ended after June 15, 2009. The adoption of these accounting updates did not have any impact on the Company’s consolidated financial statements.
Effective April 1, 2009, the Company adopted a new accounting standard for subsequent events. The update modifies the names of the two types of subsequent events either as recognized subsequent events (previously referred to in practice as Type I subsequent events) or non-recognized subsequent events (previously referred to in practice as Type II subsequent events). In addition, the standard modifies the definition of subsequent events to refer to events or transactions that occur after the balance sheet date, but before the financial statements are issued (for public entities) or available to be issued (for nonpublic entities). It also requires the disclosure of the date through which subsequent events have been evaluated. The update did not result in significant changes in the practice of subsequent event disclosures, and therefore the adoption did not have any impact on the Company’s consolidated financial statements.
67
Table of Contents
SUCCESSFACTORS, INC.
Notes to Consolidated Financial Statements—(Continued)
New Accounting Pronouncements
In October 2009, the FASB issued a new accounting standard which provides guidance for arrangements with multiple deliverables. It updates the existing multiple-element revenue arrangements guidance. The revised guidance primarily provides two significant changes: 1) requires an entity to allocate consideration at the inception of an arrangement to all of its deliverables based on their relative selling prices. In the absence of either vendor-specific objective evidence or third-party evidence of the selling prices, consideration must be allocated to the deliverables based on management’s best estimate of the selling prices, and 2) eliminates the residual method to allocate the arrangement consideration. The standard will be effective for the first annual reporting period beginning on or after June 15, 2010, with early adoption permitted provided that the revised guidance is retroactively applied to the beginning of the year of adoption. The Company is currently evaluating both the timing and method of its adoption of this standard. The Company currently believes that until such time as stand-alone value can be established for its installation services, the impact of the new standard would not be significant to the Company’s consolidated financial statements.
2. Balance Sheet Accounts
Property and Equipment
Property and equipment as of December 31, 2009 and 2008 consisted of (in thousands):
| As of December 31, | ||||||||
| 2009 | 2008 | |||||||
| Computers, equipment and software |
$ | 11,236 | $ | 8,552 | ||||
| Furniture and fixtures |
1,915 | 1,836 | ||||||
| Vehicles |
42 | 134 | ||||||
| Leasehold improvements |
3,047 | 3,027 | ||||||
| 16,240 | 13,549 | |||||||
| Less accumulated depreciation and amortization |
(10,453 | ) | (6,616 | ) | ||||
| $ | 5,787 | $ | 6,933 | |||||
Depreciation and amortization expense totaled $4.0 million, $3.9 million and $2.2 million for the years ended December 31, 2009, 2008 and 2007, respectively.
68
Table of Contents
SUCCESSFACTORS, INC.
Notes to Consolidated Financial Statements—(Continued)
Cash, Cash Equivalents and Marketable Securities
Cash, cash equivalents and marketable securities as of December 31, 2009, consisted of the following (in thousands):
| As of December 31, 2009 | |||||||||||||
| Cost | Gross Unrealized Gains |
Gross Unrealized Losses |
Estimated Fair Value | ||||||||||
| Cash |
$ | 8,914 | $ | — | $ | — | $ | 8,914 | |||||
| Cash equivalents: |
|||||||||||||
| Money market funds |
67,704 | — | — | 67,704 | |||||||||
| Total cash equivalents |
67,704 | — | — | 67,704 | |||||||||
| Total cash and cash equivalents |
76,618 | — | — | 76,618 | |||||||||
| Marketable securities: |
|||||||||||||
| U.S. Treasury bills and bonds |
115,478 | — | — | 115,478 | |||||||||
| U.S. government and agency securities |
131,248 | — | (158 | ) | 131,090 | ||||||||
| Marketable equity securities |
50 | 11 | — | 61 | |||||||||
| Total marketable securities |
246,776 | 11 | (158 | ) | 246,629 | ||||||||
| Total cash, cash equivalents and marketable securities |
$ | 323,394 | $ | 11 | $ | (158 | ) | $ | 323,247 | ||||
Cash, cash equivalents and marketable securities as of December 31, 2008, consisted of the following (in thousands):
| As of December 31, 2008 | |||||||||||||
| Cost | Gross Unrealized Gains |
Gross Unrealized Losses |
Estimated Fair Value | ||||||||||
| Cash |
$ | 684 | $ | — | $ | — | $ | 684 | |||||
| Cash equivalents: |
|||||||||||||
| Money market funds |
69,175 | — | — | 69,175 | |||||||||
| Total cash equivalents |
69,175 | — | — | 69,175 | |||||||||
| Total cash and cash equivalents |
69,859 | — | — | 69,859 | |||||||||
| Marketable securities: |
|||||||||||||
| U.S. Treasury bills and bonds |
8,969 | 26 | — | 8,995 | |||||||||
| U.S. government notes and bonds |
22,858 | 67 | — | 22,925 | |||||||||
| Corporate notes |
542 | — | (1 | ) | 541 | ||||||||
| Marketable equity securities |
50 | — | (6 | ) | 44 | ||||||||
| Total marketable securities |
32,419 | 93 | (7 | ) | 32,505 | ||||||||
| Total cash, cash equivalents and marketable securities |
$ | 102,278 | $ | 93 | $ | (7 | ) | $ | 102,364 | ||||
The Company did not realize any significant gains or losses during the years ended December 31, 2009 and 2008. The Company did not recognize any other-than-temporary impairments for the years ended December 31, 2009 and 2008.
69
Table of Contents
SUCCESSFACTORS, INC.
Notes to Consolidated Financial Statements—(Continued)
The following table summarizes the estimated fair value of our investments in marketable debt securities designated as available-for-sale classified by the contractual maturity date of the security (in thousands):
| As of December 31, 2009 | |||
| Due within 1 year |
$ | 201,863 | |
| Due within 1 year through 5 years |
44,705 | ||
| Due within 5 years through 10 years |
— | ||
| Due after 10 years |
— | ||
| Total marketable debt securities |
$ | 246,568 | |
Accrued Expenses and Other Current Liabilities
Accrued expenses and other current liabilities as of December 31, 2009 and 2008 consisted of (in thousands):
| As of December 31, | ||||||
| 2009 | 2008 | |||||
| Accrued royalties |
$ | 1,136 | $ | 1,039 | ||
| Accrued partner referral fees |
114 | 209 | ||||
| Deferred rent |
56 | 286 | ||||
| Indirect taxes |
2,091 | 1,718 | ||||
| Accrued other liabilities |
3,823 | 5,562 | ||||
| $ | 7,220 | $ | 8,814 | |||
Accrued employee compensation as of December 31, 2009 and 2008 consisted of (in thousands):
| As of December 31, | ||||||
| 2009 | 2008 | |||||
| Accrued bonus payable |
$ | 5,356 | $ | 2,323 | ||
| Accrued commission payable |
7,356 | 4,919 | ||||
| Accrued vacation |
875 | 3,505 | ||||
| All other accrued employee compensation payable |
959 | 1,412 | ||||
| $ | 14,546 | $ | 12,159 | |||
3. Lease Commitments
The Company leases office space under noncancelable operating leases with various expiration dates through December 2014 The Company recognizes rent expense on the straight-line basis over the lease period. The Company’s lease agreements for the facilities have the option to renew. The Company’s future contractual obligations would change if the Company exercised these options.
Rent expense for the years ended December 31, 2009, 2008 and 2007 was $2.9 million, $2.7 million, and $1.8 million respectively.
70
Table of Contents
SUCCESSFACTORS, INC.
Notes to Consolidated Financial Statements—(Continued)
As of December 31, 2009, future minimum lease payments under noncancelable operating leases were as follows (in thousands):
| Year Ending December 31: |
Operating Leases | ||
| 2010 |
$ | 2,358 | |
| 2011 |
1,520 | ||
| 2012 |
1,542 | ||
| 2013 |
1,278 | ||
| 2014 |
1,180 | ||
| Thereafter |
— | ||
| Total minimum lease payments |
$ | 7,878 | |
4. Fair Value Measurements
The Company measures cash equivalents, which consist of money market funds with remaining maturities at the date of purchase of 90 days or less, and marketable securities, which consist of U.S. treasury bills, government and agency securities and marketable equity securities, at fair value. Cash equivalents and marketable securities are classified within Level 1 or Level 2 hierarchies. The Company prices cash equivalents and marketable securities using quoted market prices and available market information through processes such as benchmark curves, market valuations of like securities, sector groupings and matrix pricing. As of December 31, 2009, the Company did not have any financial assets or liabilities without observable market values that would require a high level of judgment to determine fair value (Level 3).
The following table presents the cash equivalents and marketable securities carried at fair value as of December 31, 2009 (in thousands):
| Fair Value Measurements Using | |||||||||
| Description |
As of December 31, 2009 |
Quoted Prices in Active Market for Identical Assets (Level 1) |
Significant Other Observable Inputs (Level 2) | ||||||
| Cash equivalents: |
|||||||||
| Money market funds |
$ | 67,704 | $ | 6 | $ | 67,698 | |||
| Marketable securities: |
|||||||||
| U.S. Treasury bills and bonds |
115,478 | 115,478 | — | ||||||
| U.S. Government and Agency securities |
131,090 | — | 131,090 | ||||||
| Marketable equity securities |
61 | 61 | — | ||||||
| Total |
$ | 314,333 | $ | 115,545 | $ | 198,788 | |||
As of December 31, 2009, the carrying value of the Company’s cash equivalents approximated their fair value and represented approximately 22% of the Company’s total cash, cash equivalent, and marketable securities portfolio, which was held primarily in money market funds. The Company held no direct investments in auction rate securities, collateralized debt obligations, structured investment vehicles or mortgage-backed securities.
Marketable securities are considered available-for-sale and are carried in the Company’s consolidated financial statements at fair market value, with changes in value recognized as unrealized gains and losses, net of
71
Table of Contents
SUCCESSFACTORS, INC.
Notes to Consolidated Financial Statements—(Continued)
tax, in other comprehensive income. Gross unrealized gains and losses on cash equivalents and marketable securities were not material as of December 31, 2009 and 2008. Accumulated gains and losses are reclassified to earnings when the securities are sold.
5. Stockholders’ Equity (Deficit)
Preferred Stock
The Company’s board of directors has the authority to issue up to 5,000,000 shares of preferred stock with a par value of $0.001 per share and to determine the rights, preferences, privileges and restrictions of the preferred stock, including dividend rights, conversion rights, voting rights, terms of redemption, liquidation preference, and number of shares constituting any series or the designation of any series. Prior to its initial public offering, the Company had outstanding shares of convertible preferred stock. All shares of convertible preferred stock were converted into 32,550,241 shares of common stock upon the Company’s initial public offering in November 2007 At December 31, 2009 and 2008, no shares of preferred stock were outstanding.
Common Stock
The Company is authorized to issue 200,000,000 shares of common stock with a par value of $0.001 per share. Holders of common stock are entitled to one vote per share on all matters to be voted upon by stockholders of the Company.
Common Stock Warrants
The Company issued a warrant to an investor in June 2006 to purchase up to 499,535 shares of the Company’s common stock at an exercise price of $4.80 per share. In May 2008, the investor elected to exercise a net exercise provision of the warrant agreement and converted 499,535 shares in common stock warrants into 287,033 shares of common stock. At December 31, 2009, the Company had no common stock warrants outstanding.
6. Stock-Based Compensation
Stock Plans
In June 2001, the Company’s Board of Directors adopted and its stockholders approved the 2001 Stock Option Plan, and in November 2007, the Company’s Board of Directors adopted and its stockholders approved the 2007 Equity Incentive Plan (collectively, the “Stock Plans”). The Stock Plans provide for the issuance of incentive and nonstatutory stock options to employees and non-employees of the Company, and the 2007 Equity Incentive Plan additionally provides for the issuance of restricted stock awards, stock bonus awards, stock appreciation rights and restricted stock units. Options issued under the Stock Plans are generally for periods not to exceed ten years and must be issued at prices not less than 85% of the estimated fair value of the shares of common stock on the date of grant as determined by the Board of Directors. The Stock Plans provide for grants of immediately exercisable options. Options become vested and exercisable at such times and under such conditions as determined by the Board of Directors at the date of grant. Options, or shares issued upon early exercise of options, generally vest over four years, with 25% vesting after one year and the balance vesting monthly over the remaining period. Any shares exercised prior to vesting may be repurchased by the Company at the original option exercise price in the event of the employee’s termination. The right to repurchase unvested shares lapses at the rate of the vesting schedule.
72
Table of Contents
SUCCESSFACTORS, INC.
Notes to Consolidated Financial Statements—(Continued)
For non-cash, stock-based awards exchanged for employee services, the Company measures stock-based compensation on the grant date, based on the fair value of the award, and recognizes expense over the requisite service period, which for the Company is generally the vesting period. To estimate the fair value of an award, the Company uses the Black-Scholes pricing model. This model requires inputs such as expected term, expected volatility and risk-free interest rate. These inputs are subjective and generally require significant analysis and judgment to develop. For all grants during 2009, 2008 and 2007, the Company calculated the expected term based on its historical experience from previous stock option grants. The Company estimates the volatility of its common stock by analyzing its historical volatility and considering volatility data of its peer group and their implied volatility. The Company estimates the forfeiture rate based on historical experience of its stock-based awards that are granted, exercised, and cancelled.
The fair value of options granted to employees during the years ended December 31, 2009, 2008 and 2007 were determined using the following weighted-average assumptions for employee grants:
| Year Ended December 31, | ||||||||||||
| 2009 | 2008 | 2007 | ||||||||||
| Expected life (in years) |
4.36 | 3.95 | 4.29 | |||||||||
| Risk-free interest rate |
1.82 | % | 2.40 | % | 4.29 | % | ||||||
| Expected volatility |
69 | % | 55 | % | 47 | % | ||||||
| Dividend yield |
— | — | — | |||||||||
| Weighted-average estimated fair value of options granted during the period |
$ | 4.27 | $ | 4.13 | $ | 3.31 | ||||||
During 2009, the Company granted options to purchase a total of 90,000 shares of common stock to members of its Board of Directors at $7.64 per share which vest quarterly over a one year period. The fair value of these options granted was based on the following assumptions: expected life from grant date (in years) of 2.4 years; risk-free interest rate of 1.06%; expected volatility of 80.4%; dividend yield of 0% for a weighted average estimated fair value of $3.63 per share.
A summary of the Company’s stock option activity for the year ended December 31, 2009 is as follows:
| Options Outstanding | |||||||||||
| Number of Shares |
Weighted- Average Exercise Price |
Weighted-Average Remaining Contractual Term (in years) |
Aggregate Intrinsic Value | ||||||||
| (In thousands) | (In thousands)(1) | ||||||||||
| Balance at December 31, 2008 |
12,131 | $ | 6.18 | ||||||||
| Options granted |
1,696 | $ | 7.90 | ||||||||
| Exercised |
(1,866 | ) | $ | 3.78 | |||||||
| Canceled |
(1,082 | ) | $ | 8.97 | |||||||
| Balance at December 31, 2009 |
10,879 | $ | 6.58 | 7.5 | $ | 108,579 | |||||
| Exercisable as of December 31, 2009 |
5,804 | $ | 5.40 | 6.9 | $ | 64,886 | |||||
| Vested and expected to vest(2) |
10,247 | $ | 6.48 | 7.5 | $ | 103,468 | |||||
| (1) | The aggregate intrinsic value is calculated as the difference between the exercise price of the underlying awards and the closing stock price of $16.58 of our common stock on December 31, 2009. |
| (2) | Options expected to vest reflect an estimated forfeiture rate. |
73
Table of Contents
SUCCESSFACTORS, INC.
Notes to Consolidated Financial Statements—(Continued)
Additional information regarding options outstanding as of December 31, 2009, is as follows:
| Options Outstanding | Options Exercisable | |||||||||||
| Range of Exercise Prices |
Shares Subject to Options |
Weighted-Average Remaining Contractual Life (in years) |
Weighted- Average Exercise Price per Share |
Shares Subject to Options |
Weighted- Average Exercise Price per Share | |||||||
| (In thousands) | (In thousands) | |||||||||||
| $0.02 – $1.30 |
2,287 | 5.74 | $ | 0.98 | 2,213 | $ | 0.97 | |||||
| 1.60 – 7.28 |
2,231 | 8.23 | 4.67 | 594 | 4.08 | |||||||
| 7.56 – 8.31 |
989 | 8.62 | 8.03 | 258 | 8.03 | |||||||
| 8.50 – 8.50 |
2,300 | 7.51 | 8.50 | 1,377 | 8.50 | |||||||
| 8.75 – 16.71 |
3,072 | 8.02 | 10.29 | 1,362 | 9.55 | |||||||
| Total |
10,879 | 7.53 | $ | 6.60 | 5,804 | $ | 5.40 | |||||
The weighted-average grant-date fair value of options granted during the years ended December 31 2009, 2008, and 2007 was $4.27, $4.13, and $3.31, respectively. The total intrinsic value of options exercised during the years ended December 31, 2009, 2008, and 2007, was $10.6 million, $13.3 million, and $33.5 million, respectively. The total grant date fair value of stock options that vested during the years ended December 31, 2009, 2008 and 2007 was $2.7 million, $1.2 million and $2.2 million respectively. As of December 31, 2009 there was $16.3 million of unrecognized stock-based compensation cost related to stock options. The unrecognized compensation cost is expected to be recognized over an average period of 2.29 years.
There was no capitalized stock-based employee compensation cost and there were no recognized stock-based compensation tax benefits during the years ended December 31, 2009, 2008 and 2007.
The following table summarizes the activity for the Company’s unvested restricted stock units (RSUs) for the year ended December 31, 2009:
| Unvested Restricted Stock Units | ||||||
| Number of Shares |
Weighted-Average Grant-Date Fair Value | |||||
| (In thousands) | ||||||
| Unvested at December 31, 2008 |
260 | $ | 10.84 | |||
| Granted |
1,211 | 11.59 | ||||
| Vested |
(74 | ) | 10.07 | |||
| Forfeited |
(7 | ) | 13.92 | |||
| Unvested at December 31, 2009 |
1,390 | $ | 11.52 | |||
| Expected to vest after December 31, 2009(1) |
1,205 | |||||
| (1) | RSUs expected to vest reflect an estimated forfeiture rate. |
As of December 31, 2009, there was $11.7 million of unrecognized compensation cost related to employee RSUs. This amount is expected to be recognized over a weighted average period of 3.40 years.
Stock Awards Issued to Non-employees
The Company accounts for stock awards issued to non-employees based on the fair value of the equity instrument issued. During the years ended December 31, 2009, 2008 and 2007, the Company granted options to
74
Table of Contents
SUCCESSFACTORS, INC.
Notes to Consolidated Financial Statements—(Continued)
purchase 18,000, 0 and 10,000 shares of common stock, respectively, to non-employees. The Company recorded stock-based compensation expense of $181,000, $108,000 and $27,000 for the fair value of stock options granted to non-employees during the years ended December 31, 2009, 2008 and 2007, respectively.
Common Stock
The Company had reserved shares of common stock for future issuance as follows (in thousands):
| As of December 31, | ||||
| 2009 | 2008 | |||
| Stock Plans: |
||||
| Options and awards outstanding |
12,269 | 12,391 | ||
| Stock available for future grants |
5,159 | 4,995 | ||
| 17,428 | 17,386 | |||
7. Net Loss Per Common Share
Basic net loss per common share is computed by dividing the net loss by the weighted-average number of common shares outstanding for the period. Diluted net loss per common share is computed by giving effect to all potentially dilutive common shares, including options and warrants. Basic and diluted net loss per common share was the same for all periods presented as the impact of all potentially dilutive securities outstanding was anti-dilutive. Securities that could potentially dilute basic net income per share in the future as of December 31, 2009, 2008 and 2007 were 12.3 million, 12.4 million and 13.6 million, respectively.
The following table sets forth the computation of net loss per common share (in thousands, except per share data):
| Year Ended December 31, | ||||||||||||
| 2009 | 2008 | 2007 | ||||||||||
| Net loss |
$ | (12,634 | ) | $ | (64,952 | ) | $ | (75,454 | ) | |||
| Weighted average common shares outstanding, net of weighted-average shares subject to repurchase |
59,534 | 53,803 | 9,036 | |||||||||
| Net loss per common share, basic and diluted |
$ | (0.21 | ) | $ | (1.21 | ) | $ | (8.35 | ) | |||
8. Income Taxes
The Company’s geographical breakdown of its loss before provision for income taxes is as follows (in thousands):
| Year Ended December 31, | ||||||||||||
| 2009 | 2008 | 2007 | ||||||||||
| Domestic |
$ | (12,500 | ) | $ | (65,307 | ) | $ | (75,669 | ) | |||
| Foreign |
1,188 | 1,119 | 640 | |||||||||
| Loss before provision for income taxes |
$ | (11,312 | ) | $ | (64,188 | ) | $ | (75,029 | ) | |||
75
Table of Contents
SUCCESSFACTORS, INC.
Notes to Consolidated Financial Statements—(Continued)
The components of the provision for income taxes are as follows (in thousands):
| Year Ended December 31, | ||||||||||||
| 2009 | 2008 | 2007 | ||||||||||
| Current provision: |
||||||||||||
| Federal |
$ | (7 | ) | $ | (8 | ) | $ | — | ||||
| State |
(4 | ) | — | (40 | ) | |||||||
| Foreign |
1,333 | 772 | 465 | |||||||||
| Total current provision |
1,322 | 764 | 425 | |||||||||
| Deferred provision: |
||||||||||||
| Federal |
— | — | — | |||||||||
| State |
— | — | — | |||||||||
| Foreign |
— | — | — | |||||||||
| Total deferred provision |
— | — | — | |||||||||
| Total |
$ | 1,322 | $ | 764 | $ | 425 | ||||||
A reconciliation of the benefit for income taxes at the statutory rate to the Company’s provision for income taxes is as follows (in thousands):
| Year Ended December 31, | ||||||||||||
| 2009 | 2008 | 2007 | ||||||||||
| Tax benefit at federal statutory rate |
$ | (3,846 | ) | $ | (21,789 | ) | $ | (26,260 | ) | |||
| State taxes, net of federal benefit |
(567 | ) | (3,924 | ) | (4,422 | ) | ||||||
| Research and development credits |
(878 | ) | (1,468 | ) | (911 | ) | ||||||
| Foreign operations taxes at different rates |
802 | 323 | 203 | |||||||||
| Stock compensation |
1,353 | 3,331 | 939 | |||||||||
| Nondeductible expenses |
294 | 614 | 1,351 | |||||||||
| Change in valuation allowance |
4,164 | 23,677 | 29,525 | |||||||||
| Provision for income taxes |
$ | 1,322 | $ | 764 | $ | 425 | ||||||
Significant components of the Company’s net deferred tax assets are as follows (in thousands):
| As of December 31, | ||||||||
| 2009 | 2008 | |||||||
| Deferred tax assets: |
||||||||
| Reserves and accruals |
$ | 5,697 | $ | 5,005 | ||||
| Deferred revenue |
8,209 | 6,575 | ||||||
| Depreciation and amortization |
9,359 | 1,343 | ||||||
| Net operating loss carryforwards |
53,331 | 60,711 | ||||||
| Stock-based compensation |
3,939 | 2,278 | ||||||
| Tax credit carryforwards |
4,293 | 3,787 | ||||||
| Other |
625 | — | ||||||
| Total deferred tax assets |
85,453 | 79,699 | ||||||
| Deferred tax liabilities |
— | — | ||||||
| Gross deferred tax assets |
85,453 | 79,699 | ||||||
| Valuation allowance |
(85,453 | ) | (79,699 | ) | ||||
| Net deferred tax assets |
$ | — | $ | — | ||||
76
Table of Contents
SUCCESSFACTORS, INC.
Notes to Consolidated Financial Statements—(Continued)
Recognition of deferred tax assets is appropriate when realization of these assets is more likely than not. Based upon the weight of available evidence, which includes the Company’s historical operating performance and the recorded cumulative net losses in all prior fiscal periods, the Company has provided a full valuation allowance against its U.S. deferred tax assets. The Company’s valuation allowance increased by $5.8 million, $25.9 million and $28.6 million in the years ended December 31, 2009, 2008 and 2007, respectively.
As of December 31, 2009, the Company had U.S. federal and state net operating losses of approximately $146.3 million and $151.8 million, respectively. Of these amounts, $14.5 million and $1.9 million, respectively, represent tax deductions from stock option compensation which will be recorded as an adjustment to additional paid-in capital when they reduce taxes payable. The U.S. federal net operating loss carryforwards will expire at various dates beginning in 2021 through 2029 if not utilized. Most state net operating loss carryforwards will expire at various dates beginning in 2013 through 2029.
The Company uses the ‘with-and-without’ approach to determine the recognition and measurement of excess tax benefits. Accordingly, the Company has elected to recognize excess income tax benefits from stock option exercises in additional paid in capital only if an incremental income tax benefit would be realized after considering all other tax attributes presently available to the Company. As of December 31, 2009, the amount of such excess tax benefits from stock options included in net operating losses was $14.5 million. In addition, the Company has elected to account for the indirect effects of stock-based awards on other tax attributes, such as the research and alternative minimum tax credits, through the income statement.
As of December 31, 2009, the Company had U.S. federal and state tax credit carryforwards of approximately $2.4 million and $2.4 million, respectively. The federal credit will expire at various dates beginning in 2021 through 2029, if not utilized. California state research and development credits can be carried forward indefinitely. The Company also has foreign tax credits of approximately $0.3 million which will expire between 2016 and 2017 if not utilized.
Net operating loss carryforwards and credit carryforwards reflected above may become subject to limitations due to ownership changes as provided in the Internal Revenue Code and similar state provisions.
As of December 31, 2007, the Company had gross unrecognized tax benefits of approximately $1.1 million, of which $47,000 would impact the effective tax rate if recognized. As of December 31, 2008, the Company had gross unrecognized tax benefits of approximately $1.8 million, of which $855,000 would impact the effective tax rate if recognized. As of December 31, 2009, the Company had gross unrecognized tax benefits of approximately $2.7 million, of which $1.6 million would impact the effective tax rate if recognized. While it is often difficult to predict the final outcome of any particular uncertain tax position, management does not believe that it is reasonably possible that the estimates of unrecognized tax benefits will change significantly in the next twelve months.
The Company recognizes interest accrued and penalties related to unrecognized tax benefits in its income tax provision. As of December 31, 2009, the accrual for interest and penalties included in the income tax provision was not significant.
77
Table of Contents
SUCCESSFACTORS, INC.
Notes to Consolidated Financial Statements—(Continued)
A reconciliation of the beginning and ending amount of unrecognized tax benefits for the years ended December 31, 2009 and 2008, is as follows (in thousands):
| 2009 | 2008 | ||||||
| Balance at January 1 |
$ | 1,844 | $ | 1,134 | |||
| Additions based on tax positions taken during a prior period |
271 | 164 | |||||
| Reductions based on tax positions taken during a prior period |
— | (61 | ) | ||||
| Additions based on tax positions taken during the current period |
632 | 607 | |||||
| Reductions based on tax positions taken during the current period |
— | — | |||||
| Balance at December 31 |
$ | 2,747 | $ | 1,844 | |||
In many cases the Company’s uncertain tax positions are related to tax years that remain subject to examination by tax authorities. The following describes the open tax years, by major tax jurisdiction, as of December 31, 2009:
| United States—Federal |
2003—present | |
| United States—State |
2003—present | |
| Foreign |
2006—present |
9. Employee Benefit Plans
The Company has a 401(k) plan covering all eligible employees. Participants may contribute up to a maximum of $16,500 and $15,500 in pre-tax contributions and up to $5,500 and $5,000 of pre-tax catch-up contributions if 50 years of age or older for calendar years 2009 and 2008 respectively. The Company is not required to contribute to the plan. The Company made no contributions in 2009 and 2007 and contributed approximately $675,000 in fiscal 2008.
10. Subsequent Events
On February 4, 2010, the Company announced that it had entered into a definitive agreement to acquire Inform, a privately held company focused on performance measurement and workforce planning software. The Company anticipates closing this transaction in July of 2010 and that the Company will pay approximately $25 million in cash and issue approximately 907,000 shares of its common stock as consideration for 100% of the outstanding shares of Inform. The transaction will be accounted for as an acquisition of a business.
The Company has evaluated all subsequent events through February 26, 2010, the filing date of this Form 10-K with the SEC
78
Table of Contents
SUCCESSFACTORS, INC.
Notes to Consolidated Financial Statements—(Continued)
11. Selected Quarterly Financial Data (unaudited) (in thousands, expect per share data)
| Quarter Ended | ||||||||||||||||
| Mar. 31, 2009 |
June 30, 2009 |
Sept. 30, 2009 |
Dec. 31, 2009 |
|||||||||||||
| Revenue |
$ | 35,220 | $ | 36,940 | $ | 38,685 | $ | 42,209 | ||||||||
| Gross profit |
26,731 | 28,993 | 29,854 | 32,153 | ||||||||||||
| Loss from operations |
(5,620 | ) | (2,358 | ) | (2,078 | ) | (2,066 | ) | ||||||||
| Net loss |
$ | (5,682 | ) | $ | (2,321 | ) | $ | (1,972 | ) | $ | (2,659 | ) | ||||
| Net loss per common share, basic and diluted |
$ | (0.10 | ) | $ | (0.04 | ) | $ | (0.03 | ) | $ | (0.04 | ) | ||||
| Quarter Ended | ||||||||||||||||
| Mar. 31, 2008 |
June 30, 2008 |
Sept. 30, 2008 |
Dec. 31, 2008 |
|||||||||||||
| Revenue |
$ | 23,461 | $ | 25,714 | $ | 29,712 | $ | 33,026 | ||||||||
| Gross profit |
14,125 | 16,470 | 19,525 | 22,957 | ||||||||||||
| Loss from operations |
(19,785 | ) | (19,869 | ) | (20,388 | ) | (5,926 | ) | ||||||||
| Net loss |
$ | (19,298 | ) | $ | (19,287 | ) | $ | (20,388 | ) | $ | (5,979 | ) | ||||
| Net loss per common share, basic and diluted |
$ | (0.37 | ) | $ | (0.37 | ) | $ | (0.37 | ) | $ | (0.11 | ) | ||||
(a)(2) Financial Statement Schedules
All financial statement schedules are omitted because they are not applicable or the information is included in Registrant’s consolidated financial statements or related notes.
(a)(3) Exhibits
The exhibit list in the Index to Exhibits is incorporated herein by reference as the list of exhibits required as part of this report.
79
Table of Contents
Pursuant to the requirements of the Securities Exchange Act of 1934, Registrant has duly caused this report to be signed on its behalf by the undersigned thereunto duly authorized.
| SUCCESSFACTORS, INC. | ||
| By: | /s/ LARS DALGAARD | |
| Name: | Lars Dalgaard | |
| Title: | President and Chief Executive Officer | |
Date: February 26, 2010
POWER OF ATTORNEY
KNOW ALL THESE, PERSONS BY THESE PRESENTS, that each person whose signature appears below constitutes and appoints Lars Dalgaard and Bruce Felt, and each of them, his or her attorneys-in-fact, each with full power of substitution, for him or her in any and all capacities, to sign any and all amendments to this Annual Report on Form 10-K, and to file the same, with exhibits thereto and other documents in connection therewith, with the Securities and Exchange Commission, hereby ratifying and confirming all that each said attorneys-in-fact or his or her substitute or substitutes, may do or cause to be done by virtue hereof.
Pursuant to the requirements of the Securities Exchange Act of 1934, as amended, this report has been signed below by the following persons in behalf of the Registrant in the capacities and on the dates indicated.
| Signature |
Title |
Date | ||
| /s/ LARS DALGAARD Lars Dalgaard |
President, Chief Executive Officer and Director |
February 26, 2010 | ||
| /s/ BRUCE FELT Bruce Felt |
Chief Financial Officer |
February 26, 2010 | ||
| /s/ DAVID N. STROHM David N. Strohm |
Chairperson of the Board of Directors |
February 26, 2010 | ||
| /s/ DOUGLAS J. BURGUM Douglas J. Burgum |
Director |
February 26, 2010 | ||
| /s/ ERIC C. W. DUNN Eric C. W. Dunn |
Director |
February 26, 2010 | ||
| /s/ WILLIAM E. MCGLASHAN, JR. William E. McGlashan, Jr. |
Director |
February 26, 2010 | ||
| /s/ ELIZABETH NELSON Elizabeth Nelson |
Director |
February 26, 2010 | ||
| /s/ DAVID G. WHORTON David G. Whorton |
Director |
February 26, 2010 | ||
80
Table of Contents
EXHIBIT INDEX
| Exhibit No. |
Document | |
| 3.1 |
Restated Certificate of Incorporation of Registrant.(6) | |
| 3.2 |
Amended and Restated Bylaws of Registrant.(6) | |
| 4.1 |
Form of Registrant’s common stock certificate.(1) | |
| 4.2 |
Fourth Amended and Restated Investor Rights Agreement, dated as of May 19, 2006, between Registrant and certain Stockholders of Registrant.(2) | |
| 10.1 |
Form of Indemnity Agreement entered into between Registrant and its directors and executive officers.(2) | |
| 10.2* |
2001 Stock Option Plan.(2) | |
| 10.3* |
Form of Stock Option Agreement and Exercise Notice and Restricted Stock Purchase Agreement under the 2001 Stock Option Plan.(2) | |
| 10.4* |
2007 Equity Incentive Plan.(3) | |
| 10.5* |
Form of Notice of Stock Option Grant, Stock Option Agreement and Stock Option Exercise Agreement, Notice of Restricted Stock Award Grant and Restricted Stock Purchase Agreement, Notice of Restricted Stock Unit Grant and Restricted Stock Unit Agreement, Notice of Stock Bonus Award Grant and Stock Bonus Agreement and Notice of Stock Appreciation Right Grant and Stock Appreciation Right Agreement under the 2007 Equity Incentive Plan.(4) | |
| 10.6* |
Offer Letter, dated October 10, 2006, between Registrant and Bruce C. Felt, Jr.(2) | |
| 10.7 |
(Intentionally Omitted) | |
| 10.8 |
Office Lease Agreement, dated August 24, 2006, between Registrant and CLPF-BridgePointe, L.P.(2) | |
| 10.9 |
e-business Hosting Agreement, dated June 30, 2003, between Registrant and International Business Machines Corporation.(2) | |
| 10.16* |
Employment Letter Agreement, dated July 19, 2007, between Registrant and Lars Dalgaard.(2) | |
| 10.17* |
Offer Letter, dated July 16, 2007, between Registrant and Paul Albright(6) | |
| 10.18* |
Offer Letter, dated August 28, 2007, between Registrant and Jay Larson(6) | |
| 10.19* |
Offer Letter, dated July 23, 2009, between Registrant and Vicki Bernholz. | |
| 23.1 |
Consent of Ernst & Young LLP, Independent Registered Public Accounting Firm. | |
| 24.1 |
Power of Attorney (included on the signature page hereto) | |
| 31.1 |
Certification of Chief Executive Officer pursuant to Exchange Act Rule 13a-14(a) or 15(d)-14(a), as adopted pursuant to Section 302 of the Sarbanes-Oxley Act of 2002. | |
| 31.2 |
Certification of Chief Financial Officer pursuant to Exchange Act Rule 13a-14(a) or 15(d)-14(a), as adopted pursuant to Section 302 of the Sarbanes-Oxley Act of 2002. | |
| 32.1 |
Certification of Chief Executive Officer pursuant to 18 U.S.C. Section 1350, as adopted pursuant to Section 906 of the Sarbanes-Oxley Act of 2002. | |
| 32.2 |
Certification of Chief Financial Officer pursuant to 18 U.S.C. Section 1350, as adopted pursuant to Section 906 of the Sarbanes-Oxley Act of 2002. | |
| (1) | Incorporated by reference to the Exhibits filed with Amendment No. 4 to the Company’s Registration Statement on Form S-1, filed on October 31, 2007 (File No. 333-144758). |
81
Table of Contents
| (2) | Incorporated by reference to the Exhibits filed with the Company’s Registration Statement on Form S-1, filed on July 20, 2007 (File No. 333-144758). |
| (3) | Incorporated by reference to the Exhibits filed with Amendment No. 8 to the Company’s Registration Statement on Form S-1, filed on November 13, 2007 (File No. 333-144758). |
| (4) | Incorporated by reference to the Exhibits filed with Amendment No. 7 to the Company’s Registration Statement on Form S-1, filed on November 9, 2007 (File No. 333-144758). |
| (5) | Incorporated by reference to the Exhibit filed with Amendment No. 1 Company’s Registration Statement on Form S-1, filed on August 31, 2007 (File No. 333-144758). |
| (6) | Incorporated by reference to the Exhibit filed with the Company’s Annual Report on Form 10-K, filed on March 5, 2008 (File No. 001-33755). |
| * | Indicates management contract or compensatory plan or arrangement. |
82