Attached files
Table of Contents
UNITED STATES
SECURITIES AND EXCHANGE COMMISSION
WASHINGTON, D.C. 20549
FORM 10-K
| x | ANNUAL REPORT PURSUANT TO SECTION 13 OR 15(d) OF SECURITIES EXCHANGE ACT OF 1934 |
For the fiscal year ended December 31, 2009
or
| ¨ | TRANSITION REPORT PURSUANT TO SECTION 13 OR 15(d) OF THE SECURITIES EXCHANGE ACT OF 1934 |
For the transition period from to
Commission file number 0-26016
PALMETTO BANCSHARES, INC.
(Exact name of registrant as specified in its charter)
| South Carolina | 74-2235055 | |
| (State or other jurisdiction of incorporation or organization) | (IRS Employer Identification No.) | |
| 306 East North Street, Greenville, South Carolina | 29601 | |
| (Address of principal executive offices) | (Zip Code) | |
| (800) 725-2265 | palmettobank.com | |
| (Registrant’s telephone number) | (Registrant’s subsidiary’s web site) | |
Securities registered pursuant to Section 12(b) of the Act: None
Securities registered pursuant to Section 12(g) of the Act:
Common Stock, par value $5.00 per share
(Title of class)
Indicate by check mark if the registrant is a well-known seasoned issuer, as defined in Rule 405 of the Securities Act. Yes ¨ No x
Indicate by check mark if the registrant is not required to file reports pursuant to Section 13 or Section 15(d) of the Act. Yes ¨ No x
Indicate by check mark whether the registrant (1) has filed all reports required to be filed by Section 13 or 15(d) of the Securities Exchange Act of 1934 during the preceding 12 months (or for such shorter period that the registrant was required to file such reports), and (2) has been subject to such filing requirements for the past 90 days. Yes x No ¨
Indicate by check mark whether the registrant has submitted electronically and posted on its corporate Web site, if any, every Interactive Data File required to be submitted and posted pursuant to Rule 405 of Regulation S-T (§232.405 of this chapter) during the preceding 12 months (or for such shorter period that the registrant was required to submit and post such files). Yes ¨ No ¨
Indicate by check mark if disclosure of delinquent filers pursuant to Item 405 of Regulation S-K is not contained herein, and will not be contained, to the best of registrant’s knowledge, in definitive proxy or information statements incorporated by reference in Part III of this Form 10-K or any amendment to this Form 10-K. ¨
Indicate by check mark whether the registrant is a large accelerated filer, an accelerated filer, a non-accelerated filer, or a smaller reporting company. See definitions of “accelerated filer,” “large accelerated filer,” and “smaller reporting company” in Rule 12b-2 of the Act.
| Large accelerated filer ¨ |
Accelerated filer x | |
| Non accelerated filer ¨ |
Smaller reporting company ¨ |
Indicate by check mark whether the registrant is a shell company (as defined by Rule 12b-2 of the Act). Yes ¨ No x
The aggregate market value of the voting and nonvoting common equity held by nonaffiliates of the registrant (computed by reference to the price at which the stock was most recently sold) was $215,257,140 as of the last business day of the registrant’s most recently completed second fiscal quarter. There is no established public trading market for the shares. See Part II, Item 5.
6,495,130 shares of the registrant’s common stock were outstanding as of February 25, 2010.
DOCUMENTS INCORPORATED BY REFERENCE
The Company’s Proxy Statement with respect to an Annual Meeting of Shareholders to be held May 11, 2010 is incorporated by reference in Part III of this Form 10-K.
Table of Contents
PALMETTO BANCSHARES, INC. AND SUBSIDIARY
2009 ANNUAL REPORT ON FORM 10-K
| PART I | ||||
| 1 | ||||
| ITEM 1. |
2 | |||
| ITEM 1A. |
19 | |||
| ITEM 1B. |
29 | |||
| ITEM 2. |
29 | |||
| ITEM 3. |
31 | |||
| ITEM 4. |
31 | |||
| PART II | ||||
| ITEM 5. |
MARKET FOR REGISTRANT’S COMMON EQUITY, RELATED SHAREHOLDER MATTERS AND ISSUER PURCHASES OF EQUITY SECURITIES | 32 | ||
| ITEM 6. |
35 | |||
| ITEM 7. |
MANAGEMENT’S DISCUSSION AND ANALYSIS OF FINANCIAL CONDITION AND RESULTS OF OPERATIONS | 36 | ||
| 36 | ||||
| 36 | ||||
| 42 | ||||
| 47 | ||||
| 77 | ||||
| 78 | ||||
| 83 | ||||
| 95 | ||||
| 95 | ||||
| ITEM 7A. |
96 | |||
| ITEM 8. |
98 | |||
| ITEM 9. |
CHANGES IN AND DISAGREEMENTS WITH ACCOUNTANTS ON ACCOUNTING AND FINANCIAL DISCLOSURE | 157 | ||
| ITEM 9A. |
157 | |||
| ITEM 9B. |
157 | |||
| PART III | ||||
| ITEM 10. |
DIRECTORS, EXECUTIVE OFFICERS AND CORPORATE GOVERNANCE | 158 | ||
| ITEM 11. |
158 | |||
| ITEM 12. |
SECURITY OWNERSHIP OF CERTAIN BENEFICIAL OWNERS AND MANAGEMENT AND RELATED SHAREHOLDER MATTERS | 158 | ||
| ITEM 13. |
CERTAIN RELATIONSHIPS AND RELATED TRANSACTIONS, AND DIRECTOR INDEPENDENCE | 158 | ||
| ITEM 14. |
158 | |||
| PART IV | ||||
| ITEM 15. |
EXHIBITS, FINANCIAL STATEMENT SCHEDULES | 159 | ||
| 161 | ||||
| 163 | ||||
Table of Contents
This report, including information included or incorporated by reference in this document, contains statements which constitute forward-looking statements within the meaning of Section 27A of the Securities Act of 1933 and Section 21E of the Securities Exchange Act of 1934. Forward-looking statements relate to the financial condition, results of operations, plans, objectives, future performance, and business of our Company. Forward-looking statements are based on many assumptions and estimates and are not guarantees of future performance. Our actual results may differ materially from those anticipated in any forward-looking statements as they will depend on many factors about which we are unsure including many factors which are beyond our control. The words “may,” “would,” “could,” “should,” “will,” “expect,” “anticipate,” “predict,” “project,” “potential,” “continue,” “assume,” “believe,” “intend,” “plan,” “forecast,” “goal,” and “estimate” as well as similar expressions are meant to identify such forward-looking statements. Potential risks and uncertainties that could cause our actual results to differ materially from those anticipated in our forward-looking statements include, but are not limited to, the following:
| • | Reduced earnings due to higher credit losses generally and specifically because losses in the sectors of our loan portfolio secured by real estate are greater than expected due to economic factors, including declining real estate values, increasing interest rates, increasing unemployment, or changes in payment behavior or other factors, |
| • | Reduced earnings due to higher credit losses because our loans are concentrated by loan type, industry segment, borrower type, or location of the borrower or collateral, |
| • | The rate of delinquencies and amounts of loans charged-off, |
| • | The adequacy of the level of our allowance for loan losses, |
| • | Our efforts to raise capital or otherwise increase our regulatory capital ratios, |
| • | The impact of our efforts to raise capital on our financial position, liquidity, capital, and profitability, |
| • | Our ability to retain our existing customers, including our deposit relationships, |
| • | The rates of loan growth in recent years and the lack of seasoning of a portion of our loan portfolio, |
| • | The amount of our loan portfolio collateralized by real estate, and the weakness in the real estate market, |
| • | Increased funding costs due to market illiquidity, increased competition for funding, and/or increased regulatory requirements with regard to funding, |
| • | Significant increases in competitive pressure in the banking and financial services industries, |
| • | Changes in the interest rate environment which could reduce anticipated or actual margins, |
| • | Changes in political conditions and the legislative or regulatory environment, |
| • | General economic conditions, either nationally or regionally and especially in our primary service areas, becoming less favorable than expected, resulting in, among other things, a further deterioration in credit quality, |
| • | Changes occurring in business conditions and inflation, |
| • | Changes in technology, |
| • | Changes in deposit flows, |
| • | Changes in monetary and tax policies, |
| • | Changes in accounting principles, policies, or guidelines, |
1
Table of Contents
| • | Our ability to maintain effective internal control over financial reporting, |
| • | Our reliance on available secondary funding sources such as FHLB advances, Federal Reserve Discount Window borrowings, sales of securities and loans, and federal funds lines of credit from correspondent banks to meet our liquidity needs, |
| • | Adverse changes in asset quality and resulting credit risk-related losses and expenses, |
| • | Loss of consumer confidence and economic disruptions resulting from terrorist activities or other military actions, |
| • | Changes in the securities markets, and / or |
| • | Other risks and uncertainties detailed from time to time in our filings with the Securities and Exchange Commission (“SEC”). |
These risks are exacerbated by the recent developments in national and international financial markets, and we are unable to predict what impact these uncertain market conditions will have on us. During 2008 and 2009, the capital and credit markets experienced extended volatility and disruption. There can be no assurance that these unprecedented recent developments will not continue to materially and adversely impact our business, financial condition, and results of operations, as well as our ability to raise capital or other funding for liquidity and business purposes.
We have based our forward-looking statements on our current expectations about future events. Although we believe that the expectations reflected in our forward-looking statements are reasonable, we cannot guarantee that these expectations will be achieved. We undertake no obligation to publicly update or otherwise revise any forward-looking statements whether as a result of new information, future events, or otherwise.
| ITEM 1. | BUSINESS |
Development and Description of Business
Organization
Palmetto Bancshares, Inc. (the “Company”) is a regional bank holding company organized in 1982 under the laws of South Carolina and is headquartered in Greenville, South Carolina. Through the holding company’s subsidiary, The Palmetto Bank (the “Bank”), and the Bank’s wholly-owned subsidiary Palmetto Capital, Inc. (“Palmetto Capital”), we provide a broad array of commercial banking, consumer banking, trust and investment management, and brokerage services throughout our primary market area of northwest South Carolina. Throughout this report, “the Company”, “we”, “us”, or “our” refers to Palmetto Bancshares, Inc. and our subsidiary, the Bank, which includes its brokerage subsidiary, Palmetto Capital, except where the context indicates otherwise.
Since the Company is a holding company and does not conduct operations, the Company’s primary sources of liquidity are debt and equity offerings by the Company, dividends upstreamed from the Bank, funds received through stock option exercises, and funds received through the offering of commercial paper as an alternative investment tool for our commercial customers (referred to as our master note program).
Subsidiary of Palmetto Bancshares. The Bank was organized under South Carolina law in 1906. The Company owns all of the Bank’s stock. The Bank primarily acts as a financial intermediary by attracting deposits from the general public and using those funds, together with borrowed funds, to originate loans and invest in securities.
Significant services offered by the Bank include:
| • | Commercial Banking. The Bank provides commercial banking services to corporations and other business clients. Loans are made for a wide variety of corporate purposes, including financing industrial |
2
Table of Contents
| and commercial properties, construction related to industrial and commercial properties, equipment, inventories and accounts receivable, and acquisition financing. The Bank also provides cash management and merchant services. |
| • | Consumer Banking. The Bank provides consumer banking services, including checking accounts, savings programs, automated teller machines, overdraft facilities, installment and real estate loans, home equity loans and lines of credit, credit cards, drive-in and night deposit services, and safe deposit facilities. |
| • | Trust, Insurance, and Investment Management. The Bank provides trust, investment, agency, insurance, and custodial services for individual and corporate clients. These services include the administration of estates and personal trusts, as well as the management of investment accounts for individuals, employee benefit plans, and charitable foundations. At December 31, 2009, the estimated fair value of trust assets was approximately $238 million. |
Additionally, in conjunction with originating residential mortgage loans, we offer mortgage-servicing services to the secondary market.
Subsidiaries of the Bank. Palmetto Capital is a wholly-owned subsidiary of the Bank and provides brokerage services relating to stocks, treasury and municipal bonds, mutual funds, and insurance annuities, as well as college and retirement planning through a third party arrangement with Raymond James. At December 31, 2009, the estimated fair value of brokerage assets was approximately $181 million.
In 2009, the Bank formed a wholly-owned subsidiary, Palmetto Loan Subsidiary, Inc. To date, there have been no significant operations in this subsidiary.
Our corporate offices and operations center are located at 306 East North, Greenville, South Carolina 29601, and our main telephone number is (800) 725-2265. Our corporate headquarters was relocated to downtown Greenville, South Carolina during March 2009. Our operations center remains at the Laurens location.
The following table summarizes our consolidated assets, revenues, and net income at the dates and for the periods indicated (in thousands).
| At and for the years ended December 31, | |||||||||
| 2009 | 2008 | 2007 | |||||||
| Total consolidated assets |
$ | 1,435,950 | $ | 1,372,275 | 1,248,177 | ||||
| Total consolidated revenues |
84,912 | 97,143 | 100,930 | ||||||
| Total consolidated net income (loss) |
(40,085 | ) | 13,599 | 16,015 | |||||
Market
The Company is a locally oriented, community-based financial services institution. Our local market orientation is reflected in our management and advisory boards, which are comprised of local business persons, professionals, and other community representatives, who assist us in identifying and responding to banking needs within our market. Despite this community-based market focus, we believe we offer many of the products available from larger competitors.
Our primary market area is located within northwest South Carolina and includes the counties of Laurens, Greenville, Spartanburg, Greenwood, Anderson, Cherokee, Abbeville, Pickens, Oconee, and York, the majority of which are referred to as the “Upstate” of South Carolina. We originate most of our loans and deposits in our primary market area.
The Upstate’s ability to attract both small, local companies and major internationally recognized corporations is the result of cooperation between city and state governments and the private sector. We believe
3
Table of Contents
that the Upstate’s entrepreneurial spirit and strong workforce creates a strong magnet for business. Major industries of commerce in the Upstate include the auto industry which is concentrated mainly along the corridor between Greenville and Spartanburg around the BMW manufacturing facility in Greer. Another major industry in the Upstate is healthcare and pharmaceuticals. Greenville Hospital System and Bon Secours St. Francis Health System are the area’s largest in the healthcare sector, while the pharmaceutical corporation of Bausch & Lomb has established regional operations alongside smaller recently developed local companies. The Upstate is also home to a large amount of private sector and university-based research, including research and development facilities for Michelin, Fuji and General Electric, and research centers to support the automotive, life sciences, plastics and photonics industries. Clemson University, BMW, IBM, Microsoft, and Michelin have combined their resources to create International Center for Automotive Research (ICAR), a research park that specializes in the development of automotive technology.
Located adjacent to major transportation corridors such as Interstates 85 and 26 and centrally located between Charlotte, North Carolina and Atlanta, Georgia, the Upstate provides a diversified, broad economic base. We believe that our primary market area is not dependent on any one or a few types of commerce due to the area’s diverse economic base. Our customer base is similarly diverse, although as a community bank our loan portfolio includes concentrations in construction and commercial real estate.
The Upstate also benefits from being an academic center, including Clemson University, Furman University, Wofford College, and Converse College, among others.
Despite being in what we believe are some of the best growth markets in South Carolina, we face the risk of being particularly sensitive to changes in the state and local economies. South Carolina has not been immune to the economic challenges of the past two years. Unemployment has been rising in our markets and property values have declined. Unemployment rates at December 31, 2009 for the following counties were Greenville, 10.5%; Spartanburg, 12.7%; Anderson, 13.4%; and Laurens, 12.2%. The average state unemployment rate for South Carolina at December 31, 2009 was 12.6% compared to 10.0% for the United States (“U.S.”). Continued higher levels of unemployment will continue to impact credit quality. As a result, we are spending significant time on credit solutions for our customers and managing and disposing of real estate acquired in settlement of loans as effectively as possible.
The weakening in the state and local economies has impacted our loan demand and, to a lesser extent, available deposits.
See Item 1A. Risk Factors for a discussion regarding the material risks and uncertainties that may impact our market.
Distribution Channels
The Company, through the Bank, is primarily engaged in the business of commercial and consumer banking through our 29 banking offices in the counties of Laurens, Greenville, Spartanburg, Greenwood, Anderson, Cherokee, Abbeville, Pickens, Oconee, and York. In addition to our banking offices, at December 31, 2009, the Bank had 38 automatic teller machine locations (including ten at nonbanking office locations) and six limited service banking offices located in retirement centers in the Upstate. We provide our commercial banking, consumer banking, trust and investment management, and brokerage services to customers through our banking office network. Additionally, Palmetto Capital maintains a separate investment office location in Greenville County.
We provide customers with access to their funds through extended weekday hours at banking offices, Saturday banking at select banking offices, an automatic teller machine network that incorporates regional and national networks, a call center, and Internet banking.
See Item 1A. Risk Factors for a discussion regarding the material risks and uncertainties that may impact our distribution channels.
4
Table of Contents
Competition
We face substantial competition. Competitors include national banks, regional banks, and other community banks. We also face competition from many other types of financial institutions, including savings and loan associations, finance companies, credit unions, mortgage banks, and other financial intermediaries as well as full service brokerage firms and discount brokerage firms with regard to the services offered by Palmetto Capital. Out-of-state financial intermediaries that have opened loan production offices or that solicit deposits in our market areas also provide competition. In addition to historical competitors, in recent years, money market, stock, and fixed income mutual funds have attracted an increasing share of household savings. Consequently, we consider these funds to be competitors. We compete with major financial companies that have greater resources than we have, which afford them a marketplace advantage by enabling them to maintain numerous locations and mount extensive promotional and advertising campaigns. Additionally, due to their size, many competitors may offer a broader range of products and services as well as better pricing for those products and services than we offer. In addition, banks and other financial institutions with larger capitalization and financial intermediaries not subject to bank regulatory restrictions may have larger lending limits that allow them to serve the lending needs of larger customers. Because larger competitors have advantages in attracting business from larger corporations, we do not generally compete for that business. Instead, we concentrate our efforts on attracting the business of individuals and small and medium-size businesses. With regard to such accounts, we generally compete on the basis of customer service and responsiveness to customer needs, the convenience of banking offices and hours, and the availability and pricing of our products and services.
The following table summarizes the Bank’s deposit market share information, as of June 30, 2009, the most recent date for which data is available from the Federal Deposit Insurance Corporation (the “FDIC”).
| Metropolitan area | ||||||||||||
| Greenville | Anderson | Spartanburg | Combined | |||||||||
| Ranking among all institutions |
6 | 9 | 9 | 6 | ||||||||
| Total institutions |
36 | 21 | 19 | 43 | ||||||||
| Market share among all institutions |
5.09 | % | 4.85 | % | 3.96 | % | 4.81 | % | ||||
| Ranking among South Carolina headquartered institutions |
2 | 5 | 5 | 2 | ||||||||
| Total South Carolina headquartered institutions |
27 | 15 | 13 | 34 | ||||||||
| Market share among South Carolina headquartered institutions |
8.70 | % | 8.30 | % | 8.26 | % | 8.57 | % | ||||
With regard to the entire state of South Carolina, according to the FDIC, as of June 30, 2009, the Bank’s market share ranks 10th out of 107 institutions and 6th out of 90 South Carolina headquartered institutions.
Employees
At December 31, 2009, we had 413 full-time equivalent employees, none of whom were subject to collective bargaining agreements, compared with 415 full-time equivalent employees at December 31, 2008. Based on the current size and scope of business activities of the Company, we are currently focused on the need to hire additional employees with specific expertise and industry knowledge.
Supervision and Regulation
General
We are subject to extensive regulation under federal and state laws. The regulatory framework is intended primarily for the protection of depositors, federal deposit insurance funds, and the banking system as a whole and not for the protection of security holders.
Set forth below is a summary of the significant laws and regulations applicable to the Company and the Bank. The description is qualified in its entirety by reference to the full text of the statutes, regulations, and
5
Table of Contents
policies that are described. Those statutes, regulations, and policies are continually under review by Congress, state legislatures, and federal and state regulatory agencies. A change in statutes, regulations, or regulatory policies applicable to the Company and the Bank could have a material adverse impact on our business, financial condition, results of operations, and cash flows.
See Item 1A. Risk Factors for a discussion regarding the material risks and uncertainties that may impact our supervision and regulation.
Recent Legislative and Regulatory Initiatives to Address Financial and Economic Crises
Congress, the U.S. Department of the Treasury (the “U.S. Treasury”), and the federal banking regulators, including the FDIC, have taken broad action throughout 2008 and 2009 to address volatility in the U.S. banking system.
The Emergency Economic Stabilization Act of 2008 (“EESA”) authorized the Treasury Secretary to purchase from financial institutions and their holding companies up to $700 billion in mortgage loans, mortgage-backed securities, and certain other financial instruments, including debt and equity securities issued by financial institutions and their holding companies in a Troubled Asset Relief Program (“TARP”). The purpose of TARP is to restore confidence and stability to the U.S. banking system and to encourage financial institutions to increase their lending to customers and to each other. The U.S. Treasury allocated $250 billion towards the TARP Capital Purchase Program (“CPP”). Under the CPP, the U.S. Treasury purchases debt or equity securities from participating institutions. The TARP also includes direct purchases or guarantees of troubled assets of financial institutions. Participants in the CPP are subject to executive compensation limits and are encouraged to expand their lending and mortgage loan modifications. Our Board of Directors has determined not to participate in the CPP.
EESA also increased FDIC deposit insurance on most accounts from $100 thousand to $250 thousand. This increase is now in place through December 31, 2013.
Following a systemic risk determination, the FDIC established its Temporary Liquidity Guarantee Program (“TLGP”) in October 2008. Under the interim rule for the TLGP, there are two parts to the program: the Debt Guarantee Program (“DGP”) and the Transaction Account Guarantee Program (“TAGP”). Eligible entities generally are participants unless they exercised an opt-out right in timely fashion.
For the DGP, eligible entities are generally U.S. bank holding companies, savings and loan holding companies, and FDIC-insured institutions. Under the DGP, the FDIC guarantees senior unsecured debt of an eligible entity issued on or after October 14, 2008, and not later than June 30, 2009. The guarantee is effective through the earlier of the maturity date or June 30, 2012. Under an extension of the program, participating entities that issued FDIC-insured debt before April 1, 2009 (and, upon application and approval, participating entities that had not issued such debt before such date) could issue FDIC-guaranteed debt until October 31, 2009, which would be guaranteed through the earlier of maturity or December 31, 2012. The DGP coverage limit is generally 125% of the eligible entity’s eligible debt outstanding on September 30, 2008 and scheduled to mature on or before June 30, 2009. The nonrefundable DGP fee is 75 basis points (annualized) for covered debt with various surcharges ranging from 10 to 50 basis points applicable in certain cases. Eligible debt of a participating entity becomes covered when and as issued until the coverage limit is reached, except that under certain circumstances, participating entities could elect, for a fee, an option to issue non-guaranteed, long-term debt maturing after June 30, 2012, and could apply to issue other non-guaranteed debt. The Company opted out of the DGP. The FDIC has also established a limited, six-month emergency guarantee facility. Under this facility, participating entities can apply to issue FDIC-guaranteed debt during the period October 31, 2009 through April 30, 2010, to be guaranteed through December 31, 2012. For approved applicants, fees of at least 300 basis points will be assigned on a case-by-case basis. We did not apply for the six-month emergency guarantee facility.
6
Table of Contents
For the TAGP, eligible entities are FDIC-insured institutions. Under the TAGP, the FDIC provides unlimited deposit insurance coverage through June 30, 2010 for noninterest-bearing transaction accounts (typically business checking accounts) and certain funds swept into noninterest-bearing savings accounts. Negotiable order of withdrawal (“NOW”) accounts, generally, and money market deposit accounts are not covered, unless an institution opts out of the extension period. Participating institutions pay fees of 10 basis points (annualized) during the period through December 31, 2009, and fees of 15 to 25 basis points (annualized), depending on the Risk Category assigned to the institution, on the balance of each covered account in excess of $250 thousand during the period from January 1, 2010 through June 30, 2010. The Bank participates in the TAGP, and this program has not had a material impact on the FDIC deposit insurance assessment we pay.
EESA has been followed by numerous actions by the Board of Governors of the Federal Reserve (the “Federal Reserve”), Congress, U.S. Treasury, the SEC and others to address the liquidity and credit crisis that has followed the subprime crisis that commenced in 2007. These measures include homeowner relief that encourages loan restructuring and modification; the establishment of significant liquidity and credit facilities for financial institutions and banks; the lowering of the federal funds rate; action against short-term selling practices, the temporary guaranty program for money market funds; the establishment of a commercial paper funding facility to provide back-stop liquidity to commercial paper issuers; and coordinated international efforts to address illiquidity and other weaknesses in the banking sector.
In addition, the Internal Revenue Service has issued guidance in response to the credit crisis, including extension of the net operating loss carryback period from two to five years and a relaxation of limits on the ability of financial institutions that undergo an “ownership change” to utilize their pre-change net operating losses and net unrealized built-in losses. The relaxation of these limits may make it significantly more attractive to acquire financial institutions whose tax basis in their loan portfolios significantly exceeds the fair market value of those portfolios.
Proposed Legislation and Regulatory Action
Legislative and regulatory proposals regarding changes in banking, and the regulation of banks, federal savings institutions, and other financial institutions and bank and bank holding company powers are being considered by the executive branch of the federal government, Congress and various state governments. Certain of these proposals, if adopted, could significantly change the regulation or operations of banks and the financial services industry. New regulations and statutes are regularly proposed that contain wide-ranging proposals for altering the structures, regulations, and competitive relationships of the nation’s financial institutions. On June 17, 2009, the U.S. Treasury released a white paper entitled “Financial Regulatory Reform – A New Foundation: Rebuilding Financial Supervision and Regulation” (the “Proposal”) which calls for sweeping regulatory and supervisory reforms for the entire financial sector and seeks to advance the following six key objectives: (i) promote robust supervision and regulation of financial firms, (ii) establish comprehensive supervision of financial markets, (iii) protect consumers and investors from financial abuse, (iv) provide the government with additional powers to monitor systemic risks, supervise and regulate financial products and markets, and to resolve firms that threaten financial stability, and (v) raise international regulatory standards and improve international cooperation.
The Proposal includes the creation of a new federal government agency, the National Bank Supervisor (“NBS”) that would charter and supervise all federally chartered depository institutions, and all federal branches and agencies of foreign banks. It is proposed that the NBS take over the responsibilities of the Office of the Comptroller of the Currency, which currently charters and supervises nationally chartered banks, and the responsibility for the institutions currently supervised by the Office of Thrift Supervision, which supervises federally chartered savings institutions and federal savings institution holding companies.
The Proposal also includes the creation of a new federal agency designed to enforce consumer protection laws. The Consumer Financial Protection Agency (“CFPA”) would have authority to protect consumers of
7
Table of Contents
financial products and services and to regulate all providers (bank and non-bank) of such services. The CFPA would be authorized to adopt rules for all providers of consumer financial services, supervise and examine such institutions for compliance, and enforce compliance through orders, fines, and penalties. The rules of the CFPA would serve as a “floor” and individual states would be permitted to adopt and enforce stronger consumer protection laws. If adopted as proposed, we may become subject to multiple laws affecting its provision of loans and other credit services to consumers, which may substantially increase the cost of providing such services.
On February 2, 2010, the U.S. President called on the U.S. Congress to create a new Small Business Lending Fund. Under this proposal, $30 billion in TARP funds would be transferred to a new program outside of TARP to support small business lending. As proposed, only small- and medium-sized banks would qualify to participate in the program.
New regulations and statutes are regularly proposed that contain wide-ranging proposals for altering the structures, regulations, and competitive relationships of the nation’s financial institutions. We cannot predict whether or in what form any proposed regulation or statute will be adopted or the extent to which our business may be affected by any new regulation or statute.
Regulatory Agencies
The Company is a legal entity separate and distinct from the Bank, is regulated under the Bank Holding Company Act of 1956 (“BHCA”), and is subject to inspection, examination, and supervision by the Federal Reserve. We are also under the jurisdiction of the SEC and are subject to the disclosure and regulatory requirements of the Securities Act of 1933 and the Securities Exchange Act of 1934.
The Bank is a FDIC-insured, state-chartered banking organization and is subject to various statutory requirements and rules and regulations promulgated and enforced primarily by the Federal Reserve, as our primary federal regulator, the FDIC, as our deposit insurer, and the South Carolina State Board of Financial Institutions (the “State Board”). The Bank is also a member of the Federal Home Loan Bank System (“FHLB”). The Bank is subject to various statutes, rules, and regulations that govern the insurance of deposits, required reserves, allowable investments, loans, mergers, consolidations, issuance of securities, payment of dividends, establishment of banking offices, and other aspects of the business of the Bank. The Company must file reports with the Federal Reserve, and the Bank must file reports with the FDIC concerning our activities and financial condition in addition to obtaining regulatory approvals prior to entering into certain transactions such as mergers with, or acquisitions of, other financial institutions. The Federal Reserve, the State Board, and / or the FDIC conduct periodic examinations to test the applicable entity’s safety and soundness and compliance with various regulatory requirements. This regulation and supervision establishes a comprehensive framework of permitted activities in which we can engage and is intended primarily for the protection of the federal deposit insurance funds and depositors. The regulatory structure also gives the regulatory authorities extensive discretion in connection with their supervisory and enforcement activities and examination policies, including policies with respect to the classification of assets and the establishment of adequate loan loss reserves for regulatory purposes.
Holding Company Activities
BHCA. The Company is a bank holding company. In general, the BHCA limits the business of bank holding companies to banking, managing or controlling banks, and other activities that the Federal Reserve determines to be closely related to banking as to be a proper incident to the business of banking.
Activities that the Federal Reserve has found to be so closely related to banking as to be a proper incident to the business of banking include:
| • | Factoring accounts receivable, |
| • | Making, acquiring, brokering or servicing loans and usual related activities, |
8
Table of Contents
| • | Leasing personal or real property, |
| • | Operating a non-bank depository institution, such as a savings association, |
| • | Trust company functions, |
| • | Financial and investment advisory activities, |
| • | Conducting discount securities brokerage activities, |
| • | Underwriting and dealing in government obligations and money market instruments, |
| • | Providing specified management consulting and counseling activities, |
| • | Performing selected data processing services and support services, |
| • | Acting as agent or broker in selling credit life insurance and other types of insurance in connection with credit transactions, and |
| • | Performing selected insurance underwriting activities. |
The BHCA generally limits acquisitions by bank holding companies that are not qualified as financial holding companies to commercial banks and companies engaged in activities that the Federal Reserve has determined to be so closely related to banking as to be a proper incident thereto.
The BHCA also regulates acquisitions of commercial banks and prohibits us from acquiring direct or indirect control of more than 5% of any class of outstanding voting stock, or substantially all of the assets of, any bank or merging or consolidating with another bank holding company without prior approval of the Federal Reserve. The BHCA also prohibits us from engaging in or acquiring ownership or control of more than 5% of the outstanding voting stock of any company engaged in a nonbanking business unless that business is determined by the Federal Reserve to be closely related to banking or managing or controlling banks.
In addition, and subject to certain exceptions, the BHCA and the Change in Bank Control Act, together with regulations promulgated thereunder, require Federal Reserve approval prior to any person or company acquiring control of a bank holding company. Control is conclusively presumed to exist if an individual or company acquires 25% or more of any class of voting securities of a bank holding company. Following the relaxing of these restrictions by the Federal Reserve in September 2008, control will be rebuttably presumed to exist if a person acquires more than 33% of the total equity of a bank or bank holding company, of which it may own, control, or have the power to vote not more than 15% of any class of voting securities.
Source of Strength Doctrine and other Responsibilities with Respect to the Bank. There are a number of obligations and restrictions imposed by law and regulatory policy on bank holding companies with regard to their depository institution subsidiaries that are designed to minimize potential loss to depositors and to the FDIC insurance funds in the event that the depository institution becomes in danger of defaulting under its obligations to repay deposits. Under a policy of the Federal Reserve, a bank holding company is required to serve as a source of financial strength to its subsidiary depository institutions and to commit resources to support such institutions in circumstances where it might not do so absent such policy. The Federal Reserve also has the authority under the BHCA to require a bank holding company to terminate any activity or relinquish control of a nonbank subsidiary (other than a nonbank subsidiary of a bank) upon the Federal Reserve’s determination that such activity or control constitutes a serious risk to the financial soundness or stability of any subsidiary depository institution of the bank holding company. Further, federal law grants federal bank regulatory authorities additional discretion to require a bank holding company to divest itself of any bank or nonbank subsidiary if the agency determines that divestiture may aid the depository institution’s financial condition. Further, any loans by a bank holding company to a subsidiary bank are subordinate in right of payment to deposits and certain other indebtedness of the subsidiary bank. In the event of a bank holding company’s bankruptcy, any commitment by the bank holding company to a federal bank regulatory agency to maintain the capital of a subsidiary bank at a certain level would be assumed by the bankruptcy trustee and entitled to priority payment.
9
Table of Contents
The State Board of Financial Institutions. As a bank holding company registered under the South Carolina BHCA, we are subject to regulation by the State Board. We must file with the State Board periodic reports with respect to our financial condition, results of income, management, and relationships between the Company and the Bank. Additionally, we must obtain approval from the State Board prior to engaging in acquisitions of banking or nonbanking institutions or assets.
Dividends
The holders of our common stock are entitled to receive dividends, when and if declared by our Board of Directors, out of funds legally available for such dividends. The Company is a legal entity separate and distinct from the Bank and depends on the payment of dividends from the Bank. The Company and the Bank are subject to regulatory policies and requirements relating to the payment of dividends, including requirements to maintain adequate capital above regulatory minimums. Federal regulatory authorities are authorized to determine under certain circumstances that the payment of dividends by a bank holding company or a bank would be an unsafe or unsound practice and to prohibit payment of those dividends. Federal regulatory authorities have indicated that banking organizations should generally pay dividends only out of current income. In addition, as a South Carolina chartered bank, the Bank is subject to limitations on the amount of dividends that it is permitted to pay. In general, a South Carolina state bank may not pay dividends from its capital. All dividends must be paid out of undivided profits then on hand, after deducting expenses, including reserves for losses and bad debts. The Bank is authorized to pay cash dividends up to 100% of net income in any calendar year without obtaining the prior approval of the State Board, provided that the Bank received a composite rating of one or two at the last federal or state regulatory examination. The Bank must obtain approval from the State Board prior to the payment of any other cash dividends. In addition, under the Federal Deposit Insurance Corporation Improvement Act of 1991 (the “FDICIA”), the Bank may not pay a dividend if, after paying the dividend, the Bank would be undercapitalized.
See Item 5. Market For Registrant’s Common Equity, Related Shareholder Matters and Issuer Purchases of Equity Securities for a further discussion regarding matters related to our common stock dividends.
Capital Adequacy and Prompt Corrective Action
Banks and bank holding companies are subject to various regulatory capital requirements administered by state and federal banking agencies. Capital adequacy guidelines and, additionally for banks, prompt corrective action regulations, involve quantitative measures of assets, liabilities, and certain off-balance sheet agreements calculated under regulatory accounting practices. Capital amounts and classifications are also subject to qualitative judgments by regulators about components, risk-weighting, and other factors.
The Federal Reserve and the FDIC have substantially similar risk-based capital ratio and leverage ratio guidelines for banking organizations. The guidelines are intended to ensure that banking organizations have adequate capital given the risk levels of assets and off-balance sheet agreements. Under the guidelines, banking organizations are required to maintain minimum ratios for Tier 1 capital, as defined below, and total capital to risk-weighted assets (including certain off-balance sheet agreements such as letters of credit). For purposes of calculating the ratios, a banking organization’s assets and some of its specified off-balance sheet agreements are assigned to various risk categories. A depository institution’s or holding company’s capital, in turn, is classified in one of the following three tiers, depending on type:
| • | Core Capital (Tier 1). Tier 1 capital includes common equity, retained earnings, qualifying noncumulative perpetual preferred stock, a limited amount of qualifying cumulative perpetual preferred stock at the holding company level, minority interests in equity accounts of consolidated subsidiaries, qualifying trust preferred securities less goodwill, most intangible assets, and certain other assets. |
| • | Supplementary Capital (Tier 2). Tier 2 capital includes, among other things, perpetual preferred stock and trust preferred securities not meeting the Tier 1 definition, qualifying mandatory convertible debt securities, qualifying subordinated debt, and allowances for loan losses, subject to limitations. |
| • | Market Risk Capital (Tier 3). Tier 3 capital includes qualifying unsecured subordinated debt. |
10
Table of Contents
The Company, like other bank holding companies, currently is required to maintain Tier 1 capital and total capital (the sum of Tier 1, Tier 2, and Tier 3 capital) equal to at least 4.0% and 8.0%, respectively, of our total risk-weighted assets (including various off-balance sheet agreements such as letters of credit). At least half of the total capital is required to be Tier 1 capital. In determining the amount of risk-weighted assets, all assets, including certain off-balance sheet agreements, are multiplied by a risk-weight based on the risk inherent in the type of asset. The Bank, like other depository institutions, is required to maintain similar capital levels under capital adequacy guidelines. For a depository institution to be considered well-capitalized under the regulatory framework for prompt corrective action, its Tier 1 and total capital ratios must be at least 6.0% and 10.0% on a risk-weighted basis, respectively.
Bank holding companies and banks subject to the market risk capital guidelines are required to incorporate market and interest rate risk components into their risk-based capital standards. The Company and the Bank are not subject to the market risk capital guidelines.
In addition to the risk-based capital guidelines, bank holding companies and banks are also required to comply with minimum leverage ratio requirements. The Federal Reserve has adopted a minimum Tier 1 (leverage) capital ratio under which a bank holding company must maintain a minimum level of Tier 1 capital to its total adjusted quarterly average assets (as defined for regulatory purposes) of at least 3% in the case of bank holding companies that have the highest regulatory examination ratios and are not contemplating significant growth or expansion. All other bank holding companies are required to maintain a Tier 1 (leverage) capital ratio of at least 4%, unless an appropriate regulatory authority specifies a different minimum. For a depository institution to be considered well-capitalized under the regulatory framework for prompt corrective action, its leverage ratio must be at least 5%. The Federal Reserve has not advised the Company of any specific minimum leverage ratio applicable to it. The FDIC also requires state-chartered, nonmember banks to maintain a minimum leverage ratio similar to that adopted by the Federal Reserve. Under the FDIC’s leverage capital requirement, the Bank is required to maintain a minimum Tier 1 (leverage) capital ratio of not less than 4%.
The Federal Deposit Insurance Act, as amended (the “FDIA”), requires, among other things, the federal banking agencies to take prompt corrective action with respect to depository institutions that do not meet minimum capital requirements. The FDIA sets forth the following five capital tiers: well-capitalized, adequately-capitalized, undercapitalized, significantly-undercapitalized, and critically-undercapitalized. A depository institution’s capital tier depends upon how its capital levels compares with various relevant capital measures and certain other factors, as established by regulation. The relevant capital measures are the total capital ratio, the Tier 1 capital ratio, and the leverage ratio.
Under the regulations adopted by the federal regulatory authorities, a bank will be categorized as:
| • | Well-capitalized if the institution has a total risk-based capital ratio of 10.0% or greater, a Tier 1 risk-based capital ratio of 6.0% or greater, a leverage ratio of 5.0% or greater, and is not subject to any order or written directive by any such regulatory authority to meet and maintain a specific capital level for any capital measure. |
| • | Adequately-capitalized if the institution has a total risk-based capital ratio of 8.0% or greater, a Tier 1 risk-based capital ratio of 4.0% or greater, a leverage ratio of 4.0% or greater, and is not categorized as well-capitalized. |
| • | Undercapitalized if the institution has a total risk-based capital ratio that is less than 8.0%, a Tier 1 risk-based capital ratio of less than 4.0%, or a leverage ratio of less than 4.0%. |
| • | Significantly-undercapitalized if the institution has a total risk-based capital ratio of less than 6.0%, a Tier 1 risk-based capital ratio of less than 3.0%, or a leverage ratio of less than 3.0%. |
| • | Critically-undercapitalized if the institution’s tangible equity is equal to or less than 2.0% of average quarterly tangible assets. |
In addition, an institution may be downgraded to, or deemed to be in, a capital category that is lower than indicated by its capital ratios if it is determined to be in an unsafe or unsound condition or if it receives an
11
Table of Contents
unsatisfactory examination rating with respect to certain matters. A bank’s capital category is determined solely for the purpose of applying prompt corrective action regulations, and the capital category may not constitute an accurate representation of a bank’s overall financial condition or prospects for other purposes.
If a bank is not well-capitalized, it cannot accept brokered deposits without prior FDIC approval and, if approval is granted, cannot offer an effective yield in excess of 75 basis points on interest paid on deposits of comparable size and maturity in such institution’s normal market area for deposits accepted from within its normal market area, or national rate paid on deposits of comparable size and maturity for deposits accepted outside the bank’s normal market area. Thus, for deposits in its own normal market area, the bank must offer rates that are not in excess of 75 basis points over the average local rates. For non-local deposits, the bank must offer rates that are not in excess of 75 basis points over either (1) the bank’s own local rates or (2) the applicable non-local rates. In other words, the bank must adhere to the prevailing rates in its own normal market area for all deposits (whether local or non-local) and also must adhere to the prevailing rates in the non-local area for any non-local deposits. Thus, the bank would be unable to outbid non-local institutions for non-local deposits even if the non-local rates are lower than the rates in the bank’s own normal market area. Moreover, the FDIA generally prohibits a depository institution from making any capital distributions (including payment of a dividend) or paying any management fee to its parent holding company if the depository institution would thereafter be categorized as undercapitalized.
Undercapitalized institutions are subject to growth limitations (an undercapitalized institution may not acquire another institution, establish additional branch offices or engage in any new line of business unless determined by the appropriate federal banking agency to be consistent with an accepted capital restoration plan, or unless the FDIC determines that the proposed action will further the purpose of prompt corrective action) and are required to submit a capital restoration plan. The agencies may not accept a capital restoration plan without determining, among other things, that the plan is based on realistic assumptions and is likely to succeed in restoring the depository institution’s capital. In addition, for a capital restoration plan to be acceptable, the depository institution’s parent holding company must guarantee that the institution will comply with the capital restoration plan. The aggregate liability of the parent holding company is limited to the lesser of an amount equal to 5.0% of the depository institution’s total assets at the time it became categorized as undercapitalized or the amount that is necessary (or would have been necessary) to bring the institution into compliance with all capital standards applicable with respect to such institution as of the time it fails to comply with the plan. If a depository institution fails to submit an acceptable plan, it is categorized as significantly undercapitalized.
Significantly undercapitalized categorized depository institutions may be subject to a number of requirements and restrictions, including orders to sell sufficient voting stock to become categorized as adequately-capitalized, requirements to reduce total assets, and cessation of receipt of deposits from correspondent banks. The appropriate federal banking agency may take any action authorized for a significantly undercapitalized institution if an undercapitalized institution fails to submit an acceptable capital restoration plan or fails in any material respect to implement a plan accepted by the agency. A critically undercapitalized institution is subject to having a receiver or conservator appointed to manage its affairs and for loss of its charter to conduct banking activities.
An insured depository institution may not pay a management fee to a bank holding company controlling that institution or any other person having control of the institution if, after making the payment, the institution, would be undercapitalized. In addition, an institution cannot make a capital distribution, such as a dividend or other distribution that is in substance a distribution of capital to the owners of the institution if following such a distribution the institution would be undercapitalized. Thus, if payment of such a management fee or the making of such would cause a bank to become undercapitalized, it could not pay a management fee or dividend to the bank holding company.
See Item 8. Financial Statements and Supplementary Data, Note 20 for further discussion regarding the capital ratios and leverage ratio of the Company and the Bank.
12
Table of Contents
FDICIA
FDICIA and regulations implementing the FDICIA require, among other things, that management report on the institution’s responsibility for preparing financial statements, establishing and maintaining an internal control structure and procedures for financial reporting, and compliance with designated laws and regulations concerning safety and soundness. The final regulations also require that independent registered public accounting firms attest to, and report separately on, assertions in management’s reports regarding compliance with such laws and regulations using FDIC approved audit procedures. These regulations apply to financial institutions with greater than $1 billion in assets at the beginning of their fiscal year. Accordingly, the Bank is subject to these regulations.
Sarbanes-Oxley Act of 2002 (the “Sarbanes-Oxley Act”)
The Sarbanes-Oxley Act was signed into law on July 30, 2002 in response to public concerns regarding corporate accountability in connection with certain accounting scandals. The stated goals of the Sarbanes-Oxley Act are to increase corporate responsibility, to provide for enhanced penalties for accounting and auditing improprieties at publicly traded companies and to protect investors by improving the accuracy and reliability of corporate disclosures pursuant to the securities laws.
The Sarbanes-Oxley Act generally applies to all companies, both U.S. and non-U.S., that file or are required to file periodic reports with the SEC, under the Securities Exchange Act of 1934.
The Sarbanes-Oxley Act includes very specific additional disclosure requirements and new corporate governance rules, requires the SEC and securities exchanges to adopt extensive additional disclosure, corporate governance and related rules and mandates. The Sarbanes-Oxley Act represents significant federal involvement in matters traditionally left to state regulatory systems, such as the regulation of the accounting profession, and to state corporate law, such as the relationship between a board of directors and management and between a board of directors and its committees.
Deposit Insurance
The Bank’s deposits are insured up to applicable limits by the Deposit Insurance Fund (“DIF”) of the FDIC and are subject to deposit insurance assessments. The FDIC amended its risk-based assessment system for 2007 to implement authority granted by the Federal Deposit Insurance Reform Act of 2005 (“Reform Act”). The DIF is the successor to the Bank Insurance Fund and the Savings Association Insurance Fund, which were merged effective March 31, 2006. As insurer, the FDIC imposes deposit insurance premiums and is authorized to conduct examinations of and to require reporting by FDIC-insured institutions. It also may prohibit any FDIC-insured institution from engaging in any activity the FDIC determines by regulation or order to pose a serious risk to the insurance fund. The FDIC also has the authority to initiate enforcement actions against financial institutions and may terminate the deposit insurance if it determines that the institution has engaged in unsafe or unsound practices or is in an unsafe or unsound condition.
Under the Reform Act, which became law in 2006, we received a one-time assessment credit of $576 thousand that could be applied against future premiums, beginning in 2007, subject to certain limitations. Any remaining credit was to be used to offset up to 90% of subsequent annual assessments through 2010. As of December 31, 2007, approximately $154 thousand of the credit remained available to offset future deposit insurance assessments. This credit was not available to offset Financing Corporation (“FICO”) assessments. FDIC-insured institutions are required to pay FICO assessments, in order to fund the interest on bonds issued to resolve financial institutions’ failures in the 1980s. We fully utilized this credit in 2008.
Under regulations effective January 1, 2007, the FDIC adopted a new risk-based premium system that provides for quarterly assessments based on an insured institution’s ranking in one of four risk categories based upon supervisory and capital evaluations. Assessment rates depend upon the category to which an institution is assigned.
13
Table of Contents
In October 2008, the EESA increased FDIC deposit insurance on most accounts from $100,000 to $250,000. This increase was originally to be in place until the end of 2009. In May 2009, this increased coverage was extended through December 31, 2013. In addition, we are voluntarily participating in the FDIC’s TAGP. Under this program, which in August 2009 was extended through June 30, 2010, all noninterest-bearing transaction accounts are fully guaranteed by the FDIC for the entire amount of the account. Coverage under the program is in addition to and separate from the basic coverage available under the FDIC’s general deposit insurance rules.
During 2009, the FDIC implemented an industry-wide special assessment to bolster the FDIC insurance fund. The FDIC imposed a 5 basis point special assessment on assets less Tier 1 capital with a cap of 10 basis points times deposits. This incremental special assessment was paid to the FDIC at the end of the third quarter 2009. Also effective in 2009, initial base assessment rates were increased by seven basis points to range from 12 basis points to 45 basis points across all risk categories with possible adjustments to these rates based on certain debt-related components. Based on these factors, our FDIC general assessment rates in 2009 increased. The increase in the general assessment was the result of a change in the FDIC assessment matrix, the increase in our deposit base on which the assessment is calculated over the periods presented, and an increase due to our total risk-based capital ratio falling into the adequately-capitalized category during the period.
In September 2009, the FDIC adopted a Notice of Proposed Rulemaking to require insured financial institutions to prepay their estimated quarterly risk-based assessments for the fourth quarter of 2009 and for 2010, 2011 and 2012. Unlike special assessments, prepaid assessments will not immediately impact earnings but require a cash outlay for the full amount of the prepaid assessment. We applied for and received an exemption to the prepayment assessment which would have required a cash payment to the FDIC of $10.6 million in December 2009. Having been granted the waiver, we will continue to pay our FDIC insurance premiums on a quarterly basis. The FDIC Board of Directors also voted to adopt a uniform three-basis point increase in assessment rates effective on January 1, 2011.
Under the Reform Act, the FDIC may pay dividends to insured institutions once the DIF reserve ratio equals or exceeds 1.35% of estimated insured deposits.
The FDIC may terminate the deposit insurance of any insured depository institution, including the Bank, if it determines after a hearing that the institution has engaged in unsafe or unsound practices, is in an unsafe or unsound condition to continue operations, or has violated any applicable law, regulation, rule, order, or condition imposed by the FDIC. It also may suspend deposit insurance temporarily during the hearing process for the permanent termination of insurance if the institution has no tangible capital. If insurance of accounts is terminated, the accounts at the institution at the time of the termination, less subsequent withdrawals, shall continue to be insured for a period of six months to two years, as determined by the FDIC.
Depositor Preference
The FDIA provides that, in the event of the liquidation or other resolution of an insured depository institution, the claims of depositors of the institution, including the claims of the FDIC as subrogee of insured depositors and certain claims for administrative expenses of the FDIC as a receiver, will have priority over other general unsecured claims against the institution. If an insured depository institution fails, insured and uninsured depositors, along with the FDIC, will have priority in payment ahead of unsecured, nondeposit creditors, including us, with respect to any extensions of loans they have made to such insured depository institution.
Community Reinvestment Act of 1977 (“CRA”)
The CRA requires depository institutions to assist in meeting the lending needs of their market areas consistent with safe and sound banking practice. Under the CRA, each depository institution is required to help meet the lending needs of its market areas by, among other things, providing loans to low and moderate income individuals and communities. The CRA does not establish specific lending requirements or programs for
14
Table of Contents
financial institutions nor does it limit an institution’s discretion to develop the types of products and services that it believes are best suited to its particular community consistent with the CRA. A financial institution’s performance is periodically evaluated in the context of information about the institution (financial condition and business strategies), its community (demographic and economic data), and its competitors. Upon completion of a CRA examination, the FDIC rates the overall CRA performance of the financial institution using a four-tiered rating system. These ratings consist of outstanding, satisfactory, needs to improve, and substantial noncompliance. For a financial holding company to commence any new activity permitted by the BHCA or to acquire any company engaged in any new activity permitted by the BHCA, each insured depository institution subsidiary of the financial holding company must have received a rating of at least satisfactory in its most recent examination under the CRA. Furthermore, banking regulators take into account CRA ratings when considering approval of a proposed transaction. The CRA requires public disclosure of an institution’s CRA rating. Our latest CRA rating, as of March 2009, was satisfactory.
Transactions with Affiliates and Insiders
The Company is a legal entity separate and distinct from the Bank and its other subsidiaries. Various legal limitations restrict the Bank from lending or otherwise supplying funds to the Company or its non-bank subsidiaries. The Company and the Bank are subject to Sections 23A and 23B of the Federal Reserve Act and Federal Reserve Regulation W. Section 23A of the Federal Reserve Act places limits on the amount of loans or extensions of credit to, or investments in, or certain other transactions with, affiliates and on the amount of advances to third parties collateralized by the securities or obligations of affiliates. The aggregate of all covered transactions is limited in amount, as to any one affiliate, to 10% of the Bank’s capital and surplus and, as to all affiliates combined, to 20% of the Bank’s capital and surplus. Furthermore, within the foregoing limitations as to amount, each covered transaction must meet specified collateral requirements. The Bank is forbidden to purchase low quality assets from an affiliate.
Section 23B of the Federal Reserve Act, among other things, prohibits an institution from engaging in certain transactions with certain affiliates unless the transactions are on terms substantially the same, or at least as favorable to such institution or its subsidiaries, as those prevailing at the time for comparable transactions with nonaffiliated companies.
Regulation W generally excludes all non-bank and non-savings association subsidiaries of banks from treatment as affiliates, except to the extent that the Federal Reserve decides to treat these subsidiaries as affiliates. The regulation also limits the amount of loans that can be purchased by a bank from an affiliate to not more than 100% of the bank’s capital and surplus.
The Bank is also subject to certain restrictions on extensions of credit to executive officers, directors, certain principal shareholders, and their related interests. Such extensions of credit (i) must be made on substantially the same terms, including interest rates and collateral, as those prevailing at the time for comparable transactions with third parties and (ii) must not involve more than the normal risk of repayment or present other unfavorable features.
Branching
Under current South Carolina law, we may open branch offices throughout South Carolina with the prior approval of the State Board. In addition, with prior regulatory approval, the Bank will be able to acquire existing banking operations in South Carolina. Furthermore, federal legislation has been passed that permits interstate branching by banks if allowed by state law, and interstate merging by banks. However, South Carolina law, with limited exceptions, currently permits branching across state lines only through interstate mergers.
Anti-Tying Restrictions
Under amendments to the BHCA and Federal Reserve regulations, a bank is prohibited from engaging in certain tying or reciprocity arrangements with its customers. In general, a bank may not extend credit, lease, sell
15
Table of Contents
property, or furnish any services or fix or vary the consideration for these on the condition that (i) the customer obtain or provide some additional credit, property, or services from or to the bank, the bank holding company or subsidiaries thereof or (ii) the customer may not obtain some other credit, property, or services from a competitor, except to the extent reasonable conditions are imposed to assure the soundness of the credit extended. Certain arrangements are permissible: a bank may offer combined-balance products and may otherwise offer more favorable terms if a customer obtains two or more traditional bank products; and certain foreign transactions are exempt from the general rule. A bank holding company or any bank affiliate also is subject to anti-tying requirements in connection with electronic benefit transfer services.
Finance Subsidiaries
Under the Gramm-Leach-Bliley Act (the “GLBA”), subject to certain conditions imposed by their respective banking regulators, national and state-chartered banks are permitted to form “financial subsidiaries” that may conduct financial or incidental activities, thereby permitting bank subsidiaries to engage in certain activities that previously were impermissible. The GLBA imposes several safeguards and restrictions on financial subsidiaries, including that the parent bank’s equity investment in the financial subsidiary be deducted from the bank’s assets and tangible equity for purposes of calculating the bank’s capital adequacy. In addition, the GLBA imposes new restrictions on transactions between a bank and its financial subsidiaries similar to restrictions applicable to transactions between banks and non-bank affiliates.
Financial Privacy
In accordance with the GLBA, federal banking regulators adopted rules that limit the ability of banks and other financial institutions to disclose nonpublic information about consumers to nonaffiliated third parties. These limitations require disclosure of privacy policies to consumers and, in some circumstances, allow consumers to prevent disclosure of certain personal information to a nonaffiliated third party.
Consumer Protection Regulations
Activities of the Bank are subject to a variety of statutes and regulations designed to protect consumers. Interest and other charges collected or contracted for by the Bank are subject to state usury laws and federal laws concerning interest rates. The Bank’s loan operations are also subject to federal laws applicable to credit transactions, such as:
| • | The federal Truth-In-Lending Act, governing disclosures of credit terms to consumer borrowers, |
| • | The Home Mortgage Disclosure Act of 1975, requiring financial institutions to provide information to enable the public and public officials to determine whether a financial institution is fulfilling its obligation to help meet the housing needs of the community it serves, |
| • | The Equal Credit Opportunity Act, prohibiting discrimination on the basis of race, creed or other prohibited factors in extending credit, |
| • | The Fair Credit Reporting Act of 1978, as amended by the Fair and Accurate Credit Transactions Act, governing the use and provision of information to credit reporting agencies, certain identity theft protections and certain credit and other disclosures, |
| • | The Fair Debt Collection Act, governing the manner in which consumer debts may be collected by collection agencies, and |
| • | The rules and regulations of the various federal agencies charged with the responsibility of implementing these federal laws. |
The deposit operations of the Bank also are subject to:
| • | The Right to Financial Privacy Act, which imposes a duty to maintain confidentiality of consumer financial records and prescribes procedures for complying with administrative subpoenas of financial records, and |
16
Table of Contents
| • | The Electronic Funds Transfer Act and Regulation E issued by the Federal Reserve Board to implement that Act, which governs automatic deposits to and withdrawals from deposit accounts and customers’ rights and liabilities arising from the use of automated teller machines and other electronic banking services. |
Enforcement Powers
The Bank and its “institution-affiliated parties,” including its management, employees, agents, independent contractors, and consultants such as attorneys and accountants and others who participate in the conduct of the financial institution’s affairs, are subject to potential civil and criminal penalties for violations of law, regulations or written orders of a government agency. These practices can include the failure of an institution to timely file required reports or the filing of false or misleading information or the submission of inaccurate reports. Civil penalties may be as high as $1,000,000 a day for such violations. Criminal penalties for some financial institution crimes have been increased to 20 years. In addition, regulators are provided with greater flexibility to commence enforcement actions against institutions and institution-affiliated parties. Possible enforcement actions include the termination of deposit insurance. Furthermore, banking agencies’ power to issue cease-and-desist orders were expanded. Such orders may, among other things, require affirmative action to correct any harm resulting from a violation or practice, including restitution, reimbursement, indemnifications or guarantees against loss. A financial institution may also be ordered to restrict its growth, dispose of certain assets, rescind agreements or contracts, or take other actions as determined by the ordering agency to be appropriate.
Anti-Money Laundering
Financial institutions must maintain anti-money laundering programs that include established internal policies, procedures and controls; a designated compliance officer; an ongoing employee training program; and testing of the program by an independent audit function. The Company and the Bank are also prohibited from entering into specified financial transactions and account relationships and must meet enhanced standards for due diligence and “knowing your customer” in their dealings with foreign financial institutions and foreign customers. Financial institutions must take reasonable steps to conduct enhanced scrutiny of account relationships to guard against money laundering and to report any suspicious transactions, and recent laws provide law enforcement authorities with increased access to financial information maintained by banks. Anti-money laundering obligations have been substantially strengthened as a result of the USA PATRIOT Act, enacted in 2001 and renewed in 2006. Bank regulators routinely examine institutions for compliance with these obligations and are required to consider compliance in connection with the regulatory review of applications. The regulatory authorities have been active in imposing “cease and desist” orders and money penalty sanctions against institutions found to be violating these obligations.
USA PATRIOT Act
The USA PATRIOT Act became effective on October 26, 2001, amended, in part, the Bank Secrecy Act, and provides, in part, for the facilitation of information sharing among governmental entities and financial institutions for the purpose of combating terrorism and money laundering by enhancing anti-money laundering and financial transparency laws, as well as enhanced information collection tools and enforcement mechanics for the U.S. government, including: (i) requiring standards for verifying customer identification at account opening; (ii) rules to promote cooperation among financial institutions, regulators and law enforcement entities in identifying parties that may be involved in terrorism or money laundering; (iii) reports by nonfinancial trades and businesses filed with the Treasury Department’s Financial Crimes Enforcement Network for transactions exceeding $10,000; and (iv) filing suspicious activities reports by brokers and dealers if they believe a customer may be violating U.S. laws and regulations and requires enhanced due diligence requirements for financial institutions that administer, maintain, or manage private bank accounts or correspondent accounts for non-U.S. persons. Bank regulators routinely examine institutions for compliance with these obligations and are required to consider compliance in connection with the regulatory review of applications.
17
Table of Contents
Under the USA PATRIOT Act, the Federal Bureau of Investigation (“FBI”) can send our banking regulatory agencies lists of the names of persons suspected of involvement in terrorist activities. The Bank can be requested, to search its records for any relationships or transactions with persons on those lists. If the Bank finds any relationships or transactions, it must file a suspicious activity report and contact the FBI.
The Office of Foreign Assets Control (“OFAC”), which is a division of the U.S. Treasury, is responsible for helping to insure that U.S. entities do not engage in transactions with “enemies” of the U.S., as defined by various Executive Orders and Acts of Congress. OFAC has sent, and will send, our banking regulatory agencies lists of names of persons and organizations suspected of aiding, harboring or engaging in terrorist acts. If the Bank finds a name on any transaction, account or wire transfer that is on an OFAC list, it must freeze such account, file a suspicious activity report, and, as appropriate, notify the FBI. The Bank actively checks high-risk OFAC areas such as new accounts, wire transfers and customer files. The Bank performs these checks utilizing software, which is updated each time a modification is made to the lists provided by OFAC and other agencies of Specially Designated Nationals and Blocked Persons.
Privacy and Credit Reporting
Financial institutions are required to disclose their policies for collecting and protecting confidential information. Customers generally may prevent financial institutions from sharing nonpublic personal financial information with nonaffiliated third parties except under narrow circumstances, such as the processing of transactions requested by the consumer or when the financial institution is jointly sponsoring a product or service with a nonaffiliated third party. Additionally, financial institutions generally may not disclose consumer account numbers to any nonaffiliated third party for use in telemarketing, direct mail marketing or other marketing to consumers. It is the Bank’s policy not to disclose any personal information unless required by law.
Like other lending institutions, the Bank utilizes credit bureau data in its underwriting activities. Use of such data is regulated under the Federal Credit Reporting Act on a uniform, nationwide basis, including credit reporting, prescreening, sharing of information between affiliates, and the use of credit data. The Fair and Accurate Credit Transactions Act of 2003 (the “FACT Act”) authorizes states to enact identity theft laws that are not inconsistent with the conduct required by the provisions of the FACT Act.
Check 21
The Check Clearing for the 21st Century Act gives “substitute checks,” such as a digital image of a check and copies made from that image, the same legal standing as the original paper check. Some of the major provisions include:
| • | Allowing check truncation without making it mandatory, |
| • | Demanding that every financial institution communicate to accountholders in writing a description of its substitute check processing program and their rights under the law, |
| • | Legalizing substitutions for and replacements of paper checks without agreement from consumers, |
| • | Retaining in place the previously mandated electronic collection and return of checks between financial institutions only when individual agreements are in place, |
| • | Requiring that when accountholders request verification, financial institutions produce the original check (or a copy that accurately represents the original) and demonstrate that the account debit was accurate and valid, and |
| • | Requiring the re-crediting of funds to an individual’s account on the next business day after a consumer proves that the financial institution has erred. |
Impact of Governmental Monetary Policies
Our results of operations are impacted by domestic economic conditions and the monetary and fiscal policies of the U.S. government and its agencies. The Federal Reserve’s monetary policies have had, and are
18
Table of Contents
likely to continue to have, an important impact on the operating results of commercial banks through its power to implement national monetary policy in order, among other things, to curb inflation or combat a recession. The monetary policies of the Federal Reserve have major effects upon the levels of bank loans, investments and deposits through its open market operations in U.S. government securities and through its regulation of the discount rate on borrowings of member banks and the reserve requirements against member bank deposits. It is not possible to predict the nature or impact of future changes in monetary and fiscal policies.
Office of Foreign Assets Control Regulation
The U.S. has imposed economic sanctions that impact transactions with designated foreign countries, nationals, and others. Such sanctions are typically known as the OFAC rules based on their administration by the U.S. Department of the Treasury Office of Foreign Assets Control. The OFAC administered sanctions take many different forms. Generally, however, they contain one or more of the following elements:
| • | Restrictions on trade with, or investment in, a sanctioned country, including prohibitions against direct or indirect imports from and exports to a sanctioned country and prohibitions on U.S. persons engaging in financial transactions relating to making investments in, or providing investment-related advice or assistance to, a sanctioned country, and/or |
| • | A blocking of assets in which the government or specially designated nationals of the sanctioned country have an interest, by prohibiting transfers of property subject to U.S. jurisdiction (including property in the possession or control of U.S. persons). Blocked assets (e.g., property and bank deposits) cannot be paid out, withdrawn, set off, or transferred in any manner without a license from OFAC. |
Failure to comply with these sanctions can result in serious legal and reputational consequences.
Available Information
Under the Securities Exchange Act of 1934, we are required to file annual, quarterly, and current reports, proxy statements, and other information with the SEC. One may access, read, and copy any document we file with the SEC at the SEC’s Public Reference Room at 450 Fifth Street N.W., Washington, D.C. 20549. The public may obtain information on the operation of the Public Reference Room by calling the SEC at 1-800-SEC-0330. We file reports electronically with the SEC. The SEC maintains an Internet site that contains reports, proxy and information statements, and other information regarding issuers that file reports electronically. This site may be accessed at www.sec.gov. Documents filed by us electronically with the SEC may be accessed through this website.
Our Annual Reports on Form 10-K and Quarterly Reports on Form 10-Q, as well as select other documents filed with or furnished to the SEC pursuant to Section 13(a) or 15(d) of the Securities Exchange Act of 1934 are accessible at no cost on our website, www.palmettobank.com, through the “Investor Relations” link. Other documents filed with or furnished to the SEC pursuant to Section 13(a) or 15(d) of the Securities Exchange Act of 1934 are accessible at no cost on the SEC’s website (www.sec.gov) or through written request directed to 306 East North Street, Greenville, South Carolina 29601, Attention: Chief Financial Officer. In addition, through the “Corporate Governance” link, we make available our Code of Ethics as well as various other corporate governance information. We will provide a printed copy of any of the aforementioned documents to any requesting shareholder. Such requests should be directed to 306 East North Street, Greenville, South Carolina 29601, Attention: Chief Financial Officer.
| ITEM 1A. | RISK FACTORS |
The material risks and uncertainties that management believes impact our Company are described below. The risks and uncertainties described below are not the only ones we face. Additional risks and uncertainties may also impair our business operations. This report is qualified in its entirety by these risk factors.
If any of the following risks actually occurs, our business, financial condition, results of operations, or cash flows could be materially and adversely impacted. If this were to happen, the value of our common or preferred stock could decline, and investors could lose all or part of their investment.
19
Table of Contents
Economic Risk
General
All facets of our operations are impacted by general business and economic conditions in the Upstate of South Carolina, the U.S. and abroad. These conditions include short-term and long-term interest rates, inflation, money supply, political issues, legislative and regulatory changes, fluctuations in both debt and equity capital markets, broad trends in industry and finance, and the strength of the U.S. economy and the local economies in which we operate, all of which are beyond our control. In 2007, the housing and real estate sectors experienced an economic slowdown that progressed into a recession throughout 2008 and 2009. Unlike larger national or regional banks that are more geographically diversified, we primarily provide our services to customers within our market area. Continued weakness or weakening in business and economic conditions, caused by inflation, recession, acts of terrorism, unemployment, changes in securities markets, or other factors, will result in further deterioration in our asset quality, loan collateral values, and / or the demand for our products and services.
Current Conditions in the Financial Markets and Economic Conditions Generally
Negative developments which began in the latter half of 2007 and continued throughout 2009 in the financial services industry have resulted in uncertainty in the financial markets in general and a related general economic downturn. In addition, as a consequence of the current recession in the U.S., businesses across a wide range of industries face serious difficulties due to the lack of consumer spending and the extreme lack of liquidity in the global credit markets. Unemployment also increased significantly.
Further negative market developments may decrease consumer confidence levels even more causing adverse changes in payment patterns, and increases in delinquencies and default rates, which have and may continue to impact our charge-off levels and provision for loan losses. This would likely exacerbate the adverse impacts of these difficult market conditions on us and others in the financial services industry.
As a result of these financial economic crises, many lending institutions, including our Bank, have experienced declines in the performance of their loans. Moreover, competition among depository institutions for deposits and quality loans has increased significantly. In addition, the values of real estate collateral supporting many commercial loans and home mortgages have declined and may continue to decline. Broadly speaking, bank and bank holding company stock prices have been negatively impacted, as has the ability of banks and bank holding companies to raise capital or borrow in the debt markets. As a result, there is a potential for additional federal or state laws and regulations regarding lending and funding practices and liquidity standards, and bank regulatory agencies are expected to continue to be very aggressive in responding to concerns and trends identified in examinations and to, among other things, issue formal or informal enforcement actions or orders.
The impact of new legislation, enforcement actions, or other regulatory restrictions in response to those developments may negatively impact our operations by restricting our business operations, including our ability to originate or sell loans and to generate deposits, and may adversely impact our financial performance, liquidity, and stock price.
Due to concern surrounding the stability of the financial markets generally and the strength of counterparties, many lenders and institutional investors have reduced or ceased providing funding to borrowers, including to other financial institutions. This tightening of credit has led to an increased level of commercial and consumer delinquencies, lack of consumer confidence, increased market volatility and widespread reduction of business activity generally. The resulting economic pressure on consumers and lack of confidence in the financial markets has adversely impacted our business, financial condition, results of operations, and cash flows. Although there are signs of economic improvement, we do not expect that the difficult conditions in the financial markets are likely to improve significantly in the near future. If current levels of market disruption and volatility continue or worsen, our ability to access capital and maintain sufficient liquidity may be adversely impacted which, in turn, would adversely impact our business, financial condition, results of operations, and cash flows.
20
Table of Contents
Overall, during the past two years, the general business environment has had an adverse impact on our business, and there can be no assurance that the environment will improve in the near term. Until conditions improve, our business, financial condition, results of operations, and cash flows will continue to be adversely impacted.
The Current U.S. Financial Industry
Enacted legislation and other measures undertaken by the U.S. Treasury, the Federal Reserve, and other governmental agencies in 2008 and 2009 appear to have helped stabilize the U.S. financial system and improve the housing market. However, there can be no assurances that these actions will be enough to completely stabilize the financial system given the difficult economic environment.
The EESA authorizes the U.S. Treasury to purchase from financial institutions and their holding companies up to $700 billion in mortgage loans, mortgage-backed securities, and certain other financial instruments, including debt and equity securities issued by financial institutions and their holding companies, under the TARP. The purpose of TARP is to restore confidence and stability to the U.S. banking system and to encourage financial institutions to increase their lending to customers and to each other. The U.S. Treasury has allocated $250 billion towards the TARP CPP. Under the CPP, the U.S. Treasury purchases debt or equity securities from participating institutions. The TARP also will include direct purchases or guarantees of troubled assets of financial institutions. We decided not to participate in the CPP.
EESA also increased FDIC deposit insurance on most accounts from $100 thousand to $250 thousand. This increase is in place until December 31, 2013. In addition, the FDIC has implemented two temporary programs to provide deposit insurance for the full amount of most noninterest-bearing transaction accounts through June 30, 2010 and to guarantee certain unsecured debt of financial institutions and their holding companies through June 2012. The purpose of these legislative and regulatory actions is to stabilize the volatility in the U.S. banking system.
The EESA, the TARP and the FDIC’s recent regulatory initiatives may not have the desired effect. If the volatility in the market and the economy continues or worsens, our business, financial condition, results of operations, access to funds and the market price of our common stock could be materially and adversely impacted.
Risk of Downturn in the Economy on Small- to Medium-Sized Business Target Markets
We generally provide banking and financial services to small- and medium-sized businesses. These businesses generally have fewer financial resources in terms of capital borrowing capacity than larger entities. If general economic conditions continue to negatively impact these businesses in the markets in which we operate, our business, financial condition, results of operation, and cash flows will be adversely impacted.
Interest Rate Risk
Risk to Net Interest Income
One of the key measures of our success is our amount of net interest income. Net interest income is the difference between interest income earned on interest-earning assets and interest expense paid on interest-bearing liabilities. Interest rates are highly sensitive to many factors that are beyond our control, including general economic conditions and policies of various governmental and regulatory agencies, particularly the Federal Reserve.
We are subject to interest rate risk because:
| • | Assets and liabilities may mature or reprice at different times (for example, if assets reprice faster than liabilities and interest rates are generally falling, net income will initially decline), |
21
Table of Contents
| • | Assets and liabilities may reprice at the same time but by different amounts (for example, when the general level of interest rates is falling, we may reduce rates paid on transaction and savings deposit accounts by an amount that is less than the general decline in market interest rates), |
| • | Short-term and long-term market interest rates may change by different amounts (for example, the shape of the yield curve may impact new loan yields and funding costs differently), and/or |
| • | The remaining maturity of various assets or liabilities may shorten or lengthen as interest rates change (for example, if long-term mortgage interest rates decline sharply, mortgage-backed securities held in the investment securities available for sale portfolio may prepay significantly earlier than anticipated, which could reduce portfolio income). |
Interest rates may also have a direct or indirect impact on loan demand, credit losses, mortgage origination volume, the mortgage-servicing rights portfolio, the value of our pension plan assets and liabilities, and other financial instruments directly or indirectly impacting net income.
Any substantial, unexpected, prolonged change in market interest rates could have a material adverse impact on our business, financial condition, results of operations, and cash flows. See Item 7A. Quantitative and Qualitative Disclosures About Market Risk contained herein for discussion regarding the impact that changing interest rates would have on our net interest income over the coming 12 month period.
Loan Prepayment Risks Impacting Mortgage Instruments
Loan prepayment rates are impacted by changes in interest rates charged on mortgage loans as well as, to a lesser extent, by consumer behavior, conditions in the housing and financial markets, and general economic conditions. Although changes in prepayment rates are difficult to predict, prepayment rates tend to increase when market interest rates decline. Since December 31, 2007, the Federal Reserve reduced the prime and federal funds interest rate by 400-425 basis points. This decline in interest rates may continue to result in an increase in loan prepayments in the foreseeable future. Significant risks resulting from increased loan prepayments include, but are not limited to, the following:
Deferred Fees and Costs Impact. We recognize deferred loan origination fees and costs by adjusting interest income over the contractual life of the individual loans. As prepayments occur, the rate at which net deferred loan origination fees and costs are recognized accelerates.
Premiums Paid on Mortgage-Backed Securities Impact. We recognize premiums paid on mortgage-backed securities as an adjustment to interest income over the life of the investment security based on the rate of repayment of the investment securities. Prepayment on the loans underlying a mortgage-backed security shortens the life of the security thereby increasing the rate at which premiums are expensed.
Mortgage-Servicing Rights Portfolio Impact. Our mortgage-servicing rights portfolio represents the estimated present value of fees that we expect to receive on mortgages that we service over an expected term. If prepayments increase above expected levels, the value of the servicing asset decreases because the amount of future fees expected to be received decreases. We may be required to recognize this decrease in value by taking a charge against net income. We have experienced an increase in prepayments of mortgages at times in the past as interest rates have decreased dramatically, which has impacted the value of our servicing asset. We believe, based on historical experience, that the amount of prepayments and related charges should decrease if interest rates increase.
Funds Reinvestment Risk
With regard to our loan portfolio, we may be unable to reinvest prepayment proceeds at rates comparable to the prepaid instruments, particularly in periods of declining interest rates.
22
Table of Contents
Lending Activities Risk
There are inherent risks associated with our lending activities. These risks include, among other things, the impact of changes in interest rates on borrowers and changes in the economic conditions in the specific markets in which we operate, as well as changes in economic conditions regionally, nationally, and internationally. Increases in interest rates and / or continued weakening economic conditions could continue to adversely impact the ability of borrowers to pay their loans or the value of the collateral securing those loans.
See Item 7. Management’s Discussion and Analysis of Financial Condition and Results of Operations for a discussion regarding our underwriting and monitoring policies and procedures for mitigating risks inherent in our lending activities.
Repayment and Collateral Risk
We have sustained losses primarily because borrowers, guarantors, or related parties have failed to perform in accordance with the terms of their loans, and we could sustain additional losses for these reasons. In an economic downturn, our ability to assess the creditworthiness of our customers may be impaired if the models and approaches we use to select, manage, and underwrite our customers become less predictive of future behaviors, and collateral values may decline.
At December 31, 2009, a significant portion of our loan portfolio consisted of commercial and industrial loans and loans secured by construction, land development, other land, and nonfarm nonresidential real estate. Loans secured by construction, land development, other land, and nonfarm nonresidential real estate are generally viewed as having more risk of default than loans secured by residential real estate or consumer loans because repayment of the loans often depends on the successful operation of the property, the income stream of the borrowers, the accuracy of the estimate of the property’s value at completion of construction, and the estimated cost of construction. Commercial and industrial loans are generally more risky than loans secured by residential real estate or consumer loans because those loans are typically not secured by real estate collateral. An adverse development with respect to one lending relationship can expose us to a significantly greater risk of loss compared with a single-family residential mortgage loan because we typically have more than one loan with such borrowers. Additionally, these loans typically involve larger loan balances to single borrowers or groups of related borrowers compared with single-family residential mortgage loans. Therefore, the deterioration of one or a few of these loans could cause a significant decline in the related asset quality. In addition, many economists believe that deterioration in income producing commercial real estate is likely to worsen as vacancy rates continue to rise and absorption rates of existing square footage and/or units continue to decline. Because of the general economic slowdown we are currently experiencing, these loans represent higher risk and could result in a sharp increase in loans charged-off and could require us to significantly increase our allowance for loan losses, which could have a material adverse impact on our business, financial condition, results of operations, and cash flows.
Although they represent a relatively small portion of our loan portfolio, we are subject to risk with regard to our installment loans, particularly loans that are unsecured or secured by depreciating asset values. In such cases, any repossessed collateral for a defaulted installment loan may not provide an adequate source of repayment of the outstanding loan balance. In addition, installment loan collections depend on the borrower’s continuing financial stability and are more likely to be adversely impacted by job loss, divorce, illness, or personal bankruptcy. Additionally, the application of federal and state legislation or regulatory action may reduce the amount that our borrowers are required to pay or limit our ability to foreclose on properties or other collateral, which makes foreclosure less economically feasible.
Real Estate Market Risk
While we do not have any subprime loans at December 31, 2009, a significant portion of our loan portfolio is secured by real estate. The real estate collateral in each case provides an alternate source of repayment in the
23
Table of Contents
event of default by the borrower and may deteriorate in value during the time the credit is extended. We have identified credit concerns with respect to certain loans in our loan portfolio which are primarily related to the downturn in the real estate market. The real estate market has been substantially impacted by the current economic environment, increased levels of inventories of unsold homes, and higher foreclosure rates. As a result, property values for this type of collateral have declined substantially and market appraisal assumptions continue to trend downward significantly. These loans carry a higher degree of risk than long-term financing of existing real estate since repayment is dependent on the ultimate completion of the project or home and usually on the sale of the property or permanent financing. Slow housing conditions have affected some of these borrowers’ ability to sell the completed projects in a timely manner, and we believe that these trends are likely to continue. In some cases, this downturn has resulted in a significant impairment to the value of our collateral and our ability to sell the collateral upon foreclosure. As a result, we incurred substantially higher charge-offs in 2009 and increased our allowance for loan losses during 2009 to address the probable credit risks inherent within our loan portfolio. Further deterioration in the South Carolina real estate market may cause us to adjust our opinion of the level of credit quality in our loan portfolio. Such a determination may lead to an additional increase in our provisions for loan losses, which could also adversely impact our business, financial condition, and results of operations.
Lack of Loan Portfolio Seasoning Risk
We attempt to maintain an appropriate allowance for loan losses to provide for losses inherent in our loan portfolio. We periodically determine the amount of the allowance based on consideration of several factors, including:
| • | An ongoing review of the quality, mix, and size of our overall loan portfolio, |
| • | Our historical loan loss experience, |
| • | An evaluation of economic conditions, |
| • | Regular reviews of loan delinquencies and loan portfolio quality, and |
| • | The amount and quality of collateral, including guarantees, securing the loans. |
However, there is no precise method of estimating credit losses, since any estimate of loan losses is necessarily subjective and the accuracy depends on the outcome of future events. In addition, due to our growth over the past several years, a large portion of the loans in our loan portfolio were originated in recent years, and we have an increased number of individually larger loans. In general, loans do not begin to show signs of credit deterioration or default until they have been outstanding for some period of time, a process referred to as seasoning. As a result, a portfolio of more mature loans will usually behave more predictably than a newer portfolio. Because a large portion of our loans secured by construction, land development, other land, multifamily, and nonfarm nonresidential real estate is relatively new, the current level of delinquencies and defaults may not be representative of the level that will prevail when the portfolio becomes more seasoned, which may be higher than current levels. If charge-offs in future periods increase, we may be required to increase our provision for loan losses, which would decrease our net income and our capital.
Although we believe our allowance for loan losses is a reasonable estimate of probable and inherent losses in our loan portfolio, we cannot fully predict such losses or that our loan loss allowance will be adequate in the future. Excessive loan losses could have a material impact on our financial performance. Consistent with our loan loss reserve methodology, we expect to make additions to our loan loss reserve levels to reflect the changing risk inherent in our portfolio of existing loans and any additions to our loan portfolio, which may impact our short-term earnings.
Investment Securities Market Risk
Forty-seven percent, based on fair value, of our investment securities portfolio is comprised of private label mortgage-based securities collateralized by residential real estate. Dramatic declines in the housing market over
24
Table of Contents
the past two years have negatively impacted the market for some investment securities and resulted in significant writedowns of asset values by financial institutions, including government-sponsored entities, major commercial and investment banks, and regional financial institutions such as our Company. As previously discussed, we are particularly exposed to downturns in the U.S. housing market. As a result, the market for some of the investment securities held in our portfolio has become volatile over the past 24 months. Further, the current difficult market conditions may also result in credit downgrades of mortgage and bond issues that may reduce the fair value of our investment portfolio and may result in a determination that our investment securities are other-than-temporarily impaired which could cause us to writedown the carrying value of the portfolio and would reduce our net income. Such reductions to net income would also result in a material adverse impact on our capital levels.
Liquidity and Funding Risk
The goal of liquidity management is to ensure that we can meet customer loan requests, customer deposit maturities and withdrawals, and other cash commitments under both normal operating conditions and under unpredictable circumstances of industry or market stress. To achieve this goal, our Asset/Liability Committee establishes liquidity guidelines that require sufficient asset-based liquidity to cover potential funding requirements and to avoid over-dependence on volatile, less reliable funding markets.
Liquidity is essential to our business. An inability to raise funds through traditional deposits, borrowings, the sale of securities or loans, issuance of additional equity securities, and other sources could have a substantial negative impact on our liquidity. Our access to funding sources in amounts adequate to finance our activities and with terms acceptable to us could be impaired by factors that impact us specifically or the financial services industry in general. Factors that could detrimentally impact access to liquidity sources include a decrease in the level of our business activity as a result of a downturn in the markets in which our loans are concentrated or regulatory action against us. Our ability to borrow could also be impaired by factors that are not specific to us, such as the current disruption in the financial markets and negative views and expectations about the prospects for the financial services industry as a result of the continuing turmoil and deterioration in the credit markets.
Historically, we have relied on traditional and nontraditional deposits, advances from the FHLB and Federal Reserve, funding from correspondent banks, and other borrowings to fund our operations. As a result of negative financial performance indicators, some of the Bank’s various sources of liquidity are now restricted. The Bank’s credit risk rating at the FHLB has been negatively impacted, resulting, initially, in reduced borrowing capacity. In January 2010, we were notified by the FHLB that it will not allow additional advances until our financial condition improves. In addition, there is also a risk that the Bank’s ability to borrow from the Federal Reserve Discount Window could be curtailed or eliminated.
We actively monitor the depository institutions that hold our federal funds sold and due from banks cash balances. We cannot provide assurances that access to our cash and cash equivalents and federal funds sold will not be impacted by adverse conditions in the financial markets. Our emphasis is primarily on safety of principal, and we diversify cash, due from banks, and federal funds sold among counterparties to minimize exposure relating to any one of these entities. We routinely review the financials of our counterparties as part of our risk management process. Balances in our accounts with financial institutions in the U.S. may exceed the FDIC insurance limits. While we monitor and adjust the balances in our accounts as appropriate, these balances could be impacted if the financial institutions fail.
Because we are no longer well-capitalized, unless a determination is received from the FDIC that we are operating in a high-rate area, we cannot offer an effective yield on deposits in excess of 75 basis points of the national rate paid on deposits of comparable size and maturity as published weekly by the FDIC on their website. In addition, we cannot accept brokered deposits without prior FDIC approval. Although we currently do not utilize brokered deposits as a funding source, if we were to seek to begin using such funding source, there is no assurance that the FDIC will grant us the approval when requested. These restrictions could have a substantial negative impact on our liquidity.
25
Table of Contents
There can be no assurance that our sources of funds will be adequate for our liquidity needs, and we may be compelled to seek additional sources of financing in the future. Specifically, we may seek additional debt in the future to achieve our business objectives. There can be no assurance that additional borrowings, if sought, would be available to us or, if available, would be on favorable terms. Bank and holding company stock prices have been negatively impacted by the recent adverse economic conditions, as has the ability of banks and holding companies to raise capital or borrow in the debt markets. If additional financing sources are unavailable or not available on reasonable terms, our business, financial condition, results of operations, cash flows, and future prospects could be materially adversely impacted.
See Item 7. Management’s Discussion and Analysis of Financial Condition and Results of Operations for a further discussion regarding our liquidity and funding activities.
Asset Growth Restriction Risk
Minimum capital adequacy requirements restrain asset growth by requiring that asset growth be funded by a commensurate amount of additional capital. Some of the alternatives available for increasing minimum capital ratio levels include increased retained earnings, sale of additional stock, and reduced asset growth. Retained earnings may be increased through a combination of higher income and lower cash dividend payouts. An increase in retained earnings improves capital ratios assuming the increase exceeds asset growth. Historically, our primary source of capital has been through retained earnings. As part of a long-term plan to minimize shareholder dilution, we have not historically sold additional stock. However, to strengthen our capital position, we are currently pursuing potential capital raising alternatives, which could include issuing additional common or preferred stock to parties other than existing shareholders. The sale of additional stock to increase our capital could result in dilution to our existing shareholders and may not be sufficient to address capital requirements. We may be required to reduce asset growth to manage our regulatory capital position as defined by the applicable regulatory framework. Restraining asset growth could result in a material adverse impact on our business, financial condition, results of operations, and cash flows.
See Item 1. Business for further discussion regarding the capital adequacy requirements for the Company and the Bank.
Capital Adequacy Risk
Regulatory authorities require us to maintain adequate levels of capital to support our operations. As described herein, we have an immediate need to increase our capital ratios which requires us to raise additional capital and/or reduce the size of our balance sheet. In addition, even if we succeed in raising this capital, we may need to raise additional capital in the future to support growth.
The ability to raise additional capital depends in part on conditions in the capital markets at that time, which are outside our control, and on our financial performance. Accordingly, additional capital may not be raised, if and when needed, on terms acceptable to us, or at all. If we cannot raise additional capital when needed, our ability to increase our capital ratios could be materially impaired. In addition, based on discussions with the FDIC following its most recent safety and soundness examination of the Bank in November 2009, the Bank presently expects to receive a written agreement from the FDIC some time in 2010 which could require the Bank to take certain actions to address concerns raised in the examination, including maintaining capital ratios in excess of the minimum thresholds required for a bank to be well-capitalized. If the Bank were to receive a written agreement and if the Bank were to fail to comply with the requirements in such written agreement, it may be subject to further regulatory action including being placed into a federal conservatorship or receivership. If that were to occur, shareholders could suffer a complete loss in the value of their ownership interest in the Company. Lastly, if we issue additional equity capital in any manner other than pro rata to our existing shareholders, our existing shareholders’ interest would be diluted. At this time, we currently expect to issue common or preferred stock in the near-term; however, the Board of Directors has not yet determined the type,
26
Table of Contents
timing, amount, or terms of securities to be issued in a capital offering, and we currently do not have any arrangements, agreements or commitments to issue any common or preferred stock. There is also no assurance that we would be successful in raising this capital.
Dividend Payment Risk
The holders of our common stock are entitled to receive dividends, when and if declared by the Board of Directors, out of funds legally available for such dividends. The Company is a legal entity separate and distinct from the Bank and has historically relied on dividends from the Bank as a viable source of funds to service the Company’s operating expenses, which typically include dividends to holders of our common stock; however, given the Bank’s recent losses, this source of liquidity is not currently available nor is it expected to be available for the foreseeable future. The Company and the Bank are subject to regulatory policies and requirements relating to the payment of dividends, including requirements to maintain adequate capital above regulatory minimums. Federal regulatory authorities are authorized to determine under certain circumstances that the payment of dividends by a bank holding company or a bank would be an unsafe or unsound practice and to prohibit payment of those dividends. Federal regulatory authorities have indicated that banking organizations should generally pay dividends only out of current income. In addition, as a South Carolina chartered bank, the Bank is subject to limitations on the amount of dividends that it is permitted to pay.
See Item 7. Management’s Discussion and Analysis of Financial Condition and Results of Operations for further discussion regarding our dividends.
Deposit Insurance Assessment Risk
As discussed in Item 1. Business, the Bank’s deposits are insured up to applicable limits by the DIF of the FDIC and are subject to deposit insurance assessments to maintain the deposit insurance. As an FDIC-insured institution, we are required to pay quarterly deposit insurance premium assessments to the FDIC.
Due to the recent failures of several unaffiliated FDIC-insured depository institutions, and the FDIC’s new TLGP, the deposit insurance premium assessments paid by all banks have increased. In addition to the increases to deposit insurance assessments approved by the FDIC, the Bank’s risk category also changed as of June 30, 2009 as a result of the risk-based capital ratios which also increased the Bank’s premium assessments. The FDIC assessed a 5-basis point special assessment which was paid in September 2009. Also in September 2009, the FDIC adopted a Notice of Proposed Rulemaking to require insured financial institutions to prepay their estimated quarterly risk-based assessments for the fourth quarter of 2009 and for 2010, 2011 and 2012. We applied for and received an exemption to the prepayment assessment. The FDIC Board of Directors also voted to adopt a uniform three-basis point increase in assessment rates effective on January 1, 2011.
The FDIC has also indicated that it intends to propose changes to the deposit insurance premium assessment system that will shift a greater share of any increase in such assessments onto institutions with higher risk profiles. As a result, we anticipate our future insurance costs to be substantially higher than in previous periods.
Although we cannot predict what the insurance assessment rates will be in the future, further deterioration in either risk-based capital ratios or adjustments to the base assessment rates could have a material adverse impact on our business, financial condition, results of operations, and cash flows.
The FDIC may terminate deposit insurance of any insured depository institution if it determines that the institution has engaged in unsafe or unsound practices, is in an unsafe or unsound condition to continue operations, or has violated any applicable law, regulation, rule, order, or condition imposed by the FDIC. It also may suspend deposit insurance temporarily if the institution has no tangible capital. If insurance of accounts is terminated, the accounts at the institution at the time of the termination, less subsequent withdrawals, shall continue to be insured for a period of six months to two years, as determined by the FDIC.
27
Table of Contents
Monetary Policy Risk
Changes made by the Federal Reserve in monetary policy, including changes in interest rates, could influence not only our interest income earned on loans and securities and the interest expense paid on deposits and borrowed funds, but could also impact our ability to originate loans and obtain deposits, the fair value of our financial assets and liabilities, and the average duration of our mortgage-servicing rights and mortgage-backed securities portfolios. Federal Reserve policies also can adversely impact borrowers, potentially increasing the risk that they may fail to repay their loans. Changes in Federal Reserve policies, which are beyond our control and are difficult to predict or anticipate, could result in a material adverse impact on our business, financial condition, results of operations, and cash flows.
Strategic Project Plan Execution Risk
Our future performance will depend on our ability to implement successfully the Strategic Project Plan approved by the Board of Directors in June 2009 to address our credit quality, liquidity, earnings, and capital. Among other tasks, this implementation will involve a variety of complex tasks, including improving our credit quality (e.g., through reducing our level of nonperforming assets by continuing to aggressively work problem credits, exploring a bulk sale of loans or real estate acquired in settlement of loans, and possibly requiring additional writedowns to facilitate disposition), monitoring and accessing required liquidity, raising capital, and improving earnings. Any failure or delay in executing these initiatives, whether due to regulatory delays or for other reasons which may be beyond our control, is likely to impede, and could ultimately preclude, our successful implementation of our Strategic Project Plan and could materially adversely impact our business, financial condition, and results of operations.
Risk of Failure to Comply with Government Regulation and Supervision
Our operations are subject to extensive regulation by federal, state, and local governmental authorities. Given the current disruption in the financial markets, we expect that the government will continue to pass new regulations and laws that will impact us. Compliance with such regulations may increase our costs and limit our ability to pursue business opportunities. Failure to comply with laws, regulations, and policies could result in sanctions by regulatory agencies, civil money penalties, and damage to our reputation. While we have policies and procedures in place that are designed to prevent violations of these laws, regulations, and policies, there can be no assurance that such violations will not occur.
See Item 1. Business for further discussion regarding the Company’s and the Bank’s supervision and regulation.
Loss of Key Personnel Risk
We depend on a limited number of key management personnel. The loss of key personnel could have a material adverse impact on our operations because other officers may not have the experience and expertise to readily replace these individuals. As a result, the Board of Directors may have to search outside of our Company for qualified permanent replacements. This search may be prolonged, and we cannot provide assurance that we would be able to locate and hire qualified replacements.
Limited Public Trading Market Stock Risk
Our common stock is not traded or authorized for quotation on any exchanges, including NASDAQ. On June 26, 2009, we launched a Private Trading System on our website (www.palmettobank.com). The Private Trading System is a passive mechanism created to assist buyers and sellers in facilitating trades in our common stock. Thus, the liquidity of our common stock depends upon the presence in the marketplace of willing buyers and sellers. We cannot provide assurance that shareholders will be able to sell their shares on the Private Trading System at the volumes, prices, or times that they desire.
28
Table of Contents
We are not currently seeking listing of our common stock on a securities exchange such as NASDAQ. In the future, we may seek such a listing to improve liquidity in our stock for our shareholders.
Deferred Income Tax Asset Valuation Risk
Deferred income tax represents the tax impact of the differences between the book and tax basis of assets and liabilities. Deferred tax assets are assessed periodically by us to determine if they are realizable. Factors in our determination include the ability to carry back or carry forward net operating losses and the performance of the business including the ability to generate taxable income from a variety of sources and tax planning strategies. If, based on available information, it is more likely than not that the deferred income tax asset will not be realized, then a valuation allowance against the deferred tax asset must be established with a corresponding charge to net income. Realization of a deferred tax asset requires us to apply significant judgment and is inherently subjective because it requires the future occurrence of circumstances that cannot be predicted with certainty. We may not achieve sufficient future taxable income as the basis for the ultimate realization of our net deferred tax asset, and, therefore, we may have to establish a full or partial valuation allowance at some point in the future. If we determine that a valuation allowance is necessary, it would require us to incur a charge to our results of operations that would adversely impact our earnings and capital position.
Goodwill Valuation Risk
Goodwill arose from our acquisition of various branches from 1988 through 1999. Goodwill represents the excess of the cost of businesses acquired over the fair value of the net assets acquired. Goodwill is assigned to reporting units and is then tested for impairment at least annually, or on an interim basis if an event occurs or circumstances arise that would more likely than not reduce the fair value of the reporting unit below its carrying value. Once an impairment loss is recognized, future increases in fair value do not result in the reversal of previously recognized losses. To the extent a reporting unit’s carrying amount exceeds its fair value, an indication exists that the reporting unit’s goodwill may be impaired and a second step of impairment tests will be performed. The fair value of our reporting unit is generally calculated based on our stock price. A further reduction in our stock price may require a second step of impairment tests to be performed. If we determine in the future that our goodwill is impaired, we would be required to record an impairment charge to our results of operations that would adversely impact our earnings and capital position.
See Item 8. Financial Statements and Supplementary Data, Notes 1 and 6 for further discussion regarding our goodwill and the related impairment testing.
| ITEM 1B. | UNRESOLVED STAFF COMMENTS |
None.
| ITEM 2. | PROPERTIES |
General
At December 31, 2009 and 2008, the total net book value of the premises and equipment owned, excluding those held for sale, was $29.6 million and $26.3 million, respectively. None of our owned properties are subject to mortgages or liens.
At December 31, 2008, two parcels of land with a book value approximating $1.7 million were classified as held for sale. These parcels were sold during the three month period ended March 31, 2009, in conjunction with the relocation of our corporate headquarters to downtown Greenville.
Management evaluates, on an ongoing basis, the suitability and adequacy of all of our properties and has active programs of relocating, remodeling, consolidating, or closing properties, as necessary, to maintain efficient
29
Table of Contents
and attractive facilities. Management believes that all of our properties are suitable and adequate for their intended purposes. Additionally, all of our properties are protected by alarm and security systems that meet or exceed regulatory standards.
See Item 7. Management’s Discussion and Analysis of Financial Condition and Results of Operations, Item 8. Financial Statements and Supplementary Data, Note 1, and Item 8. Financial Statements and Supplementary Data, Note 5 for a further discussion regarding our premises and equipment.
Corporate Headquarters and Operations Center
We relocated our corporate headquarters to 306 East North Street, Greenville, South Carolina during March 2009. The new location is leased. Our operations center remains at our owned Laurens location.
Banking Offices
At December 31, 2009, the Bank operated 29 full-service banking offices in the following counties: Laurens County (4), Greenville County (9), Spartanburg County (5), Greenwood County (4), Anderson County (2), Cherokee County (2), Pickens County (1), Oconee County (1), and York County (1). Of our 29 full-service banking offices at December 31, 2009, seven were leased and 22 were owned.
During 2008, we purchased property at the intersection of West Wade Hampton Boulevard and Middleton Way in Greenville County on which to construct and relocate the existing Greer banking office. The opening occurred in April 2009. The previous Greer banking office lease expired June 30, 2009.
In addition to our 29 full-service banking offices at December 31, 2009, the Bank operated six limited service banking offices located in retirement centers in the Upstate.
Additionally, we have ground leases with regard to three of our banking office locations.
Other Properties
In addition to the banking offices at December 31, 2009 as discussed above, during 2008, we:
| • | Consolidated our existing banking office network, reducing the number of banking offices by four. Three of these consolidated banking offices continue to be leased and one is owned. Two of the three leases are scheduled to expire in 2010. Management is currently considering our options with regard to the remaining locations, |
| • | Completed construction and celebrated the grand opening of our relocated Pendleton office in Anderson County. We own our previous Pendleton banking office. We are currently considering our options with regard to the former location in Anderson County, and |
| • | Purchased a parcel of land located in Spartanburg County for possible future banking office expansion. |
During construction of the corporate headquarters until March 2009, we continued to pay operating lease payments on a month-to-month basis with the Lessor with regard to our previous downtown Greenville banking office. Upon occupancy, these lease payments were replaced with those required by the build-to-suit operating lease agreement dated May 2, 2007. Additionally, during construction of the new downtown Greenville banking office, the Bank leased additional office space and parking on a month-to-month basis. We have continued to lease parking spaces, on a month-to-month basis, since the completion of the headquarters.
We sublease to a third party our previous Blackstock Road banking office that we lease from a third party. The lease and sublease are scheduled to expire in 2010.
30
Table of Contents
Automatic Teller Machines
At December 31, 2009, we operated 38 automatic teller machines, including 10 in nonbanking office locations.
The Bank has ground leases with regard to nine of our automatic teller machines, all of which are located at nonbanking office locations.
Palmetto Capital, Inc. Independent Offices
During the year ended December 31, 2009, Palmetto Capital utilized one office independent of banking offices, which is leased. The previously utilized independent Laurens location is no longer occupied by Palmetto Capital. We are currently evaluating internal options for this owned location.
| ITEM 3. | LEGAL PROCEEDINGS |
We are subject to actual and threatened legal proceedings and other claims against us arising out of the conduct of our business. Some of these suits and proceedings seek damages, fines, or penalties. These suits and proceedings are being defended by, or contested on behalf of, us. On the basis of information presently available, we do not believe that existing proceedings and claims will have a material effect on our financial position or results of operations.
| ITEM 4. | SUBMISSION OF MATTERS TO A VOTE OF SECURITY HOLDERS |
No matters were submitted to a vote of security holders during the fourth quarter of the fiscal year ended December 31, 2009.
31
Table of Contents
| ITEM 5. | MARKET FOR REGISTRANT’S COMMON EQUITY, RELATED SHAREHOLDER MATTERS AND ISSUER PURCHASES OF EQUITY SECURITIES |
Common Stock Market Prices and Dividends
Our common stock is not listed on an exchange or quoted on any over-the-counter service. Thus, there is currently no public trading market of our common stock, and private trading of our common stock has been limited. In addition, buyers and sellers may privately negotiate transactions in our common stock. Because there is not an established market for our common stock, management may not be aware of all prices at which our common stock has been traded. Additionally, management has not determined whether the trades of which we are aware were the result of arm’s-length negotiations between the parties. We determine the value of our common stock based on the last five trades of the stock facilitated by the Company.
On June 26, 2009, we launched a Private Trading System on our website (www.palmettobank.com). The Private Trading System is a passive mechanism created to assist buyers and sellers in facilitating trades in our common stock. On June 30, 2009, the Company mailed a letter and related materials to shareholders regarding the Private Trading System and elected to furnish this information as an exhibit to a Current Report on Form 8-K filed with the SEC on July 2, 2009 which can be accessed through the SEC’s website (www.sec.gov).
As of December 31, 2009, there were 6,495,130 shares of our common stock outstanding held by approximately 1,715 shareholders of record. Based on information available to us, our common stock and dividend information is summarized as follows for the periods indicated.
| High | Low | Cash dividend | |||||
| 2009 |
|||||||
| First quarter |
$ | 42.00 | 27.12 | 0.06 | |||
| Second quarter |
40.00 | 33.75 | — | ||||
| Third quarter |
33.75 | 15.00 | — | ||||
| Fourth quarter |
15.00 | 10.00 | — | ||||
| 2008 |
|||||||
| First quarter |
$ | 41.00 | 41.00 | 0.20 | |||
| Second quarter |
42.00 | 41.00 | 0.20 | ||||
| Third quarter |
42.00 | 42.00 | 0.20 | ||||
| Fourth quarter |
42.00 | 42.00 | 0.20 | ||||
For the years ended December 31, 2009 and 2008, we paid quarterly cash dividends totaling $389 thousand, or $0.06 per common share, and $5.2 million, or $0.80 per common share, respectively. The Company and the Bank are subject to regulatory policies and requirements relating to the payment of dividends, including requirements to maintain adequate capital above regulatory minimums. In an effort to retain capital during this period of economic uncertainty, the Board of Directors reduced the quarterly dividend for the first quarter of 2009 and suspended the quarterly common stock dividend for the second, third, and fourth quarters of 2009. The Board of Directors believes that suspension of the dividend was prudent to protect our capital base. In addition, since our total risk-based capital ratio was 8.25% at December 31, 2009, which was below the well-capitalized regulatory minimum threshold of 10%, payment of a dividend on our common stock requires prior notification and non-objection from the FDIC. Our Board of Directors will continue to evaluate dividend payment opportunities on a quarterly basis. There can be no assurance as to when and if future dividends will be reinstated, and at what level, because they are dependent on our financial condition, results of operations, and / or cash flows, as well as capital and dividend regulations from the FDIC and others.
See Item 1. Business for further discussion regarding supervision and regulations regarding dividends.
32
Table of Contents
Equity Based Compensation Plan Information
The following table summarizes information regarding equity based compensation awards outstanding and available for future grants at December 31, 2009.
| (a) Number of securities to be issued upon exercise of outstanding options, warrants and rights |
(b) Weighted average exercise price of outstanding options, warrants and rights |
(c) Number of securities remaining available for future issuances under equity compensation plans (excluding securities reflected in column (a)) | |||||
| Equity based compensation plans approved by shareholders |
|||||||
| 1997 Stock Compensation Plan |
147,210 | $ | 21.80 | — | |||
| 2008 Restricted Stock Plan |
— | — | 204,960 | ||||
| Equity based compensation plans not approved by shareholders |
— | — | — | ||||
| Total equity compensation plans |
147,210 | $ | 21.80 | 204,960 | |||
See Item 8. Financial Statements and Supplementary Data, Note 1 and Note 14 for a discussion regarding matters related to our equity based compensation.
33
Table of Contents
Total Shareholder Return
The following graph sets forth the performance of our common stock for the five year period ended December 31, 2009 as compared to the S&P 500 Index, and the SNL $1B—$5B Bank Index. The graph assumes $100 originally invested on December 31, 2004 and that all subsequent dividends were reinvested in additional shares. The performance graph represents past performance and should not be considered to be an indication of future performance.
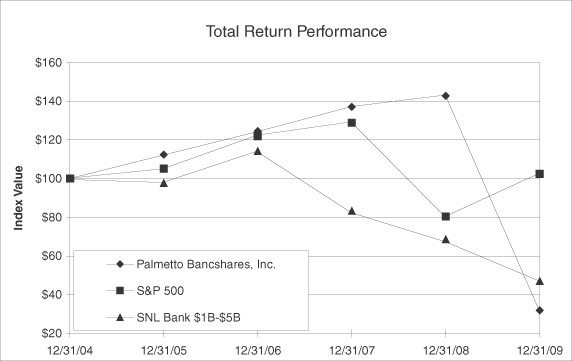
The following table summarizes the cumulative total return for the Company, the S&P 500 Index, and the SNL $1B—$5B Bank Index at the dates indicated.
| 12/31/04 | 12/31/05 | 12/31/06 | 12/31/07 | 12/31/08 | 12/31/09 | |||||||||||||
| Palmetto Bancshares, Inc. |
$ | 100.00 | $ | 111.53 | $ | 123.53 | $ | 135.87 | $ | 141.87 | $ | 33.83 | ||||||
| S&P 500 |
100.00 | 104.91 | 121.48 | 128.16 | 80.74 | 102.11 | ||||||||||||
| SNL Bank $1B—$5B |
100.00 | 98.29 | 113.74 | 82.85 | 68.72 | 49.26 | ||||||||||||
34
Table of Contents
ITEM 6. SELECTED FINANCIAL DATA
The following consolidated selected financial data should be read in conjunction with Item 7. Management’s Discussion and Analysis of Financial Condition and Results of Operations and Item 8. Financial Statements and Supplementary Data (dollars in thousands, except per share data)
| At and for the years ended December 31, | ||||||||||||||||||||
| 2009 | 2008 | 2007 | 2006 | 2005 | ||||||||||||||||
| STATEMENTS OF INCOME (LOSS) |
||||||||||||||||||||
| Interest income |
$ | 66,210 | $ | 78,245 | $ | 83,551 | $ | 76,126 | $ | 62,545 | ||||||||||
| Interest expense |
21,439 | 26,606 | 32,758 | 27,297 | 17,279 | |||||||||||||||
| Net interest income |
44,771 | 51,639 | 50,793 | 48,829 | 45,266 | |||||||||||||||
| Provision for loan losses |
73,400 | 5,619 | 988 | 1,625 | 2,400 | |||||||||||||||
| Net interest income (loss) after provision for loan losses |
(28,629 | ) | 46,020 | 49,805 | 47,204 | 42,866 | ||||||||||||||
| Noninterest income |
18,702 | 18,898 | 17,379 | 17,882 | 17,003 | |||||||||||||||
| Noninterest expense |
52,286 | 43,855 | 42,770 | 41,883 | 39,147 | |||||||||||||||
| Net income (loss) before provision (benefit) for income taxes |
(62,213 | ) | 21,063 | 24,414 | 23,203 | 20,722 | ||||||||||||||
| Provision (benefit) for income taxes |
(22,128 | ) | 7,464 | 8,399 | 7,962 | 6,942 | ||||||||||||||
| Net income (loss) |
$ | (40,085 | ) | $ | 13,599 | $ | 16,015 | $ | 15,241 | $ | 13,780 | |||||||||
| COMMON AND PER SHARE DATA |
||||||||||||||||||||
| Net income (loss) per common share: |
||||||||||||||||||||
| Basic |
$ | (6.21 | ) | $ | 2.11 | $ | 2.51 | $ | 2.40 | $ | 2.18 | |||||||||
| Diluted |
(6.21 | ) | 2.09 | 2.47 | 2.37 | 2.15 | ||||||||||||||
| Cash dividends per common share |
0.06 | 0.80 | 0.77 | 0.73 | 0.66 | |||||||||||||||
| Book value per common share |
11.55 | 17.96 | 17.17 | 15.76 | 14.05 | |||||||||||||||
| Outstanding common shares |
6,495,130 | 6,446,090 | 6,421,765 | 6,367,450 | 6,331,335 | |||||||||||||||
| Weighted average common shares outstanding—basic |
6,449,754 | 6,438,071 | 6,390,858 | 6,353,752 | 6,317,110 | |||||||||||||||
| Weighted average common shares outstanding—diluted |
6,449,754 | 6,519,849 | 6,477,663 | 6,421,742 | 6,417,358 | |||||||||||||||
| Dividend payout ratio |
n/a | % | 37.89 | % | 30.76 | % | 30.45 | % | 30.27 | % | ||||||||||
| PERIOD-END BALANCES |
||||||||||||||||||||
| Assets |
$ | 1,435,950 | $ | 1,372,275 | $ | 1,248,177 | $ | 1,153,136 | $ | 1,075,015 | ||||||||||
| Investment securities available for sale, at fair value |
119,986 | 125,596 | 95,715 | 116,567 | 125,988 | |||||||||||||||
| Total loans |
1,044,196 | 1,165,895 | 1,049,775 | 947,583 | 869,323 | |||||||||||||||
| Deposits (including traditional and nontraditional) |
1,249,520 | 1,115,808 | 1,097,209 | 1,029,602 | 938,723 | |||||||||||||||
| Other short-term borrowings |
— | 79,785 | 30,000 | 6,000 | 17,900 | |||||||||||||||
| Long-term borrowings |
101,000 | 52,000 | — | 10,000 | 23,000 | |||||||||||||||
| Shareholders’ equity |
75,015 | 115,776 | 110,256 | 100,376 | 88,941 | |||||||||||||||
| AVERAGE BALANCES |
||||||||||||||||||||
| Assets |
$ | 1,430,271 | $ | 1,322,541 | $ | 1,182,850 | $ | 1,114,553 | $ | 1,043,897 | ||||||||||
| Interest-earning assets |
1,352,956 | 1,249,992 | 1,113,461 | 1,045,556 | 980,531 | |||||||||||||||
| Investment securities available for sale, at fair value |
119,238 | 123,551 | 104,757 | 120,395 | 132,709 | |||||||||||||||
| Total loans |
1,130,809 | 1,111,436 | 987,707 | 896,503 | 831,125 | |||||||||||||||
| Deposits (including traditional and nontraditional) |
1,232,526 | 1,107,275 | 1,050,315 | 994,665 | 896,294 | |||||||||||||||
| Other short-term borrowings |
15,447 | 48,543 | 13,036 | 2,987 | 30,843 | |||||||||||||||
| Long-term borrowings |
68,054 | 41,415 | 4,521 | 15,841 | 26,145 | |||||||||||||||
| Shareholders’ equity |
106,906 | 116,222 | 106,615 | 95,077 | 85,790 | |||||||||||||||
| SELECT PERFORMANCE RATIOS |
||||||||||||||||||||
| Return on average assets |
(2.80 | )% | 1.03 | % | 1.35 | % | 1.37 | % | 1.32 | % | ||||||||||
| Return on average shareholders’ equity |
(37.50 | ) | 11.70 | 15.02 | 16.03 | 16.06 | ||||||||||||||
| Net interest margin |
3.31 | 4.13 | 4.56 | 4.67 | 4.62 | |||||||||||||||
| CAPITAL RATIOS |
||||||||||||||||||||
| Average shareholders’ equity as a percentage of average assets |
7.47 | % | 8.79 | % | 9.01 | % | 8.53 | % | 8.22 | % | ||||||||||
| Shareholders’ equity as a percentage of assets, at period end |
5.22 | 8.44 | 8.83 | 8.70 | 8.27 | |||||||||||||||
| Tier 1 risk-based capital |
6.99 | 9.55 | 9.61 | 9.37 | 9.36 | |||||||||||||||
| Total risk-based capital |
8.25 | 10.44 | 10.27 | 10.19 | 10.28 | |||||||||||||||
| Tier 1 leverage ratio |
5.55 | 8.70 | 8.97 | 8.59 | 8.08 | |||||||||||||||
| ASSET QUALITY INFORMATION |
||||||||||||||||||||
| Allowance for loan losses |
$ | 24,079 | $ | 11,000 | $ | 7,418 | $ | 8,527 | $ | 8,431 | ||||||||||
| Nonaccrual loans |
96,936 | 42,968 | 4,810 | 6,999 | 9,913 | |||||||||||||||
| Nonperforming assets |
124,950 | 50,251 | 12,956 | 7,918 | 12,034 | |||||||||||||||
| Net loans charged-off |
60,321 | 2,037 | 2,097 | 1,529 | 1,588 | |||||||||||||||
| Allowance for loan losses as a percentage of gross loans |
2.31 | % | 0.95 | % | 0.71 | % | 0.90 | % | 0.97 | % | ||||||||||
| Nonaccrual loans as a percentage of gross loans and foreclosed assets |
9.07 | 3.69 | 0.46 | 0.74 | 1.14 | |||||||||||||||
| Nonperforming assets as a percentage of assets |
8.70 | 3.66 | 1.04 | 0.69 | 1.12 | |||||||||||||||
| Net loans charged-off as a percentage of average gross loans |
5.36 | 0.18 | 0.21 | 0.17 | 0.19 | |||||||||||||||
35
Table of Contents
| ITEM 7. | MANAGEMENT’S DISCUSSION AND ANALYSIS OF FINANCIAL CONDITION AND RESULTS OF OPERATIONS |
The following discussion and analysis presents the more significant factors impacting our financial condition as of December 31, 2009 and 2008 and results of operations and cash flows for the years ended December 31, 2009, 2008, and 2007. This discussion should be read in conjunction with, and is intended to supplement, all of the other Items presented in this Annual Report on Form 10-K. Percentage calculations contained herein have been calculated based on actual not rounded results.
Financial Accounting Standards Board (“FASB”) Codification Discussion
We follow accounting standards set by the FASB. The FASB sets Generally Accepted Accounting Principles (“GAAP”) that we follow to ensure we consistently report our financial condition, results of operations, and cash flows. Over the years, the FASB and other designated GAAP-setting bodies have issued standards in the form of FASB Statements, Interpretations, FASB Staff Positions, Emerging Issues Task Force consensuses, American Institute of Certified Public Accountants (“AICPA”) Statements of Position, etc. The FASB recognized the complexity of its standard-setting process and embarked on a revised process in 2004 that culminated in the release on July 1, 2009 of the Codification (or Accounting Standards Codification), which codifies all previously issued pronouncements. The Codification does not change how we account for transactions or the nature of related disclosures made. The above change was made effective by the FASB for periods ending on or after September 15, 2009. We have updated references to GAAP in this Annual Report on Form 10-K to reflect the references in the Codification.
Critical Accounting Policies and Estimates
General
The Company’s accounting and financial reporting policies are in conformity, in all material respects, to accounting principles generally accepted in the U.S. and to general practices within the financial services industry. The preparation of financial statements in conformity with such principles requires management to make estimates and assumptions that impact the reported amounts of assets and liabilities, the disclosure of contingent assets and liabilities during the reporting period, and the reported amounts of income and expense during the reporting period. While we base estimates on historical experience, current information, and other factors deemed to be relevant, actual results could differ from those estimates. Management, in conjunction with the Company’s independent registered public accounting firm, has discussed the development and selection of the critical accounting estimates discussed herein with the Audit Committee of our Board of Directors.
We consider accounting policies and estimates to be critical to our financial condition, results of operations, or cash flows if the accounting policy or estimate requires management to make assumptions about matters that are highly uncertain and for which different estimates that management reasonably could have used for the accounting estimate in the current period, or changes in the accounting estimate that are reasonably likely to occur from period to period, could have a material impact on our financial condition, results of operations, or cash flows.
Our significant accounting policies are discussed in Item 8. Financial Statements and Supplementary Data, Note 1. Of those significant accounting policies, we have determined that accounting for our allowance for loan losses and the related reserve for unfunded commitments, mortgage-servicing rights portfolio, goodwill, real estate acquired in settlement of loans, the realization of our deferred tax asset, defined benefit pension plan, the valuation of our common stock, and the determination of fair value of financial instruments are deemed critical because of the valuation techniques used and the sensitivity of the amounts recorded in our Consolidated Financial Statements to the methods, assumptions, and estimates underlying these balances. Accounting for these critical areas requires subjective and complex judgments and could be subject to revision as new information becomes available.
36
Table of Contents
Allowance for Loan Losses
We consider our accounting policies related to the allowance for loan losses to be critical as these policies involve considerable subjective judgment and estimation by management. The allowance for loan losses is a reserve established through a provision for loan losses charged to expense. The allowance for loan losses represents management’s best estimate of probable losses that have been incurred within the existing portfolio of loans. The allowance for loan losses is necessary to reserve for estimated probable loan losses inherent in the loan portfolio. Our allowance for loan losses methodology is based on historical loss experience by type of loans, specific homogeneous risk pools, and specific loss allocations. Our process for determining the appropriate level of the allowance for loan losses is designed to account for asset deterioration as it occurs. The provision for loan losses reflects loan quality trends, including the levels of and trends related to nonaccrual loans, potential problem loans, criticized loans, and net loans charged-off or recovered, among other factors.
The level of the allowance for loan losses reflects management’s continuing evaluation of specific lending risks, loan loss experience, current loan portfolio quality, present economic, political, and regulatory conditions, and unidentified losses inherent in the current loan portfolio. Portions of the allowance for loan losses may be allocated for specific loans. However, the entire allowance for loan losses is available for any loan that, in management’s judgment, should be charged-off. While management utilizes its best judgment and information available, the ultimate adequacy of the allowance for loan losses is dependent upon a variety of factors beyond our control, including the performance of our loan portfolio, the economy, changes in interest rates, and the view of the regulatory authorities toward loan classifications and collateral valuation.
We record allowances for loan losses on specific loans when, based on current information and events, it is probable that we will be unable to collect all amounts due according to the contractual terms of the loan. Specific allowances for loans considered individually significant and that exhibit probable or observed weaknesses are determined by analyzing the borrower’s ability to repay amounts owed, guarantor support, collateral deficiencies, the relative risk grade of the loan, and economic conditions impacting the borrower’s industry, among other things. If, after review, a specific allowance is not assigned to the loan and the loan is not considered to be impaired, then the loan is included with a pool of similar loans that is subject to general reserves.
The starting point for the general component of the allowance is the historical loss experience of specific types of loans. We calculate historical loss ratios for pools of similar loans with similar characteristics based on the proportion of actual loan net charge-offs to the total population of loans in the pool. Management is currently using a five-year lookback period when computing historical loss rates to determine the component of the allowance for loan losses. Given the increase in charge-offs during 2009, we also utilized a three-year lookback period at December 31, 2009 as another reference point in determining the allowance for loan losses. Our pools of similar loans include groups of commercial and industrial loans, commercial and residential real estate loans, general consumer loans, and bankcard loans.
We calculate our general allowance by applying our historical loss factors to each pool and adjusting the percentages for other qualitative risk factors both internal and external to the Company. In general, the allowance is determined by evaluating, among other things, the experience, ability and effectiveness of the Bank’s lending management and staff, the effectiveness of the Company’s loan policies, procedures and internal controls, changes in asset quality such as past dues, nonaccruals, classified loans, and restructured loans, changes in loan portfolio volume, the composition and concentrations of the loan portfolio, the impact of competition on loan structuring and pricing, the effectiveness of the internal loan review function and Board oversight, the impact of environmental risks such as national and local economic and business conditions, legal and regulatory requirements, peer comparisons, and the impact of rising interest rates on portfolio risk.
Loans identified as losses by management, internal loan review, and / or bank examiners are charged-off. For impaired loans, we review each on a loan-by-loan basis to determine whether the impairment should be recorded as a charge-off or a reserve based on our assessment of the status of the borrower and the underlying
37
Table of Contents
collateral. In general, for collateral dependent loans, the impairment is recorded as a charge-off unless the fair value was based on an internal valuation pending receipt of a third party appraisal or other extenuating circumstances. Consumer loan accounts are charged-off generally based on pre-defined past due time periods.
In addition to our portfolio review process as discussed elsewhere in this item, various regulatory agencies, as part of their examination process, periodically review our allowance for loan losses. Such agencies may require us to recognize additions to the allowance for loan losses based on their judgments and information available to them at the time of their examination. While we use available information to recognize inherent losses on loans, future adjustments to the allowance for loan losses may be necessary based on changes in economic conditions and other factors and the impact of such changes on the Bank’s borrowers.
Management considers our allowance for loan losses at December 31, 2009 appropriate and adequate to cover probable losses inherent in the loan portfolio. However, underlying assumptions may be impacted in future periods by changes in economic conditions, the impact of regulatory examinations, and the discovery of information with respect to borrowers, which was not known to management at the time of the issuance of these Consolidated Financial Statements. Therefore, management’s assumptions may or may not prove valid. There can be no assurance that loan losses in future periods will not exceed the current allowance for loan losses amount or that future increases in the allowance for loan losses will not be required. Additionally, no assurance can be given that management’s ongoing evaluation of the loan portfolio, in light of changing economic conditions and other relevant factors, will not require significant future additions to the allowance for loan losses, thus adversely impacting our business, financial condition, results of operations, and cash flows.
See Item 1A. Risk Factors contained herein for discussion regarding the material risks and uncertainties that management believes impact our allowance for loan losses.
Mortgage-Servicing Rights Portfolio
The value of our mortgage-servicing rights portfolio represents another accounting estimate that depends heavily on current economic conditions specifically the interest rate environment and management’s judgments. We utilize the expertise of a third party consultant on a quarterly basis to assess the portfolio’s value including, but not limited to, capitalization, impairment, and amortization rates. The consultant estimates the amount and timing of prepayment rates, loan loss experience, costs to service loans, and discount rates to estimate the fair value of our mortgage-servicing rights portfolio. Amortization of the mortgage-servicing rights portfolio is based on the ratio of net servicing income received in the current period to total net servicing income projected to be realized from the mortgage-servicing rights portfolio. Projected net servicing income is determined based on the estimated future balance of the underlying mortgage loan portfolio that declines over time from prepayments and scheduled loan amortization. Future prepayment rates are estimated based on current interest rate levels, other economic conditions, market forecasts, and relevant characteristics of the mortgage-servicing rights portfolio such as loan types, interest rate stratification, and recent prepayment experience. Management believes that the modeling techniques and assumptions used by the consultant are reasonable, however, such assumptions may or may not prove valid. Thus, there can be no assurance that mortgage-servicing rights portfolio capitalization, amortization, and impairment in future periods will not exceed the current capitalization, amortization, and impairment amounts. Moreover, no assurance can be given that changing economic conditions and other relevant factors impacting our mortgage-servicing rights portfolio will not cause actual occurrences to differ from underlying assumptions thus adversely impacting our business, financial condition, results of operations, and cash flows.
Goodwill
Goodwill arose from our acquisition of various branches from 1988 through 1999 and represents the excess of the cost of businesses acquired over the fair value of the net assets acquired. Goodwill is assigned to reporting units and is then tested for impairment at least annually or on an interim basis if an event occurs or circumstances
38
Table of Contents
arise that would more likely than not reduce the fair value of the reporting unit below its carrying value. Once an impairment loss is recognized, future increases in fair value do not result in the reversal of previously recognized losses. To the extent a reporting unit’s carrying amount exceeds its fair value, an indication exists that the reporting unit’s goodwill may be impaired and a second step of impairment tests must be performed. The fair value of our reporting unit is generally calculated based on our stock price. A further reduction in our stock price may require a second step of impairment tests to be performed. Our goodwill was not impaired based on the most current analysis as of December 31, 2009. If we determine in the future that our goodwill is impaired, we would be required to record an impairment charge to our results of operations that would adversely impact our earnings and capital position. See Item 8. Financial Statements and Supplementary Data, Notes 1 and 6 for further discussion regarding our goodwill and the related impairment testing.
Real Estate Acquired in Settlement of Loans
The value of our real estate acquired in settlement of loans portfolio represents another accounting estimate that depends heavily on current economic conditions. Real estate acquired in settlement of loans is recorded, when acquired, at the lower of cost or fair value less estimated selling costs, establishing a new cost basis. Fair value of such real estate is reviewed regularly and writedowns are recorded when it is determined that the carrying value of the real estate exceeds the fair value less estimated costs to sell. Writedowns resulting from the periodic reevaluation of such properties, costs related to holding such properties, and gains and losses on the sale of foreclosed properties are charged against income. Costs relating to the development and improvement of such properties are capitalized.
The fair value of real estate acquired in settlement of loans properties is generally determined from appraisals obtained from independent appraisers. Management reviews the appraisal assumptions for reasonableness and may make adjustments when necessary to reflect current market conditions. Such assumptions may or may not prove valid. Moreover, no assurance can be given that changing economic conditions and other relevant factors impacting our real estate acquired in settlement of loans portfolio will not cause actual occurrences to differ from underlying assumptions thus adversely impacting our business, financial condition, results of operations, and cash flows.
Realization of Net Deferred Tax Asset
Management uses certain assumptions and estimates in determining income taxes payable or refundable, deferred income tax liabilities and assets for events recognized differently in our financial statements and income tax returns, and income tax expense. Determining these amounts requires analysis of certain transactions and interpretation of tax laws and regulations. Management exercises considerable judgment in evaluating the amount and timing of recognition of the resulting income tax liabilities and assets. These judgments and estimates are reevaluated on a periodic basis as regulatory and business factors change.
We include the current and deferred tax impact of our tax positions in the financial statements only when it is more likely than not (likelihood of greater than 50%) that such positions will be sustained by taxing authorities, with full knowledge of relevant information, based on the technical merits of the tax position. While we support our tax positions by unambiguous tax law, prior experience with the taxing authority, and analysis that considers all relevant facts, circumstances and regulations, management must still rely on assumptions and estimates to determine the overall likelihood of success and proper quantification of a given tax position.
We recognize deferred tax assets and liabilities based on differences between the financial statement carrying amounts and the tax bases of assets and liabilities. Management regularly reviews our deferred tax assets for recoverability based on history of earnings, expectations for future earnings, and expected timing of reversals of temporary differences. Realization of a deferred tax asset in accordance with GAAP ultimately depends on the existence of sufficient taxable income available under tax law, including future reversals of existing temporary differences, future taxable income exclusive of reversing differences, taxable income in prior carryback years, projections of taxable income in future years, and tax planning strategies.
39
Table of Contents
Although realization is not assured, management believes the recorded deferred tax assets are fully recoverable based on the periods through which losses may be carried back under the Internal Revenue Service rules. While not a necessary part of the evaluation at December 31, 2009, future evaluations may also rely on projections of future taxable income. At December 31, 2009, the net deferred tax asset totaled $5.8 million, which is fully supported by the carryback of our 2009 net operating loss to the prior years through which losses may be carried back under the Internal Revenue Service rules.
Additionally, for regulatory capital purposes, deferred tax assets are limited to the assets which can be realized through (i) carryback to prior years or (ii) taxable income in the next twelve months. At December 31, 2009, none of our net deferred tax asset was excluded from Tier 1 and total capital based on the ability to carry back our 2009 net operating loss to the prior five years. Depending on our results of operations in future periods, it is possible that some or all of our net deferred tax asset may be disallowed for regulatory capital purposes in those future periods.
Defined Benefit Pension Plan
We account for our defined benefit pension plans on an actuarial basis. Pension assumptions are significant inputs to the actuarial models that measure pension benefit obligations and related impacts on income. In particular, the assumed discount rate and expected return on assets are important elements of defined benefit pension plan expense and asset / liability measurement with regard to the plan. We evaluate these critical assumptions annually. Lower discount rates increase present values and subsequent year pension expense, while higher discount rates decrease present values and subsequent year pension expense. To determine the expected long-term rate of return on defined benefit pension plan assets, we consider asset allocations and historical returns on various categories of plan assets. Both of these key assumptions are sensitive to changes. In addition, the pension plan includes common stock of the Company, which is not traded on an exchange and the value of which is subject to change based on our financial results. At December 31, 2009, Company common stock included in the plan was 1.5% of total assets of the plan. Additionally, management periodically evaluates other assumptions involving demographic factors, such as retirement age, mortality, and turnover and updates such factors to reflect experience and expectations for the future.
Effective 2008, we ceased accruing pension benefits for employees under our noncontributory, defined benefit pension plan. Although no previously accrued benefits were lost, employees no longer accrue benefits for service subsequent to 2007. Amounts recognized within our Consolidated Financial Statements with regard to this change to our defined benefit pension plan were also computed on an actuarial basis. Because of the considerable judgment necessary in the determination of all such assumptions, actual results in any given year may differ from actuarial assumptions.
Valuation of Common Stock
On a periodic basis, we utilize the market price of our common stock within various valuations and calculations relating to our defined benefit pension plan assets, our trust department assets under management, our employee retirement accounts, our impairment analysis of goodwill, our granting of awards under our 2008 Restricted Stock Plan, our calculation of earnings per share on a diluted basis, and our valuation of such stock serving as loan collateral.
Our common stock is not listed on an exchange or any over-the-counter service. Thus, there is currently no public trading market of our common stock, and private trading of our common stock has been limited. In addition, buyers and sellers may privately negotiate transactions in our common stock. Because there is not an established market for our common stock, management may not be aware of all prices at which our common stock has been traded. Additionally, management has not determined whether the trades of which we are aware were the result of arm’s-length negotiations between the parties. Accordingly, we determine the value of our common stock based on the last five trades of the stock facilitated by the Company.
40
Table of Contents
The liquidity of our common stock depends upon the presence in the marketplace of willing buyers and sellers. We are not currently seeking listing of our common stock on a securities exchange such as NASDAQ. In the future, we may seek such a listing to improve liquidity in our stock for our shareholders. On June 26, 2009, we launched a Private Trading System on our website (www.palmettobank.com). The Private Trading System is a passive mechanism created to assist buyers and sellers in facilitating trades in our common stock.
Fair Value Measurements
The Company uses fair value measurements to record fair value adjustments to certain financial instruments and to determine fair value disclosures. Additionally, we may be required to record at fair value other assets on a nonrecurring basis. These nonrecurring fair value adjustments typically involve application of lower-of-cost-or-market accounting or writedowns of individual assets. Further, we include in the Notes to Consolidated Financial Statements information about the extent to which fair value is used to measure assets and liabilities, the valuation methodologies used, and the related impact to income. Additionally, for financial instruments not recorded at fair value, we disclose the estimate of their fair value.
Fair value is defined as the price that would be received to sell the asset or paid to transfer the liability in an orderly transaction between market participants at the measurement date. Accounting standards establish a three-level hierarchy for disclosure of assets and liabilities recorded at fair value. The classification of assets and liabilities within the hierarchy is based on whether the inputs to the valuation methodology used for measurement are observable or unobservable. Observable inputs reflect market-derived or market-based information obtained from independent sources, while unobservable inputs reflect our estimates about market data. There are three levels of inputs that may be used to measure fair value:
| • | Level 1 – Valuation is based upon quoted prices for identical instruments traded in active markets. Level 1 instruments include securities traded on active exchange markets, such as the New York Stock Exchange, as well as U.S. Treasury and other U.S. government securities that are traded by dealers or brokers in active over-the-counter markets. |
| • | Level 2 – Valuation is based upon quoted prices for similar instruments in active markets, quoted prices for identical or similar instruments in markets that are not active, and model-based valuation techniques, such as matrix pricing, for which all significant assumptions are observable in the market. Level 2 instruments include securities traded in less active dealer or broker markets and mortgage loans held for sale that are valued based on prices for other mortgage whole loans with similar characteristics. |
| • | Level 3 – Valuation is generated from model-based techniques that use significant assumptions not observable in the market. These unobservable assumptions reflect the Company’s estimates of assumptions market participants would use in pricing the asset or liability. Valuation techniques include use of option pricing models, discounted cash flow models, and similar techniques. |
We attempt to maximize the use of observable inputs and minimize the use of unobservable inputs when developing fair value measurements. When available, management uses quoted market prices to measure fair value. If market prices are not available, fair value measurement is based upon models that use primarily market-based or independently-sourced market parameters. Most of our financial instruments use either of the foregoing methodologies, collectively Level 1 and Level 2 measurements, to determine fair value adjustments recorded to our financial statements. However, in certain cases, when market observable inputs for model-based valuation techniques may not be readily available, management is required to make judgments about assumptions market participants would use in estimating the fair value of the financial instrument.
The degree of management judgment involved in determining the fair value of a financial instrument is dependent upon the availability of quoted market prices or observable market parameters. For instruments that trade actively and have quoted market prices or observable market parameters, there is minimal subjectivity involved in measuring fair value. When observable market prices and parameters are not fully available, management judgment is necessary to estimate fair value. In addition, changes in the market conditions may
41
Table of Contents
reduce the availability of quoted prices or observable data. For example, reduced liquidity in the capital markets or changes in secondary market activities could result in observable market inputs becoming unavailable. When significant adjustments are required to available observable inputs, it may be appropriate to utilize an estimate based primarily on unobservable inputs. When an active market for a security does not exist, the use of management estimates that incorporate current market participant expectations of future cash flows, and include appropriate risk premiums, is acceptable.
Significant judgment may be required to determine whether certain assets measured at fair value are included in Level 2 or Level 3. If fair value measurement is based upon recent observable market activity of such assets or comparable assets (other than forced or distressed transactions) that occur in sufficient volume and do not require significant adjustment using unobservable inputs, those assets are classified as Level 2. If not, they are classified as Level 3. Making this assessment requires significant judgment. At December 31, 2009, $40.3 million of investment securities available for sale were classified as Level 3 because significant inputs to the valuation were unobservable largely due to reduced levels of market liquidity.
Executive Summary of 2009 Financial Results
Context for 2009 and the Company
2009 was a very challenging year for the Company, the banking industry, and the U.S. economy in general. In relation to the Company, the overall economic context for 2009 included the following:
| • | Ongoing financial crisis in the overall U.S. economy that generally started in August 2008 and continued throughout 2009. |
| • | Volatile equity markets that declined significantly during the first half of 2009. |
| • | Significant stress on the banking industry with significant financial assistance to many financial institutions, extensive regulatory and congressional scrutiny, and new rule making. |
| • | General anxiety on the part of our customers and the general public. |
| • | Uncertainty about the future and when the economy will return to “normal” and questions about what will be the “new normal.” |
| • | Low and uncertain interest rate environment particularly given the government intervention in the financial markets. |
| • | High levels of unemployment that continued to increase throughout 2009. |
Additional context specific to the Company in 2009 included the following:
| • | Fast growth over the past five years growing to total assets of $1.4 billion that resulted in the Company reaching a natural “maturity/life cycle hump” that is typical for banks that reach this asset size. Typical challenges associated with this stage of our life cycle include: |
| • | Stress on our infrastructure requiring investment in the number and expertise of employees and refinement of policies and procedures. |
| • | Required investments in technology to invest in the future, and rationalization of the technology investments versus our historical investment in facilities. |
| • | Adapting products and services and related pricing and fees to remain relevant to our current and evolving customer base and competitiveness in the market place, and development of broader distribution channels for delivery of our products and services. |
| • | Application of a more sophisticated risk management approach, including a comprehensive view of risk, processes and procedures, internal and vendor expertise, and the “way we do business.” |
42
Table of Contents
| • | Executive management succession plan implemented effective July 1, 2009 and resulting organizational changes. |
| • | In planning for the retirement of the Chief Executive Officer of the Company and the Chief Executive Officer of the Bank (who also served as the President, Chief Operating Officer, and Chief Accounting Officer of the Company), the Company hired Samuel L. Erwin in March 2009 and Lee. S. Dixon in May 2009 as senior executive vice presidents. Effective July 1, 2009, the Company named Mr. Erwin as President of the Company and Chief Executive Officer and President of the Bank and Mr. Dixon as Chief Operating Officer of the Company and the Bank. Subsequently, Mr. Erwin also assumed the title of Chief Executive Officer of the Company and Mr. Dixon assumed additional responsibilities as Chief Risk Officer of the Company. |
| • | Erwin and Dixon have proven bank turn around and operational capabilities and rapidly developed and implemented the Company’s Strategic Project Plan as summarized below. |
| • | Significant deterioration in asset quality during 2009 resulting in a net loss for the year which is the first annual net loss in the history of the Company. |
| • | Increased regulatory scrutiny given declining asset quality, financial results and capital position. |
In light of the above, in 2009 management and the Board of Directors reacted quickly and defined three strategic initiatives summarized as follows:
| Component |
Primary Emphasis |
Time Horizon | ||
| Strategic Project Plan | • Manage through the extended recession and volatile economic environment
• Execute the Strategic Project Plan related to credit quality, earnings, liquidity, and capital (the Strategic Project Plan is described in more detail below) |
June 2009 – June 2010 | ||
| 2010 Annual Strategic Plan | • Strategic planning at the corporate and department level for calendar year 2010 in the context of the uncertain economic environment
• Acceleration of overcoming the growth hump/life cycle stage of maturity resulting from fast growth reaching $1.4 billion in assets
• Positioning the Bank to return to profitability in the post-recession environment |
Calendar year 2010 | ||
| Bank of the Future | • Reinventing the Bank to be “the bank of the future”
• Determining the “customer of tomorrow” and refining our products, services, and distributions channels to meet their expectations
• Adapting to the rapidly changing financial services landscape |
Three to five years | ||
We believe it is critical to focus on all three strategic initiatives simultaneously to optimize long-term shareholder value. As a result, management and the Board of Directors focused a tremendous amount of time and effort on addressing all three initiatives in 2009 with the overall objectives being: 1) to aggressively deal with our credit quality and earnings issues as quickly as possible and 2) to accelerate into a much shorter time frame the “reinvention of The Palmetto Bank” that might otherwise normally take several years to accomplish. While many
43
Table of Contents
believe the recession officially ended in 2009, the impact of the recession is continuing to be felt by the banking industry. Accordingly, overall in 2009 and continuing into 2010, our focus has been and continues to be centered on managing through the effects of the recession to position the Company to return to profitability once the economy begins to recover.
Summary Financial Results and Company Response
The national and local economy and the banking industry continue to deal with the effects of the most pronounced recession in decades. Unemployment in South Carolina rose significantly during 2009 and is higher than the national average, and residential and commercial real estate projects are depressed with significant deterioration in values. As a result, the impact in our geographic area and to individual borrowers was severe in 2009. As a result of the extended recession, our 2009 financial results were significantly impacted by the following:
| • | Provision for loan losses totaling $73.4 million compared to $5.6 million in 2008. |
| • | Real estate acquired in settlement of loans writedowns and expenses totaling $3.2 million compared to $516 thousand in 2008. |
| • | Foregone interest income on nonaccrual loans totaling $5.9 million compared to $1.5 million in 2008. |
| • | Foregone interest of $4.4 million on cash invested at the Federal Reserve at 25 basis points to maintain liquidity versus the average yield on our investment securities of 4.75%. |
| • | Higher FDIC insurance premiums due to the industry-wide special assessment in 2009 and our classification as adequately-capitalized totaling $3.3 million compared to $786 thousand in 2008. |
| • | Higher credit-related expenses for problem asset workout and other expenses to execute the Strategic Project Plan which were not incurred in 2008. |
In total, the above reduced our 2009 earnings by more than $82 million compared to 2008. Accordingly, management believes successful completion of the Strategic Project Plan will result in significant near term improvement to our earnings.
The credit-related costs for banks associated with the recession are significant. Beginning in the fourth quarter of 2008 and continuing into 2009, we recognized that construction, acquisition and development real estate projects were slowing, guarantors were becoming financially stressed, and increasing credit losses were surfacing. During 2009, delinquencies over 90 days increased resulting in an increase in nonaccrual loans indicating significant credit quality deterioration and probable losses. In particular, loans secured by real estate including acquisition, construction and development projects demonstrated stress given reduced cash flows of individual borrowers, limited bank financing and credit availability, and slow property sales. This deterioration manifested itself in our borrowers in several ways: the cash flows from underlying properties supporting the loans decreased (e.g., slower property sales for development type projects or lower occupancy rates or rental rates for operating properties), cash flows from the borrowers themselves and guarantors were under pressure given illiquid personal balance sheets and drainage by investing additional personal capital in the projects, and fair values of real estate related assets declined, resulting in lower cash proceeds from sales or fair values declining to the point that borrowers were no longer willing to sell the assets at such deep discounts.
The result of the above was a significant increase in the level of nonperforming assets during 2009. In addition, many of these loans are collateral dependent real estate loans for which we are required to writedown the loans to fair value less estimated costs to sell with the fair values determined primarily based on third party appraisals. During 2009, appraised values decreased significantly even in comparison to appraisals received within the past 12 to 36 months. As a result, our evaluation of our loan portfolio and allowance for loan losses at December 31, 2009 resulted in net charge-offs of $60.3 million and a provision for loan losses of $73.4 million during the year ended December 31, 2009.
44
Table of Contents
Strategic Project Plan
In response to the challenging economic environment and our negative financial results, in June 2009 the Board of Directors and management adopted and began executing a proactive and aggressive Strategic Project Plan (the “Plan”) to address the issues related to credit quality, liquidity, earnings, and capital. Execution of the Plan is being overseen by a special committee of the Board of Directors, and we have engaged external expertise to assist with its implementation. We believe the actions we are taking are positioning us to manage through these challenging times and begin the road to recovery.
Since June 2009, we have been, and continue to be, keenly focused on executing the Plan, which is summarized below (with additional details provided throughout the remainder of this report). No one yet can predict the ongoing impact of the recession given its length and severity. However, it is our expectation that our hard work, eventual improvement in the economy and the real estate markets, and raising additional capital, will help our borrowers and us weather this storm and start our road to recovery and return to profitability.
Credit Quality. Given the negative asset quality trends within our loan portfolio which began in 2008 and accelerated during 2009, to assist with the identification and quantification of potential losses, in May and June 2009 we performed an expanded internal loan review of our nonconsumer loan portfolio that covered approximately 70% of these loans. In July and August 2009 an independent loan review firm also reviewed approximately 35% of our nonconsumer loan portfolio. For problem loans identified, we prepared written workout plans that are borrower specific to determine how best to resolve the loans which could include restructuring the loans, requesting additional collateral, demanding payment from guarantors, sale of the loans, or foreclosure and sale of the collateral. We have also increased our monitoring of borrower and industry sector concentrations and are limiting additional credit exposure to these concentrations. In addition, we hired a new Chief Credit Officer and reevaluated our lending policies and procedures and Credit Administration function and implemented significant enhancements. Among other changes, we have reorganized our Credit Administration function, hired additional internal resources and external consulting assistance, and reorganized our line of business lending roles and responsibilities including separate designation of a commercial lending line of business with more direct oversight and clearer accountability.
Liquidity. In June 2009, we implemented a forward-looking liquidity plan and increased our liquidity monitoring. The liquidity plan includes, among other things:
| • | Implementing proactive customer deposit retention initiatives specific to large deposit customers and our deposit customers in general. |
| • | Executing targeted deposit growth and retention campaigns. |
| • | Obtaining an additional source of available financing from the Federal Reserve Discount Window and identifying additional collateral for pledging for FHLB advances. |
| • | Monitoring our correspondent bank lines of credit. |
In addition, based on the liquidity plan, we have not reinvested a significant portion of the cash received primarily from loan and security repayments, but rather have invested this cash, which totaled $161.0 million at December 31, 2009, at the Federal Reserve. These measures resulted in an overall improved liquidity position at December 31, 2009 when compared with that of December 31, 2008. Maintaining this liquidity position has reduced our interest income by approximately $4.4 million when compared with investing these funds at the average yield of 4.75% on our investment securities, since we are retaining a higher level of cash instead of reinvesting this cash in higher yielding assets. However, we expect to maintain available cash invested at the Federal Reserve for the foreseeable future.
At February 16, 2010, in addition to cash on hand, funding sources included cash invested at the Federal Reserve totaling $102.3 million, our unused borrowing capacity at the Federal Reserve totaling $55.9 million, approximately $7.0 million in available repurchase agreement capacity, and our correspondent bank line of credit
45
Table of Contents
totaling $5.0 million. In the near future, we anticipate that cash inflows resulting from our income tax refund claim on our 2009 federal income tax return of $17.5 million, the scheduled sale of two real estate properties acquired in the settlement of loans with a carrying balance of $5.6 million, and repayment and sale of outstanding loans will further contribute to our liquidity position.
Capital. At December 31, 2009, our Tier 1 leverage ratio and Tier 1 risk-based capital ratios were above the well-capitalized regulatory minimum threshold of 5% and 6%, respectively. Our total risk-based capital ratio, however, was 8.25%, which is below the well-capitalized regulatory minimum threshold of 10%. To preserve our capital, we have not paid a dividend on our common stock since the first quarter of 2009. As another means of preserving capital, we have reduced our loan portfolio by $118.2 million since December 31, 2008. We have also evaluated other capital saving alternatives such as asset sales and reducing outstanding credit commitments. To raise additional capital, we have engaged an investment banking firm and are executing a capital plan that may include issuing common stock, preferred stock, or a combination of both, debt, or other financing alternatives that are treated as capital for capital adequacy ratio purposes at the Bank. Currently, our plan is to raise additional capital in the first half of 2010; however, the Board of Directors has not yet determined the type, timing, amount or terms of securities to be issued in an offering.
Earnings. We have developed an earnings plan that is focused on improvement through a combination of revenue increases and expense reductions including assistance from external consulting firms to review our current and potential new products and services and related rates and fees. With respect to revenue increases, we have implemented risk-based loan pricing and interest rate floors on renewed and new loans meeting certain criteria and are evaluating other noninterest sources of income. At December 31, 2009, loans aggregating $190.9 million have interest rate floors, of which $156.3 million had floors greater than 5%. Regarding expense reductions, in light of the current low interest rate environment, we have reduced the interest rates paid on our deposits. In addition, we identified over $2.3 million of specific noninterest expense reductions to be realized in 2009 and into 2010, and are continuing to review other expense areas for additional reductions, including with assistance from a consulting firm that specializes in process and efficiency reviews. These expense reductions will be partially offset by the higher level of credit-related costs incurred due to legal, consulting, and carrying costs related to our higher level of nonperforming assets. Lastly, we have begun critically evaluating each of our businesses to determine their contribution to our financial performance and their relative risk/return relationship. This could result in refinement or sale of certain businesses.
Summary
In summary, during the year ended December 31, 2009, we continued to be impacted by the negative financial conditions of our borrowers and the economy in general, but we have also made substantial progress on the execution of the Strategic Project Plan adopted in June 2009. Specifically, we believe that we have made substantial progress in identifying and quantifying the impact of the economic environment on our loan portfolio and overall financial condition. We continue to rapidly execute the Plan with a current focus on raising additional capital.
46
Table of Contents
Overview
PALMETTO BANCSHARES, INC. AND SUBSIDIARY
Consolidated Balance Sheets
(dollars in thousands)
| December 31, | Dollar variance |
Percent variance |
|||||||||||||
| 2009 | 2008 | ||||||||||||||
| Assets |
|||||||||||||||
| Cash and cash equivalents |
|||||||||||||||
| Cash and due from banks |
$ | 188,084 | $ | 29,305 | $ | 158,779 | 541.8 | % | |||||||
| Total cash and cash equivalents |
188,084 | 29,305 | 158,779 | 541.8 | |||||||||||
| FHLB stock, at cost |
7,010 | 6,566 | 444 | 6.8 | |||||||||||
| Investment securities available for sale, at fair value |
119,986 | 125,596 | (5,610 | ) | (4.5 | ) | |||||||||
| Mortgage loans held for sale |
3,884 | 7,415 | (3,531 | ) | (47.6 | ) | |||||||||
| Loans, gross |
1,040,312 | 1,158,480 | (118,168 | ) | (10.2 | ) | |||||||||
| Less: allowance for loan losses |
(24,079 | ) | (11,000 | ) | (13,079 | ) | 118.9 | ||||||||
| Loans, net |
1,016,233 | 1,147,480 | (131,247 | ) | (11.4 | ) | |||||||||
| Premises and equipment, net |
29,605 | 26,347 | 3,258 | 12.4 | |||||||||||
| Premises held for sale |
— | 1,651 | (1,651 | ) | (100.0 | ) | |||||||||
| Goodwill, net |
3,691 | 3,691 | — | — | |||||||||||
| Accrued interest receivable |
4,322 | 5,466 | (1,144 | ) | (20.9 | ) | |||||||||
| Real estate acquired in settlement of loans |
27,826 | 6,719 | 21,107 | 314.1 | |||||||||||
| Income tax refund receivable |
20,869 | — | 20,869 | 100.0 | |||||||||||
| Other |
14,440 | 12,039 | 2,401 | 19.9 | |||||||||||
| Total assets |
$ | 1,435,950 | $ | 1,372,275 | $ | 63,675 | 4.6 | % | |||||||
| Liabilities and shareholders’ equity |
|||||||||||||||
| Liabilities |
|||||||||||||||
| Deposits |
|||||||||||||||
| Noninterest-bearing |
$ | 142,609 | $ | 134,465 | $ | 8,144 | 6.1 | % | |||||||
| Interest-bearing |
1,072,305 | 937,031 | 135,274 | 14.4 | |||||||||||
| Total deposits |
1,214,914 | 1,071,496 | 143,418 | 13.4 | |||||||||||
| Retail repurchase agreements |
15,545 | 16,357 | (812 | ) | (5.0 | ) | |||||||||
| Commercial paper (Master notes) |
19,061 | 27,955 | (8,894 | ) | (31.8 | ) | |||||||||
| Other short-term borrowings |
— | 79,785 | (79,785 | ) | (100.0 | ) | |||||||||
| Long-term borrowings |
101,000 | 52,000 | 49,000 | 94.2 | |||||||||||
| Accrued interest payable |
2,037 | 1,857 | 180 | 9.7 | |||||||||||
| Other |
8,378 | 7,049 | 1,329 | 18.9 | |||||||||||
| Total liabilities |
1,360,935 | 1,256,499 | 104,436 | 8.3 | |||||||||||
| Shareholders’ equity |
|||||||||||||||
| Common stock |
32,282 | 32,230 | 52 | 0.2 | |||||||||||
| Capital surplus |
2,599 | 2,095 | 504 | 24.1 | |||||||||||
| Retained earnings |
47,094 | 87,568 | (40,474 | ) | (46.2 | ) | |||||||||
| Accumulated other comprehensive loss, net of tax |
(6,960 | ) | (6,117 | ) | (843 | ) | 13.8 | ||||||||
| Total shareholders’ equity |
75,015 | 115,776 | (40,761 | ) | (35.2 | ) | |||||||||
| Total liabilities and shareholders’ equity |
$ | 1,435,950 | $ | 1,372,275 | $ | 63,675 | 4.6 | % | |||||||
47
Table of Contents
Cash and Cash Equivalents
Cash and cash equivalents increased $158.8 million at December 31, 2009 over December 31, 2008 due primarily to excess liquidity resulting from increased deposit and long-term borrowing funding offset by the repayment of other short-term borrowings. We maintain our excess liquidity with the Federal Reserve to reduce credit risks associated with selling those funds to correspondent banks. For the foreseeable future, we are intentionally maintaining these higher cash balances to provide liquidity, notwithstanding the negative impact to our interest income since we only earn 25 basis points on our deposits with the Federal Reserve versus investing this cash in higher earning assets. For 2009, the difference between the interest earned on the cash at the Federal Reserve at 25 basis points and the interest that could have been earned by investing this cash in the securities portfolio at the average yield on the portfolio of 4.75% was $4.4 million. Once the banking industry returns to a more stable operating environment and we raise additional capital, our plan is to reinvest these cash reserves into higher yielding assets which should significantly improve our net interest margin.
Concentrations and Restrictions. In an effort to manage our associated risks, we generally do not sell federal funds to other financial institutions because they are essentially uncollateralized loans to other financial institutions. Therefore, management regularly evaluates the risk associated with the counterparties to these transactions to ensure that we do not expose ourselves to any significant risks with regard to our cash and cash equivalent balances.
Approximately $512 thousand, or 0.3%, of the balance of cash and cash equivalents was restricted as of December 31, 2009, to secure a letter of credit. At December 31, 2008, no cash or cash equivalents were restricted under such an agreement.
Approximately $836 thousand, or 0.4%, of the balance of cash and cash equivalents was restricted as of December 31, 2009, as required under our credit card and merchant credit card agreement. At December 31, 2008, no cash or cash equivalents were restricted under such agreements.
Investment Activities
General. The primary objective of the Company’s management of the investment portfolio is to maintain a portfolio of high quality, highly liquid investments yielding competitive returns. We are required under federal regulations to maintain adequate liquidity to ensure safe and sound operations. We maintain investment balances based on a continuing assessment of cash flows, the level of loan production, current interest rate risk strategies, and the assessment of the potential future direction of market interest rate changes. Investment securities differ in terms of default, interest rate, liquidity, and expected rate of return risk.
Composition. The following table summarizes the composition of our investment securities available for sale portfolio at the dates indicated (dollars in thousands).
| December 31, 2009 | December 31, 2008 | December 31, 2007 | ||||||||||||||||
| Total | % of total | Total | % of total | Total | % of total | |||||||||||||
| U.S. Treasury and federal agencies |
$ | 16,297 | 13.6 | % | $ | — | — | % | $ | 20,743 | 21.7 | % | ||||||
| State and municipal |
46,785 | 39.0 | 50,830 | 40.5 | 52,159 | 54.5 | ||||||||||||
| Collateralized mortgage obligations |
40,318 | 33.6 | 54,639 | 43.5 | — | — | ||||||||||||
| Other mortgage-backed (federal agencies) |
16,586 | 13.8 | 20,127 | 16.0 | 22,813 | 23.8 | ||||||||||||
| Total investment securities available for sale |
$ | 119,986 | 100.0 | % | $ | 125,596 | 100.0 | % | $ | 95,715 | 100.0 | % | ||||||
Average balances of investment securities available for sale decreased to $119.2 million during the year ended December 31, 2009 from $123.6 million during the same period of 2008. The decrease in investment securities available for sale at December 31, 2009 compared with December 31, 2008 was primarily the result of
48
Table of Contents
principal paydowns within the collateralized mortgage obligation sector during 2009. Offsetting this decrease was our purchase of U.S. Treasury and federal agency securities during the year ended December 31, 2009. The intent of the purchases was to acquire additional securities to pledge as collateral.
At December 31, 2009, the fair value of the investment securities available for sale portfolio represented 8.4% of total assets, a decrease from 9.2% at December 31, 2008.
Unrealized Position. The following table summarizes the amortized cost and fair value composition of our investment securities available for sale portfolio at the dates indicated (dollars in thousands).
| December 31, 2009 | December 31, 2008 | December 31, 2007 | ||||||||||||||||
| Amortized cost |
Fair value |
Amortized cost |
Fair value |
Amortized cost |
Fair value | |||||||||||||
| U.S. Treasury and federal agencies |
$ | 16,294 | $ | 16,297 | $ | — | $ | — | $ | 20,725 | $ | 20,743 | ||||||
| State and municipal |
44,908 | 46,785 | 50,297 | 50,830 | 52,677 | 52,159 | ||||||||||||
| Collateralized mortgage obligations |
42,508 | 40,318 | 58,033 | 54,639 | — | — | ||||||||||||
| Other mortgage-backed (federal agencies) |
15,783 | 16,586 | 19,876 | 20,127 | 22,722 | 22,813 | ||||||||||||
| Total investment securities available for sale |
$ | 119,493 | $ | 119,986 | $ | 128,206 | $ | 125,596 | $ | 96,124 | $ | 95,715 | ||||||
U.S. Treasury and federal agency securities are government debts issued by the U.S. Treasury through the Bureau of the Public Debt. U.S. Treasury and federal agency securities are the debt financing instruments of the U.S. federal government. Our U.S. Treasury and federal agency securities are very liquid and are heavily traded.
State and municipal investment securities are debt investment securities issued by a state, municipality, or county in order to finance its capital expenditures. The most substantial risk associated with buying state and municipal investment securities is the financial risk associated with the municipality from which the securities are purchased. Although municipal bonds in smaller municipalities can sometimes be difficult to sell quickly, we do not currently anticipate that we will liquidate this portfolio in the near term.
Collateralized mortgage obligations are a mortgage-backed security sub-type in which the mortgages are ordered into tranches by some quality (such as repayment time) with each tranche sold as a separate security. These mortgage-backed securities separate the mortgage pools into short, medium, and long-term tranches. Our collateralized mortgage obligations are all fixed rate and are paid a fixed rate of interest at regular intervals. Monthly fluctuations in income occur only as there are changes in amortization or accretions due to changes in prepayment speeds.
Other mortgage-backed investment securities include investment instruments that represent ownership of an undivided interest in a group of mortgages. Principal and interest from the individual mortgages are used to pay principal and interest on the mortgage-backed investment security. Monthly income from other mortgage-backed investment securities may fluctuate as interest rates change due to the volume of mortgage prepayments.
We use prices from third party pricing services and, to a lesser extent, indicative (non-binding) quotes from third party brokers, to measure fair value of our investment securities. We utilize multiple third party pricing services and brokers to obtain fair values; however, management generally obtains one price/quote for each individual security. For securities priced by third party pricing services, management determines the most appropriate and relevant pricing service for each security class and has that vendor provide the price for each security in the class. We record the unadjusted value provided by the third party pricing service/broker in our Consolidated Financial Statements, subject to our internal price verification procedures.
Pledged. Public depositors from state and local municipalities typically require that the Bank pledge investment grade securities to the accounts to ensure repayment. Although the funds are usually a low cost, relatively stable source of funding for the Bank, availability depends on the particular government’s fiscal policies and cash flow needs.
49
Table of Contents
Approximately 61% of the investment securities portfolio, at fair value, was pledged to secure public deposits, including retail repurchase agreements, and trust assets at December 31, 2009 as compared with 55% at December 31, 2008. Of the Company’s $73.2 million pledged available for sale investment securities balance at December 31, 2009, $56.3 million of the investment securities portfolio, at fair value, was securing public deposits and trust assets at December 31, 2009. Of the Company’s $69.1 million pledged available for sale investment securities balance at December 31, 2008, $47.0 million of available for sale investment securities was securing public deposits and trust assets. As part of our liquidity plan, we have reviewed all of our public funds accounts and, where appropriate, restructured certain of these accounts to reduce the amount of required collateral pledged for these accounts.
Approximately $6.3 million, or 5%, of the portfolio was pledged to secure federal funds funding from a correspondent bank as of December 31, 2009. At December 31, 2008, no securities were pledged under such agreements.
Approximately $29.8 million, or 25%, of the portfolio was pledged to collateralize FHLB advances and letters of credit as of December 31, 2009 of which $26.8 million was utilized as lendable collateral. At December 31, 2008, approximately $41.6 million, or 33%, of the portfolio was pledged to collateralize FHLB advances and letters of credit of which $37.5 million was utilized as lendable collateral.
Other-Than-Temporary Impairment Analysis. The following tables summarize the gross unrealized losses, fair value, and the number of securities in each category of investment securities available for sale, aggregated by investment category and length of time that individual securities have been in a continuous unrealized loss position, at the dates indicated (dollars in thousands).
| December 31, 2009 | ||||||||||||||||||||||||
| Less than 12 months | 12 months or longer | Total | ||||||||||||||||||||||
| # | Fair value | Gross unrealized losses |
# | Fair value | Gross unrealized losses |
# | Fair value | Gross unrealized losses | ||||||||||||||||
| U.S. Treasury and federal agencies |
1 | $ | 300 | $ | — | — | $ | — | $ | — | 1 | $ | 300 | $ | — | |||||||||
| State and municipal |
2 | 662 | 3 | — | — | — | 2 | 662 | 3 | |||||||||||||||
| Collateralized mortgage obligations |
3 | 10,323 | 412 | 6 | 16,624 | 1,946 | 9 | 26,947 | 2,358 | |||||||||||||||
| Other mortgage-backed (federal agencies) |
2 | 1,444 | 35 | — | — | — | 2 | 1,444 | 35 | |||||||||||||||
| Total investment securities available for sale |
8 | $ | 12,729 | $ | 450 | 6 | $ | 16,624 | $ | 1,946 | 14 | $ | 29,353 | $ | 2,396 | |||||||||
| December 31, 2008 | ||||||||||||||||||||||||
| Less than 12 months | 12 months or longer | Total | ||||||||||||||||||||||
| # | Fair value | Gross unrealized losses |
# | Fair value | Gross unrealized losses |
# | Fair value | Gross unrealized losses | ||||||||||||||||
| State and municipal |
12 | $ | 5,441 | $ | 101 | 1 | $ | 423 | $ | 1 | 13 | $ | 5,864 | $ | 102 | |||||||||
| Collateralized mortgage obligations |
13 | 52,603 | 3,417 | — | — | — | 13 | 52,603 | 3,417 | |||||||||||||||
| Other mortgage-backed (federal agencies) |
4 | 1,336 | 15 | 1 | 838 | 4 | 5 | 2,174 | 19 | |||||||||||||||
| Total investment securities available for sale |
29 | $ | 59,380 | $ | 3,533 | 2 | $ | 1,261 | $ | 5 | 31 | $ | 60,641 | $ | 3,538 | |||||||||
Gross unrealized losses decreased $1.1 million from December 31, 2008 to December 31, 2009, primarily within the collateralized mortgage obligation sector of the investment securities portfolio. The U.S. Treasury’s Public Private Investment Program (“PPIP”) continues to influence prices positively in the collateralized
50
Table of Contents
mortgage obligation sector as does investor demand for higher yielding products. Gross unrealized losses on collateralized mortgage obligations in the twelve months or longer category increased based on our date of purchase.
We conduct other-than-temporary impairment analysis on a quarterly basis, and we recognize other-than-temporary impairment by evaluating separately other-than-temporarily impaired losses due to credit issues and losses related to all other factors. Other-than-temporary impairment exists when it is more likely than not that the security will mature or be sold before its amortized cost basis can be recovered. An other-than-temporary impairment related to credit losses is recognized through earnings while an other-than-temporary impairment related to other factors is recognized in other comprehensive income. Based on our other-than-temporary impairment analysis as of December 31, 2009, we concluded that one collateralized mortgage obligation with a fair value of $2.3 million and amortized cost of $3.3 million was other-than-temporarily impaired. We concluded this based on its fair value position below amortized cost followed by our analysis of our broker provided fair values and our verification of this information using external sources. Due to the fact that we do not intend to sell this security nor is it more likely than not that we will have to sell the security prior to the recovery of its amortized cost basis less any current period credit loss, the amount of impairment related to credit loss is recognized in earnings and the amount of impairment related to other matters is recognized in other comprehensive income. For the year ended December 31, 2009, a $49 thousand other-than-temporarily credit impairment was recognized in Other noninterest expense in the Consolidated Statements of Income (Loss).
Fair values of the investment securities portfolio could decline in the future if the underlying performance of the collateral for collateralized mortgage obligations or other securities deteriorates and the levels do not provide sufficient protection for contractual principal and interest. As a result, there is risk that additional other-than-temporary impairments may occur in the future particularly in light of the current economic environment.
Ratings. The following table summarizes Moody’s ratings, by segment, of the investment securities available for sale, at December 31, 2009. An AAA rating is based not only on the credit of the issuer, but may also include consideration of the structure of the securities and the credit quality of the collateral.
| U.S. Treasury and federal agencies |
State and municipal |
Collateralized mortgage obligations |
Other mortgage-backed (federal agencies) |
|||||||||
| Aaa |
69 | % | 2 | % | 68 | % | 100 | % | ||||
| Aa1-A3 |
— | 73 | 10 | — | ||||||||
| Baa1-B3 |
— | 16 | 10 | — | ||||||||
| Not rated or withdrawn rating |
31 | 9 | 12 | — | ||||||||
| Total |
100 | % | 100 | % | 100 | % | 100 | % | ||||
31% of the U.S. Treasury and federal agencies were not rated by Moody’s or Standard and Poor’s ratings at December 31, 2009. There is an implicit AAA rating on U.S. Treasury and federal agency securities.
Of the state and municipal investment securities not rated by Moody’s at December 31, 2009, 100% were rated AA by Standard and Poor’s ratings. Of the state and municipal investment securities with withdrawn ratings by Moody’s at December 31, 2009, 22% were rated AA+, 29% were rated AA, 28% were rated AA-, and 21%, or $565 thousand, were not rated by Standard and Poor’s ratings.
Of the collateralized mortgage obligations not rated by Moody’s at December 31, 2009, 100% of the securities were rated AAA by Standard and Poor’s ratings.
Maturities. The following table summarizes the maturity distribution schedule with corresponding weighted-average yields of amortized cost of investment securities available for sale at and for the period ended
51
Table of Contents
December 31, 2009 (dollars in thousands). Weighted-average yields have not been computed on a fully taxable-equivalent basis. Collateralized mortgage obligations and other mortgage-backed securities are included in maturity categories based on their stated maturity date. Expected maturities may differ from contractual maturities because issuers may have the right to call or prepay obligations.
| Amortized cost |
Book yield |
|||||
| U.S. Treasury and federal agencies |
||||||
| In one year or less |
$ | 16,294 | 0.2 | % | ||
| After 1 through 5 years |
— | — | ||||
| After 5 through 10 years |
— | — | ||||
| After 10 years |
— | — | ||||
| Total U.S. Treasury and federal agencies |
16,294 | 0.2 | ||||
| State and municipal |
||||||
| In one year or less |
4,674 | 3.1 | ||||
| After 1 through 5 years |
26,949 | 3.5 | ||||
| After 5 through 10 years |
12,418 | 3.7 | ||||
| After 10 years |
867 | 4.0 | ||||
| Total state and municipal |
44,908 | 3.5 | ||||
| Collateralized mortgage obligations |
||||||
| In one year or less |
— | — | ||||
| After 1 through 5 years |
— | — | ||||
| After 5 through 10 years |
— | — | ||||
| After 10 years |
42,508 | 6.1 | ||||
| Total collateralized mortgage obligations |
42,508 | 6.1 | ||||
| Other mortgage-backed (federal agencies) |
||||||
| In one year or less |
1 | 0.2 | ||||
| After 1 through 5 years |
120 | 3.9 | ||||
| After 5 through 10 years |
7,182 | 5.2 | ||||
| After 10 years |
8,480 | 5.4 | ||||
| Total other mortgage-backed (federal agencies) |
15,783 | 5.3 | ||||
| Total investment securities available for sale |
$ | 119,493 | 4.2 | % | ||
The weighted-average contractual life of investment securities available for sale was 3.9 years at December 31, 2009. Since approximately 49%, based on amortized cost, of the portfolio is collateralized mortgage obligations or other mortgage-backed securities, the expected remaining maturity may differ from contractual maturity because borrowers generally have the right to prepay obligations before the underlying mortgages mature.
Concentrations. Two state and municipal security issuer issued securities which totaled 2.1% and 3.0%, respectively, of total shareholders’ equity at December 31, 2009. Fourteen state and municipal security issuers issued securities with fair values ranging from 1.0% to 1.9% of total shareholders’ equity at December 31, 2009.
Eight collateralized mortgage obligation issuers issued securities with fair values ranging from 2.3% to 7.9% of total shareholders’ equity at December 31, 2009. One collateralized mortgage obligation, issued by Bank of America Alternative Loan Trust, had a fair value of $7.8 million, or 10.4%, of shareholders’ equity and an amortized cost of $7.9 million at December 31, 2009.
52
Table of Contents
The following table summarizes issuer concentrations of other mortgage-backed investment securities at fair value at December 31, 2009 (dollars in thousands).
| Federal National Mortgage Association |
Federal Home Loan Mortgage Corporation |
Government National Mortgage Association |
Total | |||||||||||||
| Other mortgage-backed (federal agencies) |
$ | 13,114 | $ | 2,029 | $ | 1,443 | $ | 16,586 | ||||||||
| As a percentage of shareholders’ equity |
17.5 | % | 2.7 | % | 1.9 | % | 22.1 | % | ||||||||
Realized Gains and Losses. The following table summarizes the gross realized gains and losses on investment securities available for sale for the periods indicated (in thousands).
| For the years ended December 31, | |||||||||
| 2009 | 2008 | 2007 | |||||||
| Realized gains |
$ | 2 | $ | 1 | $ | — | |||
| Realized losses |
— | — | — | ||||||
| Net realized gains |
$ | 2 | $ | 1 | $ | — | |||
Lending Activities
General. Loans continue to be the largest component of our assets. During the year ended December 31, 2009, gross loans declined approximately $118.2 million, or 10.2%, as we actively sought to reduce our loan portfolio to preserve capital as part of our capital plan with particular focus on reducing concentrations in the commercial real estate related segments of the loan portfolio. Based on our risk assessment of borrowers, we also implemented risk-based loan pricing and interest rate floors, or minimum interest rates, both at origination and renewal. In addition, we are proactively addressing the reduction of our nonperforming assets through restructurings, charge-offs, and sales. During the year ended December 31, 2009, we charged-off approximately $54.5 million of loans evaluated individually for impairment and transferred approximately $21.5 million of loans evaluated individually for impairment to the real estate acquired in settlement of loans portfolio.
Composition. The following table summarizes gross loans, categorized by FDIC code, at the dates indicated (dollars in thousands).
| December 31, 2009 | December 31, 2008 | |||||||||||
| Total | % of total | Total | % of total | |||||||||
| Secured by real estate |
||||||||||||
| Construction, land development, and other land loans |
$ | 205,465 | 19.8 | % | $ | 257,879 | 22.3 | % | ||||
| Farmland |
466 | — | 662 | 0.1 | ||||||||
| Single-family residential |
203,330 | 19.6 | 216,311 | 18.7 | ||||||||
| Multifamily residential |
30,668 | 3.0 | 31,532 | 2.7 | ||||||||
| Nonfarm nonresidential |
459,130 | 44.1 | 493,977 | 42.6 | ||||||||
| Commercial and industrial |
61,788 | 5.9 | 73,609 | 6.4 | ||||||||
| Obligations of states and political subdivisions of the U.S. |
1,418 | 0.1 | 2,602 | 0.2 | ||||||||
| General consumer |
57,581 | 5.5 | 60,626 | 5.2 | ||||||||
| Credit line |
5,501 | 0.5 | 6,215 | 0.5 | ||||||||
| Bankcards |
13,214 | 1.3 | 12,416 | 1.1 | ||||||||
| Others |
1,751 | 0.2 | 2,651 | 0.2 | ||||||||
| Loans, gross |
$ | 1,040,312 | 100.0 | % | $ | 1,158,480 | 100.0 | % | ||||
53
Table of Contents
The following table summarizes gross loans, categorized by loan purpose, at the dates indicated (dollars in thousands).
| December 31, | |||||||||||||||||||||||||||||||
| 2009 | 2008 | 2007 | 2006 | 2005 | |||||||||||||||||||||||||||
| Total | % of total | Total | % of total | Total | % of total | Total | % of total | Total | % of total | ||||||||||||||||||||||
| Commercial business |
$ | 121,691 | 11.7 | % | $ | 154,304 | 13.3 | % | $ | 145,634 | 13.9 | % | $ | 112,264 | 11.9 | % | $ | 90,345 | 10.4 | % | |||||||||||
| Commercial real estate |
671,701 | 64.6 | 740,420 | 63.9 | 639,144 | 61.2 | 593,377 | 62.7 | 561,575 | 64.8 | |||||||||||||||||||||
| Installment |
20,845 | 2.0 | 23,547 | 2.0 | 25,315 | 2.4 | 22,139 | 2.3 | 18,677 | 2.2 | |||||||||||||||||||||
| Installment real estate |
80,395 | 7.7 | 85,506 | 7.4 | 75,721 | 7.2 | 66,161 | 7.0 | 55,682 | 6.4 | |||||||||||||||||||||
| Indirect |
36,291 | 3.5 | 34,566 | 3.0 | 39,502 | 3.8 | 43,634 | 4.6 | 30,481 | 3.5 | |||||||||||||||||||||
| Credit line |
1,970 | 0.2 | 2,090 | 0.2 | 2,188 | 0.3 | 1,982 | 0.2 | 2,022 | 0.2 | |||||||||||||||||||||
| Prime access |
66,082 | 6.4 | 64,384 | 5.5 | 54,164 | 5.2 | 53,883 | 5.7 | 54,296 | 6.3 | |||||||||||||||||||||
| Residential mortgage |
26,282 | 2.5 | 36,611 | 3.2 | 40,842 | 3.9 | 35,252 | 3.7 | 34,453 | 4.0 | |||||||||||||||||||||
| Bankcards |
13,236 | 1.3 | 12,470 | 1.1 | 12,702 | 1.2 | 12,001 | 1.3 | 12,182 | 1.4 | |||||||||||||||||||||
| Business manager |
319 | — | 152 | — | 326 | — | 370 | — | 230 | — | |||||||||||||||||||||
| Other |
1,081 | 0.1 | 1,934 | 0.2 | 2,045 | 0.2 | 1,795 | 0.2 | 2,064 | 0.3 | |||||||||||||||||||||
| Loans in process |
(33 | ) | — | 2,141 | 0.2 | 6,511 | 0.6 | 2,397 | 0.3 | 3,413 | 0.4 | ||||||||||||||||||||
| Deferred loans fees and costs |
452 | — | 355 | — | 676 | 0.1 | 658 | 0.1 | 761 | 0.1 | |||||||||||||||||||||
| Loans, gross |
$ | 1,040,312 | 100.0 | % | $ | 1,158,480 | 100.0 | % | $ | 1,044,770 | 100.0 | % | $ | 945,913 | 100.0 | % | $ | 866,181 | 100.0 | % | |||||||||||
Loans included in both of the preceding loan composition tables are net of participations sold. Participations sold totaled $12.5 million (2 loans) and $26.7 million (7 loans) at December 31, 2009 and 2008, respectively. The decline in participations sold between these periods was the result of our completion of the foreclosure process on five loans secured by real estate, for which we sold participations. As a result of the completed foreclosure process, these loans, net of participations sold, were transferred to our real estate acquired in settlement of loans portfolio. With regard to participations sold, we serve as the lead bank and are therefore responsible for certain administration and other management functions as agent to the participating banks. We are in active discussions with the participating banks to keep them informed of the status of these loans and determine loan workout plans.
Mortgage loans serviced for the benefit of others amounted to $426.6 million and $377.3 million at December 31, 2009 and December 31, 2008, respectively, and are not included in our Consolidated Balance Sheets.
Underwriting. General. There are inherent risks associated with our lending activities. Prudent risk taking requires sound policies intended to manage the risk within the portfolio and control processes intended to ensure compliance with those policies. Management reviews and approves these policies and procedures on a regular basis. During 2009, our loan policy was amended and approved by the Board of Directors to, among other things, reduce lending limit approval authorities, prohibit out-of-market loans to borrowers for which we do not have a previously existing relationship, prohibit brokered loans, increase monitoring of collateral for non-real estate loans, and require regular reporting of portfolio concentrations. Management believes that active monitoring of the assets within our loan portfolio is critical to our business.
We do not generally originate loan in excess of 100% of collateral value, offer loan payment arrangements resulting in negative amortization, engage in lending practices subjecting borrowers to substantial payment increases (e.g. principal deferral periods, loans with initial interest-only periods, etc.), nor do we offer loan payment arrangements with minimum payments that are less than accrued interest.
54
Table of Contents
Loan Scoring and Approval. We have established and follow guidelines with regard to the scoring and approval of loans. Our loan approval process is multi-layered and incorporates a computer-based scoring analysis for all consumer loans and all commercial loans less than $500 thousand. All commercial loans greater than or equal to $500 thousand are reviewed and approved by our officer’s credit committee and the Board of Directors, if over certain limits.
Monitoring. Compliance with our underwriting policies and procedures is monitored through a loan approval and documentation review process and the resulting exception reports.
We perform, internally and through the use of external third parties, independent loan reviews to validate our loan risk program on a periodic basis. Although all of the loans within our loan portfolio are included in the population from which to select loans subject to review, commercial real estate loans are given more weight in the loan review selection process as a result of their risk characteristics and their concentration within our loan portfolio. Summary loan review reports are submitted to the Officer’s Credit Committee and the Board of Directors. The loan review process complements and reinforces the risk identification and assessment decisions made by the Company and the Company’s policies and procedures.
Validation. Our underwriting policies and processes are validated through the ongoing analysis of asset quality trends. A reporting system supplements the monitoring process by providing management with frequent reports related to loan production, quality, and concentrations. During 2009, we enhanced this reporting both to management and the Board of Directors.
Commercial Business. Commercial business loans are underwritten after evaluating and understanding the borrower’s ability to operate profitably while prudently expanding the borrower’s business. Underwriting standards are designed to promote relationship banking rather than transactional banking. If we believe that the borrower’s management possesses sound ethics and solid business acumen, management examines current and projected cash flows to determine the likelihood that the borrower will repay its obligations as agreed. Commercial business loans are primarily made based on the projected cash flows of the borrower and secondarily on the underlying collateral provided by the borrower. The actual cash flows of borrowers, however, may not be as expected, and the collateral securing loans may fluctuate in value. Most commercial business loans are secured by the assets being financed or other business assets, such as accounts receivable or inventory, and generally incorporate a personal guarantee. However, we make some short-term loans on an unsecured basis. In the case of loans secured by accounts receivable, the availability of funds for the repayment of these loans may depend substantially on the ability of the borrower to collect amounts due from its customers. As a result of these factors, management believes that commercial business loans generally involve greater risk than real estate loans.
Our commercial business loans are generally made with terms that do not exceed five years. Such loans may have fixed or variable interest rates with variable rates that change at periods ranging from one day to one year based on the prime lending rate as the interest rate index.
Commercial Real Estate. Commercial real estate loans are subject to underwriting standards and processes similar to commercial business loans with additional standards with regard to real estate collateral. These loans are viewed primarily as cash flow loans and secondarily as loans secured by real estate. Management monitors and evaluates commercial real estate loans based on collateral type. In addition, management analyzes the loans based on owner occupied commercial real estate loans versus nonowner occupied loans.
The Company makes commercial real estate loans to businesses within most industry sectors. Interest rates charged on these real estate loans are determined by market conditions existing at the time of the loan commitment. Generally, loans have adjustable rates, although the rate may be fixed for three to five years of the term of the loan depending on market conditions, collateral, and our relationship with the borrower. Amortization of commercial and installment real estate loans varies but typically does not exceed 20 years. Normally, we have collateral securing real estate loans appraised.
55
Table of Contents
We originate loans to developers and builders that are secured by nonowner occupied properties. Such loans are typically approved based on predetermined loan-to-collateral values. Construction loans are underwritten utilizing feasibility studies, independent appraisal reviews, sensitivity analysis of absorption and lease rates, and/or financial analysis of the developers and property owners. Construction loans are generally based upon estimates of costs and values associated with the complete projects and often involve the disbursement of funds with repayment dependent on the success of the ultimate project. Sources of repayment for these types of loans may be precommitted permanent loans from approved long-term lenders, sales of developed property, or an interim loan commitment from us until permanent financing is obtained. We monitor these loans by conducting onsite inspections. During 2009, we centralized the oversight and disbursement of construction draws to contractors working for borrowers, and we hired a construction draw manager to review advance requests before funds are advanced to borrowers. We believe that these loans have higher risks than other real estate loans because their repayment is sensitive to interest rate changes, governmental regulation of real property, general economic and market conditions, and the availability of long-term financing particularly in the current economic environment.
Installment Real Estate. Underwriting standards for single-family real estate purpose loans within the installment real estate loan portfolio category (for example, home equity loans) are heavily regulated by statutory requirements, which include, but are not limited to, maximum loan-to-value percentages.
As part of our residential lending program, we originate residential construction loans to finance the construction of individual, owner occupied houses with 80% loan-to-value ratios to qualified builders although higher loan-to-value ratios may be utilized at our discretion. Such loans involve additional risks because loan funds are advanced based on the security of the project under construction. We typically structure these construction loans to be converted to preapproved permanent loans at the completion of the construction phase. Loan proceeds are disbursed in increments as construction progresses and as inspections warrant. These construction loans are generally at a competitive fixed or adjustable-rate of interest for one or two year terms. We also offer lot loans intended for residential use that may be on a fixed or adjustable-rate basis.
Residential Mortgages. Our mortgage lenders make both fixed-rate and adjustable-rate single-family mortgage loans with terms generally ranging from 10 to 30 years. Adjustable-rate mortgage loans currently offered by the Company have interest rates that adjust annually or adjust annually after being fixed for a period of several years in accordance with a designated index. We may offer loans that have interest rates that adjust annually or adjust annually after being fixed for a period of three to seven years in accordance with a designated index (although we currently do not offer these loans). Adjustable-rate mortgage loans may be originated with a limit on any increase or decrease in the interest rate per year further limited by the amount by which the interest rate can increase or decrease over the life of the loan. In order to encourage the origination of adjustable-rate mortgage loans with interest rates that adjust annually, the Company, like many of our competitors, generally offers a more attractive rate of interest on such loans than on fixed-rate mortgage loans.
A large percentage of our originated single-family mortgage loans are underwritten pursuant to guidelines that permit the sale of these loans in the secondary market to government or private agencies. We participate in secondary market activities by selling whole loans and participations in loans primarily to the FHLB under its Mortgage Partnership Program and the Federal Home Loan Mortgage Corporation (“FHLMC”). This practice enables us to satisfy the demand for these loans in our local communities, to meet asset and liability objectives of the Company, and to develop a source of fee income through the servicing of these loans. We may sell fixed-rate, adjustable-rate, and balloon-term loans. Based on current interest rates as well as other factors, we intend to sell selected originations of conforming 30 year and 15 year fixed-rate mortgage loans. While we have not historically sold loans to the Federal National Mortgage Association (“FNMA”) and had no plans to do so in the future, FNMA suspended the Company as a FNMA Seller/Servicer effective December 30, 2009, since our total risk-based capital ratio was less than 10%.
56
Table of Contents
To protect against declines in collateral value, when we originate and underwrite single-family mortgage loans to be retained in our residential mortgage portfolio, if the loan exceeds 80% of the collateral value, we require private mortgage insurance that protects us against losses of at least 20% of the mortgage loan amount.
Effective January 1, 2010, to better manage our regulatory compliance and provide more consistent underwriting and loan pricing, we began originating all new single-family first mortgage and closed-end second mortgage loans through our Mortgage department rather than through our branch network.
Consumer. Management believes that the Company’s loan scoring and approval policies and procedures, as outlined previously, coupled with relatively small loan amounts that are spread across many individual borrowers minimize risk within the consumer sectors of our loan portfolio.
Pledged. To borrow from the FHLB, members must pledge collateral to secure advances and letters of credit. Acceptable collateral include, among other types of collateral, a variety of residential, multifamily, home equity lines and second mortgages, and commercial loans. Approximately $407.0 million of gross loans were pledged to collateralize FHLB advances and letters of credit at December 31, 2009, of which $162.0 million was available as lendable collateral. Of the $379.4 million of gross loans pledged at December 31, 2008, $159.1 million was available as lendable collateral.
During the second quarter of 2009, we established a borrowing relationship with the Federal Reserve through its Discount Window. As of December 31, 2009, our borrowings capacity at the Federal Reserve was secured by a blanket lien on a portion of our commercial and consumer loan portfolios. The amount of borrowing capacity is calculated by the Federal Reserve’s internally modeled fair value estimate calculations based on the loan collateral filings that are submitted by the Company. Of the $108.8 million of loans pledged at December 31, 2009, $61.2 million was available as lendable collateral. We had no outstanding borrowings from the Federal Reserve at December 31, 2009.
Concentrations. General. During 2009, we increased our monitoring of borrower and industry sector concentrations and are limiting additional credit exposure to these concentrations, in particular the segments of our loan portfolio secured by commercial real estate. In addition, we are proactively executing loan workout plans with a particular focus on reducing our concentrations in these segments. In addition, in the fourth quarter of 2009 we executed a contract with an investment banking firm to assist us with the potential sale, individually or in bulk, of a pool of commercial real estate loans aggregating $68.1 million. The pool of loans is being actively marketed with bids to be received by the end of February 2010.
Loan Type/Industry Concentration. The following table summarizes loans secured by commercial real estate, categorized by FDIC code, at December 31, 2009 (dollars in thousands).
| Total | % of gross loans |
% of Bank’s total regulatory capital |
|||||||
| Secured by commercial real estate |
|||||||||
| Construction, land development, and other land loans |
$ | 205,465 | 19.8 | % | 220.9 | % | |||
| Multifamily residential |
30,668 | 2.9 | 33.0 | ||||||
| Nonfarm nonresidential |
459,130 | 44.1 | 493.6 | ||||||
| Total loans secured by commercial real estate |
$ | 695,263 | 66.8 | % | 747.5 | % | |||
57
Table of Contents
The following table further categorizes loans secured by commercial real estate, categorized by FDIC code, at December 31, 2009 (dollars in thousands).
| Total | % of gross loans |
% of Bank’s total regulatory capital |
|||||||
| Development commercial real estate loans |
|||||||||
| Secured by: |
|||||||||
| Land—unimproved (commercial or residential) |
$ | 89,234 | 8.6 | % | 95.9 | % | |||
| Land development—commercial |
14,087 | 1.4 | 15.1 | ||||||
| Land development—residential |
57,084 | 5.5 | 61.4 | ||||||
| Commercial construction: |
|||||||||
| Hotel/motel |
196 | — | 0.2 | ||||||
| Retail |
4,639 | 0.4 | 5.0 | ||||||
| Office |
246 | — | 0.3 | ||||||
| Multifamily |
9,878 | 0.9 | 10.6 | ||||||
| Industrial and warehouse |
7,098 | 0.7 | 7.6 | ||||||
| Healthcare |
4,981 | 0.5 | 5.4 | ||||||
| Miscellaneous commercial |
1,765 | 0.2 | 1.9 | ||||||
| Total development commercial real estate loans |
189,208 | 18.2 | 203.4 | ||||||
| Existing and other commercial real estate loans |
|||||||||
| Secured by: |
|||||||||
| Hotel/motel |
105,428 | 10.1 | 113.4 | ||||||
| Retail |
31,369 | 3.0 | 33.7 | ||||||
| Office |
36,036 | 3.5 | 38.7 | ||||||
| Multifamily |
30,668 | 3.0 | 33.0 | ||||||
| Industrial and warehouse |
15,414 | 1.5 | 16.6 | ||||||
| Healthcare |
16,826 | 1.6 | 18.1 | ||||||
| Miscellaneous commercial |
133,655 | 12.8 | 143.7 | ||||||
| Residential construction—speculative |
7,184 | 0.7 | 7.7 | ||||||
| Total existing and other commercial real estate loans |
376,580 | 36.2 | 404.9 | ||||||
| Commercial real estate owner occupied and residential loans |
|||||||||
| Secured by: |
|||||||||
| Commercial—owner occupied |
120,402 | 11.6 | 129.4 | ||||||
| Commercial construction—owner occupied |
2,418 | 0.2 | 2.6 | ||||||
| Residential construction—contract |
6,655 | 0.6 | 7.2 | ||||||
| Total commercial real estate owner occupied and residential loans |
129,475 | 12.4 | 139.2 | ||||||
| Total loans secured by commercial real estate |
$ | 695,263 | 66.8 | % | 747.5 | % | |||
Geographic Concentration. As discussed in Item 1A. Risk Factors, unlike larger national or regional banks that are more geographically diversified, we primarily provide our services to customers within our market area. Deterioration in local economic conditions could result in declines in asset quality, loan collateral values, or the demand for our products and services, among other things.
Although our geographic concentration limits us to the economic risks within our market area, our lack of geographic diversification may make it particularly sensitive to adverse impacts of negative economic conditions that impact our market area.
58
Table of Contents
Maturities and Sensitivities of Loans to Changes in Interest Rates. The following table summarizes the Company’s total loan portfolio, including mortgage loans held for sale, by FDIC code, at December 31, 2009 that, based on contractual terms, were due during the periods noted. Loans having no stated maturity and no stated schedule of repayments are reported as due in one year or less. In addition, due to the fact that our equity lines of credit are mortgage loans intended to be long-term real estate consumer products, all such loans are reported as due after five years. The table also summarizes our loan portfolio at December 31, 2009 with regard to fixed-rate and variable-rate maturity or repricing terms due in periods after one year (in thousands).
| Maturity | Rate structure for loans with maturities or repricing terms over one year | ||||||||||||
| Due in one year or less |
Due after one year through five years |
Due after five years |
Total | Fixed-rate | Variable- rate | ||||||||
| Secured by real estate |
|||||||||||||
| Construction, land development, and other land loans |
$ | 148,864 | 46,506 | 10,095 | 205,465 | 56,601 | — | ||||||
| Farmland |
52 | 19 | 395 | 466 | 414 | — | |||||||
| Single-family residential |
63,864 | 43,394 | 99,956 | 207,214 | 110,685 | 32,665 | |||||||
| Multifamily residential |
24,807 | 4,391 | 1,470 | 30,668 | 5,861 | — | |||||||
| Nonfarm nonresidential |
148,586 | 269,746 | 40,798 | 459,130 | 310,544 | — | |||||||
| Commercial and industrial |
35,176 | 24,583 | 2,029 | 61,788 | 26,611 | — | |||||||
| Obligations of states and political subdivisions of the U.S. |
350 | 335 | 733 | 1,418 | 1,068 | — | |||||||
| General consumer |
7,265 | 41,392 | 8,924 | 57,581 | 50,317 | — | |||||||
| Credit line |
191 | 5,310 | — | 5,501 | 5,310 | — | |||||||
| Bankcards |
13,214 | — | — | 13,214 | — | — | |||||||
| Others |
1,331 | 420 | — | 1,751 | 420 | — | |||||||
| Total |
$ | 443,700 | 436,096 | 164,400 | 1,044,196 | 567,831 | 32,665 | ||||||
Asset Quality. As part of the credit quality plan, to continue to address the impact of the declining economic environment on our loan portfolio, we are focused on executing detailed loan workout plans for problem loans led by a team of seasoned commercial lenders and using external loan workout consulting expertise.
Given the negative credit quality trends which began in 2008 and accelerated during 2009, we performed an expanded internal loan review during the second quarter of 2009 which covered approximately 70% of our nonconsumer loan portfolio. This internal loan review process included written loan officer summaries for all nonconsumer loans individually greater than $500 thousand and vetting of these loans by the loan officers and our senior management team. During the second quarter of 2009, as confirmed by this enhanced internal loan review, we became increasingly aware that many of our borrowers were facing additional stress manifesting itself in the following ways:
| • | Cash flows from the underlying properties supporting the loans decreased, |
| • | Personal cash flows from the borrowers and guarantors were under pressure given illiquid personal balance sheets and drainage by the investment of additional personal capital into the related projects, and |
| • | Fair values of real estate related assets declining, resulting in lower cash proceeds from sales or fair values declining to the point that borrowers were no longer willing to sell the assets at such deep discounts. |
59
Table of Contents
We downgraded a portion of our loan portfolio during the second quarter due to both the negative trend in the general economic factors and the specific results of the enhanced internal loan review performed during the second quarter of 2009. Some of these loans had been originated within the past three years. Consistent with this increase in adversely classified loans, we also had an increase in nonperforming assets and impaired loans during the second quarter of 2009, particularly within the construction, acquisition and other land loan portion of our real estate loan portfolio. In July and August 2009, an independent loan review firm also reviewed approximately 35% of the nonconsumer loan portfolio.
We continually review our lending policies and procedures and credit administration function. To this end, during 2009 we implemented several enhancements as follows:
| • | Construction draws: In March we centralized the oversight and disbursement of construction draws to contractors working for borrowers, and in October we hired a construction draw manager to review advance requests before funds are advanced to borrowers. |
| • | Loan Policy: In June we reduced lending limit approval authorities, prohibited out-of-market loans to borrowers for which we do not have a previously existing relationship, and prohibited brokered loans. |
| • | Credit Administration: In July we hired a new Chief Credit Officer who brings over 25 years of credit administration, loan review, and credit policy experience to the Company, in August we reassigned two commercial lenders to credit analysts in the Credit Administration department, and in September we hired an additional senior Credit Administration executive. |
| • | Special Assets: In June we reassigned a senior Credit Administrator, in August and September we engaged two external workout consultants, in November we reassigned a commercial lender, and in December we reassigned a consumer lender. These internal personnel and external consultants are focused exclusively on accelerated resolution of our problem assets. |
All of these actions were taken to improve our credit risk management approach and accelerate the resolution of our credit quality issues.
Delinquent Loans. We determine past due and delinquent status based on contractual terms. When a borrower fails to make a scheduled loan payment, we attempt to cure the default through several methods including, but not limited to, collection contact and assessment of late fees. If these methods do not result in the borrower remitting the past due payment, further action may be taken. Interest on loans deemed past due continues to accrue until the loan is placed in nonaccrual status. We place loans in nonaccrual status prior to any amount being charged-off.
Nonperforming Assets. Nonaccrual loans are those loans that management has determined offer a more than normal risk of future uncollectibility. In most cases, loans are automatically placed in nonaccrual status by the loan system when the loan payment becomes 90 days delinquent and no acceptable arrangement has been made between us and the borrower. Loans may be manually placed in nonaccrual status on the loan system if management determines that some factor other than delinquency (such as bankruptcy proceedings) cause us to believe that more than a normal amount of risk exists with regard to collectability. When the loan is placed in nonaccrual status, accrued interest income is reversed based on the effective date of nonaccrual status. Thereafter, interest income on the nonaccrual loans is recognized only as received.
We classify nonaccrual loans as substandard or lower. When the probability of future collectability on a nonaccrual loan declines, we may take additional collection measures including commencing foreclosure action, if necessary. Specific steps must be taken when commencing foreclosure action on loans secured by real estate. Notice of default is required to be recorded and mailed. If the default is not cured within a specified time period, a notice of sale is posted, mailed, and advertised, and a sale is then conducted.
60
Table of Contents
The following table summarizes nonperforming assets, by FDIC code, at the dates indicated (dollars in thousands).
| December 31, | ||||||||||||||||||||
| 2009 | 2008 | 2007 | 2006 | 2005 | ||||||||||||||||
| Secured by real estate |
||||||||||||||||||||
| Construction, land development, and other land loans |
$ | 47,901 | $ | 15,409 | $ | 1,783 | $ | — | $ | — | ||||||||||
| Farmland |
50 | — | — | — | — | |||||||||||||||
| Single-family residential |
7,652 | 2,569 | 781 | 1,398 | 1,243 | |||||||||||||||
| Multifamily residential |
9,844 | 231 | — | — | — | |||||||||||||||
| Nonfarm nonresidential |
23,330 | 23,725 | 1,563 | 4,873 | 7,922 | |||||||||||||||
| Commercial and industrial |
7,475 | 763 | 567 | 549 | 631 | |||||||||||||||
| General consumer |
684 | 271 | 116 | 179 | 117 | |||||||||||||||
| Total nonaccrual loans |
96,936 | 42,968 | 4,810 | 6,999 | 9,913 | |||||||||||||||
| Real estate acquired in settlement of loans |
27,826 | 6,719 | 7,743 | 600 | 1,954 | |||||||||||||||
| Repossessed automobiles acquired in settlement of loans |
188 | 564 | 403 | 319 | 167 | |||||||||||||||
| Total foreclosed assets |
28,014 | 7,283 | 8,146 | 919 | 2,121 | |||||||||||||||
| Total nonperforming assets |
$ | 124,950 | $ | 50,251 | $ | 12,956 | $ | 7,918 | $ | 12,034 | ||||||||||
| Gross loans |
$ | 1,040,312 | $ | 1,158,480 | $ | 1,044,770 | $ | 945,913 | $ | 866,181 | ||||||||||
| Total assets |
1,435,950 | 1,372,275 | 1,248,177 | 1,153,136 | 1,075,015 | |||||||||||||||
| Nonaccrual loans as a percentage of: |
||||||||||||||||||||
| gross loans and foreclosed assets |
9.07 | % | 3.69 | % | 0.46 | % | 0.74 | % | 1.14 | % | ||||||||||
| total assets |
6.75 | 3.13 | 0.39 | 0.61 | 0.92 | |||||||||||||||
| Nonperforming assets as a percentage of: |
||||||||||||||||||||
| gross loans and foreclosed assets |
11.70 | % | 4.31 | % | 1.23 | % | 0.84 | % | 1.39 | % | ||||||||||
| total assets |
8.70 | 3.66 | 1.04 | 0.69 | 1.12 | |||||||||||||||
Loans placed in nonaccrual status during 2009 resulted from loans becoming delinquent on contractual payments due to deterioration in the financial condition of the borrowers or guarantors such that payment in full of principal or interest was not expected due to personal cash flows from the borrowers and guarantors inadequate to service the loans, interest reserves on the loans being depleted, a decrease in operating cash flows from the underlying properties supporting the loans, or a decline in fair values of the collateral resulting in lower cash proceeds from property sales.
Twenty-seven loans with a balance at December 31, 2009 greater than $1 million comprised approximately 65% of our nonaccrual loans at December 31, 2009. The following table summarizes the composition of these loans by collateral type (dollars in thousands).
| Total nonaccrual loans > $1 million |
% of total nonaccrual loans |
|||||
| Residential lots/golf course development |
$ | 31,277 | 32 | % | ||
| Multifamily residential |
8,195 | 8 | ||||
| Real estate for commercial use |
15,332 | 16 | ||||
| Marina |
2,790 | 3 | ||||
| Other business loans |
5,605 | 6 | ||||
| Total nonaccrual loans > $1 million secured by commercial real estate |
$ | 63,199 | 65 | % | ||
61
Table of Contents
Additionally, six of these loans (30% based on the principal balance at December 31, 2009) were purchased participations and ten of these loans (42% based on the principal balance at December 31, 2009) were out-of-market loans. In June 2009, we amended our loan policy to preclude originating any new loans of these kinds.
In the fourth quarter of 2009 we executed a contract with an investment banking firm to assist us with the sale, individually or in bulk, of a pool of nonaccrual commercial real estate loans aggregating $68.1 million. The pool of loans is being actively marketed with bids expected to be received by the end of February 2010.
Additional interest income of $5.9 million would have been reported during 2009 had loans classified as nonaccrual during the period performed in accordance with their original terms. As a result, our core operating earnings did not include this interest income. While a loan is in nonaccrual status, cash received is applied to the principal balance.
The following table summarizes the changes in the Real estate acquired in settlement of loans portfolio at the dates and for the periods indicated (in thousands). Real estate acquired in settlement of loans in the table above is net of participations sold of $10.2 million (5 properties) at December 31, 2009.
| At and for the years ended December 31, |
||||||||||||
| 2009 | 2008 | 2007 | ||||||||||
| Real estate acquired in settlement of loans, beginning of period |
$ | 6,719 | $ | 7,743 | $ | 600 | ||||||
| Add: New real estate acquired in settlement of loans at fair value |
24,628 | 2,778 | 10,030 | |||||||||
| Less: Sales of real estate acquired in settlement of loans |
(761 | ) | (3,634 | ) | (2,707 | ) | ||||||
| Less: Provision charged to expense |
(2,760 | ) | (168 | ) | (180 | ) | ||||||
| Real estate acquired in settlement of loans, end of period |
$ | 27,826 | $ | 6,719 | $ | 7,743 | ||||||
The following table summarizes the Real estate acquired in settlement of loans portfolio, by FDIC code, at December 31, 2009 (in thousands).
| Construction, land development, and other land loans |
$ | 6,660 | |
| Single-family residential |
1,783 | ||
| Nonfarm, nonresidential |
19,383 | ||
| Total real estate acquired in settlement of loans |
$ | 27,826 | |
Eight individual properties greater than $1 million comprised approximately 79% of our real estate acquired in settlement of loans portfolio at December 31, 2009. Of these properties, 35% were hotel properties, 7% were residential development properties, and 58% were retirement center properties. Additionally, 63% of these properties were participations. Six of the eight were the result of out-of-market loans.
These properties are being actively marketed with the primary objective of liquidating the collateral at a level which most accurately approximates fair value and allows recovery of as much of the unpaid principal balance as possible upon the sale of the property in a reasonable period of time. As a result, loan charge-offs were recorded prior to or upon foreclosure to writedown the loans to estimated fair value less estimated costs to sell. For some assets, additional writedowns have been taken based on receipt of updated third party appraisals for which appraised values continue to decline. Based on currently available valuation information, the carrying value of these assets is believed to be representative of their fair value less estimated costs to sell although there can be no assurance that the ultimate proceeds from the sale of these assets will be equal to or greater than the carrying values particularly in the current real estate environment and the continued downward trend in third party appraised values.
62
Table of Contents
In the fourth quarter of 2009, we sold at auction 14 assets from our real estate acquired in settlement of loans portfolio with an aggregate net carrying amount of $165 thousand at a loss of $5 thousand.
Of the balance at December 31, 2009:
| • | In February 2010, we sold one property with a carrying amount of $1.7 million at a gain. |
| • | Two assets with an aggregate net carrying amount of $5.6 million are under contract for sale with closing dates in the first quarter of 2010. |
| • | In February 2010, letters of intent were received on 2 properties with an aggregate carrying value totaling $3.8 million that, if consummated, are expected to close in the second quarter of 2010. |
| • | We have scheduled for bulk sale by auction in March 2010, 13 properties with an aggregate net carrying amount of $506 thousand. |
We are actively addressing the issue of our increase in nonperforming assets and will continue to be aggressive in working to resolve these issues as quickly as possible. We have hired several third party consultants to assist with the workout of problem assets. For problem assets identified, we prepared written workout plans that are borrower specific to determine how best to resolve the loans which could include restructuring the loans, requesting additional collateral, demanding payment from guarantors, sale of the loans, or foreclosure and sale of the collateral. However, given the nature of the projects related to such loans and the distressed values within the real estate market, immediate resolution in all cases is not expected. Therefore, it is reasonable to expect that current negative asset quality trends may continue for coming periods when compared to historical periods. As necessary, carrying values of these assets may require additional adjustment for further declines in estimated fair values.
Troubled Debt Restructurings. Troubled debt restructurings are loans which have been restructured from their original contractual terms (for example, reduction in contractual interest rate). As part of the determination of our individual loan workout plans, we may restructure loans to assist borrowers facing cash flow challenges in the current economic environment to facilitate ultimate repayment of the loan. At December 31, 2009 and December 31, 2008, the principal balance of troubled debt restructurings totaled $14.6 million and $1.2 million, respectively. Four individual loans greater than $1 million comprised approximately 49% of our troubled debt restructurings at December 31, 2009. Three of the loans experienced rate concessions while one of the loans experienced rate and term concessions. All are performing as expected under the new terms.
A troubled debt restructuring can be removed from such status once there is sufficient history, generally six months, of demonstrating the borrower can service the credit under market terms.
Potential Problem Loans. Potential problem loans consist of loans that are generally performing in accordance with contractual terms but for which we have concerns about the ability of the borrower to continue to comply with repayment terms because of the borrower’s potential operating or financial difficulties. Management monitors these loans closely and reviews performance on a regular basis. As of December 31, 2009, potential problem loans that were not already categorized as nonaccrual totaled $93.1 million.
Allowance for Loan Losses. The allowance for loan losses represents an amount that we believe will be adequate to absorb probable losses as of a specific period of time inherent in our loan portfolio. Assessing the adequacy of the allowance for loan losses is a process that requires considerable judgment. Our judgment in determining the adequacy of the allowance is based on evaluations of the collectability of loans, including consideration of factors such as the balance of impaired loans, the quality, mix, and size of our overall loan portfolio, economic conditions that may impact the overall loan portfolio or an individual borrower’s ability to repay, the amount and quality of collateral securing the loans, our historical loan loss experience, and borrower and collateral specific considerations for loans individually evaluated for impairment.
63
Table of Contents
Our allowance for loan losses totaled $24.1 million at December 31, 2009 compared with $11.0 million at December 31, 2008, representing 2.31% and 0.95% of gross loans, respectively. The December 31, 2009 allowance for loan losses, and, therefore indirectly the provision for loan losses for the year ended December 31, 2009, was determined based on the following specific factors, though not intended to be an all inclusive list:
| • | The impact of the ongoing depressed overall economic environment, including those within our geographic market, |
| • | The cumulative impact of the extended duration of this economic deterioration on our borrowers, in particular those with real estate related loans, |
| • | The declining asset quality trends in our loan portfolio, |
| • | The increasing trend in the historical loan loss rates within our loan portfolio, |
| • | The results of our internal and independent loan reviews during the second and third quarters of 2009 resulting in loan downgrades, |
| • | Our individual impaired loan analysis which identified: |
| • | Increased stress on borrowers given increasing lack of liquidity and limited bank financing and credit availability, and |
| • | Continued downward trends in appraised values and market assumptions used to value real estate dependent loans. |
64
Table of Contents
The following table summarizes activity within our allowance for loan losses, by FDIC code, at the dates and for the periods indicated (dollars in thousands). Loans charged-off and recovered are charged or credited to the allowance for loan losses at the time realized.
| At and for the years ended December 31, | ||||||||||||||||||||
| 2009 | 2008 | 2007 | 2006 | 2005 | ||||||||||||||||
| Allowance for loan losses, beginning of period |
$ | 11,000 | $ | 7,418 | $ | 8,527 | $ | 8,431 | $ | 7,619 | ||||||||||
| Provision for loan losses |
73,400 | 5,619 | 988 | 1,625 | 2,400 | |||||||||||||||
| Loans charged-off |
||||||||||||||||||||
| Secured by real estate |
||||||||||||||||||||
| Construction, land development, and other land loans |
33,873 | 16 | — | — | — | |||||||||||||||
| Farmland |
— | — | — | — | — | |||||||||||||||
| Single-family residential |
4,060 | 367 | 371 | 247 | 415 | |||||||||||||||
| Multifamily residential |
5,096 | — | — | — | 1 | |||||||||||||||
| Nonfarm nonresidential |
10,784 | 182 | 496 | 191 | 241 | |||||||||||||||
| Commercial and industrial |
4,945 | 430 | 505 | 453 | 244 | |||||||||||||||
| General consumer and other |
2,033 | 1,174 | 991 | 791 | 891 | |||||||||||||||
| Total loans charged-off |
60,791 | 2,169 | 2,363 | 1,682 | 1,792 | |||||||||||||||
| Recoveries |
||||||||||||||||||||
| Secured by real estate |
||||||||||||||||||||
| Construction, land development, and other land loans |
32 | — | — | — | — | |||||||||||||||
| Farmland |
— | — | — | — | — | |||||||||||||||
| Single-family residential |
5 | 11 | 39 | 15 | — | |||||||||||||||
| Multifamily residential |
— | — | — | — | — | |||||||||||||||
| Nonfarm nonresidential |
79 | 9 | 13 | 6 | 35 | |||||||||||||||
| Commercial and industrial |
88 | 18 | 54 | 37 | 35 | |||||||||||||||
| General consumer and other |
266 | 94 | 160 | 95 | 134 | |||||||||||||||
| Total recoveries |
470 | 132 | 266 | 153 | 204 | |||||||||||||||
| Net loans charged-off |
60,321 | 2,037 | 2,097 | 1,529 | 1,588 | |||||||||||||||
| Allowance for loan losses, end of period |
$ | 24,079 | $ | 11,000 | $ | 7,418 | $ | 8,527 | $ | 8,431 | ||||||||||
| Average gross loans |
$ | 1,124,599 | $ | 1,107,007 | $ | 986,518 | $ | 895,062 | $ | 828,545 | ||||||||||
| Ending gross loans |
1,040,312 | 1,158,480 | 1,044,770 | 945,913 | 866,181 | |||||||||||||||
| Nonaccrual loans |
96,936 | 42,968 | 4,810 | 6,999 | 9,913 | |||||||||||||||
| Net loans charged-offs as a percentage of average gross loans |
5.36 | % | 0.18 | % | 0.21 | % | 0.17 | % | 0.19 | % | ||||||||||
| Allowance for loan losses as a percentage of ending gross loans |
2.31 | 0.95 | 0.71 | 0.90 | 0.97 | |||||||||||||||
| Allowance for loan losses as a percentage of nonaccrual loans |
24.84 | 25.60 | 154.22 | 121.83 | 85.05 | |||||||||||||||
In addition to loans charged-off in the ordinary course of business, included within loans charged-off for the year ended December 31, 2009 were $54.5 million relating to loans individually evaluated for impairment. The determination was made to take partial charge-offs on certain collateral dependent loans during 2009 based on the status of the underlying real estate projects or our expectation that these loans would be foreclosed on, and we would take possession of the collateral. The loan charge-offs primarily related to construction, acquisition, and development real estate projects that are not complete and will require additional investment to be completed. Additionally, the loan charge-offs were recorded to writedown the loans to the fair value of the collateral less
65
Table of Contents
estimated costs to sell generally based on fair values from third party appraisals. We do not split loans with partial charge-offs into two legally separate loans. Accordingly, loans with partial charge-offs remain on nonaccrual status.
We analyze individual loans within the portfolio and make allocations to the allowance for loan losses based on each individual loan’s specific factors and other circumstances that impact the collectability of the loan. The population of loans evaluated to be potential impaired loans includes all troubled debt restructures and specifically identified loans with interest reserves, as well as significant individual loans classified as doubtful or in nonaccrual status. At December 31, 2009, we had two loans totaling $7.4 million with interest reserves that, based on our analysis, were considered impaired. One of these loans in the amount of $2.8 million was also a troubled debt restructuring.
In situations where a loan is determined to be impaired (primarily because it is probable that all principal and interest due according to the terms of the loan agreement will not be collected as scheduled), the loan is excluded from the general reserve calculation described below and is evaluated individually for impairment. The impairment analysis is based on the determination of the most probable source of repayment which is typically liquidation of the underlying collateral, but may also include discounted future cash flows or, in rare cases, the market value of the loan itself. At December 31, 2009, $94.4 million of our loans evaluated individually for impairment were valued based on collateral while $2.4 million were valued based on discounted future cash flows.
Generally, for larger collateral dependent impaired loans, current appraisals performed by Company approved third-party appraisers are the basis for estimating the current fair value of the collateral. However, in situations where a current appraisal is not available, management uses the best available information (including recent appraisals for similar properties, communications with qualified real estate professionals, information contained in reputable trade publications, and other observable market data) to estimate the current fair value. The estimated costs to sell the property, if not already included in the appraisal, are then deducted from the appraised value to arrive at the net realizable value of the loan used to calculate the loan’s specific reserve. At December 31, 2009, 88% of our collateral dependent loan valuations were based on third party appraisals received in 2009.
During 2009, we identified additional loans to be reviewed individually for impairment driven primarily by the deterioration in the real estate market in South Carolina. During this time period, we began to experience increased delinquencies as real estate project and borrower personal cash reserves became increasingly strained and the underlying projects began to slow significantly. At the same time, market appraisal assumptions were declining and, therefore, fair values were rapidly revised downward. These factors contributed to the increase in impaired loans reviewed individually for impairment and the charge-offs related to such loans during 2009.
The following table summarizes the composition of impaired loans, by FDIC code, at December 31, 2009 (in thousands).
| Secured by real estate |
|||
| Construction, land development, and other land loans |
$ | 54,501 | |
| Farmland |
— | ||
| Single-family residential |
4,829 | ||
| Multifamily residential |
11,303 | ||
| Nonfarm nonresidential |
19,494 | ||
| Commercial and industrial |
6,709 | ||
| Total impaired loans |
$ | 96,836 | |
66
Table of Contents
The following table summarizes information relative to impaired loans at the dates and for the periods indicated (in thousands).
| At and for the years ended December 31, | ||||||
| 2009 | 2008 | |||||
| Impaired loans for which there is a related allowance for loan losses determined in accordance with FASB ASC 310 |
$ | 11,253 | $ | 21,413 | ||
| Other impaired loans |
85,583 | 16,055 | ||||
| Total impaired loans |
$ | 96,836 | $ | 37,468 | ||
| Average impaired loans, based on a simple average of quarter-end balances |
$ | 82,471 | $ | 22,568 | ||
| Related allowance for loan losses |
5,250 | 4,453 | ||||
We calculate our general allowance by applying our historical loss factors to each sector of the loan portfolio and adjusting these percentages for qualitative environmental factors derived from macroeconomic indicators and other factors. The general reserve is then combined with the specific allowance to determine the total allowance for loan losses. Qualitative factors we considered in the determination of the December 31, 2009 allowance for loan losses include pervasive factors that generally impact borrowers across the loan portfolio (such as unemployment and consumer price index) and factors that have specific implications to particular loan portfolios (such as residential home sales or commercial development). Factors evaluated may include changes in delinquent, nonaccrual and troubled debt restructured loan trends, trends in risk grades and net loans charged-off, concentrations of credit, competition and legal and regulatory requirements, trends in the nature and volume of the loan portfolio, national and local economic and business conditions, collateral valuations, the experience and depth of lending management, lending policies and procedures, underwriting standards and practices, the quality of loan review systems and degree of oversight by the Board of Directors, peer comparisons, and other external factors.
The following table summarizes the allocation of the allowance for loan losses at the dates indicated (in thousands).
| December 31, | ||||||
| 2009 | 2008 | |||||
| Allowance for loan losses allocated to |
||||||
| Homogenous loan pools |
$ | 18,829 | $ | 6,148 | ||
| Loan individually analyzed for impairment |
5,250 | 4,453 | ||||
| Unallocated |
— | 399 | ||||
| Allowance for loan losses |
$ | 24,079 | $ | 11,000 | ||
The shift in the allocation of the allowance for loan losses from 0.95% to 2.31% of gross loans from December 31, 2008 to December 31, 2009 is due the deterioration in the credit quality of our loan portfolio as previously described including the impact of the current economic environment. Since we charged-off a large portion of the impairments on loans individually analyzed for impairment, the increase in the total allowance for loan losses was in the component of the allowance attributable to the homogeneous loan pools.
67
Table of Contents
The following table summarizes the allocation of the allowance for loan losses at December 31, 2009, by FDIC code (dollars in thousands).
| Allowance allocation |
Allowance allocation |
% of loans to gross loans |
|||||||
| Secured by real estate |
|||||||||
| Construction, land development, and other land loans |
$ | 7,397 | 30.7 | % | 19.8 | % | |||
| Farmland |
1 | — | — | ||||||
| Single-family residential |
3,683 | 15.3 | 19.6 | ||||||
| Multifamily residential |
609 | 2.5 | 3.0 | ||||||
| Nonfarm nonresidential |
5,363 | 22.3 | 44.1 | ||||||
| Commercial and industrial |
4,853 | 20.2 | 5.9 | ||||||
| Obligations of states and political subdivisions of the U.S. |
— | — | 0.1 | ||||||
| General consumer |
1,216 | 5.0 | 5.5 | ||||||
| Credit line |
277 | 1.2 | 0.5 | ||||||
| Bankcards |
680 | 2.8 | 1.3 | ||||||
| Others |
— | — | 0.2 | ||||||
| Total |
$ | 24,079 | 100.0 | % | 100.0 | % | |||
Portions of the allowance for loan losses may be allocated for specific loans or portfolio segments. However, the entire allowance for loan losses is available for any loan that, in management’s judgment, should be charged-off. While management utilizes the best judgment and information available to it, the ultimate adequacy of the allowance for loan losses depends on a variety of factors beyond the Company’s control, including the performance of the Company’s loan portfolio, the economy, changes in interest rates, and the view of the regulatory authorities toward loan classifications.
In addition to the Company’s portfolio review process, various regulatory agencies periodically review the Company’s allowance for loan losses. These agencies may require the Company to recognize additions to the allowance for loan losses based on their judgments and information available to them at the time of their examinations. While the Company uses available information to recognize inherent losses on loans, future adjustments to the allowance for loan losses may be necessary based on changes in economic conditions and other factors and the impact of such changes and other factors on our borrowers.
Management believes that the allowance for loan losses at December 31, 2009 is appropriate and adequate to cover probable inherent losses in the loan portfolio. However, underlying assumptions may be impacted in future periods by changes in economic conditions, the impact of regulatory examinations, and the discovery of information with respect to borrowers, which was not known to management at the time of the issuance of the Company’s Consolidated Financial Statements. Therefore, management’s assumptions may or may not prove valid. Thus, there can be no assurance that loan losses in future periods will not exceed the current allowance for loan losses amount or that future increases in the allowance for loan losses will not be required. Additionally, no assurance can be given that management’s ongoing evaluation of the loan portfolio, in light of changing economic conditions and other relevant factors, will not require significant future additions to the allowance for loan losses, thus adversely impacting the Company’s business, financial condition, results of operations, and cash flows.
Deposit Activities
Traditional deposit accounts have historically been the primary source of funds for the Company and a competitive strength of our Company. Traditional deposit accounts also provide a customer base for the sale of additional financial products and services and fee income through service charges. We set targets for growth in deposit accounts annually in an effort to increase the number of products per banking relationship. Deposits are attractive sources of funding because of their stability and generally low cost as compared with other funding sources.
68
Table of Contents
The following table summarizes our traditional deposit composition at the dates indicated (dollars in thousands).
| December 31, | ||||||||||||||||||||||||||||||
| 2009 | 2008 | 2007 | 2006 | 2005 | ||||||||||||||||||||||||||
| Total | % of total |
Total | % of total |
Total | % of total |
Total | % of total |
Total | % of total |
|||||||||||||||||||||
| Noninterest-bearing transaction deposit accounts |
$ | 142,609 | 11.7 | % | $ | 134,465 | 12.6 | % | $ | 135,920 | 12.8 | % | $ | 134,229 | 13.5 | % | $ | 131,854 | 14.6 | % | ||||||||||
| Interest-bearing transaction deposit accounts |
307,258 | 25.3 | 364,315 | 34.0 | 387,248 | 36.6 | 313,613 | 31.5 | 220,472 | 24.4 | ||||||||||||||||||||
| Transaction deposit accounts |
449,867 | 37.0 | 498,780 | 46.6 | 523,168 | 49.4 | 447,842 | 45.0 | 352,326 | 39.0 | ||||||||||||||||||||
| Money market deposit accounts |
119,082 | 9.8 | 93,746 | 8.7 | 118,681 | 11.2 | 124,874 | 12.6 | 111,380 | 12.3 | ||||||||||||||||||||
| Savings deposit accounts |
40,335 | 3.3 | 36,623 | 3.4 | 34,895 | 3.3 | 41,887 | 4.2 | 45,360 | 5.0 | ||||||||||||||||||||
| Time deposit accounts |
605,630 | 49.9 | 442,347 | 41.3 | 382,859 | 36.1 | 379,584 | 38.2 | 395,014 | 43.7 | ||||||||||||||||||||
| Total traditional deposit accounts |
$ | 1,214,914 | 100.0 | % | $ | 1,071,496 | 100.0 | % | $ | 1,059,603 | 100.0 | % | $ | 994,187 | 100.0 | % | $ | 904,080 | 100.0 | % | ||||||||||
At December 31, 2009, traditional deposit accounts as a percentage of liabilities were 89.3% compared with 85.3% at December 31, 2008. Interest-bearing deposits increased approximately $135.3 million during the year ended December 31, 2009, primarily due to time deposit accounts. This increase was offset by a decrease in interest-bearing transaction accounts. The increase in time deposit accounts during 2009 was primarily the result of certificate of deposit promotions intended to increase liquidity. Traditional deposit accounts continue to be our primary source of funding, and, as part of our liquidity plan, we are proactively pursuing deposit retention initiatives with our deposit customers. We are also pursuing strategies to increase our transaction deposit accounts as a proportion of our total deposits. As a result of being adequately-capitalized at December 31, 2009, we are restricted by the FDIC from offering an effective yield of more than 75 basis points over the national rates published by the FDIC on their website on a weekly basis.
During the fourth quarter of 2009, we conducted targeted deposit growth and retention campaigns related to maturing certificates of deposits and to attract new deposits such as deposits from health savings accounts. These certificate of deposit campaigns resulted in retaining $25.8 million of balances already in the Bank and generating new deposits of $5.3 million. We are currently conducting similar campaigns in the first quarter of 2010 related to maturing certificates of deposit and to generate new deposits in products such as individual retirement accounts. The certificate of deposit (“CD”) campaigns include CDs with various maturities ranging from 6 months to 60 months, as well as 20 month and 36 month step-up CDs that allows holders to reset their interest rate once and up to three times, respectively, over the life of the CD. Through February 25, 2010, these campaigns resulted in the retention of existing CDs and generation of new CDs totaling approximately $122 million. However, due primarily to maturing CDs that we were unable to retain, through February 25, 2010, total traditional deposit accounts, and as a result our cash reserves, decreased approximately $85 million from December 31, 2009. In general, CD runoff was expected as part of our balance sheet management efforts to attract and retain lower priced transaction deposit accounts rather than paying higher rates on CDs.
69
Table of Contents
The table set forth below summarizes the average balances of interest-bearing traditional deposit accounts by type and the weighted average rates paid thereon for the periods indicated (dollars in thousands).
| For the years ended December 31, | |||||||||||||||||||||||||||
| 2009 | 2008 | 2007 | |||||||||||||||||||||||||
| Average balance |
Interest expense |
Weighted average rate paid |
Average balance |
Interest expense |
Weighted average rate paid |
Average balance |
Interest expense |
Weighted average rate paid |
|||||||||||||||||||
| Transaction deposit accounts |
$ | 323,613 | $ | 526 | 0.16 | % | $ | 374,382 | $ | 4,966 | 1.33 | % | $ | 358,118 | $ | 10,152 | 2.83 | % | |||||||||
| Money market deposit accounts |
108,566 | 602 | 0.55 | 105,834 | 1,922 | 1.82 | 115,563 | 3,977 | 3.44 | ||||||||||||||||||
| Savings deposit accounts |
40,871 | 132 | 0.32 | 37,692 | 129 | 0.34 | 40,184 | 139 | 0.35 | ||||||||||||||||||
| Time deposit accounts |
578,026 | 18,251 | 3.16 | 400,516 | 16,677 | 4.16 | 360,025 | 15,964 | 4.43 | ||||||||||||||||||
| Total interest-bearing traditional deposit accounts |
$ | 1,051,076 | $ | 19,511 | 1.86 | % | $ | 918,424 | $ | 23,694 | 2.58 | % | $ | 873,890 | $ | 30,232 | 3.46 | % | |||||||||
Jumbo Time Deposit Accounts. Jumbo time deposit accounts are accounts with balances totaling $100,000 or greater at the date indicated. Jumbo time deposit accounts totaled 21.8% of total interest-bearing liabilities at December 31, 2009. The following table summarizes our jumbo time deposit accounts by maturity at December 31, 2009 (in thousands).
| Three months or less |
$ | 138,672 | |
| Over three months through six months |
29,136 | ||
| Over six months through twelve months |
38,333 | ||
| Twelve months or less |
206,141 | ||
| Over twelve months |
57,523 | ||
| Total jumbo time deposit accounts |
$ | 263,664 | |
Jumbo time deposit accounts totaled $180.1 million at December 31, 2008. Management believes the increase in FDIC insurance for deposited funds, the volatility in the financial stock markets, and targeted promotions contributed to the increase in jumbo time deposit accounts from December 31, 2008 to December 31, 2009.
In October 2008, the EESA was enacted. Among other things, the EESA increased FDIC deposit insurance on most accounts from $100,000 to $250,000. This increase was originally to be in place until the end of 2009. In May 2009, this increased coverage was extended through December 31, 2013. In addition, we are voluntarily participating in the FDIC’s TAGP. Under this program, which in August 2009 was extended through June 30, 2010, all noninterest-bearing transaction accounts are fully guaranteed by the FDIC for the entire amount of the account. Coverage under the program is in addition to and separate from the basic coverage available under the FDIC’s general deposit insurance rules. We believe participation in the program will enhance our ability to retain customer deposits.
Borrowing Activities
During the year ended December 31, 2009, liquidity management was a priority. Borrowings as a percentage of total liabilities decreased from 14.0% at December 31, 2008 to 10.0% at December 31, 2009. The decrease was due to less reliance being placed on such borrowed funding sources as liquidity was provided through growth experienced in traditional deposit accounts during the period and cash retention of proceeds from loan payments and maturing securities.
70
Table of Contents
The following table summarizes our borrowings composition at the dates indicated (dollars in thousands).
| December 31, 2009 | December 31, 2008 | |||||||||||
| Total | % of total |
Total | % of total |
|||||||||
| Retail repurchase agreements |
$ | 15,545 | 11.5 | % | $ | 16,357 | 9.3 | % | ||||
| Commercial paper |
19,061 | 14.0 | 27,955 | 15.9 | ||||||||
| Total nontraditional deposit accounts |
34,606 | 25.5 | 44,312 | 25.2 | ||||||||
| Other short-term borrowings |
— | — | 79,785 | 45.3 | ||||||||
| Long-term borrowings |
101,000 | 74.5 | 52,000 | 29.5 | ||||||||
| Total wholesale funding |
101,000 | 74.5 | 131,785 | 74.8 | ||||||||
| Total borrowed funds |
$ | 135,606 | 100.0 | % | $ | 176,097 | 100.0 | % | ||||
The following table provides further detail with respect to our borrowings composition at the dates and for the periods indicated (dollars in thousands).
| At and for the years ended December 31, |
||||||||||||
| 2009 | 2008 | 2007 | ||||||||||
| Retail repurchase agreements |
||||||||||||
| Amount outstanding at year-end |
$ | 15,545 | $ | 16,357 | $ | 11,280 | ||||||
| Average amount outstanding during year |
23,227 | 18,063 | 13,347 | |||||||||
| Maximum amount outstanding at any month-end |
29,461 | 21,817 | 13,772 | |||||||||
| Rate paid at year-end * |
0.25 | % | 0.25 | % | 2.63 | % | ||||||
| Weighted average rate paid during the year |
0.25 | 1.37 | 4.04 | |||||||||
| Commercial paper |
||||||||||||
| Amount outstanding at year-end |
$ | 19,061 | $ | 27,955 | $ | 26,326 | ||||||
| Average amount outstanding during year |
24,085 | 32,415 | 27,295 | |||||||||
| Maximum amount outstanding at any month-end |
27,041 | 37,487 | 32,667 | |||||||||
| Rate paid at year-end * |
0.25 | % | 0.25 | % | 2.81 | % | ||||||
| Weighted average rate paid during the year |
0.25 | 1.11 | 4.07 | |||||||||
| Other short-term borrowings—federal funds purchased from correspondent banks |
||||||||||||
| Amount outstanding at year-end |
$ | — | $ | 35,785 | $ | 18,000 | ||||||
| Average amount outstanding during year |
5,335 | 13,240 | 3,610 | |||||||||
| Maximum amount outstanding at any month-end |
17,295 | 38,171 | 18,000 | |||||||||
| Rate paid at year-end |
— | % | 0.68 | % | 4.32 | % | ||||||
| Weighted average rate paid during the year |
0.61 | 2.27 | 5.50 | |||||||||
| Other short-term borrowings—FHLB |
||||||||||||
| Amount outstanding at year-end |
$ | — | $ | 44,000 | $ | 12,000 | ||||||
| Average amount outstanding during year |
10,112 | 35,303 | 9,426 | |||||||||
| Maximum amount outstanding at any month-end |
69,000 | 59,000 | 24,000 | |||||||||
| Rate paid at year-end |
— | % | 0.46 | % | 4.56 | % | ||||||
| Weighted average rate paid during the year |
0.57 | 2.29 | 5.36 | |||||||||
| Long-term borrowings—FHLB |
||||||||||||
| Amount outstanding at year-end |
$ | 101,000 | $ | 52,000 | $ | — | ||||||
| Average amount outstanding during year |
68,054 | 41,415 | 4,521 | |||||||||
| Maximum amount outstanding at any month-end |
101,000 | 52,000 | 10,000 | |||||||||
| Rate paid at year-end |
2.01 | % | 2.90 | % | — | % | ||||||
| Weighted average rate paid during the year |
2.53 | 2.89 | 3.83 | |||||||||
| * | Rates paid are tiered based on level of deposit. Rate presented represents the average rate for all tiers offered at year-end. |
71
Table of Contents
Retail Repurchase Agreements. We offer retail repurchase agreements as an alternative investment tool to conventional savings deposits. The investor buys an interest in a pool of U.S. government or agency securities. Funds are swept daily between the customer and the Bank. Retail repurchase agreements are securities transactions, not insured deposits.
Commercial Paper. We offer commercial paper as an alternative investment tool for our commercial customers. Through a master note arrangement between the Company and the Bank, Palmetto Master Notes are issued as an alternative investment for commercial sweep accounts. These master notes are unsecured but are backed by the full faith and credit of the Company. The commercial paper is issued only in conjunction with deposits in the Bank’s automated sweep accounts. While they have not indicated any plans to do, the Federal Reserve, as regulator for the Company, could require that we discontinue this program.
Wholesale Funding. Wholesale funding options include federal funds lines from correspondent banks and FHLB advances. Such funding provides us with the ability to access the type of funding needed at the time and amount needed at market rates. This provides us with the flexibility to tailor borrowings to our specific needs. Wholesale funding utilization may be categorized as either other short-term borrowings or long-term borrowings depending on maturity terms. Wholesale short-term borrowings are those having maturities less than one year when executed. Long-term borrowings are those having maturities greater than one year when executed. Interest rates on such borrowings vary from time to time in response to general economic conditions.
FHLB Borrowings. As disclosed in Investment Activities and Lending Activities, we pledge investment securities and loans to collateralize FHLB advances and letters of credit. In order to compute lendable collateral amounts, the market value of pledged securities and loans balances is reduced by a 10% collateral discount factor. This amount is then adjusted by the institution assigned collateral maintenance level factor. Among other things, the collateral maintenance level factor takes into account our collateral credit score determined by the FHLB. During the second quarter of 2009, in recognition of the continuing decrease in the market value of residential mortgages, specifically single-family residential loan collateral and home equity lines of credit, the FHLB revised its collateral value percentages to reflect the overall decline in market values of mortgage loans and ongoing volatility in the mortgage and credit markets. The FHLB has pledged that it will continue to evaluate collateral discount percentages in relation to current market values of various categories of mortgages and home equity lines of credit. In addition, beginning in the second quarter of 2009, the FHLB required additional reporting related to residential single-family collateral securing advances and letters of credit. Our system generated report did not contain all of the necessary information. Accordingly, we were assessed an additional 10% collateral discount on this particular type of collateral. The additional 10% collateral discount does not apply to our home equity lines of credit portfolio. At December 31, 2009 and 2008, our collateral maintenance factors from the FHLB were 125% and 100%, respectively. Cash and cash equivalents, if pledged as collateral, are not subject to the 125% collateralization maintenance level. In January 2010, we were notified by the FHLB that it will not allow additional borrowings until our financial condition improves.
The following table summarizes FHLB borrowed funds utilization and availability at the dates indicated (in thousands).
| December 31, | ||||||||
| 2009 | 2008 | |||||||
| Available lendable loan collateral value to serve against FHLB advances and letters of credit |
$ | 162,014 | $ | 159,060 | ||||
| Available lendable investment security collateral value to serve against FHLB advances and letters of credit |
26,791 | 37,481 | ||||||
| Advances and letters of credit |
||||||||
| Short-term advances |
$ | — | $ | (44,000 | ) | |||
| Long-term advances |
(101,000 | ) | (52,000 | ) | ||||
| Letters of credit |
(50,000 | ) | (69,000 | ) | ||||
| Available lendable collateral value to serve against FHLB advances and letters of credit |
$ | 55 | $ | 31,541 | ||||
72
Table of Contents
The following table summarizes long-term FHLB borrowings at December 31, 2009 (dollars in thousands). Our long-term FHLB advances do not have embedded call options.
| Total | ||||||||||||||||||||||||||||
| Borrowing balance |
$ | 5,000 | $ | 12,000 | $ | 19,000 | $ | 30,000 | $ | 30,000 | $ | 5,000 | $ | 101,000 | ||||||||||||||
| Interest rate |
2.57 | % | 2.75 | % | 0.63 | % | 1.34 | % | 2.89 | % | 3.61 | % | 2.01 | % | ||||||||||||||
| Maturity date |
3/8/2010 | 4/2/2010 | 1/7/2011 | 1/18/2011 | 3/7/2011 | 4/2/2013 | ||||||||||||||||||||||
The increase in long-term FHLB borrowings during the year ended December 31, 2009 was due to the following additional borrowings during 2009:
| • | $30 million that matures on January 18, 2011 at a fixed rate of 1.34%. |
| • | $19 million that matures on January 7, 2011 at a fixed rate of 0.63%. |
The FHLB may assess fees and charges to cover costs relating to the receipt, holding, redelivery, and reassignment of our collateral. The FHLB publishes a schedule of these fees and charges on its website. In addition, the FHLB may assess fees to cover collateral verification reviews performed by, or on behalf of, the FHLB. Historically, any such fees have not been significant.
Any FHLB advance with a fixed interest rate is subject to a prepayment fee in the event of full or partial repayment prior to maturity or the expiration of any interim interest rate period. Historically, we have not made full or partial repayment prior to maturity or the expiration of any interim interest rate period.
Federal Reserve Discount Window. As disclosed in Lending Activities, during the second quarter of 2009, we established a borrowing relationship with the Federal Reserve through its Discount Window. Through the Discount Window, primary credit is available to generally sound depository institutions on a very short-term basis, typically overnight, at a rate above the Federal Open Market Committee target rate for federal funds. All extensions of credit must be secured to the satisfaction of the lending Federal Reserve by collateral that is acceptable for that purpose. Most performing or investment grade assets held by depository institutions are acceptable as collateral. In order to compute lendable collateral amounts, pledged loan unpaid principal balances are reduced by the applicable collateral discount margin. The financial condition of an institution may be considered when assigning values.
As of December 31, 2009, our borrowings capacity at the Federal Reserve was secured by a blanket lien on a portion of our commercial and consumer loan portfolios. Of the $108.8 million of loans pledged at December 31, 2009, $61.2 million was available as lendable collateral. We had no outstanding borrowings from the Federal Reserve at December 31, 2009. On October 19, 2009, the Federal Reserve implemented its planned changes to the collateral margins for Discount Window borrowings. The amount of borrowing capacity is calculated by the Federal Reserve’s internally modeled fair value estimate calculations based on the loan collateral filings that are submitted by the Company. While it has not expressed any intention to do so, because we are no longer well-capitalized our ability to borrow funds from the Discount Window could be restricted by the Federal Reserve, which has broad discretion in regulating such borrowings.
Federal Funds Accommodations. At December 31, 2009, we had access to federal funds funding from a correspondent bank. During the year ended December 31, 2009, four correspondent banks canceled unused existing federal funds accommodations for a total of $47.5 million, and another correspondent bank decreased existing federal funds accommodation by $15.0 million. We had not used these lines of credit and had no plans to do so.
73
Table of Contents
Our remaining federal funds accommodation line is secured by U.S. Treasury and federal agencies securities. The following table summarizes our federal funds funding utilization and availability at the dates indicated (in thousands).
| December 31, | |||||||
| 2009 | 2008 | ||||||
| Authorized federal funds funding accomodations |
$ | 5,000 | $ | 67,500 | |||
| Utilized federal funds funding accomodations |
— | (35,785 | ) | ||||
| Available federal funds funding accomodations |
$ | 5,000 | $ | 31,715 | |||
This federal funds funding source may be canceled at any time at the correspondent bank’s discretion.
Capital
At December 31, 2009, our Tier 1 leverage ratio and Tier 1 risk-based capital ratios were above the well-capitalized regulatory minimum threshold of 5% and 6%, respectively. Our total risk-based capital ratio, however, was 8.25%, which is below the well-capitalized regulatory minimum threshold of 10%. To preserve our capital, we did not pay a dividend on our common stock during the second, third, or fourth quarters of 2009. As another means of preserving capital, we have reduced our loan portfolio by $118.2 million since December 31, 2008. We have also evaluated other capital saving alternatives such as asset sales and reducing outstanding credit commitments.
Based on discussions with the FDIC following its most recent safety and soundness examination of the Bank in November 2009, the Bank presently expects to receive a written agreement from the FDIC some time in 2010 which could require the Bank to take certain actions to address concerns raised in the examination. If the Bank were to receive a written agreement and if the Bank were to fail to comply with the requirements in such written agreement, it may be subject to further regulatory action.
To raise additional capital, we have engaged an investment banking firm and are executing a capital plan that may include issuing common stock, preferred stock, or a combination of both, debt, or other financing alternatives that are treated as capital for capital adequacy ratio purposes at the Bank. Currently, our plan is to raise additional capital in the first half of 2010, and we are in active discussion with potential investors; however, the Board of Directors has not yet determined the type, timing, amount or terms of securities to be issued in the offering and there are no assurances that the offering will be completed.
The following table summarizes capital key performance indicators at the dates and for the periods indicated (dollars in thousands, except per share data).
| At and for the years ended December 31, |
||||||||
| 2009 | 2008 | |||||||
| Total shareholders’ equity |
$ | 75,015 | $ | 115,776 | ||||
| Average shareholders’ equity |
106,906 | 116,222 | ||||||
| Shareholders’ equity as a percentage of assets |
5.22 | % | 8.44 | % | ||||
| Average shareholders’ equity as a percentage of average assets |
7.47 | 8.79 | ||||||
| Cash dividends per common share |
$ | 0.06 | $ | 0.80 | ||||
| Dividend payout ratio |
n/a | % | 37.89 | % | ||||
74
Table of Contents
The following table summarizes activity impacting shareholders’ equity for the period indicated (in thousands).
| At and for the year ended December 31, 2009 |
||||
| Total shareholders’ equity, beginning of period |
$ | 115,776 | ||
| Additions to shareholders’ equity during period |
||||
| Change in accumulated other comprehensive loss due to investment securities available for sale |
1,927 | |||
| Common stock issued pursuant to stock option plan |
106 | |||
| Common stock issued pursuant to restricted stock plan |
253 | |||
| Compensation expense related to stock option plan |
64 | |||
| Excess tax benefit from equity based awards |
133 | |||
| Total additions to shareholders’ equity during period |
2,483 | |||
| Reductions in shareholders’ equity during period |
||||
| Net loss |
(40,085 | ) | ||
| Change in accumulated other comprehensive loss due to defined benefit pension plan |
(2,770 | ) | ||
| Cash dividends declared and paid |
(389 | ) | ||
| Total reductions in shareholders’ equity during period |
(43,244 | ) | ||
| Total shareholders’ equity, end of period |
$ | 75,015 | ||
Accumulated Other Comprehensive Loss. The following table summarizes the components of accumulated other comprehensive loss, net of tax impact, at the dates and for the periods indicated (in thousands).
| Impact of FASB ASC 715 |
Impact of curtailment |
Total impact of defined benefit pension plan |
Impact of investment securities available for sale |
Total | |||||||||||||||
| Accumulated other comprehensive income (loss), after income tax impact, December 31, 2007 |
$ | (4,116 | ) | $ | 1,630 | $ | (2,486 | ) | $ | (252 | ) | $ | (2,738 | ) | |||||
| Accumulated other comprehensive loss, before income tax impact |
(3,092 | ) | — | (3,092 | ) | (2,201 | ) | (5,293 | ) | ||||||||||
| Income tax benefit |
1,082 | — | 1,082 | 832 | 1,914 | ||||||||||||||
| Accumulated other comprehensive loss, after income tax impact |
(2,010 | ) | — | (2,010 | ) | (1,369 | ) | (3,379 | ) | ||||||||||
| Accumulated other comprehensive income (loss), after income tax impact, December 31, 2008 |
$ | (6,126 | ) | $ | 1,630 | $ | (4,496 | ) | $ | (1,621 | ) | $ | (6,117 | ) | |||||
| Accumulated other comprehensive income (loss), before income tax impact |
(4,261 | ) | — | (4,261 | ) | 3,107 | (1,154 | ) | |||||||||||
| Income tax (expense) benefit |
1,491 | — | 1,491 | (1,180 | ) | 311 | |||||||||||||
| Accumulated other comprehensive income (loss), after income tax impact |
(2,770 | ) | — | (2,770 | ) | 1,927 | (843 | ) | |||||||||||
| Accumulated other comprehensive income (loss), after income tax impact, December 31, 2009 |
$ | (8,896 | ) | $ | 1,630 | $ | (7,266 | ) | $ | 306 | $ | (6,960 | ) | ||||||
75
Table of Contents
Dividends. The following table summarizes key dividend information at the dates and for the periods indicated (dollars in thousands, except per share data).
| At and for the years ended December 31, |
||||||||
| 2009 | 2008 | |||||||
| Cash dividends per common share |
$ | 0.06 | $ | 0.80 | ||||
| Cash dividends declared and paid |
389 | 5,153 | ||||||
| Dividend payout ratio |
n/a | % | 37.89 | % | ||||
On March 17, 2009, our Board of Directors declared a cash dividend of $0.06 per share of common stock with regard to the first quarter of 2009. For the second, third, and fourth quarters 2009, the Board of Directors concluded that no dividend would be declared or paid on our common stock. As part of our capital plan, the Board of Directors believes that suspension of the dividend was prudent to preserve our capital and manage long-term shareholder value. Our Board of Directors will continue to evaluate whether or not to pay dividends on a quarterly basis. There can be no assurance as to future dividend payments because they are dependent on our financial condition, results of operations, and cash flows, as well as capital and dividend regulations. As a result of being adequately-capitalized at December 31, 2009, the Bank is restricted from declaring and paying a dividend on its common stock without prior notification and non-objection from the FDIC.
Regulatory Capital Requirements. Under regulatory capital requirements, reported accumulated other comprehensive income (loss) amounts do not increase or decrease regulatory capital and are not included in the calculation of risk-based capital and leverage ratios. The Company and the Bank are required to meet regulatory capital requirements that currently include several measures of capital.
Although our Tier 1 leverage ratio and Tier 1 risk-based capital ratios were above the well-capitalized regulatory minimum threshold of 5% and 6%, respectively, at December 31, 2009, our total risk-based capital ratio was 8.25% which was below the well-capitalized regulatory minimum threshold of 10%. As a result, although we had none at December 31, 2008 or since then, we may not accept brokered deposits unless a waiver has been granted by the FDIC. In addition, we are restricted from offering an effective yield of more than 75 basis points over the national rates published weekly by the FDIC on their website. Lastly, payment of a dividend on the Bank’s common stock requires prior notification and non-objection from the FDIC. Should losses continue, all or a portion of our deferred tax asset may be disallowed for purposes of our regulatory capital calculations. Such a disallowance may adversely impact our regulatory capital adequacy ratios.
Based on discussions with the FDIC following its most recent safety and soundness examination of the Bank in November 2009, the Bank presently expects to receive a written agreement from the FDIC some time in 2010 which could require the Bank to take certain actions to address concerns raised in the examination, including maintaining capital ratios in excess of the minimum thresholds required for a bank to be well-capitalized. If the Bank were to receive a written agreement and if the Bank were to fail to comply with the requirements in such written agreement, it may be subject to further regulatory action.
To raise additional capital, we have engaged an investment banking firm and are executing a capital plan that may include issuing common stock, preferred stock, or a combination of both, debt, or other financing alternatives that are treated as capital for capital adequacy ratio purposes at the Bank. Currently, our plan is to raise additional capital in the first half of 2010 and we are in active discussion with potential investors; however, the Board of Directors has not yet determined the type, timing, amount or terms of securities to be issued in the offering and there are no assurances that the offering will be completed.
See Item 8. Financial Statements and Supplementary Data, Note 20, contained herein for disclosures regarding the Company’s and the Bank’s actual and required regulatory capital requirements and ratios. Since December 31, 2009, no conditions or events have occurred of which we are aware, that have resulted in a material change in the Company’s or the Bank’s category other than as reported in this Annual Report on Form 10-K.
76
Table of Contents
Outstanding Equity. On May 19, 2009, at the Annual Meeting of Shareholders, our shareholders approved a proposed amendment to the Company’s Articles of Incorporation to increase the authorized common stock from 10 million shares to 25 million shares. Although we expect to issue common stock as part of our capital plan, at this time the Board of Directors has not made any decisions about the timing or terms of any potential common stock issuance.
On September 15, 2009, at the Special Meeting of Shareholders, our shareholders approved a proposed amendment to the Company’s Articles of Incorporation to authorize the issuance of up to 2.5 million shares of preferred stock with such preferences, limitations, and relative rights, within legal limits, of the class, or one or more series within the class, as are set by the Board of Directors. Although we expect to raise capital, at this time the Board of Directors has not made any decisions about whether preferred stock will be issued, the timing, or the terms of any potential issuance.
Government Financing. We did not participate in the U.S. Treasury’s CPP based on our evaluation of the merits of the program at that time. Currently, we are not eligible for CPP funds as application to that program was closed in 2008. In June, we submitted an application to participate in the U.S. Treasury’s Capital Assistance Program. Upon further consideration, we withdrew that application in August 2009.
With respect to any potential government assistance programs in the future, we will evaluate the merits of the programs to determine whether it is prudent to participate.
Private Trading System. On June 26, 2009, we implemented a Private Trading System on our website (www.palmettobank.com). The Private Trading System is a passive mechanism created to assist buyers and sellers in facilitating trades in our common stock. On June 30, 2009, the Company mailed a letter and related materials to shareholders regarding the Private Trading System and elected to furnish this information as an exhibit to a Current Report on Form 8-K filed with the SEC on July 2, 2009 which can be accessed through the SEC’s website (www.sec.gov).
Governance. During 2009, as part of our ongoing self-assessment process, management and the Board of Directors focused on their governance roles and processes to support a healthy corporate culture. The Board performed a self-assessment facilitated by an external consultant including comparisons to best practices from recognized authorities such as the Business Roundtable, CalPERS, and the national stock exchanges. The Board also reviewed the Company’s Articles of Incorporation and Bylaws and updated them to fit the current and future size, structure, and business activities of the Company. Also during 2009, management refined its performance evaluation process with a more detailed focus on roles and responsibilities and related accountabilities.
We are required to recognize all derivatives as either assets or liabilities in the balance sheet and measure those instruments at fair value. Changes in the fair value of those derivatives are reported in current earnings or other comprehensive income depending on the purpose for which the derivative is held and whether the derivative qualifies for hedge accounting.
We originate certain residential loans with the intention of selling these loans. Between the time that we enter into an interest rate lock commitment to originate a residential loan with a potential borrower and the time the closed loan is sold, we are subject to variability in market prices related to these commitments. We also enter into forward sale agreements of “to be issued” loans. The commitments to originate residential loans and forward sales commitments are freestanding derivative instruments and are recorded on the Consolidated Balance Sheet at fair value. They do not qualify for hedge accounting treatment. Fair value adjustments are recorded within the Mortgage-banking financial statement line item of the Consolidated Statements of Income (Loss). Commitments to originate conforming loans totaled $7.0 million at December 31, 2009. At December 31, 2009, these derivative loan commitments had positive fair values, included within the Other assets financial statement line item of the
77
Table of Contents
Consolidated Balance Sheet, totaling approximately $52 thousand, and negative fair values, included within the Other liabilities financial statement line item of the Consolidated Balance Sheet, totaling approximately $11 thousand, resulting in net derivative loan commitment income totaling approximately $41 thousand for the year ended December 31, 2009.
Forward sales commitments totaled $10.0 million at December 31, 2009. At December 31, 2009, forward sales commitments had positive fair values, included within the Other assets financial statement line item of the Consolidated Balance Sheet, totaling $92 thousand, and negative fair values, included within the Other liabilities financial statement line item of the Consolidated Balance Sheet, totaling approximately $1 thousand, resulting in net forward sales commitment income totaling approximately $91 thousand for the year ended December 31, 2009.
At December 31, 2008, the fair value of our derivative assets related to derivative loan commitments and forward loan sales commitments was not material.
General
Liquidity measures our ability to meet current and future cash flow needs as they become due. The liquidity of a financial institution reflects its ability to accommodate possible outflows in deposit accounts, meet loan requests and commitments, maintain reserve requirements, pay operating expenses, provide funds for dividends and debt service, manage operations on an ongoing basis, capitalize on new business opportunities, and take advantage of interest rate market opportunities. The ability of a financial institution to meet its current financial obligations is a function of its balance sheet structure, its ability to liquidate assets, and its access to alternative sources of funds. We seek to ensure our funding needs are met by maintaining a level of liquid funds through proactive balance sheet management.
Asset liquidity is provided by liquid assets which are readily convertible into cash or pledgeable or which will mature in the near future. Our liquid assets include cash, interest-bearing deposits in banks, investment securities available for sale, and federal funds sold. Liability liquidity is provided by access to funding sources, which include deposits and borrowed funds. We may also issue equity securities although our common and preferred stock are not listed on a national exchange or quoted on an over-the-counter service. Each of the Company’s sources of liquidity is subject to various factors beyond our control.
In June, we implemented a forward-looking liquidity plan and increased our liquidity monitoring. The liquidity plan includes, among other things:
| • | Maintaining cash received from loan and security repayments in cash invested at the Federal Reserve, rather than reinvesting the cash in other assets. Our cash invested at the Federal Reserve totaled $161.0 million at December 31, 2009. Maintaining this liquidity position has reduced our interest income by approximately $4.4 million when compared with investing the same funds at the average yield of 4.75% on our investment securities, since we are retaining a higher level of cash instead of reinvesting this cash in higher yielding assets. However, we expect to maintain available cash invested at the Federal Reserve for the foreseeable future. |
| • | Proactive customer deposit retention initiatives specific to large deposit customers and our deposit customers in general. In addition, during the fourth quarter of 2009, we conducted targeted deposit growth and retention campaigns related to maturing certificates of deposits and to attract new deposits such as health savings accounts. The certificate of deposit campaigns resulted in retaining $25.8 million of balances already in the Bank and generating new deposits of $5.3 million. We are currently conducting similar campaigns in the first quarter of 2010 related to maturing certificates of deposit and to generate new deposits in products such as individual retirement accounts. The CD campaigns include |
78
Table of Contents
| CDs with various maturities ranging from 6 months to 60 months, as well as 20 month and 36 month step-up CDs that allows holders to reset their interest rate once and up to three times, respectively, over the life of the CD. Through February 25, 2010, these campaigns resulted in the retention of existing CDs and generation of new CDs totaling approximately $122 million. |
| • | Obtaining additional term advances from the FHLB in 2009 aggregating $49 million. |
| • | Establishing access to the Federal Reserve Discount Window in the second quarter of 2009 for which we had unused borrowing capacity of $61.2 million at December 31, 2009. |
| • | Securing our remaining correspondent bank line of credit with collateral. |
| • | Obtaining a waiver from the FDIC from paying our prepaid FDIC assessment for 2010, 2011 and 2012 which would have required a cash payment in December 2009 of $10.6 million. |
| • | Filing of our 2009 federal income tax return on an accelerated basis to request payment of our refund claim totaling approximately $17.5 million resulting from the carryback of our net operating loss to 2004 through 2007. In addition, we filed a refund claim for $3.5 million of estimated income tax paid during 2009, of which we received $3.3 million thus far in February 2010. In total these refund claims represent $20.9 million of income tax refunds receivable at December 31, 2009. |
These measures resulted in an overall improved liquidity position at December 31, 2009 when compared with that of December 31, 2008. However, we are monitoring our liquidity carefully given:
| • | Restrictions by the FDIC from offering an effective yield of more than 75 basis points over the national rates published by the FDIC on their website on a weekly basis, due to not being well-capitalized. |
| • | Notification by the FHLB in January 2010 that it will not allow additional borrowings until our financial condition improves. |
| • | Limited access to federal funds funding from correspondent banks which were reduced during 2009 to $5 million at December 31, 2009. |
Cash Flow Needs
In the normal course of business, we enter into various transactions, some of which, in accordance with accounting principles generally accepted in the U.S., are not recorded in our Consolidated Balance Sheets. These transactions may involve, to varying degrees, elements of credit risk and interest rate risk in excess of the amounts recognized in the Consolidated Balance Sheets, if any.
Lending Commitments and Standby Letters of Credit. Unused lending commitments to customers are not recorded in our Consolidated Balance Sheets until funds are advanced. For commercial customers, lending commitments generally take the form of unused revolving credit arrangements to finance customers’ working capital requirements. For retail customers, lending commitments are generally unused lines of credit secured by residential property. At December 31, 2009, unused lending availability totaled $170.2 million.
Standby letters of credit are issued for customers in connection with contracts between the customers and third parties. Letters of credit are conditional commitments issued by us to guarantee the performance of a customer to a third party. The maximum potential amount of undiscounted future payments related to letters of credit at December 31, 2009 was $4.6 million compared with $8.6 million at December 31, 2008.
Our lending commitments and standby letters of credit do not meet the criteria to be accounted for at fair value since our commitment letters contained material adverse change clauses. Accordingly, we account for these instruments in a manner similar to our loans.
79
Table of Contents
We use the same credit policies in making and monitoring commitments as used for loan underwriting. Therefore, in general the methodology to determine the reserve for unfunded commitments is inherently similar to that used to determine the general reserve component of the allowance for loan losses. However, commitments have fixed expiration dates and most of our commitments to extend credit have adverse change clauses that allow the Bank to cancel the commitments based on various factors, including deterioration in the creditworthiness of the borrower. Accordingly, many of our loan commitments are expected to expire without being drawn upon and therefore the total commitment amounts do not necessarily represent potential credit exposure. The credit reserve for unfunded commitments at December 31, 2009 was $128 thousand and is recorded in the Other liabilities financial statement line item in the Consolidated Balance Sheet.
Derivatives. See Derivative Activities, included elsewhere in this item, for discussion regarding the Company’s off-balance sheet arrangements and commitments related to our derivative loan commitments and freestanding derivatives.
Dividend Obligations. The holders of the Company’s common stock are entitled to receive dividends, when and if declared by the Company’s Board of Directors, out of funds legally available for such dividends. The Company is a legal entity separate and distinct from the Bank and depends on the payment of dividends from the Bank. The Company and the Bank are subject to regulatory policies and requirements relating to the payment of dividends, including requirements to maintain adequate capital above regulatory minimums. The appropriate federal regulatory authorities are authorized to determine under certain circumstances that the payment of dividends by a bank holding company or a bank would be an unsafe or unsound practice and to prohibit payment of those dividends. The appropriate federal regulatory authorities have indicated that banking organizations should generally pay dividends only out of current income. In addition, as a South Carolina chartered bank, the Bank is subject to legal limitations on the amount of dividends it is permitted to pay.
In an effort to retain capital during this period of economic uncertainty, the Board of Directors reduced the quarterly dividend for the first quarter of 2009. For the three month period ended March 31, 2009, cash dividends were declared by the Board of Directors and paid totaling $389 thousand, or $0.06 per common share. These dividends equate to a dividend payout ratio of 19.51% for the quarter ended March 31, 2009. The Board of Directors suspended the quarterly common stock dividend for the second, third, and fourth quarters of 2009. The Board of Directors believes that suspension of the dividend was prudent to protect our capital base. In addition, since our total risk-based capital ratio was 8.25% at December 31, 2009 which was below the well-capitalized regulatory minimum threshold of 10%, payment of a dividend on our common stock requires prior notification and non-objection from the FDIC. Our Board of Directors will continue to evaluate dividend payment opportunities on a quarterly basis. There can be no assurance as to when and if future dividends will be reinstated, and at what level, because they are dependent on our financial condition, results of operations, and / or cash flows, as well as capital and dividend regulations from the FDIC and others.
For the years ended December 31, 2008 and 2007, cash dividends were declared by the Company’s Board of Directors and paid totaling $5.2 million, or $0.80 per common share, and $4.9 million, or $0.77 per common share, respectively. These dividends equate to dividend payout ratios of 37.89% and 30.76% for the same periods. The Company’s dividend payout ratio calculates the percentage of income paid to shareholders in the form of dividends.
80
Table of Contents
Long-Term Contractual Obligations. In addition to the contractual commitments and arrangements previously described, the Company enters into other contractual obligations in the ordinary course of business. The following table summarizes these contractual obligations at December 31, 2009 (in thousands) except obligations for employee benefit plans as these obligations are paid from separately identified assets. See Item 8. Financial Statements and Supplementary Data, Note 13 for discussion regarding this employee benefit plan.
| Other contractual obligations |
Less than one year |
Over one through three years |
Over three through five years |
Over five years |
Total | ||||||||||
| Real property operating lease obligations |
$ | 1,991 | $ | 3,597 | $ | 3,203 | $ | 14,272 | $ | 23,063 | |||||
| Time deposit accounts |
464,910 | 138,278 | 1,241 | 1,201 | 605,630 | ||||||||||
| Long-term borrowings |
17,000 | 79,000 | 5,000 | — | 101,000 | ||||||||||
| Total other contractual obligations |
$ | 483,901 | $ | 220,875 | $ | 9,444 | $ | 15,473 | $ | 729,693 | |||||
Obligations under noncancelable real property operating lease agreements noted above are payable over several years with the longest obligation expiring in 2029. Option periods that the Company has not yet exercised are not included in the preceding table.
Real property operating lease obligations summarized in the preceding table:
| • | Are net of payments to be received under a sublease agreement with a third party with regard to the Company’s previous Blackstock Road banking office for which we are contracted under a lease agreement as Lessee. This lease is scheduled to expire in 2010. |
| • | Include obligations with regard to three banking offices that were consolidated during 2008 that are leased by the Company and currently vacant. Two of the leases are scheduled to expire in 2010. Management is considering options with regard to the remaining leased location. |
| • | Do not include periodic increases in lease payments for the Rock Hill operating building lease and operating lease for additional office space. Lease payment increases are subject to consumer price index changes. Management does not believe that future minimum lease payments relative to these locations will significantly differ from current obligations at December 31, 2009. Therefore, current lease obligations have been used to determine the operating lease obligations in the preceding table. Obligations under these operating lease agreements are payable over several years with the building lease expiring in 2015 and the additional office space lease expiring in 2011. |
| • | Do not include the parking leases in downtown Greenville which are paid month-to-month. |
We relocated our corporate headquarters to downtown Greenville, South Carolina during March 2009. During 2007, we executed a build-to-suit operating lease agreement in conjunction with our new corporate headquarters in Greenville County. Upon occupancy, these lease payments were replaced with those required by the build-to-suit operating lease agreement dated May 2, 2007.
The Company enters into agreements with third parties with respect to the leasing, servicing, and maintenance of equipment. However, because we believe that these agreements are immaterial when considered individually, or in the aggregate, with regard to our Consolidated Financial Statements, we have not included such agreements in the preceding contractual obligations table. Therefore, management believes that noncompliance with terms of such agreements would not have a material impact on our business, financial condition, results of operations, and cash flows. Furthermore, as most such commitments are entered into for a 12-month period with option extensions, long-term obligations beyond 2010 cannot be reasonably estimated at this time.
81
Table of Contents
Short-Term Contractual and Noncontractual Obligations. Annually, in conjunction with our budgeting process, capital expenditures are approved for the coming year. During the budgeting process for 2010, the Board of Directors approved $2.5 million in capital expenditures related to technology and facilities. Generally, purchase obligations are not made in advance of such purchases, although to obtain discounted pricing we may enter into such arrangements. In addition, management anticipates that expenditures will be required during 2010 that could not have been expected and, therefore, were not approved in the budgeting process. Funds to fulfill both budgeted and nonbudgeted commitments will come from our operational cash flows.
Although we expect to make capital expenditures in years subsequent to 2010, capital expenditures are reviewed by management on an annual basis. Therefore, we have not yet estimated such capital expenditure obligations for years subsequent to 2010.
82
Table of Contents
Overview
PALMETTO BANCSHARES, INC. AND SUBSIDIARY
Consolidated Statements of Income (Loss)
(dollars in thousands, except per share data)
| For the years ended December 31, | 2009 to 2008 comparison | |||||||||||||||||
| 2009 | 2008 | 2007 | Dollar variance |
Percent variance |
||||||||||||||
| Interest income |
||||||||||||||||||
| Interest earned on cash and cash equivalents |
$ | 215 | $ | 106 | $ | 678 | $ | 109 | 102.8 | % | ||||||||
| Dividends paid on FHLB stock |
19 | 189 | 155 | (170 | ) | (89.9 | ) | |||||||||||
| Interest earned on investment securities available for sale |
5,667 | 6,010 | 4,392 | (343 | ) | (5.7 | ) | |||||||||||
| Interest and fees earned on loans |
60,309 | 71,940 | 78,326 | (11,631 | ) | (16.2 | ) | |||||||||||
| Total interest income |
66,210 | 78,245 | 83,551 | (12,035 | ) | (15.4 | ) | |||||||||||
| Interest expense |
||||||||||||||||||
| Interest paid on deposits |
19,511 | 23,694 | 30,232 | (4,183 | ) | (17.7 | ) | |||||||||||
| Interest paid on retail repurchase agreements |
58 | 247 | 539 | (189 | ) | (76.5 | ) | |||||||||||
| Interest paid on commercial paper |
60 | 359 | 1,110 | (299 | ) | (83.3 | ) | |||||||||||
| Interest paid on other short-term borrowings |
90 | 1,108 | 704 | (1,018 | ) | (91.9 | ) | |||||||||||
| Interest paid on long-term borrowings |
1,720 | 1,198 | 173 | 522 | 43.6 | |||||||||||||
| Total interest expense |
21,439 | 26,606 | 32,758 | (5,167 | ) | (19.4 | ) | |||||||||||
| Net interest income |
44,771 | 51,639 | 50,793 | (6,868 | ) | (13.3 | ) | |||||||||||
| Provision for loan losses |
73,400 | 5,619 | 988 | 67,781 | 1,206.3 | |||||||||||||
| Net interest income (loss) after provision for loan losses |
(28,629 | ) | 46,020 | 49,805 | (74,649 | ) | (162.2 | ) | ||||||||||
| Noninterest income |
||||||||||||||||||
| Service charges on deposit accounts, net |
8,275 | 8,596 | 8,050 | (321 | ) | (3.7 | ) | |||||||||||
| Fees for trust and investment management and brokerage services |
2,275 | 2,996 | 3,115 | (721 | ) | (24.1 | ) | |||||||||||
| Mortgage-banking |
3,174 | 2,145 | 1,797 | 1,029 | 48.0 | |||||||||||||
| Automatic teller machine |
1,389 | 1,234 | 1,049 | 155 | 12.6 | |||||||||||||
| Investment securities gains |
2 | 1 | — | 1 | 100.0 | |||||||||||||
| Other |
3,587 | 3,926 | 3,368 | (339 | ) | (8.6 | ) | |||||||||||
| Total noninterest income |
18,702 | 18,898 | 17,379 | (196 | ) | (1.0 | ) | |||||||||||
| Noninterest expense |
||||||||||||||||||
| Salaries and other personnel |
24,463 | 23,774 | 25,850 | 689 | 2.9 | |||||||||||||
| Occupancy |
4,293 | 3,293 | 2,969 | 1,000 | 30.4 | |||||||||||||
| Furniture and equipment |
3,407 | 3,823 | 3,685 | (416 | ) | (10.9 | ) | |||||||||||
| Loss (gain) on disposition of premises, furniture, and equipment |
81 | (2 | ) | 346 | 83 | (4,150.0 | ) | |||||||||||
| FDIC deposit insurance assessment |
3,261 | 786 | 179 | 2,475 | 314.9 | |||||||||||||
| Mortgage-servicing rights portfolio amortization and impairment |
1,271 | 881 | 511 | 390 | 44.3 | |||||||||||||
| Marketing |
1,114 | 1,576 | 1,410 | (462 | ) | (29.3 | ) | |||||||||||
| Real estate acquired in settlement of loans writedowns and expenses |
3,233 | 516 | 164 | 2,717 | 526.6 | |||||||||||||
| Other |
11,163 | 9,208 | 7,656 | 1,955 | 21.2 | |||||||||||||
| Total noninterest expense |
52,286 | 43,855 | 42,770 | 8,431 | 19.2 | |||||||||||||
| Net income (loss) before provision (benefit) for income taxes |
(62,213 | ) | 21,063 | 24,414 | (83,276 | ) | (395.4 | ) | ||||||||||
| Provision (benefit) for income taxes |
(22,128 | ) | 7,464 | 8,399 | (29,592 | ) | (396.5 | ) | ||||||||||
| Net income (loss) |
$ | (40,085 | ) | $ | 13,599 | $ | 16,015 | $ | (53,684 | ) | (394.8 | )% | ||||||
| Common and per share data |
||||||||||||||||||
| Net income (loss)—basic |
$ | (6.21 | ) | $ | 2.11 | $ | 2.51 | $ | (8.32 | ) | (394.3 | )% | ||||||
| Net income (loss)—diluted |
(6.21 | ) | 2.09 | 2.47 | (8.30 | ) | (397.1 | ) | ||||||||||
| Cash dividends |
0.06 | 0.80 | 0.77 | (0.74 | ) | (92.5 | ) | |||||||||||
| Book value |
11.55 | 17.96 | 17.17 | (6.41 | ) | (35.7 | ) | |||||||||||
| Weighted average common shares outstanding—basic |
6,449,754 | 6,438,071 | 6,390,858 | |||||||||||||||
| Weighted average common shares outstanding—diluted |
6,449,754 | 6,519,849 | 6,477,663 | |||||||||||||||
83
Table of Contents
Summary
Historically, our earnings were driven primarily by a high net interest margin resulting from higher yielding commercial real estate and construction loans which allowed for a higher expense base related primarily to personnel and facilities. However, given the narrowing of our net interest margin due to the reduction of 500 to 525 basis points in interest rates by the Federal Reserve in 2007 and 2008, we have become much more focused on increasing our noninterest income and managing expenses. In addition, we are realigning our lending focus to non-real estate portfolio segments. To accelerate efforts to improve earnings above what we have already done, we have also engaged two strategic consulting firms in the first quarter of 2010 which specialize in assessment of banking products and services, revenue enhancements, and efficiency reviews.
One of the components of our Strategic Project Plan is an earnings plan that is focused on earnings improvement through a combination of revenue increases and expense reductions. In summary to date:
| • | With respect to revenue increases, we have implemented risk-based loan pricing and interest rate floors on renewed and new loans meeting certain criteria and are evaluating other noninterest sources of income. At December 31, 2009, loans aggregating $190.9 million have interest rate floors, of which $156.3 million had floors greater than or equal to 5%. |
| • | Regarding expense reductions, in light of the current low interest rate environment, we have reduced the interest rates paid on our deposits, including the rates on our CD campaigns in December 2009 and into 2010. |
| • | In addition, we identified over $2.3 million of specific noninterest expense reductions to be realized in 2009 and into 2010 and are continuing to review other expense areas for additional reductions. These expense reductions will be partially offset by the higher level of credit-related costs incurred due to legal, consulting, and carrying costs related to our higher level of nonperforming assets. |
We expect additional increases in revenues and decreases in expenses in 2010 as we continue execution of our earnings plan. We have begun critically evaluating each of our businesses to determine their contribution to our financial performance and their relative risk/return relationship. This could result in refinement or sale of certain businesses.
Net Interest Income
General. Net interest income is the difference between interest income earned on interest-earning assets, primarily loans and investment securities, and interest expense paid on interest-bearing deposits and other interest-bearing liabilities. This measure represents the largest component of income for us. The net interest margin measures how effectively we manage the difference between the interest income earned on interest-earning assets and the interest expense paid for funds to support those assets. Changes in interest rates earned on interest-earning assets and interest rates paid on interest-bearing liabilities, the rate of growth of the interest-earning assets and interest-bearing liabilities base, the ratio of interest-earning assets to interest-bearing liabilities, and the management of interest rate sensitivity factor into fluctuations within net interest income.
Net interest income totaled $44.8 million for year ended December 31, 2009 compared with $51.6 million for the year ended December 31, 2008. Overall, interest income has been negatively impacted by the reduction in interest rates by the Federal Reserve by 500 to 525 basis points throughout 2007 and 2008.
In addition to the impact of changes due to volume and rate as summarized below in Rate / Volume Analysis, net interest income for the period was negatively impacted by the impact of loans placed in nonaccrual status during the period; foregone interest on nonaccrual loans in 2009 totaled $5.9 million.
The net interest margin was also negatively impacted by retaining a higher level of cash at the Federal Reserve, primarily from loan and security repayments, for which we earn a 25 basis points yield. Maintaining
84
Table of Contents
this liquidity position has reduced our interest income by approximately $4.4 million when compared with investing these funds at the average yield of 4.75% on our investment securities because we are retaining a higher level of cash instead of reinvesting this cash in higher yielding assets. However, we expect to maintain this liquidity position for the foreseeable future, notwithstanding the negative impact our interest income. Once the banking industry returns to a more stable operating environment and we raise additional capital, our plan is to reinvest these cash reserves into higher yielding assets which should significantly improve our net interest margin.
Given the reduction in interest rates by the Federal Reserve, the Company is experiencing a narrower net interest margin. In response, we have refined the type of loan and deposit products we prefer to pursue taking into consideration the yields earned and rates paid and are exercising more discipline in our loan and deposit interest rate levels. We have also implemented interest rate floors on loans. At December 31, 2009, loans aggregating $190.9 million have interest rate floors, of which $156.3 million had floors greater than or equal to 5%.
During the second half of 2008 and continuing through 2009, the financial markets experienced significant volatility resulting from the continued fallout of subprime lending and the global liquidity crisis. A multitude of government initiatives along with interest rate cuts by the Federal Reserve have been designed to improve liquidity for the distressed financial markets and stabilize the banking system. The relationship between declining interest-earning asset yields and more slowly declining interest-bearing liability costs has caused, and may continue to cause, net interest margin compression. Net interest margin compression may also continue to be impacted by continued deterioration of assets resulting in further interest income adjustments.
85
Table of Contents
Average Balance Sheets and Net Interest Income/Margin Analysis. The following table summarizes our average balance sheets and net interest income/margin analysis for the periods indicated (dollars in thousands). Our interest yield earned on interest-earning assets and interest rate paid on interest-bearing liabilities shown in the table are derived by dividing interest income and expense by the average balances of interest-earning assets or interest-bearing liabilities, respectively. The following table does not include a tax-equivalent adjustment to net interest income for interest-earning assets earning tax-exempt income to a comparable yield on a taxable basis.
| For the years ended December 31, | ||||||||||||||||||||||||||||||
| 2009 | 2008 | 2007 | ||||||||||||||||||||||||||||
| Average balance |
Income/ expense |
Yield/ rate |
Average balance |
Income/ expense |
Yield/ rate |
Average balance |
Income/ expense |
Yield/ rate |
||||||||||||||||||||||
| Assets |
||||||||||||||||||||||||||||||
| Interest-earnings assets |
||||||||||||||||||||||||||||||
| Cash and cash equivalents |
$ | 96,546 | $ | 215 | 0.22 | % | $ | 9,365 | $ | 106 | 1.13 | % | $ | 18,273 | $ | 678 | 3.71 | % | ||||||||||||
| FHLB stock |
6,363 | 19 | 0.30 | 5,640 | 189 | 3.35 | 2,724 | 155 | 5.69 | |||||||||||||||||||||
| Investment securities available for sale, taxable (1) |
70,693 | 4,027 | 5.70 | 71,778 | 4,204 | 5.86 | 54,330 | 2,592 | 4.77 | |||||||||||||||||||||
| Investment securities available for sale, nontaxable (1) |
48,545 | 1,640 | 3.38 | 51,773 | 1,806 | 3.49 | 50,427 | 1,800 | 3.57 | |||||||||||||||||||||
| Loans (2) |
1,130,809 | 60,309 | 5.33 | 1,111,436 | 71,940 | 6.47 | 987,707 | 78,326 | 7.93 | |||||||||||||||||||||
| Total interest-earning assets |
1,352,956 | 66,210 | 4.89 | 1,249,992 | 78,245 | 6.26 | 1,113,461 | 83,551 | 7.50 | |||||||||||||||||||||
| Noninterest-earning assets |
||||||||||||||||||||||||||||||
| Cash and cash equivalents |
23,022 | 25,915 | 26,370 | |||||||||||||||||||||||||||
| Allowance for loan losses |
(16,831 | ) | (7,611 | ) | (8,344 | ) | ||||||||||||||||||||||||
| Premises and equipment, net |
28,931 | 24,704 | 24,835 | |||||||||||||||||||||||||||
| Premises held for sale |
339 | 1,651 | — | |||||||||||||||||||||||||||
| Goodwill, net |
3,688 | 3,688 | 3,688 | |||||||||||||||||||||||||||
| Accrued interest receivable |
4,934 | 6,012 | 6,049 | |||||||||||||||||||||||||||
| Real estate acquired in settlement of loans |
14,887 | 7,563 | 3,063 | |||||||||||||||||||||||||||
| Other |
18,345 | 10,627 | 13,728 | |||||||||||||||||||||||||||
| Total noninterest-earning assets |
77,315 | 72,549 | 69,389 | |||||||||||||||||||||||||||
| Total assets |
$ | 1,430,271 | $ | 1,322,541 | $ | 1,182,850 | ||||||||||||||||||||||||
| Liabilities and Shareholders’ Equity |
||||||||||||||||||||||||||||||
| Liabilities |
||||||||||||||||||||||||||||||
| Interest-bearing liabilities |
||||||||||||||||||||||||||||||
| Transaction deposit accounts |
$ | 323,613 | $ | 526 | 0.16 | % | $ | 374,382 | $ | 4,966 | 1.33 | % | $ | 358,118 | $ | 10,152 | 2.83 | % | ||||||||||||
| Money market deposit accounts |
108,566 | 602 | 0.55 | 105,834 | 1,922 | 1.82 | 115,563 | 3,977 | 3.44 | |||||||||||||||||||||
| Savings deposit accounts |
40,871 | 132 | 0.32 | 37,692 | 129 | 0.34 | 40,184 | 139 | 0.35 | |||||||||||||||||||||
| Time deposit accounts |
578,026 | 18,251 | 3.16 | 400,516 | 16,677 | 4.16 | 360,025 | 15,964 | 4.43 | |||||||||||||||||||||
| Total interest-bearing deposits |
1,051,076 | 19,511 | 1.86 | 918,424 | 23,694 | 2.58 | 873,890 | 30,232 | 3.46 | |||||||||||||||||||||
| Retail repurchase agreements |
23,227 | 58 | 0.25 | 18,063 | 247 | 1.37 | 13,347 | 539 | 4.04 | |||||||||||||||||||||
| Commercial paper (Master notes) |
24,085 | 60 | 0.25 | 32,415 | 359 | 1.11 | 27,295 | 1,110 | 4.07 | |||||||||||||||||||||
| Other short-term borrowings |
15,447 | 90 | 0.58 | 48,543 | 1,108 | 2.28 | 13,036 | 704 | 5.40 | |||||||||||||||||||||
| Long-term borrowings |
68,054 | 1,720 | 2.53 | 41,415 | 1,198 | 2.89 | 4,521 | 173 | 3.83 | |||||||||||||||||||||
| Total interest-bearing liabilities |
1,181,889 | 21,439 | 1.81 | 1,058,860 | 26,606 | 2.51 | 932,089 | 32,758 | 3.51 | |||||||||||||||||||||
| Noninterest-bearing liabilities |
||||||||||||||||||||||||||||||
| Noninterest-bearing deposits |
134,138 | 138,373 | 135,783 | |||||||||||||||||||||||||||
| Accrued interest payable |
2,217 | 2,309 | 2,496 | |||||||||||||||||||||||||||
| Other |
5,121 | 6,777 | 5,867 | |||||||||||||||||||||||||||
| Total noninterest-bearing liabilities |
141,476 | 147,459 | 144,146 | |||||||||||||||||||||||||||
| Total liabilities |
1,323,365 | 1,206,319 | 1,076,235 | |||||||||||||||||||||||||||
| Shareholders’ equity |
106,906 | 116,222 | 106,615 | |||||||||||||||||||||||||||
| Total liabilities and shareholders’ equity |
$ | 1,430,271 | $ | 1,322,541 | $ | 1,182,850 | ||||||||||||||||||||||||
| NET INTEREST INCOME/NET YIELD ON INTEREST-EARNING ASSETS |
$ | 44,771 | 3.31 | % | $ | 51,639 | 4.13 | % | $ | 50,793 | 4.56 | % | ||||||||||||||||||
| (1) | The average balances for investment securities include the applicable unrealized gain or loss recorded for available for sale securities. |
| (2) | Calculated including mortgage loans held for sale, excluding the allowance for loan losses. Nonaccrual loans are included in average balances for yield computations. The impact of foregone interest income as a result of loans on nonaccrual was not considered in the above analysis. All loans and deposits are domestic. |
86
Table of Contents
Federal Reserve Rate Influences. The Federal Reserve influences the general market rates of interest earned on interest-earning assets and interest paid on interest-bearing liabilities. The following table summarizes the actions taken by the Federal Reserve with regard to the prime interest rate and the federal funds interest rate from December 31, 2006 through December 31, 2009.
| Prime rate | Federal funds rate | |||||||||||
| Change | Balance | Change | Balance | |||||||||
| Rate, at December 31, 2006 |
8.25 | % | 5.25 | % | ||||||||
| Changes in rate |
||||||||||||
| September 18, 2007 |
(0.50 | )% | (0.50 | )% | ||||||||
| October 31, 2007 |
(0.25 | ) | (0.25 | ) | ||||||||
| December 11, 2007 |
(0.25 | ) | (0.25 | ) | ||||||||
| Total changes in rate |
(1.00 | ) | (1.00 | ) | ||||||||
| Rate, at December 31, 2007 |
7.25 | 4.25 | ||||||||||
| Changes in rate |
||||||||||||
| January 22, 2008 |
(0.75 | ) | (0.75 | ) | ||||||||
| January 30, 2008 |
(0.50 | ) | (0.50 | ) | ||||||||
| March 18, 2008 |
(0.75 | ) | (0.75 | ) | ||||||||
| April 30, 2008 |
(0.25 | ) | (0.25 | ) | ||||||||
| October 8, 2008 |
(0.50 | ) | (0.50 | ) | ||||||||
| October 29, 2008 |
(0.50 | ) | (0.50 | ) | ||||||||
| December 16, 2008 |
(0.75-1.00 | ) | (0.75-1.00 | ) | ||||||||
| Total changes in rate |
(4.00-4.25 | ) | (4.00-4.25 | ) | ||||||||
| Rate, at December 31, 2008 |
3.00-3.25 | 0.00-0.25 | ||||||||||
| Changes in rate |
— | — | ||||||||||
| Rate, at December 31, 2009 |
3.00-3.25 | % | 0.00-0.25 | % | ||||||||
87
Table of Contents
Rate/Volume Analysis. The following rate / volume analysis summarizes the dollar amount of changes in interest income and interest expense attributable to changes in volume and the amount attributable to changes in rate when comparing the periods indicated (in thousands). The impact of the combination of rate and volume change has been divided proportionately between the rate change and volume change.
| For the year ended December 31, 2009 compared with the year ended December 31, 2008 |
||||||||||||
| Change in volume |
Change in rate |
Total change |
||||||||||
| Assets |
||||||||||||
| Interest-earnings assets |
||||||||||||
| Cash and cash equivalents |
$ | 119 | $ | (10 | ) | $ | 109 | |||||
| FHLB stock |
28 | (198 | ) | (170 | ) | |||||||
| Investment securities available for sale (1) |
(207 | ) | (136 | ) | (343 | ) | ||||||
| Loans (2) |
1,278 | (12,909 | ) | (11,631 | ) | |||||||
| Total interest income |
$ | 1,218 | $ | (13,253 | ) | $ | (12,035 | ) | ||||
| Liabilities and Shareholders’ Equity |
||||||||||||
| Interest-bearing liabilities |
||||||||||||
| Transaction deposit accounts |
$ | (594 | ) | $ | (3,846 | ) | $ | (4,440 | ) | |||
| Money market deposit accounts |
51 | (1,371 | ) | (1,320 | ) | |||||||
| Savings deposit accounts |
8 | (5 | ) | 3 | ||||||||
| Time deposit accounts |
3,462 | (1,888 | ) | 1,574 | ||||||||
| Total interest paid on deposits |
2,927 | (7,110 | ) | (4,183 | ) | |||||||
| Retail repurchase agreements |
102 | (291 | ) | (189 | ) | |||||||
| Commercial paper |
(74 | ) | (225 | ) | (299 | ) | ||||||
| Other short-term borrowings |
(486 | ) | (532 | ) | (1,018 | ) | ||||||
| Long-term borrowings |
650 | (128 | ) | 522 | ||||||||
| Total interest expense |
$ | 3,119 | $ | (8,286 | ) | $ | (5,167 | ) | ||||
| Net interest income |
$ | (1,901 | ) | $ | (4,967 | ) | $ | (6,868 | ) | |||
88
Table of Contents
| For the year ended December 31, 2008 compared with the year ended December 31, 2007 |
||||||||||||
| Change in volume |
Change in rate |
Total change |
||||||||||
| Assets |
||||||||||||
| Interest-earnings assets |
||||||||||||
| Cash and cash equivalents |
$ | (236 | ) | $ | (336 | ) | $ | (572 | ) | |||
| FHLB stock |
55 | (21 | ) | 34 | ||||||||
| Investment securities available for sale (1) |
855 | 763 | 1,618 | |||||||||
| Loans (2) |
13,672 | (20,058 | ) | (6,386 | ) | |||||||
| Total interest income |
$ | 14,346 | $ | (19,652 | ) | $ | (5,306 | ) | ||||
| Liabilities and Shareholders’ Equity |
||||||||||||
| Interest-bearing liabilities |
||||||||||||
| Transaction deposit accounts |
$ | 484 | $ | (5,670 | ) | $ | (5,186 | ) | ||||
| Money market deposit accounts |
(311 | ) | (1,744 | ) | (2,055 | ) | ||||||
| Savings deposit accounts |
(9 | ) | (1 | ) | (10 | ) | ||||||
| Time deposit accounts |
1,557 | (844 | ) | 713 | ||||||||
| Total interest paid on deposits |
1,721 | (8,259 | ) | (6,538 | ) | |||||||
| Retail repurchase agreements |
334 | (626 | ) | (292 | ) | |||||||
| Commercial paper |
261 | (1,013 | ) | (752 | ) | |||||||
| Other short-term borrowings |
514 | (109 | ) | 405 | ||||||||
| Long-term borrowings |
1,056 | (31 | ) | 1,025 | ||||||||
| Total interest expense |
$ | 3,886 | $ | (10,038 | ) | $ | (6,152 | ) | ||||
| Net interest income |
$ | 10,460 | $ | (9,614 | ) | $ | 846 | |||||
| (1) | The average balances for investment securities include the applicable unrealized gain (loss) recorded for investment securities available for sale. |
| (2) | Calculated including mortgage loans held for sale, excluding the allowance for loan losses. Nonaccrual loans are included in average balances for yield computations. The impact of foregone interest income as a result of loans on nonaccrual was not considered in the above analysis. All loans and deposits are domestic. |
Absent the significant impact of impaired loans during 2009, the change due to rate for the year ended December 31, 2009 compared with the year ended December 31, 2008 and the change due to volume relative to loans was -$2.7 million and the change due to rate was -$8.9 million, respectively.
Provision for Loan Losses
Provision for loan losses increased from $5.6 million during the year ended December 31, 2008 to $73.4 million for the year ended December 31, 2009. See Financial Condition—Lending Activities, included elsewhere in this item, for discussion regarding our accounting policies related to, factors impacting, and methodology for analyzing the adequacy of our allowance for loan losses and, therefore, our provision for loan losses.
89
Table of Contents
Noninterest Income
General. The following table summarizes the components of noninterest income for the periods indicated (in thousands).
| For the years ended December 31, | |||||||||
| 2009 | 2008 | 2007 | |||||||
| Service charges on deposit accounts, net |
$ | 8,275 | $ | 8,596 | $ | 8,050 | |||
| Fees for trust and investment management and brokerage services |
2,275 | 2,996 | 3,115 | ||||||
| Mortgage-banking |
3,174 | 2,145 | 1,797 | ||||||
| Automatic teller machine |
1,389 | 1,234 | 1,049 | ||||||
| Investment securities gains |
2 | 1 | — | ||||||
| Other |
3,587 | 3,926 | 3,368 | ||||||
| Total noninterest income |
$ | 18,702 | $ | 18,898 | $ | 17,379 | |||
Service Charges on Deposit Accounts, Net. Net service charges on deposit accounts comprise a significant component of noninterest income totaling 1.8% of average transaction deposit accounts for the year ended December 31, 2009 compared with 1.7% of average transaction deposit accounts for the year ended December 31, 2008.
In response to competition to retain deposits, institutions in the financial services industry have increasingly been providing services for free in an effort to lure deposits away from competitors and retain existing balances. Services that were initially developed as fee income opportunities, such as Internet banking and bill payment service, are now provided to customers free of charge. Consequently, opportunities to earn additional income from service charges for such services have been more limited. In addition, recent focus on the level of deposit service charges within the banking industry by the media and the U.S. Government may result in future legislation limiting the amount and type of services charges within the banking industry. New regulations to be effective in 2010 may result in reductions in deposit-related service charges. Accordingly, we are monitoring the regulations closely and evaluating alternative products that may offset reductions due to any required regulatory changes.
Fees for Trust and Investment Management and Brokerage Services. The following table summarizes the composition of fees for trust and investment management and brokerage services for the periods indicated (in thousands).
| For the years ended December 31, | |||||||||
| 2009 | 2008 | 2007 | |||||||
| Fees for trust and investment management services |
$ | 1,764 | $ | 2,311 | $ | 2,446 | |||
| Fees for brokerage services |
511 | 685 | 669 | ||||||
| Total fees for trust and investment management and brokerage services |
$ | 2,275 | $ | 2,996 | $ | 3,115 | |||
Fees for trust and investment management and brokerage services for the year ended December 31, 2009 decreased $721 thousand, or 24.1%, to $2.3 million from $3.0 million for the year ended December 31, 2008 primarily as a result of the overall decrease in the market values of securities held in trust accounts which had a material impact in the calculation and realization of trust fees. Fees for brokerage services are primarily transaction-based. As such, the decrease in these fees was primarily due to the decline in brokerage transaction activity over the periods presented.
90
Table of Contents
The following table summarizes trust and investment management and brokerage assets under management, which are not included in our Consolidated Balance Sheets, at the dates indicated (in thousands).
| For the years ended December 31, | |||||||||
| 2009 | 2008 | 2007 | |||||||
| Trust and investment management assets |
$ | 237,771 | $ | 214,389 | $ | 312,503 | |||
| Brokerage assets |
181,469 | 167,923 | 207,336 | ||||||
| Total trust and investment management and brokerage assets |
$ | 419,240 | $ | 382,312 | $ | 519,839 | |||
Mortgage-Banking. Most of the residential mortgage loans that we originate are sold in the secondary market. Normally we retain the servicing rights. Mortgage loans serviced for the benefit of others amounted to $426.6 million and $377.3 million at December 31, 2009 and December 31, 2008, respectively, and are not included in our Consolidated Balance Sheets.
The following table summarizes the components of mortgage-banking income for the periods indicated (dollars in thousands).
| For the years ended December 31, |
||||||||||||
| 2009 | 2008 | 2007 | ||||||||||
| Mortgage-servicing fees |
$ | 974 | $ | 901 | $ | 834 | ||||||
| Gain on sale of mortgage loans held for sale |
1,728 | 994 | 796 | |||||||||
| Derivative loan commitment income |
41 | — | — | |||||||||
| Forward sales commitment income |
91 | — | — | |||||||||
| Other |
340 | 250 | 167 | |||||||||
| Total mortgage-banking income |
$ | 3,174 | $ | 2,145 | $ | 1,797 | ||||||
| Mortgage-servicing fees as a percentage of average mortgage loans serviced for the benefit of others |
0.24 | % | 0.25 | % | 0.25 | % | ||||||
Mortgage banking income increased $1.0 million, or 48.0%, from December 31, 2008 to December 31, 2009, primarily due to increased gains on sales of mortgage loans combined with a net gain on derivative loan and forward sales commitments for the year ended December 31, 2009 compared with the year ended December 31, 2008.
Gains on sale of mortgage loans held for sale increased over the periods presented primarily due to an increase in the volume of refinancings resulting from the low interest rate environment during 2009.
Commitments to originate conforming loans are accounted for at fair value with the change in fair value recorded in earnings. The net change in derivative loan commitment fair values during the year ended December 31, 2009 totaled $41 thousand.
Forward sales commitments are accounted for at fair value with the change in fair value recorded in earnings. The net change in forward sales commitment fair values during the year ended December 31, 2009 totaled $91 thousand.
Automatic Teller Machine. Automatic teller machine income increased $155 thousand, or 12.6%, during the year ended December 31, 2009 over the year ended December 31, 2008. Prior to 2009, we were on a surcharge free network. We did not participate in this program in 2009.
91
Table of Contents
Other. Other noninterest income decreased $339 thousand, or 8.6%, from December 31, 2008 to December 31, 2009. The $71 thousand increase in Debit card income, the largest component of Other noninterest income, over the same period was offset by the following decreases.
Included within Other noninterest income for the year ended December 31, 2008 was a pretax first quarter gain of approximately $226 thousand, resulting from the mandatory redemption of the Company’s Class B Visa, Inc. shares as part of Visa’s initial public offering. We continue to own 8,386 shares of Visa Class B shares that are convertible into Class A shares. The amount of Class A shares the Company could realize upon conversion of our remaining Class B shares may change depending upon whether additional amounts of money need to be reserved by Visa to settle outstanding litigation. The Class B shares carry a three-year lock-up provision and may not be converted or redeemed during that period. We obtained our ownership of Visa shares, and resulting proportionate share of the Visa litigation settlement, by being a long-time Visa member. Our ownership proportion is based upon our percentage of total fees paid to Visa over this period.
Included within Other noninterest income for the year ended December 31, 2007 was a pretax third quarter gain of approximately $487 thousand resulting from our sale of our MasterCard stock. During the third quarter of 2007, the Bank converted our shares of Class B common stock on a one-for-one basis into shares of Class A common stock for subsequent sale to public investors.
Noninterest Expense
General. The earnings component of our Strategic Project Plan includes keen focus on expense management. As part of our earnings plan to improve our overall financial performance, we identified over $2.3 million of specific noninterest expense reductions to be realized in 2009 and into 2010 and are continuing to review other expense areas for additional reductions. Examples include freezing employee salaries effective May 1, 2009, eliminating the remaining officer cash incentive plan awards under the corporate incentive plan for 2009, reducing our Saturday banking hours from 2:00 p.m. to noon effective September 5, 2009, reducing corporate contributions to not-for-profit organizations, reducing marketing expenses, and overall savings resulting from implementing more advanced technology. These expense reductions will be partially offset by the higher level of credit-related costs incurred due to legal, consulting, and carrying costs related to our higher level of nonperforming assets. We continue to review other expense areas for additional reduction opportunities, including assistance in the first quarter 2010 from a consulting firm that specializes in efficiency reviews and expense reductions.
The following table summarizes the components of noninterest expense for the periods indicated (in thousands).
| For the years ended December 31, | ||||||||||
| 2009 | 2008 | 2007 | ||||||||
| Salaries and other personnel |
$ | 24,463 | $ | 23,774 | $ | 25,850 | ||||
| Occupancy |
4,293 | 3,293 | 2,969 | |||||||
| Furniture and equipment |
3,407 | 3,823 | 3,685 | |||||||
| Loss (gain) on disposition of premises, furniture, and equipment |
81 | (2 | ) | 346 | ||||||
| FDIC deposit insurance assessment |
3,261 | 786 | 179 | |||||||
| Mortgage-servicing rights portfolio amortization and impairment |
1,271 | 881 | 511 | |||||||
| Marketing |
1,114 | 1,576 | 1,410 | |||||||
| Real estate acquired in settlement of loans writedowns and expenses |
3,233 | 516 | 164 | |||||||
| Other |
11,163 | 9,208 | 7,656 | |||||||
| Total noninterest expense |
$ | 52,286 | $ | 43,855 | $ | 42,770 | ||||
92
Table of Contents
Salaries and Other Personnel. Comprising 46.8% of total noninterest expense during the year ended December 31, 2009 and 54.2% of total noninterest expense during the year ended December 31, 2008, salaries and other personnel expense increased by $689 thousand, or 2.9%, over the same periods. This increase was primarily a result of an increase in pension expense over the periods presented offset by the freezing of employee salaries effective May 1, 2009, elimination of the remaining officer cash incentive plan awards under corporate incentive plan for 2009, the reduction of our Saturday banking hours from 2:00 p.m. to noon effective September 5, 2009, and a decrease in full-time equivalent employees from 415 at December 31, 2008 to 413 at December 31, 2009.
For comparative purposes, the following table summarizes nonrecurring transactions in 2007, all of which were disclosed in our Annual Report on Form 10-K for the year ended December 31, 2007, which represented the majority of the fluctuation in salaries and other personnel expense for the year ended December 31, 2007 when compared with the years ended December 31, 2008 and 2009 (in thousands).
| For the years ended December 31, |
|||||||||||
| 2009 | 2008 | 2007 | |||||||||
| Cash surrender value of life insurance income |
$ | — | $ | — | $ | 901 | |||||
| 401(k) error contribution expense |
— | — | (1,583 | ) | |||||||
| Pension income (expense) |
(749 | ) | 603 | (652 | ) | ||||||
| $ | (749 | ) | $ | 603 | $ | (1,334 | ) | ||||
We use split-dollar life insurance arrangements to provide retirement and death benefits to key employees. The amount that could be realized under the insurance contract is reported as an asset. Prior to 2008, we recorded the amount that could be realized under the insurance contract as expense in the Consolidated Statement of Income (Loss). During 2007, we recorded cash surrender value of approximately $900 thousand in the Other assets financial statement line item on the Consolidated Balance Sheets with an offsetting entry to income (as these amounts had been expensed since the agreements’ inception) with regard to these policies.
During 2007, in conjunction with the audit of our 401(k) Plan, an administrative error was discovered that had resulted in participants being denied the opportunity to fully defer the appropriate amount of compensation under the plan. During the third and fourth quarters of 2007, we calculated and accrued the denied deferral amount and the resulting employer match, including missed earnings, totaling $1.6 million through December 31, 2007. These amounts were recorded within the Salaries and other personnel expense financial statement line item of the Consolidated Statements of Income (Loss) for the year ended December 31, 2007.
During the fourth quarter of 2007, we notified employees that, effective 2008, we would cease accruing pension benefits for employees with regard to our noncontributory, defined benefit pension plan. Although no previously accrued benefits were lost, employees can no longer accrue benefits for service subsequent to 2007. See Item 8. Financial Statements and Supplementary Data, Note 13 for discussion regarding the expense components for our defined benefit pension plan, at and for the periods indicated.
Occupancy. Occupancy expense increased $1.0 million, or 30.4%, for the year ended December 31, 2009 over 2008 primarily as a result of the impact of the new corporate headquarters. Occupancy expense for the year ended December 31, 2009 included 9.5 monthly payments under the lease agreement for the new headquarters. This increase was offset by the impact of expenses associated with banking offices previously consolidated or relocated that have not yet been subleased or sold no longer being recorded within this financial statement line item but rather being recorded as a branch closure expense within the Other noninterest expense financial statement line item of the Consolidated Statements of Income (Loss).
93
Table of Contents
Loss on Disposition of Premises, Furniture, and Equipment. We booked a loss on disposition of premises, furniture and equipment for the year ended December 31, 2009 primarily associated with the write off of the temporary downtown Greenville banking office. During the year ended December 31, 2007, we wrote off $346 thousand in leasehold improvements and equipment in conjunction with the demolition of our previous downtown Greenville banking office.
FDIC Deposit Insurance Assessment. FDIC insurance premiums increased $2.5 million during the year ended December 31, 2009 over 2008 due to the FDIC’s industry-wide special assessment and due to higher general assessment rates during the year ended December 31, 2009 compared with the year ended December 31, 2008. The increase in the general assessment was the result of a change in the FDIC assessment matrix, the increase in our deposit base on which the assessment is calculated over the periods presented and an increase due to our total risk-based capital ratio falling into the adequately-capitalized category during the year. As a result of these factors, our general assessment during the year ended December 31, 2009 was $1.8 million higher than that of the year ended 2008. Also, during 2008, we fully utilized one-time assessment credits from 2006.
Also during the year ended December 31, 2009, we paid an incremental $682 thousand of increased FDIC premiums due to the industry-wide special assessment by the FDIC to bolster the FDIC insurance fund. The FDIC imposed a 5 basis point special assessment on assets less Tier 1 capital with a cap of 10 basis points times deposits. This incremental special assessment was paid to the FDIC at the end of the third quarter of 2009.
In September 2009, the FDIC adopted a Notice of Proposed Rulemaking to require insured financial institutions to prepay their estimated quarterly risk-based assessments for the fourth quarter of 2009 and for 2010, 2011 and 2012. Unlike special assessments, prepaid assessments will not immediately impact earnings. We applied for and received an exemption to the prepayment assessment. The FDIC Board of Directors also voted to adopt a uniform three-basis point increase in assessment rates effective on January 1, 2011.
Mortgage-servicing Rights Portfolio Amortization and Impairment. Amortization and impairment of the mortgage-servicing rights portfolio increased $390 thousand, or 44.3%, over the years presented. During 2007 and 2008, the Federal Reserve decreased rates by 500 to 525 basis points. This decline in interest rates has resulted in an increase in loan prepayments and, therefore, has increased amortization within the mortgage-servicing rights portfolio.
Marketing. Marketing expense decreased $462 thousand, or 29.3%, over the years presented primarily due to a concerted effort to reduce discretionary expenditures.
Real Estate Acquired in Settlement of Loans Writedowns and Expenses. Real estate acquired in settlement of loans writedowns and expenses increased $2.7 million from 2008 to 2009 primarily due to the receipt of an updated third party appraisal in 2009 on one particular property which resulted in a writedown of $1.3 million. Additional writedowns are charged against income, if necessary, as a result of regular reviews of fair value of real estate acquired in settlement of loan properties. Of the total subsequent writedowns recorded in 2009, 71% related to two properties.
Other. Other noninterest expense increased by $2.0 million, or 21.2%, to $11.2 million during the year ended December 31, 2009 from $9.2 million during the year ended December 31, 2008. In large part, this increase was the result of increased credit-related costs and expenses associated with the execution of the Strategic Project Plan and problem loan resolution consulting assistance.
In addition, branch closure expenses increased $467 thousand for the year ended December 31, 2009 over the year ended December 31, 2008 due to expenses associated with banking offices previously consolidated or relocated that have not yet been subleased or sold.
Based on our other-than-temporary impairment analysis as of December 31, 2009, we concluded that one security had other-than-temporary impairment, related to credit losses, of $49 thousand during 2009.
94
Table of Contents
Also included within this financial statement line item is the 2009 provision for unfunded commitments of $128 thousand.
Provision (Benefit) for Income Taxes
As a result of our pretax net loss of approximately $62.2 million for the year ended December 31, 2009, we recognized an income tax benefit of approximately $22.1 million for the period. During the year ended December 31, 2008, we recognized income tax expense of $7.5 million on pretax net income of $21.1 million. Our effective tax rate was 35.6% for the year ended December 31, 2009 and 35.4% for the year ended December 31, 2008.
Deferred tax assets represent the future tax benefit of deductible differences. If it is more likely than not that a deferred tax asset will not be realized, a valuation allowance is required to reduce the recorded value to net realizable value. During 2009, the Internal Revenue Service extended the net operating loss carryback period from two years to five years. As of December 31, 2009, management’s analysis concluded that it is more likely than not that all of our net deferred income tax assets will be realizable based on available net operating loss carrybacks refundable from income taxes previously paid. As a result, no valuation allowance was recorded at December 31, 2009. In future periods, the realization of our deferred tax assets may also depend on the existence of sufficient taxable income available under tax law, including future reversals of existing temporary differences, future taxable income exclusive of reversing differences, taxable income in prior carryback years, projections of taxable income in future years, and tax planning strategies. The Company has carryback capacity in 2010 to recapture $7.9 million of taxes paid in 2008.
Most of the $5.2 million increase in the net deferred asset during 2009 relates to the change in the allowance for loan losses. For federal income tax purposes, no deduction is allowed for the Company’s provision for loan losses in excess of net loan charge-offs. Consequently, the increase in the allowance for loan losses during 2009 resulted in a $4.6 million increase in the net deferred tax asset with a corresponding increase in income tax benefit.
Recently Issued/Adopted Accounting Pronouncements
See Item 8. Financial Statements and Supplementary Data, Note 1 for a discussion regarding recently issued and recently adopted accounting pronouncements and their expected impact on our business, financial condition, results of operations, and cash flows.
Impact of Inflation and Changing Prices
The Consolidated Financial Statements contained in Item 8 of this document and related data have been prepared in accordance with GAAP which require the measurement of financial position and operating results in terms of historical dollars, without considering changes in the relative purchasing power of money over time because of inflation.
Unlike most industrial companies, virtually all of the assets and liabilities of a financial institution are monetary. As a result, interest rates have a more significant impact on a financial institution’s performance than the impact of general levels of inflation. Interest rates do not necessarily move in the same direction or in the same magnitude as the price of goods and services since such prices are impacted by inflation. We are committed to continuing to actively manage the gap between our interest-sensitive assets and interest-sensitive liabilities.
95
Table of Contents
ITEM 7A. QUANTITATIVE AND QUALITATIVE DISCLOSURES ABOUT MARKET RISK
Market risk refers to the risk of loss arising from adverse changes in interest rates, foreign currency exchange rates, commodity prices, and other relevant market rates and prices such as equity prices. Due to the nature of our operations, we are primarily exposed to interest rate risk and liquidity risk.
Interest rate risk within our Consolidated Balance Sheets consists of reprice, option, and basis risks. Reprice risk results from differences in the maturity, or repricing, of asset and liability portfolios. Option risk arises from “embedded options” present in many financial instruments, such as loan prepayment options, deposit early withdrawal options, and interest rate options. These options allow customers opportunities to benefit when market interest rates change, which typically results in higher expense or lower income for us. Basis risk refers to the potential for changes in the underlying relationship between market rates and indices, which subsequently result in a narrowing of the profit spread on an interest-earning asset or interest-bearing liability. Basis risk is also present in administered rate liabilities, such as savings accounts, negotiable order of withdrawal accounts, and money market accounts with respect to which historical pricing relationships to market rates may change due to the level or directional change in market interest rates.
We seek to avoid fluctuations in our net interest margin and to maximize net interest income within acceptable levels of risk through periods of changing interest rates. Accordingly, our Asset and Liability Committee monitors our interest rate sensitivity and liquidity on an ongoing basis. Our Asset and Liability Committee oversees market risk management and establishes risk measures, limits, and policy guidelines for managing the amount of interest rate risk and its impact on net interest income and capital. The committee uses a variety of measures to gain a comprehensive view of the magnitude of interest rate risk, the distribution of risk, the level of risk over time, and the exposure to changes in certain interest rate relationships.
We utilize a simulation model as the primary quantitative tool in measuring the amount of interest rate risk associated with changing market rates. The model measures the impact on net interest income relative to a base case scenario of hypothetical fluctuations in interest rates over the coming 12 month period. These simulations incorporate assumptions regarding balance sheet growth and mix, pricing, and the repricing and maturity characteristics of the existing and projected Consolidated Balance Sheet. Other interest rate related risks, such as prepayment, basis, and option risk, are also considered in the model.
The Asset and Liability Committee continuously monitors and manages the balance between interest rate-sensitive assets and liabilities. The objective is to manage the impact of fluctuating market rates on net interest income within acceptable levels. In order to meet this objective and mitigate potential market risk, management may lengthen or shorten the duration of assets or liabilities.
The following table summarizes, as of December 31, 2009, the forecasted impact on net interest income using a base case scenario given upward and downward movement in interest rates of 100 basis points and 200 basis points based on forecasted assumptions of nominal interest rates and deposit and loan repricing rates. Estimates are based on historical interest rate cycles and other factors deemed to be relevant. However, underlying assumptions may be impacted in future periods which were not known to management at the time of the issuance of the Consolidated Financial Statements. Therefore, management’s assumptions may or may not prove valid. No assurance can be given that changing economic conditions and other relevant factors impacting our net interest income will not cause actual occurrences to differ from underlying assumptions.
| Interest rate scenario (1) |
Percentage change in net interest income from base |
||
| Up 200 basis points |
(0.30 | )% | |
| Up 100 basis points |
(0.13 | ) | |
| Down 100 basis points |
2.14 | ||
| Down 200 basis points |
3.00 |
| (1) | The rising and falling 100 and 200 basis point interest rate scenarios assume a gradual change in interest rates along the entire yield curve over a twelve month time frame. |
96
Table of Contents
There are material limitations with the model presented above, which include, but are not limited to:
| • | The model presents the balance sheet in a static position. However, when assets and liabilities mature or reprice, they do not necessarily keep the same characteristics. |
| • | The computation of prospective impacts of hypothetical interest rate changes are based on numerous assumptions and should not be relied upon as indicative of actual results. |
| • | The computations do not contemplate any additional actions we could undertake in response to changes in interest rates. |
97
Table of Contents
ITEM 8. FINANCIAL STATEMENTS AND SUPPLEMENTARY DATA
MANAGEMENT’S REPORT ON INTERNAL CONTROL OVER FINANCIAL REPORTING
Management of Palmetto Bancshares, Inc. is responsible for establishing and maintaining adequate internal control over financial reporting as defined in Rule 13a-15(f) of the Securities Exchange Act of 1934 as amended (the Exchange Act). The Corporation’s internal control over financial reporting is a process designed to provide reasonable assurance regarding the reliability of financial reporting and the preparation of financial statements for external purposes in accordance with accounting principles generally accepted in the United States of America. The Company’s internal control over financial reporting includes those policies and procedures that (1) pertain to the maintenance of records, that in reasonable detail, accurately and fairly reflect the transactions and disposition of the Company’s assets; (2) provide reasonable assurance that transactions are recorded as necessary to permit the preparation of the financial statements in accordance with generally accepted accounting principles and that receipts and expenditures of the Company are being made only in accordance with the authorizations of the Company’s management and directors; and (3) provide reasonable assurance regarding prevention or timely detection of unauthorized acquisition, use or disposition of the Company’s assets that could have a material impact on the financial statements.
Because of its inherent limitations, internal control over financial reporting may not prevent or detect misstatements. Also, projections of any evaluation of effectiveness to future periods are subject to the risk that controls may become inadequate due to changes in conditions, or that the degree of compliance with the policies and procedures may deteriorate.
Management conducted an evaluation of the effectiveness of the internal control over financial reporting based on the framework in “Internal Control—Integrated Framework” promulgated by the Committee of Sponsoring Organizations of the Treadway Commission (“COSO”). Based on this evaluation under the COSO criteria, management concluded that the internal control over financial reporting was effective as of December 31, 2009.
The effectiveness of the internal control structure over financial reporting as of December 31, 2009 has been audited by Elliott Davis, LLC, an independent registered public accounting firm, as stated in their report included in this Annual Report on Form 10-K, which expresses an unqualified opinion on the effectiveness of the Company’s internal control over financial reporting as of December 31, 2009.

|

| |
| Samuel L. Erwin | Lauren S. Greer | |
| President and Chief Executive Officer Palmetto Bancshares, Inc. |
Chief Financial Officer The Palmetto Bank |
98
Table of Contents
Report of Independent Registered Public Accounting Firm
To the Board of Directors and Shareholders
Palmetto Bancshares, Inc.
Greenville, South Carolina
We have audited the accompanying consolidated balance sheets of Palmetto Bancshares, Inc. and Subsidiary (the “Company”) as of December 31, 2009 and 2008, and the related consolidated statements of income (loss), shareholders’ equity and comprehensive income (loss) and cash flows for each of the three years in the period ended December 31, 2009. These consolidated financial statements are the responsibility of the Company’s management. Our responsibility is to express an opinion on these consolidated financial statements based on our audits.
We conducted our audits in accordance with the standards of the Public Company Accounting Oversight Board (United States). Those standards require that we plan and perform the audit to obtain reasonable assurance about whether the financial statements are free of material misstatement. An audit includes examining, on a test basis, evidence supporting the amounts and disclosures in the financial statements. An audit also includes assessing the accounting principles used and significant estimates made by management, as well as evaluating the overall financial statement presentation. We believe that our audits provide a reasonable basis for our opinion.
In our opinion, the consolidated financial statements referred to above present fairly, in all material respects, the financial position of Palmetto Bancshares, Inc. and Subsidiary as of December 31, 2009 and 2008, and the results of their operations and their cash flows for each of the three years in the period ended December 31, 2009, in conformity with U.S. generally accepted accounting principles.
We have also audited, in accordance with the standards of the Public Company Accounting Oversight Board (United States), the Company’s internal control over financial reporting as of December 31, 2009, based on criteria established in Internal Control — Integrated Framework issued by the Committee of Sponsoring Organizations of the Treadway Commission, and our report dated February 26, 2010 expressed an unqualified opinion on the effectiveness of Palmetto Bancshares, Inc. and Subsidiary’s internal control over financial reporting.

Greenville, South Carolina
February 26, 2010
99
Table of Contents
REPORT OF INDEPENDENT REGISTERED PUBLIC ACCOUNTING FIRM
To the Board of Directors and Shareholders
Palmetto Bancshares, Inc.
Greenville, South Carolina
We have audited the internal control over financial reporting of Palmetto Bancshares, Inc. and Subsidiary (the “Company”) as of December 31, 2009, based on criteria established in Internal Control — Integrated Framework issued by the Committee of Sponsoring Organizations of the Treadway Commission (the “COSO criteria”). The Company’s management is responsible for maintaining effective internal control over financial reporting and for its assessment of the effectiveness of internal control over financial reporting included in the accompanying Management’s Report on Internal Control over Financial Reporting. Our responsibility is to express an opinion on the effectiveness of the Company’s internal control over financial reporting based on our audit.
We conducted our audit in accordance with the standards of the Public Company Accounting Oversight Board (United States). Those standards require that we plan and perform the audit to obtain reasonable assurance about whether effective internal control over financial reporting was maintained in all material respects. Our audit included obtaining an understanding of internal control over financial reporting, assessing the risk that a material weakness exists and testing and evaluating the design and operating effectiveness of internal control based on the assessed risk. Our audit also included performing such other procedures as we considered necessary in the circumstances. We believe that our audit provides a reasonable basis for our opinion.
A company’s internal control over financial reporting is a process designed to provide reasonable assurance regarding the reliability of financial reporting and the preparation of financial statements for external purposes in accordance with generally accepted accounting principles. A company’s internal control over financial reporting includes those policies and procedures that (a) pertain to the maintenance of records that, in reasonable detail, accurately and fairly reflect the transactions and dispositions of the assets of the company; (b) provide reasonable assurance that transactions are recorded as necessary to permit preparation of financial statements in accordance with generally accepted accounting principles, and that receipts and expenditures of the company are being made only in accordance with authorizations of management and directors of the company; and (c) provide reasonable assurance regarding prevention or timely detection of unauthorized acquisition, use, or disposition of the company’s assets that could have a material effect on the financial statements.
Because of its inherent limitations, internal control over financial reporting may not prevent or detect misstatements. Also, projections of any evaluation of effectiveness to future periods are subject to the risk that controls may become inadequate because of changes in conditions, or that the degree of compliance with the policies or procedures may deteriorate.
In our opinion, the Company maintained, in all material respects, effective internal control over financial reporting as of December 31, 2009, based on the COSO criteria.
We have also audited, in accordance with the standards of the Public Company Accounting Oversight Board (United States), the consolidated balance sheets of the Company as of December 31, 2009 and 2008 and the related consolidated statements of income (loss), shareholders’ equity and comprehensive income (loss), and cash flows for each of the three years in the period ended December 31, 2009 and our report dated February 26, 2010 expressed an unqualified opinion thereon.
Greenville, South Carolina
February 26, 2010
100
Table of Contents
PALMETTO BANCSHARES, INC. AND SUBSIDIARY
Consolidated Balance Sheets
(dollars in thousands, except per share data)
| December 31, | ||||||||
| 2009 | 2008 | |||||||
| Assets |
||||||||
| Cash and cash equivalents |
||||||||
| Cash and due from banks |
$ | 188,084 | $ | 29,305 | ||||
| Total cash and cash equivalents |
188,084 | 29,305 | ||||||
| FHLB stock, at cost |
7,010 | 6,566 | ||||||
| Investment securities available for sale, at fair value |
119,986 | 125,596 | ||||||
| Mortgage loans held for sale |
3,884 | 7,415 | ||||||
| Loans, gross |
1,040,312 | 1,158,480 | ||||||
| Less: allowance for loan losses |
(24,079 | ) | (11,000 | ) | ||||
| Loans, net |
1,016,233 | 1,147,480 | ||||||
| Premises and equipment, net |
29,605 | 26,347 | ||||||
| Premises held for sale |
— | 1,651 | ||||||
| Goodwill, net |
3,691 | 3,691 | ||||||
| Accrued interest receivable |
4,322 | 5,466 | ||||||
| Real estate acquired in settlement of loans |
27,826 | 6,719 | ||||||
| Income tax refund receivable |
20,869 | — | ||||||
| Other |
14,440 | 12,039 | ||||||
| Total assets |
$ | 1,435,950 | $ | 1,372,275 | ||||
| Liabilities and shareholders’ equity |
||||||||
| Liabilities |
||||||||
| Deposits |
||||||||
| Noninterest-bearing |
$ | 142,609 | $ | 134,465 | ||||
| Interest-bearing |
1,072,305 | 937,031 | ||||||
| Total deposits |
1,214,914 | 1,071,496 | ||||||
| Retail repurchase agreements |
15,545 | 16,357 | ||||||
| Commercial paper (Master notes) |
19,061 | 27,955 | ||||||
| Other short-term borrowings |
— | 79,785 | ||||||
| Long-term borrowings |
101,000 | 52,000 | ||||||
| Accrued interest payable |
2,037 | 1,857 | ||||||
| Other |
8,378 | 7,049 | ||||||
| Total liabilities |
1,360,935 | 1,256,499 | ||||||
| Commitments and contingencies (Note 16) |
||||||||
| Shareholders’ equity |
||||||||
| Common stock—par value $5.00 per share; authorized 25,000,000 and 10,000,000 shares at December 31, 2009 and December 31, 2008, respectively; issued and outstanding 6,495,130 and 6,446,090 at December 31, 2009 and December 31, 2008, respectively |
32,282 | 32,230 | ||||||
| Capital surplus |
2,599 | 2,095 | ||||||
| Retained earnings |
47,094 | 87,568 | ||||||
| Accumulated other comprehensive loss, net of tax |
(6,960 | ) | (6,117 | ) | ||||
| Total shareholders’ equity |
75,015 | 115,776 | ||||||
| Total liabilities and shareholders’ equity |
$ | 1,435,950 | $ | 1,372,275 | ||||
See Notes to Consolidated Financial Statements
101
Table of Contents
PALMETTO BANCSHARES, INC. AND SUBSIDIARY
Consolidated Statements of Income (Loss)
(dollars in thousands, except per share data)
| For the years ended December 31, | |||||||||||
| 2009 | 2008 | 2007 | |||||||||
| Interest income |
|||||||||||
| Interest earned on cash and cash equivalents |
$ | 215 | $ | 106 | $ | 678 | |||||
| Dividends paid on FHLB stock |
19 | 189 | 155 | ||||||||
| Interest earned on investment securities available for sale |
|||||||||||
| U.S. Treasury and federal agencies (taxable) |
8 | 235 | 1,390 | ||||||||
| State and municipal (nontaxable) |
1,640 | 1,806 | 1,800 | ||||||||
| Collateralized mortgage obligations (taxable) |
3,069 | 2,877 | — | ||||||||
| Other mortgage-backed (taxable) |
950 | 1,092 | 1,202 | ||||||||
| Interest and fees earned on loans |
60,309 | 71,940 | 78,326 | ||||||||
| Total interest income |
66,210 | 78,245 | 83,551 | ||||||||
| Interest expense |
|||||||||||
| Interest paid on deposits |
19,511 | 23,694 | 30,232 | ||||||||
| Interest paid on retail repurchase agreements |
58 | 247 | 539 | ||||||||
| Interest paid on commercial paper |
60 | 359 | 1,110 | ||||||||
| Interest paid on other short-term borrowings |
90 | 1,108 | 704 | ||||||||
| Interest paid on long-term borrowings |
1,720 | 1,198 | 173 | ||||||||
| Total interest expense |
21,439 | 26,606 | 32,758 | ||||||||
| Net interest income |
44,771 | 51,639 | 50,793 | ||||||||
| Provision for loan losses |
73,400 | 5,619 | 988 | ||||||||
| Net interest income (loss) after provision for loan losses |
(28,629 | ) | 46,020 | 49,805 | |||||||
| Noninterest income |
|||||||||||
| Service charges on deposit accounts, net |
8,275 | 8,596 | 8,050 | ||||||||
| Fees for trust and investment management and brokerage services |
2,275 | 2,996 | 3,115 | ||||||||
| Mortgage-banking |
3,174 | 2,145 | 1,797 | ||||||||
| Automatic teller machine |
1,389 | 1,234 | 1,049 | ||||||||
| Investment securities gains |
2 | 1 | — | ||||||||
| Other |
3,587 | 3,926 | 3,368 | ||||||||
| Total noninterest income |
18,702 | 18,898 | 17,379 | ||||||||
| Noninterest expense |
|||||||||||
| Salaries and other personnel |
24,463 | 23,774 | 25,850 | ||||||||
| Occupancy |
4,293 | 3,293 | 2,969 | ||||||||
| Furniture and equipment |
3,407 | 3,823 | 3,685 | ||||||||
| Loss (gain) on disposition of premises, furniture, and equipment |
81 | (2 | ) | 346 | |||||||
| FDIC deposit insurance assessment |
3,261 | 786 | 179 | ||||||||
| Mortgage-servicing rights portfolio amortization and impairment |
1,271 | 881 | 511 | ||||||||
| Marketing |
1,114 | 1,576 | 1,410 | ||||||||
| Real estate acquired in settlement of loans writedowns and expenses |
3,233 | 516 | 164 | ||||||||
| Other |
11,163 | 9,208 | 7,656 | ||||||||
| Total noninterest expense |
52,286 | 43,855 | 42,770 | ||||||||
| Net income (loss) before provision (benefit) for income taxes |
(62,213 | ) | 21,063 | 24,414 | |||||||
| Provision (benefit) for income taxes |
(22,128 | ) | 7,464 | 8,399 | |||||||
| Net income (loss) |
$ | (40,085 | ) | $ | 13,599 | $ | 16,015 | ||||
| Common and per share data |
|||||||||||
| Net income (loss)—basic |
$ | (6.21 | ) | $ | 2.11 | $ | 2.51 | ||||
| Net income (loss)—diluted |
(6.21 | ) | 2.09 | 2.47 | |||||||
| Cash dividends |
0.06 | 0.80 | 0.77 | ||||||||
| Book value |
11.55 | 17.96 | 17.17 | ||||||||
| Weighted average common shares outstanding—basic |
6,449,754 | 6,438,071 | 6,390,858 | ||||||||
| Weighted average common shares outstanding—diluted |
6,449,754 | 6,519,849 | 6,477,663 | ||||||||
See Notes to Consolidated Financial Statements
102
Table of Contents
PALMETTO BANCSHARES, INC. AND SUBSIDIARY
Consolidated Statements of Changes in Shareholders’ Equity and Comprehensive Income (Loss)
(dollars in thousands, except per share data)
| Shares of common stock |
Common stock |
Capital surplus |
Retained earnings |
Accumulated other comprehensive income (loss), net |
Total | |||||||||||||||
| Balance at December 31, 2006 |
6,367,450 | $ | 31,837 | $ | 1,102 | $ | 68,132 | $ | (695 | ) | $ | 100,376 | ||||||||
| Net income |
16,015 | 16,015 | ||||||||||||||||||
| Other comprehensive income (loss), net of tax |
||||||||||||||||||||
| Investment securities available for sale |
||||||||||||||||||||
| Change in unrealized position during the period, net of tax impact of $277 |
443 | 443 | ||||||||||||||||||
| Defined benefit pension plan |
||||||||||||||||||||
| Impact of adoption of FASB ASC 715, net of tax impact of $2,218 |
(4,116 | ) | ||||||||||||||||||
| Impact of defined benefit pension plan curtailment, net of tax impact of $878 |
1,630 | |||||||||||||||||||
| Net unrealized loss relating to the defined benefit pension plan |
(2,486 | ) | ||||||||||||||||||
| Comprehensive income |
13,972 | |||||||||||||||||||
| Cash dividend declared and paid ($0.77 per share) |
(4,926 | ) | (4,926 | ) | ||||||||||||||||
| Compensation expense related to stock option plan |
132 | 132 | ||||||||||||||||||
| Common stock issued pursuant to stock option plan |
54,315 | 272 | 430 | 702 | ||||||||||||||||
| Balance at December 31, 2007 |
6,421,765 | $ | 32,109 | $ | 1,664 | $ | 79,221 | $ | (2,738 | ) | $ | 110,256 | ||||||||
| Net income |
13,599 | 13,599 | ||||||||||||||||||
| Other comprehensive income (loss), net of tax |
||||||||||||||||||||
| Investment securities available for sale |
||||||||||||||||||||
| Change in unrealized position during the period, net of tax impact of $832 |
(1,368 | ) | ||||||||||||||||||
| Reclassification adjustment included in net income, net of tax impact of $0 |
(1 | ) | ||||||||||||||||||
| Net unrealized loss on investment securities available for sale |
(1,369 | ) | ||||||||||||||||||
| Defined benefit pension plan |
||||||||||||||||||||
| Impact of adoption of FASB ASC 715, net of tax impact of $1,082 |
(2,010 | ) | (2,010 | ) | ||||||||||||||||
| Comprehensive income |
10,220 | |||||||||||||||||||
| Cumulative effect of adoption of new accounting standard (see Note 13) |
(99 | ) | (99 | ) | ||||||||||||||||
| Cash dividend declared and paid ($0.80 per share) |
(5,153 | ) | (5,153 | ) | ||||||||||||||||
| Compensation expense related to stock option plan |
94 | 94 | ||||||||||||||||||
| Excess tax benefit from equity based awards |
78 | 78 | ||||||||||||||||||
| Common stock issued pursuant to stock option plan |
24,325 | 121 | 259 | 380 | ||||||||||||||||
| Balance at December 31, 2008 |
6,446,090 | $ | 32,230 | $ | 2,095 | $ | 87,568 | $ | (6,117 | ) | $ | 115,776 | ||||||||
| Net loss |
(40,085 | ) | (40,085 | ) | ||||||||||||||||
| Other comprehensive loss, net of tax |
||||||||||||||||||||
| Investment securities available for sale |
||||||||||||||||||||
| Change in unrealized position during the period, net of tax impact of $1,179 |
1,928 | |||||||||||||||||||
| Reclassification adjustment included in net income, net of tax impact of $1 |
(1 | ) | ||||||||||||||||||
| Net unrealized gain on investment securities available for sale |
1,927 | |||||||||||||||||||
| Defined benefit pension plan |
||||||||||||||||||||
| Impact of adoption of FASB ASC 715, net of tax impact of $1,491 |
(2,770 | ) | (2,770 | ) | ||||||||||||||||
| Comprehensive loss |
(40,928 | ) | ||||||||||||||||||
| Cash dividend declared and paid ($0.06 per share) |
(389 | ) | (389 | ) | ||||||||||||||||
| Compensation expense related to stock option plan |
64 | 64 | ||||||||||||||||||
| Excess tax benefit from equity based awards |
133 | 133 | ||||||||||||||||||
| Common stock issued pursuant to stock option plan |
4,000 | 20 | 86 | 106 | ||||||||||||||||
| Common stock issued pursuant to restricted stock plan |
45,040 | 32 | 221 | 253 | ||||||||||||||||
| Balance at December 31, 2009 |
6,495,130 | $ | 32,282 | $ | 2,599 | $ | 47,094 | $ | (6,960 | ) | $ | 75,015 | ||||||||
See Notes to Consolidated Financial Statements
103
Table of Contents
PALMETTO BANCSHARES, INC. AND SUBSIDIARY
Consolidated Statements of Cash Flows
(in thousands)
| For the years ended December 31, | ||||||||||||
| 2009 | 2008 | 2007 | ||||||||||
| Operating activities |
||||||||||||
| Net income (loss) |
$ | (40,085 | ) | $ | 13,599 | $ | 16,015 | |||||
| Adjustments to reconcile net income (loss) to net cash provided by operating activities |
||||||||||||
| Depreciation |
2,157 | 1,972 | 1,950 | |||||||||
| Loss on dispositions of premises held for sale |
8 | — | — | |||||||||
| Amortization of unearned discounts/premiums on investment securities available for sale, net |
45 | 13 | 248 | |||||||||
| Investment securities available for sale gains |
(2 | ) | (1 | ) | — | |||||||
| Investment securities available for sale other-than-temporary impairment |
49 | — | — | |||||||||
| Provision for loan losses |
73,400 | 5,619 | 988 | |||||||||
| Originations of mortgage loans held for sale |
(146,018 | ) | (78,962 | ) | (60,876 | ) | ||||||
| Proceeds from sale of mortgage loans held for sale |
151,277 | 77,701 | 67,665 | |||||||||
| Gains on sales of mortgage loans held for sale, net |
(1,728 | ) | (994 | ) | (796 | ) | ||||||
| Writedowns and losses on sales of real estate acquired in settlement of loans |
2,760 | 168 | 180 | |||||||||
| Compensation expense related to stock options granted |
64 | 94 | 132 | |||||||||
| Deferred income tax (benefit) expense |
(4,878 | ) | (1,320 | ) | 3,074 | |||||||
| Income tax benefits from exercises of nonqualified stock options in excess of amount previously provided |
133 | 78 | — | |||||||||
| (Increase) decrease in interest receivable and other assets, net |
(21,121 | ) | 1,559 | (1,989 | ) | |||||||
| Increase (decrease) in accrued interest payable and other liabilities, net |
1,435 | (2,136 | ) | 480 | ||||||||
| Net cash provided by operating activities |
17,496 | 17,390 | 27,071 | |||||||||
| Investing activities |
||||||||||||
| Proceeds from maturities, calls, and repayments of investment securities available for sale |
26,402 | 34,441 | 45,303 | |||||||||
| Purchases of investment securities available for sale |
(17,779 | ) | (66,537 | ) | (23,979 | ) | ||||||
| Purchases of FHLB stock |
(2,447 | ) | (5,029 | ) | (1,170 | ) | ||||||
| Redemptions of FHLB stock |
2,003 | 1,080 | 1,152 | |||||||||
| Decrease (increase) in loans, net |
33,219 | (118,680 | ) | (120,312 | ) | |||||||
| Proceeds on sale of real estate acquired in settlement of loans |
760 | 3,634 | 2,707 | |||||||||
| Proceeds on sale of premises held for sale |
1,643 | — | — | |||||||||
| Purchases of premises and equipment, net |
(5,415 | ) | (4,837 | ) | (2,589 | ) | ||||||
| Net cash provided by (used in) investing activities |
38,386 | (155,928 | ) | (98,888 | ) | |||||||
| Financing activities |
||||||||||||
| (Decrease) increase in transaction, money market, and savings deposit accounts, net |
(19,865 | ) | (47,595 | ) | 62,141 | |||||||
| Increase in time deposit accounts, net |
163,283 | 59,488 | 3,275 | |||||||||
| (Decrease) increase in retail repurchase agreements, net |
(812 | ) | 5,077 | (3,147 | ) | |||||||
| (Decrease) increase in commercial paper, net |
(8,894 | ) | 1,629 | 5,338 | ||||||||
| (Decrease) increase in other short-term borrowings |
(79,785 | ) | 49,785 | 24,000 | ||||||||
| Proceeds from (repayments of) long-term borrowings |
49,000 | 52,000 | (10,000 | ) | ||||||||
| Proceeds from exercise of stock options |
359 | 380 | 702 | |||||||||
| Cash dividends paid on common stock |
(389 | ) | (5,153 | ) | (4,926 | ) | ||||||
| Net cash provided by financing activities |
102,897 | 115,611 | 77,383 | |||||||||
| Net increase (decrease) in cash and cash equivalents |
158,779 | (22,927 | ) | 5,566 | ||||||||
| Cash and cash equivalents, beginning of period |
29,305 | 52,232 | 46,666 | |||||||||
| Cash and cash equivalents, end of period |
$ | 188,084 | $ | 29,305 | $ | 52,232 | ||||||
| Supplemental cash flow disclosures |
||||||||||||
| Cash paid during the period for: |
||||||||||||
| Interest expense |
$ | 21,259 | $ | 26,791 | $ | 32,300 | ||||||
| Income taxes |
2,880 | 9,588 | 6,968 | |||||||||
| Significant noncash activities |
||||||||||||
| Net unrealized gain (loss) on investment securities available for sale, net of tax |
$ | 1,927 | $ | (1,369 | ) | $ | 443 | |||||
| Loans transferred to real estate acquired in settlement of loans, at fair value |
24,628 | 2,778 | 10,030 | |||||||||
| Premises reclassified as held for sale, at fair value |
— | 1,651 | — | |||||||||
| Net unrealized loss on pension plan assets, net of tax |
(2,770 | ) | (2,010 | ) | (2,486 | ) | ||||||
| Loans transferred from held for investment to held for sale |
— | 155 | 9,328 | |||||||||
See Notes to Consolidated Financial Statements
104
Table of Contents
PALMETTO BANCSHARES, INC. AND SUBSIDIARY
Notes To Consolidated Financial Statements
| 1. | Summary of Significant Accounting Policies |
Nature of Operations
The Company is a regional financial services bank holding company organized in 1982 under the laws of South Carolina currently headquartered in Greenville, South Carolina. The Company provides, through its Bank, a broad array of commercial banking, consumer banking, trust, investment management, and brokerage services throughout our market area primarily within northwest South Carolina.
Principles of Consolidation / Basis of Presentation
The accompanying Consolidated Financial Statements include the accounts of the Company, which includes our wholly-owned subsidiary, the Bank, and the Bank’s wholly-owned subsidiary, Palmetto Capital and other subsidiaries of the Bank. In management’s opinion, all significant intercompany accounts and transactions have been eliminated in consolidation, and all adjustments necessary for a fair presentation of the financial condition and results of operations for periods presented have been included. Any such adjustments are of a normal and recurring nature. Assets held by the Company or its subsidiary in a fiduciary or agency capacity for customers are not included in the Company’s Consolidated Financial Statements because those items do not represent assets of the Company or its subsidiary. The accounting and financial reporting policies of the Company conform, in all material respects, to accounting principles generally accepted in the United States of America and to general practices within the financial services industry.
FASB Accounting Standards Codification™ (“ASC”)
In June 2009, the FASB issued guidance which restructured GAAP and simplified access to all authoritative literature by providing a single source of authoritative nongovernmental GAAP. The guidance is presented in a topically organized structure referred to as the FASB ASC. The new structure was effective for interim or annual periods ending after September 15, 2009. All existing accounting standards have been superseded and all other accounting literature not included is considered nonauthoritative.
Business Segments
We adhere to the provisions of FASB ASC 280, Segment Reporting. Operating segments are components of an enterprise about which separate financial information is available that are evaluated regularly by the chief operating decision maker in deciding how to allocate resources and assess performance. FASB ASC 280 requires that a public enterprise report a measure of segment profit or loss, certain specific revenue and expense items for each segment, segment assets, and information about the way that the operating segments were determined, among other items.
We consider business segments by analyzing distinguishable components that are engaged in providing individual products, services, or groups of related products or services and that are subject to risks and returns that are different from those of other business segments. When determining whether products and services are related, we consider the nature of the products or services, the nature of the production processes, the type or class of customer for which the products or services are designed, and the methods used to distribute the products or provide the services.
The Bank offers mortgage-banking services. These services have similar production processes and are targeted to similar customers using similar distribution channels as those employed for the entire Bank loan portfolio. Additionally, decisions are not made by chief decision makers based on the results of these services
105
Table of Contents
PALMETTO BANCSHARES, INC. AND SUBSIDIARY
Notes To Consolidated Financial Statements—(Continued)
alone. Instead, decisions with regard to mortgage-banking services are typically made in conjunction with decisions made with regard to the entire loan portfolio. Therefore, we have concluded that mortgage-banking services do not represent an operating segment separate from the banking segment.
Additionally, the Bank and its subsidiary offer trust and investment management and brokerage services to customers through similar distribution channels utilized by the Bank. These services are not routinely evaluated separately from the Bank’s other services. At December 31, 2009, fees for such services represented approximately 3% of our total revenues. Based on these factors, trust and investment management and brokerage services do not represent an operating segment separate from the banking segment.
At December 31, 2009, we determined that we had one reportable operating segment, banking.
Use of Estimates
In preparing our Consolidated Financial Statements, the Company’s management makes estimates and assumptions that impact the reported amounts of assets and liabilities and the disclosure of contingent assets and liabilities as of the date of the Consolidated Financial Statements and for the years presented. Actual results could differ from these estimates and assumptions. Therefore, the results of operations for the year ended December 31, 2009 are not necessarily indicative of the results of operations that may be expected in future periods.
Reclassifications
Certain amounts previously presented in our Consolidated Financial Statements for prior periods have been reclassified to conform to current classifications. All such reclassifications had no impact on the prior periods’ net income (loss) or shareholders’ equity as previously reported.
Risk and Uncertainties
In the normal course of business, the Company encounters two significant types of risk: economic and regulatory. There are three main components of economic risk: credit risk, market risk, and concentration of credit risk. Credit risk is the risk of default on the Company’s loan portfolios that results from borrowers’ inability or unwillingness to make contractually required payments. Market risk includes primarily interest rate risk. The Company is exposed to interest rate risk to the degree that our interest-bearing liabilities mature or reprice at different speeds, or different bases, than our interest-earning assets. Market risk also reflects the risk of declines in the valuation of loans held for sale and in the value of the collateral underlying loans and the value of real estate held by the Company. Concentration of credit risk refers to the risk that, if the Company extends a significant portion of our total outstanding credit to borrowers in a specific geographical area or industry or on the security of a specific form of collateral, the Company may experience disproportionately high levels of default and losses if those borrowers, or the value of such type of collateral, is adversely impacted by economic or other factors that are particularly applicable to such borrowers or collateral. Concentration of credit risk is also similarly applicable to the investment securities portfolio.
The Bank is subject to the regulations of various government agencies. These regulations can and do change significantly from period to period. The Bank also undergoes periodic examinations by regulatory agencies, which may subject the Bank to changes with respect to asset valuations, amount of required allowance for loan loss, or operating restrictions.
The preparation of financial statements in conformity with GAAP requires management to make estimates and assumptions that affect the reported amounts of assets and liabilities and disclosure of contingent assets and liabilities at the date of the financial statements and the reported amounts of revenues and expenses during the reporting period. Actual results could differ from those estimates.
106
Table of Contents
PALMETTO BANCSHARES, INC. AND SUBSIDIARY
Notes To Consolidated Financial Statements—(Continued)
Subsequent Events
Subsequent events are events or transactions that occur after the balance sheet date but before financial statements are issued. Recognized subsequent events are events or transactions that provide additional evidence about conditions that existed at the date of the balance sheet, including the estimates inherent in the process of preparing financial statements. Nonrecognized subsequent events are events that provide evidence about conditions that did not exist at the date of the balance sheet but arose after that date. Management has reviewed events occurring through the date of this filing, and no subsequent events have occurred requiring accrual or disclosure in addition to that included herein.
Cash and Cash Equivalents
Cash and cash equivalents include cash, interest-bearing bank balances, and federal funds sold. Generally, both cash and cash equivalents have maturities of three months or less, and accordingly, the carrying amount of these instruments is deemed to be a reasonable estimate of fair value.
FHLB Stock
The FHLB System is under the jurisdiction of the Federal Housing Finance Board. The Bank, as a member of the FHLB, is required to acquire and hold shares of capital stock in the FHLB. A member’s FHLB capital stock requirement is an amount equal to the sum of a membership requirement and an activity-based requirement as described in the FHLB’s Capital Plan. No ready market exists for this stock, and it has no quoted market value. Redemptions are transacted each quarter to adjust our investment to the required amount. We have experienced no interruption in such redemptions. Historically, redemption of this stock has been at par value. The carrying value of FHLB stock approximates fair value. The carrying value of this stock was $7.0 million at December 31, 2009 and $6.6 million at December 31, 2008.
We do not anticipate any impairment charges associated with these instruments. According to the AICPA Audit Guide, FHLB stock does not have readily determinable fair value and the equity ownership rights are more limited than would be the case for a public company because of the Federal Housing Finance Agency’s (“FHFA”) oversight role in budgeting and approving dividends. FHLB stock is generally viewed as a long-term investment and as a restricted investment security. Thus, when evaluating FHLB stock for impairment, its value should be determined based on the ultimate recoverability of the par value rather than by recognizing temporary declines in value.
Under FHFA regulations, a Federal Home Loan Bank that fails to meet any regulatory capital requirement may not declare a dividend or redeem or repurchase capital stock in excess of what is required for members’ current loans. Moody’s Investors Service’s (Moody’s) current assessment of the FHLB’s portfolios indicates that the true economic losses embedded in these securities are significantly less than the accounting impairments would suggest and are manageable given the FHLB’s capital levels. According to Moody’s, the large difference between the expected economic losses and the mark-to-market impairment losses for accounting purposes is attributed to market illiquidity, deleveraging, and stress in the credit market in general. Furthermore, Moody’s believes that the FHLBs have the ability to hold the securities until maturity. The FHLBs have access to the U.S. Government-Sponsored Enterprise Credit Facility, a secured lending facility that serves as a liquidity backstop, substantially reducing the likelihood that the FHLBs would need to sell securities to raise liquidity and, thereby, cause the realization of large economic losses. In addition, the Federal Reserve has begun to purchase direct debt obligations of FHLMC, FNMA and the FHLBs. Moody’s has stated that their AAA senior debt rating and Prime-1 short-term debt rating are likely to remain unchanged based on expectations that the FHLBs have a very high degree of government support. Based on the above, we have determined there was no other-than-temporary impairment related to our FHLB stock investment as of December 31, 2009.
107
Table of Contents
PALMETTO BANCSHARES, INC. AND SUBSIDIARY
Notes To Consolidated Financial Statements—(Continued)
Investment Securities Available for Sale
We account for our investment securities in accordance with FASB ASC 320, Investments—Debt and Equity Securities. FASB ASC 320 addresses accounting and reporting requirements for investments in equity securities that have readily determinable fair values other than those accounted for under the equity method, those accounted for as investments in consolidated subsidiaries, and all investments in debt securities. Under this guidance, investments are classified into three categories. Held to maturity investment securities include debt securities that the owner has the intent and ability to hold until maturity and are reported at amortized cost. Trading investment securities include debt and equity securities that are bought and held for the purpose of sale in the near term and are reported at fair value with unrealized gains and losses included in income. Available for sale investment securities include debt and equity investment securities that, at the time of purchase, we determine may be sold at a future date or that we do not have the intent or ability to hold to maturity. Available for sale investment securities are reported at fair value with unrealized gains and losses excluded from income and reported as a separate component of shareholders’ equity, net of income taxes. An other-than-temporary impairment related to credit losses is recognized through earnings while any other-than-temporary impairment related to other factors is recognized in other comprehensive income. Realized gains or losses on available for sale investment securities are computed on a specific identification basis.
Fair value measurements of investment securities available for sale are based upon quoted prices, if available. If quoted prices are not available, fair values are measured using third party, pricing models, or other model-based valuation techniques, such as the present value of future cash flows, adjusted for the security’s credit rating, prepayment assumptions, and other factors such as credit loss assumptions. In the event that pricing occurs in an illiquid or abnormal market, pricing of assets of other relevant issuers of similarly structured securities where data is more readily available may be employed.
Management conducts other-than-temporary impairment analysis on a quarterly basis or more often if a potential loss-triggering event occurs. We recognize other-than-temporary impairment by evaluating separately other-than-temporarily impaired losses due to credit issues and losses related to all other factors. Other-than-temporary impairment exists when it is more likely than not that the security will mature or be sold before its amortized cost basis can be recovered. Additionally, in determining if there was evidence of credit deterioration, we evaluate the severity of decline in market value below cost, the period of time for which the decline in fair value has existed, and the financial condition and near-term prospects of the issuer, including any specific events which may influence the operations of the issuer.
We consider investment securities to be impaired on an other-than-temporary basis if it is probable that the issuer will be unable to make its contractual payments or if we no longer believe the security will recover within the estimated recovery period. For debt securities, we also consider the cause of the price decline such as the general level of interest rates and industry and issuer-specific factors, the issuer’s financial condition, near-term prospects and current ability to make future payments in a timely manner, the issuer’s ability to service debt, any change in agencies’ ratings at evaluation date from acquisition date and any likely imminent action, and for asset-backed securities, the credit performance of the underlying collateral, including delinquency rates, cumulative losses to date, and the remaining credit enhancement compared to expected credit losses. An other-than-temporary impairment related to credit losses is recognized through earnings while any other-than-temporary impairment related to other factors is recognized in other comprehensive income.
Unamortized premiums and discounts are recognized in interest income over the contractual life of the security using the interest method. As principal repayments are received on securities (primarily mortgage-backed securities) a pro-rata portion of the unamortized premium or discount is recognized in interest income. We discontinue accretion of unamortized discounts for investment securities that fall below investment grade.
108
Table of Contents
PALMETTO BANCSHARES, INC. AND SUBSIDIARY
Notes To Consolidated Financial Statements—(Continued)
Mortgage Loans Held for Sale
Residential mortgage loans originated with the intent of sale are reported at the lower of cost or estimated fair value on an aggregate loan basis. Net unrealized losses, if necessary, are provided for in a valuation allowance charged to income. Gains or losses realized on the sale of residential mortgage loans are recognized at the time of sale and are determined by the difference between the net sale proceeds and the carrying value of loans sold.
Mortgage-Servicing Rights Portfolio
We account for our mortgage-servicing rights portfolio in accordance with FASB ASC 860, Transfers and Servicing, which requires us to recognize a servicing asset or servicing liability each time we undertake an obligation to service a financial asset by entering into a servicing contract when the transfer of financial assets meets the requirements for sale accounting, when the servicer’s financial assets are transferred to a qualifying special-purpose entity in a guaranteed mortgage securitization in which the transferor retains all of the resulting securities and classifies them as either available-for-sale securities or trading securities in accordance with FASB ASC 320, or when a transfer occurs as a result of an acquisition or assumption of an obligation to service a financial asset that does not relate to financial assets of the servicer or its consolidated affiliates. This guidance requires all separately recognized servicing assets and servicing liabilities to be initially measured at fair value, if practicable, and permits an entity to choose either the amortization or fair value measurement method for each class of separately recognized servicing assets and servicing liabilities.
We determine the fair value of mortgage-servicing rights at the date of transfer using the present value of estimated future net servicing income, using assumptions that market participants use in their estimates of values. FASB ASC 860 also requires separate presentation of servicing assets and servicing liabilities subsequently measured at fair value in the Consolidated Balance Sheets and additional disclosures for all separately recognized servicing assets and servicing liabilities. Gain or loss on sale of loans depends on proceeds received and the previous carrying amount of the assets transferred and any interests the Company continues to hold, if any, based on relative fair value at the date of transfer. Our mortgage-servicing rights portfolio is included in the Other assets financial statement line item on the Consolidated Balance Sheets.
We utilize a third party consultant on a quarterly basis to assess our portfolio’s fair value including, but not limited to, capitalization, impairment, and amortization rates. The consultant estimates the amount and timing of prepayment rates, loan loss experience, costs to service loans, and discount rates to determine an estimate of the fair value of our mortgage-servicing rights portfolio. Management believes that the modeling-techniques and assumptions used by the consultant are reasonable. Amortization of the mortgage-servicing rights portfolio is based on the ratio of net servicing income received in the current period to total net servicing income projected to be realized from the mortgage-servicing rights portfolio. Projected net servicing income is determined based on the estimated future balance of the underlying mortgage loan portfolio that declines over time from prepayments and scheduled loan amortization. Future prepayment rates are estimated based on current interest rate levels, other economic conditions, market forecasts, and relevant characteristics of the mortgage-servicing rights portfolio, such as loan types, interest rate stratification, and recent prepayment experience. Impairment valuations are based on projections using a discounted cash flow method that includes assumptions regarding prepayments, interest rates, servicing costs, and other factors. Impairment is measured on a disaggregated basis for each stratum of the mortgage-servicing rights portfolio, which is segregated based on predominate risk characteristics, including interest rate and loan type. Subsequent increases in value are recognized by the Company to the extent of the impairment valuation allowance.
109
Table of Contents
PALMETTO BANCSHARES, INC. AND SUBSIDIARY
Notes To Consolidated Financial Statements—(Continued)
Loans
Loans are reported at their outstanding principal balances net of any unearned income, charge-offs, and unamortized deferred fees and costs on originated loans. Unearned income, deferred fees and costs, and discounts and premiums are amortized to income over the contractual life of the loan.
The accrual of interest is discontinued when, in the opinion of management, there is an indication that the borrower may be unable to meet future payments as they become due, generally when a loan becomes 90 days delinquent. The accrual of interest on some loans, however, may continue even after the loan becomes 90 days delinquent in special circumstances deemed appropriate by management. When interest accrual is discontinued, all unpaid accrued interest is reversed. While a loan is in nonaccrual status, cash received is applied to the principal balance. Loans are returned to accrual status when the loan is brought current and ultimate collectability of principal and interest is no longer in doubt.
In situations where, for economic or legal reasons related to a borrower’s financial difficulties, we grant a concession to the borrower that we would not otherwise consider, the related loan is classified as a troubled debt restructuring. The restructuring of a loan may include the transfer from the borrower to the Company of real estate, receivables from third parties, other assets, or an equity interest in the borrower in full or partial satisfaction of the loan, a modification of the loan terms, or a combination of the above.
In accordance with FASB ASC 310, Receivables, nonrefundable fees and certain direct costs associated with the origination of loans are deferred and recognized as a yield adjustment over the contractual life of the related loans, or if the related loan is held for resale, until the loan is sold. Recognition of deferred fees and costs is discontinued on nonaccrual loans until they return to accrual status or are charged-off.
Allowance for Loan Losses
The allowance for loan losses is a reserve established through a provision for loan losses charged to expense. The allowance for loan losses represents management’s best estimate of probable inherent losses that have been incurred within the existing portfolio of loans. The allowance for loan losses is necessary to reserve for estimated loan losses and risks inherent in the loan portfolio. The Company’s allowance for loan loss methodology is based on guidance provided in FASB ASC 310-10, Receivables-Overall, and includes allocations calculated in accordance with FASB ASC 310-40, Receivables-Troubled Debt Restructurings by Creditors, and allocations determined in accordance with FASB ASC 450, Contingencies. Accordingly, the methodology is based on historical loss experience by type of loans, specific homogeneous risk pools, and specific loss allocations. The provision for loan losses reflects loan quality trends, including the levels of and trends related to nonaccrual loans, potential problem loans, criticized loans, and net loans charged-off or recovered, among other factors.
The level of the allowance for loan losses reflects management’s continuing evaluation of specific lending risks, loan loss experience, current loan portfolio quality, present economic, political and regulatory conditions, and unidentified losses inherent in the current loan portfolio. Portions of the allowance for loan losses may be allocated for specific loans or loan portfolio segments. However, the entire allowance for loan losses is available for any loan that, in management’s judgment, should be charged-off. While management utilizes its best judgment and information available, the ultimate adequacy of the allowance for loan losses is dependent upon a variety of factors beyond our control, including the performance of our loan portfolio, the economy, changes in interest rates, and the view of the regulatory authorities toward loan classifications and collateral valuation.
110
Table of Contents
PALMETTO BANCSHARES, INC. AND SUBSIDIARY
Notes To Consolidated Financial Statements—(Continued)
Historical general allowances are calculated based on the historical loss experience of specific types of loans. We calculate historical loss ratios for pools of similar loans with similar characteristics based on the proportion of actual loans charged-off to the total population of loans in the pool. Management is currently using a five-year lookback period when computing historical loss rates to determine the general component of the allowance for loan losses. Given the increase in charge-offs during 2009, we also utilized a three-year lookback period at December 31, 2009 as another reference point in determining the allowance for loan losses. A historical allowance is established for each pool of similar loans based upon the product of the historical loss ratio and the total dollar amount of the loans in the pool. Our pools of similar loans include similarly risk graded groups of commercial and industrial loans, commercial and residential real estate loans, general consumer loans, and bankcard loans. General historical allowances are adjusted for qualitative factors such as general economic conditions and other qualitative risk factors both internal and external to the Company. In general, these allowances are determined by evaluating, among other things, the experience, ability and effectiveness of the Bank’s lending management and staff, the effectiveness of the Company’s loan policies, procedures and internal controls, changes in asset quality such as past dues, nonaccruals, classified loans, and restructured loans, changes in loan portfolio volume, the composition and concentrations of the loan portfolio, the impact of competition on loan structuring and pricing, the effectiveness of the internal loan review function and Board oversight, the impact of environmental risks such as national and local economic and business conditions, legal and regulatory requirements, peer comparisons, and the impact of rising interest rates on portfolio risk.
In accordance with FASB ASC 310 we analyze individual loans within the portfolio and make specific allocations to the allowance for loan losses based on each individual loan’s specific factors and other circumstances that impact the collectability of the loan. The population of loans evaluated to be potential impaired loans includes all trouble debt restructures, specifically identified loans with interest reserves, and significant individual loans classified as doubtful or on nonaccrual.
In situations where a loan is determined to be impaired (primarily because it is probable that all principal and interest due according to the terms of the loan agreement will not be collected as scheduled), the loan is excluded from the general reserve calculation described below and is evaluated individually for impairment. The impairment analysis is based on the determination of the most probable source of repayment which is usually liquidation of the underlying collateral, but may also include discounted future cash flows or, in rare cases, the market value of the loan itself.
Loans identified as losses by management, internal loan review, and/or bank examiners are charged-off. For impaired loans, we review each on a loan by loan basis to determine whether the impairment should be recorded as a charge-off or a reserve based on our assessment of the status of the borrower and the underlying collateral. In general, for collateral dependent loans the impairment is charged-off unless the fair value is based on an internal valuation pending receipt of a third party appraisal or other extenuating circumstances. Consumer loan accounts are charged-off based on regulatory requirements. An allowance for loan losses is not recorded for loans held for sale.
Reserve for Unfunded Commitments
We also estimate probable losses related to unfunded lending commitments. The methodology to determine such losses is inherently similar to the methodology utilized in calculating the allowance for loan losses; however, commitments have fixed expiration dates and most of our commitments to extend credit have adverse change clauses that allow the Bank to cancel the commitments based on various factors, including deterioration in the creditworthiness of the borrower. Accordingly, many of our loan commitments are expected to expire without being drawn upon and therefore the total commitment amounts do not necessarily represent potential
111
Table of Contents
PALMETTO BANCSHARES, INC. AND SUBSIDIARY
Notes To Consolidated Financial Statements—(Continued)
credit exposure. The reserve for unfunded lending commitments is included in the Other liabilities financial statement line item in the Consolidated Balance Sheet. Changes to the reserve for unfunded commitments are recorded through other noninterest expense in the Consolidated Statements of Income (Loss).
Premises and Equipment, net
Land is reported at cost. Building and improvements, furniture and equipment, and software are carried at cost, less accumulated depreciation, computed principally by the straight-line method based on the estimated useful lives of the related asset. Estimated lives range from twelve to thirty-nine years for buildings and improvements and from five to twelve years for furniture and equipment. Estimated lives range from three to five years for computer software. Estimated lives of Bank automobiles are typically five years. Leasehold improvements are generally depreciated over the lesser of the term of the respective lease or the estimated useful lives of the improvements.
Depreciation with regard to our leased improvements to premises and equipment is recorded in accordance with FASB ASC 840, Leases.
Maintenance and repairs of such premises and equipment are charged to expense as incurred. Improvements that extend the useful lives of the respective assets are capitalized.
Impairment of Long-Lived Assets
We periodically review the carrying value of our long-lived assets including, but not limited to, premises and equipment, for impairment when events or circumstances indicate that the carrying amount of such assets may not be fully recoverable. For long-lived assets to be held and used, impairments are recognized when the carrying amount of a long-lived asset is not recoverable and exceeds its fair value. The carrying amount of a long-lived asset is not recoverable if it exceeds the sum of the undiscounted cash flows expected to result from the use and eventual disposition of the asset. An impairment loss is the amount by which the carrying amount of a long-lived asset exceeds its fair value.
Long-lived assets to be sold are classified as held for sale and are no longer depreciated. Certain criteria must be met in order for the long-lived asset to be classified as held for sale, including that a sale is probable and expected to occur within a one year period. Long-lived assets classified as held for sale are recorded at the lower of carrying amount or fair value less the estimated costs to sell.
We recorded no impairment loss relative to our long-lived assets for the years ended December 31, 2009, 2008, and 2007.
Long-lived assets to be disposed of by abandonment or in an exchange for similar productive long-lived assets are classified as held for sale and used until disposed. We had no such assets at December 31, 2009 or 2008.
Goodwill and Core Deposit Intangibles
Goodwill represents the excess of the cost of businesses acquired over the fair value of the net assets acquired. Goodwill is assigned to reporting units and is then tested for impairment at least annually, or on an interim basis if an event occurs or circumstances arise that would more likely than not reduce the fair value of the
112
Table of Contents
PALMETTO BANCSHARES, INC. AND SUBSIDIARY
Notes To Consolidated Financial Statements—(Continued)
reporting unit below its carrying value. The first step of our goodwill impairment test, used to identify potential impairment, compares the fair value of our reporting unit with our carrying amount, including goodwill. If the fair value of our reporting unit exceeds our carrying amount, goodwill is considered not impaired, thus the second step of the impairment test is unnecessary. If the carrying amount of our reporting unit exceeds the fair value, the second step of the goodwill impairment test is performed to measure the amount of impairment loss, if any. The second step of the goodwill impairment test, used to measure the amount of impairment loss, compares the implied fair value of reporting unit goodwill with the carrying amount of that goodwill. If the carrying amount of reporting unit goodwill exceeds the implied fair value of that goodwill, an impairment loss is recognized in an amount equal to that excess. The loss recognized cannot exceed the carrying amount of goodwill. After a goodwill impairment loss is recognized, the adjusted carrying amount of goodwill is its new accounting basis. Once an impairment loss is recognized, future increases in fair value do not result in the reversal of previously recognized losses.
Other intangible assets are acquired assets that lack physical substance but can be distinguished from goodwill because of contractual or other legal rights or because the asset is capable of being sold or exchanged either on its own or in combination with a related contract, asset, or liability. Our intangible assets include core deposit intangibles. We fully amortized our remaining core deposit intangibles in 2009.
Real Estate Acquired in Settlement of Loans
Real estate acquired in settlement of loans is recorded, when acquired, at the lower of cost or fair value less estimated selling costs, establishing a new cost basis. Fair value of such real estate is reviewed regularly and writedowns are recorded when it is determined that the carrying value of the real estate exceeds the fair value less estimated costs to sell. Writedowns resulting from the periodic reevaluation of such properties, costs related to holding such properties, and gains and losses on the sale of foreclosed properties are charged against income. Costs relating to the development and improvement of such property are capitalized.
Accumulated Other Comprehensive Loss
We report comprehensive income in accordance with FASB ASC 220, Comprehensive Income, which establishes standards for the reporting and presentation of comprehensive income and its components in financial statements. In accordance with this guidance, we elected to disclose changes in comprehensive income in our Consolidated Statements of Changes in Shareholders’ Equity and Comprehensive Income (Loss). Comprehensive income includes all changes in shareholders’ equity during a period except those resulting from transactions with shareholders.
113
Table of Contents
PALMETTO BANCSHARES, INC. AND SUBSIDIARY
Notes To Consolidated Financial Statements—(Continued)
The following table summarizes the components of accumulated other comprehensive loss, net of tax impact, at the dates and for the periods indicated (in thousands).
| Impact of FASB ASC 715 |
Impact of curtailment |
Total impact of defined benefit pension plan |
Impact of investment securities available for sale |
Total | |||||||||||||||
| Accumulated other comprehensive income (loss), after income tax impact, December 31, 2007 |
$ | (4,116 | ) | $ | 1,630 | $ | (2,486 | ) | $ | (252 | ) | $ | (2,738 | ) | |||||
| Accumulated other comprehensive loss, before income tax impact |
(3,092 | ) | — | (3,092 | ) | (2,201 | ) | (5,293 | ) | ||||||||||
| Income tax benefit |
1,082 | — | 1,082 | 832 | 1,914 | ||||||||||||||
| Accumulated other comprehensive loss, after income tax impact |
(2,010 | ) | — | (2,010 | ) | (1,369 | ) | (3,379 | ) | ||||||||||
| Accumulated other comprehensive income (loss), after income tax impact, December 31, 2008 |
$ | (6,126 | ) | $ | 1,630 | $ | (4,496 | ) | $ | (1,621 | ) | $ | (6,117 | ) | |||||
| Accumulated other comprehensive income (loss), before income tax impact |
(4,261 | ) | — | (4,261 | ) | 3,107 | (1,154 | ) | |||||||||||
| Income tax (expense) benefit |
1,491 | — | 1,491 | (1,180 | ) | 311 | |||||||||||||
| Accumulated other comprehensive income (loss), after income tax impact |
(2,770 | ) | — | (2,770 | ) | 1,927 | (843 | ) | |||||||||||
| Accumulated other comprehensive income (loss), after income tax impact, December 31, 2009 |
$ | (8,896 | ) | $ | 1,630 | $ | (7,266 | ) | $ | 306 | $ | (6,960 | ) | ||||||
Income Taxes
The Company files consolidated federal and state income tax returns. Federal income tax expense or benefit has been allocated to subsidiaries on a separate return basis. We account for income taxes in accordance with FASB ASC 740, Income Taxes, resulting in two components of income tax expense: current and deferred. Current income tax expense approximates taxes to be paid or refunded for the current period and includes income tax expense related to uncertain tax positions, if any.
Deferred income taxes are determined using the balance sheet method. Under this method, the net deferred tax asset or liability is based on the tax impacts of the differences between the book and tax bases of assets and liabilities and recognizes enacted changes in tax rates and laws in the period in which they occur. Deferred income tax expense results from changes in deferred tax assets and liabilities between periods. Deferred tax assets are recognized subject to management’s judgment that realization is more likely than not. A tax position that meets the more likely than not recognition threshold is measured to determine the amount of benefit to recognize. The tax position is measured at the largest amount of benefit that is greater than 50% likely of being realized upon settlement. Interest and penalties, if any, are recognized as a component of income tax expense.
Management reviews our deferred tax assets for recoverability based on history of earnings, expectations for future earnings and expected timing of reversals of temporary differences. Realization of a deferred tax asset ultimately depends on the existence of sufficient taxable income available under tax law, including future reversals of existing temporary differences, future taxable income exclusive of reversing differences, taxable income in prior carryback years, projections of taxable income in future years, and tax planning strategies.
114
Table of Contents
PALMETTO BANCSHARES, INC. AND SUBSIDIARY
Notes To Consolidated Financial Statements—(Continued)
Net Income (Loss) per Common Share
Basic income (loss) per common share is based on net income (loss) divided by the weighted average number of common shares outstanding during the period. Diluted income per share reflects the potential dilution that could occur if securities or other contracts to issue common stock, such as stock options, result in the issuance of common stock that share in the income (loss) of the Company.
In accordance with FASB ASC 260, Earnings Per Share, including potential common shares in the denominator of the diluted per share computation for continuing operations results in an antidilutive per share amount when an entity has a loss from continuing operations. As such, no potential common shares were included in the computation of the diluted per share amount for the year ended December 31, 2009.
Employee Benefit Plan—Defined Benefit Pension Plan
Prior to 2008, the Company offered a noncontributory, defined benefit pension plan that covered all full-time employees having at least twelve months of continuous service and having attained age 21. The plan was originally designed to produce a designated retirement benefit, and benefits were fully vested after five years of service. No vesting occurred until five years of service had been achieved. In the fourth quarter of 2007, we notified employees that, effective 2008, we would cease accruing pension benefits for employees with regard to the Company’s noncontributory, defined benefit pension plan. Although no previously accrued benefits were lost, employees no longer accrue benefits for service subsequent to 2007.
The Company’s trust department administers the plan’s assets. Contributions to the plan are made as required by the Employee Retirement Income Security Act of 1974.
The Company accounts for our defined benefit pension plans using an actuarial model required by FASB ASC 715, Compensation—Retirement Benefits. This model allocates pension costs over the service period of employees in the plan. The underlying principle is that employees render services ratably over this period and, therefore, the income statement impacts of pensions should follow a similar pattern.
FASB ASC 715 requires the Company to recognize the funded status of our pension plan on our Consolidated Balance Sheet. Additionally, this guidance required us to use a year-end measurement date beginning in 2008. We conformed our pension asset and liabilities to FASB ASC 715 and recorded a corresponding reduction of $4.1 million, after-tax, to the December 31, 2007 balance of accumulated other comprehensive income (loss) in stockholders’ equity relative to the adoption of FASB ASC 715. This guidance does not change the amount of net periodic benefit expense charged to income.
One of the principal components of the net periodic pension expense calculation is the expected long-term rate of return on plan assets. The use of an expected long-term rate of return on plan assets may cause the Company to recognize pension income returns that are greater or less than the actual returns of plan assets in any given year. The expected long-term rate of return is designed to approximate the actual long-term rate of return over time and is not expected to change significantly. Therefore, the pattern of income / expense recognition should match the stable pattern of services provided by the Company’s employees over the life of the Company’s pension obligation. To ensure that the expected rate of return is reasonable, management considers such factors as long-term historical return experience for major asset class categories and considers any material forward-looking return expectations for these major asset classes. Differences between expected and actual returns in each year, if any, are included in the net actuarial gain or loss amount, which is recognized in other comprehensive income. The Company generally amortizes any net actuarial gain or loss in excess of a predetermined corridor in net periodic pension expense calculations. Expected returns on defined benefit pension plan assets are developed
115
Table of Contents
PALMETTO BANCSHARES, INC. AND SUBSIDIARY
Notes To Consolidated Financial Statements—(Continued)
by the Company in conjunction with input from external advisors and take into account the investment policy, actual investment allocation, and long-term expected rates of return on the relevant asset classes.
The Company uses a discount rate to determine the present value of our future benefit obligations. The discount rate is determined in consultation with our third party actuary and is set by matching the projected benefit cash flow to the Citigroup pension yield curve. The yield curve reflects the plan specific duration.
The pension plan includes common stock of the Company, which is not traded on an exchange. At December 31, 2009, Company common stock included in the plan was 1.5% of total assets of the plan.
Equity Based Compensation—Stock Option Plan
The Company accounts for our stock options under FASB ASC 718, Compensation—Stock Compensation. FASB ASC 718 requires that such transactions be recognized as compensation cost in the income statement based on fair value on the measurement date, which, for the Company, is the date of the grant. The Company transitioned to fair value based accounting for equity based compensation using a modified version of prospective application (“modified prospective application”). Under the modified prospective application, FASB ASC 718 applies to new awards and to awards modified, repurchased, or cancelled after January 1, 2006. Additionally, compensation cost for the portion of awards for which the requisite service has not been rendered (generally referring to nonvested awards) that were outstanding as of January 1, 2006 will be recognized as the remaining requisite service is rendered during the period of and / or the periods after the adoption of this guidance. The attribution of compensation cost for those earlier awards is based on the same method and on the same grant date fair values previously determined for the pro forma disclosures required for companies that did not previously adopt the fair value accounting method for equity based employee compensation.
Derivative Financial Instruments and Hedging Activities
FASB ASC 815, Derivatives and Hedging, establishes accounting and reporting standards for derivatives and hedging activities. It requires an entity to recognize all derivatives as either assets or liabilities in the Consolidated Balance Sheet and measure those instruments at fair value. Changes in the fair value of those derivatives are reported in current earnings or other comprehensive income depending on the purpose for which the derivative is held and whether the derivative qualifies for hedge accounting.
We originate certain residential loans with the intention of selling these loans. Between the time that we enter into an interest rate lock commitment to originate a residential loan with a potential borrower and the time the closed loan is sold, we are subject to variability in market prices related to these commitments. We also enter into forward sale agreements of “to be issued” loans. The commitments to originate residential loans and forward sales commitments are freestanding derivative instruments and are recorded on the Consolidated Balance Sheet at fair value. They do not qualify for hedge accounting treatment. Fair value adjustments are recorded within the Mortgage-banking financial statement line item of the Consolidated Statements of Income (Loss).
Fair Valuation Measurements
We apply the provisions of FASB ASC 820, Fair Value Measurements and Disclosures, which provides a framework for measuring and disclosing fair value under GAAP. FASB ASC 820 requires disclosures about the fair value of assets and liabilities recognized in the Consolidated Balance Sheet in periods subsequent to initial recognition whether the measurements are made on a recurring basis (for example, investment securities available-for-sale) or on a nonrecurring basis (for example, impaired loans).
116
Table of Contents
PALMETTO BANCSHARES, INC. AND SUBSIDIARY
Notes To Consolidated Financial Statements—(Continued)
FASB ASC 820 defines fair value as the exchange price that would be received for an asset or paid to transfer a liability (an exit price) in the principal or most advantageous market for the asset or liability in an orderly transaction between market participants on the measurement date. This guidance also establishes a fair value hierarchy which requires an entity to maximize the use of observable inputs and minimize the use of unobservable inputs when measuring fair value. The standard describes three levels of inputs that may be used to measure fair value:
| • | Level 1 – quoted prices in active markets for identical assets or liabilities; |
| • | Level 2 – observable inputs other than Level 1 prices such as quoted prices for similar assets or liabilities, quoted prices in markets that are not active, or other inputs that are observable or can be corroborated by observable market data for substantially the full term of the assets or liabilities; and |
| • | Level 3 – unobservable inputs that are supported by little or no market activity and that are significant to the fair value of the assets or liabilities. |
Disclosures about the fair value of all financial instruments whether or not recognized in the Consolidated Balance Sheet for which it is practicable to estimate that value are required. In cases where quoted market prices are not available, fair values are based on estimates using present value or other valuation techniques. Those techniques are significantly impacted by the assumptions used, including the discount rate and estimates of future cash flows. In that regard, the derived fair value estimates cannot be substantiated by comparison to independent markets and, in many cases, could not be realized through immediate settlement of the instrument. Accordingly, the aggregate fair value amounts presented do not represent the underlying value of the Company.
Valuation of the Company’s Common Stock
On a periodic basis, we utilize the market price of our common stock within various valuations and calculations relating to our defined benefit pension plan assets, our trust department assets under management, our employee retirement accounts, our impairment analysis of goodwill, our granting of awards under our 2008 Restricted Stock Plan, our calculation of earnings per share on a diluted basis, and our valuation of such stock serving as loan collateral.
Our common stock is not listed on an exchange or any over-the-counter service. Thus, there is currently no public trading market of our common stock, and private trading of our common stock has been limited. In addition, buyers and sellers may privately negotiate transactions in our common stock. Because there is not an established market for our common stock, management may not be aware of all prices at which our common stock has been traded. Additionally, management has not determined whether the trades of which we are aware were the result of arm’s-length negotiations between the parties. Accordingly, we determine the value of our common stock based on the last five trades of the stock facilitated by the Company.
Recently Adopted Accounting Pronouncements
Certain accounting standards required additional disclosures for the year ended December 31, 2009, and such disclosures are included herein. Following is a summary of other applicable accounting pronouncements adopted by the Company during the year ended December 31, 2009 that required accounting changes beyond just disclosures.
The FASB issued new accounting guidance regarding the determination of the useful life of intangible assets in April 2008. The guidance amended the factors that should be considered in developing renewal or extension assumptions used to determine the useful life of a recognized intangible asset. It is intended to improve
117
Table of Contents
PALMETTO BANCSHARES, INC. AND SUBSIDIARY
Notes To Consolidated Financial Statements—(Continued)
the consistency between the useful life of a recognized intangible asset and the period of expected cash flows used to measure the fair value of the asset. The standard was effective for financial statements issued for fiscal years beginning after December 15, 2008 and interim periods within those fiscal years. Its adoption had no material impact on our financial position, results of operations, or cash flows.
The FASB issued new accounting guidance regarding other-than-temporary impairment of investments in debt and equity securities in April 2009. The guidance provided that other-than-temporary impairment is not necessarily the same as permanent impairment and, unless evidence exists to support a value equal to or greater than the carrying value of the equity security investment, a writedown to fair value should be recorded and accounted for as a realized loss. The standard was effective upon issuance, and its adoption had no impact on our financial position, results of operations, or cash flows.
In April 2009, the FASB issued new accounting guidance which categorizes losses on debt securities available-for-sale or held-to-maturity determined by management to be other-than-temporarily impaired into losses due to credit issues and losses related to all other factors. Other-than-temporary impairment exists when it is more likely than not that the security will mature or be sold before its amortized cost basis can be recovered. An other-than-temporary impairment related to credit losses should be recognized through earnings. An other-than-temporary impairment related to other factors should be recognized in other comprehensive income. The amendment was effective for reporting periods ending after June 15, 2009. The adoption did not have a material impact on our financial position, results of operations, or cash flows. Also in April 2009, the FASB issued new accounting guidance that recognizes that quoted prices may not be determinative of fair value when the volume and level of trading activity has significantly decreased. The evaluation of certain factors may necessitate that fair value be determined using a different valuation technique. Fair value should be the price that would be received to sell an asset or paid to transfer a liability in an orderly transaction not a forced liquidation or distressed sale. If a transaction is considered to not be orderly, little, if any, weight should be placed on the transaction price. If there is not sufficient information to conclude as to whether or not the transaction is orderly, the transaction price should be considered when estimating fair value. An entity’s intention to hold an asset or liability is not relevant in determining fair value. Quoted prices provided by pricing services may still be used when estimating fair value; however, the entity should evaluate whether the quoted prices are based on current information and orderly transactions. Inputs and valuation techniques are required to be disclosed in addition to any changes in valuation techniques. The standard was effective for periods ending after June 15, 2009. Its adoption had no material impact on our financial position, results of operations, or cash flows.
In August 2009, the FASB issued new accounting guidance to provide direction when estimating the fair value of a liability. When a quoted price in an active market for the identical liability is not available, fair value should be measured using:
| • | The quoted price of an identical liability when traded as an asset, |
| • | Quoted prices for similar liabilities or similar liabilities when traded as assets, or |
| • | Another valuation technique such as an income approach or a market approach. |
If a restriction exists that prevents the transfer of the liability, a separate adjustment related to the restriction is not required when estimating fair value. The standard was effective for us on October 1, 2009. Its adoption had no material impact on our financial position, results of operations, or cash flows.
In September 2009, the FASB issued new accounting guidance allowing a company to measure the fair value of an investment that has no readily determinable fair value on the basis of the investee’s net asset value per share as provided by the investee. This allowance assumes that the investee has calculated net asset value in
118
Table of Contents
PALMETTO BANCSHARES, INC. AND SUBSIDIARY
Notes To Consolidated Financial Statements—(Continued)
accordance with the GAAP measurement principles of Topic 946 as of the reporting entity’s measurement date. Examples of such investments include investments in hedge funds, private equity funds, real estate funds, and venture capital funds. The update also provides guidance on how the investment should be classified within the fair value hierarchy based on the value for which the investment can be redeemed. The amendment is effective for interim and annual periods ending after December 15, 2009. Its adoption had no material impact on our financial position, results of operations, or cash flows.
Recently Issued Applicable Accounting Pronouncements
The FASB issued new accounting guidance on accounting for transfers of financial assets in June 2009. The guidance limits the circumstances in which a financial asset should be derecognized when the transferor has not transferred the entire financial asset by taking into consideration the transferor’s continuing involvement. The standard requires that a transferor recognize and initially measure at fair value all assets obtained (including a transferor’s beneficial interest) and liabilities incurred as a result of a transfer of financial assets accounted for as a sale. The concept of a qualifying special-purpose entity is no longer applicable. The standard is effective for the first annual reporting period that begins after November 15, 2009, for interim periods within the first annual reporting period, and for interim and annual reporting periods thereafter. Earlier application is prohibited. The Company does not expect the guidance to have a material impact on our financial position, results of operation or cash flows.
Other accounting standards that have been issued or proposed by the FASB or other standards-setting bodies are not expected to have a material impact on the Company’s financial position, results of operations, or cash flows.
| 2. | Cash and Cash Equivalents |
Noninterest-Earning Deposits with Financial Institutions
Included in the Cash and due from banks line item in the Consolidated Balance Sheets was $262 thousand at December 31, 2009, of noninterest-earning deposits with financial institutions. We had no noninterest-earning deposits with financial institutions at December 31, 2008.
Required Reserve Balances
The Federal Reserve Act requires each depository institution to maintain reserves against its reservable liabilities as prescribed by Federal Reserve regulations. The Bank reports our reservable liabilities to the Federal Reserve on a weekly basis. Weekly reporting institutions maintain reserves on their reservable liabilities with a 30-day lag. For the maintenance period ended on December 30, 2009, based on reservable liabilities from November 17, 2009 through November 30, 2009, the Federal Reserve required the Bank to maintain reserves of $10.4 million. After taking into consideration our levels of vault cash, reserves of $1.4 million were required to be maintained at our correspondent transaction settlement bank in addition to $1.0 million that was required to be maintained with the Federal Reserve.
Concentrations and Restrictions
In an effort to manage our associated risks, we generally do not sell federal funds to other financial institutions because they are essentially uncollateralized loans to other financial institutions. Therefore, management regularly evaluates the risk associated with the counterparties to these transactions to ensure that we do not expose ourselves to any significant risks with regard to our cash and cash equivalent balances.
119
Table of Contents
PALMETTO BANCSHARES, INC. AND SUBSIDIARY
Notes To Consolidated Financial Statements—(Continued)
Approximately $512 thousand, or 0.3%, of the balance of cash and cash equivalents was restricted as of December 31, 2009, to secure a letter of credit. At December 31, 2008, no cash or cash equivalents were restricted under such an agreement.
Approximately $836 thousand, or 0.4%, of the balance of cash and cash equivalents was restricted as of December 31, 2009, as required under our credit card and merchant credit card agreement. At December 31, 2008, no cash or cash equivalents were restricted under such agreements.
| 3. | Investment Securities Available for Sale |
The following tables summarize the amortized cost, gross unrealized gains, gross unrealized losses, and fair values of investment securities available for sale at the dates indicated (in thousands).
| December 31, 2009 | |||||||||||||
| Amortized cost |
Gross unrealized gains |
Gross unrealized losses |
Fair value | ||||||||||
| U.S. Treasury and federal agencies |
$ | 16,294 | $ | 3 | $ | — | $ | 16,297 | |||||
| State and municipal |
44,908 | 1,880 | (3 | ) | 46,785 | ||||||||
| Collateralized mortgage obligations |
42,508 | 168 | (2,358 | ) | 40,318 | ||||||||
| Other mortgage-backed (federal agencies) |
15,783 | 838 | (35 | ) | 16,586 | ||||||||
| Total investment securities available for sale |
$ | 119,493 | $ | 2,889 | $ | (2,396 | ) | $ | 119,986 | ||||
| December 31, 2008 | |||||||||||||
| Amortized cost |
Gross unrealized gains |
Gross unrealized losses |
Fair value | ||||||||||
| State and municipal |
$ | 50,297 | $ | 635 | $ | (102 | ) | $ | 50,830 | ||||
| Collateralized mortgage obligations |
58,033 | 23 | (3,417 | ) | 54,639 | ||||||||
| Other mortgage-backed (federal agencies) |
19,876 | 270 | (19 | ) | 20,127 | ||||||||
| Total investment securities available for sale |
$ | 128,206 | $ | 928 | $ | (3,538 | ) | $ | 125,596 | ||||
We use prices from third party pricing services and, to a lesser extent, indicative (non-binding) quotes from third party brokers, to measure fair value of our investment securities. See Note 18 for further discussion regarding the amount and fair value hierarchy classification of investment securities measured at fair value using a third party pricing service and those measured at fair value using broker quotes. We utilize multiple third party pricing services and brokers to obtain fair values; however, management generally obtains one price/quote for each individual security. For securities priced by third party pricing services, management determines the most appropriate and relevant pricing service for each security class and has that vendor provide the price for each security in the class. We record the unadjusted value provided by the third party pricing service/broker in our Consolidated Financial Statements, subject to our internal price verification procedures.
120
Table of Contents
PALMETTO BANCSHARES, INC. AND SUBSIDIARY
Notes To Consolidated Financial Statements—(Continued)
Other-Than-Temporary Impairment
The following tables summarize the number of securities in each category of investment securities available for sale, the fair value, and the gross unrealized losses, aggregated by investment category and length of time that individual securities have been in a continuous unrealized loss position, at the dates indicated (dollars in thousands).
| December 31, 2009 | ||||||||||||||||||||||||
| Less than 12 months | 12 months or longer | Total | ||||||||||||||||||||||
| # | Fair value |
Gross unrealized losses |
# | Fair value |
Gross unrealized losses |
# | Fair value |
Gross unrealized losses | ||||||||||||||||
| U.S. Treasury and federal agencies |
1 | $ | 300 | $ | — | — | $ | — | $ | — | 1 | $ | 300 | $ | — | |||||||||
| State and municipal |
2 | 662 | 3 | — | — | — | 2 | 662 | 3 | |||||||||||||||
| Collateralized mortgage obligations |
3 | 10,323 | 412 | 6 | 16,624 | 1,946 | 9 | 26,947 | 2,358 | |||||||||||||||
| Other mortgage-backed (federal agencies) |
2 | 1,444 | 35 | — | — | — | 2 | 1,444 | 35 | |||||||||||||||
| Total investment securities available for sale |
8 | $ | 12,729 | $ | 450 | 6 | $ | 16,624 | $ | 1,946 | 14 | $ | 29,353 | $ | 2,396 | |||||||||
| December 31, 2008 | ||||||||||||||||||||||||
| Less than 12 months | 12 months or longer | Total | ||||||||||||||||||||||
| # | Fair value |
Gross unrealized losses |
# | Fair value |
Gross unrealized losses |
# | Fair value |
Gross unrealized losses | ||||||||||||||||
| State and municipal |
12 | $ | 5,441 | $ | 101 | 1 | $ | 423 | $ | 1 | 13 | $ | 5,864 | $ | 102 | |||||||||
| Collateralized mortgage obligations |
13 | 52,603 | 3,417 | — | — | — | 13 | 52,603 | 3,417 | |||||||||||||||
| Other mortgage-backed (federal agencies) |
4 | 1,336 | 15 | 1 | 838 | 4 | 5 | 2,174 | 19 | |||||||||||||||
| Total investment securities available for sale |
29 | $ | 59,380 | $ | 3,533 | 2 | $ | 1,261 | $ | 5 | 31 | $ | 60,641 | $ | 3,538 | |||||||||
Gross unrealized losses decreased $1.1 million from December 31, 2008 to December 31, 2009, primarily within the collateralized mortgage obligation sector of the investment securities portfolio.
Based on our other-than-temporary impairment analysis at December 31, 2009, one collateralized mortgage obligation with a fair value of $2.3 million and amortized cost of $3.3 million was other-than-temporarily impaired. We concluded this based on its fair value position below amortized cost followed by our analysis of our broker provided fair values and our verification of this information using external sources. Due to the fact that we do not intend to sell this security nor is it more likely than not that we will have to sell the security prior to the recovery of its amortized cost basis less any current period credit loss, the amount of impairment related to credit loss is recognized in earnings and the amount of impairment related to other matters is recognized in other comprehensive income. For the year ended December 31, 2009, a $49 thousand other-than-temporarily credit impairment was recognized in Other noninterest expense in the Consolidated Statements of Income (Loss).
121
Table of Contents
PALMETTO BANCSHARES, INC. AND SUBSIDIARY
Notes To Consolidated Financial Statements—(Continued)
Ratings
The following table summarizes Moody’s ratings, by segment, of the investment securities available for sale, at December 31, 2009. An AAA rating is based not only on the credit of the issuer, but may also include consideration of the structure of the securities and the credit quality of the collateral.
| U.S. Treasury and federal agencies |
State and municipal |
Collateralized mortgage obligations |
Other mortgage- backed (federal agencies) |
|||||||||
| Aaa |
69 | % | 2 | % | 68 | % | 100 | % | ||||
| Aa1-A3 |
— | 73 | 10 | — | ||||||||
| Baa1-B3 |
— | 16 | 10 | — | ||||||||
| Not rated or withdrawn rating |
31 | 9 | 12 | — | ||||||||
| Total |
100 | % | 100 | % | 100 | % | 100 | % | ||||
31% of the U.S. Treasury and federal agencies were not rated by Moody’s or Standard and Poor’s ratings at December 31, 2009. There is an implicit AAA rating on U.S. Treasury and federal agency securities.
Of the state and municipal investment securities not rated by Moody’s at December 31, 2009, 100% were rated AA by Standard and Poor’s ratings. Of the state and municipal investment securities with withdrawn ratings by Moody’s at December 31, 2009, 22% were rated AA+, 29% were rated AA, 28% were rated AA-, and 21%, or $565 thousand, were not rated by Standard and Poor’s ratings.
Of the collateralized mortgage obligations not rated by Moody’s at December 31, 2009, 100% of the securities were rated AAA by Standard and Poor’s ratings.
Maturities
The following table summarizes the amortized cost and estimated fair value of investment securities available for sale at December 31, 2009 by contractual maturity (in thousands). Expected maturities may differ from contractual maturities because issuers may have the right to call or prepay obligations. Collateralized mortgage obligations and other mortgage-backed securities are shown separately since they are not due at a single maturity date.
| Amortized cost |
Fair value | |||||
| Due in one year or less |
$ | 20,968 | $ | 21,025 | ||
| Due after one year through five years |
26,949 | 28,193 | ||||
| Due after five year through ten years |
12,418 | 12,944 | ||||
| Due after ten years |
867 | 920 | ||||
| Collateralized mortgage obligations |
42,508 | 40,318 | ||||
| Other mortgage-backed securities (federal agencies) |
15,783 | 16,586 | ||||
| Total investment securities available for sale |
$ | 119,493 | $ | 119,986 | ||
The weighted-average contractual life of investment securities available for sale was 3.9 years at December 31, 2009. Since approximately 49%, based on amortized cost, of the portfolio is collateralized mortgage obligations or other mortgage-backed securities, the expected remaining maturity may differ from contractual maturity because borrowers generally have the right to prepay obligations before the underlying mortgages mature.
122
Table of Contents
PALMETTO BANCSHARES, INC. AND SUBSIDIARY
Notes To Consolidated Financial Statements—(Continued)
Pledged
Approximately 61% of the portfolio was pledged to secure public deposits, including retail repurchase agreements, and trust assets at December 31, 2009 as compared with 55% at December 31, 2008. Of the $73.2 million pledged at December 31, 2009, $56.3 million of the portfolio was securing public deposits and trust assets. Of the $69.1 million pledged at December 31, 2008, $47.0 million of the portfolio was securing public deposits and trust assets.
Approximately $6.3 million, or 5%, of the portfolio was pledged to secure federal funds funding from a correspondent bank as of December 31, 2009. At December 31, 2008, no securities were pledged under such agreements.
Approximately $29.8 million, or 25%, of the portfolio was pledged to collateralize FHLB advances and letters of credit as of December 31, 2009 of which $26.8 million was utilized as lendable collateral. At December 31, 2008, approximately $41.6 million, or 33%, of the portfolio was pledged to collateralize FHLB advances and letters of credit of which $37.5 million was utilized as lendable collateral.
Concentrations
Two state and municipal security issuer issued securities which totaled 2.1% and 3.0%, respectively, of total shareholders’ equity at December 31, 2009. Fourteen state and municipal security issuers issued securities with fair values ranging from 1.0% to 1.9% of total shareholders’ equity at December 31, 2009.
Eight collateralized mortgage obligation issuers issued securities with fair values ranging from 2.3% to 7.9% of total shareholders’ equity at December 31, 2009. One collateralized mortgage obligation, issued by Bank of America Alternative Loan Trust, had a fair value of $7.8 million, or 10.4%, of shareholders’ equity and an amortized cost of $7.9 million at December 31, 2009.
The following table summarizes issuer concentrations of other mortgage-backed investment securities at fair value at December 31, 2009 (dollars in thousands).
| Federal National Mortgage Association |
Federal Home Loan Mortgage Corporation |
Government National Mortgage Association |
Total | |||||||||||||
| Other mortgage-backed (federal agencies) |
$ | 13,114 | $ | 2,029 | $ | 1,443 | $ | 16,586 | ||||||||
| As a percentage of shareholders’ equity |
17.5 | % | 2.7 | % | 1.9 | % | 22.1 | % | ||||||||
Realized Gains and Losses
The following table summarizes the gross realized gains and losses on investment securities available for sale for the periods indicated (in thousands).
| For the years ended December 31, | |||||||||
| 2009 | 2008 | 2007 | |||||||
| Realized gains |
$ | 2 | $ | 1 | $ | — | |||
| Realized losses |
— | — | — | ||||||
| Net realized gains |
$ | 2 | $ | 1 | $ | — | |||
123
Table of Contents
PALMETTO BANCSHARES, INC. AND SUBSIDIARY
Notes To Consolidated Financial Statements—(Continued)
| 4. | Loans |
Composition
The following table summarizes gross loans, categorized by FDIC code, at the dates indicated (dollars in thousands).
| December 31, 2009 | December 31, 2008 | |||||||||||
| Total | % of total | Total | % of total | |||||||||
| Secured by real estate |
||||||||||||
| Construction, land development, and other land loans |
$ | 205,465 | 19.8 | % | $ | 257,879 | 22.3 | % | ||||
| Farmland |
466 | — | 662 | 0.1 | ||||||||
| Single-family residential |
203,330 | 19.6 | 216,311 | 18.7 | ||||||||
| Multifamily residential |
30,668 | 3.0 | 31,532 | 2.7 | ||||||||
| Nonfarm nonresidential |
459,130 | 44.1 | 493,977 | 42.6 | ||||||||
| Commercial and industrial |
61,788 | 5.9 | 73,609 | 6.4 | ||||||||
| Obligations of states and political subdivisions of the U.S. |
1,418 | 0.1 | 2,602 | 0.2 | ||||||||
| General consumer |
57,581 | 5.5 | 60,626 | 5.2 | ||||||||
| Credit line |
5,501 | 0.5 | 6,215 | 0.5 | ||||||||
| Bankcards |
13,214 | 1.3 | 12,416 | 1.1 | ||||||||
| Others |
1,751 | 0.2 | 2,651 | 0.2 | ||||||||
| Loans, gross |
$ | 1,040,312 | 100.0 | % | $ | 1,158,480 | 100.0 | % | ||||
Loans included in the preceding loan composition table are net of participations sold. Participations sold totaled $12.5 million at December 31, 2009 and $26.7 million at December 31, 2008.
Mortgage loans serviced for the benefit of others amounted to $426.6 million and $377.3 million at December 31, 2009 and December 31, 2008, respectively, and are not included in our Consolidated Balance Sheets.
Pledged
To borrow from the FHLB, members must pledge collateral to secure advances and letters of credit. Acceptable collateral includes, among other types of collateral, a variety of residential, multifamily, home equity lines and second mortgages, and commercial loans. Approximately $407.0 million of gross loans were pledged to collateralize FHLB advances and letters of credit at December 31, 2009, of which $162.0 million was available as lendable collateral. Of the $379.4 million of gross loans pledged at December 31, 2008, $159.1 million was available as lendable collateral.
At December 31, 2009, our borrowings capacity at the Federal Reserve was secured by a blanket lien on a portion of our commercial and consumer loan portfolios. Of the $108.8 million of loans pledged at December 31, 2009, $61.2 million was available as lendable collateral. We had no outstanding borrowings from the Federal Reserve at December 31, 2009.
124
Table of Contents
PALMETTO BANCSHARES, INC. AND SUBSIDIARY
Notes To Consolidated Financial Statements—(Continued)
Concentrations
The following table summarizes loans secured by commercial real estate, categorized by FDIC code, at December 31, 2009 (dollars in thousands).
| Total | % of gross loans |
% of Bank’s total regulatory capital |
|||||||
| Secured by commercial real estate |
|||||||||
| Construction, land development, and other land loans |
$ | 205,465 | 19.8 | % | 220.9 | % | |||
| Multifamily residential |
30,668 | 2.9 | 33.0 | ||||||
| Nonfarm nonresidential |
459,130 | 44.1 | 493.6 | ||||||
| Total loans secured by commercial real estate |
$ | 695,263 | 66.8 | % | 747.5 | % | |||
The following table further categorizes loans secured by commercial real estate, categorized by FDIC code, at December 31, 2009 (dollars in thousands).
| Total | % of gross loans |
% of Bank’s total regulatory capital |
|||||||
| Development commercial real estate loans |
|||||||||
| Secured by: |
|||||||||
| Land—unimproved (commercial or residential) |
$ | 89,234 | 8.6 | % | 95.9 | % | |||
| Land development—commercial |
14,087 | 1.4 | 15.1 | ||||||
| Land development—residential |
57,084 | 5.5 | 61.4 | ||||||
| Commercial construction: |
|||||||||
| Hotel / motel |
196 | — | 0.2 | ||||||
| Retail |
4,639 | 0.4 | 5.0 | ||||||
| Office |
246 | — | 0.3 | ||||||
| Multifamily |
9,878 | 0.9 | 10.6 | ||||||
| Industrial and warehouse |
7,098 | 0.7 | 7.6 | ||||||
| Healthcare |
4,981 | 0.5 | 5.4 | ||||||
| Miscellaneous commercial |
1,765 | 0.2 | 1.9 | ||||||
| Total development commercial real estate loans |
189,208 | 18.2 | 203.4 | ||||||
| Existing and other commercial real estate loans |
|||||||||
| Secured by: |
|||||||||
| Hotel/motel |
105,428 | 10.1 | 113.4 | ||||||
| Retail |
31,369 | 3.0 | 33.7 | ||||||
| Office |
36,036 | 3.5 | 38.7 | ||||||
| Multifamily |
30,668 | 3.0 | 33.0 | ||||||
| Industrial and warehouse |
15,414 | 1.5 | 16.6 | ||||||
| Healthcare |
16,826 | 1.6 | 18.1 | ||||||
| Miscellaneous commercial |
133,655 | 12.8 | 143.7 | ||||||
| Residential construction—speculative |
7,184 | 0.7 | 7.7 | ||||||
| Total existing and other commercial real estate loans |
376,580 | 36.2 | 404.9 | ||||||
| Commercial real estate owner occupied and residential loans |
|||||||||
| Secured by: |
|||||||||
| Commercial—owner occupied |
120,402 | 11.6 | 129.4 | ||||||
| Commercial construction—owner occupied |
2,418 | 0.2 | 2.6 | ||||||
| Residential construction—contract |
6,655 | 0.6 | 7.2 | ||||||
| Total commercial real estate owner occupied and residential loans |
129,475 | 12.4 | 139.2 | ||||||
| Total loans secured by commercial real estate |
$ | 695,263 | 66.8 | % | 747.5 | % | |||
125
Table of Contents
PALMETTO BANCSHARES, INC. AND SUBSIDIARY
Notes To Consolidated Financial Statements—(Continued)
Asset Quality
Nonaccrual Loans and Loans Past Due 90 Days and Still Accruing. The following table summarizes nonaccrual loans and loans past due 90 days and still accruing interest at the dates indicated (in thousands).
| December 31, | ||||||
| 2009 | 2008 | |||||
| Nonaccrual loans |
$ | 96,936 | $ | 42,968 | ||
| Loans past due 90 days and still accruing (1) |
— | 206 | ||||
| $ | 96,936 | $ | 43,174 | |||
| (1) | Substantially all of these loans are bankcard loans. |
Additional interest income of $5.9 million would have been reported during 2009 had loans classified as nonaccrual during the period performed in accordance with their original terms. As a result, our core operating earnings did not include this interest income. Additionally, no interest income was recorded during 2009 on loans classified as nonaccrual as our policy is to apply payments collected on nonaccrual loans to the principal balance of the loan.
Troubled Debt Restructurings. At December 31, 2009 and December 31, 2008, the principal balance of troubled debt restructurings totaled $14.6 million and $1.2 million, respectively.
Allowance for Loan Losses
The following table summarizes the activity impacting the allowance for loan losses at the dates and for the periods indicated (in thousands).
| At and for the years ended December 31, |
||||||||||||
| 2009 | 2008 | 2007 | ||||||||||
| Allowance for loan losses, beginning of period |
$ | 11,000 | $ | 7,418 | $ | 8,527 | ||||||
| Provision for loan losses |
73,400 | 5,619 | 988 | |||||||||
| Loan charge-offs |
(60,791 | ) | (2,169 | ) | (2,363 | ) | ||||||
| Loan recoveries |
470 | 132 | 266 | |||||||||
| Net loans charged-off |
(60,321 | ) | (2,037 | ) | (2,097 | ) | ||||||
| Allowance for loan losses, end of period |
$ | 24,079 | $ | 11,000 | $ | 7,418 | ||||||
Impaired Loans. The following table summarizes information relative to impaired loans at the dates and for the periods indicated (in thousands).
| At and for the years ended December 31, | ||||||
| 2009 | 2008 | |||||
| Impaired loans for which there is a related allowance for loan losses determined in accordance with FASB ASC 310 |
$ | 11,253 | $ | 21,413 | ||
| Other impaired loans |
85,583 | 16,055 | ||||
| Total impaired loans |
$ | 96,836 | $ | 37,468 | ||
| Average impaired loans, based on a simple average of quarter-end balances |
$ | 82,471 | $ | 22,568 | ||
| Related allowance for loan losses |
5,250 | 4,453 | ||||
126
Table of Contents
PALMETTO BANCSHARES, INC. AND SUBSIDIARY
Notes To Consolidated Financial Statements—(Continued)
| 5. | Premises and Equipment |
The following table summarizes the premises and equipment balances, net at the dates indicated (in thousands).
| December 31, | ||||||||
| 2009 | 2008 | |||||||
| Land |
$ | 6,534 | $ | 6,530 | ||||
| Buildings |
19,904 | 19,668 | ||||||
| Leasehold improvements |
5,313 | 2,884 | ||||||
| Furniture and equipment |
20,908 | 19,412 | ||||||
| Software |
3,719 | 3,495 | ||||||
| Bank automobiles |
820 | 941 | ||||||
| Capital lease asset |
420 | — | ||||||
| Premises and equipment, gross |
57,618 | 52,930 | ||||||
| Accumulated depreciation |
(28,013 | ) | (26,583 | ) | ||||
| Premises and equipment, net |
$ | 29,605 | $ | 26,347 | ||||
Premises Held for Sale
During 2008, the Company classified two parcels of land with a carrying amount approximating $1.7 million at December 31, 2008, as held for sale. These parcels were sold by the Company during the first quarter of 2009, at the carrying amount, in conjunction with the construction of our corporate headquarters in downtown Greenville. We had no long-lived assets classified as held for sale at December 31, 2009.
During 2008, we consolidated our existing banking office network, reducing the number of banking offices by four. Three of the consolidated banking offices were leased, and we owned one. Additionally, during 2008, we relocated our existing Pendleton banking office in Anderson County. The previous banking office is owned. At December 31, 2009, these banking office locations were not classified as held for sale as all criteria had not been met for such classification. As such, these long-lived assets will continue to be depreciated until which time all criteria are met. The book value of these properties totaled $580 thousand at December 31, 2009.
| 6. | Goodwill, net and Core Deposit Intangibles, net |
Goodwill of $3.7 million at December 31, 2009 and 2008 resulted from past business combinations from 1988 through 1999. We perform our annual impairment testing as of June 30. Our impairment testing at June 30, 2009, 2008, and 2007 indicated that no impairment charge was required as of those dates. Due to the continuing significant negative economic environment and our declined market capitalization based on our stock price, we also performed an impairment test of our goodwill at December 31, 2009. No impairment loss was recognized during the year ended December 31, 2009.
The following table summarizes the gross carrying amount and accumulated amortization of intangible assets with finite lives at the dates indicated (in thousands). Core deposit intangibles, net are included within the Other assets financial statement line item of the Consolidated Balance Sheets.
| December 31, | ||||||||
| 2009 | 2008 | |||||||
| Core deposit intangibles, gross |
$ | 1,779 | $ | 1,779 | ||||
| Less: accumulated amortization |
(1,779 | ) | (1,745 | ) | ||||
| Core deposit intangibles, net |
$ | — | $ | 34 | ||||
127
Table of Contents
PALMETTO BANCSHARES, INC. AND SUBSIDIARY
Notes To Consolidated Financial Statements—(Continued)
| 7. | Mortgage-Banking Activities |
Mortgage loans serviced for the benefit of others amounted to $426.6 million and $377.3 million at December 31, 2009 and December 31, 2008, respectively, and are excluded from our Consolidated Balance Sheets.
The book value of mortgage-servicing rights at December 31, 2009 and December 31, 2008 was $3.0 million and $2.9 million, respectively. Mortgage-servicing rights are included within the Other assets financial statement line item of the Consolidated Balance Sheets. The fair value of mortgage-servicing rights at December 31, 2009 and December 31, 2008 was $3.6 million and $3.2 million, respectively.
Mortgage-Servicing Rights Activity
The following table summarizes the changes in the mortgage-servicing rights portfolio at the dates and for the periods indicated (in thousands).
| For the years ended December 31, |
||||||||
| 2009 | 2008 | |||||||
| Mortgage-servicing rights portfolio, net of valuation allowance, beginning of period |
$ | 2,932 | $ | 2,949 | ||||
| Capitalized mortgage-servicing rights |
1,378 | 864 | ||||||
| Mortgage-servicing rights portfolio amortization and impairment |
(1,271 | ) | (881 | ) | ||||
| Mortgage-servicing rights portfolio, net of valuation allowance, end of period |
$ | 3,039 | $ | 2,932 | ||||
Amortization
The following table summarizes the estimated amortization expense of our mortgage-servicing rights portfolio outstanding at December 31, 2009 for the periods indicated (in thousands).
| During the years ended December 31, |
|||
| 2010 |
$ | 903 | |
| 2011 |
710 | ||
| 2012 |
553 | ||
| 2013 |
426 | ||
| 2014 |
324 | ||
| Thereafter |
123 | ||
| $ | 3,039 | ||
128
Table of Contents
PALMETTO BANCSHARES, INC. AND SUBSIDIARY
Notes To Consolidated Financial Statements—(Continued)
Valuation Allowance
The following table summarizes the activity impacting the valuation allowance for impairment of the mortgage-servicing rights portfolio for the periods indicated (in thousands).
| For the years ended December 31, | |||||||||
| 2009 | 2008 | 2007 | |||||||
| Valuation allowance, beginning of period |
$ | 30 | $ | 10 | $ | 3 | |||
| Additions charged to and (reduction credited from) operations |
10 | 20 | 7 | ||||||
| Valuation allowance, end of period |
$ | 40 | $ | 30 | $ | 10 | |||
| 8. | Real Estate and Personal Property Acquired in Settlement of Loans |
Composition
The following table summarizes Real estate acquired in settlement of loans and personal property acquired in settlement of loans, which is included within the Other assets financial statement line item on the Consolidated Balance Sheets at the dates indicated (in thousands).
| December 31, | ||||||
| 2009 | 2008 | |||||
| Real estate acquired in settlement of loans |
$ | 27,826 | $ | 6,719 | ||
| Repossessed automobiles acquired in settlement of loans |
188 | 564 | ||||
| Total property acquired in settlement of loans |
$ | 28,014 | $ | 7,283 | ||
Real Estate Acquired in Settlement of Loans Activity
The following table summarizes the changes in the real estate acquired in settlement of loans portfolio at the dates and for the periods indicated (in thousands).
| At and for the years ended December 31, |
||||||||||||
| 2009 | 2008 | 2007 | ||||||||||
| Real estate acquired in settlement of loans, beginning of period |
$ | 6,719 | $ | 7,743 | $ | 600 | ||||||
| Plus: New real estate acquired in settlement of loans |
24,628 | 2,778 | 10,030 | |||||||||
| Less: Sales of real estate acquired in settlement of loans |
(761 | ) | (3,634 | ) | (2,707 | ) | ||||||
| Less: Provision charged to expense |
(2,760 | ) | (168 | ) | (180 | ) | ||||||
| Real estate acquired in settlement of loans, end of period |
$ | 27,826 | $ | 6,719 | $ | 7,743 | ||||||
At December 31, 2009, three assets with an aggregate net carrying amount of $7.3 million were under contract for sale to close in the first quarter of 2010. Of these, one property with a carrying amount of $1.7 million closed in February 2010 at a gain.
129
Table of Contents
PALMETTO BANCSHARES, INC. AND SUBSIDIARY
Notes To Consolidated Financial Statements—(Continued)
| 9. | Deposits |
Composition
The following table summarizes traditional deposit composition at the dates indicated (in thousands).
| December 31, | ||||||
| 2009 | 2008 | |||||
| Transaction deposit accounts |
$ | 449,867 | $ | 498,780 | ||
| Money market deposit accounts |
119,082 | 93,746 | ||||
| Savings deposit accounts |
40,335 | 36,623 | ||||
| Time deposit accounts $100,000 and greater |
263,664 | 180,083 | ||||
| Time deposit accounts less than $100,000 |
341,966 | 262,264 | ||||
| Total traditional deposit accounts |
$ | 1,214,914 | $ | 1,071,496 | ||
At December 31, 2009, $542 thousand of overdrawn transaction deposit accounts were reclassified to loans, compared with $1.2 million at December 31, 2008.
Time Deposit Account Maturities
The following table summarizes the maturities of time deposit accounts outstanding at December 31, 2009 during the periods indicated (in thousands).
| During the years ended December 31, |
|||
| 2010 |
$ | 464,910 | |
| 2011 |
119,259 | ||
| 2012 |
19,019 | ||
| 2013 |
728 | ||
| 2014 |
513 | ||
| Thereafter |
1,201 | ||
| $ | 605,630 | ||
Jumbo Time Deposit Accounts
Jumbo time deposit accounts are accounts with balances totaling $100,000 or greater at the date indicated. The following table summarizes the jumbo time deposit accounts by maturity at December 31, 2009 (in thousands).
| Three months or less |
$ | 138,672 | |
| Over three months through six months |
29,136 | ||
| Over six months through twelve months |
38,333 | ||
| Twelve months or less |
206,141 | ||
| Over twelve months |
57,523 | ||
| Total jumbo time deposit accounts |
$ | 263,664 | |
Jumbo time deposit accounts totaled $180.1 million at December 31, 2008.
130
Table of Contents
PALMETTO BANCSHARES, INC. AND SUBSIDIARY
Notes To Consolidated Financial Statements—(Continued)
Interest Expense on Deposit Accounts
The following table summarizes interest paid on traditional deposit accounts for the periods indicated (in thousands).
| For the years ended December 31, | |||||||||
| 2009 | 2008 | 2007 | |||||||
| Transaction deposit accounts |
$ | 526 | $ | 4,966 | $ | 10,152 | |||
| Money market deposit accounts |
602 | 1,922 | 3,977 | ||||||
| Savings deposit accounts |
132 | 129 | 139 | ||||||
| Time deposit accounts |
18,251 | 16,677 | 15,964 | ||||||
| Total interest expense on traditional deposit accounts |
$ | 19,511 | $ | 23,694 | $ | 30,232 | |||
131
Table of Contents
PALMETTO BANCSHARES, INC. AND SUBSIDIARY
Notes To Consolidated Financial Statements—(Continued)
| 10. | Borrowings |
The following table provides detail with respect to our borrowings composition at the dates and for the periods indicated (dollars in thousands).
| At and for the years ended December 31, |
||||||||||||
| 2009 | 2008 | 2007 | ||||||||||
| Retail repurchase agreements |
||||||||||||
| Amount outstanding at year-end |
$ | 15,545 | $ | 16,357 | $ | 11,280 | ||||||
| Average amount outstanding during year |
23,227 | 18,063 | 13,347 | |||||||||
| Maximum amount outstanding at any month-end |
29,461 | 21,817 | 13,772 | |||||||||
| Rate paid at year-end * |
0.25 | % | 0.25 | % | 2.63 | % | ||||||
| Weighted average rate paid during the year |
0.25 | 1.37 | 4.04 | |||||||||
| Commercial paper |
||||||||||||
| Amount outstanding at year-end |
$ | 19,061 | $ | 27,955 | $ | 26,326 | ||||||
| Average amount outstanding during year |
24,085 | 32,415 | 27,295 | |||||||||
| Maximum amount outstanding at any month-end |
27,041 | 37,487 | 32,667 | |||||||||
| Rate paid at year-end * |
0.25 | % | 0.25 | % | 2.81 | % | ||||||
| Weighted average rate paid during the year |
0.25 | 1.11 | 4.07 | |||||||||
| Other short-term borrowings—federal funds purchased from correspondent banks |
||||||||||||
| Amount outstanding at year-end |
$ | — | $ | 35,785 | $ | 18,000 | ||||||
| Average amount outstanding during year |
5,335 | 13,240 | 3,610 | |||||||||
| Maximum amount outstanding at any month-end |
17,295 | 38,171 | 18,000 | |||||||||
| Rate paid at year-end |
— | % | 0.68 | % | 4.32 | % | ||||||
| Weighted average rate paid during the year |
0.61 | 2.27 | 5.50 | |||||||||
| Other short-term borrowings—FHLB |
||||||||||||
| Amount outstanding at year-end |
$ | — | $ | 44,000 | $ | 12,000 | ||||||
| Average amount outstanding during year |
10,112 | 35,303 | 9,426 | |||||||||
| Maximum amount outstanding at any month-end |
69,000 | 59,000 | 24,000 | |||||||||
| Rate paid at year-end |
— | % | 0.46 | % | 4.56 | % | ||||||
| Weighted average rate paid during the year |
0.57 | 2.29 | 5.36 | |||||||||
| Long-term borrowings—FHLB |
||||||||||||
| Amount outstanding at year-end |
$ | 101,000 | $ | 52,000 | $ | — | ||||||
| Average amount outstanding during year |
68,054 | 41,415 | 4,521 | |||||||||
| Maximum amount outstanding at any month-end |
101,000 | 52,000 | 10,000 | |||||||||
| Rate paid at year-end |
2.01 | % | 2.90 | % | — | % | ||||||
| Weighted average rate paid during the year |
2.53 | 2.89 | 3.83 | |||||||||
| * | Rates paid are tiered based on level of deposit. Rate presented represents the average rate for all tiers offered at year end. |
132
Table of Contents
PALMETTO BANCSHARES, INC. AND SUBSIDIARY
Notes To Consolidated Financial Statements—(Continued)
Federal Funds Accommodations
At December 31, 2009, we had access to federal funds funding from a correspondent bank that is secured by U.S. Treasury and federal agency securities. The following table summarizes our federal funds funding utilization and availability at the dates indicated (in thousands).
| December 31, | |||||||
| 2009 | 2008 | ||||||
| Authorized federal funds funding accomodations |
$ | 5,000 | $ | 67,500 | |||
| Utilized federal funds funding accomodations |
— | (35,785 | ) | ||||
| Available federal funds funding accomodations |
$ | 5,000 | $ | 31,715 | |||
This federal funds funding source may be canceled at any time at the correspondent bank’s discretion.
FHLB Borrowings
As disclosed in Notes 3 and 4, we pledge investment securities and loans to collateralize FHLB advances and letters of credit. Additionally, we may pledged cash and cash equivalents. In order to compute lendable collateral amounts, the market value of pledged securities and loans balances is reduced by a 10% collateral discount factor. This amount is then adjusted by the institution assigned collateral maintenance level factor. Among other things, the collateral maintenance level factor takes into account our collateral credit score determined by the FHLB. As of December 31, 2009 and 2008, our collateral maintenance factors from the FHLB were 125% and 100%, respectively. Cash and cash equivalents, if pledged, are not subject to the 125% collateralization maintenance level. In January 2010, the Company was notified by the FHLB that it will not allow additional borrowings until our financial condition improves.
The following table summarizes FHLB borrowed funds utilization and availability at the dates indicated (in thousands).
| December 31, | ||||||||
| 2009 | 2008 | |||||||
| Available lendable loan collateral value to serve against FHLB advances and letters of credit |
$ | 162,014 | $ | 159,060 | ||||
| Available lendable investment security collateral value to serve against FHLB advances and letters of credit |
26,791 | 37,481 | ||||||
| Advances and letters of credit |
||||||||
| Short-term advances |
$ | — | $ | (44,000 | ) | |||
| Long-term advances |
(101,000 | ) | (52,000 | ) | ||||
| Letters of credit |
(50,000 | ) | (69,000 | ) | ||||
| Available lendable collateral value to serve against FHLB advances and letters of credit |
$ | 55 | $ | 31,541 | ||||
The following table summarizes long-term FHLB borrowings at December 31, 2009 (dollars in thousands). Our long-term FHLB advances do not have embedded call options.
| Total | ||||||||||||||||||||||||||||
| Borrowing balance |
$ | 5,000 | $ | 12,000 | $ | 19,000 | $ | 30,000 | $ | 30,000 | $ | 5,000 | $ | 101,000 | ||||||||||||||
| Interest rate |
2.57 | % | 2.75 | % | 0.63 | % | 1.34 | % | 2.89 | % | 3.61 | % | 2.01 | % | ||||||||||||||
| Maturity date |
3/8/2010 | 4/2/2010 | 1/7/2011 | 1/18/2011 | 3/7/2011 | 4/2/2013 | ||||||||||||||||||||||
133
Table of Contents
PALMETTO BANCSHARES, INC. AND SUBSIDIARY
Notes To Consolidated Financial Statements—(Continued)
Federal Reserve Discount Window
As of December 31, 2009, our borrowings capacity at the Federal Reserve was secured by a blanket lien on a portion of our commercial and consumer loan portfolios. Of the $108.8 million of loans pledged at December 31, 2009, $61.2 million was available as lendable collateral. We had no outstanding borrowings from the Federal Reserve at December 31, 2009.
| 11. | Shareholders’ Equity |
Authorized Common Shares
On May 19, 2009, the shareholders voted to amend the Company’s Articles of Incorporation to increase the authorized common stock from 10 million shares to 25 million shares.
Authorized Preferred Shares
On September 15, 2009, the shareholders voted to amend the Company’s Articles of Incorporation to authorize the issuance of up to 2.5 million shares of preferred stock with such preferences, limitations and relative rights, within legal limits, of the class, or one or more series within the class, as are set by the Board of Directors.
Cash Dividends
For the years ended December 31, 2009 and 2008, we paid quarterly cash dividends totaling $389 thousand, or $0.06 per common share, and $5.2 million, or $0.80 per common share, respectively. The Company and the Bank are subject to regulatory policies and requirements relating to the payment of dividends, including requirements to maintain adequate capital above regulatory minimums. Since our total risk-based capital ratio was 8.25% at December 31, 2009 which was below the well-capitalized regulatory minimum threshold of 10%, payment of a dividend on the Bank’s common stock requires prior notification and non-objection from the FDIC. See Note 20 for further discussion regarding our regulatory capital requirements and dividend restrictions.
| 12. | Income Taxes |
The following table summarizes income tax expense (benefit) attributable to continuing operations for the periods indicated (in thousands).
| For the years ended December 31, | |||||||||||
| 2009 | 2008 | 2007 | |||||||||
| Current |
|||||||||||
| Federal |
$ | (17,250 | ) | $ | 8,272 | $ | 6,947 | ||||
| State |
— | 610 | 724 | ||||||||
| Total current |
(17,250 | ) | 8,882 | 7,671 | |||||||
| Deferred |
|||||||||||
| Federal |
(4,878 | ) | (1,418 | ) | 728 | ||||||
| Total current and deferred |
$ | (22,128 | ) | $ | 7,464 | $ | 8,399 | ||||
The excess tax benefit from equity based awards recorded in shareholders’ equity was $133 thousand during the year ended December 31, 2009.
134
Table of Contents
PALMETTO BANCSHARES, INC. AND SUBSIDIARY
Notes To Consolidated Financial Statements—(Continued)
The Company had a net deferred tax asset of $5.8 million at December 31, 2009 and a net deferred tax asset of $607 thousand at December 31, 2008. The following table summarizes our net deferred tax asset and the tax impacts of temporary differences that gave rise to significant portions of these deferred tax assets and liabilities at the dates indicated (in thousands).
| December 31, | ||||||||
| 2009 | 2008 | |||||||
| Deferred tax assets |
||||||||
| Allowance for loan losses reserve |
$ | 8,428 | $ | 3,850 | ||||
| Nonaccrual loan interest |
546 | 557 | ||||||
| Real estate acquired in settlement of loans writedowns |
956 | 94 | ||||||
| Unrealized losses on investment securities available for sale |
— | 991 | ||||||
| Pension plan |
1,297 | 174 | ||||||
| Other |
248 | 58 | ||||||
| Total deferred tax assets, gross |
11,475 | 5,724 | ||||||
| Deferred tax liabilities |
||||||||
| Premises and equipment, due to depreciation differences |
(1,343 | ) | (1,095 | ) | ||||
| Basis of intangible assets for financial reporting purposes in excess of basis for tax purposes |
(673 | ) | (537 | ) | ||||
| Deferred loan costs deducted for tax purposes as incurred and deferred loan fees recognized under the principal reduction method for tax purposes |
(2,073 | ) | (2,209 | ) | ||||
| Unrealized gains on investment securities available for sale |
(187 | ) | — | |||||
| Mortgage-servicing rights |
(1,064 | ) | (1,026 | ) | ||||
| Prepaid expenses |
(290 | ) | (250 | ) | ||||
| Other |
(46 | ) | — | |||||
| Total deferred tax liabilities, gross |
(5,676 | ) | (5,117 | ) | ||||
| Deferred tax asset, net |
$ | 5,799 | $ | 607 | ||||
During 2009, the Internal Revenue Service extended the net operating loss carryback period from two years to five years. As of December 31, 2009, management’s analysis concluded that it is more likely than not that all of our net deferred income tax assets will be realizable based on available net operating loss carrybacks refundable from income taxes previously paid. As a result, no valuation allowance was recorded at December 31, 2009.
As a result of the tax net operating loss in 2009, the Company filed a tax refund claim receivable from carrybacks to 2004 – 2007 totaling $17.5 million. In addition, the Company filed federal and state tax refund claims for estimated taxes paid in 2009 totaling $3.5 million, of which $3.3 million related to the federal claim was received in February 2010.
Effective January 1, 2010, under the Internal Revenue Service rules, the available carryback years reverted from a five-year period to two years. The Company has carryback capacity in 2010 to recapture $7.9 million of taxes paid in 2008.
In accordance with FASB ASC 715, a current period deferred tax credit of $1.5 million was recorded against a charge of $4.3 million to shareholders’ equity relative to the Company’s noncontributory defined benefit pension plan.
135
Table of Contents
PALMETTO BANCSHARES, INC. AND SUBSIDIARY
Notes To Consolidated Financial Statements—(Continued)
The following table reconciles the Company’s statutory federal income tax rate to the effective income tax rate for the periods indicated.
| For the years ended December 31, |
|||||||||
| 2009 | 2008 | 2007 | |||||||
| U.S. federal income tax rate |
35.0 | % | 35.0 | % | 35.0 | % | |||
| Changes from statutory rates resulting from: |
|||||||||
| Tax-exempt income |
0.9 | (3.1 | ) | (2.7 | ) | ||||
| Expenses not deductible for tax purposes |
(0.2 | ) | 0.9 | 1.1 | |||||
| State taxes, net of Federal income tax benefit |
— | 1.9 | 1.9 | ||||||
| Other |
(0.1 | ) | 0.7 | (0.9 | ) | ||||
| Effective tax rate |
35.6 | % | 35.4 | % | 34.4 | % | |||
The Company is subject to U.S. federal and South Carolina state income tax. Tax authorities in various jurisdictions may examine the Company. During 2008, the Internal Revenue Service examined the Company for tax years 2006 through 2007. With few exceptions, the Company and the Bank are not subject to federal and state income tax examinations for taxable years prior to 2005.
At December 31, 2009 and 2008, the Company had no unrecognized tax benefits as a result of the requirements of FASB ASC 740.
| 13. | Employee Benefit Plans |
Defined Benefit Pension Plan
Historically, we have offered a noncontributory, defined benefit pension plan that covered all full-time employees having at least twelve months of continuous service and having attained age 21. During the fourth quarter of 2007, we notified employees that, effective 2008, it would cease accruing pension benefits for employees with regard to our noncontributory, defined benefit pension plan. Although no previously accrued benefits were lost, employees no longer accrue benefits for service subsequent to 2007.
The Company began recognizing the funded status of our defined benefit postretirement plan in our Consolidated Balance Sheet and provided additional required disclosures beginning with the year ended December 31, 2007. Gains and losses, prior service costs and credits, and any remaining transition amounts that had not yet been recognized through net periodic benefit cost as of December 31, 2007 are recognized in accumulated other comprehensive income, net of tax impacts, until they are amortized as a component of net periodic cost.
Unless a business entity remeasures both its plan assets and benefit obligations during the fiscal year, the funded status it reports in its Consolidated Balance Sheet will be the same asset or liability recognized in the previous year-end Consolidated Balance Sheet adjusted for subsequent accruals of net periodic benefit cost that exclude the amortization of amounts previously recognized in other comprehensive income and contributions to a funded plan, or benefit payments. We conformed our pension asset and pension and postretirement liabilities in accordance with the guidance issued by the FASB and recorded a corresponding reduction of $4.1 million, after-tax, to the December 31, 2007 balance of accumulated other comprehensive income (loss) in shareholders’ equity relative to the adoption of the this guidance. The Company recorded an additional reduction of $2.0 million, after-tax, to accumulated other comprehensive income (loss) in shareholders’ equity in order to recognize the
136
Table of Contents
PALMETTO BANCSHARES, INC. AND SUBSIDIARY
Notes To Consolidated Financial Statements—(Continued)
underfunded status of our defined benefit pension plan at December 31, 2008 and an additional reduction of $2.8 million, after-tax, to accumulated other comprehensive income (loss) in shareholders’ equity in order to recognize the underfunded status of our defined benefit pension plan at December 31, 2009.
Defined Benefit Pension Plan Funded Status. The following table summarizes the combined change in benefit obligation, defined benefit pension plan assets, and funded status of the Company’s defined benefit pension plan at the dates and for the periods indicated (in thousands) including the impact of the curtailment of accrued pension benefits and the adoption of the guidance issued by the FASB during the year ended December 31, 2007.
| At and for the years ended December 31, |
||||||||||||
| 2009 | 2008 | 2007 | ||||||||||
| Change in benefit obligation |
||||||||||||
| Benefit obligation, beginning of period |
$ | 11,270 | $ | 13,934 | $ | 14,692 | ||||||
| Service cost |
— | — | 722 | |||||||||
| Interest cost |
923 | 683 | 868 | |||||||||
| Impact of plan curtailment |
— | — | (2,508 | ) | ||||||||
| Net actuarial loss (gain) |
5,836 | (1,788 | ) | 598 | ||||||||
| Benefits paid |
(1,121 | ) | (1,559 | ) | (438 | ) | ||||||
| Benefit obligation, end of period |
16,908 | 11,270 | 13,934 | |||||||||
| Change in plan assets |
||||||||||||
| Fair value of plan assets, beginning of period |
10,774 | 15,914 | 14,798 | |||||||||
| Return on plan assets |
1,748 | (3,594 | ) | 455 | ||||||||
| Employer contribution |
1,801 | 13 | 1,099 | |||||||||
| Benefits paid |
(1,121 | ) | (1,559 | ) | (438 | ) | ||||||
| Fair value of plan assets, end of period |
13,202 | 10,774 | 15,914 | |||||||||
| Funded status |
(3,706 | ) | (496 | ) | 1,980 | |||||||
| Net prepaid |
7,473 | 6,422 | 5,806 | |||||||||
| Net actuarial loss |
(11,179 | ) | (6,918 | ) | (3,826 | ) | ||||||
| Income tax benefit |
(3,913 | ) | (2,422 | ) | (1,340 | ) | ||||||
| Accumulated other comprehensive loss impact |
$ | (7,266 | ) | $ | (4,496 | ) | $ | (2,486 | ) | |||
The Company’s accrued liability recognized, net at December 31, 2009 and 2008 is included in the Other liabilities financial statement line item on the Consolidated Balance Sheets. The Company’s accrued asset recognized, net at December 31, 2007 is included in the Other assets financial statement line item on the Consolidated Balance Sheets.
137
Table of Contents
PALMETTO BANCSHARES, INC. AND SUBSIDIARY
Notes To Consolidated Financial Statements—(Continued)
Cost of Defined Benefit Pension Plan. The following table summarizes the adjusted net periodic (income) expense components for the Company’s defined benefit pension plan, which is included in Salaries and other personnel expense on the Consolidated Statements of Income (Loss), for the periods indicated (in thousands).
| For the years ended December 31, |
||||||||||||
| 2009 | 2008 | 2007 | ||||||||||
| Service cost |
$ | — | $ | — | $ | 722 | ||||||
| Interest cost |
923 | 683 | 868 | |||||||||
| Expected return on plan assets |
(899 | ) | (1,267 | ) | (1,358 | ) | ||||||
| Amortization of prior service cost |
— | — | 5 | |||||||||
| Amortization of net actuarial (gain) loss |
725 | (19 | ) | 278 | ||||||||
| Net periodic pension (income) expense |
$ | 749 | $ | (603 | ) | $ | 515 | |||||
The service cost component of net periodic pension cost is the actuarial present value of benefits attributed by the plan’s benefit formula to services rendered by employees during the period. As a result of the Company’s decision to curtail the plan effective on January 1, 2008, no costs relative to this component of net periodic pension cost have been necessary since that date since employees did not accrue benefits for services rendered after that date.
Actuarial gains and losses are the unanticipated change in the unfunded liability over a given year, i.e. the excess of the actual unfunded liability over the predicted unfunded liability resulting from unanticipated events. Actuarial gains and losses result from actual asset returns deviating from the assumed rate, changes in the discount rate used to measure plan obligations, and other variances in demographic experience such as retirements and mortality.
Defined Benefit Pension Plan Assumptions. The following table summarizes the assumptions used in computing the benefit obligation and the adjusted net periodic (income) expense for the periods indicated.
| For the years ended December 31, |
|||||||||
| 2009 | 2008 | 2007 | |||||||
| Discount rate |
5.70 | % | 5.70 | % | 5.80 | % | |||
| Rate of increase in compensation levels |
n/a | 3.50 | 3.50 | ||||||
| Expected long-term rate of return on plan assets |
8.00 | 8.00 | 9.00 | ||||||
Defined Benefit Pension Plan Assets. The following table summarizes the fair value of defined benefit pension plan assets by major category at the dates indicated (in thousands).
| December 31, | ||||||
| 2009 | 2008 | |||||
| Investments, at fair value |
||||||
| Interest-bearing cash |
$ | 427 | $ | 789 | ||
| U.S. government and agency securities |
2,745 | 1,790 | ||||
| Corporate bonds |
2,951 | 2,562 | ||||
| Corporate stocks |
1,755 | 1,128 | ||||
| Palmetto Bancshares, Inc. common stock |
192 | 672 | ||||
| Pooled funds |
5,072 | 3,628 | ||||
| Accrued interest receivable |
60 | 205 | ||||
| Total assets |
$ | 13,202 | $ | 10,774 | ||
138
Table of Contents
PALMETTO BANCSHARES, INC. AND SUBSIDIARY
Notes To Consolidated Financial Statements—(Continued)
The investment objectives of the defined benefit pension plan assets are designed to maintain full funding with respect to the projected benefit obligation and to maximize returns in order to minimize contributions within reasonable and prudent levels of risk. The precise amount for which these obligations will be settled depends on future events, including the life expectancy of the defined benefit pension plan’s participants and salary inflation. The obligations are estimated using actuarial assumptions based on the current economic environment. The defined benefit pension plan’s investment strategy balances the requirement to generate return, using higher-returning assets, with the need to control risk using less volatile assets. Risks include, but are not limited to, inflation, volatility in equity values, and changes in interest rates that could cause the defined benefit pension plan to become underfunded, thereby increasing the defined benefit pension plan’s dependence on contributions from the Company.
Plan assets are managed by professional investment firms as well as by investment professionals that are employees of the Company as approved by the Board of Directors. The Compensation Committee of the Board of Directors is responsible for maintaining the investment policy of the defined benefit pension plan, approving the appointment of the investment manager, and reviewing the performance of the defined benefit pension plan assets at least annually.
Investments within the defined benefit pension plan are diversified with the intent to minimize the risk of large losses to the defined benefit pension plan. The total portfolio is constructed and maintained to provide prudent diversification within each investment category, and we assume that the volatility of the portfolio will be similar to the market as a whole. The asset allocation ranges represent a long-term perspective. Therefore, rapid unanticipated market shifts may cause the asset mix to fall outside the policy range. Such divergences should be short-term in nature.
Fair Value Measurements. FASB ASC 820 establishes a framework for measuring fair value and provides a fair value hierarchy that prioritizes the inputs to valuation techniques used to measure fair value. The hierarchy gives the highest priority to unadjusted quoted prices in active markets for identical assets or liabilities (Level 1 measurements) and the lowest priority to unobservable inputs (Level 3 measurements). For assets, fair value measurement is based upon quoted prices, if available. If quoted prices are not available, fair values are measured using independent pricing models or other model-based valuation techniques such as the present value of future cash flows, adjusted for the security’s credit rating, prepayment assumptions and other factors such as credit loss assumptions. Following is a description of the valuation in determining fair value measurements of defined benefit pension plan assets.
| • | Interest-bearing cash. Valued at the net asset value of units held by the pension plan at year-end. |
| • | U.S. government and agency securities. Valued at the closing price reported in the active market in which the individual securities are traded. |
| • | Corporate bonds. Valued at the closing price reported in the active market in which the bond is traded. |
| • | Corporate stocks. Valued at the closing price reported in the active market in which the individual securities are traded. |
| • | Palmetto Bancshares, Inc. common stock. Common stock of the Company is valued based on the average of the last five trades of the stock facilitated by the Company. At December 31, 2009, Company common stock included in the plan was 1.5% of total assets of the plan. |
| • | Pooled funds. Valued at the net asset value of units held by the pension plan at year-end. |
The preceding methods described may produce a fair value calculation that may not be indicative of net realizable value or reflective of future fair values. Furthermore, although we believe our valuation methods are
139
Table of Contents
PALMETTO BANCSHARES, INC. AND SUBSIDIARY
Notes To Consolidated Financial Statements—(Continued)
appropriate and consistent with other market participants, the use of different methodologies or assumptions to determine the fair value of certain financial instruments could result in a different fair value measurement at the reporting date.
The following table summarizes the defined benefit pension plan assets measured at fair value at December 31, 2009 aggregated by the level in the fair value hierarchy within which those measurements fall (in thousands).
| Level 1 | Level 2 | Level 3 | Total | |||||||||
| Pension assets |
$ | 1,755 | $ | 11,255 | $ | 192 | $ | 13,202 | ||||
The following table summarizes the changes in Level 3 assets measured at fair value on a recurring basis at the dates and for the period indicated (in thousands).
| Palmetto Bancshares, Inc. common stock |
||||
| Balance, December 31, 2008 |
$ | 672 | ||
| Total unrealized losses |
(480 | ) | ||
| Balance, December 31, 2009 |
$ | 192 | ||
Current and Future Expected Contributions. The Pension Protection Act of 2006 imposed a number of burdens on pension plans with an asset liability ratio of less than 80% with additional burdens imposed if the asset liability ratio falls below 60%. Due primarily to declining asset values, our plan was 66% funded at January 1, 2009. In order to eliminate the burdens resulting from this funded status, we contributed approximately $1.7 million to the defined benefit pension plan relative to 2008 and $104 thousand relative to 2009 on June 30, 2009. These contributions increased our asset liability ratio above the 80% threshold. Contributions to our defined benefit pension plan assets totaled $13 thousand during fiscal year 2008. Employer contributions in the amount of at least $78 thousand will be made during 2010. Additional contributions may be made depending on the funded status of the plan.
Expected Future Defined Benefit Pension Plan Payments. The following table summarizes the benefits expected to be paid for the periods indicated (in thousands).
| During the years ended December 31, |
|||
| 2010 |
$ | 742 | |
| 2011 |
747 | ||
| 2012 |
799 | ||
| 2013 |
861 | ||
| 2014 |
899 | ||
| 2015 - 2019 |
5,507 | ||
The expected benefits to be paid are based on the same assumptions used to measure the Company’s benefit obligation at December 31, 2009.
401(k) Plan
Employees are given the opportunity to participate in the Company’s 401(k) plan designed to supplement an employee’s retirement income. Under the plan, the Company makes contributions to a trust fund that will pay the
140
Table of Contents
PALMETTO BANCSHARES, INC. AND SUBSIDIARY
Notes To Consolidated Financial Statements—(Continued)
employee benefits at retirement. Prior to December 1, 2009, employees were eligible to participate in this plan after completing one year of service and reaching age 21. Effective December 1, 2009, employees are eligible to participate in the plan immediately when hired. Employees may withhold a percentage of compensation with certain limitations for deposit into the trust fund. Employees may terminate deferrals at any time. The Company makes matching contributions to each employee based on the employee’s deferral in a percentage set by the Company prior to the end of each plan year. The employer match for 2009 and 2008 was 3.6% and 3.0%, respectively. During the years ended December 31, 2009, 2008, and 2007, the Company made matching contributions to our employee 401(k) plan totaling $407 thousand, $327 thousand, and $302 thousand, respectively.
During 2007, in conjunction with the audit of the Company’s 401(k) Plan, an administrative error was discovered that resulted in participants being denied the opportunity to fully defer the appropriate amount of compensation under the plan. During 2007, the Company calculated and accrued the denied deferral amount and the resulting employer match, including missed earnings. Those amounts totaled approximately $1.6 million through December 31, 2007. Those amounts were recorded within salaries and other personnel expense on the Consolidated Statements of Income for the year ended December 31, 2007. The Company contributed these amounts to each participant’s account during the fourth quarter of 2007.
Collateral Split-Dollar Life Insurance Arrangements
On January 1, 2008, we changed our accounting policy and recognized a cumulative-effect adjustment to retained earnings totaling $99 thousand related to accounting for certain collateral split-dollar life insurance arrangements in connection with the adoption of certain provisions within FASB ASC 715. Deferred compensation expense related to such collateral split-dollar life insurance arrangements was less than $1 thousand for the years ended December 31, 2009 and 2008.
Bank-Owned Life Insurance
The Company has purchased life insurance policies on certain key employees. Such policies are recorded in the Other assets financial statement line item on the Consolidated Balance Sheets at their cash surrender value or the amount that can be realized. At December 31, 2009 and 2008, the cash surrender value of such policies totaled $1.6 million.
| 14. | Equity Based Compensation |
Stock Option Plan
General. Prior to 2009, the Company had in place several plans pursuant to which we may grant incentive and nonincentive stock options to certain key employees and directors of the Company. Our shareholders have approved all of the plans. The Board determines the terms of the options on the grant date. The option price must be at least 100% of fair value of our common stock as of the grant date, and the term of the options shall not be greater than 10 years. Under the Palmetto Bancshares, Inc. 1997 Stock Compensation Plan, we could grant nonqualified stock options and incentive stock options.
The Stock Compensation Plan originally provided for the issuance of 175,000 common shares, which were doubled in conjunction with a stock split in 2000 and increased by 100,000 in 2003. As provided in the Palmetto Bancshares, Inc. 1997 Stock Compensation Plan, as of close of business on December 8, 2007, the plan terminated, and no options have been granted under the plan after that date. However, the termination did not impact options
141
Table of Contents
PALMETTO BANCSHARES, INC. AND SUBSIDIARY
Notes To Consolidated Financial Statements—(Continued)
previously granted under the plan. All options expire at various dates through December 31, 2016. Of these, 147,210 remained outstanding at December 31, 2009 with exercise prices ranging from $13.50 to $30.40. All options granted had a vesting term of five years and an exercise period of ten years from date of grant.
Determining Fair Value.
| • | Valuation and Amortization Method. We estimate the fair value of stock options granted using the Black-Scholes option-pricing formula. This fair value is then amortized on a straight-line basis over the requisite service periods of the awards, which is generally the vesting period. |
| • | Dividend Yields. We estimate the expected dividend based on historical dividends declared per year, giving consideration for any anticipated changes and the estimated stock price over the expected term based on historical experience when using the Black-Scholes option-pricing formula to determine the fair value of options granted. |
| • | Expected Volatility. As of January 16, 2007, all options under the plan had been granted. Prior to April 2007, we used an annual independent stock appraisal to assist us in establishing the fair value of our common stock. We used these fair market valuations of the common stock to determine the estimated volatility factor for the Black-Scholes option-pricing formula. |
| • | Risk-Free Interest Rate. We base the risk-free interest rate used in the Black-Scholes option pricing formula on the implied yield currently available on U.S. Department of the Treasury zero coupon issues with the same or substantially equivalent remaining term as the expected term of the option at the time of grant. |
| • | Expected Term. The expected term represents the period that our stock option awards are expected to be outstanding. We base the expected term of options on our historical share option exercise experience. |
The following table summarizes the stock option awards granted by the Company, the fair value of each award granted as estimated on the date of grant using the Black-Scholes option-pricing model, and the weighted average assumptions used for the determination of fair value of such grants for the grant date indicated.
| Grant Date |
1/16/2007 | |||
| Stock option awards granted |
800 | |||
| Option price |
$ | 30.40 | ||
| Fair value of stock option awards granted |
$ | 6.24 | ||
| Expected dividend yields |
2.5 | % | ||
| Expected volatility |
13 | |||
| Risk-free interest rate |
5 | |||
| Expected term (years) |
10 | |||
| Vesting period (years) |
5 | |||
Stock Option Compensation Expense. The compensation cost that was charged against pretax income during 2009 for stock options was $64 thousand. The total income tax benefit recognized in the Consolidated Statements of Income (Loss) with regard to the deductible portion of this compensation cost was $6 thousand. The compensation cost that was charged against pretax net income during 2008 for stock options was $94 thousand. The total income tax benefit recognized in the Consolidated Statements of Income (Loss) with regard to the deductible portion of this compensation cost was $6 thousand. Management estimated that forfeitures would not be significant and is recognizing compensation costs for all equity based awards.
142
Table of Contents
PALMETTO BANCSHARES, INC. AND SUBSIDIARY
Notes To Consolidated Financial Statements—(Continued)
At December 31, 2009 and 2008, based on options outstanding at that time, the total compensation cost related to nonvested stock option awards granted under our stock option plan but not yet recognized was $31 thousand and $95 thousand, respectively, before the impact of income taxes. Stock option compensation expense is recognized on a straight-line basis over the vesting period of the option. This remaining compensation cost related to nonvested stock option awards at December 31, 2009 is expected to be recognized over a remaining period through 2011.
Stock Option Activity. The following table summarizes stock option activity for the Palmetto Bancshares, Inc. 1997 Stock Compensation Plan for the periods indicated.
| Stock options outstanding |
Weighted- average exercise price | |||||
| Outstanding at December 31, 2006 |
251,670 | $ | 18.67 | |||
| Granted |
800 | 30.40 | ||||
| Exercised |
(54,315 | ) | 12.93 | |||
| Outstanding at December 31, 2007 |
198,155 | 20.29 | ||||
| Granted |
— | — | ||||
| Forfeited |
(4,500 | ) | 20.00 | |||
| Exercised |
(24,325 | ) | 15.61 | |||
| Outstanding at December 31, 2008 |
169,330 | 20.98 | ||||
| Forfeited |
(18,120 | ) | 13.00 | |||
| Exercised |
(4,000 | ) | 26.60 | |||
| Outstanding at December 31, 2009 |
147,210 | $ | 21.80 | |||
Cash received from stock option exercises under our stock option plan for the years ended December 31, 2009, 2008, and 2007 was $106 thousand, $380 thousand, and $702 thousand, respectively.
Stock Options Outstanding. The following table summarizes information regarding stock options outstanding and exercisable at December 31, 2009.
| Options outstanding | Options exercisable | |||||||||||
| Exercise price or range of exercise prices |
Number of stock options outstanding at 12/31/09 |
Weighted- average remaining contractual life (years) |
Weighted- average exercise price |
Number of stock options exercisable at 12/31/09 |
Weighted- average exercise price | |||||||
| $13.50 |
7,800 | 1.00 | $ | 13.50 | 7,800 | $ | 13.50 | |||||
| $15.00 to $20.00 |
54,410 | 2.40 | 17.02 | 54,410 | 17.02 | |||||||
| $23.30 to $26.60 |
51,200 | 4.36 | 24.47 | 51,200 | 24.47 | |||||||
| $27.30 to $30.40 |
33,800 | 6.02 | 27.37 | 26,480 | 27.36 | |||||||
| Total |
147,210 | 3.84 | 21.80 | 139,890 | 21.51 | |||||||
At December 31, 2009, we determined the fair value of our common stock based on the average of the last five trades reported through our Private Trading System. The total intrinsic value of stock options exercised during the years ended December 31, 2009, 2008, and 2007 was $62 thousand, $631 thousand, and $1.5 million, respectively. At December 31, 2009, the fair value of our common stock did not exceed the exercise price of any options outstanding and exercisable.
143
Table of Contents
PALMETTO BANCSHARES, INC. AND SUBSIDIARY
Notes To Consolidated Financial Statements—(Continued)
Restricted Stock Plan
In 2008, the Company’s Board of Directors adopted, and the shareholders approved, the Palmetto Bancshares, Inc. 2008 Restricted Stock Plan, which provides for the grant of common stock awards to the Company’s employees, officers, and directors. A total of 250,000 shares of common stock have been reserved for issuance pursuant to awards under the plan subject to its anti-dilution provisions.
The first awards were granted under the 2008 Restricted Stock Plan during the year ended December 31, 2009. The following table summarizes restricted stock activity at the date and for the period indicated.
| Restricted stock outstanding |
Weighted- average grant price | |||||
| Granted, January 2009 |
37,540 | $ | 42.00 | |||
| Granted, October 2009 |
17,500 | 21.95 | ||||
| Forfeited |
(10,000 | ) | 42.00 | |||
| Outstanding at December 31, 2009 |
45,040 | $ | 34.21 | |||
5,508 restricted stock shares vested in 2009.
The value of the restricted stock awarded is established as the fair value of the stock at the time of the grant. We measure compensation cost for restricted stock awards at fair value and recognize compensation expense over the service period for awards expected to vest. As such, expense relative to 2009 grants equal is recognized ratably over the 5 year vesting period of the stock award grants. The compensation cost, taking into account the forfeitures of nonvested share awards, that was charged against pretax income during 2009 for restricted stock awards was $253 thousand. The total income tax benefit recognized in the Consolidated Statements of Income (Loss) with regard to the deductible portion of this compensation cost was $89 thousand. Forfeitures are accounted for by eliminating compensation expense for unvested shares as forfeitures occur. At December 31, 2009, based on restricted stock awards outstanding at that time, the total pretax compensation cost related to nonvested restricted stock awards granted under the restricted stock plan but not yet recognized was $1.3 million. This cost is expected to be recognized over a remaining period through 2014. The estimation of restricted stock awards that will ultimately vest requires judgment and, to the extent actual results or updated estimates differ from current estimates, such amounts will be recorded as a cumulative adjustment in the period estimates are revised.
At December 31, 2009, there was no intrinsic value associated with the restricted stock as the fair value did not exceed the fair value on the date of grant. At December 31, 2009, 204,960 shares were available for issuance under the plan.
Shares of restricted stock granted to employees under the 2008 Restricted Stock Plan are subject to restrictions as to continuous employment for a specified time period following the date of grant. During this period, the holder is entitled to full voting rights and dividends.
144
Table of Contents
PALMETTO BANCSHARES, INC. AND SUBSIDIARY
Notes To Consolidated Financial Statements—(Continued)
| 15. | Average Share Information |
The following table summarizes the reconciliation of the numerators and denominators of the basic and diluted net income (loss) per common share computations for the periods indicated.
| For the years ended December 31, | ||||||||||
| 2009 | 2008 | 2007 | ||||||||
| Weighted average common shares outstanding—basic |
6,449,754 | 6,438,071 | 6,390,858 | |||||||
| Dilutive impact resulting from potential common share issuances |
— | 81,778 | 86,805 | |||||||
| Weighted average common shares outstanding—diluted |
6,449,754 | 6,519,849 | 6,477,663 | |||||||
| Per Share Data |
||||||||||
| Net income (loss)—basic |
$ | (6.21 | ) | $ | 2.11 | $ | 2.51 | |||
| Net income (loss)—diluted |
(6.21 | ) | 2.09 | 2.47 | ||||||
Basic net income (loss) per share is computed by dividing net income (loss) available to common shareholders by the weighted average number of shares of common stock outstanding during the period. For diluted net income per share, the denominator is increased to include the number of additional common shares that would have been outstanding if dilutive potential common shares had been issued. If dilutive, common stock equivalents are calculated for stock options and restricted stock shares using the treasury stock method.
In accordance with FASB ASC 260 including potential common shares in the denominator of the diluted per share computation for continuing operations results in an antidilutive per share amount when an entity has a loss from continuing operations. As such, no potential common shares were included in the computation of the diluted per share amount for the year ended December 31, 2009.
| 16. | Commitments, Guarantees, and Other Contingencies |
Lending Commitments and Standby Letters of Credit
Unused lending commitments to customers are not recorded in our Consolidated Balance Sheets until funds are advanced. For commercial customers, lending commitments generally take the form of unused revolving credit arrangements to finance customers’ working capital requirements. For retail customers, lending commitments are generally unused lines of credit secured by residential property.
The following table summarizes the contractual amounts of our unused lending commitments relating to extension of credit with off-balance sheet risk at December 31, 2009 (in thousands).
| Commitments to extend credit: |
|||
| Revolving, open-end lines secured by single-family residential properties |
$ | 51,159 | |
| Bankcard lines |
40,617 | ||
| Commercial real estate, construction, and land development loans secured by real estate |
|||
| Single-family residential construction loan commitments |
2,565 | ||
| Commercial real estate, other construction loan, and land development loan commitments |
23,873 | ||
| Other |
51,947 | ||
| Total commitments to extend credit |
$ | 170,161 | |
145
Table of Contents
PALMETTO BANCSHARES, INC. AND SUBSIDIARY
Notes To Consolidated Financial Statements—(Continued)
Commitments to fund “other” loans are comprised primarily of overdraft protection lines and lines related to commercial and industrial loans.
Standby letters of credit are issued for customers in connection with contracts between the customers and third parties. Letters of credit are conditional commitments issued by us to guarantee the performance of a customer to a third party. The maximum potential amount of undiscounted future payments related to letters of credit at December 31, 2009 was $4.6 million compared with $8.6 million at December 31, 2008.
The reserve for unfunded commitments at December 31, 2009 was $128 thousand and is recorded in the Other liabilities financial statement line item in the Consolidated Balance Sheet.
Loan Participations
With regard to participations sold aggregating $26.3 million at December 31, 2009 ($12.5 million of which related to gross loan balances and $13.8 million of which related to the contractual real estate acquired in settlement of loan balances), we serve as the lead bank and are therefore responsible for certain administration and other management functions as agent to the participating banks. The participation agreements include certain standard representations and warranties related to our duties to the participating banks.
Derivatives
See Note 17 for further discussion regarding our off-balance sheet arrangements and commitments related to our derivative loan commitments and freestanding derivatives.
Long-Term Contractual Obligations
In addition to the contractual commitments and arrangements previously described, the Company enters into other contractual obligations in the ordinary course of business. The following table summarizes these contractual obligations at December 31, 2009 (in thousands) except obligations for employee benefit plans as these obligations are paid from separately identified assets. See Note 13 for discussion regarding this employee benefit plan.
| Other contractual obligations |
Less than one year |
Over one through three years |
Over three through five years |
Over five years |
Total | ||||||||||
| Real property operating lease obligations |
$ | 1,991 | $ | 3,597 | $ | 3,203 | $ | 14,272 | $ | 23,063 | |||||
| Time deposit accounts |
464,910 | 138,278 | 1,241 | 1,201 | 605,630 | ||||||||||
| Long-term borrowings |
17,000 | 79,000 | 5,000 | — | 101,000 | ||||||||||
| Total other contractual obligations |
$ | 483,901 | $ | 220,875 | $ | 9,444 | $ | 15,473 | $ | 729,693 | |||||
Obligations under noncancelable real property operating lease agreements noted above are payable over several years with the longest obligation expiring in 2029. Option periods that the Company has not yet exercised are not included in the preceding table.
Real property operating lease obligations summarized in the preceding table:
| • | Are net of payments to be received under a sublease agreement with a third party with regard to the Company’s previous Blackstock Road banking office for which we are contracted under a lease agreement as Lessee. This lease is scheduled to expire in 2010. |
| • | Include obligations with regard to three banking offices that were consolidated during 2008 that are leased by the Company and currently vacant. Two of the leases are scheduled to expire in 2010. Management is considering options with regard to the remaining leased location. |
146
Table of Contents
PALMETTO BANCSHARES, INC. AND SUBSIDIARY
Notes To Consolidated Financial Statements—(Continued)
| • | Do not include periodic increases in lease payments for the Rock Hill operating building lease and operating lease for additional office space. Lease payment increases are subject to consumer price index changes. Management does not believe that future minimum lease payments relative to these locations will significantly differ from current obligations at December 31, 2009. Therefore, current lease obligations have been used to determine the operating lease obligations in the preceding table. Obligations under these operating lease agreements are payable over several years with the building lease expiring in 2015 and the additional office space lease expiring in 2011. |
| • | Do not include the parking leases in downtown Greenville which are paid month-to-month. |
We relocated our corporate headquarters to downtown Greenville, South Carolina during March 2009. During 2007, we executed a build-to-suit operating lease agreement in conjunction with our new corporate headquarters in Greenville County. Upon occupancy, these lease payments were replaced with those required by the build-to-suit operating lease agreement dated May 2, 2007.
The Company enters into agreements with third parties with respect to the leasing, servicing, and maintenance of equipment. However, because we believe that these agreements are immaterial when considered individually, or in the aggregate, with regard to our Consolidated Financial Statements, we have not included such agreements in the preceding contractual obligations table. Therefore, management believes that noncompliance with terms of such agreements would not have a material impact on our business, financial condition, results of operations, and cash flows. Furthermore, as most such commitments are entered into for a 12-month period with option extensions, long-term obligations beyond 2010 cannot be reasonably estimated at this time.
Short-Term Contractual and Noncontractual Obligations
Annually, in conjunction with our budgeting process, capital expenditures are approved for the coming year. During the budgeting process for 2010, the Board of Directors approved $2.5 million in capital expenditures related to technology and facilities. Generally, purchase obligations are not made in advance of such purchases, although to obtain discounted pricing we may enter into such arrangements. In addition, management anticipates that expenditures will be required during 2010 that could not have been expected and, therefore, were not approved in the budgeting process. Funds to fulfill both budgeted and nonbudgeted commitments will come from our operational cash flows.
Although we expect to make capital expenditures in years subsequent to 2010, capital expenditures are reviewed by management on an annual basis. Therefore, we have not yet estimated such capital expenditure obligations for years subsequent to 2010.
Capital Expenditure Obligations
Remaining capital expenditure obligations relative to our relocated Greer banking office and corporate headquarters were estimated between $500 thousand and $1 million at December 31, 2008. All obligations were satisfied during the year ended December 31, 2009.
Legal Proceedings
We are subject to actual and threatened legal proceedings and other claims against us arising out of the conduct of our business. Some of these suits and proceedings seek damages, fines, or penalties. These suits and proceedings are being defended by, or contested on behalf of, us. On the basis of information presently available, we do not believe that existing proceedings and claims will have a material effect on our financial position or results of operations.
147
Table of Contents
PALMETTO BANCSHARES, INC. AND SUBSIDIARY
Notes To Consolidated Financial Statements—(Continued)
| 17. | Derivative Financial Instruments and Hedging Activities |
At December 31, 2009 and 2008, our only derivative instruments related to our residential mortgage lending activities.
Commitments to originate conforming loans totaled $7.0 million at December 31, 2009. At December 31, 2009, these derivative loan commitments had positive fair values, included within the Other assets financial statement line item of the Consolidated Balance Sheet, totaling approximately $52 thousand, and negative fair values, included within the Other liabilities financial statement line item of the Consolidated Balance Sheet, totaling approximately $11 thousand, resulting in net derivative loan commitment income totaling approximately $41 thousand for the year ended December 31, 2009.
Forward sales commitments totaled $10.0 million at December 31, 2009. At December 31, 2009, forward sales commitments had positive fair values, included within the Other assets financial statement line item of the Consolidated Balance Sheet, totaling $92 thousand, and negative fair values, included within the Other liabilities financial statement line item of the Consolidated Balance Sheet, totaling approximately $1 thousand, resulting in net forward sales commitment income totaling approximately $91 thousand for the year ended December 31, 2009.
At December 31, 2008, the fair value of our derivative assets related to derivative loan commitments and forward loan sales commitments was not material.
| 18. | Disclosures Regarding Fair Value |
Valuation Methodologies
Following is a description of the valuation methodologies used for fair value measurements.
Investment Securities Available for Sale. Investment securities available-for-sale are recorded at fair value on a recurring basis. Fair value measurement is based upon quoted prices, if available. If quoted prices are not available, fair values are measured using independent pricing models or other model-based valuation techniques such as the present value of future cash flows, adjusted for the security’s credit rating, prepayment assumptions and other factors such as credit loss assumptions. Level 1 securities include those traded on an active exchange, such as the New York Stock Exchange, U.S. Treasury and federal agencies that are traded by dealers or brokers in active over-the-counter markets, and money market funds. Level 2 securities include mortgage-backed securities issued by government sponsored entities, state and municipal bonds, and corporate debt securities. Securities classified as Level 3 include asset-backed securities in less liquid markets.
Mortgage Loans Held for Sale. Mortgage loans held for sale are carried at the lower of cost or fair value. The fair value of mortgage loans held for sale is based on what secondary markets are currently offering for portfolios with similar characteristics. As such, we classify loans subjected to nonrecurring fair value adjustments as Level 2.
Loans. We do not record loans at fair value on a recurring basis. However, from time to time, a loan is considered impaired and a specific allowance for loan losses is established or the loan is charged down to the fair value less costs to sell. Once a loan is identified as individually impaired, management measures impairment. The fair value of impaired loans is estimated using one of several methods, including collateral value and discounted cash flows. Those impaired loans not requiring an allowance represent loans for which the net present value of the expected cash flows or fair value of the collateral less costs to sell exceed the recorded investments in such loans. At December 31, 2009, substantially all of the total impaired loans were evaluated based on the
148
Table of Contents
PALMETTO BANCSHARES, INC. AND SUBSIDIARY
Notes To Consolidated Financial Statements—(Continued)
fair value of the collateral. When the fair value of the collateral is based on an observable market price or a current appraised value, we record the impaired loan as nonrecurring Level 2. When an appraised value is not available or management determines the fair value of the collateral is further impaired below the appraised value and there is no observable market price, we record the impaired loan as nonrecurring Level 3.
Goodwill. Goodwill is subject to impairment testing. We test goodwill for impairment by comparing the business unit’s carrying value to the implied fair value. In the event the fair value is determined to be less than the carrying value, the asset is recorded at fair value as determined by the valuation model. As such, if applicable, we classify goodwill subjected to nonrecurring fair value adjustments as Level 3.
Real Estate and Personal Property Acquired in Settlement of Loans. Real estate and personal property acquired in settlement of loans is adjusted to fair value upon transfer of the loans. Subsequently, such assets are carried at the lower of carrying value or fair value less costs to sell. Fair value is based upon independent market prices, appraised values of the collateral, or management’s estimation of the value of the collateral. When the fair value of the collateral is based on an observable market price or a current appraised value, we record the asset as nonrecurring Level 2. When an appraised value is not available or management determines the fair value of the collateral is further impaired below the appraised value and there is no observable market price, we record the asset as nonrecurring Level 3.
Derivative Financial Instruments. Currently, we enter into loan commitments and forward sales commitments. The valuation of these instruments is computed using internal valuation models utilizing observable market-based inputs. As such, we classify derivative financial instruments subjected to recurring fair value adjustments as Level 2.
Assets and Liabilities Measured at Fair Value on a Recurring Basis
The following table summarizes our assets and liabilities measured at fair value on a recurring basis at December 31, 2009 aggregated by the level in the fair value hierarchy within which those measurements fall (in thousands).
| Level 1 | Level 2 | Level 3 | Total | |||||||||
| Assets |
||||||||||||
| Investment securities available for sale |
$ | 16,297 | $ | 63,371 | $ | 40,318 | $ | 119,986 | ||||
| Derivative financial instruments |
— | 144 | — | 144 | ||||||||
| Total assets |
$ | 16,297 | $ | 63,515 | $ | 40,318 | $ | 120,130 | ||||
| Liabilities |
||||||||||||
| Derivative financial instruments |
$ | — | $ | 12 | $ | — | $ | 12 | ||||
The following table summarizes the detail of investment securities available for sale fair value measurements from brokers or third party pricing services by level at December 31, 2009 (in thousands).
| Level 1 | Level 2 | Level 3 | Total | |||||||||
| Brokers |
$ | — | $ | — | $ | 40,318 | $ | 40,318 | ||||
| Third party pricing services |
16,297 | 63,371 | — | 79,668 | ||||||||
| Total |
$ | 16,297 | $ | 63,371 | $ | 40,318 | $ | 119,986 | ||||
149
Table of Contents
PALMETTO BANCSHARES, INC. AND SUBSIDIARY
Notes To Consolidated Financial Statements—(Continued)
The following table reconciles the beginning and ending balances of fair value measurements using significant unobservable inputs on a recurring basis at the dates and for the period indicated (in thousands).
| Investment securities available for sale |
||||
| Balance, December 31, 2008 |
$ | 54,639 | ||
| Total unrealized gain included in: |
||||
| Net income |
— | |||
| Accumulated other comprehensive income |
1,204 | |||
| Purchases, sales, issuances, and settlements, net |
(15,525 | ) | ||
| Transfers in and (out) of level three |
— | |||
| Balance, December 31, 2009 |
$ | 40,318 | ||
See Note 13 for detailed disclosure regarding the fair value of defined benefit pension plan assets at December 31, 2009.
Assets and Liabilities Measured at Fair Value on a Nonrecurring Basis
The following table summarizes our assets and liabilities measured at fair value on a nonrecurring basis at December 31, 2009 aggregated by the level in the fair value hierarchy within which those measurements fall (in thousands).
| Level 1 | Level 2 | Level 3 | Total | |||||||||
| Assets |
||||||||||||
| Impaired loans, net |
$ | — | $ | 75,209 | $ | 14,097 | $ | 89,306 | ||||
| Real estate and personal property acquired in settlement of loans |
— | 25,522 | 2,492 | 28,014 | ||||||||
| Total assets |
$ | — | $ | 100,731 | $ | 16,589 | $ | 117,320 | ||||
Carrying Amounts and Estimated Fair Value at Principal Financial Assets and Liabilities
For assets and liabilities that are not presented on the balance sheet at fair value, we use the following methods to determine fair value:
For financial instruments that have quoted market prices, those quotes are used to determine fair value. Financial instruments that have no defined maturity, have a remaining maturity of 180 days or less, or reprice frequently to a market rate, are assumed to have a fair value that approximates reported book value. If no market quotes are available, financial instruments are valued by discounting the expected cash flows using an estimated current market interest rate for the financial instrument.
The short maturity of our assets and liabilities results in having a significant number of financial instruments whose fair value equals or closely approximates carrying value. Such financial instruments are reported in the following balance sheet captions: cash and cash equivalents, mortgage loans held for sale, retail repurchase agreements, commercial paper, and other short-term borrowings.
Fair value estimates are made at a specific point in time based on relevant market information and information about the financial instrument. These estimates do not reflect the premium or discount on any particular financial instrument that could result from the sale of our entire holdings. Because no ready market exists for a significant portion of our financial instruments, fair value estimates are based on many judgments.
150
Table of Contents
PALMETTO BANCSHARES, INC. AND SUBSIDIARY
Notes To Consolidated Financial Statements—(Continued)
These estimates are subjective in nature and involve uncertainties and matters of significant judgment and therefore cannot be determined with precision. Changes in assumptions could significantly impact the estimates.
Fair value estimates are based on existing on and off-balance sheet financial instruments without attempting to estimate the value of anticipated future business and the value of assets and liabilities that are not considered financial instruments. Significant assets and liabilities that are not considered financial instruments include those resulting from our mortgage-banking operations, the value of the long-term relationships with the Company’s deposit customers, deferred income taxes, and premises and equipment. In addition, the tax ramifications related to the realization of the unrealized gains and losses can have a significant impact on fair value estimates and have not been considered in the estimates.
Commitments to extend credit and standby letters of credit are generally short-term, and commitments to extend credit are generally at variable market rates. Standby letters of credit generally have no associated rate unless funding occurs. As such, commitments to extend credit and standby letters of credit are deemed to have no material fair value.
The following table summarizes the carrying amount and fair values for other financial instruments included in our Consolidated Balance Sheets at the dates indicated (in thousands).
| December 31, 2009 | December 31, 2008 | |||||||||||
| Carrying amount |
Fair value | Carrying amount |
Fair value | |||||||||
| Assets |
||||||||||||
| Loans, gross |
$ | 945,864 | $ | 912,277 | $ | 1,121,012 | $ | 1,179,667 | ||||
| Total assets |
$ | 945,864 | $ | 912,277 | $ | 1,121,012 | $ | 1,179,667 | ||||
| Liabilities |
||||||||||||
| Deposits |
$ | 1,214,914 | $ | 1,206,857 | $ | 1,071,496 | $ | 1,079,681 | ||||
| Long-term borrowings |
101,000 | 100,119 | 52,000 | 49,808 | ||||||||
| Total liabilities |
$ | 1,315,914 | $ | 1,306,976 | $ | 1,123,496 | $ | 1,129,489 | ||||
| 19. | Holding Company Condensed Financial Information |
Since the Company is a holding company and does not conduct operations, its primary sources of liquidity are equity issuances, dividends upstreamed from the Bank, funds received through stock option exercises, and funds received through the offering of commercial paper as an alternative investment tool for our commercial customers (referred to as our master note program). Through the master note arrangement between the Company and the Bank, Palmetto Master Notes are issued as an alternative investment for commercial sweep accounts. These master notes are unsecured but are backed by the full faith and credit of the Company. The commercial paper is issued only in conjunction with deposits to automated sweep accounts at the Bank level. While they have not indicated any intention to do so, the Federal Reserve, as regulator for the Company, could require that we discontinue this program.
151
Table of Contents
PALMETTO BANCSHARES, INC. AND SUBSIDIARY
Notes To Consolidated Financial Statements—(Continued)
The following tables summarize the holding company’s financial condition, results of operations, and cash flows at the dates and for the periods indicated (in thousands).
Condensed Balance Sheets
| December 31, | ||||||
| 2009 | 2008 | |||||
| Assets |
||||||
| Cash and cash equivalents |
$ | 1,050 | $ | — | ||
| Due from subsidiary |
19,486 | 27,949 | ||||
| Investment in subsidiary |
74,009 | 115,067 | ||||
| Goodwill |
704 | 704 | ||||
| Other |
114 | 11 | ||||
| Total assets |
$ | 95,363 | $ | 143,731 | ||
| Liabilities and shareholders’ equity |
||||||
| Commercial paper |
$ | 19,061 | $ | 27,955 | ||
| Prepaid compensation |
1,287 | — | ||||
| Shareholders’ equity |
75,015 | 115,776 | ||||
| Total liabilities and shareholders’ equity |
$ | 95,363 | $ | 143,731 | ||
Condensed Statements of Income (Loss)
| For the years ended December 31, |
||||||||||||
| 2009 | 2008 | 2007 | ||||||||||
| Interest income from commercial paper (Master notes) |
$ | 60 | $ | 359 | $ | 1,110 | ||||||
| Dividends received from subsidiary |
389 | 4,616 | 4,348 | |||||||||
| Equity in undistributed earnings (loss) of subsidiary |
(40,412 | ) | 8,984 | 11,746 | ||||||||
| Interest expense on commercial paper (Master notes) |
(60 | ) | (359 | ) | (1,110 | ) | ||||||
| Other operating income |
— | — | 22 | |||||||||
| Other operating expense |
(62 | ) | (1 | ) | (101 | ) | ||||||
| Net income (loss) |
$ | (40,085 | ) | $ | 13,599 | $ | 16,015 | |||||
152
Table of Contents
PALMETTO BANCSHARES, INC. AND SUBSIDIARY
Notes To Consolidated Financial Statements—(Continued)
Condensed Statements of Cash Flows
| For the years ended December 31, |
||||||||||||
| 2009 | 2008 | 2007 | ||||||||||
| Operating Activities |
||||||||||||
| Net income (loss) |
$ | (40,085 | ) | $ | 13,599 | $ | 16,015 | |||||
| Adjustments to reconcile net income (loss) to net cash provided by |
||||||||||||
| Decrease (increase) in due from subsidiary |
8,463 | (1,626 | ) | (5,335 | ) | |||||||
| Increase in equity in undistributed loss (earnings) of subsidiary |
40,412 | (8,984 | ) | (11,746 | ) | |||||||
| (Increase) decrease in other assets |
(103 | ) | 2 | (13 | ) | |||||||
| Increase in other liabilities |
1,540 | — | — | |||||||||
| Net cash provided by (used in) operating activities |
10,227 | 2,991 | (1,079 | ) | ||||||||
| Financing Activities |
||||||||||||
| (Decrease) increase in commercial paper |
(8,894 | ) | 1,629 | 5,338 | ||||||||
| Proceeds from exercise of stock options |
106 | 380 | 702 | |||||||||
| Cash dividends declared and paid on common stock |
(389 | ) | (5,153 | ) | (4,926 | ) | ||||||
| Net cash provided by (used in) financing activities |
(9,177 | ) | (3,144 | ) | 1,114 | |||||||
| Net increase (decrease) in cash and cash equivalents |
1,050 | (153 | ) | 35 | ||||||||
| Cash and cash equivalents, beginning of the period |
— | 153 | 118 | |||||||||
| Cash and cash equivalents, end of the period |
$ | 1,050 | $ | — | $ | 153 | ||||||
| 20. | Regulatory Capital Requirements and Dividend Restrictions |
Capital Requirements
The following table summarizes the Company’s and the Bank’s actual and required capital ratios at the dates indicated (dollars in thousands). Although our Tier 1 leverage ratio and Tier 1 risk-based capital ratios were above the well-capitalized regulatory minimum threshold of 5% and 6%, respectively, at December 31, 2009, our total risk-based capital ratio was below the well-capitalized regulatory minimum threshold of 10%. Therefore we were classified in the adequately-capitalized category at December 31, 2009.
153
Table of Contents
PALMETTO BANCSHARES, INC. AND SUBSIDIARY
Notes To Consolidated Financial Statements—(Continued)
Since December 31, 2009, no conditions or events have occurred, of which we are aware, that have resulted in a material change in the Company’s or the Bank’s category other than as reported in this Annual Report on Form 10-K.
| Actual | For capital adequacy purposes |
To be “well capitalized” under prompt corrective action provisions |
||||||||||||||||
| amount | ratio | amount | ratio | amount | ratio | |||||||||||||
| At December 31, 2009 |
||||||||||||||||||
| Total capital to risk-weighted assets |
||||||||||||||||||
| Company |
$ | 93,298 | 8.25 | % | $ | 90,426 | 8.00 | % | n/a | n/a | % | |||||||
| Bank |
93,013 | 8.22 | 90,518 | 8.00 | $ | 113,147 | 10.00 | |||||||||||
| Tier 1 capital to risk-weighted assets |
||||||||||||||||||
| Company |
79,046 | 6.99 | 45,213 | 4.00 | n/a | n/a | ||||||||||||
| Bank |
78,745 | 6.96 | 45,259 | 4.00 | 67,888 | 6.00 | ||||||||||||
| Tier 1 leverage ratio |
||||||||||||||||||
| Company |
79,046 | 5.55 | 56,951 | 4.00 | n/a | n/a | ||||||||||||
| Bank |
78,745 | 5.52 | 57,042 | 4.00 | 71,302 | 5.00 | ||||||||||||
| At December 31, 2008 |
||||||||||||||||||
| Total capital to risk-weighted assets |
||||||||||||||||||
| Company |
$ | 128,876 | 10.44 | % | $ | 98,750 | 8.00 | % | n/a | n/a | % | |||||||
| Bank |
128,872 | 10.44 | 98,750 | 8.00 | $ | 123,437 | 10.00 | |||||||||||
| Tier 1 capital to risk-weighted assets |
||||||||||||||||||
| Company |
117,876 | 9.55 | 49,375 | 4.00 | n/a | n/a | ||||||||||||
| Bank |
117,872 | 9.55 | 49,375 | 4.00 | 74,062 | 6.00 | ||||||||||||
| Tier 1 leverage ratio |
||||||||||||||||||
| Company |
117,876 | 8.70 | 54,220 | 4.00 | n/a | n/a | ||||||||||||
| Bank |
117,872 | 8.69 | 54,240 | 4.00 | 67,800 | 5.00 | ||||||||||||
Restrictions
Deposits. As a result of being adequately-capitalized at December 31, 2009, although we had none at or since December 31, 2009, we may not accept brokered deposits unless a waiver has been granted by the FDIC. Additionally, we are restricted from offering an effective yield of more than 75 basis points over the national rates published by the FDIC weekly on their website.
Dividends. The holders of the Company’s common stock are entitled to receive dividends, when and if declared by the Company’s Board of Directors, out of funds legally available for such dividends. The Company is a legal entity separate and distinct from the Bank and depends on the payment of dividends from the Bank. The Company and the Bank are subject to regulatory policies and requirements relating to the payment of dividends
154
Table of Contents
PALMETTO BANCSHARES, INC. AND SUBSIDIARY
Notes To Consolidated Financial Statements—(Continued)
including requirements to maintain adequate capital above regulatory minimums. Federal regulatory authorities are authorized to determine under certain circumstances that the payment of dividends by a bank holding company or a bank would be an unsafe or unsound practice and to prohibit payment of those dividends. Federal regulatory authorities have indicated that banking organizations should generally pay dividends only out of current income. In addition, as a South Carolina chartered bank, the Bank is subject to limitations on the amount of dividends that it is permitted to pay. As a result of our being adequately-capitalized at December 31, 2009, we are restricted from declaring and paying a dividend on the Bank’s common stock without prior notification and non-objection from the FDIC.
Other. Based on discussions with the FDIC following its most recent safety and soundness examination of the Bank in November 2009, the Bank presently expects to receive a written agreement from the FDIC at some point in 2010 which could require the Bank to take certain actions to address concerns raised in the examination. If the Bank were to receive a written agreement, and if the Bank were to fail to comply with the requirements in such written agreement, it may be subject to further regulatory action.
To raise additional capital, we have engaged an investment banking firm and are executing a capital plan that may include issuing common stock, preferred stock, or a combination of both, debt, or other financing alternatives that are treated as capital for capital adequacy ratio purposes at the Bank. Currently, our plan is to raise additional capital in the first half of 2010 and we are in active discussion with potential investors; however, the Board of Directors has not yet determined the type, timing, amount or terms of securities to be issued in the offering and there are no assurances that the offering will be completed.
| 21. | Related Party Transactions |
FASB ASC 850, Related Party Disclosures, provides guidance regarding transactions with related parties. Financial statements must include disclosures of material related party transactions.
Intercompany Transactions
Intercompany transactions include activities between the Company and the Bank, as well as between the Bank, Palmetto Capital, and other subsidiaries. The former includes transactions described in Note 19. The Bank’s trust department also manages certain of the assets of our employee benefit plans.
Related Party Transactions
Certain directors, executive officers, and their related interests are loan customers of the Bank. All such loans were made on substantially the same terms, including interest rates and collateral, as those prevailing at the same time for comparable transactions. The total loans outstanding to these related parties aggregated approximately $12.9 million and $14.2 million at December 31, 2009 and 2008, respectively.
To raise additional capital, we have engaged an investment banking firm and are executing a capital plan that may include issuing common stock, preferred stock, or a combination of both, debt, or other financing alternatives that are treated as capital for capital adequacy ratio purposes at the Bank. Currently, our plan is to raise additional capital in the first half of 2010, and we are in active discussion with potential investors; however, the Board of Directors has not yet determined the type, timing, amount, or terms of securities to be issued in the offering, and there are no assurances that the offering will be completed.
155
Table of Contents
PALMETTO BANCSHARES, INC. AND SUBSIDIARY
Notes To Consolidated Financial Statements—(Continued)
| 22. | Quarterly Financial Data (Unaudited) |
The following tables summarize selected financial data regarding results of operations for the periods indicated (in thousands, except per share data). Certain amounts previously presented in our Consolidated Statements of Income (Loss) for prior periods have been reclassified to conform to current classifications. All such reclassifications had no impact on the prior periods’ net income (loss) as previously reported.
| For the year ended December 31, 2009 | |||||||||||||||||||
| First quarter |
Second quarter |
Third quarter |
Fourth quarter |
Total | |||||||||||||||
| Interest income |
$ | 17,566 | $ | 15,890 | $ | 17,046 | $ | 15,708 | $ | 66,210 | |||||||||
| Interest expense |
5,188 | 5,622 | 5,530 | 5,099 | 21,439 | ||||||||||||||
| Net interest income |
12,378 | 10,268 | 11,516 | 10,609 | 44,771 | ||||||||||||||
| Provision for loan losses |
2,175 | 30,000 | 24,000 | 17,225 | 73,400 | ||||||||||||||
| Net interest income (loss) after provision for loan losses |
10,203 | (19,732 | ) | (12,484 | ) | (6,616 | ) | (28,629 | ) | ||||||||||
| Investment securities gains |
2 | — | — | — | 2 | ||||||||||||||
| Other noninterest income |
4,429 | 5,103 | 4,543 | 4,625 | 18,700 | ||||||||||||||
| Noninterest expense |
11,517 | 13,143 | 13,998 | 13,628 | 52,286 | ||||||||||||||
| Net income before provision (benefit) for income taxes |
3,117 | (27,772 | ) | (21,939 | ) | (15,619 | ) | (62,213 | ) | ||||||||||
| Provision (benefit) for income taxes |
1,123 | (9,921 | ) | (7,764 | ) | (5,566 | ) | (22,128 | ) | ||||||||||
| Net income (loss) |
$ | 1,994 | $ | (17,851 | ) | $ | (14,175 | ) | $ | (10,053 | ) | $ | (40,085 | ) | |||||
| Common and per share data |
|||||||||||||||||||
| Net income (loss)—basic |
$ | 0.31 | $ | (2.77 | ) | $ | (2.20 | ) | $ | (1.55 | ) | $ | (6.21 | ) | |||||
| Net income (loss)—diluted |
0.31 | (2.77 | ) | (2.20 | ) | (1.55 | ) | (6.21 | ) | ||||||||||
| For the year ended December 31, 2008 | |||||||||||||||||||
| First quarter |
Second quarter |
Third quarter |
Fourth quarter |
Total | |||||||||||||||
| Interest income |
$ | 20,216 | $ | 20,026 | $ | 19,694 | $ | 18,309 | $ | 78,245 | |||||||||
| Interest expense |
7,691 | 6,428 | 6,505 | 5,982 | 26,606 | ||||||||||||||
| Net interest income |
12,525 | 13,598 | 13,189 | 12,327 | 51,639 | ||||||||||||||
| Provision for loan losses |
488 | 687 | 687 | 3,757 | 5,619 | ||||||||||||||
| Net interest income after provision for loan losses |
12,037 | 12,911 | 12,502 | 8,570 | 46,020 | ||||||||||||||
| Investment securities gains |
— | 1 | — | — | 1 | ||||||||||||||
| Other noninterest income |
4,905 | 4,772 | 4,590 | 4,630 | 18,897 | ||||||||||||||
| Noninterest expense |
11,359 | 11,015 | 10,813 | 10,668 | 43,855 | ||||||||||||||
| Net income before provision for income taxes |
5,583 | 6,669 | 6,279 | 2,532 | 21,063 | ||||||||||||||
| Provision for income taxes |
1,937 | 2,340 | 2,222 | 965 | 7,464 | ||||||||||||||
| Net income |
$ | 3,646 | $ | 4,329 | $ | 4,057 | $ | 1,567 | $ | 13,599 | |||||||||
| Common and per share data |
|||||||||||||||||||
| Net income—basic |
$ | 0.57 | $ | 0.67 | $ | 0.63 | $ | 0.24 | $ | 2.11 | |||||||||
| Net income—diluted |
0.56 | 0.66 | 0.62 | 0.25 | 2.09 | ||||||||||||||
156
Table of Contents
| ITEM 9. | CHANGES IN AND DISAGREEMENTS WITH ACCOUNTANTS ON ACCOUNTING AND FINANCIAL DISCLOSURE |
None.
ITEM 9A. CONTROLS AND PROCEDURES
Evaluation of Disclosure Controls and Procedures
An evaluation of the Company’s disclosure controls and procedures (as defined in Section 13(a)-14(c) of the Securities Exchange Act of 1934) was carried out under the supervision and with the participation of the Company’s Chief Executive Officer and the Bank’s Chief Financial Officer, and several other members of the Company’s senior management as of December 31, 2009. The Company’s Chief Executive Officer and the Bank’s Chief Financial Officer concluded that the Company’s disclosure controls and procedures were effective as of December 31, 2009 in ensuring that the information required to be disclosed by the Company in the reports it files or submits under the Securities Exchange Act of 1934 is (i) accumulated and communicated to management (including the Chief Executive Officer and Chief Financial Officer) in a timely manner, and is (ii) recorded, processed, summarized, and reported within the time periods specified in the SEC’s rules and forms.
See Item 8. Financial Statements and Supplementary Data, which includes management’s report on internal control over financial reporting and the attestation report thereon issued by Elliott Davis, LLC, which is incorporated herein by reference.
Fourth Quarter Internal Control Changes
During the fourth quarter of 2009, the Company did not make any changes in our internal controls over financial reporting that has materially impacted or is reasonably likely to materially impact those controls.
None.
157
Table of Contents
ITEM 10. DIRECTORS, EXECUTIVE OFFICERS AND CORPORATE GOVERNANCE
The information required by this item is set forth in the definitive Proxy Statement of the Company filed in connection with our 2010 Annual Meeting of the Shareholders, which is incorporated herein by reference.
ITEM 11. EXECUTIVE COMPENSATION
The information required by this item is set forth in the definitive Proxy Statement of the Company filed in connection with our 2010 Annual Meeting of the Shareholders, which is incorporated herein by reference.
| ITEM 12. | SECURITY OWNERSHIP OF CERTAIN BENEFICIAL OWNERS AND MANAGEMENT AND RELATED SHAREHOLDER MATTERS |
A portion of the information required by this item is set forth in Item 5 of this Annual Report on Form 10-K. Additional information required by this item is set forth in the definitive Proxy Statement of the Company filed in connection with our 2010 Annual Meeting of Shareholders, which is incorporated herein by reference.
| ITEM 13. | CERTAIN RELATIONSHIPS AND RELATED TRANSACTIONS, AND DIRECTOR INDEPENDENCE |
The information required by this item is set forth in the definitive Proxy Statement of the Company filed in connection with our 2010 Annual Meeting of the Shareholders, which is incorporated herein by reference.
| ITEM 14. | PRINCIPAL ACCOUNTING FEES AND SERVICES |
The information required by this item is set forth in the definitive Proxy Statement of the Company filed in connection with our 2010 Annual Meeting of the Shareholders, which is incorporated herein by reference.
158
Table of Contents
ITEM 15. EXHIBITS, FINANCIAL STATEMENT SCHEDULES
| (a) | (1) All Financial Statements |
See Item 8. Financial Statements and Supplementary Data
| (2) | Financial Statement Schedules |
All schedules to the Consolidated Financial Statements required by Article 9 of Regulation S-X and all other schedules to the financial statements of the Company required by Article 5 of Regulation S-X are not required under the related instructions or are inapplicable and, therefore, have been omitted, or the required information is contained in the Consolidated Financial Statements or the notes thereto, which are included in Item 8 hereof.
| (3) | Listing of Exhibits |
| Exhibit No. |
Description | |
| 3.1.1 | Articles of Incorporation filed on May 13, 1982 in the office of the Secretary of State of South Carolina: Incorporated by reference to Exhibit 3 to the Company’s Registration Statement on Form S-4, Commission File No. 33-19367, filed with the Securities and Exchange Commission on December 30, 1987 | |
| 3.1.2 | Articles of Amendment filed on May 5, 1988 in the office of the Secretary of State of South Carolina: Incorporated by reference to Exhibit 4.1.2 to the Company’s Registration Statement on Form S-8, Commission File No. 33-51212, filed with the Securities and Exchange Commission on August 20, 1992 | |
| 3.1.3 | Articles of Amendment filed on January 26, 1989 in the office of the Secretary of State of South Carolina: Incorporated by reference to Exhibit 4.1.3 to the Company’s Registration Statement on Form S-8, Commission File No. 33-51212, filed with the Securities and Exchange Commission on August 20, 1992 | |
| 3.1.4 | Articles of Amendment filed on April 23, 1990 in the office of the Secretary of State of South Carolina: Incorporated by reference to Exhibit 4.1.4 to the Company’s Registration Statement on Form S-8, Commission File No. 33-51212, filed with the Securities and Exchange Commission on August 20, 1992 | |
| 3.1.5 | Articles of Amendment filed on October 16, 1996 in the office of the Secretary of State of South Carolina: Incorporated by reference to Exhibit 3.1.5 to the Company’s Quarterly Report on Form 10-Q for the fiscal quarter ended September 30, 1996 | |
| 3.1.6 | Articles of Amendment filed on May 17, 1999 in the office of the Secretary of State of South Carolina: Incorporated by reference to Exhibit 3.1.6 of the Company’s Quarterly Report on Form 10-Q for the quarter ended June 30, 1999 | |
| 3.1.7^ | Articles of Amendment filed on June 1, 2009 in the office of the Secretary of State of South Carolina | |
| 3.1.8 | Amended and Restated Articles of Incorporation filed on December 21, 2009 in the office of the Secretary of State of South Carolina: Incorporated by reference to Exhibit 3.1 of the Company’s Current Report on Form 8-K filed with the Securities and Exchange Commission on December 21, 2009 | |
| 3.2.1 | By-Laws adopted on April 10, 1990: Incorporated by reference to Exhibit 3.2.1 to the Company’s Annual Report on Form 10-K for the year ended December 31, 1996 | |
| 3.2.2 | Amendment to By-Laws dated April 12, 1994: Incorporated by reference to Exhibit 3.2.2 to the Company’s Annual Report on Form 10-K for the year ended December 31, 1996 | |
159
Table of Contents
| Exhibit No. |
Description | |
| 3.2.3 | Amendment to By-Laws dated January 19, 1999: Incorporated by reference to Exhibit 3.2.3 to the Company’s Annual Report on Form 10-K for the year ended December 31, 1998 | |
| 3.2.4 | Amended and Restated Bylaws dated December 15, 2009: Incorporated by reference to Exhibit 3.2 of the Company’s Current Report on Form 8-K filed with the Securities and Exchange Commission on December 21, 2009 | |
| 4.1 | Articles of Incorporation of the Registrant: Included in Exhibits 3.1.1 - .7 | |
| 4.2 | Bylaws of the Registrant: Included in Exhibit 3.2.1 - .4 | |
| 4.3 | Specimen Certificate for Common Stock: Incorporated by reference to Exhibit 4.3 to the Company’s Registration Statement on Form S-8, Commission File No. 33-51212, filed with the Securities and Exchange Commission on August 20, 1992 | |
| 10.1* | Palmetto Bancshares, Inc. Stock Option Plan: Incorporated by reference to Exhibit 10 (a) to the Company’s Registration Statement on Form S-4, Commission File No. 33-19367, filed with the Securities and Exchange Commission on May 2, 1988 | |
| 10.2* | The Palmetto Bank Pension Plan and Trust Agreement: Incorporated by reference to Exhibit 10 (c) to the Company’s Registration Statement on Form S-4, Commission File No. 33-19367, filed with the Securities and Exchange Commission on May 2, 1988 | |
| 10.3* | The Palmetto Bank Officer Incentive Compensation Plan: Incorporated by reference to Exhibit 10.3 to the Company’s Annual Report on Form 10-K for the year ended December 31, 2000 | |
| 10.4.1* | Palmetto Bancshares, Inc. 1997 Stock Compensation Plan, as amended to date: Incorporated by reference to Exhibit 10.1 to the Company’s Annual Report on Form 10-K for the year ended December 31, 1997 | |
| 10.4.2* | Amendment to the Palmetto Bancshares, Inc.’s 1997 Stock Compensation Plan: Incorporated by reference to Exhibit 10.4.1 to the Company’s Annual Report on Form 10-K for the year ended December 31, 2003 | |
| 10.5* | Palmetto Bancshares, Inc. 2008 Restricted Stock Plan: Incorporated by reference to Appendix A to Company’s Proxy Statement on Schedule 14A, filed with the Securities and Exchange Commission on March 17, 2008 | |
| 10.6 | Lease Agreement dated as of May 2, 2007 between The Palmetto Bank and Charles E. Howard and Doris H. Howard: Incorporated by reference to Exhibit 10.1 to the Company’s Current Report on Form 8-K filed on June 26, 2007 | |
| 10.7* | Employment Agreement by and between Palmetto Bancshares, Inc. and Samuel L. Erwin, dated December 15, 2009: Incorporated by reference to Exhibit 10.1 of the Company’s Current Report on Form 8-K filed with the Securities and Exchange Commission on December 21, 2009. | |
| 10.8* | Employment Agreement by and between Palmetto Bancshares, Inc. and Lee S. Dixon, dated December 15, 2009: Incorporated by reference to Exhibit 10.2 of the Company’s Current Report on Form 8-K filed with the Securities and Exchange Commission on December 21, 2009. | |
| 21.1^ | List of Subsidiaries of the Registrant | |
| 23.1^ | Consent of Elliott Davis, LLC | |
| 31.1^ | Samuel L. Erwin’s Certification Pursuant to Section 302 of the Sarbanes-Oxley Act of 2002 | |
| 31.2^ | Lauren S. Greer’s Certification Pursuant to Section 302 of the Sarbanes-Oxley Act of 2002 | |
| 32^ | Certifications Pursuant to Section 906 of the Sarbanes-Oxley Act of 2002 | |
| * | Management contract or compensatory plan or arrangement |
| ^ | Filed with this Annual Report on Form 10-K |
Copies of exhibits are available upon written request to Corporate Secretary, Palmetto Bancshares, Inc., 306 East North Street, Greenville, SC 20601
160
Table of Contents
Pursuant to the requirements of Section 13 or 15(d) of the Securities Exchange Act of 1934, the registrant has duly caused this report to be signed on its behalf by the undersigned, thereunto duly authorized.
| PALMETTO BANCSHARES, INC. | ||
| By: | /s/ SAMUEL L. ERWIN | |
| Samuel L. Erwin Chief Executive Officer Palmetto Bancshares, Inc. | ||
| /s/ LAUREN S. GREER | ||
| Lauren S. Greer Chief Financial Officer The Palmetto Bank | ||
Date: February 26, 2010
Pursuant to the requirements of the Securities Exchange Act of 1934, this report has been signed below and on the dates by the following persons on behalf of the registrant and in the capacities indicated.
| Signature |
Title |
Date | ||
| /s/ W. FRED DAVIS, JR. W. Fred Davis, Jr. |
Director |
February 26, 2010 | ||
| /s/ LEE S. DIXON Lee S. Dixon |
Director Chief Operating Officer Palmetto Bancshares, Inc. |
February 26, 2010 | ||
| /s/ SAMUEL L. ERWIN Samuel L. Erwin |
Director Chief Executive Officer Palmetto Bancshares, Inc. |
February 26, 2010 | ||
| /s/ DAVID P. GEORGE, JR. David P. George, Jr. |
Director |
February 26, 2010 | ||
| /s/ MICHAEL D. GLENN Michael D. Glenn |
Director |
February 26, 2010 | ||
| /s/ JOHN T. GRAMLING, II John T. Gramling, II |
Director |
February 26, 2010 | ||
| /s/ LAUREN S. GREER Lauren S. Greer |
Chief Financial Officer The Palmetto Bank |
February 26, 2010 | ||
| /s/ JOHN D. HOPKINS, JR. John D. Hopkins, Jr. |
Director |
February 26, 2010 | ||
| /s/ L. LEON PATTERSON L. Leon Patterson |
Chairman of the Board of Directors |
February 26, 2010 | ||
161
Table of Contents
| Signature |
Title |
Date | ||
| /s/ SAM B. PHILLIPS, JR. Sam B. Phillips, Jr. |
Director |
February 26, 2010 | ||
| /s/ ALBERT V. SMITH Albert V. Smith |
Director |
February 26, 2010 | ||
| /s/ ANN B. SMITH Ann B. Smith |
Director |
February 26, 2010 | ||
| /s/ EDWARD KEITH SNEAD, III Edward Keith Snead, III |
Director |
February 26, 2010 | ||
| /s/ JANE S. SOSEBEE Jane S. Sosebee |
Director |
February 26, 2010 | ||
| /s/ L. STEWART SPINKS L. Stewart Spinks |
Director |
February 26, 2010 | ||
| /s/ J. DAVID WASSON, JR. J. David Wasson, Jr. |
Director |
February 26, 2010 | ||
162
Table of Contents
| Exhibit No. |
Description | |
| 3.1.7 | Articles of Amendment filed on June 1, 2009 in the office of the Secretary of State of South Carolina | |
| 21.1 | List of Subsidiaries of the Registrant | |
| 23.1 | Consent of Elliott Davis, LLC | |
| 31.1 | Samuel L. Erwin’s Certification Pursuant to Section 302 of the Sarbanes-Oxley Act of 2002 | |
| 31.2 | Lauren S. Greer’s Certification Pursuant to Section 302 of the Sarbanes-Oxley Act of 2002 | |
| 32 | Certifications Pursuant to Section 906 of the Sarbanes-Oxley Act of 2002 | |
163