Attached files
| file | filename |
|---|---|
| 8-K - SHARING ECONOMY INTERNATIONAL INC. | v175752_8k.htm |
| EX-99.2 - SHARING ECONOMY INTERNATIONAL INC. | v175752_ex99-2.htm |
| EX-99.1 - SHARING ECONOMY INTERNATIONAL INC. | v175752_ex99-1.htm |
Corporate Presentation
February 2010
1

Safe Harbor Statement
Safe Harbor Statement Under the Private Securities Litigation Reform Act
of 1995: Any statements set forth in this presentation that are not
historical facts are forward-looking statements that involve risks and
uncertainties that could cause actual results to differ materially from
those in the forward-looking
statements, which may include, but are not
limited to, such factors as unanticipated changes in product demand,
increased competition, downturns in the economy, failure to comply with
specific regulations pertaining to government projects, fluctuation
of
revenue due to the nature of project lifecycles, and other information
detailed from time to time in the Company filings and future filings with
the United States Securities and Exchange Commission. The forward-
looking statements contained
in this presentation are made only of this
date, and the Company is under no obligation to revise or update these
forward-looking statements.
2

Wind Industry Dynamics In China
There is the potential for China to invest $200 billion in wind turbine components and
projects through 2020
The Chinese government has substantially increased its goal for installed wind
energy capacity by 2020, during the past two years. Since 2008, the goal has
increased from 20 GW to 30 GW to 120 GW and,
most recently in July 2009, to 150 GW
China is expected to surpass the United States as the world’s largest market for wind
turbines
The Chinese government recently announced the $17.6 billion, 20 GW “Three Gorges
Wind Power” project in Northwest China
China’s wind power industry is expected to reach 30 GW of capacity by 2010
China’s current renewable energy usage rate is 16% and the Chinese government
recently increased its goal for 2020 to 23%, which is similar to European targets
The Chinese government will offer bank loans with subsidized interest rates to wind
farm operators
3
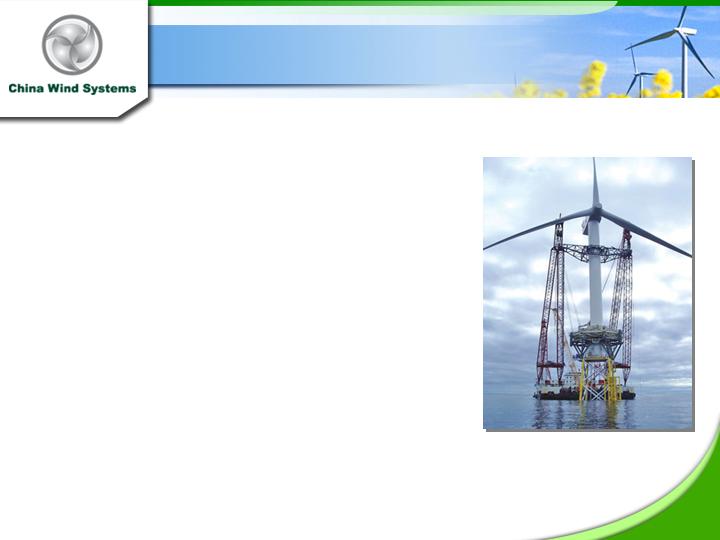
Wind Power Propels Our Business Model
China needs to add nearly 9x the amount
of electricity generation as the United
States does
-International Energy Agency
Chinese investment in coal-fired power
projects declined by 11% while
investment in wind power increased by
44% in 2009
-National Energy Administration
(China)
“Total power generation in China is on
track to pass the United States in 2012.”
-The New York Times, January 2010
5MW wind turbine by REpower
4
Forged Steel
Components
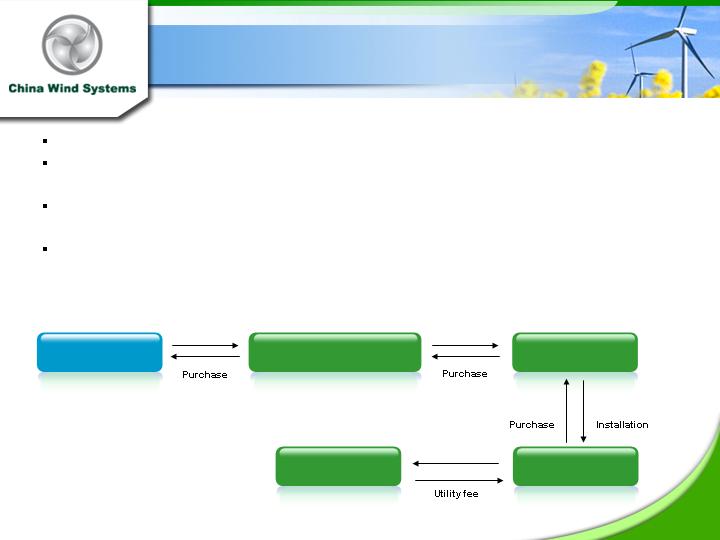
Where We Fit in Wind Power
China is a world leader in the advancement of wind power
The Chinese government invested approximately $111 billion in power construction
projects in 2009
Wind turbines contain highly technical components that are creating a supply
bottleneck
China Wind Systems has demonstrated solid execution of its business plan by
becoming a key supplier of many wind-power components, in which end users are
international wind power players
Fabrication
Assembly
Yaw Bearings, Blades,
Gearbox and Other Parts
Wind Turbine
Grid Connection
End User
Wind Farm
5

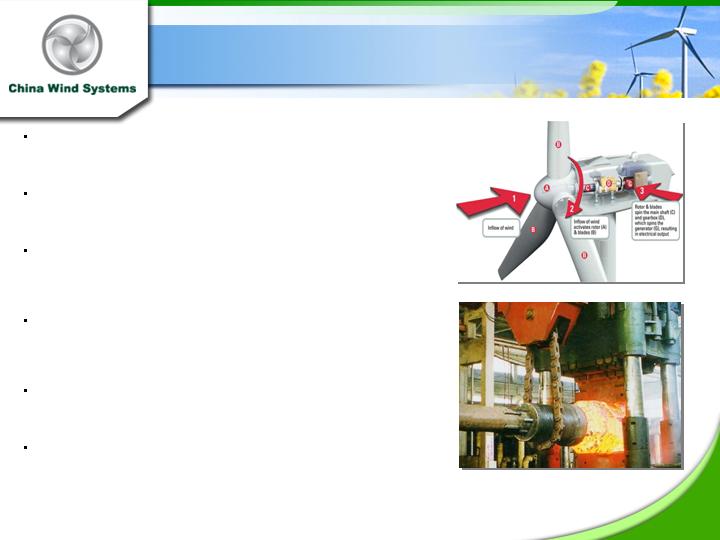
Interior of Wind Turbine Unit
Source: U.S. Department of Energy
% Cost Breakdown of A Windmill
Component
Percent
Blade
19%
Electrical Control System
16%
Gearbox
15%
Tower (flanges)
9%
Generator
8%
Hub
7%
Yaw System
5%
Spare Parts
5%
Nacelle
4%
Main Shaft
4%
Central Monitoring/Control System
3%
General Assembly
3%
Hydraulic System
2%
Source: Morgan Stanley Research
*We supply forged products for wind power components
6
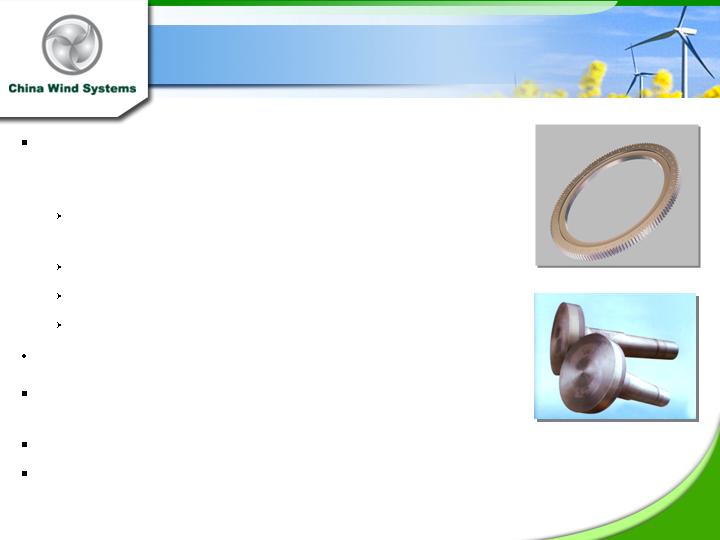
Began in-house manufacturing of shafts, flanges, shafts
and forged rolled rings for gear rims and other applications
in March 2009
Rings =6.3 meters in diameter, for use in wind turbines up to
5 MW
Shafts used in 1MW-3MW wind turbine units
Gear rims for use in gearboxes
Flanges for tower
Mature industrial equipment and forged product
manufacturer
Quality metal fabricator of components for heavy machinery
industries
Time-tested innovative engineers and skilled technicians
State-of-the-art (108,000 SF) forging facility focused on wind
industry commenced operations in March 2009
Company Overview
Gear Rim
gear rim
unfinished shaft
7

Leveraging Growth on the Wind Power
Industry
Original Facility
Forged Products Facility
Upgrades to Forged
Product Facility
Products
Rolled rings up to 3 meters
diameter
Rolled rings up to 6.3 meters
diameter rolled rings, flanges,
shafts, and gear rims
Electro-slag Re-
melted forged
products
Equipment Installation
None
Jan 08 - Feb 09
Oct 2009- March 2010
Production Start
April 2007
March 2009
March 2010
Design Capacity
8,500 tons of rolled rings
40,000 tons of rolled rings,
flanges, shafts and gear rims
6,000 tons
Expected Gross Margins
22%
28%-30%
35%-40%
Actual Capacity @
Design Capacity (Annual in tons) *
45,000
100%
50%
ESR forged products 100%
Total Tonnage Output
40,000
20,000
6,000
Average Price/Tonnage (2008 RMB)
10,000
10,000
25,000-30,000
Revenue (RMB)
400,000,000
200,000,000
180,000,000
Exchange Rate
6.8
6.8
6.8
Revenue (in USD)
58,823,529
29,411,765
26,354,319
Average Gross Margin %
30%
28%
37%
Gross Profit (in USD)
17,647,058
8,235,294
9,751,098
8
First Mover Advantage Keeps Us Ahead of the Curve
Competitive Advantages:
Employ axial-close die forging technology to produce
high precision products that reduces material
consumption by 35% leading to surface flatness,
excellent mechanical strength, high flexibility,
and full
automatic operation
Prime location in Jiangsu Province near major
transportation routes enables cost-savings
Growing national network of customers
Strong management capability to accelerate company’s
leadership role in the industry and leverage 15 years of
manufacturing expertise
Received ISO9001 in July 2009, covering machining and
related service of shaft-shaped forging, ring forging,
tubular forging and component assembly
9
Leveraging Existing Wind Customer Base
Name of Company
Product
End
Product
Chengxi Shipyard Co., Ltd
2009 New Customer
Flanges
Wind tower
Shenyang Heavy Machinery
2009 New Customer
Gear rim, shaft,
Flanges
Power
plants
Zhongxin Heavy Machinery Group
2009 New Customer
Rolled rings
Flanges
Wuxi Lida Gear Manufacturing Co., Ltd
2009 New Customer
Rolled Rings
Yaw
bearing
Hangzhou Advance Gearbox Group Co., Ltd
2009 New Customer
Gear rims
Gearbox
Gansu Keyao Electrical Manufacturing Co., Ltd
2009 New Customer
Flanges
Flanges for
wind tower
6 New Wind Customers In 2009
10
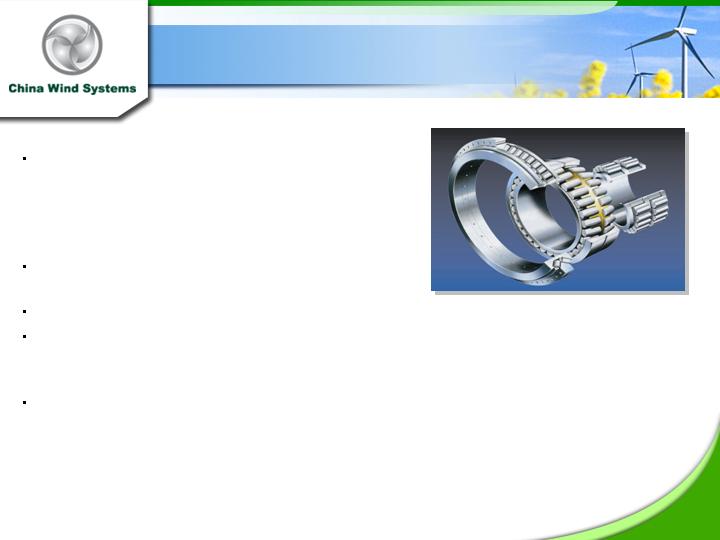
Strategic Move to Focus on Electro-Slag Remelted
(ESR) Forged Products
ESR technology is used to increase the durability and quality of
steel material used particularly for components in high precision
yaw bearings
Inadequate supply of high quality precision forged products in the
large-sized wind turbine sector in China has created an industry
bottleneck
Well positioned to reap the high margin opportunity supplying
superior quality, high performance forged products starting March
2010
At full manufacturing capacity of 6,000 tons per year, gross
margin is expected to reach 37%
Signed preliminary agreement to supply 12,000 tons of ESR
forged products over 2.5 years
11
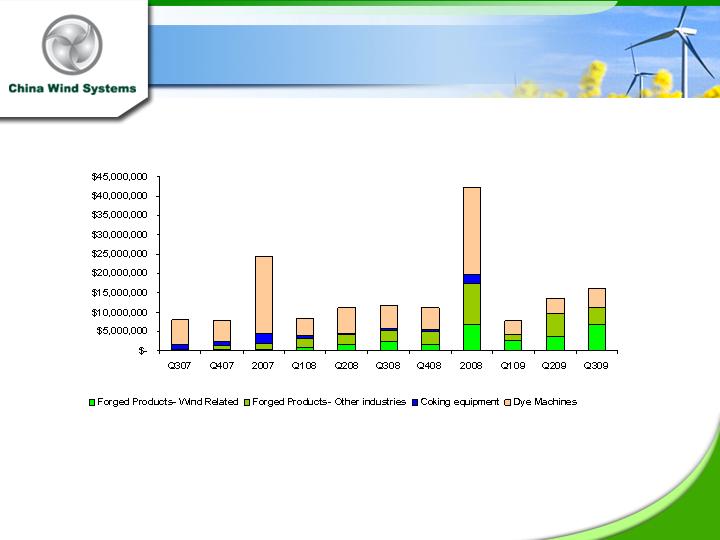
Revenue Breakdown
12
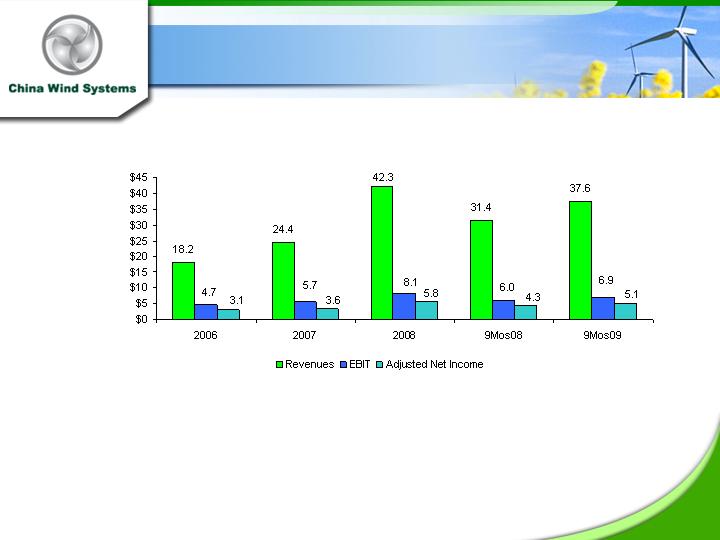
Strong Annual Growth
Notes: $ figures in millions
Income tax rate: 33%, 2005-2007; 25%, 2008
2007 net income before and after-tax exclude, $6.7 MM in one-time tax benefit, Q3, 2007
2008 net income before and after tax net income exclude non-cash charges of $2.3M related to amortization of debt discount to interest expense and non-
cash charge of $2.9 MM, related to deemed preferred dividend
related to issuance of stock warrants upon conversion of convertible debt to series A
preferred stock in Q1 08.
2009 net income before and after tax exclude non-cash charges of $0.2 MM related to amortization of debt discount and interest expense and a non cash
charge of $0.5 MM related to deemed preferred dividend related
to issuance of stock warrants upon conversion of convertible debt to series A in preferred
stock
13
One of the few Chinese wind industry players publicly
traded in the U.S.
Potential to capitalize on China’s projected $200 billion
wind industry components market
Excellent industry dynamics where installed wind power is
targeted by the Chinese government to grow from 20 GW in
2009 to 150 GW by 2020
Transforming into a leading supplier of wind power
components to address the rapidly growing wind industry
in China and the world.
State-of-the-art manufacturing facility focuses on
manufacturing forged products for wind power industry
Experienced management team with successful track
record to build China Wind Systems into a world-class
organization
Investment Highlights
Hydraulic press
wind turbine
14

Experienced Executive Team
Mr. Jianhua Wu, Chairman / CEO
Mr. Wu is the Founder and CEO of the Huayang Companies and has more than 20 years of machinery manufacturing experience. He holds a certificate in Mechanical Engineering and
is a founding member of the China
Wind Association.
Ms. Teresa Zhang, CFO
Prior to joining China Wind Systems Ms. Zhang served as an auditing manager since July 2005 at GC Alliance HK CPA, an international accounting, taxation and advisory services firm
in Beijing. From January 2003
to June 2005, Ms. Zhang served as a liaison officer for the Australian-Chinese Friendship Business Association. From July 2000 to September 2002, Ms.
Zhang was an auditor at Ernst & Young in Beijing, China. Ms. Zhang is a Certified Practising Accountant
in Australia. She earned her bachelor’s degree in international accounting from
Renmin University in China and her master’s degree in accounting from Macquarie University in Australia
Mr. Adam Wasserman, CPA, Vice President of Financial Reporting
Mr. Wasserman is the CEO of CFO Oncall, Inc., an accounting consulting firm. Mr. Wasserman holds CFO titles for Transax International Ltd, since May 2005, Lotus Pharmaceuticals,
Inc. since October
2006 and Gold Horse Intl. Inc. since July 2007. He earned a B.S. in Accounting from the State University of New York, Albany.
Mr. Ryan Hua, VP / Operations
Prior to joining China Wind Systems Mr. Hua was a Partner at Wuxi Zhong Qiang Heavy Machinery, Inc. Previously, he was a General Manager at Zhong Qiang Heavy Machinery Inc.
and Assistant Electrical
Engineer at Huayang Companies. Mr Hua holds a B.S. from Nanjing University of Science and Technology.
Mr. Chen Yao Hong, Chief Engineer
Mr. Hong has previous experience in optical Instrument design and radar design and holds a certificate of Mechanical Engineering and a BS in Mechanical Design.
Mr. Bo Xiong Shen, Director / Business Development
Mr. Shen has 28 years experience with progressive responsibilities including Technician Technology Innovation Manager, Director of External Economic Affairs, and General Manager
of Import and Export at Nanjing
Machine Tools Corp. He has in-depth experience in manufacturing large size mechanical bearings and gearbox; Mr. Shen holds a certificate as a Sr.
Mechanical Engineer and received a B.S. from Beijing University in Mechanical Technology.
Drew Bernstein, Independent Director
Mr. Bernstein serves as Chairman of the Audit Committee of China Wind Systems. He co-founded Bernstein & Pinchuk LLP (B&P) in 1983. His early recognition of the global
marketplace and his extensive
travel in the People's Republic of China (“PRC”) resulted in the aggressive expansion of the firm’s services to the PRC. Mr. Bernstein received his BS
degree from the University of Maryland Business School, is licensed in the State of New
York, Connecticut, California, Texas and Maryland and is a member of the AICPA, the
NYSSCPA and the NSA.
Megan Penick, Independent Director
Ms. Penick serves on the Company’s audit and compensation committees. Ms. Penick is an attorney, licensed to practice in New York State, and the owner of Penick & Associates
LLC, which provides
corporate governance consulting. She focuses on working with United States and China-based companies and their boards to develop corporate governance best
practices. She received her J.D. from New York Law School and is fluent in both Mandarin and English.
15

Contact
Company Contact:
China Wind Systems, Inc
Teresa Zhang, Chief Financial Officer
No. 9 Yanyu Middle Road
Quinzhou Village, Huishan District,
Wuxi City, Jiangsu Province, PRC
Tel: (86) 138 1194 8079
E-mail: teresa.zhang@chinawindsystems.com
Investor Relations:
CCG Investor Relations, Inc
Crocker Coulson, President
1325 Avenue of Americas
Suite 2800
New York, NY 10019
Tel: (646) 213-1915
E-mail: crocker.coulson@ccgir.com
Legal Contact:
Asher S. Levitsky P.C.
Sichenzia Ross Friedman Ference LLP
61 Broadway
New York, NY 10006
Telephone: (212) 981-6767
E-mail: ALevitsky@srff.com
External Auditors:
Sherb & Company, LLP
1900 NW Corporate Boulevard
Suite E210
Boca Raton, FL 33431
Tel: (561) 886-4200
16
Appendix I: Equity Snapshot
Ticker (NASDAQ): CWS
Price (2/16/2010): $5.63
Market Cap: $86.7 mil
Revenues (ttm): $48.5 mil
Net Income (ttm)*: $6.5 mil
Diluted Shares Outstanding**: 15.4 mil
Diluted EPS (ttm)*: $0.30
P/E (ttm)**: 18.8x
P/S (ttm): 1.8x
*TTM net income and diluted eps exclude non-cash charges of $0.2 MM related to amortization of debt discount and interest expense and a non cash charge
of $0.5 MM related to deemed preferred dividend related to issuance of stock warrants upon conversion of convertible debt to series A in preferred stock Q3 2009
*Diluted weighted average shares for the 9 months ended Sept 30, 2009, adjusted for a one-for-three reverse stock split
17
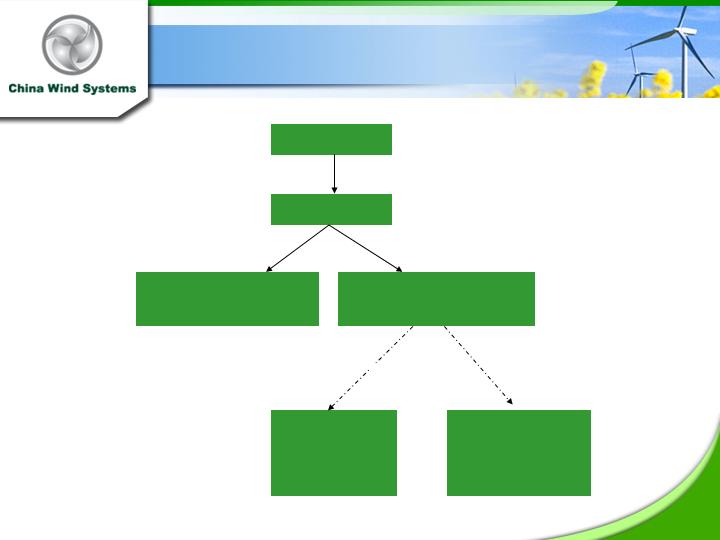
Appendix II: Corporate Structure
CWS
Fulland Ltd.
Green Power Environmental
Technologies Co., Ltd
(“Green Power”)
Wuxi Fulland Wind Energy
Equipment Co., Ltd
(“Wind Power”)
100%
100%
100%
Wuxi Huayang Dye
Machine Co., Ltd.
(“Huayang Dye
Machine”)
Contractual
Arrangement
WFOE
WFOE
Wuxi Huayang
Electrical Power
Equipment Co., Ltd
(Huayang Electrical
Power Equipment)
Contractual
Arrangement
18
3,061,903
Shares issuable upon exercise of warrants at $1.70
Share Type
Number of Shares
Common shares issued and outstanding
15,406,842
Common shares issuable upon conversion of series A
preferred stock
4,819,696
Shares issuable upon exercise of warrants at $1.20
2,243,599
Shares issuable upon exercise of warrants at $1.50
133,333
Total
25,665,373
*As of September 30, 2009. All amounts adjusted for a 1 for 3 reverse split.
Appendix III: Capitalization Structure*
19
Appendix IV: Summary Balance Sheet
($ in thousands) 9/30/09 12/31/08
(Unaudited) (Audited)
Cash and Cash Equivalents $1,159 $329
Current Assets 10,967 7,586
Total Assets 45,972 37,332
Current Debt 1,359 1,021
Total Liabilities 6,277 4,406
Total Stockholders’ Equity 39,695 32,925
20
Appendix V: Summary Income Statement
Source: Company’s SEC filings
^Net income, EPS excludes $0.5 MM in non-cash deemed preferred dividend related to issuance of 1.1 million preferred shares in Q309
* Net income, EPS exclude $2.3 million in non-cash interest expenses, amortization of debt issuance cost and non-cash $2.9 million
deemed preferred dividend
** Net income, EPS exclude one-time income net of $6.7 million related to forgiveness of VAT and income taxes, Q3, 2007
($ in thousands, except per share data) FYE, Dec 31
(audited)
Q3 09 Q3 08 YoY% 2008 2007 YoY%
Revenues $16,132 $11,770 37.1% $42,285 $24,418 73.2%
Gross Profit 3,889 2,954 31.7% 10,545 7,052 49.5%
Operating Income 3,420 2,470 38.5% 8,063 5,662 42.4%
Net Income 2,498^ 1,861 34.3% 5,829* 3,603** 61.8
Diluted EPS $0.09^ $0.08 $0.09* $0.09**
Gross Margin 24% 25% 24.9% 28.9%
Operating Margin 21% 21% 19.1% 23.2%
21
Weighted average diluted shares, 23,506,936 for three months ended September 30,2009 and 22,396,370 for three months ended
September 30, 2008
$ 0.08
$ 1,860,862
$ 0.11
$ 2,498,437
Adjusted Amount of Net Income available to Common Shareholders
-
-
0.02
462,000
Deemed dividend to preferred stockholders
Adjustment
$ 0.08
$ 1,860,862
$ 0.09
$ 2,036,437
Amount per consolidated statement of operations
Diluted
EPS
Net Income
Diluted EPS
Net Income
2008
2009
For the Three Months ended September 30,
`
Weighted average diluted shares, 21,969,692 for nine months ended September 30,2009 and 12,878,103 for three months ended
September 30, 2008
$ 0.33
$ 4,307,614
$ 0.23
$ 5,085,030
Adjusted Amount of Net Income available to Common Shareholders
-
0.01
128,000
Non-cash interest from debt conversion
-
21,429
-
-
Amortization of debt issuance costs
0.18
2,264,000
32,000
Non-cash interest from amortization of debt discount
0.22
2,884,062
0.02
462,000
Deemed dividend to preferred stockholders
Adjustment
$ (0.07)
$ (861,877)
$ 0.20
$ 4,463,030
Amount per consolidated statement of operations
Diluted
EPS
Net Income
Diluted EPS
Net Income
2008
2009
For the Nine Months ended September 30,
Appendix VI: Adjusted Financial
Reconciliation Data
22