Attached files
| file | filename |
|---|---|
| 8-K - FORM 8-K - Arthur J. Gallagher & Co. | d8k.htm |
| EX-99.1 - SLIDES FOR ARTHUR J. GALLAGHER & CO.'S PRESENTATIONS AT INVESTOR CONFERENCES - Arthur J. Gallagher & Co. | dex991.htm |
Exhibit 99.2
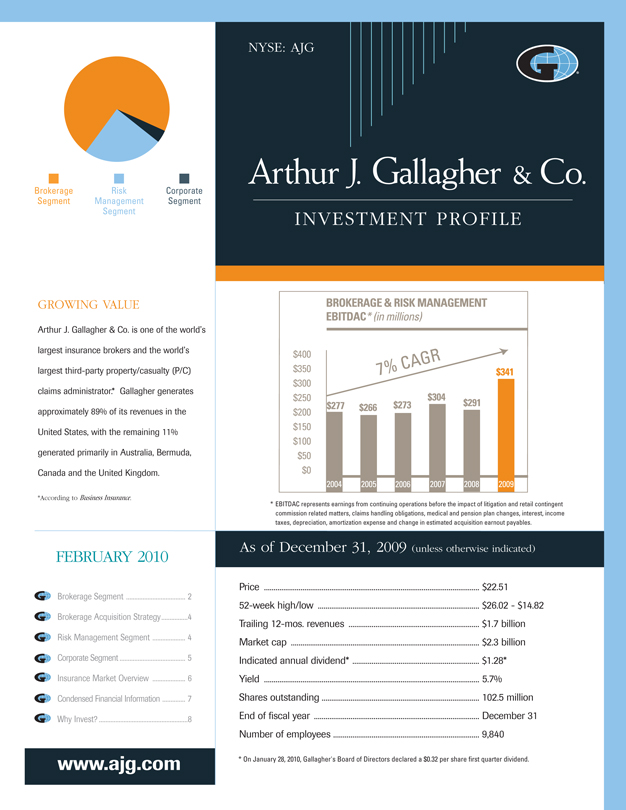
Exhibit 99.2
NYSE: AJG
Brokerage Risk Corporate Segment Management Segment Segment
GROWING VALUE
Arthur J. Gallagher & Co. is one of the world’s largest insurance brokers and the world’s largest third-party property/casualty (P/C) claims administrator.* Gallagher generates approximately 89% of its revenues in the United States, with the remaining 11% generated primarily in Australia, Bermuda, Canada and the United Kingdom.
*According to Business Insurance.
FEBRUARY 2010
Brokerage Segment 2
Brokerage Acquisition Strategy 4
Risk Management Segment 4
Corporate Segment 5
Insurance Market Overview 6
Condensed Financial Information 7
INVESTMENT PROFILE
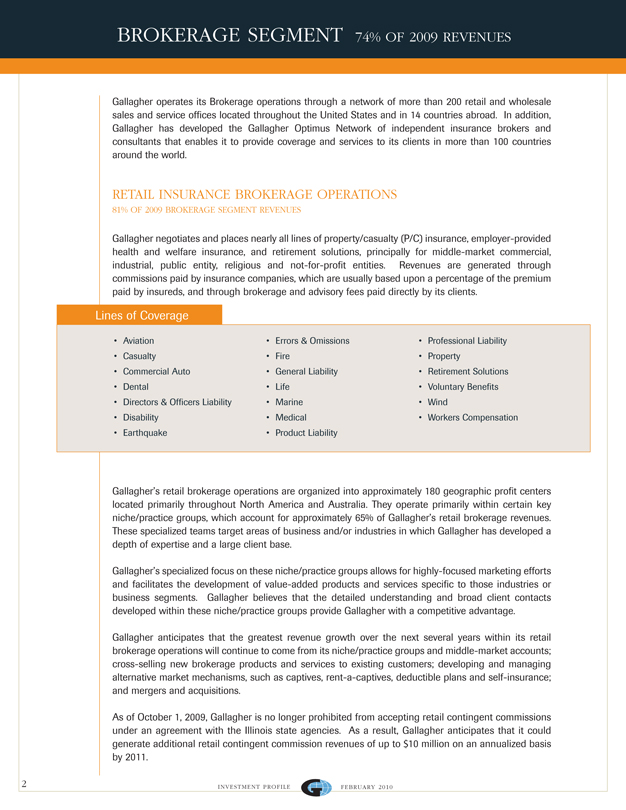
$400 $350 $300 $250 $200 $150 $100 $50 $0
* EBITDAC represents earnings from continuing operations before the impact of litigation and retail contingent commission related
matters, claims handling obligations, medical and pension plan changes, interest, income taxes, depreciation, amortization expense and change in estimated acquisition earnout payables.
As of December 31, 2009 (unless otherwise indicated)
Price $22.51
52-week high/low $26.02 - $14.82
Trailing 12-mos. revenues $1.7 billion
Market cap $2.3 billion
Indicated annual dividend* $1.28*
Yield 5.7%
Shares outstanding 102.5 million
End of fiscal year December 31
Number of employees 9,840
* On January 28, 2010, Gallagher’s Board of Directors declared a $0.32 per share first quarter dividend.
BROKERAGE SEGMENT 74% OF 2009 REVENUES
Gallagher operates its Brokerage operations through a network of more than 200 retail and wholesale sales and service offices located throughout the United States and in 14 countries abroad. In addition, Gallagher has developed the Gallagher Optimus Network of independent insurance brokers and consultants that enables it to provide coverage and services to its clients in more than 100 countries around the world.
RETAIL INSURANCE BROKERAGE OPERATIONS
81% OF 2009 BROKERAGE SEGMENT REVENUES
Gallagher negotiates and places nearly all lines of property/casualty (P/C) insurance, employer-provided health and welfare insurance, and retirement solutions, principally for middle-market commercial, industrial, public entity, religious and not-for-profit entities. Revenues are generated through commissions paid by insurance companies, which are usually based upon a percentage of the premium paid by insureds, and through brokerage and advisory fees paid directly by its clients.
Lines of Coverage
Aviation Casualty
Commercial Auto Dental
Directors & Officers Liability Disability Earthquake
Errors & Omissions Fire General Liability Life Marine Medical Product Liability
Professional Liability Property Retirement Solutions Voluntary Benefits Wind Workers Compensation
Gallagher’s retail brokerage operations are organized into approximately 180 geographic profit centers located primarily throughout North America and Australia. They operate primarily within certain key niche/practice groups, which account for approximately 65% of Gallagher’s retail brokerage revenues. These specialized teams target areas of business and/or industries in which Gallagher has developed a depth of expertise and a large client base.
Gallagher’s specialized focus on these niche/practice groups allows for highly-focused marketing efforts and facilitates the development of value-added products and services specific to those industries or business segments. Gallagher believes that the detailed understanding and broad client contacts developed within these niche/practice groups provide Gallagher with a competitive advantage.
Gallagher anticipates that the greatest revenue growth over the next several years within its retail brokerage operations will continue to come from its niche/practice groups and middle-market accounts; cross-selling new brokerage products and services to existing customers; developing and managing alternative market mechanisms, such as captives, rent-a-captives, deductible plans and self-insurance; and mergers and acquisitions.
As of October 1, 2009, Gallagher is no longer prohibited from accepting retail contingent commissions under an agreement with the Illinois state agencies. As a result, Gallagher anticipates that it could generate additional retail contingent commission revenues of up to $10 million on an annualized basis by 2011.
2
INVESTMENT PROFILE FEBRUARY 2010
®
Niche/Practice Groups
Agribusiness
Aviation & Aerospace Captive Consulting Construction Energy Entertainment Global Risks Habitational Healthcare
Higher Education Hospitality Institutional Services Marine Manufacturing Personal Professional Groups Private Equity Public Entity
• Real Estate
• Religious/Not-for-Profit
• Restaurant
• Scholastic
• Technology/Telecom
• Transportation
WHOLESALE INSURANCE BROKERAGE OPERATIONS
19% OF 2009 BROKERAGE SEGMENT REVENUES
Gallagher’s wholesale brokerage operations assist retail brokers and agents in the placement of specialized, unique and hard-to-place insurance programs. Wholesale revenues are generated from sharing the commissions paid to the retail broker by the insurance carrier.
Gallagher’s wholesale brokerage operations are organized into more than 60 geographic profit centers located primarily in the United States and Bermuda, and through its approved Lloyd’s of London broker. In certain cases Gallagher acts as a brokerage wholesaler and in other cases Gallagher acts as a managing general agent, distributing specialized insurance coverages for insurance carriers.
More than 80% of Gallagher’s wholesale brokerage revenues come from retail brokers and agents who are not affiliated with Gallagher. Based on wholesale premium volume from P/C risks, Gallagher’s U.S. wholesale brokerage operation currently ranks as the largest domestic managing general agency, according to Business Insurance magazine.
Gallagher anticipates growing its wholesale brokerage operations by increasing its number of broker clients, by developing new managing general agency programs, and through mergers and acquisitions.
Gallagher Optimus Network
The Gallagher Optimus Network is a global alliance of independent broker partners. Optimus Network partners are selected by Gallagher based upon common business philosophies and the partners’ strengths and service capabilities within their respective countries. Through the Gallagher Optimus Network and its own international operations, Gallagher offers client-service capabilities in more than 100 countries around the world.
INVESTMENT PROFILE FEBRUARY 2010
®
3
Brokerage Segment Acquisition Strategy
Gallagher is highly growth-oriented. Its Brokerage Segment growth strategy has two primary components: organic growth through new business production and the strategic acquisition of complementary businesses. Gallagher completed and integrated approximately 235 acquisitions from January 1985 through December 2009, almost exclusively within the Brokerage Segment. Most were regional or local retail or wholesale brokers possessing a strong middle-market focus or significant expertise in a desirable market niche. Gallagher typically acquires companies that generate $2 million to $10 million in annual revenues. In addition, Gallagher is focused on international expansion through joint ventures, where the company begins its relationship with an equity position.
Gallagher is highly selective. An acquisition must offer significant benefits, such as expanding the company’s talent pool, enhancing its geographic presence and service capabilities, and/or broadening and further diversifying its business mix. In selecting acquisition candidates, Gallagher also focuses on: • a company culture that matches its own • a profitable, growing business that could further enhance its ability to compete by gaining access to Gallagher’s greater resources • clearly defined financial criteria.
Contributing to the company’s success as an acquirer is its attractiveness as a merger partner. Growth-oriented independent brokers and consultants are attracted by Gallagher’s aggressive, sales-oriented culture, team-based approach and depth of resources.
RISK MANAGEMENT SEGMENT 26% OF 2009 REVENUES
Based on revenues, Gallagher’s Risk Management operation currently ranks as the world’s largest third-party P/C claims administrator, according to Business Insurance magazine. Gallagher provides contract claims settlement and administration services for entities that choose to self-insure and insurance companies that choose to outsource their claims-handling services.
Expertise
Real-time Claims Management Recoveries (subrogation, salvage, etc.) Appraisal Services Litigation Management Information Management
Managed Care Services Risk Control Services Safety Programs Settlement Management Education & Training
4
INVESTMENT PROFILE FEBRUARY 2010
®
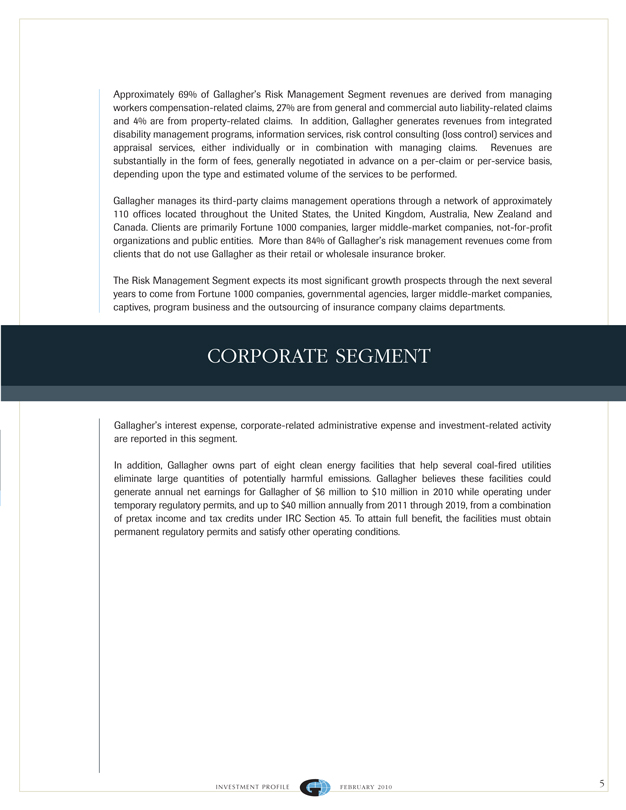
Approximately 69% of Gallagher’s Risk Management Segment revenues are derived from managing workers compensation-related claims, 27% are from general and commercial auto liability-related claims and 4% are from property-related claims. In addition, Gallagher generates revenues from integrated disability management programs, information services, risk control consulting (loss control) services and appraisal services, either individually or in combination with managing claims. Revenues are substantially in the form of fees, generally negotiated in advance on a per-claim or per-service basis, depending upon the type and estimated volume of the services to be performed.
Gallagher manages its third-party claims management operations through a network of approximately 110 offices located throughout the United States, the United Kingdom, Australia, New Zealand and Canada. Clients are primarily Fortune 1000 companies, larger middle-market companies, not-for-profit organizations and public entities. More than 84% of Gallagher’s risk management revenues come from clients that do not use Gallagher as their retail or wholesale insurance broker.
The Risk Management Segment expects its most significant growth prospects through the next several years to come from Fortune 1000 companies, governmental agencies, larger middle-market companies, captives, program business and the outsourcing of insurance company claims departments.
CORPORATE SEGMENT
Gallagher’s interest expense, corporate-related administrative expense and investment-related activity are reported in this segment.
In addition, Gallagher owns part of eight clean energy facilities that help several coal-fired utilities eliminate large quantities of potentially harmful emissions. Gallagher believes these facilities could generate annual net earnings for Gallagher of $6 million to $10 million in 2010 while operating under temporary regulatory permits, and up to $40 million annually from 2011 through 2019, from a combination of pretax income and tax credits under IRC Section 45. To attain full benefit, the facilities must obtain permanent regulatory permits and satisfy other operating conditions.
INVESTMENT PROFILE FEBRUARY 2010
®
| 5 |
|
INSURANCE MARKET OVERVIEW
Fluctuations in premiums charged by P/C insurance carriers have a direct and potentially material impact on the insurance brokerage industry. Commission revenues are generally based on a percentage of the premiums paid by insureds and normally follow premium levels. Insurance premiums are cyclical in nature and may vary widely based on market conditions. Various factors — including competition for market share among insurance carriers, increased underwriting capacity and improved economies of scale following consolidations — can result in flat or reduced premium rates
(a “soft” market). A soft market tends to put downward pressure on commission revenues. Various countervailing factors, such as heavier-than-anticipated loss experience or capital shortages, can result in increases in premium rates (a “hard” market). A hard market tends to favorably impact commission revenues. Hard and soft markets may be broad-based or more narrowly focused across individual product lines or geographic areas.
From 2004 through December 2009, the P/C market has been soft in most lines and geographic areas. A quarterly market survey conducted by the Council of Insurance Agents & Brokers in the fourth quarter of 2009 indicated that the level of rate reductions for commercial business averaged 5.6%, year-over-year, compared with a 5.8% year-over-year decline in the third quarter of 2009.
Safe Harbor Statement
This investment profile contains forward-looking statements. The Private Securities Litigation Reform Act of 1995 provides a safe harbor for forward-looking statements. Examples of forward-looking statements include, but are not limited to, statements relating to our future results, areas of future revenue growth, anticipated contingent commission revenue, future income and tax credits generated by our clean-energy facilities, impact of expense reductions, future acquisition activity, and the future of the insurance and insurance brokerage industries. These forward-looking statements are subject to certain risks and uncertainties that could cause actual results to differ materially from those expected, depending on a variety of factors, such as changes in worldwide and national economic conditions, changes in premium rates and in insurance markets generally, and significant uncertainties related to our clean-energy investments. Please refer to Gallagher’s filings with the Securities and Exchange Commission (SEC), including Item 1, “Business —–Information Concerning Forward-Looking Statements” and Item 1A, “Risk Factors,” of Gallagher’s Annual Report on Form 10-K for the fiscal year ended December 31, 2009, for a more detailed discussion of these and other factors. This document includes certain non-GAAP financial measures as defined under rules promulgated by the SEC. As required by SEC rules, Gallagher has provided reconciliations of those measures to the most directly comparable GAAP measures, which are available on Gallagher’s Web site at www.ajg.com.
6
INVESTMENT PROFILE FEBRUARY 2010
®
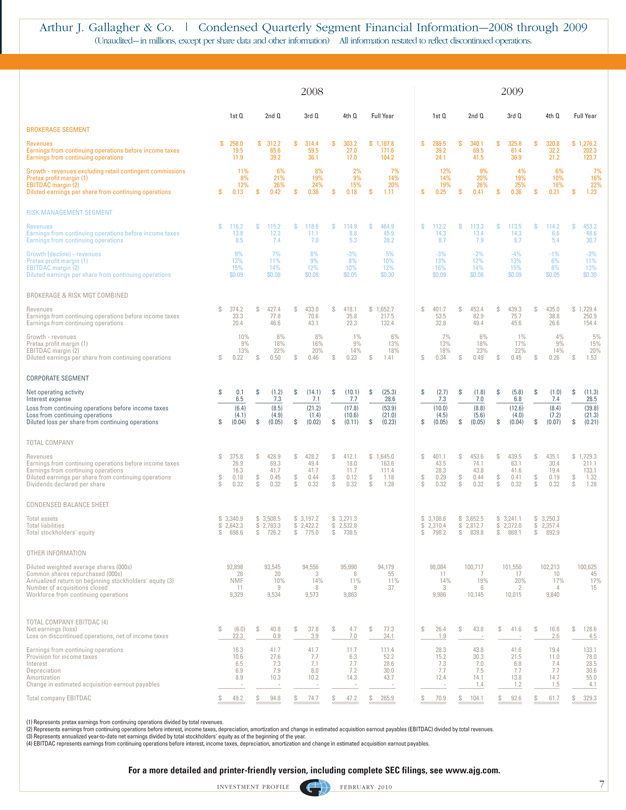
Arthur J. Gallagher & Co. | Condensed Quarterly Segment Financial Information-–2008 through 2009
(Unaudited-–in millions, except per share data and other information) All information restated to reflect discontinued operations.
2008 2009
1st Q 2nd Q 3rd Q 4th Q Full Year 1st Q 2nd Q 3rd Q 4th Q Full Year
BROKERAGE SEGMENT
Revenues $ 258.0 $ 312.2 $ 314.4 $ 303.2 $ 1,187.8 $ 289.5 $ 340.1 $ 325.8 $ 320.8 $ 1,276.2
Earnings from continuing operations before income taxes 19.5 65.6 59.5 27.0 171.6 39.2 69.5 61.4 32.2 202.3
Earnings from continuing operations 11.9 39.2 36.1 17.0 104.2 24.1 41.5 36.9 21.2 123.7
Growth - revenues excluding retail contingent commissions 11% 6% 8% 2% 7% 12% 9% 4% 6% 7%
Pretax profit margin (1) 8% 21% 19% 9% 14% 14% 20% 19% 10% 16%
EBITDAC margin (2) 12% 26% 24% 15% 20% 19% 26% 25% 16% 22%
Diluted earnings per share from continuing operations $ 0.13 $ 0.42 $ 0.38 $ 0.18 $ 1.11 $ 0.25 $ 0.41 $ 0.36 $ 0.21 $ 1.23
RISK MANAGEMENT SEGMENT
Revenues $ 116.2 $ 115.2 $ 118.6 $ 114.9 $ 464.9 $ 112.2 $ 113.3 $ 113.5 $ 114.2 $ 453.2
Earnings from continuing operations before income taxes 13.8 12.2 11.1 8.8 45.9 14.3 13.4 14.3 6.6 48.6
Earnings from continuing operations 8.5 7.4 7.0 5.3 28.2 8.7 7.9 8.7 5.4 30.7
Growth (decline) - revenues 9% 7% 8% -3% 5% -3% -2% -4% -1% -3%
Pretax profit margin (1) 12% 11% 9% 8% 10% 13% 12% 13% 6% 11%
EBITDAC margin (2) 15% 14% 12% 10% 12% 16% 14% 15% 8% 13%
Diluted earnings per share from continuing operations $0.09 $0.08 $0.08 $0.05 $0.30 $0.09 $0.08 $0.09 $0.05 $0.30
BROKERAGE & RISK MGT COMBINED
Revenues $ 374.2 $ 427.4 $ 433.0 $ 418.1 $ 1,652.7 $ 401.7 $ 453.4 $ 439.3 $ 435.0 $ 1,729.4
Earnings from continuing operations before income taxes 33.3 77.8 70.6 35.8 217.5 53.5 82.9 75.7 38.8 250.9
Earnings from continuing operations 20.4 46.6 43.1 22.3 132.4 32.8 49.4 45.6 26.6 154.4
Growth - revenues 10% 6% 8% 1% 6% 7% 6% 1% 4% 5%
Pretax profit margin (1) 9% 18% 16% 9% 13% 13% 18% 17% 9% 15%
EBITDAC margin (2) 13% 22% 20% 14% 18% 18% 23% 22% 14% 20%
Diluted earnings per share from continuing operations $ 0.22 $ 0.50 $ 0.46 $ 0.23 $ 1.41 $ 0.34 $ 0.49 $ 0.45 $ 0.26 $ 1.53
CORPORATE SEGMENT
Net operating activity $ 0.1 $ (1.2) $ (14.1) $ (10.1) $(25.3) $ (2.7) $ (1.8) $ (5.8) $ (1.0) $(11.3)
Interest expense 6.5 7.3 7.1 7.7 28.6 7.3 7.0 6.8 7.4 28.5
Loss from continuing operations before income taxes(6.4)(8.5)(21.2)(17.8)(53.9)(10.0)(8.8)(12.6)(8.4)(39.8)
Loss from continuing operations(4.1)(4.9)(1.4)(10.6)(21.0)(4.5)(5.6)(4.0)(7.2)(21.3)
Diluted loss per share from continuing operations $ (0.04) $ (0.05) $ (0.02) $ (0.11) $(0.23) $ (0.05) $ (0.05) $ (0.04) $ (0.07) $(0.21)
TOTAL COMPANY
Revenues $ 375.8 $ 428.9 $ 428.2 $ 412.1 $ 1,645.0 $ 401.1 $ 453.6 $ 439.5 $ 435.1 $ 1,729.3
Earnings from continuing operations before income taxes 26.9 69.3 49.4 18.0 163.6 43.5 74.1 63.1 30.4 211.1
Earnings from continuing operations 16.3 41.7 41.7 11.7 111.4 28.3 43.8 41.6 19.4 133.1
Diluted earnings per share from continuing operations $ 0.18 $ 0.45 $ 0.44 $ 0.12 $ 1.18 $ 0.29 $ 0.44 $ 0.41 $ 0.19 $ 1.32
Dividends declared per share $ 0.32 $ 0.32 $ 0.32 $ 0.32 $ 1.28 $ 0.32 $ 0.32 $ 0.32 $ 0.32 $ 1.28
CONDENSED BALANCE SHEET
Total assets $ 3,340.9 $ 3,508.5 $ 3,197.2 $ 3,271.3 $ 3,108.6 $ 3,652.5 $ 3,241.1 $ 3,250.3
Total liabilities $ 2,642.3 $ 2,783.3 $ 2,422.2 $ 2,532.8 $ 2,310.4 $ 2,812.7 $ 2,372.0 $ 2,357.4
Total stockholders’ equity $ 698.6 $ 726.2 $ 775.0 $ 738.5 $ 798.2 $ 839.8 $ 869.1 $ 892.9
OTHER INFORMATION
Diluted weighted average shares (000s) 92,898 93,545 94,556 95,990 94,179 98,084 100,717 101,550 102,213 100,625
Common shares repurchased (000s) 26 20 3 6 55 11 7 17 10 45
Annualized return on beginning stockholders’ equity (3) NMF 10% 14% 11% 11% 14% 19% 20% 17% 17%
Number of acquisitions closed 11 9 8 9 37 3 6 2 4 15
Workforce from continuing operations 9,329 9,534 9,573 9,863 9,986 10,145 10,015 9,840
TOTAL COMPANY EBITDAC (4)
Net earnings (loss) $ (6.0) $ 40.8 $ 37.8 $ 4.7 $ 77.3 $ 26.4 $ 43.8 $ 41.6 $ 16.8 $ 128.6
Loss on discontinued operations, net of income taxes 22.3 0.9 3.9 7.0 34.1 1.9 - 2.6 4.5
Earnings from continuing operations 16.3 41.7 41.7 11.7 111.4 28.3 43.8 41.6 19.4 133.1
Provision for income taxes 10.6 27.6 7.7 6.3 52.2 15.2 30.3 21.5 11.0 78.0
Interest 6.5 7.3 7.1 7.7 28.6 7.3 7.0 6.8 7.4 28.5
Depreciation 6.9 7.9 8.0 7.2 30.0 7.7 7.5 7.7 7.7 30.6
Amortization 8.9 10.3 10.2 14.3 43.7 12.4 14.1 13.8 14.7 55.0
Change in estimated acquisition earnout payables ------ 1.4 1.2 1.5 4.1
Total company EBITDAC $ 49.2 $ 94.8 $ 74.7 $ 47.2 $ 265.9 $ 70.9 $ 104.1 $ 92.6 $ 61.7 $ 329.3
(1) Represents pretax earnings from continuing operations divided by total revenues.
(2) Represents earnings from continuing operations before interest, income taxes, depreciation, amortization and change in estimated acquisition earnout payables (EBITDAC) divided by total revenues.
(3) Represents annualized year-to-date net earnings divided by total stockholders’ equity as of the beginning of the year.
(4) EBITDAC represents earnings from continuing operations before interest, income taxes, depreciation, amortization and change in estimated acquisition earnout payables.
For a more detailed and printer-friendly version, including complete SEC filings, see www.ajg.com.
INVESTMENT PROFILE FEBRUARY 2010 7
®
WHY INVEST?
$2,000 $1,700 $1,400 $1,100 $800 $500 $200
2004
2005
2006
2007
2008
2009
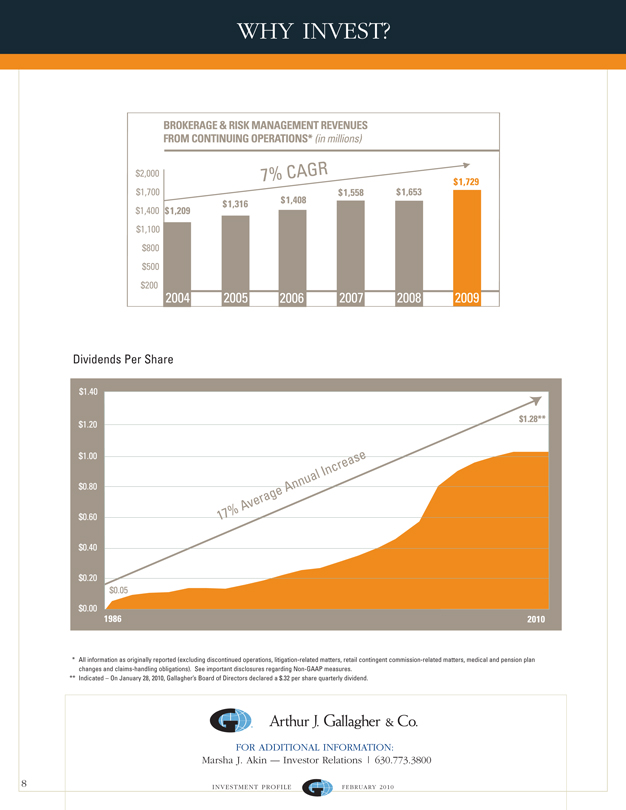
$1,209
$1,316
$1,408
$1,558
$1,653
$1,729
7%cagr
Brokerage & Risk Management Revenues from continuing operations* (in millions)
Dividends Per Share
$1.40
$1.20
$1.00
$0.80
$0.60
$0.40
$0.20
$0.00
1986 2010
17% Average Annual Increase
$1,28**
* All information as originally reported (excluding discontinued operations, litigation-related matters, retail contingent commission-related matters, medical and pension plan changes and claims-handling obligations). See important disclosures regarding Non-GAAP measures.
** Indicated – On January 28, 2010, Gallagher’s Board of Directors declared a $.32 per share quarterly dividend.
FOR ADDITIONAL INFORMATION: Marsha J. Akin –– Investor Relations | 630.773.3800
®
8
INVESTMENT PROFILE FEBRUARY 2010
®