Attached files
| file | filename |
|---|---|
| 8-K - FORM 8-K - Arthur J. Gallagher & Co. | d8k.htm |
| EX-99.2 - ARTHUR J. GALLAGHER & CO. FEBRUARY 2010 INVESTMENT PROFILE - Arthur J. Gallagher & Co. | dex992.htm |
 Investment Presentation February 2010 Exhibit 99.1 |
 2 This presentation contains forward-looking statements within the meaning of the Private Securities
Litigation Reform Act of 1995. Examples of forward-looking statements include,
but are not limited to, statements relating to our future results, areas of future revenue
growth, anticipated contingent commission revenue, anticipated performance of our clean-energy investments, impact of expense reductions, future acquisition activity, and the future of the insurance and
insurance brokerage industries. Forward-looking statements made by or on behalf of
Gallagher are subject to risks and uncertainties that could cause Gallagher’s actual results
to be materially different than those expressed in our forward-looking statements, including
but not limited to the following: Gallagher’s commission revenues are highly dependent on premiums charged by insurers, which are subject to fluctuation; alternative insurance markets continue to
grow, which could unfavorably impact commission and favorably impact fee revenue, though not
necessarily to the same extent; Gallagher’s revenues vary significantly from
period-to-period as a result of the timing of policy inception dates and the net effect
of new and lost business production; Gallagher faces significant competitive pressures; disruptions in the credit and financial markets could limit access to capital and credit and make it more difficult for Gallagher to obtain
financing for its operations or investments or increase its cost of obtaining financing; the
recession could adversely affect Gallagher’s business in a number of ways, including by
causing its clients to purchase less insurance coverage, by leading to a continued reduction in
the number of claims processed by Gallagher, or by causing insurance companies with which Gallagher does business to experience liquidity problems, withdraw from writing certain coverages, or fail;
Gallagher’s ability to grow has been enhanced through acquisitions, which may or may not be
available on acceptable terms in the future and which, if consummated, may or may not be
advantageous to Gallagher; Gallagher’s debt agreements contain restrictions and covenants
that could significantly impact Gallagher’s ability to operate its business; Gallagher could incur substantial losses if one of the commercial banks it uses fails; Gallagher’s non-U.S. operations
expose it to certain risks such as exchange rate fluctuations, geopolitical risk, and risks
related to regulatory requirements including those imposed by the U.S. Foreign Corrupt Practices
Act; Gallagher is subject to insurance industry regulation worldwide, and such regulations could
change at any time; changes in Gallagher’s accounting estimates and assumptions could adversely affect its financial position and operating results; Gallagher is subject to a number of contingencies and
legal proceedings; rising employee benefits costs (including pension expense) could reduce
Gallagher’s profitability; Gallagher’s effective income tax rate and obligations under
tax indemnity agreements may be subject to increase as a result of changes in income tax laws,
unfavorable interpretations of past, current or future tax laws or developments resulting in the loss or unavailability of historically claimed tax credits under Section 29 of the Internal Revenue Code (IRC); there
are significant uncertainties related to Gallagher’s IRC Section 45-related investments,
which must be favorably resolved in order for Gallagher to recoup these investments and generate
earnings on them; and operations at the IRC Section 45 facilities could subject Gallagher to
environmental and product liability claims and environmental compliance costs. For a further discussion of certain of the matters described above see Item 1A, “Risk Factors” in
Gallagher’s Annual Report on Form 10-K for the year ended December 31, 2009.
Safe Harbor Statement Under the Private Securities Litigation Reform Act of 1995 |
 3 Certain Non-GAAP Financial Measures This presentation contains certain information that may be considered “non-GAAP
financial measures” within the meaning of SEC regulations because it is
derived from Gallagher’s consolidated financial information but is not required to be presented in financial statements that are prepared
in conformity with U.S. generally accepted accounting principles (GAAP).
Consistent with SEC regulations, a description of such information is provided
below and a reconciliation of certain of such items to GAAP is provided on our Web site at www.ajg.com. Pretax earnings from continuing operations for 2006 and 2005 were adjusted in this
presentation to add back charges related to litigation and contingent
commission matters and claims handling obligations and to eliminate the impact
of medical and pension plan changes. Charges in 2006 relating to retail contingent commission related matters and medical plan changes totaled $9.0 million (or $5.4 million after tax) and $7.5 million (or $4.5 million after tax), respectively. Charges in 2005 relating to
retail contingent commission matters and claims handling obligations totaled
$73.6 million (or $44.2 million after tax) and $5.2 million (or $3.6 million
after tax), respectively. In addition, Gallagher recognized a pension curtailment gain of $10.0 million (or $6.0 million after tax) in 2005. There were no such charges or gains in 2007 to 2009. These adjustments, which Gallagher believes are for non-recurring items, were made to GAAP
earnings from continuing operations in 2006 and 2005 in order to calculate
earnings from continuing operations before litigation and contingent
commission related matters, claims handling obligations and medical and pension plan changes. Gallagher believes the “non-GAAP financial measures” included in this presentation provide meaningful additional information, which may be helpful to investors in assessing certain aspects of
its operating performance and financial condition that may not be otherwise
apparent from the information Gallagher provides in accordance with GAAP.
Gallagher’s industry peers provide similar non-GAAP supplemental information, although they may not use the same or comparable terminology and may not make
identical adjustments. This non-GAAP information provided by
Gallagher should be used in addition to, but not as a substitute for, the GAAP
information provided. |
 4 Arthur J. Gallagher & Co. l Among the world’s top 5 insurance brokers* Retail & Wholesale – 90% U.S., 10% International • Largest Managing General Agent* • One of the fastest growing Lloyd’s brokers • Predominate focus on middle-market space l Largest P/C third-party administrator* Adjusting WC, liability & property claims/BPO 85% U.S., 15% International 2009 Business Insurance Readers Choice Award l Simple business model: we sell insurance and adjust claims l No underwriting risk *According to Business Insurance magazine |
 5 In February 2009 We Said l We were well-positioned coming into 2009 EBITDAC – $291m in 2008 Roll-over of 2008 M&A into 2009 – $25m to $30m EBITDAC Cost-containment in 2009 – $25m to$30m EBITDAC
Completed 4% workforce reduction in 2008 l We would return cash to stockholders Strong history of dividends & repurchases l We would complete Liberty Mutual/Wausau deal Little EBITDAC in 2009 but $30m+ in 2010 |
 6 We Did What We Said l Grew EBITDAC by $50m in 2009 up 17% Roll-over of 2008 M&A into 2009 – $25m to $30m EBITDAC Cost-containment in 2009 – $25m to $30m EBITDAC Liberty Mutual/Wausau integration – Approx. $10m in EBITDAC in 2009 Despite negative organic growth l Maintained $1.28 dividend |
 7 In 2009 We Also l Hired production teams – U.S., London, Canada l Regained ability to accept contingent commissions l Completed $150m private debt placement at 5.85% rate l Reduced middle and back-office workforce by another 4% l Built 8 clean-energy facilities |
 8 Positioned Coming Into 2010 l Roll-over of 2009 M&A into 2010 – $12m to $15m EBITDAC – Includes Liberty Mutual/Wausau l Cost containment – net $20m reduction in workforce costs l Potential – up to $6m to $10m net earnings from clean energy facilities in 2010 and up to $40m from 2011 through 2019 l Up to $10m in additional contingent commissions in 2011 |
 9 Environment Still Challenged l Headwinds Continue Soft P&C Insurance Market •CIAB – 5% to 6% average pricing decline in 2009 Still Seeing Economic Issues •Reduced payrolls, exposure units and claim counts
•Lag effect in brokerage renewals Lower Investment
Yields •Cash in no-yield, government-protected accounts •Expect only $3m to $4m again in 2010 |
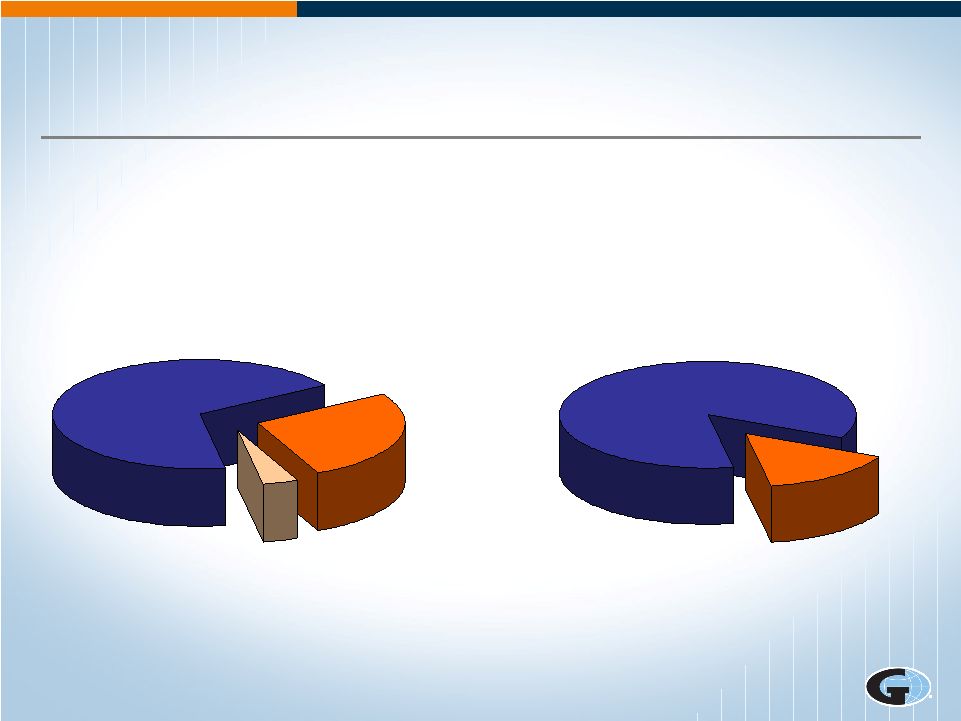
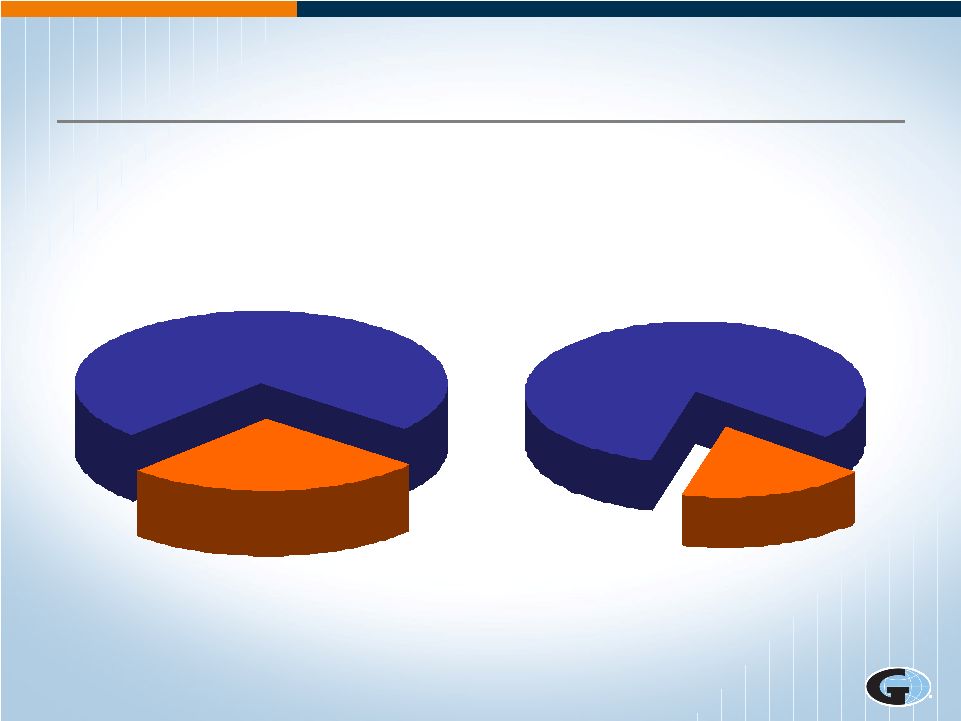 10 Two Core Businesses l 2009 Revenues – $1.7 billion l 2009 EBITDAC – $341 million Brokerage 74% (Selling Insurance) Risk Management 26% (Adjusting Claims) Brokerage 82% Risk Management 18% See important disclosures regarding Non-GAAP measures on page 3 |
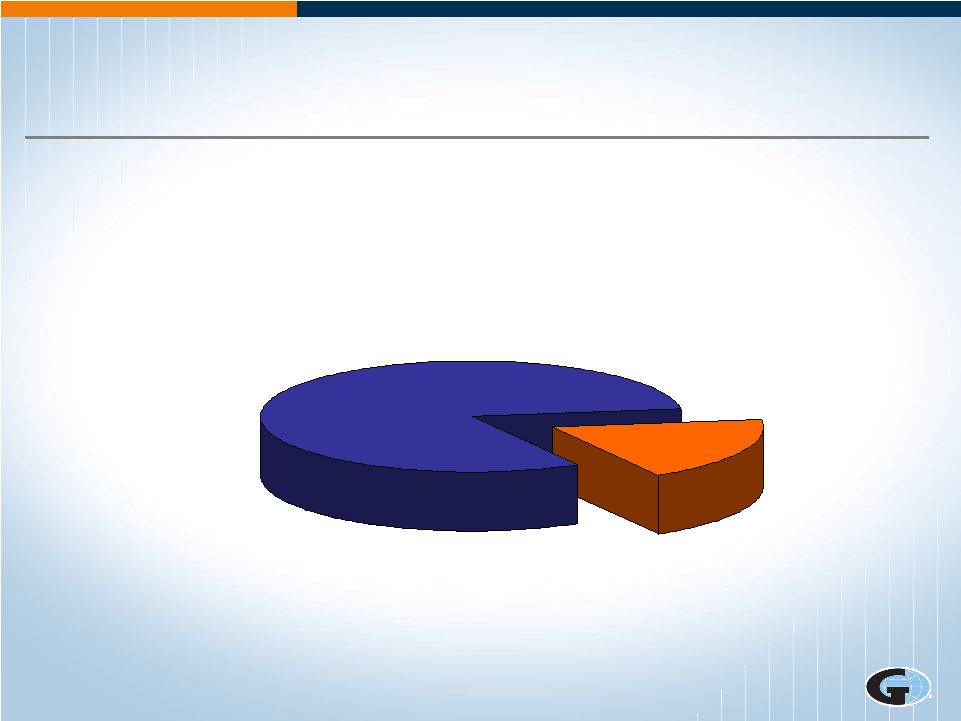 11 Brokerage Segment l 2009 Revenues – $1.3 billion Retail 81% Mostly U.S. and Canada Wholesale 19% Mostly U.S. and U.K. See important disclosures regarding Non-GAAP measures on page 3 l 2009 EBITDAC – $280 million |
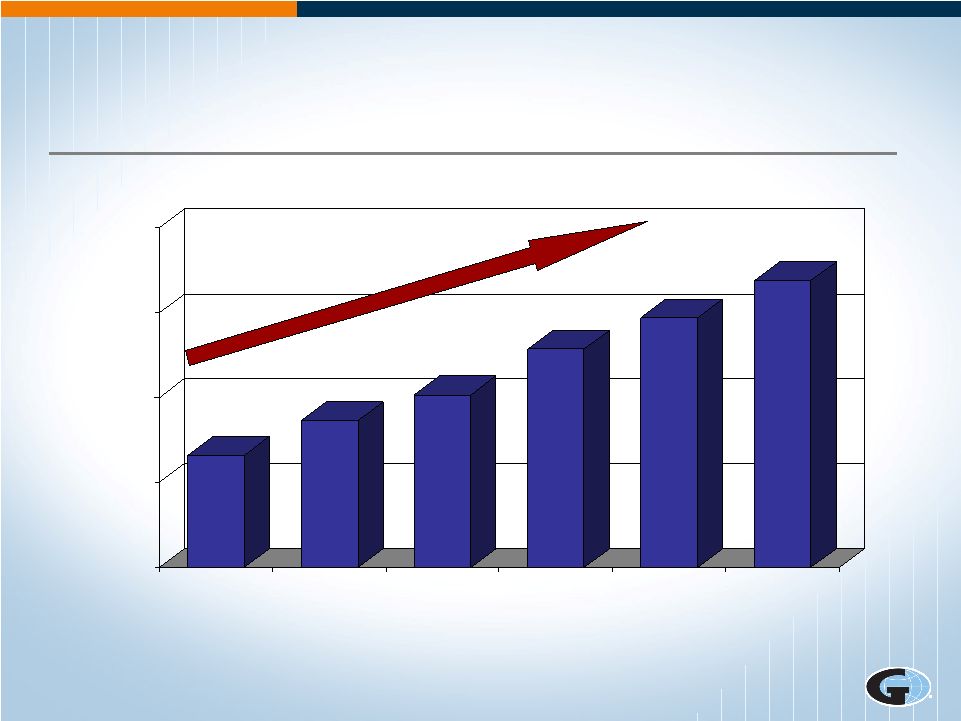 12 Brokerage Segment Revenues From Continuing Operations $600 $800 $1,000 $1,200 $1,400 8 % CAGR 2005 2006 2007 2008 2009 $864 $1,007 $1,114 $1,188 $1,276 $946 2004 |
 13 Brokerage Segment EBITDAC from Continuing Operations* *See important disclosures regarding Non-GAAP measures on page 3 $150 $175 $200 $225 $250 $275 $300 2004 2005 2006 2007 2008 2009 $211 $280 $233 $228 $207 $193 7% CAGR |
 14 l Drive top-line growth Domestic International l Cost containment l Stay in sweet spot Middle to upper commercial market Very niche-focused Brokerage Segment Focus |
 15 Niche/Practice Groups l Agribusiness l Aviation & Aerospace l Captive Consulting l Construction l Energy l Entertainment l Global Risks l Habitational l Healthcare l Higher Education l Hospitality l Institutional Services l Marine l Manufacturing l Personal l Professional Groups l Private Equity l Public Entity l Real Estate l Religious/Not-for-Profit l Restaurant l Scholastic l Technology/Telecom l Transportation |
 16 Growth – Domestic l Internal revenue drivers Hiring new producers wanting: •Access to our network, expertise and niches •Infrastructure support Growing our own producers
through: •Two-year internship program •Career Launch program Cross-selling and utilization of our worldwide capabilities Compensation from carriers |
 17 l Organic Substantial London operations Hire experienced sales teams We can now handle about any type of business l Opportunistic acquisitions/minority interests l Gallagher Optimus Network Correspondent brokers and agents in more than 100 countries Stages of partnership to investment Growth – International |
 18 Gallagher Optimus Network |
 19 Growth – Acquisitions l Acquisitions 18,000 retail and wholesale brokerages and agencies* in the U.S. (P&C and Benefits) Many owned by baby boomers who need an exit strategy yet still want to be in the business Smaller number of consolidators *According to Hales & Co, Inc. |
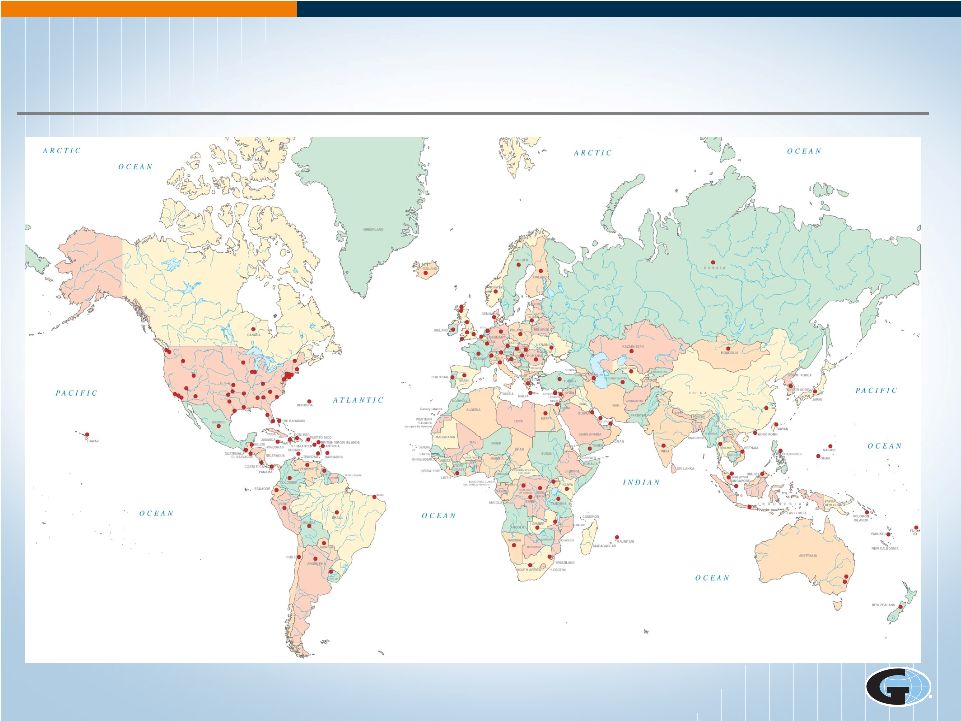
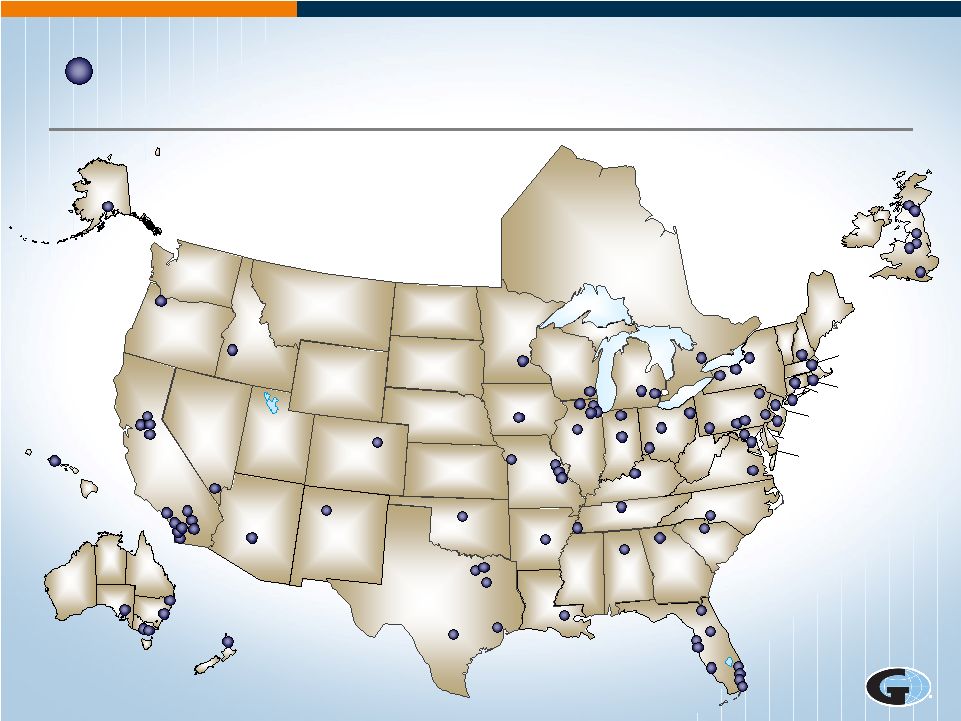
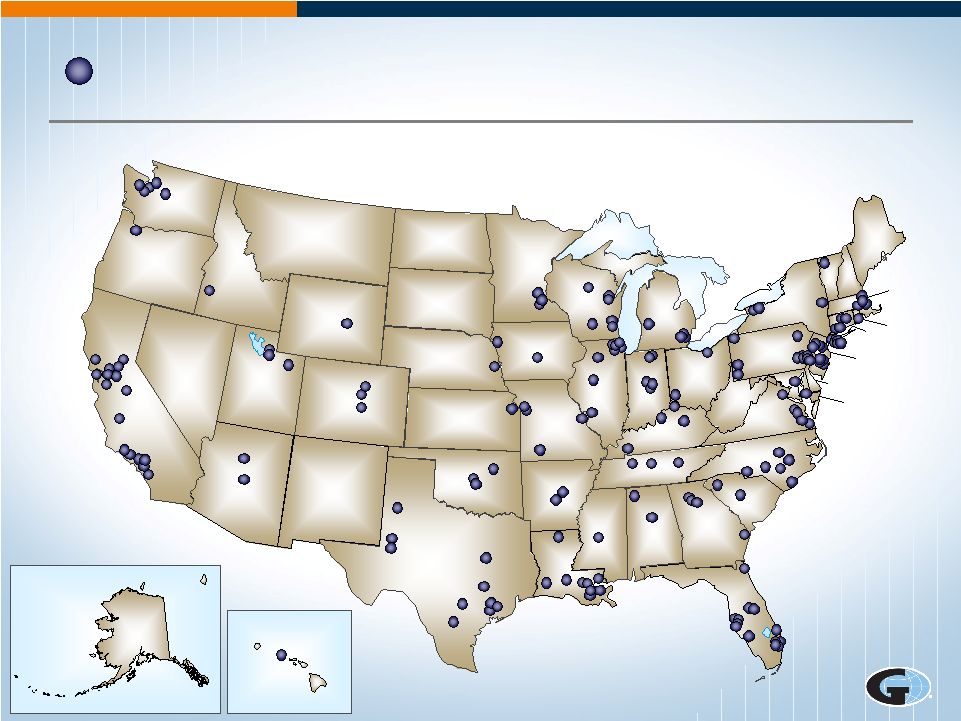 20 ID MT WA CA UT NV AZ NM TX OK KS NE MN WI MO AR LA TN IL WV PA NY NH ME MA CT NJ DE MD IA CO WY SD ND OR OH MI KY MS AL GA FL SC NC VA VT RI IN AK HI Current Gallagher U.S. Locations
|
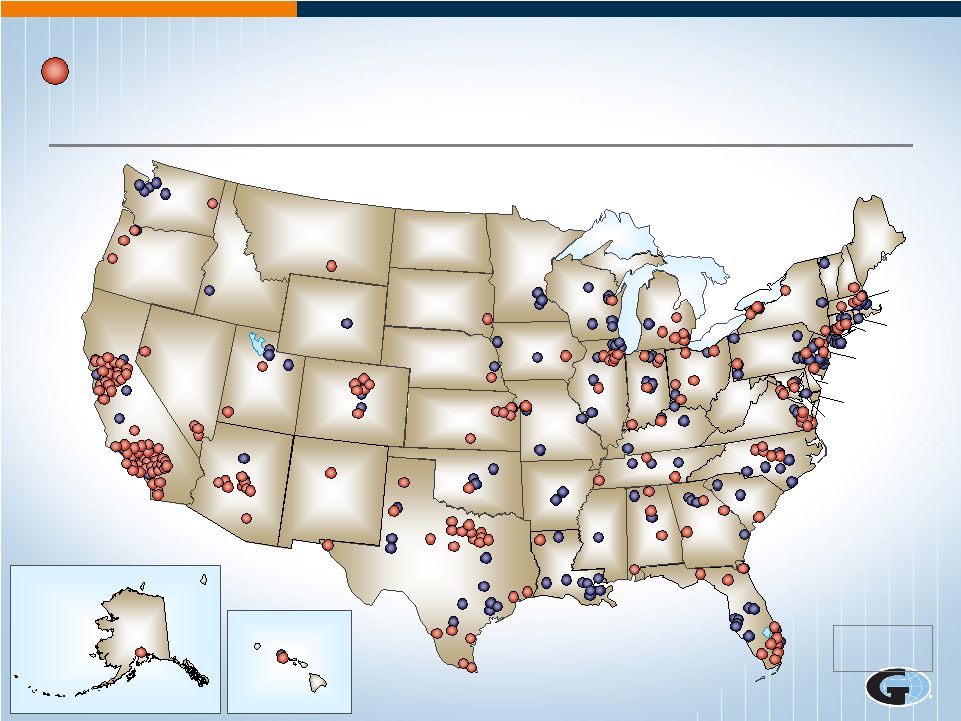 21 Larger Cities Where We Aren’t
Located Source for Acquisition Targets: ID 68 MT 59 WA 282 CA 1,777 UT 122 NV 103 AZ 237 NM 77 TX 1,082 OK 181 KS 185 NE 137 MN 300 WI 315 MO 320 AR 109 LA 232 TN 340 IL 711 WV 78 PA 904 NY 1,425 NH 121 ME 112 MA 642 CT 331 NJ 699 DE 53 MD 301 IA 213 CO 221 WY 18 SD 47 ND 45 OR 181 OH 641 MI 524 KY 189 MS 126 AL 199 GA 467 FL 1,079 SC 189 NC 444 VA 317 VT 56 RI IN 324 AK 36 HI 47 DC 23 Puerto Rico 53 Virgin Islands 2 Hales & Co., Inc. and D&B
|
 22 Growth by Acquisition l Approx. 235 deals since 1985 l Typical deal: $2 to $10 million in revenues 2 to 5 producers/staff of 10 to 20 EBITDAC margins between 25% - 30% 2008 – paid 6.3x EBITDAC 2009 – paid 5.8x EBITDAC l Must fit into our sales culture! See important disclosures regarding Non-GAAP measures on page 3 EBITDAC multiples are based on the initial recorded purchase price, which in 2009 includes the estimated fair value of earnout payable 4.5 5.0 5.5 6.0 6.5 7.0 7.5 8.0 2006 2007 2008 2009 Median EBITDAC Multiples |
 23 Risk Management Segment l 2009 Revenues –
$453 million Workers Compensation 69% Liability 27% Property 4% Domestic 85% International 15% See important disclosures regarding Non-GAAP measures on page 3 l 2009 EBITDAC –
$61 million |
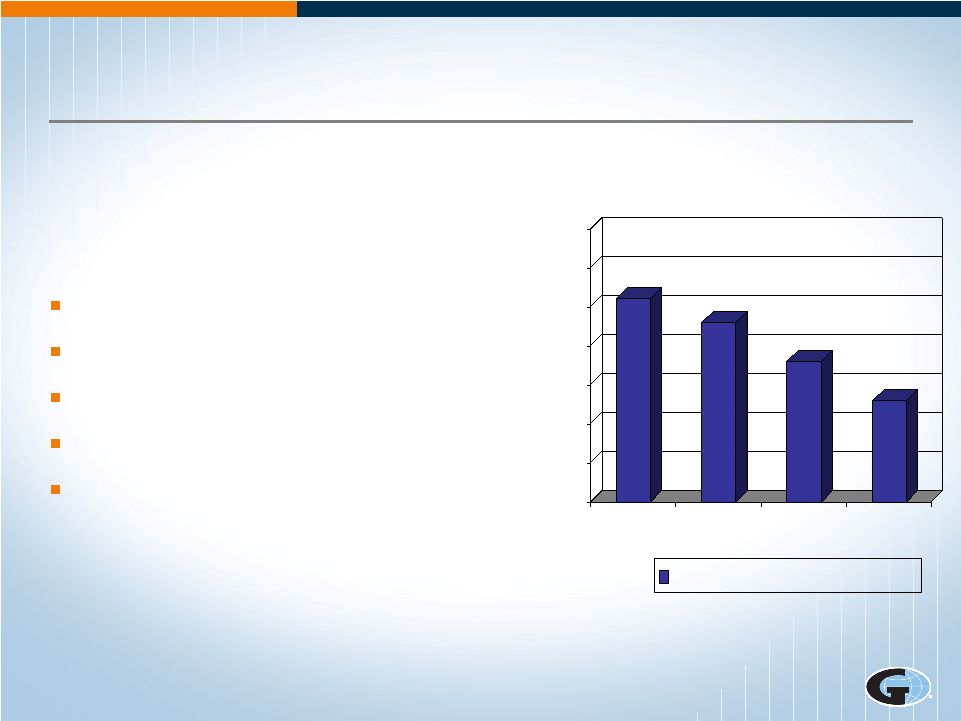
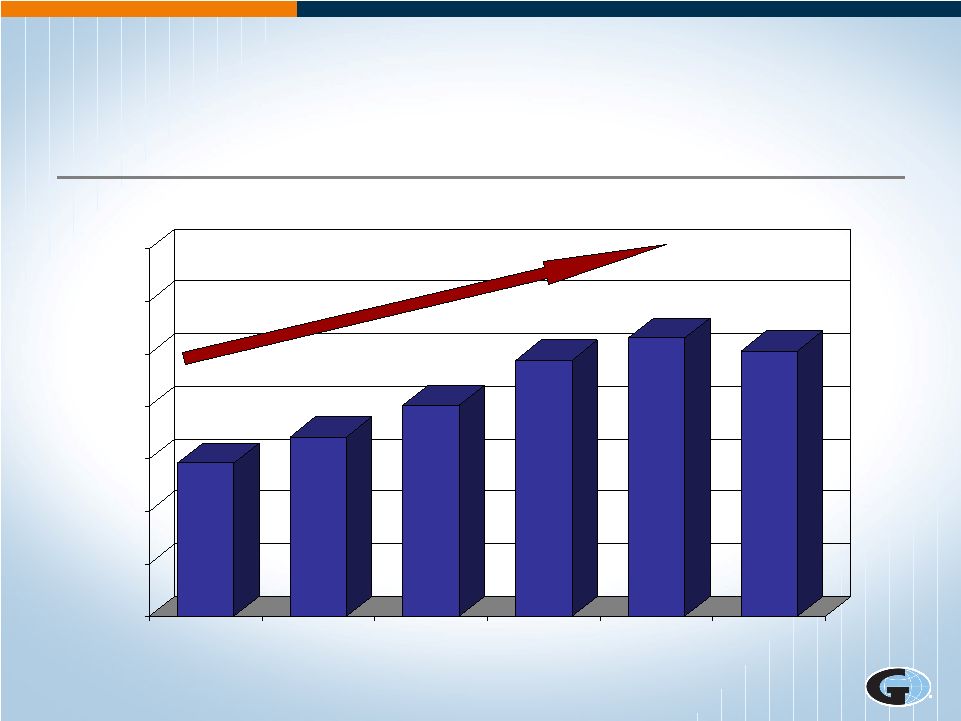 24 Risk Management Segment Revenues From Continuing Operations (In millions) $200 $250 $300 $350 $400 $450 $500 $550 8% CAGR $371 $401 $444 $465 $453 2005 2006 2007 2008 2009 2004 $346 |
 25 l Growth Domestic International l Client service High quality standards Technology l Cost containment Risk Management Segment – Focus |
 26 RM Growth – Domestic l All organic l Over 84% non-Gallagher clients l Targeting Mainly Fortune 1000 companies Standard platform enables profitable service to smaller accounts l Differentiation Network focused or dedicated – flexibility Client intimacy Quality standards Proprietary technology National workers compensation capability |
 27 l Fastest growing Revenues – 5 year CAGR of 12.4% l In Australia, Canada, U.K. & New Zealand l Largely public entity but leveraging U.S. expertise to penetrate commercial clients l Global technology capabilities l Standard claims process RM Growth – International |
 28 AK HI AUSTRALIA NEW ZELAND SCOTLAND ENGLAND ID MT WA CA UT NV AZ N M TX OK KS NE MN WI M O AR LA TN IL W V PA NY NH ME MA CT NJ D E M D IA CO W Y SD ND OR OH MI KY MS AL GA FL SC NC VA VT RI IN ONTARIO Risk Management Locations |
 29 Corporate Segment l Interest expense on debt – $8.8m/qrtr l Corporate operating expense – $1m/qrtr l Clean-Energy Facilities – potential of $6m to $10m net earnings in 2010 while operating under temporary regulatory permits and $40m/yr net earnings from 2011 through 2019 Combination of pretax income and tax credits under IRC Section 45 Full benefits require permanent regulatory permits and satisfying other operating conditions |
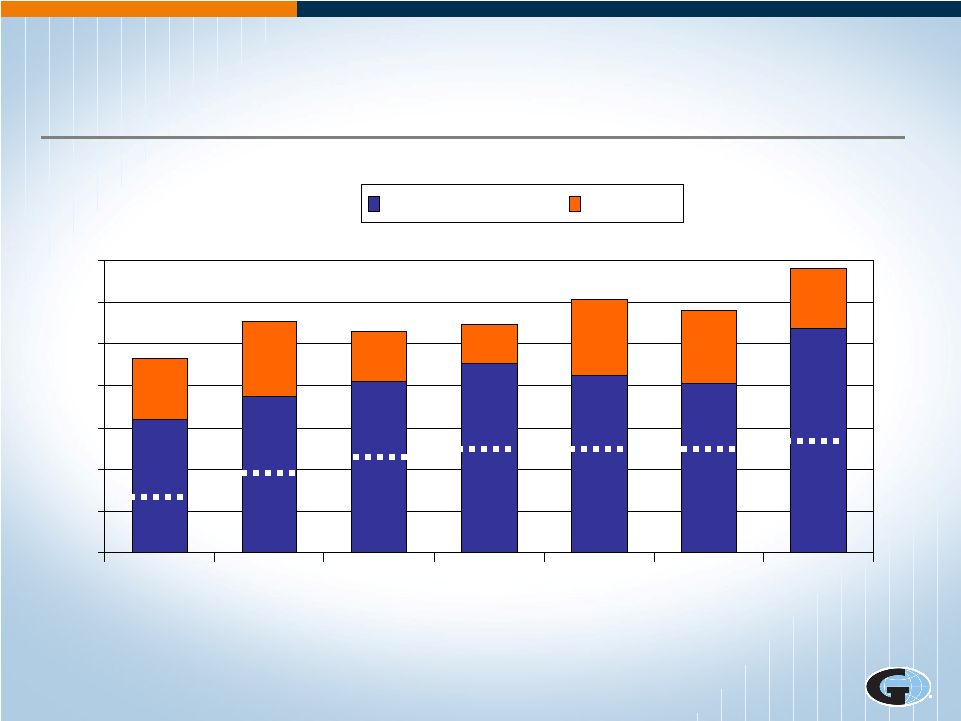 30 $0 $50 $100 $150 $200 $250 $300 $350 2003 2004 2005 2006 2007 2008 2009 Cash Generation* EBITDAC Business Generates Cash* * See important disclosures regarding Non-GAAP measures on page 3 and see Exhibit
1 (In millions) - Dividend |
 31 Uses of Cash l Return cash to stockholders Pay dividends – $1.28/share and 5.4%* yield Repurchase shares but currently favor dividends l Buy brokers Mix of cash and/or stock Currently 75% stock and 25% cash l Neither segment needs substantial capital or cap-ex *At February 19, 2010 |
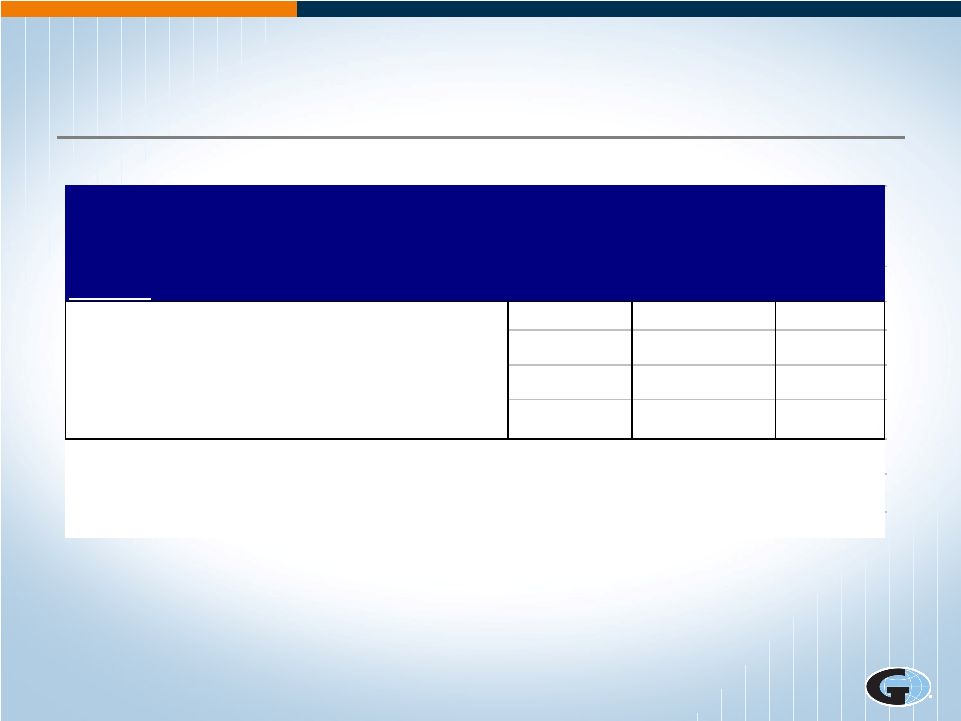 32 Prudent Balance Sheet l Flexibility remains – $436m available line of credit capacity at December 31, 2009 See important disclosures regarding Non-GAAP measures on page 3 Global Insurance Broker Avg S&P 1000 (millions) 2009 2009 2009 Total Debt $550 Stockholders' equity $893 Debt to Total Capital (Debt/(Debt + Equity)) 38% 39% 42% Debt to EBITDAC* 1.6x 2.0x 5.4x Source for S&P 1000 Data: Thomson Reuters Spreadsheet Link *Global Insurance Broker's EBITDAC adjusted for restructuring charges & unusual items Gallagher |
 33 Focusing on Priorities l Top priorities: Driving growth Expense containment Servicing our clients •Helping them navigate troubled economy
•Continuing to increase quality service
levels •Expanding capabilities and
options Return cash to stockholders |
 34 l Questions & Answers |
 35 Exhibit 1 Short-cut To Understanding Cash Generation (See GAAP cash flows in Statement of Cash Flows) See important disclosures regarding Non-GAAP measures on page 3 $ millions 2005 2006 2007 2008 2009 Brokerage & Risk Management EBITDAC from Continuing Operations (adjusted for unusual items) 266 $ 273 $ 304 $ 291 $ 340 $ Stock compensation expense 16 25 19 18 16 Capital expenditures (23) (33) (41) (32) (24) Interest expense on corporate debt & corporate overhead expenses (6) (6) (22) (35) (35) Taxes paid (47) (31) (48) (40) (28) Cash generation 206 $ 228 $ 212 $ 202 $ 268 $ |
 36 For Additional Information l Website: www.ajg.com l Email: investor_relations@ajg.com l Marsha Akin Marsha_Akin@ajg.com l Phone: 630-285-3501 |