Attached files
| file | filename |
|---|---|
| 8-K - FORM 8-K - CenterState Bank Corp | d8k.htm |
 Investor Presentation Exhibit 99.1 |
 This presentation contains forward-looking statements, as defined by Federal
Securities Laws, relating to present or future trends or factors affecting
the operations, markets and products of CenterState Banks, Inc. (CSFL). These statements are provided to assist in the understanding of future financial performance. Any such statements are based on current
expectations and involve a number of risks and uncertainties. For a
discussion of factors that may cause such forward-looking statements to
differ materially from actual results, please refer to CSFL’s
most recent Form 10-Q and Form 10-K filed with the Securities Exchange Commission. CSFL undertakes no obligation to release revisions to these forward-looking
statements or reflect events or circumstances after the date of this
presentation. Forward Looking Statement 2 |
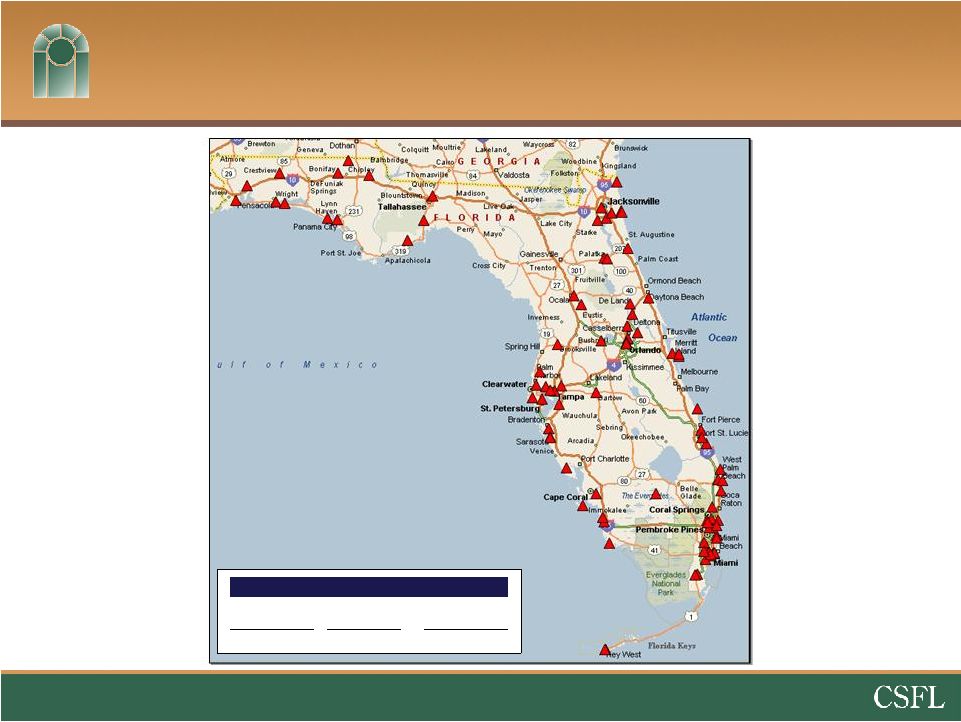
 Corporate Overview Headquartered in Davenport, Florida $1.8 billion in assets $1.3 billion in deposits Company formed: June 2000 4 Subsidiary Banks; 38 branch banking offices in 10 counties throughout Central Florida 6 of 10 counties of operation rank in the top 15 fastest growing counties in Florida Counties of Operation Citrus Hernando Hillsborough Lake Marion Orange Osceola Pasco Polk Sumter Headquarters CenterState Bank Central Florida, N.A. CenterState Bank, N.A. CenterState Bank of Florida, N.A. Valrico State Bank 3 |
 Market Share Opportunity Combined Counties of Operation 4 Deposits per Deposits Market Branch Rank Institution ($000) Share Branches ($000) 1 Bank of America Corp. (NC) $10,301,554 20.25 % 111 $92,807 2 SunTrust Banks Inc. (GA) 9,196,029 18.08 146 62,986 3 Wells Fargo & Company (CA) 8,120,483 15.96 113 71,863 4 BB&T Corp. (NC) 3,916,987 7.70 73 53,657 5 Regions Financial Corp. (AL) 3,311,920 6.51 91 36,395 6 CenterState Banks (FL) 1,204,831 2.37 37 32,563 7 Fifth Third Bancorp (OH) 1,131,031 2.22 30 37,701 8 South Financial Group Inc. (SC) 838,113 1.65 17 49,301 9 Village Bancorp Inc. (FL) 817,150 1.61 9 90,794 10 The Tampa Banking Co. (FL) 786,536 1.55 9 87,393 Source: FDIC and SNL Financial. Deposit data as of 6/30/09. Market share data for CSFL's combined counties of operation, excluding
Orange County. Excludes Orange County in which CSFL has $20.0
million in deposits and 1 branch. |
 Goals and Priorities Achieve Return on Average Assets of 1.00% Surpass $5 billion in assets Expand into new markets with demographics similar to Central Florida Remain highly capitalized Strategic Goals Priorities (18 – 24 Months) Acquire banking institutions through FDIC assisted transactions Leverage Correspondent Banking Division Reduce the level of problem assets 5 |
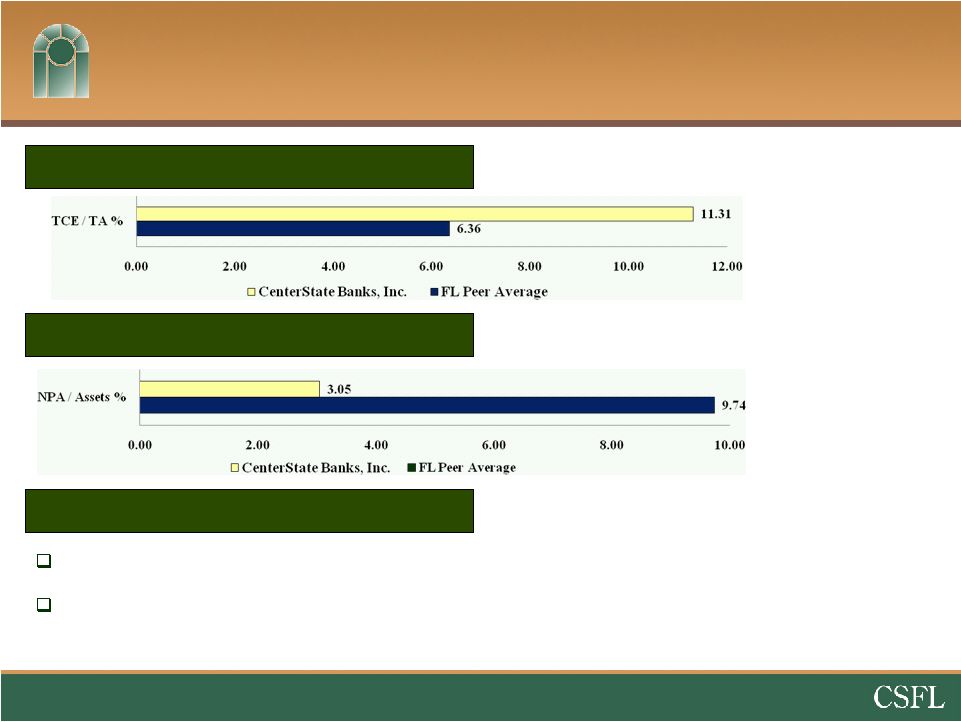
 Conservative Balance Sheet Loans / Assets of 55% as of 12/31/09 Constr/A&D/Land loans represent 12% of total loans
versus 22% for Southeastern peers and 18% for Florida peers NPAs / Assets of 3.05% versus 4.57% for Southeastern peers and
9.74% for Florida peers Robust capital position • TCE and Tier 1 leverage ratios of 11.3% and 11.4% at 12/31/09 Source: SNL Financial and Company filings, data as of most recent quarter
available. Southeastern peers include ABCB, BTFG, GRNB, PNFP,
RNST, SCBT, UBSH and UCBI. Florida peers include BBX, BOFL, BCBF,
CCBG, CBKS, FCFL, FUBC, GFLB, SBCF, SAMB and TIBB. 6
|
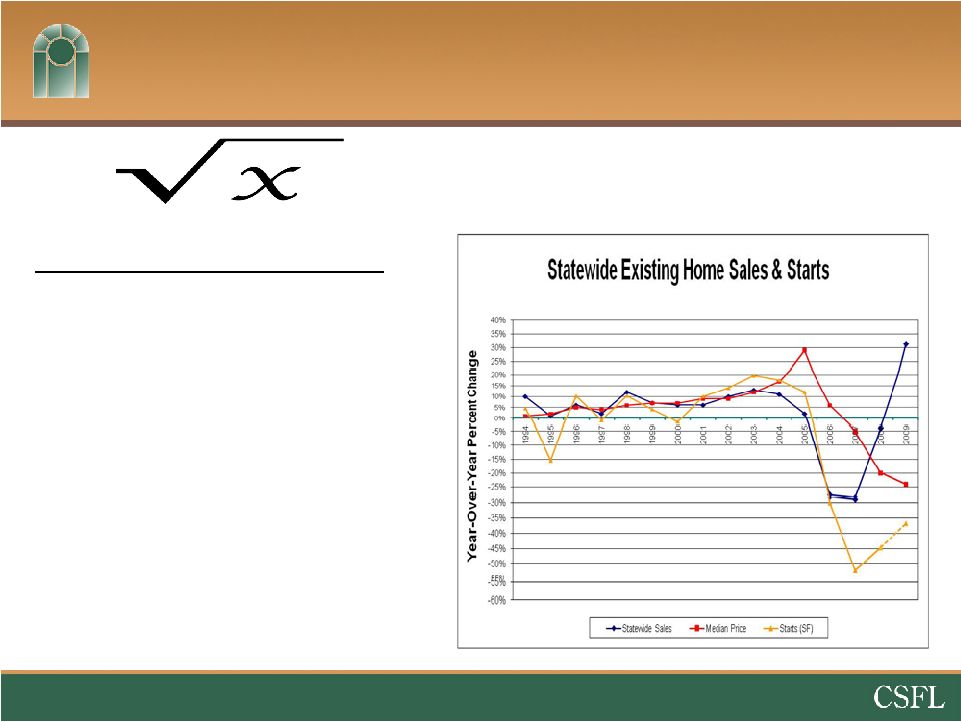 NEAR-TERM DRIVERS 1. Home sales up significantly Orlando up 50% over the last year 2. Home prices continue to slide - Foreclosures & shadow inventory 3. Unemployment continues to creep upward ~ 12% 4. Debt-overhang will slow expansion in the near term = Bank Consolidation Florida Outlook – Long Slow Recovery Source: Florida Legislature Office of Economic and Demographic Research
7 |
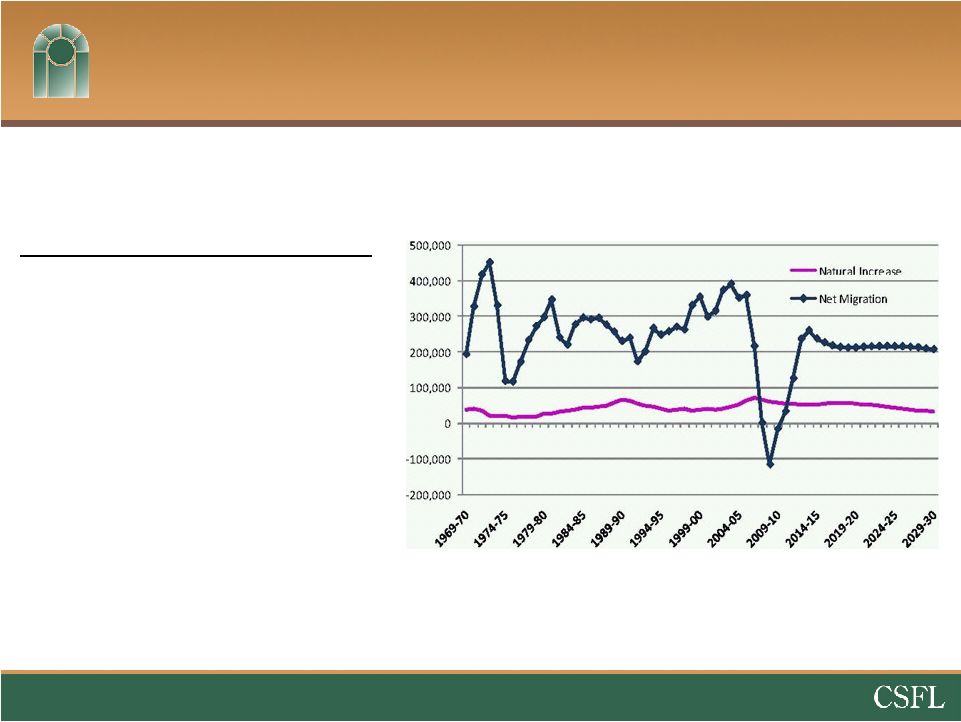 LONG-TERM DRIVERS 1. Housing more affordable 2. Baby-Boomers nearing retirement age 3. Net migration to return 4. 72 degrees in January Florida Outlook Long-Term Future Still Bright Florida’s Population Growth Source: Florida Legislature Office of Economic and Demographic Research
8 |
 9 Positioned for FDIC Acquisitions Source: SNL Financial, data as of most recent quarter available. Florida peers include BBX, BOFL, BCBF, CCBG, CBKS, FCFL, FUBC, GFLB, SBCF, SAMB and TIBB. Capital NPAs Management Prior FDIC acquisition experience – Ocala National Bank 4 separate executive teams within the holding company
|
 Numerous FDIC Transaction Opportunities 10 Source: SNL Financial. Data as of 12/31/09 Texas Ratio > 75% or Tier 1 Leverage Ratio < 5% No. of Institutions No. of Branches Deposits ($MM) 98 688 $39,214 |
 FDIC Deals - Core Deposit Focus Jumbo Time Deposits Retail Time Deposits Money Market & Savings Accts. Demand – Interest bearing Non – Interest bearing deposits Total Deposits ($MM) Number of Deposit Accounts Core deposits defined as non-time deposits. 11 24% 20% 24% 15% 18% Approximately 66,586 total accounts - $19,599 average balance per
account Ocala National Bank (FDIC
assisted) – Core deposits up 13% in first year |
 Correspondent Banking Division Management lift out from RBC (20 employees – formerly ALAB) and recent addition of Capital Markets Division of Silverton (40 employees) Physical operations – Birmingham (AL), Atlanta (GA) and Winston-Salem (NC) Three primary business lines Bond Sales Fed funds Safekeeping, bond accounting, and asset/liability consulting services Customer base – 400 small to medium size financial institutions primarily located in Florida, Alabama, Georgia and the Carolinas Opportunity Bank Clearing & Cash Management Talent Recruiting / M&A Division Contribution 12 ($000s, except per share) 4Q08 1Q09 2Q09 3Q09 4Q09 Net Interest Income $43 $1,178 $1,975 $1,813 $1,656 Bond Sales Commission 1,412 2,557 2,610 5,630 7,119 Other Income --- 40 60 381 349 Total Expenses (1,007) (2,104) (2,038) (5,312) (6,512) Income Tax Expense (117) (428) (881) (967) (1,006) Net Income Impact $331 $1,243 $1,726 $1,545 1,606 EPS Impact $0.03 $0.10 $0.14 $0.07 $0.06 |
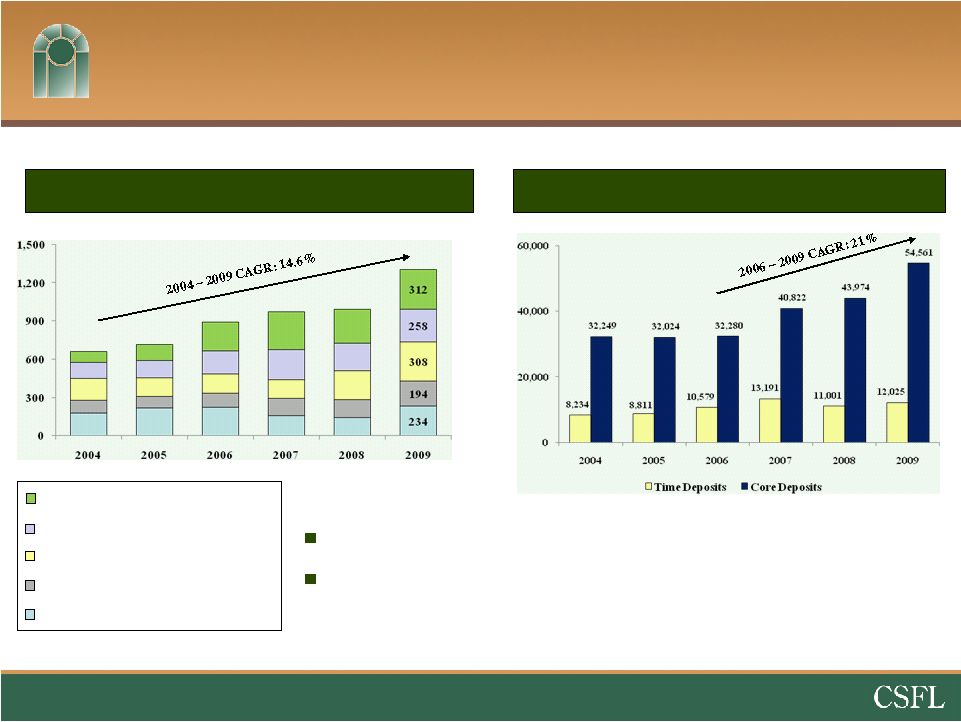
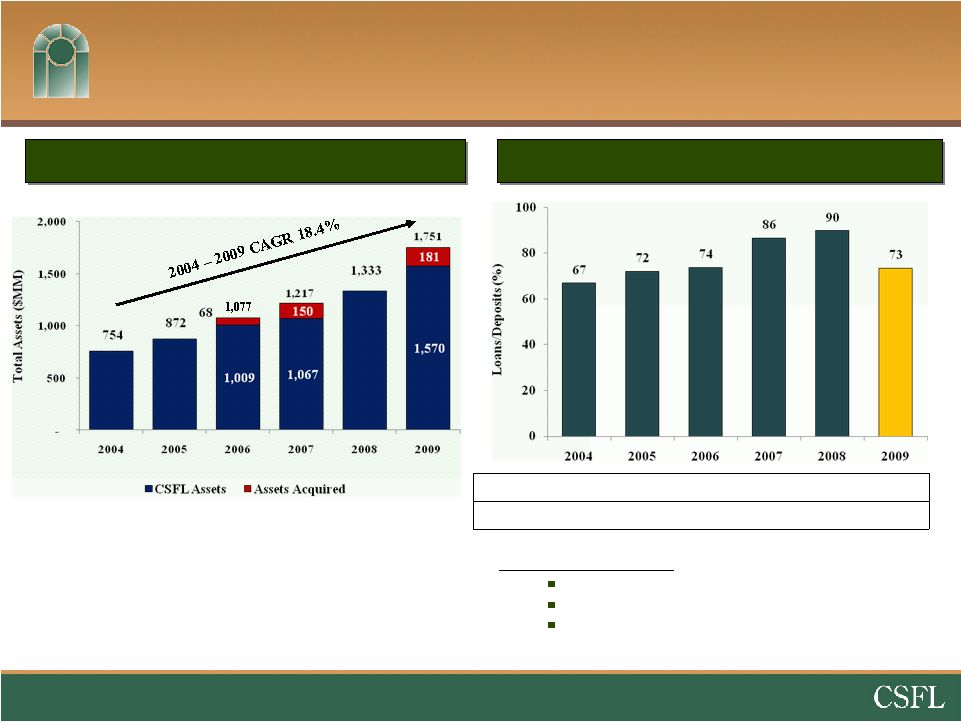 13 Organic Growth & Ample Liquidity Loans / Deposits ratio CenterState Banks, Inc. – 73% Southeastern Peers Average – 92% Florida Peers Average – 93% Loans $441 $517 $658 $841 $892 $959 Deposits 660 717 893 973 994 1,305 Source: SNL Financial and Company filings, data as of most recent quarter available. Southeastern peers include ABCB, BTFG, GRNB, PNFP, RNST, SCBT, UBSH and UCBI. Florida peers include BBX, BOFL, BCBF, CCBG, CBKS, FCFL, FUBC, GFLB, SBCF,
SAMB and TIBB. Total Asset Growth Loans / Deposits (%) |
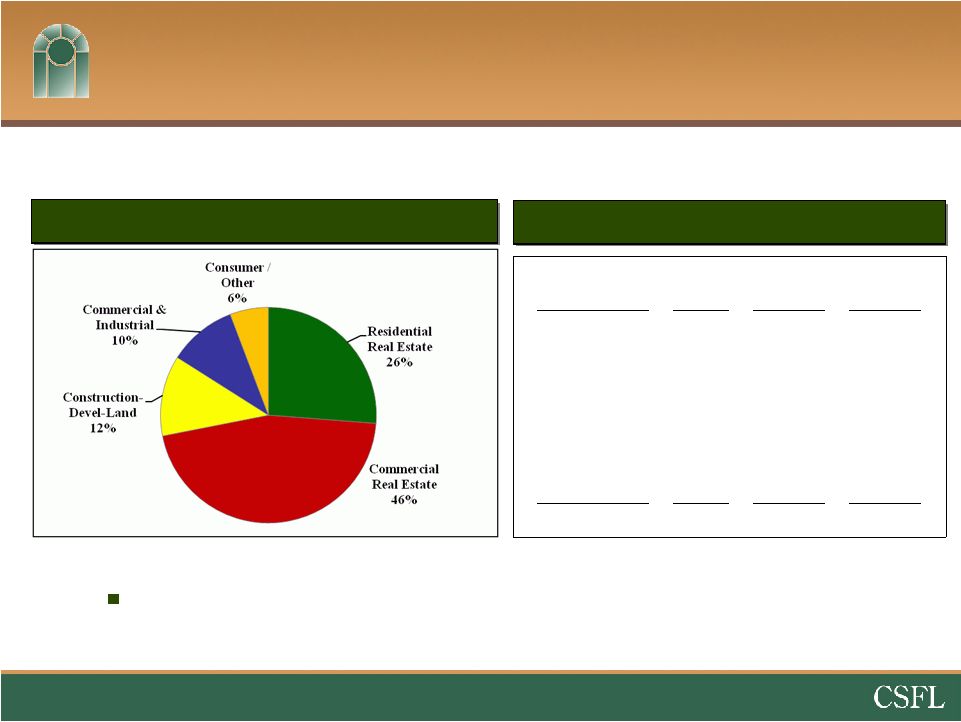 Loan Portfolio Construction, Development, & land represents only 12% of the total
portfolio 14 Loan Type No. of Loans 12/31/09 Balance Avg Loan Balance Residential Real Estate 2,605 $252MM $97,000 Commercial Real Estate 1,095 438MM 400,000 Construction, A&D, & Land 574 116MM 202,000 Commercial & Industrial 1,030 98MM 95,000 Consumer /Other 2,284 55MM 24,000 Total 7,588 $959MM $126,000 Total Loans by Type (%) Total Loans Detail |
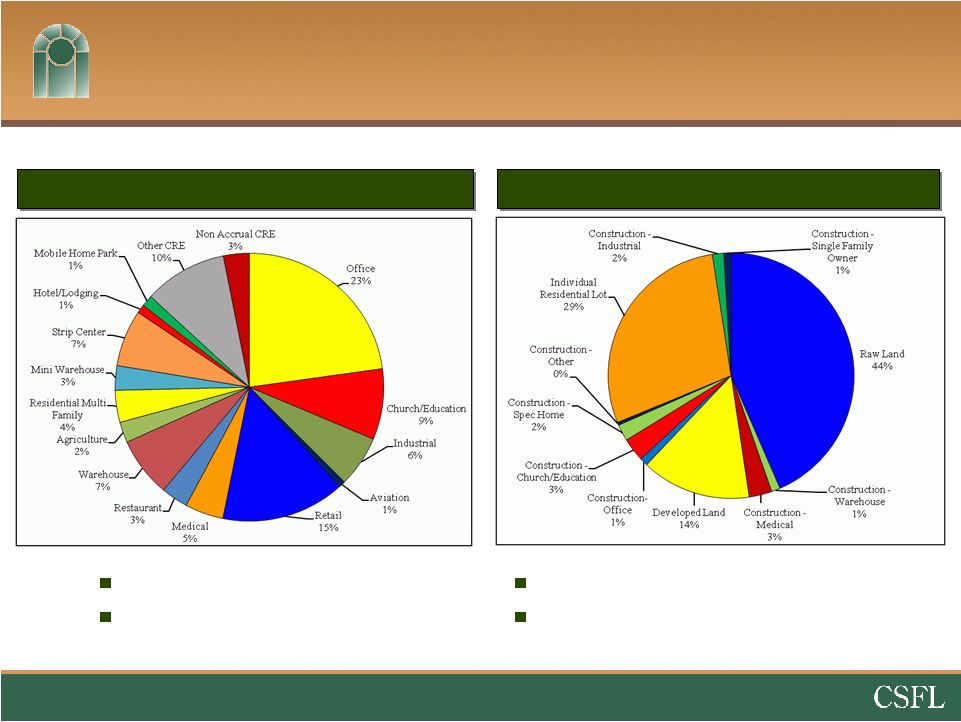 Commercial Real Estate & Construction Loans $438 million 56% owner-occupied $116 million Approximately 12% of total loans * approx. 66% commercial and 34% residential 15 Data as of 12/31/09 Commercial Real Estate by Type (%) Constr/Dev/Land Loans by Type (%) |
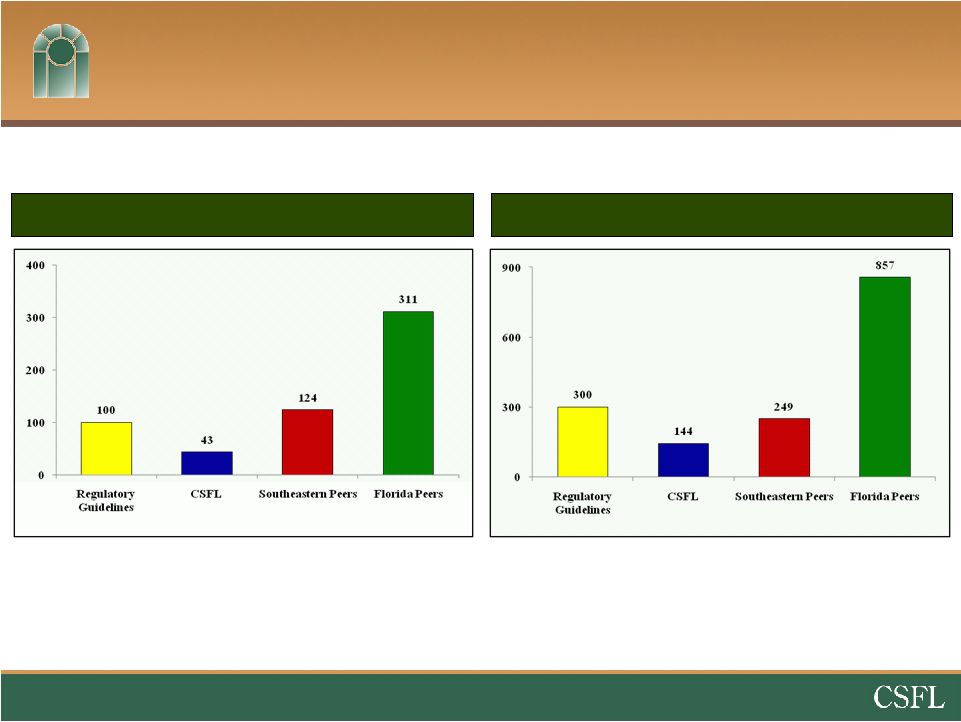 CRE Concentrations 16 Source: SNL Financial and Company filings, data as of most recent quarter
available. Southeastern peers include ABCB, BTFG, GRNB, PNFP,
RNST, SCBT, UBSH and UCBI. Florida peers include BBX, BOFL, BCBF,
CCBG, CBKS, FCFL, FUBC, GFLB, SBCF, SAMB and TIBB. C&D
Concentration – Category A (%) CRE Concentration – Category B (%) |
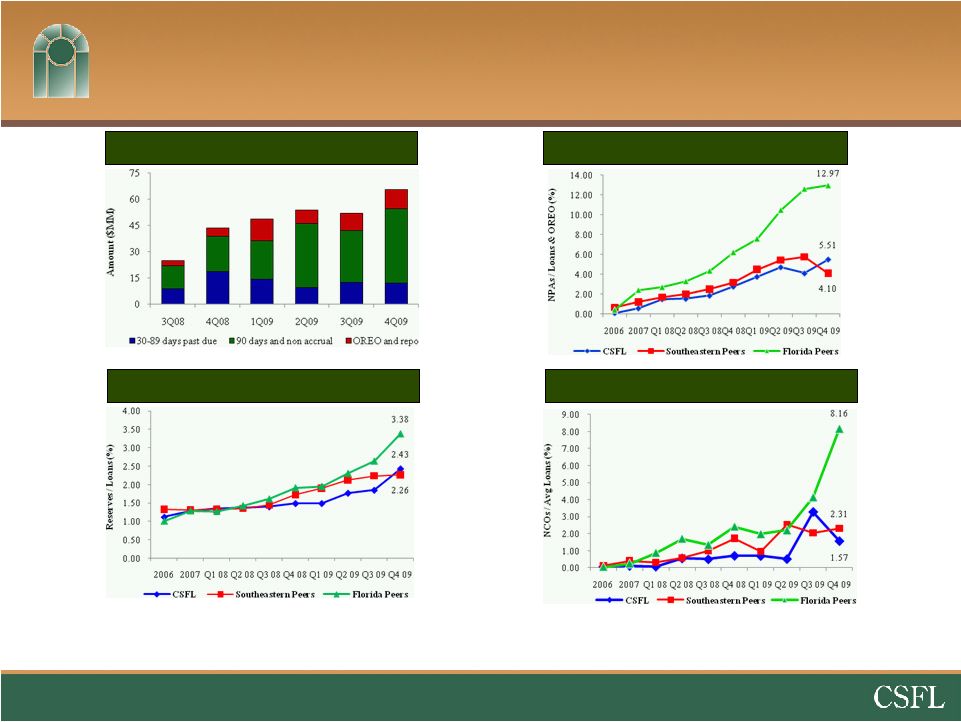 Credit Quality Trends NPAs / Loans & OREO (%) Net Charge-Offs / Avg. Loans (%) Source: SNL Financial and Company filings. Nonperforming assets include 90 days or more past due. Southeastern peers include ABCB, BTFG, GRNB, PNFP, RNST, SCBT, UBSH and
UCBI. Florida peers include BBX, BOFL, BCBF, CCBG, CBKS, FCFL,
FUBC, GFLB, SBCF, SAMB and TIBB. Problem Loan Trends ($MM)
Reserves / Loans (%) • ALLL / NPL ratio of 55% at 12/31/09 versus 29% for Florida Peers 17 |
 Nonperforming Loans & Other Real Estate Nonperforming Loans Other Real Estate Owned $42,341,000 4.42% of Gross Loans $10,196,000 Residential Real Estate $9,728K (65 loans) Commercial Real Estate $21,217K (43 loans) Construction, A&D, & Land $10,735K (42 loans) Commercial $424K (13 loans) Consumer / Other $237K (15 loans) 18 Commercial Buildings (10) $3,283K Commercial Lots (1) $138K Mobile Homes w/ Land (7) $276K Vacant Land $1,693K Mixed Properties $225K Single Family Homes (21) $2,654K Residential Lots (58) $1,927K |
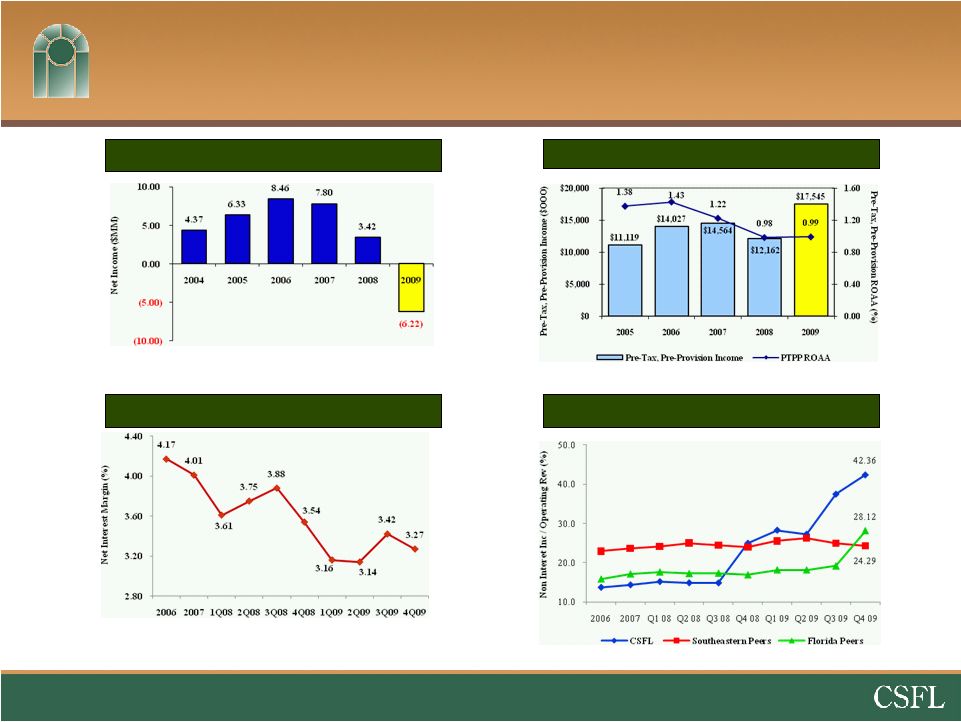 Profitability Pre- Tax, Pre-Provision Income & ROAA (%) Non Interest Inc / Op. Revenue (%) Net Income ($MM) Net Interest Margin (%) 19 Source: SNL Financial and Company filings. Southeastern peers include ABCB, BTFG, GRNB, PNFP, RNST, SCBT, UBSH and UCBI. Florida peers include BBX, BOFL, BCBF, CCBG, CBKS, FCFL, FUBC, GFLB, SBCF,
SAMB and TIBB. |
 Summary Energetic management team that is taking advantage of opportunities Home field advantage in attractive markets Excess capital to deploy on FDIC assisted deals Unprecedented opportunities to add shareholder value 20 |