Attached files
| file | filename |
|---|---|
| 8-K - FORM 8-K - HD SUPPLY, INC. | d8k.htm |
 Lenders
Presentation in connection with Amendment to Senior Secured Credit Facility and Senior Asset Based Revolving Facility Presentation on February 23, 2010 Exhibit 99.1 |
 2
Disclaimer This presentation includes forward-looking information and projections. Forward-looking statements and
projections are subject to known and unknown risks and uncertainties, many of which may be beyond
our control. We caution you that the forward-looking information presented in this
presentation is not a guarantee of future performance and that our actual results of operations,
financial condition and liquidity, and the development of the industries in which we operate may differ materially from those made in or suggested by the forward-looking information contained in this presentation.
A number of important factors could cause actual results to differ materially from those
contained in or implied by the forward-looking statements, including those factors discussed
in our registration statement on Form S-4/A, filed July 27, 2009, and subsequent filings with the Securities and Exchange Commission. Any forward-looking information presented herein is made
only as of the date of this presentation, and we do not undertake any obligation to update or
revise any forward-looking information to reflect changes in assumptions, the occurrence of
unanticipated events, changes in future operating results over time or otherwise. Comparisons of
results for current and any prior periods are not intended to express any future trends or indications of future performance, unless expressed as such, and should only be viewed as historical data. In addition to disclosing financial results that are determined in accordance with U.S. generally adjusted
accounting principles (“GAAP”), the Company also disclosed in this presentation certain
non-GAAP financial information including, Cash Flow, Adjusted EBITDA, Net Debt and Net
Capex. These financial measures are not recognized measures under GAAP, and are not intended to be and should not be considered in isolation or as a substitute for, or superior to, the
financial information prepared and presented in accordance with GAAP. |
 3
Investment Snapshot |
 4
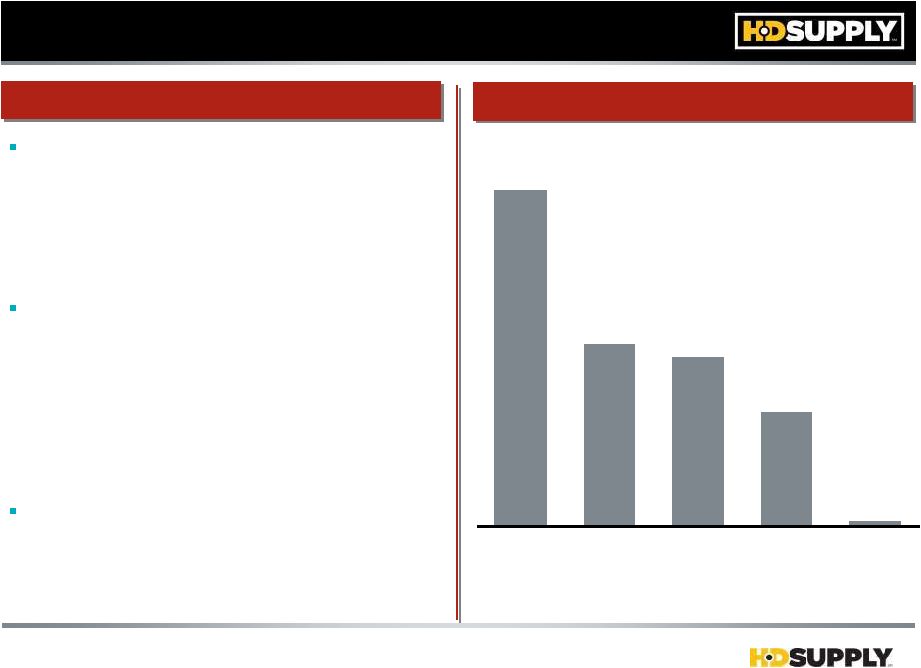
$346M HD Supply at a Glance HD Supply is One of the Largest Wholesale Distributors Serving the Highly Fragmented U.S. and Canadian Infrastructure & Energy, Maintenance, Repair & Improvement and Specialty Construction Sectors The Company Operates a Diverse Portfolio of 10 Discrete Distribution Businesses that Provide Approximately 1 Million SKUs to Over 450,000 Professional Customers Including Contractors, Government Entities, Maintenance Professionals, Home Builders and Industrial Businesses Operates Through Approximately 800 Locations Across 44 U.S. States and 9 Canadian Provinces Facilities Maintenance IPVF Utilities White Cap Waterworks $6B $12B $22B $22B $49B HDS Rank % Share Principal LOBs Cash Flow 4 $494M $1,006M $739M FY07 Net Sales Adj EBITDA $12.6B $11.7B $9.8B $7.7B 1 6 3% 7 3% 1 5% 1 8% 1 29% ($ in millions) $1,030M $747M $601M Fiscal Year End: 2006-1/28/07; 2007-2/3/08; 2008-2/1/09; 3Q09 ended
11/1/09 Residential 18% Non-Residential 28% MRO 22% Net Sales by End Customer (YTD’09 Estimate) Infrastructure and Other 32% Company Overview End Markets Financial Summary 3Q09LTM 3 FY06PF 2 FY08 3 1. See appendix for reconciliation to GAAP Net Income 2. Pro Forma for two months of Hughes results prior to acquisition by HD Supply in 2006; Revenue: $1.3B and
EBITDA: $0.1B 3. Adj EBTDA includes previously disclosed 4Q08 charge of $33M related to increase in Accounts Receivable
valuation allowance. 4. Pre-Tax, Unlevered; See appendix for reconciliation to GAAP Operating Cash Flow 5. Management Estimates 6. Facilities Maintenance is the largest distributor to multifamily properties 1 Addressable Opportunities 5 |
 5
Executing Through a Challenging Environment 2006 2007 2008 2009E SF (YOY%) Non Res (YOY%) (29.7%) 9.9% (40.5%) 1.6% (29.0%) (30.3%) 2006 2007 2008 2009E 6.1% 4.8% 3.3% $217B $238B $243B $169B 1. Seasonally Adjusted Annual Rate; Economy.com (Nov ’09) 2. 3Q’09 Dodge (Total US, non-residential), BLS.gov, BEA.gov 3. Pro Forma for two months of Hughes results prior to acquisition by HD Supply in 2006; GM=$0.3B & SG&A=$0.2B 4. Split by Management Estimates 1,474K 1,036K 616K 437K SG&A% Cash Flow 6 (Pre-Tax, Unlevered) ($ in millions) GM% 4.6% 4.6% 5.8% 9.3% FY07 FY08 3Q09 YTD 18.2% 20.4% 20.9% 21.4% 5 9.0% 9.2% 10.0% 10.4% 10.1% 10.8% 9.1% 12.3% Fixed SG&A 4 $1,006M FY07 FY08 3Q09 YTD $494M $398M -2.2% FY07 FY08 3Q09 YTD 26.6% 26.7% 27.0% 27.1% 5 Fiscal Year End: 2006-1/28/07; 2007-2/3/08; 2008-2/1/09; 3Q09 ended
11/1/09 5. GM% and SGA% presented on Adjusted EBITDA basis. 3Q09YTD excludes restructuring of $9M (in GM%) and stock comp and management fees of $13M and $4M resp. (in SGA%) 6. See appendix for reconciliation to GAAP Operating Cash Flow Variable SG&A 4 SF Starts 1 Non Res 2 Nominal GDP 2 Unemployment Rate 2 FY06PP 3 Key Drivers HD Supply’s Response FY06PF 3 |
 6
Portfolio of Assets With Leading Positions Exposure and Diverse Revenue Mix Leverage and Sourcing Opportunities Model Driving Significant Free Cash Flow and Strong Equity ...Poised for Accelerated Growth on Rebound Investment Thesis and Key Credit Highlights Premier Broad Segment Expansive Product Portfolio Significant Cost Resilient Business Generation Experienced, Motivated Management Team Sponsorship Attractive Cycle Timing |
 7
Company Overview |
  8
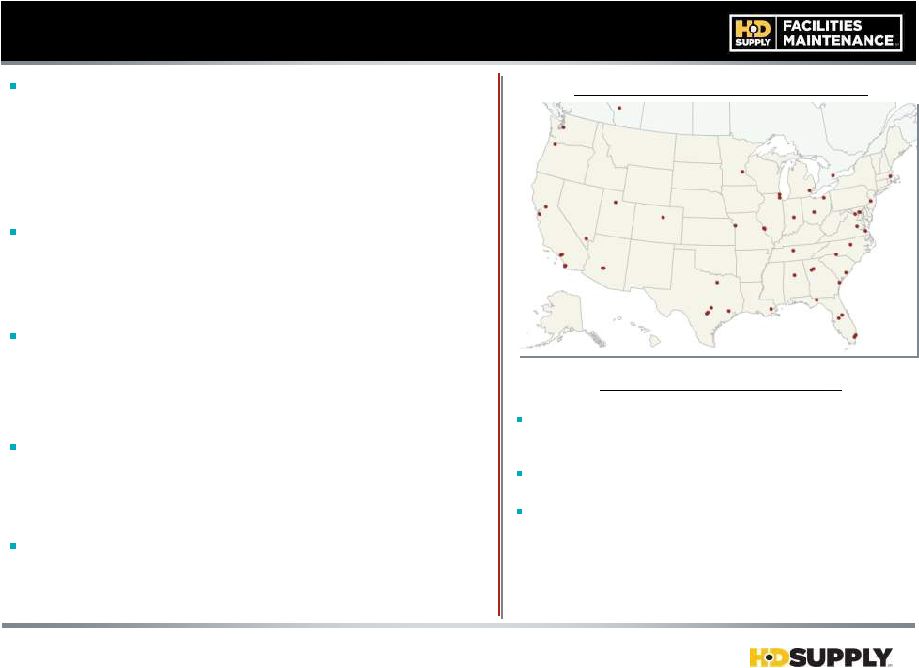
2 HD Supply Overview 1 Additional 62 locations throughout 9 Canadian provinces. 2 All Others consists of Plumbing/HVAC, Creative Touch Interiors, Electrical,
Repair & Remodel, Crown Bolt, and HD Supply Canada businesses. Waterworks 22% Facilities Maintenance 22% Utilities 13% White Cap 12% Industrial PVF 9% All Others 22% Business Description Geographic Footprint 1 3Q’09 YTD Net Sales by Segment HDS is One of the Largest Wholesale Distributors Serving the Highly Fragmented U.S. and Canadian Infrastructure & Energy,
Maintenance, Repair & Improvement and Specialty Construction Sectors The Company Operates a Diverse Portfolio of Distribution Businesses that Provide Approximately 1 Million SKUs to Over 450,000 Professional Customers, Including Contractors, Government Entities, Maintenance Professionals, Home Builders and Industrial Businesses - Operates Through Approximately 800 Locations Across 44 U.S. States and 9 Canadian Provinces The Company Believes that Diversity in Product Portfolio, Vendor Relationships and Customer Base Reduces the Company’s Exposure to Any Single Segment, Customer or Product Size, Scale and National Presence Drive Competitive Advantage in Large, Fragmented Markets |
 9
Broad Product Portfolio Plumbing CTI Electrical Facilities Maintenance Industrial PVF Repair & Remodel Crown Bolt HD Supply Canada Waterworks Utilities White Cap Principal Lines of Business Principal Lines of Business Other Lines of Business Other Lines of Business Pipes, Meters and Fire Hydrants Maintenance Repair Concrete Accessories Overhead Transmission Pipes, Flanges, Valves Fasteners, Chain Windows, Doors Switchgear Lighting Pipes, Fixtures HVAC Fixtures Tools and Fasteners Flooring Over one million products to meet the specific needs of HD Supply’s diverse
customers |
 10 1 Industry Fundamentals Highly Fragmented U.S. and Canadian Infrastructure & Energy, Maintenance, Repair &
Improvement and Specialty Construction Sectors Approximately $400B Opportunity National Presence and Offers a Greater Breadth of Products and Services than Many of its Competitors which are Specialized, Local or Regional Value Creation from Distributors with Large
Scale - Broad Product and Service Offering - Strong Customer Service - Global Sourcing Capability - Significant Product Purchasing Power - Broad Geographic Coverage - Sophisticated Information Technology Systems ($ in billions) 1 Management Estimates Facilities Maintenance IPVF Utilities White Cap Waterworks $6B $12B $22B $22B $49B Principal Lines of Business Large, Highly Fragmented Market Addressable Opportunity |
 11 Industry Fundamentals (cont’d) Expenditures
In: - Residential and Commercial Construction and Maintenance - Water,
Wastewater and Electrical Distribution Infrastructure - Facility Repair and Remodeling - Industrial Production Industry-Specific Trends…Supported by Government Stimulus - Maintenance and Improvement of Aging Water and Wastewater Infrastructure - Upgrade of Transportation Infrastructure (DOT) - Upgrade and Repair of Aging Power Transmission and Distribution Grid - Demand for Capital Equipment in the Oil & Gas and Petrochemical Markets Macroeconomic Growth - Population - Economic Production - Employment Source: Dodge 3Q09 Release (Total US, non-residential), Economy.com (Nov ’09) 0.4% 8.4% 11.3% 12.4% 23.1% Housing Starts Non- Res Construction Water Systems Infrastructure Renovation & Improvement Key Drivers Real End-Market Growth CAGRs: 2009 – 2014 |
      12
Overview: 5 Highly Attractive Principal
Businesses #1 Supplier of Water and Wastewater Transmission Products Dedicated Supplier with National Footprint Attractive Growth Driven by
Replacement of Aging Water & Wastewater Infrastructure Significant Free Cash Flow Generation #1 Specialty Construction Materials Supplier with National Footprint that Provides Breadth of Core Products to Professional Contractors Positioned for Growth Through Key Capabilities to Serve All Geographic and Trade Segments Flexible Service Model to Support Varying Customer Needs #1 Distributor of Electrical Transmission and Distribution Products, Power Plant Maintenance, Repair
and Operations Supplies and Smart-grid Technologies Significant Market Growth Due to Electric Transmission and Distribution Infrastructure Upgrade Requirements Market Trend Towards Outsourcing, Automation, Inventory Management and Expanded MRO Services for Large Investor-owned Utilities Leading Distributor of Stainless Steel and Special Alloy Pipes, Plates, Sheets, Flanges and Fittings, as
well as High Performance Valves, Actuation Services and High-density
Polyethylene Pipes and Fittings Driven by Capital Spending in Oil, Gas and Petrochemical Industries Purchasing and Inventory Management Expertise High Barriers to Entry Due to Significant Inventory Investment Needed to Service Customer Needs #1 MRO Distributor within Multi-Family Segment Highly Stable and Growing Facilities Maintenance Opportunity Significant Expansion Opportunities in Adjacent Segments (Hospitality, Healthcare, Commercial) 1 Percentage of Total HDS Net Sales for 3Q09YTD Waterworks (22% of Net Sales ) Facilities Maintenance (22% of Net Sales ) Utilities (13% of Net Sales ) White Cap (12% of Net Sales ) Industrial PVF (9% of Net Sales ) 1 1 1 1 1 |
     13
Business Strategy 1 HDS is the leader of the multifamily sub-segment of MRO, a $21 billion market.
Continue to Develop Five Principal Lines of Business, of which Four Have #1 Market Share - Growth Through Expansion of Product Offering and Service in Current and Adjacent Verticals - Leverage Strong National Presence and Invest Locally to Grow Participation - Greenfield Expansion Capture Sourcing Opportunities… Vendor Consolidation and Shift to Low-Cost Country Sources Expand Proprietary Brand Products Deploy Analytical Pricing and Inventory Optimization Tools to Drive More Sophisticated and Disciplined Product Pricing Improve Cost Position and Productivity…Branch Consolidations, Functional Excellence Drive Operational Efficiencies by Leveraging Scale Enhance ERP Systems to Improve Receivables and Inventory Management Utilize Business Scale and Vendor Consolidation Initiatives to Drive More Favorable Payment Terms Focus on Consistent Application of Investment Metrics Increase Local Scale Through Acquisition of Regional and Local Competitors Leverage Significant Integration Expertise to Capture Maximum Synergies Across Business Entities Identify and Evaluate Potential Tuck-in Acquisitions Targets to Further Grow and
Enhance Business Maintain and Build Upon Strong Leadership Positions in Principal Lines of Business Continue to Implement Margin Enhancement Initiatives Increase Operational Efficiency through Optimal Asset Management Supplement Organic Growth with an Active Potential Acquisition Pipeline 1 |
 14 Select Business Initiatives Growth into Product Adjacencies and Expanding Presence in Current Verticals - Pumps - Treatment Plants Geographic Expansion - New Branch Openings and Strategic Acquisitions Extending Core Stock Offering - Storm Drain Opportunity… ~$6B – $1,309M YTD Net Sales; $84M YTD Adj. EBITDA – 235 Locations in 41 U.S. States – Strong Demand Driven by Maintenance and Repair of Aging Water Infrastructure for Next Decade Products… 25,000+ SKUs – Pipes, Fittings, Valves, Meter and Fire Hydrants, etc… – Fragmented Supplier Base Customers… 49,000+ – 60% Private Development, 40% Public Works – Highly Diversified Base, Top 50 Make Up 12% of Sales – 80% of Customers Have Done Business in Each of the Last Three Years Associates… ~2,400 – 470 Outside Sales Reps… 13.2 Year Avg. Experience – Highly Compensated, Variable Structure Yields Low Turnover and Drives Best-in-Class Service Key Competitive Advantages – Strong Business Model with National Footprint of Dedicated Branches – Industry Leading Marketplace Experience – Comprehensive Information Technology and Supply Chain Integration Drives Efficient and Accurate Order Fulfillment with a 96% Fill Rate Waterworks’ Footprint Overview: Waterworks • Waterworks • Fire Protection 1 See appendix for reconciliation to Segment Operating Income 1 |
 15 Opportunity… ~$49B - $1,256M YTD Net Sales; $228M YTD Adj. EBITDA - Leading Multifamily MRO Provider - Spending Generally Non-Discretionary - Primary Focus in Multifamily, Hospitality, and Healthcare - Growth Opportunities in Commercial, Institutional, and Industrial Sectors Products… 45,000 SKUs - 16 Product Categories Including but not Limited to: Plumbing, HVAC, Appliance, Lighting, Hardware, Janitorial, Electrical, etc. - OEM and Private Label Offerings Customers… 220,000+ Active - Diversified Customer Base Ranging from Small Property Owners, Property Management Companies to Real Estate Investment Trusts and Large Hotel Chains - Top 100 Client Relationships Represent 46% of Sales Associates… ~3,500 - 7 Call Center Locations - 580+ Field and National Account Reps - Highly Tenured Sales Force with 6+ Yrs Avg. Experience Key Competitive Advantages - Highly Diversified by Customer and Segment - Hub and Spoke Model Featuring 38 Distribution Center Locations, Enabling Next Day Delivery to 95% of U.S. Facilities Maintenance Footprint Select Business Initiatives Specialization - Tailoring Customer Experience by Vertical Expanding Targeted Services Offering Extending Offering into Adjacencies and New Customer Opportunities Overview: Facilities Maintenance 1 See appendix for reconciliation to Segment Operating Income 1 |
 16 Opportunity… ~$12B – $692M YTD Net Sales; -$16M YTD Adj. EBITDA – 143 Locations in 28 U.S. States – 13 Completed Acquisitions Since 2004 Products… 26,000 SKUs – Hardware, Tools and Materials Sold to Professional Contractors Customers… ~60,000 – 4 Divisional Sales Categories: Concrete Accessories Division (CAD), Residential (RES), Industrial/Commercial (IC) and Grading and Waterproofing (GWP) – Highly Diversified Customer base, with Top 50 Customers Representing ~9% of Sales Associates… ~2,700 – 470+ Outside Sales, 300+ Inside Sales, and 300 Counter Sales Key Competitive Advantages – Open Warehouse Format – Will Call / Delivery / Direct ship – Broad Product Offering White Cap Footprint Select Business Initiatives Focused Execution at MSA Level - Targeted Trade Expansion - Merchandising - Logistics Expanding Gross Margin Overview: White Cap 1 See appendix for reconciliation to Segment Operating Income 1 |
 17 Utilities Footprint Opportunity… $22B - $768M YTD Net Sales; $41M YTD Adj. EBITDA - 68 Locations in 26 States and 4 Canadian Provinces - Outsourcing Trend of Investor Owned Utilities - Upgrade and Improvement in Aging T&D Infrastructure Products… 130,000 SKUs - Wire and Cable, Transformers, Switches - Outsourcing Solutions, Automated Meter Reading (AMR), Generation Customers… ~5,000 - Include Municipal, Cooperative, Provincial and Investor Owned Utilities - Diversified Base, Top 50 make up 53% of Sales Associates… ~800 - 116 Outside Sales Reps…12 Years Avg. Experience at HDS; 120 Inside Sales Reps - Strong Management Team with Combined 211 Years Experience Key Competitive Advantages - Largest Pure Play Utilities Wholesaler in the U.S. and Canada - Centralized Sourcing with Local Negotiations to Deliver Value Driven Solutions - Technology Leadership - National Scope with Local Service Select Business Initiatives Driving Growth in Key Segments - Automation: AMI, DR-DSM - Alliances: Single Source & Outsourcing - Project Services: Materials Management Pricing and Inventory Optimization Overview: Utilities 1 See appendix for reconciliation to Segment Operating Income 1 |
 18 Overview: Industrial PVF Industrial PVF’s Footprint Opportunity… ~$22B - $514M YTD Net Sales; $51M Adj. EBITDA - 40 Locations in 17 U.S. states, 1 Canadian Location - #1 Player in Niche Metals Market - Key Competitors Actively Consolidating Products… 63,000+ SKUs - Stainless Steel and Special Alloy Pipe, Flanges, Fittings, Plate and Sheet; Hi-performance Valves and Actuators; High Density Polyethylene Pipe, Flanges, Fittings and Fusion Services Customers… 9,000+ - Primary Customers: Industrial and Manufacturing Facilities, Including Oil and Gas, Chemical, Food and Beverage; Mechanical Contractors and OEMs Associates… ~700 - Approximately 90 Outside Sales Associates - Average Industry Experience of Managers is 28 years Key Competitive Advantages - Strong Purchasing Discipline Preserves Inventory Value Over the Long Term - Real-time Pricing Processes Capture the Maximum Margins Allowed by Marketplace - Highly Scalable Model with Variable Cost Structure Select Business Initiatives Extending Presence in Current Segments… Focusing on MRO Adding New Product Lines and Expansion of Current Assortment 1 See appendix for reconciliation to Segment Operating Income 1 |
 19 YTD 3Q09 Financials |
 20 Macro Overview (Since 2006) ($ in millions) GM% (Core Profitability Metric) Stable… Pricing Discipline and Cost Leadership Reduced Operational Headcount and “De-Layered” Overhead…Retained Customer Facing Personnel Aggressive Management of SG&A; Investing in Growth Initiatives Net Sales Trending in Line with Economic Declines Net Sales $12.6B $11.7B $9.8B $7.7B GM $3.3B $3.1B $2.6B $2.1B SGA $2.3B $2.4B $2.0B $1.7B Adj. EBITDA $1,030 $747 $601 $346 Adj. EBITDA % 8.3% 6.9% 6.6% 5.0% Working Capital (excl. Cash and cash equivalents) $1.9B $1.3B $1.3B Headcount 20K 17K 16K Facility Count 1,100 1,020 800 2006 2006 2007 2007 2008 2008 Consolidated Facilities… Maintained Geographic Footprint Volume-Driven Decline; Improved Inventory Aging and AR Profile $2.0B 23K 1,100 SF Housing Starts 5 1,036 615 437 1,473 Non-Resi Constr 6 $238B $243B $169B $217B YOY % -30% -41% -29% YOY % 10% 2% -30% 1. Pro Forma for two months of Hughes results prior to acquisition by HD Supply in 2006;
Revenue: $1.3B and EBITDA: $0.1B 2. See appendix for reconciliation to GAAP Net Income 3. 4Q08 includes previously disclosed charge of $33M related to increase in Accounts
Receivable valuation allowance. 4. orking Capital is defined as current assets minus current liabilities 5. Source: Economy.com Nov-09; Oct’09=FY09 Forecast 6. Source: McGrawHill/Dodge 3Q09 (Total US, non-residential); Oct’09=FY09
Forecast YOY % -7% -16% Fiscal Year End: 2006-1/28/07; 2007-2/3/08; 2008-2/1/09; Oct-09 ended
11/1/09 % of Sales 26.6% 26.7% 27.0% 26.8% % of Sales 18.2% 20.4% 20.9% 22.3% Pro Forma 1 2 4 3 Oct’09 LTM 3 W |
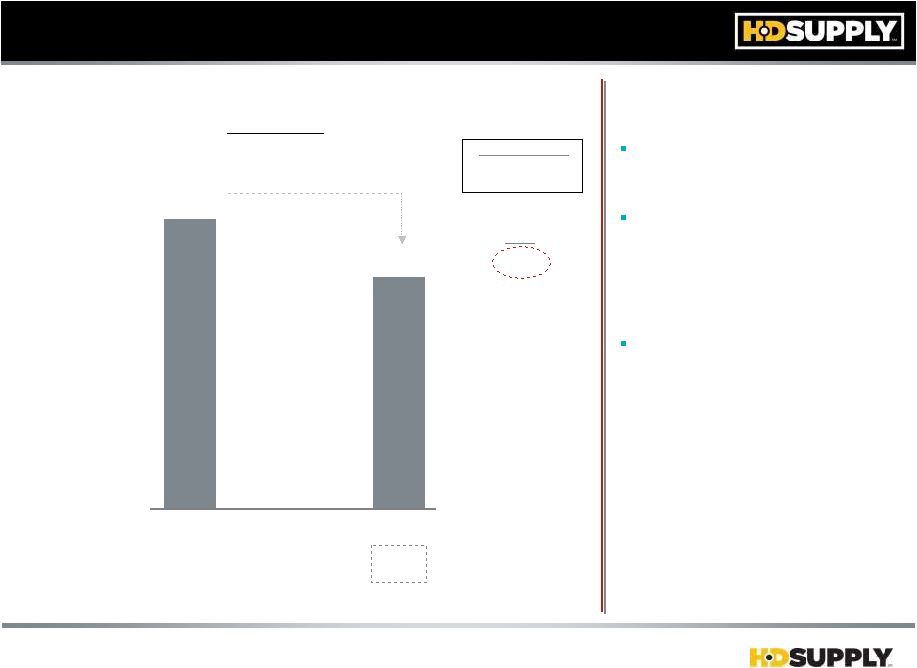
 21 Net Sales in Line with Economic Declines October YTD’09 Financial Results Net Sales GM% 27.3% 27.1% Adj. EBITDA $589 $335 Adj. EBITDA% 7.5% 5.8% SG&A % 19.9% 21.4% Headcount 18,573 15,780 Cash Flow (pre-tax,unlevered) $666 $399 Gross Working Capital $1,951 $1,436 Net Debt $5.6B $5.1B $5.8B $7.9B Oct-08 YTD Oct-09 YTD Operations Balance Sheet Average Daily Sales $30.3 $40.9 ($ in millions) YTD GM% Impacted by Commodities Excluding commodities, GM% Holding Despite Net Sales Decline EBITDA Predictability Improving Net Debt Reduction Approaching $1B Since Inception Aligning Cost Structure with Volume Decline; Maintaining Strategic Costs; Investing for Growth 1. GM% and SGA% presented on Adjusted EBITDA basis. Oct-09YTD excludes restructuring of $9M (in GM%) and stock comp and management fees of $13M and $4M resp. (in SGA%) 2. See appendix for reconciliation to GAAP measurements 3. Gross Working Capital = [Trade AR, gross of allowance for doubtful accounts,
vendor rebates and other receivables] + [Inventory, gross of inventory reserves
and unearned rebates & discounts] – Accounts Payable 4. Net Debt = Total Debt – Cash and Cash Equivalents (3Q08: Total Debt=$6.3B; Cash and Cash Equivalents=$0.7B) 1 1 3 4 2 2 |
   22
October YTD’09 Gross Margin ($ in millions) 27.3% 27.1% 27.2% 26.8% Oct'08 Oct’09 Oct’08 Oct’09 YTD LTM HDS GM% HDS GM% 1. Excludes the impact of restructuring charges related to inventory liquidation in
Oct-09YTD of $9M 2. Management estimates 3. Excludes the impact of restructuring charges related to inventory liquidation in 4Q08 of
$3M and YTD09 of $9M Excl Commodities 27.9% Excl Commodities 27.8% 1 3 Maintaining Price Discipline & Leveraging Sourcing Capabilities to Drive Margin Improvement Notwithstanding Declining Volumes… Large Investments in Pricing Technology /
Personnel Proprietary Brands, Imports, and Supplier Initiatives Driving
Cost Leadership Excluding the Impact of Commodities, LTM09 is +60bps above LTM08 2 2 |
  23
($313M) Reduced SG&A $313M Overall Drove Variable Cost Improvement (9.1% of Net Sales -20bps) – Operational Efficiencies/Consolidations – Technology Transforming Supply Chain Invested in Revenue and Strategic Initiatives (Fixed Cost 12.3% of Net Sales +170bps) – Retained 90% Commercial Personnel (Approx 5,000) – Maintained Presence in Key Markets – Customer, Product and Geographical Expansion October YTD’09 SG&A ($ in millions) % Net Sales VPY$ Variable 9.3% 9.1% Fixed 10.6% 12.3% Headcount 18,573 15,780 Oct-08 Oct-09 $1,562 19.9% $1,249 21.4% 1 SG&A excludes Stock Compensation and Management Fees - ’09:$13M & $4M resp.; ’08: $10M & $4M resp. YTD SG&A Memo: Oct’09 LTM SG&A $1,729 22.3% of Net Sales 1 |
 24 1 1 2 Adj. A/R DSO 50 $1,026 YE08 Oct-09 DOH 79 $1,186 YE08 Oct-09 Adj. Inventory DPO 52 $776 YE08 Oct-09 VYE $94M VPY $248M Cash Gap 78 $1,436 YE08 Oct-09 Gross WC VYE $90M VPY $459M VYE $155M VPY $305M A/P VPM $151M VPY $515M ($ in millions) October YTD’09 Gross Working Capital $1,116 $1,341 $870 $1,587 59 90 56 93 $700M Reduction in Working Capital (v ’07) – Senior Management Engagement – Common Metrics/Transparency – Routine Pulsing – Cash Based Compensation Receivable Write-Offs at 30bps as Percent of Revenue – Technology Investments – Disciplined Credit Approach (Liens) YE07 Gross WC $2.1B3 Cash Gap 79 days Fiscal Year End: 2008-2/1/09 1. See Appendix for reconciliation to GAAP 2. Gross Working Capital = [Trade AR, gross of allowance for doubtful accounts, vendor rebates and
other receivables] + [Inventory, gross of inventory reserves and unearned rebates & discounts] – Accounts Payable 3. YE07 Gross Working Capital of $2.1B = $1.4B (A/R) + $1.6B (Inv) - $0.9B (A/P)
|
 25 1 2 3 October YTD’09 Cash Flow Unlevered, Pre-Tax CF ($ in millions) Adj. EBITDA and Working Capital Driving Cash Flow Capex Dramatically Reduced (20% YTD) YTD Cash Flow 119% of Adj. EBITDA NOL’s Treated as Non Operational Comments YTD 1. See appendix for reconciliation to GAAP measurements 2. Net Capex = Capital Expenditures – Proceeds on Sales of Property and Equipment 3. A/P presented net of Accrued Liabilities Memo: 3Q09YTD VPY$ LTM Adj. EBITDA $335 ($254) $346 Net Capex (35) 2 (57) (Incr)/Decr in A/R 91 156 458 (Incr)/Decr in Inv 138 69 281 Incr/(Decr) in A/P (97) (189) (251) Sub-total 132 36 488 Chg. in Other Assets/Liabilities (42) 36 (47) Purchase/Sale of business, net 9 (87) 9 Pre-tax, Unlevered Cash Flow 1 $399 ($267) $739 |
 26 October Debt & Liquidity Summary Gross Debt Rollforward Available Liquidity Availability Drawn Excess Availability $1,318 (846) $472 YE08 ABL Rollforward Oct-09 $1,183 (697) $487 Drawn Cash Balances Net Debt 771 727 472 487 $1.2B $1.2B YE08 Oct’09 Cash Available ABL ($ in millions) $6.1B $5.8B 0.3 0.3 1.5 1.4 2.5 2.5 1.0 1.0 0.8 0.6 YE08 Oct’09 ABL Rev. Term Sr. Unsec. PIK $771 $727 $5.3B $5.1B Availability Excess Availability |
 27 Appendix |
 28 Description of EBITDA & Adjusted EBITDA EBITDA, a measure used by management to evaluate operating performance, is defined as net income (loss) less
income (loss) from discontinued operations, net of tax, plus (i) interest expense and interest
income, net, (ii) provision (benefit) for income taxes, and (iii) depreciation and amortization.
EBITDA is not a recognized term under GAAP and does not purport to be an alternative to net income
as a measure of operating performance or to cash flows from operating activities as a measure of
liquidity. Additionally, EBITDA is not intended to be a measure of free cash flow available for management’s discretionary use, as it does not consider certain cash requirements such as interest payments, tax payments
and other debt service requirements. We believe EBITDA is helpful in highlighting trends because
EBITDA excludes the results of decisions that are outside the control of operating management and
that can differ significantly from company to company depending on long-term strategic
decisions regarding capital structure, the tax jurisdictions in which companies operate, age and
book depreciation of facilities and capital investments. In addition, EBITDA provides more comparability between the historical results of HD Supply prior to the acquisition by HDS Holding Corporation of all the
outstanding capital stock of each of HD Supply, Inc. and CND Holdings, Inc. as well as certain
intellectual property from the Home Depot, Inc. (the “Acquisition”) and results that
reflect the new capital structure after the Acquisition. We further believe that EBITDA is frequently used by securities analysts, investors and other interested parties in their evaluation of
companies, many of which present an EBITDA measure when reporting their results. We compensate
for the limitations of using non-GAAP financial measures by using them to supplement GAAP
results to provide a more complete understanding of the factors and trends affecting the business
than GAAP results alone. Because not all companies use identical calculations, our presentation
of EBITDA may not be comparable to other similarly titled measures of other companies. |
 29 Description of EBITDA & Adjusted EBITDA cont’d In addition, we present Adjusted EBITDA because it is based on “Consolidated EBITDA,” a measure which is used in calculating financial ratios in several material debt covenants in our senior secured credit facility and our
senior asset-based revolving credit facility (together, the “Senior
Credit Facilities”). Borrowings under the Senior Credit Facilities are a key source of liquidity and our ability to borrow under the Senior Credit Facilities depends upon, among other things, our compliance with such
financial ratio covenants. Adjusted EBITDA is defined as EBITDA adjusted to
exclude non-cash items, unusual items and certain other adjustments to Consolidated Net Income permitted in calculating Consolidated EBITDA under the Senior Credit Facilities. We
believe that inclusion of supplementary adjustments to EBITDA applied in
presenting Adjusted EBITDA is appropriate to provide additional information to investors about how the covenants in those agreements operate and about certain non-cash items, unusual items that we do
not expect to continue at the same level and other items. The Senior Credit Facilities permit us to make certain adjustments to Consolidated Net Income in calculating Consolidated EBITDA, such as projected net cost savings, which are not reflected in the Adjusted EBITDA data
presented in this presentation. We may in the future reflect such permitted adjustments in our calculations of Adjusted EBITDA. • EBITDA and Adjusted EBITDA have limitations as analytical tools and should not be
considered in isolation or as substitutes for analyzing our results as
reported under GAAP. Some of these limitations are: • EBITDA and Adjusted EBITDA do not reflect changes in, or cash requirements for, our
working capital needs; • EBITDA and Adjusted EBITDA do not reflect our interest expense, or the requirements
necessary to service interest or principal payments on our debt; • EBITDA and Adjusted EBITDA do not reflect our income tax expenses or the cash requirements
to pay our taxes; • EBITDA and Adjusted EBITDA do not reflect historical cash expenditures or future
requirements for capital expenditures or contractual commitments; and
• although depreciation and amortization charges are non-cash charges, the assets being
depreciated and amortized will often have to be replaced in the future, and
EBITDA and Adjusted EBITDA do not reflect any cash requirements for such replacements. |
 30 Reconciliation to GAAP Financials LOB Adj. EBITDA to Op. Income LOB Adj. EBITDA to Op. Income 2006 to 2009YTD GAAP Reconciliation 2006 to 2009YTD GAAP Reconciliation Fiscal Year End: 2006-1/28/07; 2007-2/3/08; 2008-2/1/09 2006 2007 3QYTD FY 3QYTD LTM Adjusted EBITDA 964 747 589 601 335 346 Reconciling Items: Depreciation and Amortization (191) (291) (312) (411) (295) (394) Goodwill Impairment - - (48) (1,053) (224) (1,229) Restructuring - - (36) (23) (59) Stock Compenstion (17) (34) (10) (14) (13) (17) Management Fee - (2) (4) (6) (4) (5) GAAP Operating Income 756 420 215 (919) (224) (1,358) Interest Expense (321) (510) (479) (642) (449) (611) Other Income - - (2) (11) 205 196 GAAP Pre-Tax Income 435 (90) (267) (1,572) (468) (1,773) Tax Benefit (169) 25 79 318 131 370 GAAP Net Income (Cont Ops) 266 (65) (188) (1,254) (337) (1,403) * 2008 as revised 2007 3QYTD FY 3QYTD LTM Cash Flow (pre-tax, unlevered) 494 666 1,006 399 739 Reconciling Items: Interest Paid (286) (371) (397) (346) (372) Purchase/Sale of business, net - (96) (96) (9) (9) Proceeds/ from sale of PPE (62) (16) (18) (6) (8) Taxes (65) (7) (9) 127 125 Cash Flow Support from THD 431 - - - - Capital Expenditures 251 53 77 41 65 Equity Contribution - (9) (10) - (1) Other 9 (11) 5 (1) 15 GAAP Operating Cash Flow 772 209 548 205 544 2009 2008* 2008 2009 AR & Inventory Reconciliation AR & Inventory Reconciliation ($ in millions) 3Q09 YTD WW FM WC UTL IPVF Adjusted EBITDA 84 228 (16) 41 51 Reconciling Items: Depreciation and Amort. (75) (71) (34) (15) (12) Segment Operating Income* 8 157 (51) 26 39 *Segment Operating Income excludes Goodwill Impairment and Restructuring Charges
2007 2008 2008 2009 FY 3QYTD FY 3QYTD Adjusted AR 1,440 1,485 1,116 1,026 Reconciling Items: Vendor Rebates 110 80 67 43 Allowance For Doubtful Accounts (72) (62) (95) (76) Other Recievables 121 30 34 8 GAAP Receivables 1,599 1,532 1,123 1,001 2007 2008 2008 2009 FY 3QYTD FY 3QYTD Adjusted Inventory 1,575 1,491 1,341 1,186 Reconciling Items: Unearned Rebates & Discounts (18) (20) (34) (32) Inventory Reserves (44) (96) (89) (88) GAAP Inventory 1,513 1,375 1,218 1,066 |