Attached files
| file | filename |
|---|---|
| 8-K - FORM 8-K - EAGLE MATERIALS INC | d8k.htm |
 Wells Fargo Securities Housing and Building Products Conference February 2010 Low Cost Producer Exhibit 99.1 |
 Forward Looking Statement This presentation contains forward-looking statements within the meaning of Section
27A of the Securities Act of 1933, Section 21E of the Securities Exchange
Act of 1934 and the Private Securities Litigation Reform Act of 1995. Forward-looking statements may be identified by the context of the statement and generally arise when the Company is discussing its beliefs, estimates or expectations. These statements are not historical facts or guarantees of future performance but instead represent only the Company’s beliefs
at the time the statements were made regarding future events which are
subject to significant risks, uncertainties and other factors many of which are outside the Company’s control. Actual results and outcomes may differ materially from what is expressed or forecast in such forward-looking
statements. The principal risks and uncertainties that may affect the Company’s actual performance include the following: the cyclical and seasonal nature of the
Company’s business; public infrastructure expenditures; adverse weather
conditions; restrictive covenants contained in our debt agreements; availability of raw materials; changes in energy costs including, without limitation, increases in natural gas and oil; changes in the cost and availability of
transportation; unexpected operational difficulties, equipment failures and
catastrophic events; inability to timely execute announced capacity expansions; governmental regulation and changes in governmental and public policy (including climate change regulation); changes in economic conditions specific to
any one or more of the Company’s markets; competition; announced
increases in capacity in the gypsum wallboard and cement industries; changes in demand for residential housing construction or commercial construction; environmental liabilities; general economic conditions (including the
possibility of the deepening of the current economic recession); and interest rates. For example, increases in interest rates, decreases in demand for
construction materials or increases in the cost of energy (including natural
gas and oil) could affect the revenues and operating earnings of our operations. In addition, changes in national and regional economic conditions and levels of infrastructure and construction spending could also adversely
affect the Company’s results of operations. These and other factors are described in the Annual Report on Form 10-K for the Company for the
fiscal year ended March 31, 2009 and in its quarterly report on Form 10-Q for the fiscal quarter ended December 31, 2009. These reports are filed with the Securities and Exchange Commission and may be obtained free
of charge through the website maintained by the SEC at www.sec.gov. All
forward-looking statements made in this presentation are made as of the date hereof, and the risk that actual results will differ materially from expectations
expressed in this presentation will increase with the passage of time. The Company undertakes no duty to update any forward-looking statement to reflect future
events or changes in the Company’s expectations. 2
|
 Agenda • Who We Are • Industry Outlook • Eagle Materials Outlook 3 |
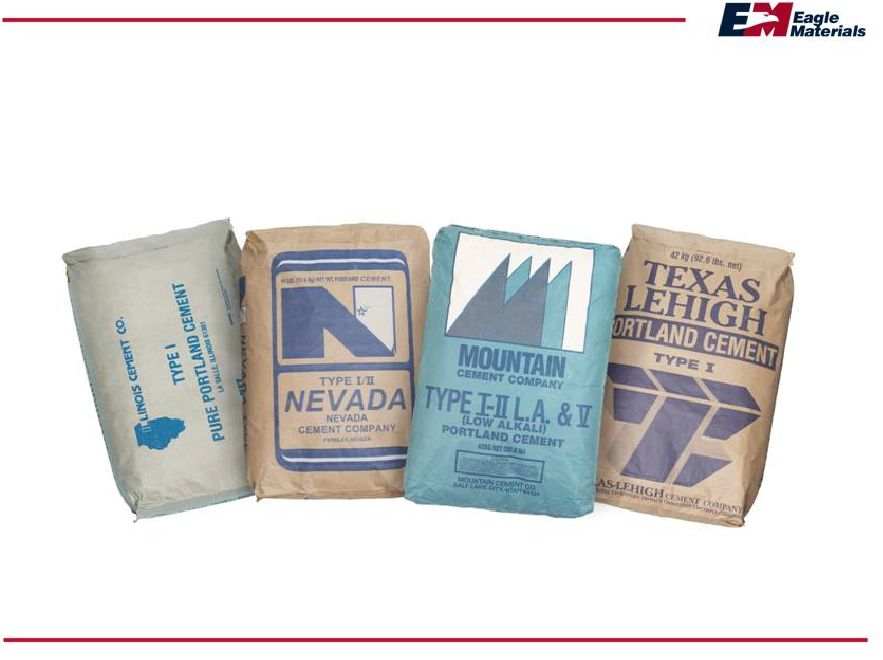
 Eagle Materials 4 • Major North American cement producer • Four geographically diversified plants, supported by 10 cement terminals • Lowest cost producer -- profitable through the cycle • Complimenting the cement business are concrete and aggregates operations, which enjoy strong competitive positions in TX and CA • Vast aggregates reserves (over 1 billion tons) in Northern CA • National gypsum wallboard producer • Four manufacturing plants • Lowest cost producer • Paper needs met through owned lightweight paperboard mill • Distribution yards enable service coast-to-coast |
 Ten
Hallmarks of How We Operate • Decentralized, profit center model with low overhead -- no frills • Intense focus on operating metrics • Provide the most demanded commodity products with consistent high quality • Focus of innovation on operating efficiency improvement – to maintain and extend low cost producer positions and to add incremental capacity • Assets are maintained in “like new” condition • Projects on-time and on-budget due to rigorous engineering discipline • Customers find us easy to do business with, a preferred supplier • Close attention to safety and environmental/community stewardship • Principles-based management culture, low turnover, deep experience • Financial transparency, internally and externally 5 |
 Criteria for Major New Investment • Strengthens core business position in gypsum wallboard, cement or aggregates • Improves low-cost producer positions • Improves regional market diversification • Provides superior return on investment • Preserves balance sheet health and financial flexibility Track record of returning cash to shareholders when investment criteria is not well-met 6 |
 Multiple Sources of Cost Advantage Raw Materials and Inputs Manufacturing and Overhead Raw Materials Cost Paper Weight Production Waste Natural Gas Usage G&A Construction Cost Eagle Cost Advantages Operating Execution Operational Innovation Technology/Engineering Scarcity Leveraging EXP Industry EXP EXP EXP EXP EXP EXP Industry Industry Industry Industry Industry Industry 7 Delivered Cost to Market |
 Low
Cost Commodity Producer Advantages 8 |
 Agenda 9 • Who We Are • Industry Outlook • Cement • Gypsum Wallboard • Eagle Materials Outlook |
 10
Cement |
 US
Cement Industry Outlook • Demand has declined approximately 26% year-over-year in calendar 2009 • Several plant closures and delays of expansion projects have been announced, however several new plants came on-line last year, representing nearly 11 million short tons of new clinker capacity • Imports of foreign cement have been dramatically reduced • Demand is heavily driven by public infrastructure investment and by non-residential construction • The outlook for 2010 and 2011 is for consumption to increase 5% and 16% respectively, driven in large measure by expected stimulus investment • Stimulus has yet to materialize in a meaningful way; state bureaucratic processes have slowed realization of stimulus benefits • State budget problems pose on-going risk to stimulus benefits 11 Source: Portland Cement Association for the outlook |
 US
Cement Consumption Outlook Million Metric Tons 12 US Capacity Source: Portland Cement Association 2010 Winter Forecast and Eagle Materials analysis Imports |
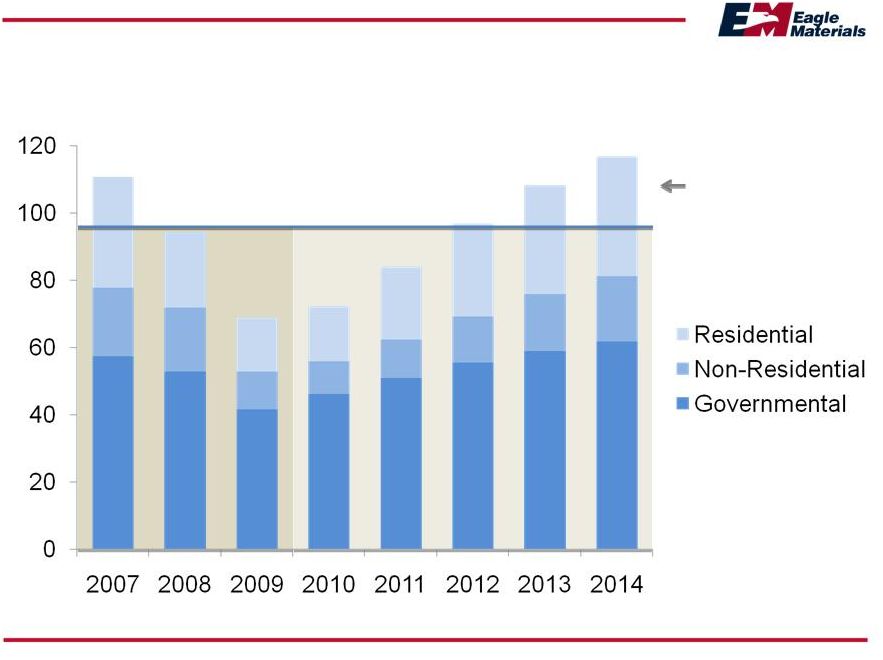
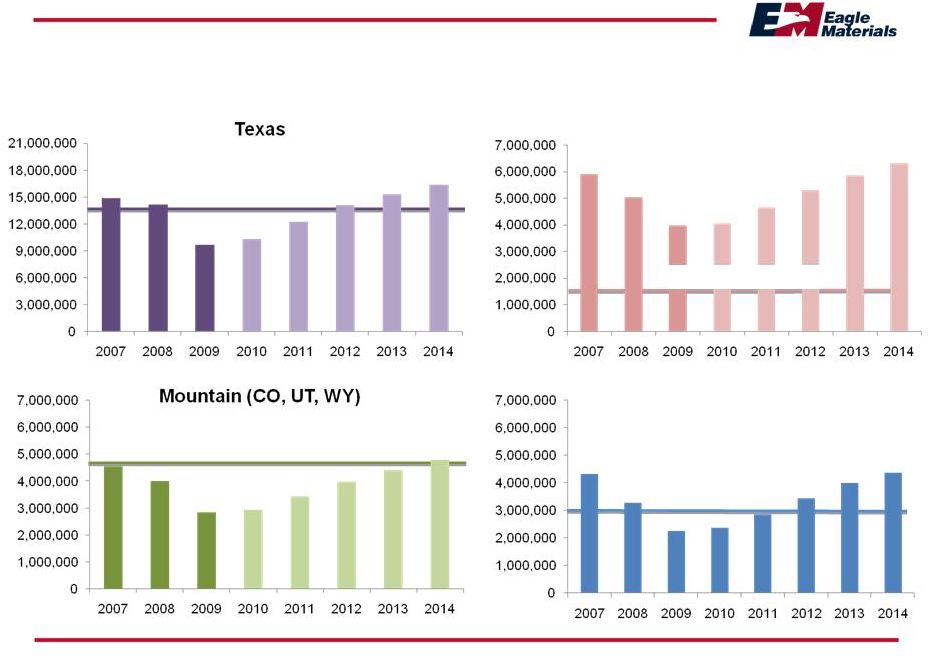 Regional Cement Consumption Forecasts Metric Tons 13 Source: Portland Cement Association State Forecast Reports, Winter 2010, Eagle Materials
Analysis Core Regional Capacity Core Regional Capacity Illinois (IL and WI) Core Regional Capacity Nevada (W. NV and N. CA) Core Regional Capacity |
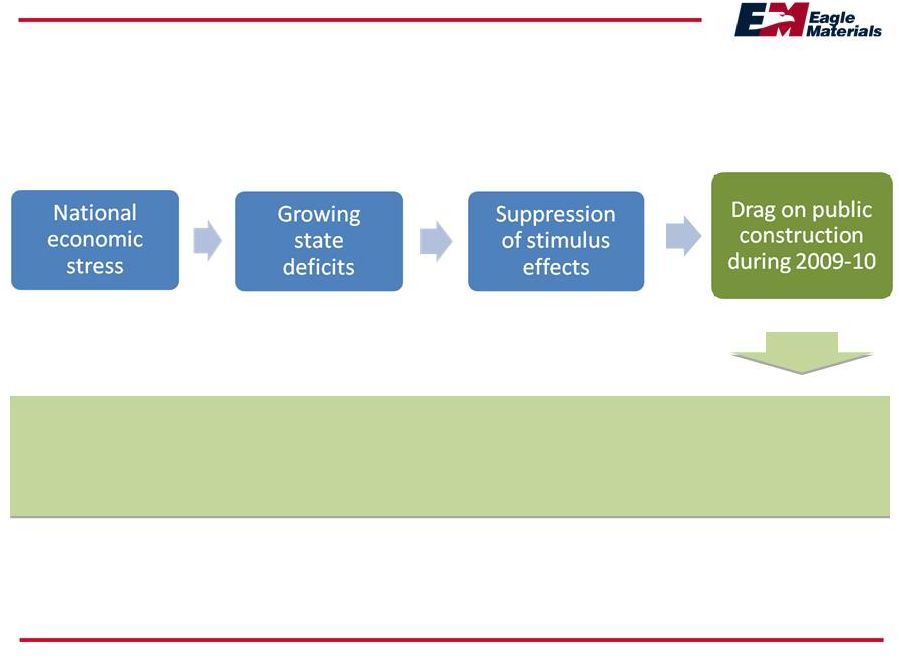 Infrastructure Update and Outlook Silver lining: Sustained gains in cement consumption in 2011-2014 as projects are pushed forward 14 |
 15
Gypsum Wallboard |
 Gypsum Wallboard Industry Update Demand • Demand is half of what it was at the peak • We anticipate the start of a cyclic recovery next year, with 2010 being relatively flat Supply • Capacity has not dropped materially from the 2005 peak What’s Needed for Higher Industry Profitability • Demand needs to increase, high-cost capacity needs to shut down or some combination 16 |
 US
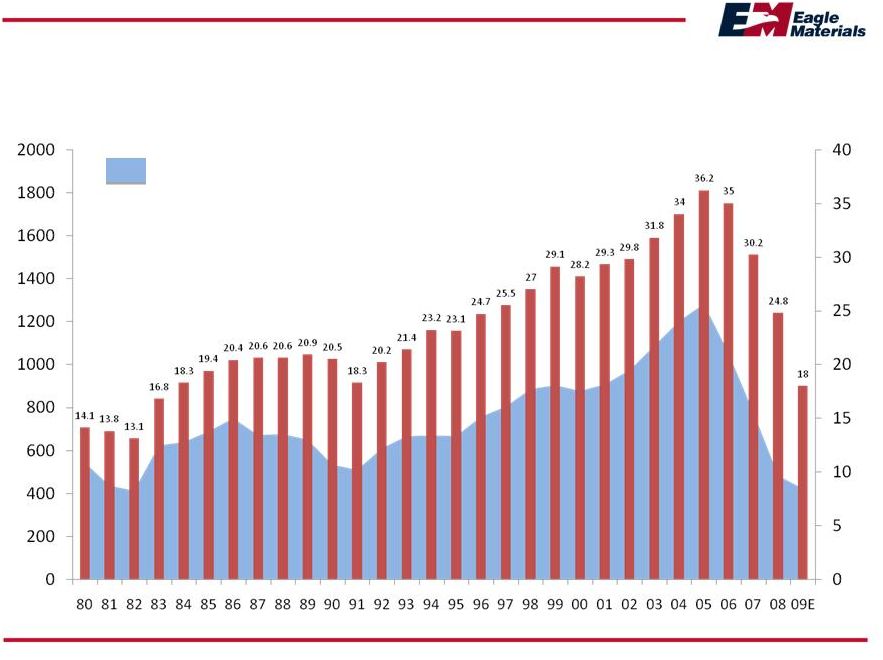
Demand for Gypsum Wallboard Closely Linked with Housing 17 New Home Sales (000) BSF Source: US Census Bureau, company analysis |
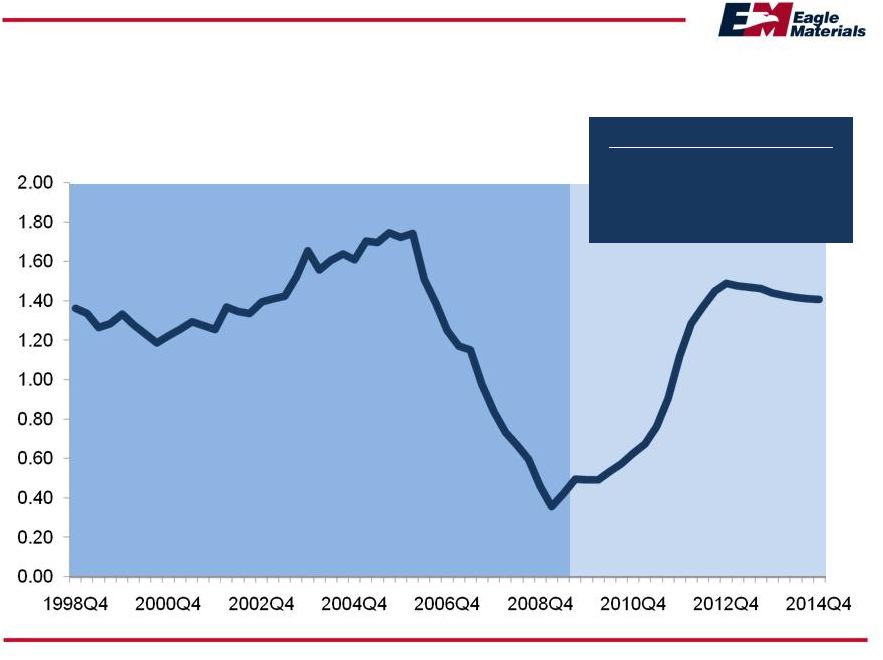 18 Base Case Demand Outlook Single Family Housing Starts, in Millions, SAAR Source: Moody’s Economy.com, December 2009 Base Case SF Starts 2009 440,000 2010 560,000 2011 870,000 |
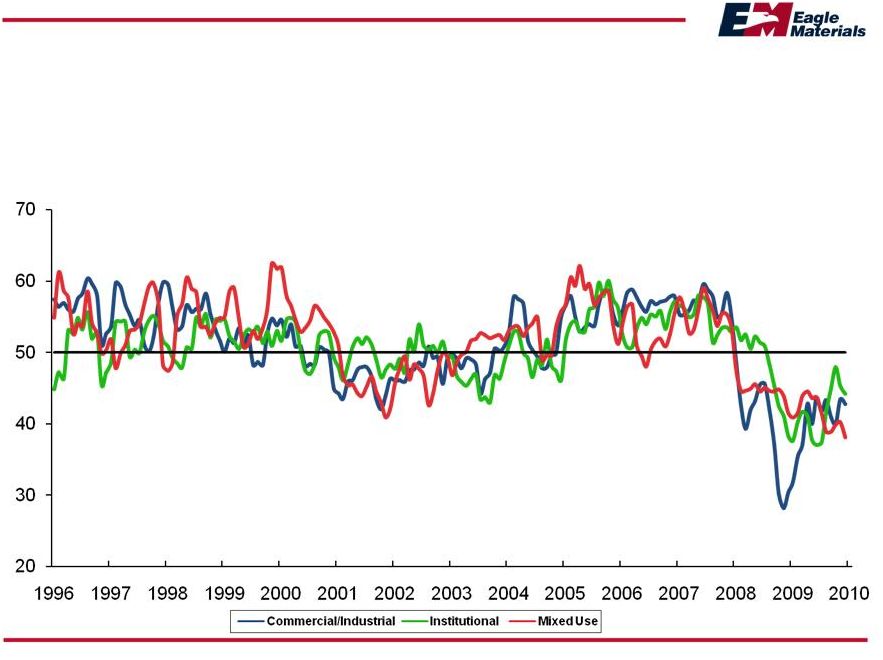 19 Architectural Billings Index December 2009 As a leading economic indicator of construction activity, the ABI reflects the
approximate nine to twelve month lag between architectural billings and
construction spending. Any score above 50 indicates an increase in billings. Source: American Institute of Architects |
 %
of Capacity in East USG 70% National 74% Koch 45% CertainTeed 37% Eagle (AGC) 21% Lafarge 100% Temple 58% 20 Geographic Wallboard Supply/Demand Imbalance Supply 15.5 Demand 8.7 Difference 6.8 Fact Eagle has •Strong West positions •Low exposure to east •Low-cost eastern plant is in favorable Carolina location Fact East-to-west supply balancing opportunity is limited by freight radius and higher eastern cost structure Inference West can regain health through market recovery in ~18 months (base case) unless new capacity is added Inference East is unlikely to achieve health without ~3 BSF of capacity reduction in conjunction with a market recovery Supply 21.3 Demand 9.3 Difference 12.0 |
 Capacity Balancing at the Trough 21 Supply Supply Demand On On On On On On Off Off Off |
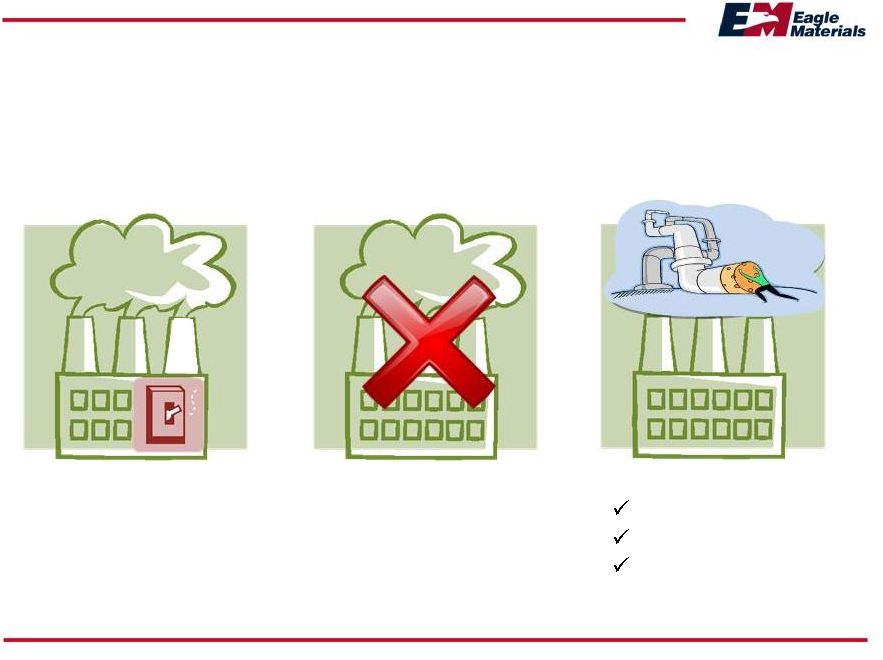 Capacity Balancing at the Trough 22 On Off Creates Diseconomies Curtail / Start-Stop Permanent
Shut-Down Mothball Not Always Necessary Reduces Capacity Preserves Option Lowers System Delivered Costs |
 A
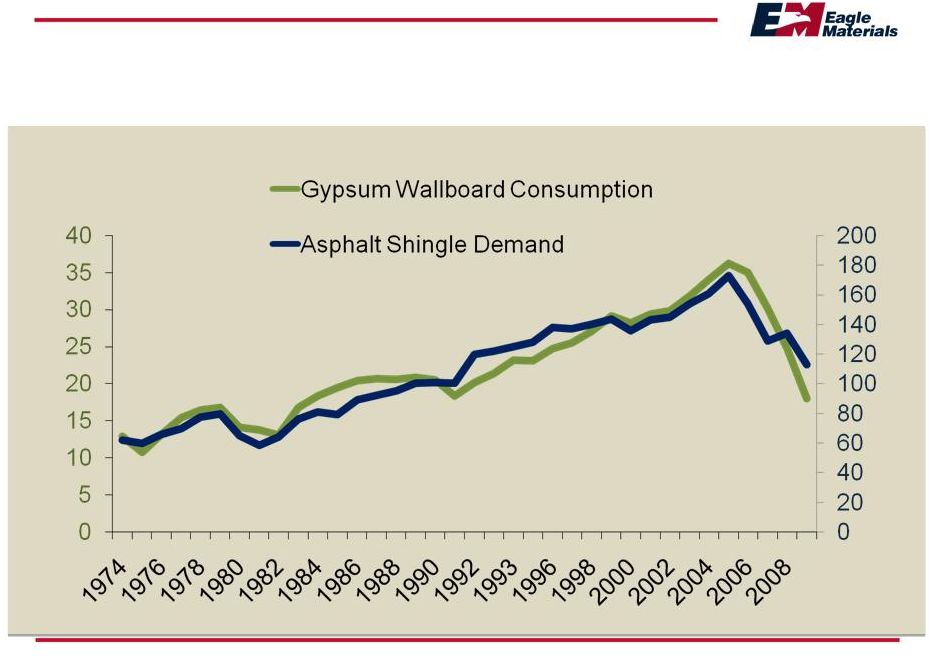
Tale of Two Industries The Same … 23 Billion Square Ft. Million Squares |
 24 A Tale of Two Industries The Same… Gypsum Wallboard Asphalt Shingles Universally used construction product Housing driven demand Sold through wholesale distributors Low industry capacity utilization … yet different |
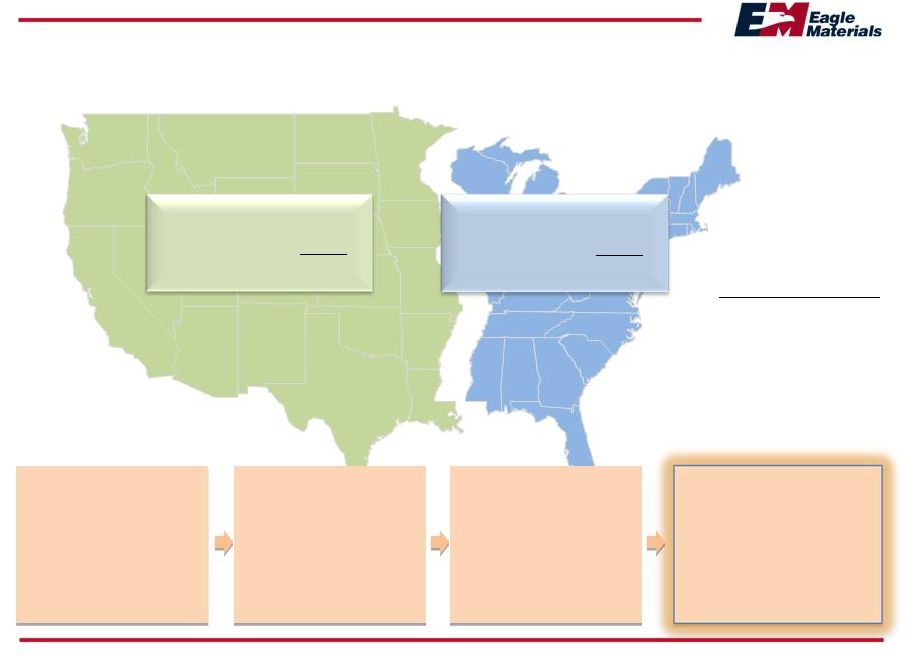
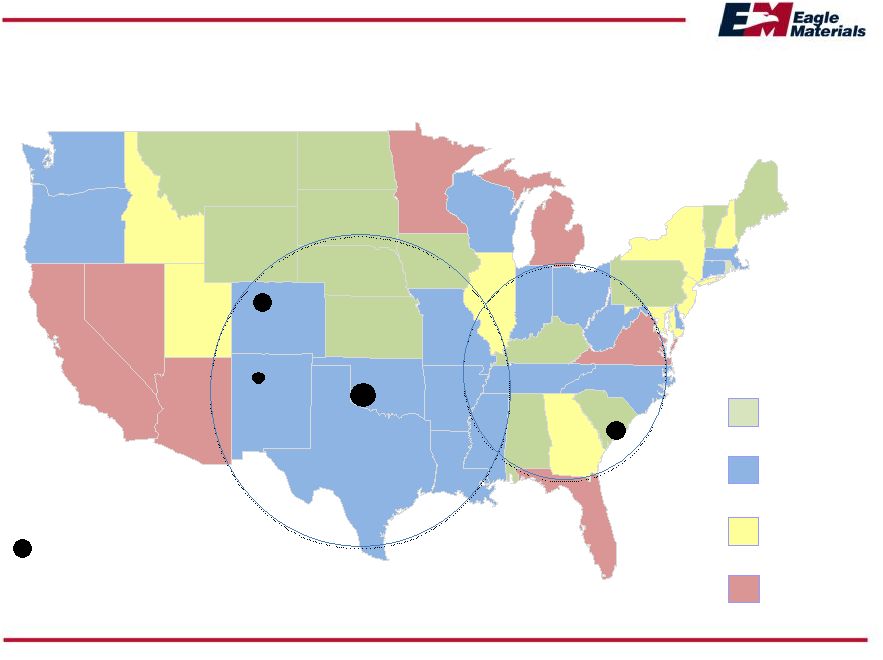     25 When will housing prices rebound to recent peak? Before 2014 2014 - 2017 2018 - 2022 After 2023 Sources: Fiserv, Moody’s Economy.com Eagle is Positioned in Earliest Recovery Markets Eagle (American Gypsum) Wallboard Plants |
 Agenda • Who We Are • Industry Outlook • Eagle Materials Outlook 26 |
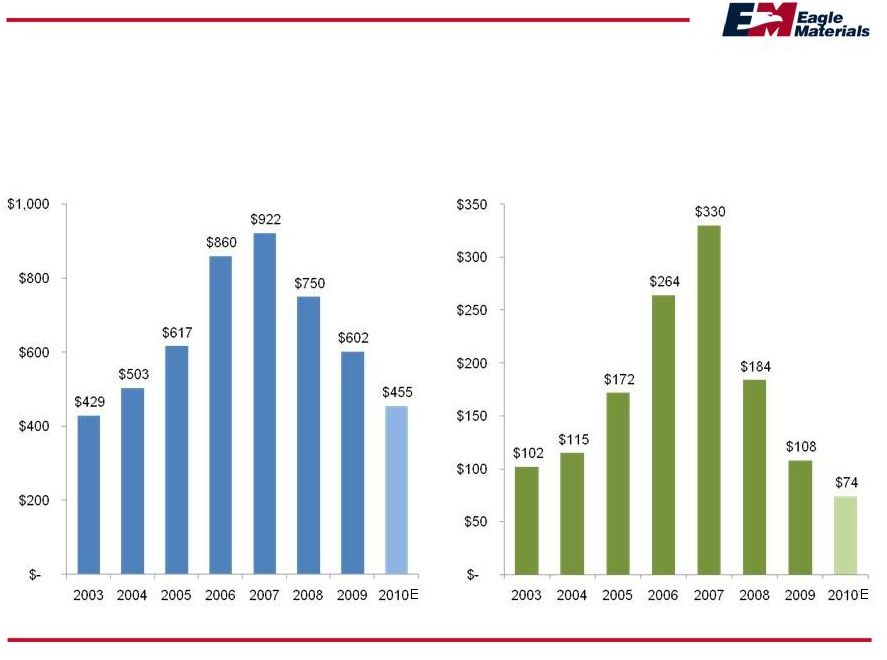 Financial Highlights $ in millions, For Fiscal Years Ending March 31 27 * Estimated Operating earnings are before Corporate G&A Revenues Operating Earnings* |
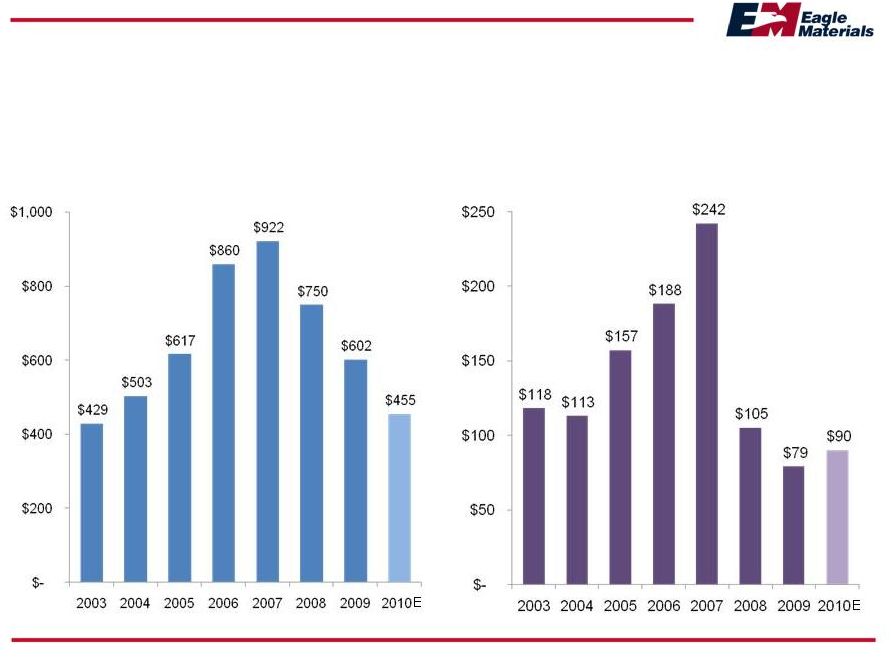 Financial Highlights $ in millions, For Fiscal Years Ending March 31 28 Revenues Operating Cash Flow |
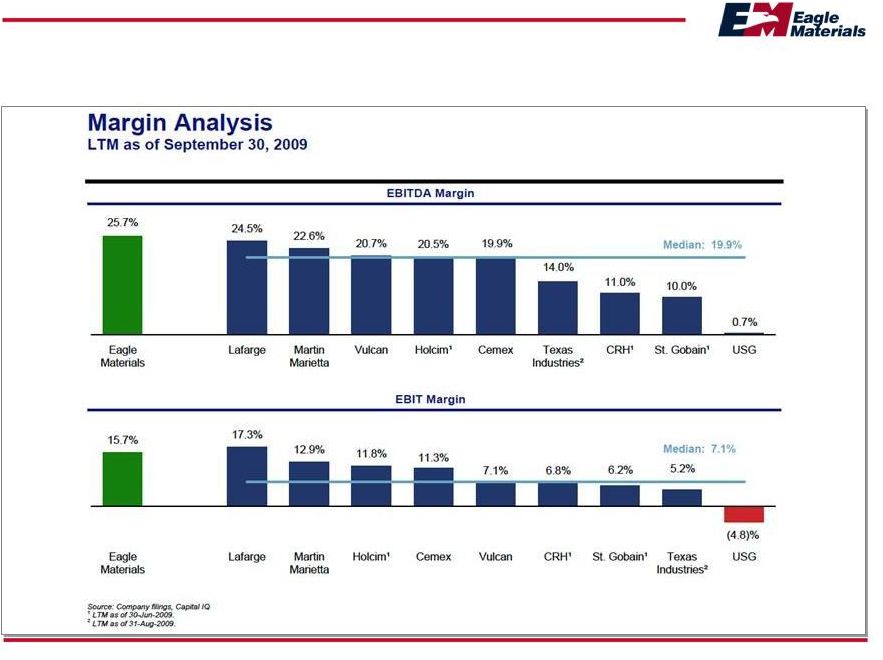 Leading Performance 29 Note: This is based on comparison of EBITDA Margins (TTM) for each of the listed
companies for the most recently reported period. EBITDA margins
represent earnings before interest, taxes, depreciation and amortization / revenues. EBITDA is a non-GAAP measure. See slide entitled “Explanation of Non-GAAP Items” that is appended as a final slide. |
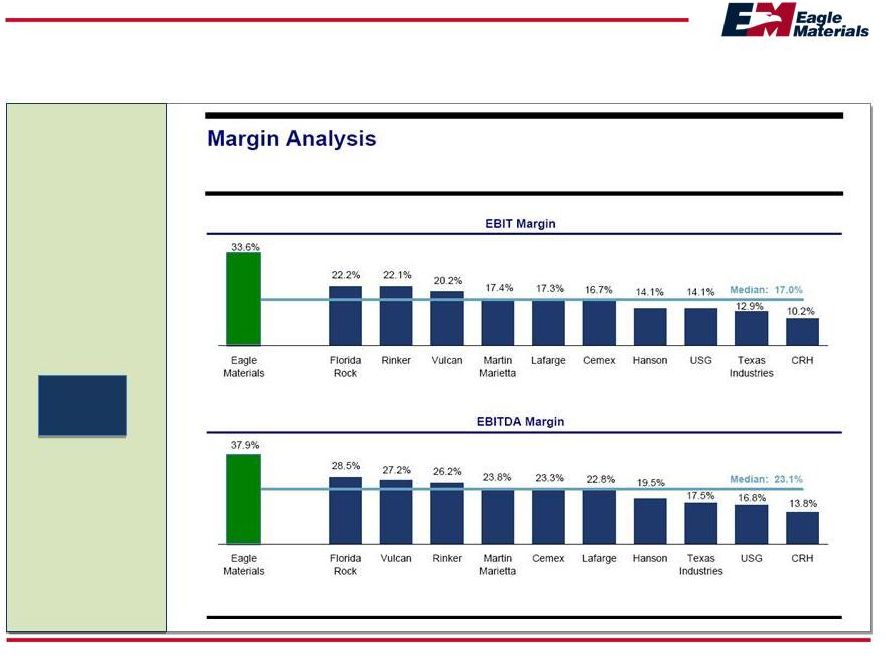 The
Song Was the Same in 2007 (Peak) 30 Note: This is based on comparison of EBITDA Margins (TTM) for each of the listed
companies for the most recently reported period. EBITDA margins
represent earnings before interest, taxes, depreciation and amortization / revenues. EBITDA is a non-GAAP measure. See slide entitled “Explanation of Non-GAAP Items” that is appended as a final slide. From May 2007 with X’s added X X X X X X (TTM) |
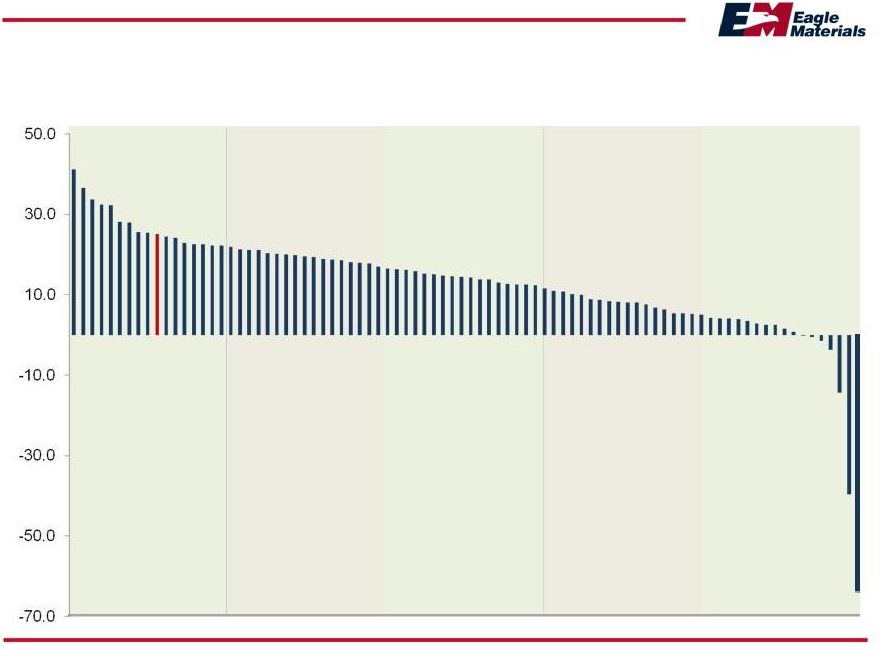
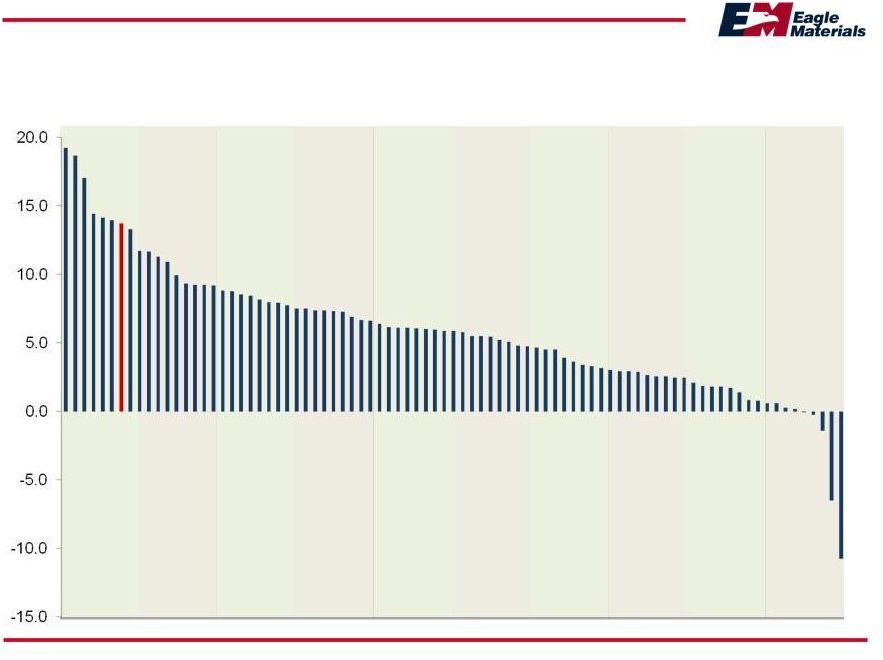 Return on Average Assets Five Year Average S&P 1500 Materials Group (N=86) 31 Top 10% Bottom 10% Eagle Materials Source FactSet, December 2009 |
 Return on Average Equity Five Year Average S&P 1500 Materials Group (N=86) 32 Top Quintile Bottom Quintile Eagle Materials Source FactSet, December 2009 |
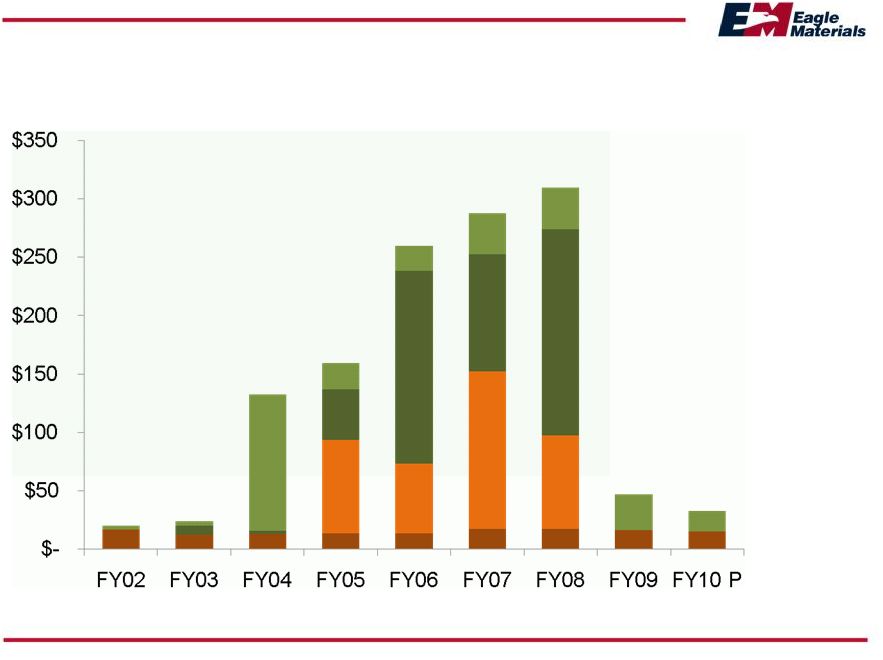 Disciplined Use of
Cash $ Millions 33 Maintenance Dividends Growth and Improvement Share Repurchases |
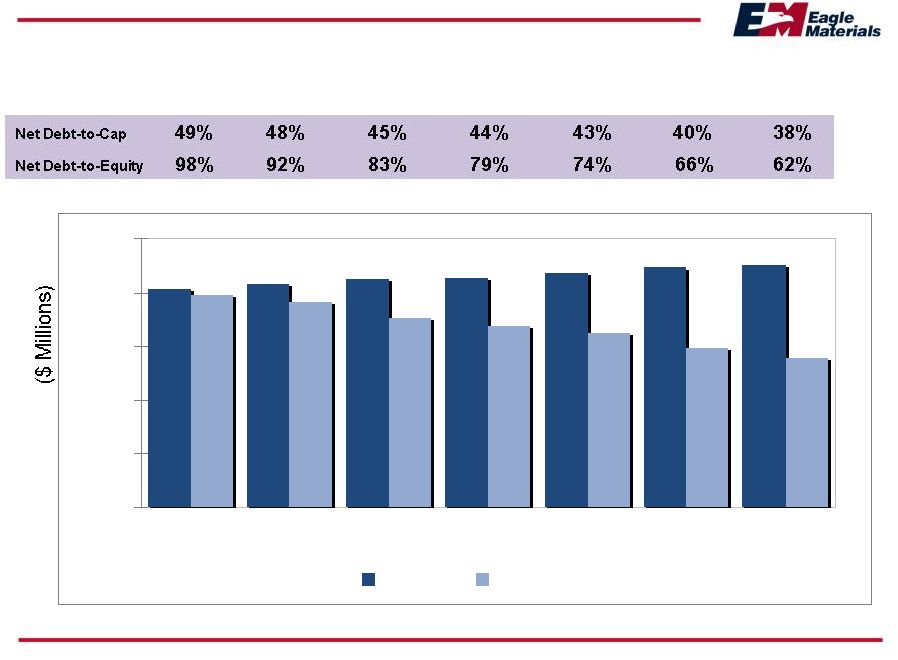 34 Capital Structure A6/30/08 9/30/08 12/31/08 3/31/09 6/30/09 9/30/09 12/31/09 $406 $416 $425 $428 $437 $446 $449 $396 $383 $352 $337 $324 $296 $278 $- $100 $200 $300 $400 $500 Equity Net Debt |
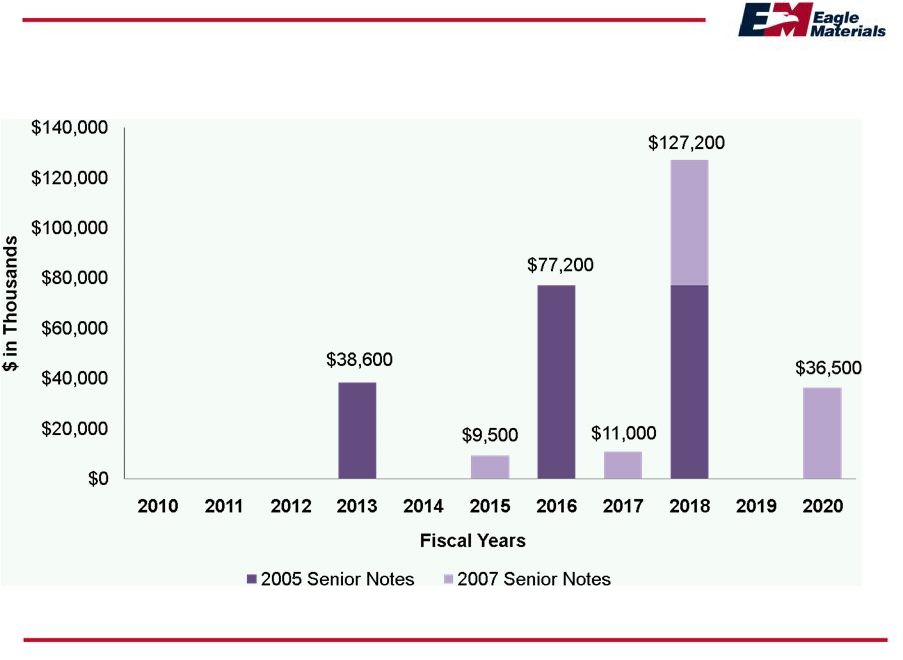 Debt Maturity
Profile 35 |
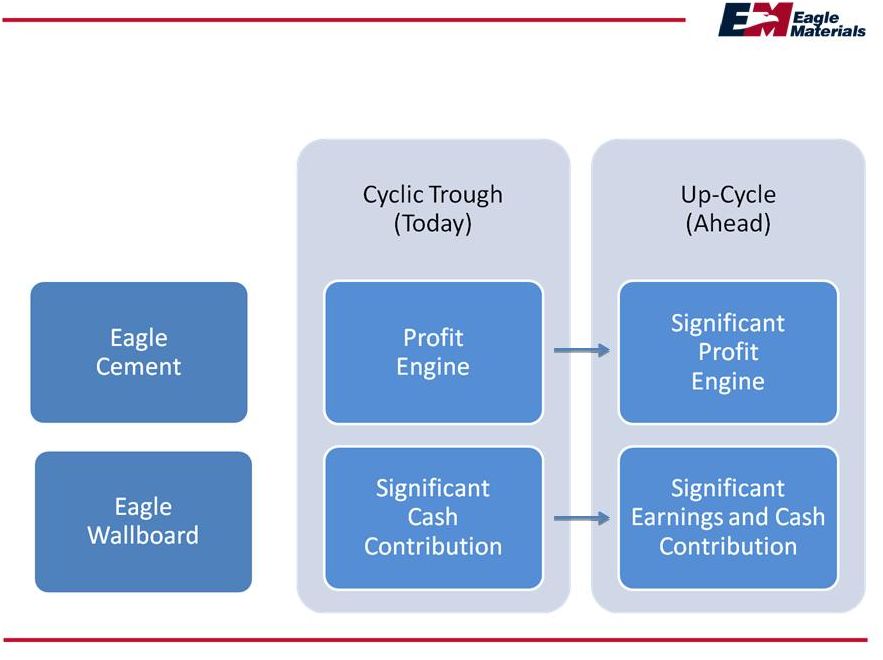
 Resilience and Performance Eagle’s ability to perform through down-cycles and thrive in the up-cycles is due to the company’s • Low cost producer position • Strong cash flow from low-cost operations • Low overhead • Consistent quality products • Exceptional customer service and long-term relationships • Best and most experienced management team in the industry, at all levels • Solid balance sheet • Positioning for the recovery 36 |
 Contact Information Steve Rowley President and CEO (214) 432-2020 srowley@eaglematerials.com Craig Kesler Executive Vice President and CFO (214) 432-2013 ckesler@eaglematerials.com Bob Stewart Executive Vice President, Strategy, Corporate Development and Communications (214) 432-2040 bstewart@eaglematerials.com Eagle Materials
Inc. NYSE: EXP www.eaglematerials.com 37 |
 38 Questions and Answers |
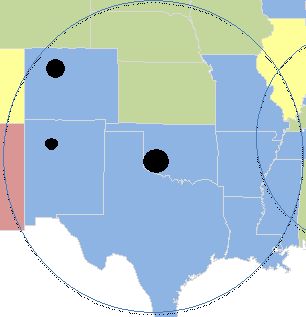
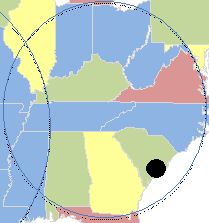
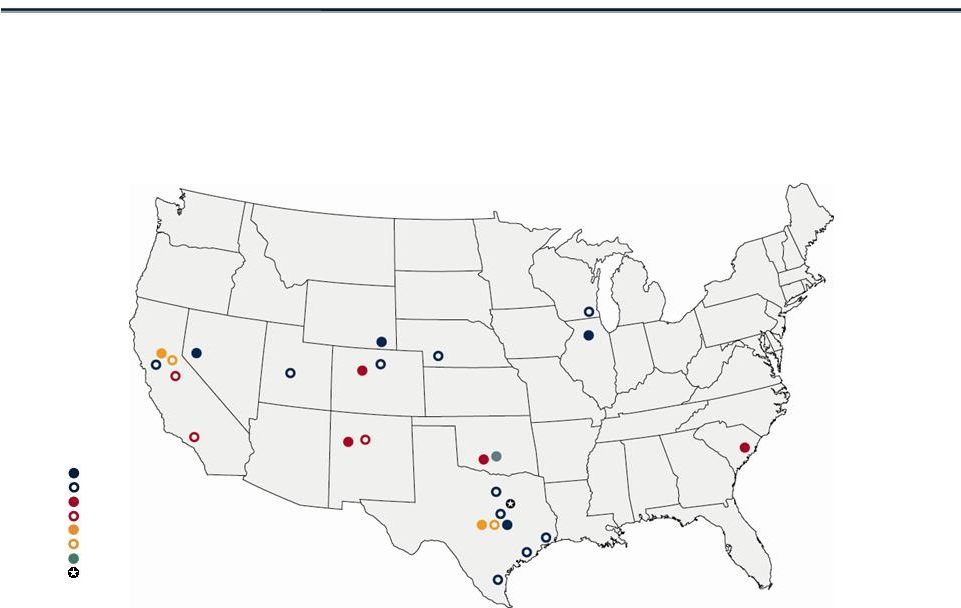 EAGLE MATERIALS’ MAJOR FACILITIES AMERICAN GYPSUM COMPANY Albuquerque, New Mexico Gypsum, Colorado Duke, Oklahoma Georgetown, South Carolina ILLINOIS CEMENT COMPANY LLC LaSalle, Illinois MOUNTAIN CEMENT COMPANY Laramie, Wyoming NEVADA CEMENT COMPANY Fernley, Nevada TEXAS LEHIGH CEMENT COMPANY LP Buda, Texas (50% joint venture) REPUBLIC PAPERBOARD COMPANY LLC Lawton, Oklahoma CENTEX MATERIALS LLC Austin and Buda, Texas MATHEWS READYMIX LLC Marysville, California WESTERN AGGREGATES LLC Marysville, California MARYSVILLE RENO (FERNLEY) ALBUQUERQUE AUSTIN (BUDA) DALLAS DUKE LAWTON LASALLE GEORGETOWN LEGEND CEMENT PLANTS CEMENT TERMINALS WALLBOARD PLANTS WALLBOARD DISTRIBUTION YARDS CONCRETE OPERATIONS AGGREGATES OPERATIONS PAPERBOARD MILL DALLAS HEADQUARTERS 39 GYPSUM WALLBOARD PLANTS CEMENT PLANTS PAPERBOARD MILL CONCRETE & AGGREGATES PLANTS |
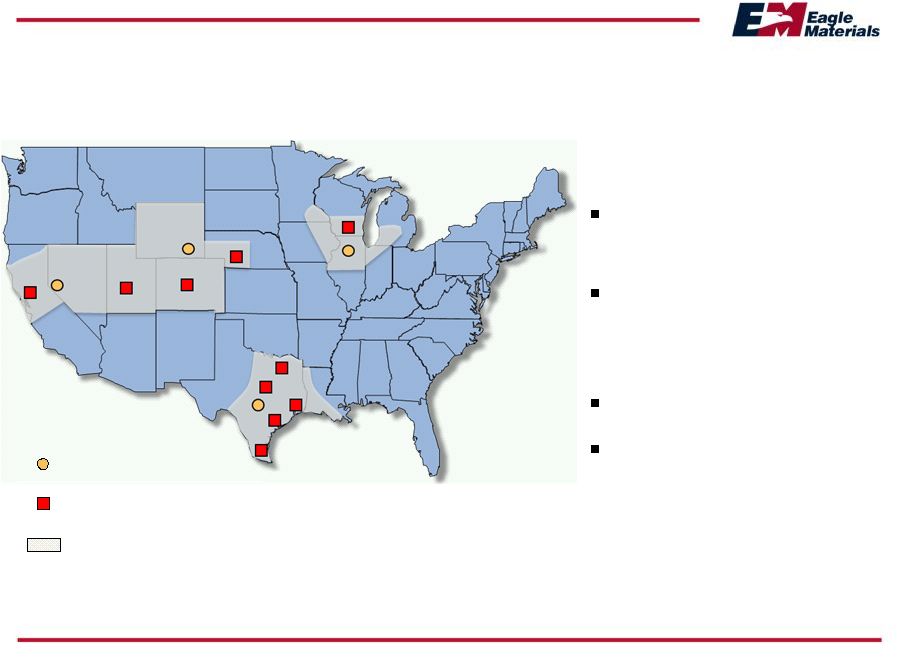
 Eagle’s Wallboard
Operations at a Glance American Gypsum • 18-year history • Nearly 4.0 bsf of capacity • Est. 10% market
share (Top 5 in US) • Lowest cost producer • Consistent quality • Exceptional customer service Wallboard Plants Reload/Distribution Yards Core Markets Served 40 |
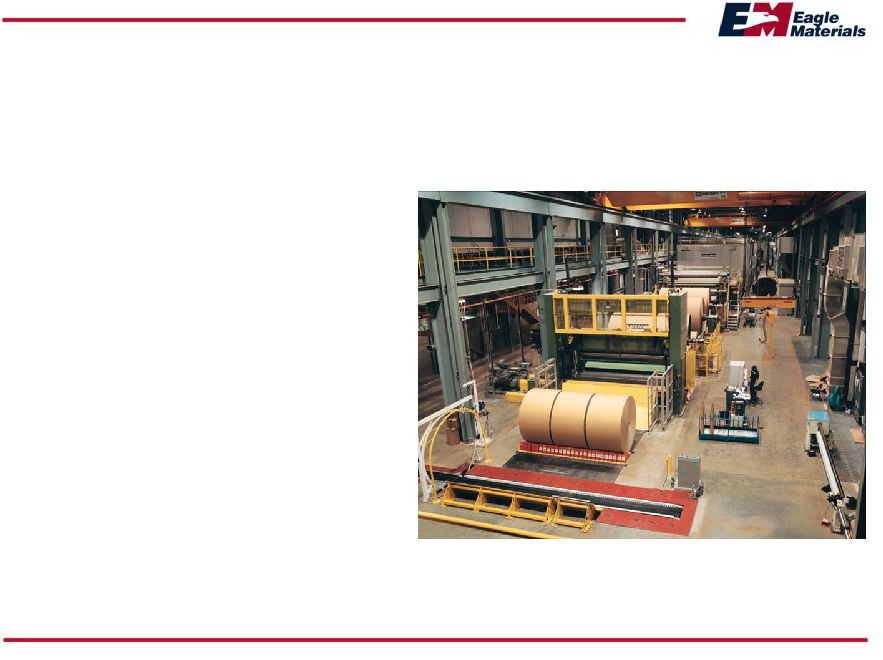 Eagle’s Gypsum
Paperboard at a Glance 41 • Original design capacity of 220,000 tons has been increased to 320,000 tons • Republic produces light-weight gypsum paperboard • 15% lighter than gypsum industry average • Superior wallboard conversion characteristics • Produces uniform cross-directional strength, weight and moisture profile • 50% of capacity consumed internally, 40% sold through long-term sales contract with CertainTeed, 10% sold in spot linerboard market (at full utilization) • Cost trends: OCC costs are up since year end, energy costs are trending down |
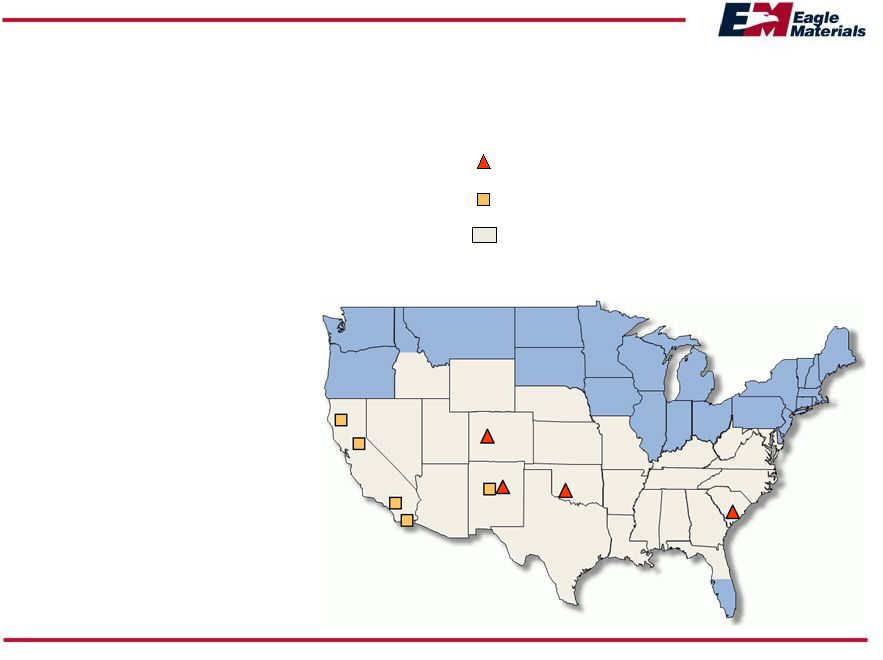
 Eagle’s Cement
Operations at a Glance Approximately 3.1 million tons of capacity 3.1% market share (Top 12 in North America) Low cost producer Exceptional quality and customer service 42 Cement Plants Cement Terminals Markets Served |
 Eagle’s Concrete
and Aggregates Operations at a Glance 43 • Strong competitive position in local markets • Capacities • Aggregates – 5.5 mil tons • Concrete – 850,000 cu yds • Complimentary to Eagle’s Cement business • Vast aggregates reserves: over 1 billion tons in No. CA • Exceptional quality and customer service |
 Explanation of
Non-GAAP Items 44 EBITDA represents net income, plus interest expense (less interest income), provisions for income taxes and depreciation and amortization expense. EBITDA is a non-GAAP measure that provides supplemental information regarding the operating performance of our business without regard to financing methods, capital structures or historical cost bases and is used as a benchmark for evaluating the creditworthiness of particular issuers. EBITDA should not, however, be considered as an alternative to net income, operating income, cash flow from operations or any other measure of financial performance in accordance with GAAP. EBITDA for our trailing twelve-months ended September 30, 2009 of $138.6 can be reconciled to net income by adding to net income the following amounts: interest expense, $24.0 million; provision for income taxes, $21.3 million; deprecation and amortization expense, $50.9 million. EBITDA for our trailing twelve-months ended March 31, 2007 of $349.7 can be reconciled to net income by adding to net income the following amounts: interest expense, $5.4 million; provision for income taxes, $101.6 million; deprecation and amortization expense, $40.0 million. |