Attached files
| file | filename |
|---|---|
| 8-K - FORM 8-K - NewStar Financial, Inc. | d8k.htm |
 Investor Presentation February 2010 Exhibit 99.1 |
 1 This presentation contains forward-looking statements. All statements other than
statements of historical fact included in this presentation are forward-looking
statements, including, without limitation, statements related to any plans to raise additional capital. These statements also include information with respect to future
events, including our anticipated financial performance and results of
operations. These forward looking statements are not guarantees of our
future performance or of the occurrence of future events and are subject to
material risks and uncertainties that could cause actual results or events to
differ materially from the results or events contemplated by the
forward-looking statements. Factors that could affect our results and
cause them to materially differ from those contained in the forward-looking statements include our limited operating history; the current dislocation in the credit
markets and the general state of the economy; our ability to compete
effectively in a highly competitive industry; and the impact of federal, state
and local laws and regulations that govern non-depository commercial
lenders and businesses generally. More detailed information about these risk
factors can be found in the section titled “Risk Factors” in our annual report on Form 10-K, as such section is updated by our quarterly reports on Form 10-Q, all of which are filed with the SEC. Forward Looking Statements |
 2 Agenda I. Introduction II. History III. Business Strategy and Credit Thesis IV. Core Strengths and Competitive Advantage V. Performance VI. Value Considerations VII. Opportunity Appendix |
 3 Introduction Emerging from a period of unprecedented challenges Our ability to navigate through this period reflects both the quality of the business
plan and the experience of the management team Although credit costs weighed heavily on financial results in 2009, the outlook is
improving Believe provision expense and reserve levels have peaked Expect to be profitable in 2010 as credit costs moderate Fundamental business model still able to generate attractive returns in a lower
leverage environment with increased focus on asset management activities
|
 4 History Formed in June 2004 by a team of senior banking executives Initially capitalized with $210 million from a group of investors led by Corsair
Capital and Capital Z Partners Funded lending activities through a combination of equity, warehouse lines from
major banks and securitizations (CLOs) Launched $600 million sidecar fund with $150 million of equity from Och-Ziff and
Caisse Depot de Quebec Raised $235 million from IPO in December 2006 and another $125 million in a follow-on PIPE transaction in December 2007/January 2008 Raised $1.8 billion of debt capital through issuance of five CLOs Issued $75 million of revolving Holdco notes and completed new $275 CLO in
January 2010 Tangible equity was $546 million, or $10.92 per share, as of December 31, 2009,
down only 9% from peak of $12.00 per share |
 5 Business Strategy and Credit Thesis Focus on direct origination of loans with control over due diligence and negotiation of transaction terms Employ experienced, credit-trained bankers Apply disciplined selection criteria for target markets, clients and transactions Enforce a rigorous credit process Execute a defensive portfolio strategy – Broad diversification by issuer and across industry sectors – Focus on senior debt with conservative leverage and substantial capital below NewStar in the capital structure from investors with incentive and resources to support their investment Invest in experienced portfolio managers to support credit process and actively
manage credit portfolios Emphasize asset management and syndication activities to provide strategic advantage to lending business and enhance returns on equity
|
 6 Core Strengths and Competitive Advantage Experienced, cohesive management team Direct origination capabilities and lending franchise Skill and experience of bankers and portfolio managers Credit and risk management capabilities Loan syndication capabilities and asset management platform Funding platform Operating and loan servicing infrastructure |
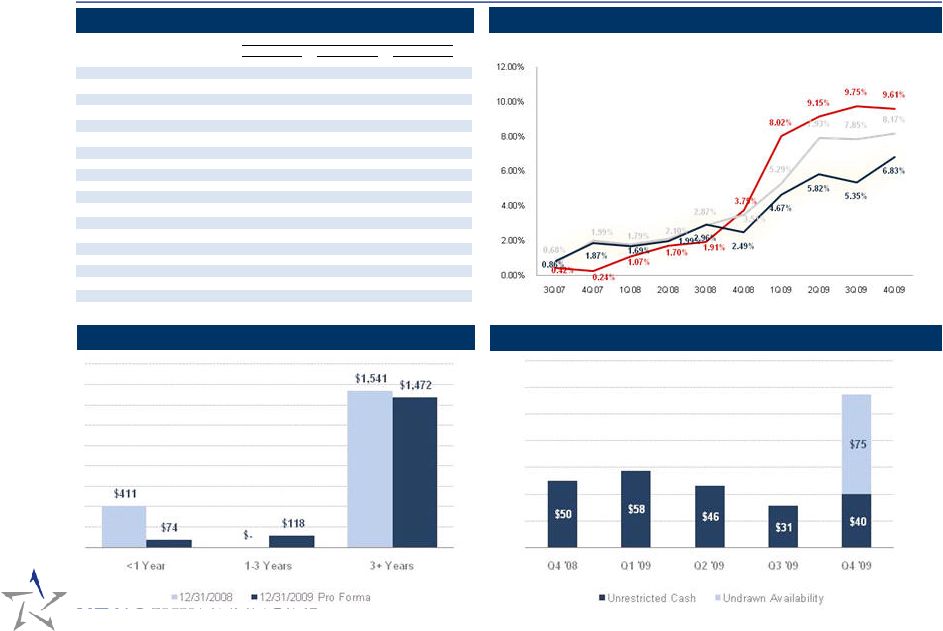 7 Performance Credit Performance Financial Highlights Lagging 12-Month Default Rate by Principal Amount 1 Funding – Debt Maturity Profile Liquidity ($ in thousands) 2007 2008 2009 Total Assets $2,622,765 $2,571,522 $2,200,072 Loans, Gross 2,402,322 2,409,148 2,036,213 Managed Assets 2,980,594 2,970,389 2,578,717 Non-performing Loans / Loans 0.97 % 2.52 % 8.08 % ALLL / Loans 1.58 % 2.25 % 5.68 % Charge-offs / Loans 0.19 % 0.82 % 3.61 % Net Interest Income $94,592 $102,554 $94,642 Non-interest Income (28,176) 18,930 10,653 Operating Expenses 57,494 44,789 42,435 Provision for Credit Losses 19,510 38,224 133,093 Net Income (8,639) 22,398 (44,260) Net Interest Margin 4.23 % 4.02 % 3.98 % Efficiency Ratio 86.57 % 24.04 % 39.69 % FTE 132 94 61 Secured Short-term Debt $677,739 $411,267 $91,890 Secured Term Debt 84,000 219,000 270,375 Term Debt Securitizations 1,280,725 1,305,171 1,252,677 Tangible Equity 502,690 581,555 546,062 Book Value Per Share 11.58 12.00 10.92 Year EndedDecember 31, Source: Standard and Poor’s LCD and S&P/LSTA Leveraged Loan Index and Company Estimates S&P LSTA Index NEWS Total Loans NEWS Middle Market Corporate Loans Note: The S&P LSTA lagging 12-Month Default Rate published for the US Leveraged Loan Index is calculated
by summing the total par amount outstanding, at time of default, of the defaulted facilities over the previous 12 month time period divided by the total par amount outstanding of the overall index as
of the beginning of that 12 month period. A loan is considered defaulted if an obligor is in payment default, bankruptcy or has been downgraded to a “D” rating from Standard &
Poor’s. For NewStar’s calculation of the lagging 12-month default rate, a loan is considered defaulted if its has been classified as a non-performing loan. |
 8 Value Considerations – Breakdown of Book Value Warehouse Secured Term Debt CLO Trusts Parent Company Assets Memo: NPAs Debt Net Assets Net Asset Value / Share Memo: NPAs / Share $174 0 92 82 $1.63 n.m. $407 0 270 136 $2.72 n.m. $1,412 88 1,253 159 $3.18 $1.76 $100 84 -- -- -- 100 $1.99 $1.68 Unrestricted Cash $40 -- -- -- -- 40 $0.80 -- Unencumbered Loans and OREO Assets Memo: NPAs Reserves Deferred loan fees Liabilities Net Assets Net Asset Value / Share Memo: NPAs / Share Deferred Tax Asset $57 -- -- -- -- 57 $1.13 -- Financing Subsidiaries Subtotal Subtotal $1,993 88 1,615 377 $7.53 $1.76 $342 84 (115) (21) 35 171 $3.39 $1.68 As of 12/31/2010 $10.92 Other¹ $145 -- (115) (21) 35 (26) ($0.53) -- 1 Assets include restricted cash balances of $91.1 million, deferred financing costs of $18.6 million, interest receivable of $7.9 , net fixed assets of $1.0 million. Income tax receivable of $7.3 million and other assets totaling $19.6 million.
Reserves include allowance for loan losses not allocated to unencumbered assets. Liabilities include accrued interest payable of $2.8 million, accounts payable of
$0.6 million and other liabilities totaling $31.6 million. Restricted cash is shown at the parent company for illustrative purposes, but is held principally at
the financing subsidiary level to be used for reinvestment in loan collateral, debt service, and to meet any reserve requirements. |
 9 Opportunity Unlock balance sheet value Restart growth in an historically attractive lending environment Leverage origination and servicing platforms with core strength in credit management into new markets and asset types Participate in consolidation of CLO and other credit managers Build on current track record to launch new credit funds |
 10 Opportunity Expect strong demand for loans from LBO and refinancing activity With an estimated $400 million of capital available for investment, private equity has purchasing power of nearly $1 trillion assuming 40% equity contributions in new deals NewStar targets buyout funds which represent approximately $40bn or 10.0% of the un-invested private equity capital That translates into a target market opportunity of approximately $32bn Record amounts of leveraged loans were issued from 2005 to 2007, much of which will mature in the next three to four years With a more than $1.3 trillion of leveraged loans issued between 2005 and 2007, lenders should see a significant refinancing opportunity Leveraged Loans Maturing in Next Five Years US Fundraising and LBO Volume Source: S&P LCD |
 11 Opportunity Thinner competitive landscape with reduced lending capacity Dramatic decrease in number of loan market investors Expect loan market to experience imbalance as CLOs lose reinvestment capacity as record amounts of loans are scheduled to mature Deal structures in future likely to be more influenced by regulators as banks increase share Declining # of Active Institutional Loan Investor Groups Non-US Banks Institutional Investors US Banks Securities Firms Finance Cos Reduction in US CLO Lending Capacity Institutional Investors Have Dominated the Market Source: S&P LCD |
 12 Opportunity Return expectations in a higher cost of capital and lower leverage market Earning assets / total assets – NPAs and reserves Asset yields – Pricing strategy and business/asset mix Leverage – Market conditions, credit performance, and mix of asset types Fee revenue / non-interest income – Asset management and loan syndication Scale – Expenses as % of total assets – Staffing strategy 2 3 4 5 1 2 4 5 1 3 Amount Amount Leverage % Earning Assets 100 $ Debt 80 $ 4.00 x 80.0% Equity 20 1.00 x 20.0% 100 $ 100 $ % $ % Interest Income Debt Index (LIBOR) 0.30% - $ Loan Index (LIBOR incl. floors) 1.00% 1.0 Credit Spread 5.00% 5.0 Upfront Fee 0.50% 0.5 All-in Spread 5.50% 5.5 Total Interest Income (Yield) 6.50% 6.5 Interest Expense (Cost of Funds) Index (LIBOR) 0.30% (0.2) Credit Spread 2.20% (1.8) Nominal Interest Expense 2.50% x Advance Rate 80.0% Effective Interest Expense 2.00% (2.0) Net Interest Income 4.50% 4.5 Non-Interest Income 1.25% 1.3 Revenue 5.75% 5.8 Credit Costs 1.00% (1.0) Risk Adjusted Revenue 4.75% 4.8 Expenses 1.25% (1.3) Pre-Tax ROAA (Income) 3.50% 3.5 Pre-tax ROE 17.5% 17.5% Illustrative Business Model Economics |
 13 ##### 4.00% 4.50% 5.00% 5.50% 6.00% 17.50% 0.25% 0.60% 1.00% 1.50% 2.00% 1.50% 15.3% 17.8% 20.3% 22.8% 25.3% 1.50% 16.6% 18.3% 20.3% 22.8% 25.3% 1.75% 14.3% 16.8% 19.3% 21.8% 24.3% 1.75% 15.6% 17.3% 19.3% 21.8% 24.3% 2.00% 13.3% 15.8% 18.3% 20.8% 23.3% 2.00% 14.6% 16.3% 18.3% 20.8% 23.3% CoF 2.20% 12.5% 15.0% 17.5% 20.0% 22.5% CoF 2.10% 14.2% 15.9% 17.9% 20.4% 22.9% 2.25% 12.3% 14.8% 17.3% 19.8% 22.3% 2.25% 13.6% 15.3% 17.3% 19.8% 22.3% 2.50% 11.3% 13.8% 16.3% 18.8% 21.3% 2.50% 12.6% 14.3% 16.3% 18.8% 21.3% 2.75% 10.3% 12.8% 15.3% 17.8% 20.3% 2.75% 11.6% 13.3% 15.3% 17.8% 20.3% ##### 3.00 3.50 4.00 4.50 5.00 17.50% 4.00% 4.50% 5.00% 5.50% 6.00% 1.50% 16.6% 18.5% 20.3% 22.2% 24.0% 0.75% 15.0% 17.5% 20.0% 22.5% 25.0% 1.75% 15.9% 17.6% 19.3% 21.0% 22.8% 1.00% 13.8% 16.3% 18.8% 21.3% 23.8% 2.00% 15.1% 16.7% 18.3% 19.9% 21.5% 1.25% 12.5% 15.0% 17.5% 20.0% 22.5% CoF 2.20% 14.5% 16.0% 17.5% 19.0% 20.5% 1.50% 11.3% 13.8% 16.3% 18.8% 21.3% 2.25% 14.4% 15.8% 17.3% 18.8% 20.3% 1.75% 10.0% 12.5% 15.0% 17.5% 20.0% 2.50% 13.6% 15.0% 16.3% 17.7% 19.0% 2.00% 8.8% 11.3% 13.8% 16.3% 18.8% 2.75% 12.9% 14.1% 15.3% 16.5% 17.8% 2.25% 7.5% 10.0% 12.5% 15.0% 17.5% Credit Costs ##### 0.50% 0.75% 1.00% 1.50% 2.00% 17.50% 0.75% 1.00% 1.25% 1.50% 1.75% 1.50% 22.8% 21.6% 20.3% 17.8% 15.3% 0.50% 18.8% 20.0% 21.3% 22.5% 23.8% 1.75% 21.8% 20.6% 19.3% 16.8% 14.3% 0.75% 17.5% 18.8% 20.0% 21.3% 22.5% 2.00% 20.8% 19.6% 18.3% 15.8% 13.3% 1.00% 16.3% 17.5% 18.8% 20.0% 21.3% CoF 2.20% 20.0% 18.8% 17.5% 15.0% 12.5% 1.25% 15.0% 16.3% 17.5% 18.8% 20.0% 2.25% 19.8% 18.6% 17.3% 14.8% 12.3% 1.50% 13.8% 15.0% 16.3% 17.5% 18.8% 2.50% 18.8% 17.6% 16.3% 13.8% 11.3% 1.75% 12.5% 13.8% 15.0% 16.3% 17.5% 2.75% 17.8% 16.6% 15.3% 12.8% 10.3% 2.00% 11.3% 12.5% 13.8% 15.0% 16.3% Exp Non-Interest Income Exp Loan Credit Spread Loan LIBOR Debt / Equity Loan Credit Spread Opportunity Business Model Economics - Sensitivity to Key Drivers “CoF” Cost of funds |
 Appendix |
    15 Loan Portfolio Outstandings ($MM) 2002 - 2003 6/06: Closed second CLO ($500MM) 9/02-6/04: Developed strategy and team 6/05: CAM-2 servicer rating from Fitch 6/07: Closed third CLO ($600MM) Overview Corporate History 6/04: NewStar formed with $210MM of equity 7/04: Closed first loan 11/07: Raised $121MM in equity 12/07: Closed NCOF CLO ($560MM) 11/07: Closed Term Debt Facility ($300MM) 12/06: NEWS IPO ($218MM) 8/05: Established NCOF asset management business with $150MM of equity 8/05: Closed first CLO ($375MM) 12/07: Became Sarbanes- Oxley Compliant 11/08: Extended Citi Warehouse ($300MM) 6/09: Fitch affirmed CAM-2 servicer rating Credit Crisis/Cycle 7/09: Term Out of Wachovia / Wells Warehouse 5/09: Renewal of Natixis Warehouse 7/09: Rollout of Everest analytics & reporting system (1) Estimate as of 9/30/09 1/10: Closed fourth CL0 ($275 MM) 1/10: Issued $75 MM Revolving Credit Notes • 61 employees • 4,000+ opportunities • $2.6 billion assets under management (inc. NCOF) |
 16 House values peak Record M&A and capital markets activity Tightening credit spreads Loose credit standards (2 nd lien, Covevent lite, PIK Toggle) Easy access to capital / New entrants in loan markets Subprime Crisis Financial Crisis Recession Asset Bubble 2005-2006 2007 2009 2008 Housing bubble bursts Massive writedowns of MBS / CDOs Other credit markets peak SIVs begin to unwind and ABCP market collapses Syndicated loan and CLO market shuts down in second half Banks begin to pull warehouse lines Macro Environment Access to capital severely constrained as markets freeze Banks forced to de-lever and build reserves High profile failures of top tier banks and other non-bank lenders Government coordinates massive intervention and bailout Economy contracts sharply Banking system stabilizes and congress passes economic stimulus bill Credit losses worsen as CRE markets collapse and consumer markets weaken further Over 100 banks fail Credit spreads begin to tighten as market conditions improve Financial industry consolidation gains momentum Overview Managing through the financial crisis Raised $850 million through two CLOs Raised $100 million of corporate debt Raised $235 million in IPO Added over $1 bn of warehouse line borrowing capacity Substantial growth through direct origination Focused on senior debt Reduced scale of planned CRE and Structured Products lending platforms Completed $600 million CLO to fund balance sheet and $560 million CLO to fund NCOF Completed $300 million term debt financing Raised $125 mn of equity capital in PIPE transaction Maintained growth trajectory and warehouse lines, but curtailed syndications activity Sold securities portfolio and exited structured products segment Began to assess alternative funding models Shifted to defensive posture to preserve liquidity and protect balance sheet Slowed origination activity and began to pursue depository strategy Increased term debt by $100 million Maintained profitability, while increasing reserves Entered agreement to acquire commercial bank and explored opportunities to participate in government programs Completed extensive regulatory review process before withdrawing applications and terminating bank acquisition Restructured balance sheet, reducing short-term debt by 82% and total debt by $340 million Experienced elevated credit costs, but outperformed benchmarks Right-sized cost base Positioned company to be survivor and capitalize on emerging opportunities Issued first CLO since market collapsed Issued $75 million of revolving Holdco credit notes |
 17 Business Model: Management Experienced Executive Team Executive Title Years Experience Prior Experience Executive Management Tim Conway Chief Executive Officer 24 Head of Corporate Finance, Capital Markets and Leveraged Finance, Fleet Boston Head of Loan Syndications, Private Placements and Acquisition Finance, Citicorp Securities Peter Schmidt-Fellner Chief Investment Officer 22 Head of High Yield Bond Sales, Trading, Research and loan trading and Co-Head of High Yield Capital Markets, Chemical/Chase/JP Morgan Corporate Administration John Bray Chief Financial Officer 30 Director of LOB Finance, Fleet Boston Financial Chief Financial Officer, Fleet Credit Card Services John Frishkopf Managing Director, Treasurer and Head of Asset Management 22 Turnaround Professional, Nightingale & Associates Chief Financial Officer, VSZ (Slovak Steel Company) Vice President, Citicorp Securities Robert Brown Managing Director, Corporate Strategy & Development 17 MD & Head of Sales Planning & Performance Management for the Global Wealth & Investment Management Division of Bank of America MD& Head of Strategy & Business Development for Commercial Finance Division of Bank of America Credit Bob Clemmens Chief Credit Officer, Middle Market 33 Head of Risk for the Americas, Barclays Bank Member, Counterparty Risk Management Policy Group Dan Adkinson Managing Director, Commercial Real Estate 29 Head of Real Estate Debt Capital Markets, JP Morgan Fleming Asset Management Origination Dave Dobies Managing Director, Middle Market 19 Managing Director, Fleet Securities Scott Poirier Managing Director, Sales & Trading 15 Head of European Debt Capital Markets, Fleet Securities Managing Director, Sales & Trading, Fleet Securities |
 18 Business Model: Management With Experience Working Together NewStar’s executives have collaborated together at predecessor institutions over the past 20
years |
 19 Admin Agent: $2 billion of loans Underwrite or Arrange up to $65MM Loans: ~$2.0 billion Hold Sizes: $5 – 17.5 million Loans: ~$0.6 billion Hold Sizes: $5 – 17.5 million $5MM – $100MM Commitment Business Model: Origination and Distribution Platform Flexible and Scalable Ability to commit substantial capital to customers Hold limits enhance diversification Generates multiple revenue streams Asset Management Fees Agency Fees Syndication Fees Interest Income Commitment Fees Amendment Fees Other Fees Customer |
 20 Business Model: Target Market Focused on the Middle Market Target Market = US Middle Market Aaa $1,000 $5,000 Source: S&P Capital IQ CIT Management estimates B1 B2 B3 NR $10 $50 $250 Structure of U.S. Commercial Lending Market Ba3 Baa Credit Rating NewStar targets the market for financing mid-sized companies, which is large and fragmented
with no single competitor holding a dominant market share… Middle Market – Non-investment grade companies with $25 – 500 million of revenue – Addressable market of approximately $1.5 trillion Characteristics – Constant change combined with M&A activity drives consistent need for new
financing – Complex financing needs comparable to large companies, but on a scale not suitable for
capital markets – Long-term bank consolidation and recent credit crisis has left market under-served with few scale competitors Senior Debt Large Banks Investment Banks Finance Companies BDCs Regional Banks Middle Market Hedge Funds CLO Managers Community Banks Annual Revenue Number of Companies Approximate Market Size ($bn) % of Market $25-50 32,057 433 28% $50-100 17,144 386 25% $100-250 10,190 382 25% $250-500 3,866 319 21% 63,257 1,520 100% |
 21 Typically floating rate senior secured obligations with liens on all assets (including stock of subsidiaries) Restrictive covenants provide additional protection tied to financial performance and
reporting rights among other things Pricing of senior secured (1 lien) loans ranges from LIBOR + 550 bps to LIBOR + 750 bps Significant junior capital and ‘cash’ equity provide support for senior debt Business Model: Credit Product Strategy Middle Market Loan Characteristics Assets Current Assets Cash Accounts receivable Inventories Other current assets Long Term Assets Plant & Equipment Real Estate Intangibles Subsidiary Stock Liabilities and Equity Equity 30 – 50% Subordinated Debt (Unsecured) 0 – 20% All assets pledged to Hypothetical Borrower Company Profile Transaction Characteristics Target Credit Profile Revenue: $25 - 250 million EBITDA: $5 - 50 million Stable predictable cash flow Rating: Non-rated, but implied Ba3/B1/B2/B3 credit quality Industries: Defensive Stage: Mature companies with franchise value Sr. Debt: Up to $150 million Avg size is $50 - $75 million Jr. Debt: Up to $50 million Avg size is $15 – 25 million Sr. Lev: <3.00x (LTV < 50%) Total Lev: <4.00x (LTV < 60%) Equity: >40% st Senior Secured Debt (1 Lien) 40 - 55% Senior Secured Debt (2 Lien) 0 – 20% st nd |
       22 Managing Director New York Region 9 Old Kings Hwy South Darien, CT 06820 203-716-8411 Qualifications Number of Key Relationships: Business Model: Direct Origination Uniquely Qualified Bankers 40-60 Financing Opportunities 6-8 Closed Deals • Industry expertise • Credit experience • Capital markets perspective and insight 20 5-10 3-5 5 10-15 • 20+ Year Commercial Banker • Middle Market Executive • Senior Credit Officer |
 23 Business Model Credit Selection Key strategy characteristics – Targeted direct origination with industry focus – Sophisticated, experienced bankers – Disciplined screening process – Relative value assessment – Diversification – Focus on senior secured positions Key credit considerations – Strong, sustainable business franchise – Consistent historical operating performance – Stable, predictable cash flow and operating results – Reasonable growth potential – Strong equity sponsorship – Appropriate capital structure for business risks and operating performance characteristics – Appropriate structural protection, rights and remedies for position in capital structure Target industry sectors with defensive orientation Credit Selection Strong business franchise with sustainable competitive advantage Consistent, predictable cash flow and reasonable enterprise valuation Appropriate capital structure with sufficient new cash equity (LTV and Min. Equity) Management team and sponsor with track record and available capital to support transaction US Credit Markets Transaction structure (security position, covenants, rights and remedies) and pricing Credit Selection NewStar’s credit process combines a disciplined screening process with a conservative credit approach Credit policies and practices are based on a fundamental approach to credit selection and
management… |
 24 Business Model: Portfolio Strategy Diversification and Focus on Senior Debt Highly diversified portfolio by issuer and across industries Specialized teams focused on key industry segments: Media and Information Services Healthcare Energy Commercial Real Estate Defensively positioned Increased focus on senior debt, which now comprises >96% of overall portfolio Avoided covenant lite transactions Minimized 2 lien commitments Exited structured credit $2.0 billion (217 obligors) (1) Portfolio Strategy 1 All figures represents loans, gross nd Mfg - Cons. Non Durable, $151 , 7% Mfg - Cons. Durable, $34 , 2% Retail, $49 , 2% Restaurants, $86 , 4% Consumer Svcs, $22 , 1% Printing/Publishing, $141 , 7% Cable/Telecom, $58 , 3% Broadcasting, $44 , 2% Entertainment/Leisure, $36 , 2% Tech Svcs, $110 , 5% Environmental Svcs, $50 , 2% Marketing Svcs, $101 , 5% Other Business Svcs, $121 , 6% Energy/Chemical Svcs, $139 , 7% Auto/Transportation, $38 , 2% Industrial/Other, $143 , 7% Healthcare, $208 , 10% Building Materials, $62 , 3% Financial Services, $79 , 4% Commercial - Non-Mortgage, $24 , 1% Consumer - Non-Mortgage, $16 , 1% CRE-Office, $174 , 9% CRE - Multi -Family, $65 , 3% CRE-Industrial, $42 , 2% CRE-Retail, $25 , 1% CRE-Other, $15 , 1% Commercial Real Estate 16% Consumer / Retail 16% Media 14% Business Services 18% Industrial (Other) 16% Structured Products 2% |
 Financial Performance |
 26 Financial Results Summary of Q4 2009 December 31, September 30, December 31, ($ in thousands, except per share amounts) 2009 2009 2008 Net income (loss) $ (13,405) $ (10,262) $ 2,754 After tax adjustments to net income (loss): IPO related compensation and benefits expense (1) 1,872 915 2,102 Loss on assets sold and retained residual interest (2) - - 258 Adjusted net income (loss) $ (11,533) $ (9,347) $ 5,114 Net income (loss) per share: Basic $ (0.27) $ (0.21) $ 0.06 Diluted $ (0.27) $ (0.21) $ 0.06 Weighted average shares outstanding: Basic 49,349,508 49,173,245 48,510,697 Diluted 49,349,508 49,173,245 48,510,697 Adjusted net income (loss) per share: Basic $ (0.23) $ (0.19) $ 0.11 Diluted $ (0.23) $ (0.19) $ 0.11 Adjusted weighted average shares outstanding: Basic 49,349,508 49,173,245 48,510,697 Diluted 49,349,508 49,173,245 48,510,697 Three Months Ended (1) Non-cash compensation charge related to restricted stock grants made since our
inception as a private company, including equity awards made in connection with the initial public offering. (2) Loss and expenses incurred in connection with the sale of assets comprised of 50 debt
securities and two loans during Q2 2007, permanent impairments on these assets, the change in fair value of the residual interest
in these assets, and the impact on the effective tax rate. The change in effective tax rate was applied retrospectively. |
 27 Financial Results Q4 2009 Income Statement (1) Non-cash compensation charge related to restricted stock grants made since our
inception as a private company, including equity awards made in connection with
the initial public offering. (2) Loss and expenses incurred in connection with the sale of assets comprised of 50 debt
securities and two loans during Q2 2007, permanent impairments on these assets,
the change in fair value of the residual interest in these assets, and the impact on the effective tax rate. The change in effective tax rate was applied retrospectively. December 31, September 30, December 31, ($ in thousands) 2009 2009 2008 Net interest income: Interest income $ 31,943 $ 33,675 $ 45,845 Interest expense 7,553 9,197 21,445 Net interest income 24,390 24,478 24,400 Provision for credit losses 39,032 32,577 17,930 Net interest income after provision for credit losses (14,642) (8,099) 6,470 Non-interest income: Fee income 415 388 866 Asset management income 716 758 1,457 Gain (loss) on derivatives 41 126 1,366 Gain (loss) on sale of loans and debt securities - - (1) Loss on investments in debt securities - - (1) Other income (expense) 3,274 (1,139) 4,958 Total non-interest income 4,446 133 8,645 Operating expenses: Compensation and benefits 6,512 7,578 4,172 Occupancy and equipment 791 769 718 General and administrative expenses 2,257 2,580 3,054 Total operating expenses 9,560 10,927 7,944 Income (loss) before income taxes (19,756) (18,893) 7,171 Income tax expense (benefit) (6,405) (6,957) 4,417 Net income (loss) before noncontrolling interest (13,351) (11,936) 2,754 Net (income) loss attributable to noncontrolling interest (54) 1,674 - Net income (loss) $ (13,405) $ (10,262) $ 2,754 After tax adjustments to net income (loss): IPO related compensation and benefits expense(1) 1,872 915 2,102 Loss on assets sold and retained residual interest(2) - - 258 Adjusted net income (loss) $ (11,533) $ (9,347) $ 5,114 Three Months Ended |
 28 Financial Results Q4 2009 Balance Sheet December 31, September 30, December 31, ($ in thousands) 2009 2009 2008 Assets: Cash and cash equivalents $ 39,848 $ 31,128 $ 50,279 Restricted cash 136,884 109,618 84,163 Investments in debt securities, available-for-sale 4,183 3,859 3,025 Loans held-for-sale 15,736 3,072 - Loans, net 1,878,978 2,041,087 2,328,812 Deferred financing costs, net 18,557 19,219 21,003 Interest receivable 7,949 8,442 10,608 Property and equipment, net 976 976 1,252 Deferred income taxes, net 56,449 56,863 31,238 Income tax receivable 7,260 603 - Other assets 33,252 32,703 41,142 Total assets $ 2,200,072 $ 2,307,570 $ 2,571,522 Liabilities: Credit facilities $ 91,890 $ 135,742 $ 411,267 Term debt 1,523,052 1,567,864 1,524,171 Accrued interest payable 2,774 3,408 9,773 Income tax payable - - 353 Accounts payable 645 386 1,049 Other liabilities 31,591 38,660 43,354 Total liabilities 1,649,952 1,746,060 1,989,967 NewStar Financial, Inc. stockholders’ equity 546,062 557,506 581,555 Noncontrolling interest 4,058 4,004 - Total stockholders' equity 550,120 561,510 581,555 Total liabilities and stockholders’ equity $ 2,200,072 $ 2,307,570 $ 2,571,522 |
 29 Financial Results Improving Credit Outlook May Signal Peak in Allowance for Loan Losses Allowance for credit losses increased 13.2% to $114.5 million, or 5.68% of loans as of
December 31, 2009 compared to $101.1 million or 4.69% of loans as September
30, 2009 Non-accruing loans were $162.7 million as of December 31, 2009
compared to $147.6 million as of September 30, 2009 New specific reserves
totaling $40.0 million were established in Q4 ‘09 compared to $33.3 million for Q3 ‘09 Other real estate owned was $9.4 million as of 12/31/09 Net charge-offs were $25.7 million or 5.06% of loans on an annualized basis for Q4 09, compared to $17.8 million or 3.27% of loans on an annualized basis for Q3 09. Net charge-offs for the full year in
2009 were 3.61% of loans. Improving credit outlook may signal peak in
provision expense and allowance for loan losses, but levels of charge-offs and NPAs are expected to remain elevated for several quarters Credit Metrics Allowance for credit losses December 31, September 30, December 31, 2009 2009 2008 Three Months Ended Balance as of beginning of period 101,117 $ 86,340 $ 44,933 $ General provision for credit losses (1,002) (703) 4,726 Specific provision for credit losses 40,034 33,280 13,204 Net charge offs (25,679) (17,800) (8,886) Balance as of end of period 114,470 $ 101,117 $ 53,977 $ Delinquent loan rate (at period end) 6.15 % 6.91 % 0.69 % Delinquent loan rate for accruing loans 60 days or more past due (at period end) 0.99 1.69 - Non-accrual loan rate (at period end) 8.08 6.84 2.52 Non-performing asset rate (at period end) 8.55 7.08 2.82 Annualized net charge off rate (end of period loans) 5.06 3.27 1.47 Annualized net charge off rate (average period loans) 4.82 3.18 1.46 Allowance for credit losses ratio (at period end) 5.68 4.69 2.25 |
 Funding
Model |
     31 Business Model: Funding Wholesale model • 3-yr term funding provided by banks for static pools • Self amortizing – repaid from principal collections • Advance rates of 65–75% • L+175-375bps • Collateralized Loan Obligations (CLOs) • NEWS retains equity – consolidated on balance sheet • Non-recourse • Reinvestment capacity • Approx. L+54bps blended cost of funds • 91% advance rate (D/E: 10x) • Equity used to capitalize financing subsidiaries and partially fund new loan
origination • Approximately 22% Tangible Equity to Total Assets • Initially funded by $210 million of private equity • Raised gross proceeds of $235 million in IPO (Nasdaq: NEWS) • Raised gross proceeds of $125 million in private placement of common stock Banks • Advances used to partially fund new loan origination • Repaid from proceeds of term debt securitizations • Advance rates down to 50% (D/E: 1.0x) from peak of 75-80% (D/E: 3-4.0x) • Cost of funds increased from low of L+60bps to L+250-450bps • Borrowing capacity down to approx. $100 million from peak of $900 million • Limited recourse • Renewed annually Banks |
 32 Funding Platform Strengthened by Recent Financings Completed $275 million CLO scheduled to mature on July 30, 2018 Repaid all outstanding borrowings under Deutsche Bank term facility with proceeds from new CLO Entered into a note agreement with an institutional investor establishing $75 million revolving credit facility with a maturity date of July 5, 2013 Reduced refinancing risk by renewing Citi warehouse line until November 2010 Increased unrestricted cash position to $40 million Maintained reinvestment capacity in two existing CLOs (CLO II and III) at attractive ‘locked-in’ spreads Protecting the Balance Sheet Funding Sources 1 Funding Profile 1 As of 12/31/2009 Cash Position 1 Pro forma for closing of Revolving Credit Notes and CLO IV (2009-1) Warehouse Credit Facilities $211 million Term Debt $1.6 billion Equity $546 million Total: $2.5 billion Corporate Debt $75 million $130 $150 $349 $500 $588 $275 $50 $11 $130 $75 Short Term <1 yr Medium Term 1-3 yrs Long Term >3 yrs Unrestricted Cash $ 39.8 Restricted Cash Pledged to Credit Facilities & CLOI 38.2 Restricted Cash Available for Debt Service 51.8 Restricted Cash for Reinvestment 37.6 Restricted Cash Held in Escrow 9.3 Total Restricted Cash 136.9 Total Cash $ 176.7 |
 Management Biographies |
 34 Management Biographies Timothy J. Conway – Chief Executive Officer and Director Timothy J. Conway is our Chief Executive Officer and President and was elected to serve
as Chairman of our Board of Directors in September 2006. He has been our
Chief Executive Officer and President and has served on our Board of Directors since our inception in June 2004. From July 2002 to June 2004, Mr. Conway worked full-time on our
founding. From 1996 to July 2002, Mr. Conway was a Managing Director at
FleetBoston Financial Corporation or its predecessors responsible for Corporate Finance and Capital Markets. From 1987 to 1996, Mr. Conway held various senior management positions at Citicorp
Securities, Inc. He was a Managing Director and Senior Securities Officer
and was responsible for the bank’s private placement, loan syndication and acquisition finance businesses. Mr. Conway received his undergraduate degree from Fairfield University and his masters
of business administration from the University of Connecticut. Peter A. Schmidt-Fellner – Chief Investment Officer Peter A. Schmidt-Fellner has served as our Chief Investment Officer since our inception in 2004 and is a Director
Nominee. From 1993 to 2003, Mr. Schmidt-Fellner was at JPMorgan Securities, Inc. and its various subsidiaries and predecessor institutions, where during his tenure, he was responsible for High Yield Bond Sales, Trading and Research, Loan Trading and Co-Head of High Yield Bond Capital Markets. Mr. Schmidt-Fellner received his undergraduate degree from Colby College and his masters in business administration from the Tuck School of Business at Dartmouth. John Kirby Bray – Chief Financial Officer John K. Bray has served as our Chief Financial Officer since January 2005. From April
2004 to October 2004, Mr. Bray was the Business Financial Officer at Bank
of America. From August 1979 to April 2004, Mr. Bray held various positions at FleetBoston Financial Corporation or its predecessors, most recently as Director of Finance — Line of Businesses. Mr. Bray received his undergraduate degree from the College of the Holy Cross and his masters of business
administration from the University of Hartford. |
 35 Management Biographies John J. Frishkopf – Managing Director, Treasurer and Head of Asset Management John J. Frishkopf has served as a Managing Director and Treasurer/Head of Asset Management since our
inception in 2004. From February 1999 to June 2004, he was a Managing
Director of Milford Associates, LLC, a turnaround and corporate restructuring advisory firm, which he founded in 1999. Mr. Frishkopf received his undergraduate degree from the Massachusetts Institute of Technology and his masters of science in management from the Sloan School of Management at the Massachusetts Institute of Technology. J. Daniel Adkinson – Head of Commercial Real Estate J. Daniel Adkinson has served as a Managing Director and Head of our Commercial Real Estate group since
our inception in 2004. From October 1994 to June 2004, he was a portfolio manager at JP Morgan Fleming Asset Management where he worked in both the Fixed Income and Real Estate Investment groups. From 2001 to 2004, Mr. Adkinson served as a member of the Board of Directors and of the Compensation Committee of ARCap REIT, Inc. and its predecessor company. He is an adjunct assistant professor at the Graduate School of Business of Columbia University. Mr. Adkinson received his undergraduate degree from Williams College. Robert T. Clemmens – Chief Credit Officer, Middle Market Robert T. Clemmens has served as a Chief Credit Officer since our inception in 2004 with responsibility
for our Middle Market Corporate and Structured Products groups. From October 2002 to February 2004, Mr. Clemmens was at Tacitus Capital Management, a hedge fund, where he most recently served as Executive Vice President
concentrating on fixed income research. From 1981 to 2002, he held various
positions at Barclays Capital, most recently as a Managing Director and Head of Risk Management for the Americas. Mr. Clemmens received his undergraduate degree from Laurentian University and his masters in business administration from York University. |
 36 Management Biographies David R. Dobies – Managing Director, Middle Market David R. Dobies has served as a Managing Director and Co-Head of our Middle Market Corporate group
since our inception in 2004. From 1995 to 2004, Mr. Dobies served in various capacities at FleetBoston Financial Corporation or its predecessors,
most recently as Managing Director and Head of the Media, Entertainment and Sports Finance syndication businesses. Mr. Dobies received his undergraduate degree from Villanova University and his masters in business
administration from the William E. Simon School of Business at the
University of Rochester. Robert K. Brown – Head of Strategy and Corporate Development Robert Brown serves as Head of Strategy and Corporate Development. He also serves as a
member of firm’s management committee and is responsible for Investor Relations. Prior to joining the firm, Mr. Brown was head of Sales Planning & Performance Management for the Global Wealth & Investment Management Division of
Bank of America. Prior to that, Mr. Brown served as head of strategy and business development for Bank of America’s Commercial Finance Division. Mr. Brown joined Fleet Financial Group in 1992 and served in various roles of increasing responsibility in the
company’s commercial banking and capital markets
businesses. Mr. Brown received his undergraduate degree from the University of Vermont and his masters of business administration from the University of Rhode Island. Scott Poirier – Managing Director, Sales & Trading R. Scott Poirier has served as a Managing Director and Head of Sales and Trading since our inception in 2004. From October 2002 to June 2004, Mr. Poirier worked full-time on our founding. From March 1997 to
October 2002, Mr. Poirier was employed by FleetBoston Financial Corporation
or its predecessors where he most recently served as a Managing Director and Group Head of the European Debt Capital Markets Group in London. Mr. Poirier received his
undergraduate degree from the United States Military Academy at West Point
and his masters in business administration from Yale University. |
 37 Board of Directors Biographies Richard E. Thornburgh – Vice Chairman of Corsair Investments LLC In February 2006, Mr. Thornburgh joined Corsair Capital LLC as a partner. From 1976 until December 2005, he held several positions at the Credit Suisse Group and its various subsidiaries and predecessor institutions, most recently as Executive Vice Chairman and Member of the Credit Suisse Group Executive Board. He currently serves on the Board of Directors of the Credit Suisse Group and is on its Risk Committee. He also serves on the Board of Directors of Dollar General Corporation and is on its
Finance Committee and Strategic Planning Committee. Mr. Thornburgh received
his undergraduate degree from the University of Cincinnati and his masters in business administration from Harvard University College of Business Administration. Charles N. Bralver – Senior Associate Dean for International Business and Finance at the Fletcher School at Tufts University Charles N. Bralver joined our Board of Directors in 2009. Mr. Bralver is the Senior Associate Dean for International Business and Finance at the Fletcher School at Tufts University, was a founding partner and Vice Chairman of
Oliver, Wyman & Co., and has served as a Strategic Advisor at Warburg
Pincus, LLC. T. Kimball Brooker Jr. – Senior Vice President of Arnhold and S. Bleichroeder Advisers, LLC T. Kimball Brooker, Jr. has served on our Board of Directors since our inception in 2004. Since January 2009, he has served as a Senior Vice President of Arnhold and S. Bleichroeder Advisers, LLC, an asset management firm headquartered in New York. From August 1998 through November 2008, he was employed by, or a partner of, Corsair Capital LLC (and/or its
current or prior affiliates including J.P. Morgan Chase & Co. with whom Corsair was affiliated until it separated from J.P. Morgan Chase & Co. in March 2006). Mr. Brooker is also a Director of Insurance Revolution, Inc., SPARTA Insurance and Barbara Oil Company. Mr. Brooker received his undergraduate degree from Yale University and his masters in business administration from Harvard Business
School. Maureen P. O’Hara – Finance professor at the Johnson Graduate School of Management, Cornell University Maureen O'Hara is the Robert W. Purcell Professor of Finance at the Johnson Graduate
School of Management, Cornell University, where she joined the faculty in
1979. She has had visiting appointments at UCLA, the London Business School, the University of New South Wales, Cambridge University, and Hong Kong University of Science and Technology. She has served
as President of the Western Finance Association and recently served as
President of the American Finance Association. Ms. O'Hara currently serves on the Board of Directors of Investment Technology Group, Inc., where she has been lead director since January 2005
and where she has served on the Compensation Committee, Audit Committee and
Nominating Committee. Ms. O'Hara received her undergraduate degree from the University of Illinois and her masters of science in economics and Ph.D. in finance from Northwestern
University. |
 38 Brian L.P. Fallon – Partner of O'Conner Capital Partners Brian L.P. Fallon is a Partner of O'Conner Capital Partners. Prior to joining O'Conner
Capital Partners in September of 2007, Mr. Fallon was a Managing Director and Principal of Extell Development Company from 2002-2007. From 1982-2002, Mr. Fallon held numerous
positions at Meredith & Grew, Inc. and served on the Board of Directors.
Mr. Fallon is involved in various non-profit boards and activities and currently serves as a Director on the Advisory Council of the Robert F. Kennedy Children's Action Corps as well as The Community Builders, Inc. Mr. Fallon received his undergraduate degree from Siena College and his masters in public administration from the Maxwell School at Syracuse University. Bradley E. Cooper – Partner of Capital Z Partners Management, LLC Bradley E. Cooper is a Partner of Capital Z Partners Management, LLC, the successor to Capital Z Management, LLC (which he joined as a founding Partner in July 1998). He previously held similar positions at Insurance
Partners, L.P. and International Insurance Advisors, L.P. Mr. Cooper serves on the board of directors of MountainView Capital Holdings, LLC and Argo Group International Holdings Ltd. and is a member of Argo's Investment Committee. Mr. Cooper received an undergraduate degree from
the University of Michigan. Frank R. Noonan – Former CFO of Unum Corporation and CEO of R.H. Donnelly Co. From August 1991 through May 2002, Frank R. Noonan was the Chief Executive Officer of R.H. Donnelley Co. He also served as President of R.H. Donnelley Co. from August 1991 to July 1998 and was Chairman from July 1998 through May 2002. From May 1989 to August 1991, Mr. Noonan served as Senior Vice President, Finance, with Dun & Bradstreet, the former parent company of R.H. Donnelley Co., and was a member of its Board of Directors in 1998. Prior to joining Dun & Bradstreet, Mr. Noonan served as Chief Financial Officer and Senior Vice President at Unum Corporation from July 1981 to December 1989.He currently is a Director and member of the Audit Committee of Avnet, Inc. and was previously a Director and member of the Audit Committee of Toys "R" Us, Inc. Mr. Noonan received his undergraduate degree from the University of New Hampshire. Board of Directors Biographies |