Attached files
Table of Contents
UNITED STATES
SECURITIES AND EXCHANGE COMMISSION
Washington, D.C. 20549
FORM 10-K
| x | ANNUAL REPORT PURSUANT TO SECTION 13 OR 15(d) OF THE SECURITIES EXCHANGE ACT OF 1934 |
For the fiscal year ended December 31, 2010
OR
| ¨ | TRANSITION REPORT PURSUANT TO SECTION 13 OR 15(d) OF THE SECURITIES EXCHANGE ACT OF 1934 |
For the transition period from to
Commission file number 001-33211
NewStar Financial, Inc.
(Exact name of registrant as specified in its charter)
| Delaware | 54-2157878 | |
| (State or other jurisdiction of incorporation or organization) |
(I.R.S. Employer Identification No.) | |
| 500 Boylston Street, Suite 1250, Boston, MA | 02116 | |
| (Address of principal executive offices) | (Zip Code) | |
Registrant’s telephone number, including area code: (617) 848-2500
Securities registered pursuant to Section 12(b) of the Act:
| Title of each class |
Name of each exchange on which registered | |
| Common Stock, par value $0.01 per share | The NASDAQ Global Market |
Securities registered pursuant to Section 12(g) of the Act:
None
Indicate by check mark if the registrant is a well-known seasoned issuer, as defined in Rule 405 of the Securities Act. Yes ¨ No x
Indicate by check mark if the registrant is not required to file reports pursuant to Section 13 or Section 15(d) of the Act. Yes ¨ No x
Indicate by check mark whether the registrant (1) has filed all reports required to be filed by Section 13 or 15(d) of the Securities Exchange Act of 1934 during the preceding 12 months (or for such shorter period that the registrant was required to file such reports), and (2) has been subject to such filing requirements for the past 90 days. Yes x No ¨
Indicate by check mark whether the registrant has submitted electronically and posted on its corporate website, if any, every Interactive Data File required to be submitted and posted pursuant to Rule 405 of Regulation S-T (§232.405 of this chapter) during the preceding 12 months (or for such shorter period that the registrant was required to submit and post such files). Yes ¨ No ¨
Indicate by check mark if disclosure of delinquent filers pursuant to Item 405 of Regulation S-K is not contained herein, and will not be contained, to the best of the registrant’s knowledge, in definitive proxy or information statements incorporated by reference in Part III of this Form 10-K or any amendment to this Form 10-K x
Indicate by check mark whether the registrant is a large accelerated filer, an accelerated filer, a non-accelerated filer or a smaller reporting company. See the definitions of “accelerated filer”, “large accelerated filer” and “smaller reporting company” in Rule 12b-2 of the Exchange Act.
| Large Accelerated Filer ¨ |
Accelerated Filer x | Non-Accelerated Filer ¨ | Smaller reporting company ¨ |
Indicate by check mark whether the registrant is a shell company (as defined in Rule 12b-2 of the Exchange Act). Yes ¨ No x
As of June 30, 2010 the last business day of our most recently completed second fiscal quarter, the aggregate market value of the voting stock held by non-affiliates was $179,509,416, based on the number of shares held by non-affiliates of the registrant as of June 30, 2010, and based on the reported last sale price of common stock on June 30, 2010. This calculation does not reflect a determination that persons are affiliates for any other purposes.
As of March 2, 2011, 50,516,816 shares of common stock, par value of $0.01 per share, were outstanding.
DOCUMENTS INCORPORATED BY REFERENCE
Portions of the Registrant’s Definitive Proxy Statement to be filed with the Securities and Exchange Commission (“SEC”) pursuant to Regulation 14A under the Securities Exchange Act of 1934, as amended (the “Exchange Act”), relating to the Registrant’s Annual Meeting of Stockholders scheduled to be held May 11, 2011 are incorporated by reference into Part III of this Form 10-K. With the exception of the portions of the Proxy Statement specifically incorporated herein by reference, the Proxy Statement is not deemed to be filed as part of this Form 10-K.
Table of Contents
| Page | ||||||
| PART I | ||||||
| Item 1. |
Business | 2 | ||||
| Item 1A. |
12 | |||||
| Item 1B. |
23 | |||||
| Item 2. |
23 | |||||
| Item 3. |
23 | |||||
| Item 4. |
23 | |||||
| PART II | ||||||
| Item 5. |
Market for Registrant’s Common Equity, Related Stockholder Matters and Issuer Purchases of Equity Securities | 24 | ||||
| Item 6. |
26 | |||||
| Item 7. |
Management’s Discussion and Analysis of Financial Condition and Results of Operations |
29 | ||||
| Item 7A. |
57 | |||||
| Item 8. |
58 | |||||
| Item 9. |
Changes in and Disagreements with Accountants on Accounting and Financial Disclosure |
102 | ||||
| Item 9A. |
102 | |||||
| Item 9B. |
102 | |||||
| PART III | ||||||
| Item 10. |
Directors, Executive Officers and Corporate Governance | 103 | ||||
| Item 11. |
104 | |||||
| Item 12. |
Security Ownership of Certain Beneficial Owners and Management and Related Stockholder Matters |
104 | ||||
| Item 13. |
Certain Relationships and Related Transactions, and Director Independence |
104 | ||||
| Item 14. |
104 | |||||
| PART IV | ||||||
| Item 15. |
105 | |||||
| 106 | ||||||
1
Table of Contents
Forward-Looking Statements
Statements in this Annual Report about our anticipated financial condition, results of operations, and growth, as well as about the future development of our products and markets and the future performance of the financial markets in general, are forward-looking statements. You can identify forward-looking statements by the fact that they do not relate strictly to historical or current facts. They may include words such as “anticipate,” “estimate,” “expect,” “project,” “plan,” “intend,” “believe,” “may,” “should,” “can have,” “likely” and other words and terms of similar meaning in connection with any discussion of the timing or nature of future operating or financial performance or other events and circumstances. These forward-looking statements are based on assumptions that we have made in light of our industry experience and on our perceptions of historical trends, current conditions, expected future developments and other factors. As you read this Annual Report, you should understand that these statements are not guarantees of performance or results. They involve risks and uncertainties that are beyond our control. Important information about the bases for our assumptions and factors that may cause our actual results and other circumstances to differ materially from those described in the forward-looking statements are discussed in Item 1A. “Risk Factors” and generally throughout this Annual Report.
| Item 1. | Business |
Corporate History and Information
NewStar Financial, Inc. (which is referred to throughout this Annual Report as “NewStar”, “the Company”, “we” and “us”) was founded in June 2004 by a team of experienced bankers and capital markets executives. On December 14, 2006, our common stock began trading on the NASDAQ Global Market, and on December 19, 2006 we completed the initial public offering of our common stock.
We are a Delaware corporation. Our principal executive office is located at 500 Boylston Street, Suite 1250, Boston, Massachusetts 02116, and our telephone number is (617) 848-2500. We maintain a website at www.newstarfin.com.
Overview
We are a specialized commercial finance company focused on meeting the complex financing needs of companies and private investors in the middle market. We principally focus on the direct origination of loans and leases that meet our risk and return parameters. Our direct origination efforts target mid-sized companies, private equity sponsors, corporate executives, regional banks, real estate investors and a variety of other financial intermediaries to source transaction opportunities. Direct origination provides direct access to our customers’ management, enhances our due diligence, and allows significant input into our customers’ capital structure and direct negotiation of transaction pricing and terms. We also participate in loan syndications as a member of a lending group. We employ highly experienced origination, credit and finance professionals to identify and structure our transactions. We believe that the quality of our professionals, their ability to develop creative solutions and our efficient, comprehensive credit approval process position us to be a preferred lender for mid-sized borrowers.
We specialize in providing a range of senior secured debt financing options to mid-sized companies to fund working capital, growth strategies, acquisitions and recapitalizations, as well as, equipment purchases. Our loans and other debt products typically range in size from $5 million to $20 million. We also selectively arrange larger transactions, which we may hold on our balance sheet or syndicate to the NewStar Credit Opportunities Fund, Ltd. (the “NCOF”), a private debt fund, and other third-parties, thereby allowing us to provide more debt capital to our customers and generate fee income while limiting our exposure. From time to time our balance sheet exposure to certain loans and other debt products may exceed $20 million.
2
Table of Contents
We operate as a single segment, and we derive revenues from four national lending groups:
| • | Leveraged Finance, which originates, structures and underwrites senior debt and, to a lesser extent, second lien, mezzanine and subordinated debt, and equity and other equity-linked products for companies with annual EBITDA typically between $5 million and $50 million; |
| • | Real Estate, which originates, structures and underwrites first mortgage debt and, to a lesser extent, subordinated debt, primarily to finance acquisitions of commercial real estate properties typically valued between $10 million and $50 million; |
| • | Business Credit, which originates, structures and underwrites senior asset-based loans for companies with sales typically totaling between $25 million and $500 million; and |
| • | Equipment Finance, which originates, structures and underwrites leases and lease lines for capital expenditures for companies with annual sales of at least $25 million. |
As of December 31, 2010, our portfolio of loans and other debt products, which we refer to as our loan portfolio, totaled approximately $2.0 billion of funding commitments, representing $1.7 billion of balances outstanding and $0.3 billion of funds committed but undrawn. We finance our loan portfolio through a combination of debt and equity.
As of December 31, 2010, we classify our portfolio as 80% Leveraged Finance, 16% Real Estate and 4% Business Credit, and senior debt constituted 97% of our portfolio. We launched our Equipment Finance group in January 2011 and as such, we did not have any equipment finance leases as of December 31, 2010.
We manage the NCOF, which has the opportunity to invest in loans and other debt products originated or acquired by us. The NCOF raised $150.0 million of equity from third-party institutional investors and had a $400.0 million committed credit facility. As of December 31, 2010, the NCOF’s and NCOF CLO II’s (defined below) loan portfolio had total funding commitments and balances outstanding of approximately $476.2 million and $451.9 million, respectively. Our managed loan portfolio, which includes our loan portfolio and the loan portfolio of the NCOF, totaled approximately $2.5 billion of commitments and $2.2 billion of balances outstanding as of December 31, 2010.
On December 17, 2007, the NewStar Credit Opportunities Funding II (the “NCOF CLO II”) securitization closed. This securitization is a $560.0 million cash flow collateralized loan obligation managed by us. The NCOF CLO II is comprised of $450.0 million rated floating rate notes, of which $161.0 million benefit from a financial guaranty. The NCOF CLO II permits reinvestment of collateral principal repayments for a five-year period ending in December 2012. The NCOF CLO II assets include a diversified portfolio of primarily senior secured corporate loans.
Recent Developments
Acquisition
On November 1, 2010, we acquired Core Business Credit, LLC, an asset-based lender located in Dallas, Texas with outstanding loans totaling $73.4 million as of October 31, 2010, and its wholly-owned subsidiaries (“Core”) for a purchase price of $25.3 million. We recognized a gain of $5.6 million in connection with the acquisition. In conjunction with the acquisition, we became a party to an existing $225 million revolving credit facility with DZ Bank AG Deutsche Zentral-Genossenschaftsbank Frankfurt for financing asset-based loans.
New Business Initiative
We launched our Equipment Finance group in January 2011 to lease essential-use equipment for mid-sized companies. Concurrent with the acquisition of Core and the launch of the Equipment Finance group, we rebranded our business groups as Leveraged Finance, Real Estate, Business Credit, and Equipment Finance.
3
Table of Contents
Liquidity
On January 25, 2011, we entered into a note purchase agreement with Wells Fargo Bank, National Association (Wells Fargo). Under the terms of the note purchase agreement, Wells Fargo agreed to provide a $75 million revolving credit facility to fund new equipment lease origination. The credit facility is scheduled to mature four years after the initial advance under the credit facility.
On February 14, 2011, we amended our credit facility with Citicorp North America, Inc. (“Citicorp”), which extended the facility’s maturity date to June 15, 2011 with a bullet maturity payment due at that time. Advances may be made at 28% of the borrowing base up to $10.0 million and may only be used to fund existing revolving loans.
Stock Repurchase Program
On January 25, 2010, we announced that our Board of Directors has authorized the repurchase of up to $10 million of the Company’s common stock from time to time on the open market or in privately negotiated transactions through January 22, 2011. On December 3, 2010, we completed the repurchase of $10 million of the Company’s common stock under that program.
Lending Groups
Our lending activities are organized into four specialized lending groups: Leveraged Finance, Business Credit, Real Estate, and Equipment Finance.
Leveraged Finance
Our Leveraged Finance group provides senior secured, and to a lesser extent, senior subordinated, second lien, mezzanine and subordinated debt, and equity and other equity-linked products to companies with annual EBITDA typically between $5 million and $50 million, the proceeds of which are primarily used for acquisition financing, growth and working capital, recapitalization and other purposes. Our Leveraged Finance group also originates senior debt for larger middle market companies with assets generally between $25 million and $250 million, primarily to fund asset growth.
We source our loans primarily through direct origination efforts by our bankers. Our bankers establish and maintain relationships with mid-sized companies, private equity firms, corporate executives, regional banks, other non-bank “club” lenders, mid-sized consumer and commercial finance companies, and investment and commercial banks. We also source debt products by participating with other lenders in syndicated transactions.
We target selected industries where we have significant lending and underwriting experience, including:
| • | healthcare; |
| • | manufacturing and industrial; |
| • | financial services; |
| • | energy/chemical services; |
| • | printing/publishing; |
| • | consumer, retail and restaurants; and |
| • | business services. |
We currently provide senior and subordinated debt products, including revolving credit facilities, amortizing loans, term loans and debt securities secured by a variety of business assets. We also continue to manage the $6.3
4
Table of Contents
million of assets remaining in our structured products loan portfolio as part of our Leveraged Finance group although we no longer originate new structured product loans.
Our loans and other debt products, which may be part of larger credit facilities, typically range in size from $5 million to $20 million. In certain cases our loans and debt products may exceed $20 million. We also have the ability to arrange significantly larger transactions which we syndicate to others. As a result of that syndication activity, our balance sheet exposure to certain loans and other debt products may exceed $20 million from time to time as reflected in “Loans held-for-sale” which are amounts in excess of our target position. Our loans and other debt products typically mature in two to six years and require monthly or quarterly interest payments at variable rates based on a spread to LIBOR or the prime rate; however, some of our loans are fixed rate.
In determining our corporate borrowers’ ability to repay the loan, we consider several factors, including the borrowers’:
| • | equity sponsorship and capital structure; |
| • | management strength and experience; |
| • | market position; |
| • | historical and projected profitability; |
| • | balance sheet strength and liquidity; |
| • | ability to withstand competitive challenges; and |
| • | relationships with customers and suppliers. |
Borrowers are typically subject to a number of financial covenants during the term of the loan. These covenants generally may include one or more of the following:
| • | maximum ratio of senior debt and total debt to EBITDA; |
| • | minimum level of EBITDA; |
| • | minimum fixed charge coverage; |
| • | minimum interest coverage; and |
| • | limits on capital expenditures and distributions. |
As of December 31, 2010, our Leveraged Finance loan portfolio totaled $1.6 billion in funding commitments and $1.4 billion in balances outstanding, representing 80.0% of our loan portfolio. This represented 164 transactions with an average balance outstanding of approximately $8.5 million. During 2010, we originated $348.5 million of Leveraged Finance loans. Additionally, we originated $197.7 million for the NCOF during 2010.
Real Estate
Our Real Estate group originated, structured and underwrote first mortgage and, to a lesser extent, senior subordinated asset-based debt primarily to finance the acquisition of commercial real estate properties typically valued between $10 million and $50 million.
We sourced our commercial real estate loans and other debt products primarily through property investors, specialized commercial real estate brokers, regional banks and other financial intermediaries.
Our commercial real estate loans typically provide capital for the following purposes:
| • | acquisition; |
5
Table of Contents
| • | lease-up; |
| • | repositioning and build-out; and |
| • | refinancing and recapitalization. |
We have a selective regional focus on property types where we have significant lending and underwriting experience, including:
| • | office; |
| • | multi-family; |
| • | retail; and |
| • | industrial. |
Our loans and other debt products typically range in size from $5 million to $20 million. Although we generally limit loan sizes to $17.5 million, our exposure to certain loans and other debt products may exceed $20 million from time to time. Our loans and other debt products typically mature in two to five years and require monthly or quarterly interest payments at variable rates based on a spread to LIBOR or the prime rate; however, some of our loans are fixed rate.
For our commercial real estate loans, we perform due diligence that includes reviewing:
| • | sponsor’s history, capital and liquidity, and portfolio of other properties; |
| • | the property’s historical and projected cash flow; |
| • | tenant creditworthiness; |
| • | the borrower’s plan for the subject property; |
| • | the property’s condition; |
| • | local real estate market conditions; |
| • | loan-to-value based on independent third-party appraisals; |
| • | borrower’s demonstrated operating capability and creditworthiness; |
| • | licensing and environmental issues related to the property and the borrower; and |
| • | borrower’s management. |
As of December 31, 2010 our Real Estate loan portfolio totaled $301.6 million in funding commitments and $282.6 million in balances outstanding, representing 16.2% of our loan portfolio. This represented 28 transactions with an average balance outstanding of approximately $10.1 million. During 2010, we did not originate any new commercial real estate loans. Funding new commercial real estate loans through the capital markets remained difficult in 2010, but we expect to originate new commercial real estate loans as market conditions improve. As of December 31, 2010, we had the ability to syndicate to the NCOF an additional $52.1 million of commercial real estate loans.
Business Credit
NewStar Business Credit targets potential asset-based lending transactions in the middle market to borrowers with sales typically between $25 million and $500 million. Our asset-based loans typically range in size from $5 million to $25 million. We also have the ability to arrange significantly larger transactions that we may syndicate to others.
6
Table of Contents
Our asset-based loans typically provide capital for the following purposes:
| • | working capital; |
| • | acquisition; |
| • | dividend recapitalizations; |
| • | refinancing and restructuring; |
| • | corporate growth; and |
| • | management buyouts. |
We target a variety of industries for our asset-based loans including:
| • | general manufacturing; |
| • | wholesale distribution; |
| • | business service; |
| • | retail; and |
| • | technology. |
Our asset-based products include the following:
| • | revolving lines of credit; and |
| • | senior secured term loans. |
Equipment Finance
We launched our Equipment Finance group in January 2011, and as such we did not have any outstanding leases as of December 31, 2010. Our Equipment Finance group includes a network of independent agents who operate under an agreement with us to originate new leases that meet our return objectives and credit standards. We provide an attractive equipment financing alternative for established mid-sized companies that have been hurt by a reduction in the availability of credit from banks and independent lessors sidelined by the credit crisis. We finance essential-use equipment for mid-sized businesses nationwide. Our Equipment Finance group offers traditional direct finance leases with various end-of-term options to fund the purchase of a wide range of equipment types, including manufacturing, technology, healthcare, and telecom equipment. Targeted transaction sizes range from $500,000 to $3 million, and we offer lease lines to meet customers’ needs for planned capital expenditures. We focus on companies with annual sales of at least $25 million across a broad array of industries, including business services, healthcare, telecommunications, financial services, education, retail and manufacturing.
Loans and Other Debt Products
First mortgage
Our first mortgage loans are provided by our Real Estate group and are secured by a mortgage bearing a first lien on the real property serving as collateral. Our first mortgage loans require borrowers to demonstrate satisfactory collateral value at closing through a third party property appraisal and typically contain provisions governing the use of property operating cash flow and disbursement of loan proceeds during the term of the loan.
As of December 31, 2010, first mortgage loans totaled $283.2 million in funding commitments and $264.2 million in balances outstanding, representing 15.1% of our loan portfolio.
7
Table of Contents
Senior secured asset-based
Our senior secured asset-based loans are provided by our Business Credit group, and to a lesser degree by our Leveraged Finance group, and are secured by a first-priority lien on tangible assets and have a first-priority in right of payment.
As of December 31, 2010, senior secured asset-based loans totaled $164.7 million in funding commitments and $73.8 million in balances outstanding, representing 4.2% of our loan portfolio.
Senior secured cash flow
Our senior secured cash flow loans are provided by our Leveraged Finance group. We underwrite these loans based on the cash flow, profitability and enterprise value of the borrower, with the value of any tangible assets as secondary protection. These loans are generally secured by a first-priority security interest in all or substantially all of the borrowers’ assets and, in certain transactions, the pledge of their common stock.
As of December 31, 2010, senior secured cash flow loans totaled $1.5 billion in funding commitments and $1.4 billion in balances outstanding, representing 77.7% of our loan portfolio.
Other
Our Other loans and debt products are categorized as $20.8 million of senior subordinated asset-based (which are equal as to collateral and subordinate as to right of payment to other senior lenders), $1.8 million of senior subordinated cash flow (which are equal as to collateral and subordinate in right of payment of principal and interest to other senior lenders), $29.0 million of second lien (which are second liens on all or substantially all of a borrower’s assets, and in some cases, junior in right of payment to senior lenders), and $0.7 million of mezzanine/subordinated (which are subordinated as to rights to collateral and right of payment to senior lenders).
Loan Portfolio Overview
The following tables present information regarding the outstanding balances of our loans and other debt products:
| December 31, | ||||||||||||||||||||||||
| 2010 | 2009 | 2008 | ||||||||||||||||||||||
| ($ in thousands) | ||||||||||||||||||||||||
| Composition Type |
||||||||||||||||||||||||
| First mortgage |
$ | 264,156 | 15.1 | % | $ | 306,075 | 15.0 | % | $ | 370,810 | 15.4 | % | ||||||||||||
| Senior secured asset-based |
73,764 | 4.2 | 26,463 | 1.3 | 40,969 | 1.7 | ||||||||||||||||||
| Senior secured cash flow |
1,356,805 | 77.7 | 1,621,816 | 79.6 | 1,884,862 | 78.2 | ||||||||||||||||||
| Other |
52,209 | 3.0 | 81,859 | 4.1 | 112,507 | 4.7 | ||||||||||||||||||
| Total |
$ | 1,746,934 | 100.0 | % | $ | 2,036,213 | 100.0 | % | $ | 2,409,148 | 100.0 | % | ||||||||||||
| December 31, | ||||||||||||
| 2010 | 2009 | 2008 | ||||||||||
| ($ in thousands) | ||||||||||||
| Composition by Lending Group |
||||||||||||
| Leveraged Finance |
$ | 1,396,934 | $ | 1,715,554 | $ | 2,016,447 | ||||||
| Real Estate |
282,610 | 320,659 | 392,701 | |||||||||
| Business Credit |
67,390 | — | — | |||||||||
| Total |
$ | 1,746,934 | $ | 2,036,213 | $ | 2,409,148 | ||||||
8
Table of Contents
| December 31, 2010 | ||||||||
| Percentage of Leveraged Finance |
Percentage of Loan Portfolio |
|||||||
| Leveraged Finance by Industry |
||||||||
| Healthcare |
14.2 | % | 11.3 | % | ||||
| Other business services |
10.8 | 8.6 | ||||||
| Manufacturing—consumer non-durable |
8.0 | 6.4 | ||||||
| Energy/Chemical services |
7.6 | 6.1 | ||||||
| Printing/Publishing |
7.6 | 6.0 | ||||||
| Industrial/Other |
7.1 | 5.7 | ||||||
| Marketing services |
6.2 | 4.9 | ||||||
| Financial services |
5.9 | 4.7 | ||||||
| Tech services |
5.2 | 4.2 | ||||||
| Restaurants |
5.1 | 4.1 | ||||||
| Cable/Telecom |
4.1 | 3.3 | ||||||
| Environmental services |
3.9 | 3.1 | ||||||
| Building materials |
3.6 | 2.9 | ||||||
| Broadcasting |
2.7 | 2.2 | ||||||
| Retail |
2.0 | 1.7 | ||||||
| Entertainment/Leisure |
1.7 | 1.3 | ||||||
| Manufacturing—consumer durable |
1.5 | 1.2 | ||||||
| Consumer services |
1.5 | 1.2 | ||||||
| Auto/Transportation |
1.3 | 1.1 | ||||||
| Total |
100.0 | % | 80.0 | % | ||||
| December 31, 2010 | ||||||||
| Percentage of Real Estate |
Percentage of Loan Portfolio |
|||||||
| Real Estate by Property Type |
||||||||
| Office |
54.3 | % | 8.8 | % | ||||
| Multi-family |
22.5 | 3.7 | ||||||
| Industrial |
9.4 | 1.5 | ||||||
| Retail |
8.8 | 1.4 | ||||||
| Other |
5.0 | 0.8 | ||||||
| Total |
100.0 | % | 16.2 | % | ||||
| December 31, 2010 | ||||||||
| Percentage of Business Credit |
Percentage of Loan Portfolio |
|||||||
| Business Credit by Industry |
||||||||
| Manufacturing—consumer non-durable |
32.3 | 1.2 | ||||||
| Marketing services |
25.4 | 1.0 | ||||||
| Retail |
18.1 | 0.7 | ||||||
| Building materials |
16.6 | 0.6 | ||||||
| Broadcasting |
5.0 | 0.2 | ||||||
| Entertainment/Leisure |
2.6 | 0.1 | ||||||
| Total |
100.0 | % | 3.8 | % | ||||
9
Table of Contents
The table below shows the final maturities of our loan portfolio as of December 31, 2010:
| Due in One Year or Less |
Due in One to Five Years |
Due After Five Years |
Total | |||||||||||||
| ($ in thousands) | ||||||||||||||||
| First mortgage |
$ | 102,817 | $ | 161,339 | $ | — | $ | 264,156 | ||||||||
| Senior secured asset-based |
19,874 | 53,890 | — | 73,764 | ||||||||||||
| Senior secured cash flow |
77,802 | 1,172,610 | 106,393 | 1,356,805 | ||||||||||||
| Other |
725 | 49,186 | 2,298 | 52,209 | ||||||||||||
| Total |
$ | 201,218 | $ | 1,437,025 | $ | 108,691 | $ | 1,746,934 | ||||||||
The table below shows the outstanding balances of fixed-rate and adjustable-rate loans and other debt products as of December 31, 2010:
| Fixed- Rate (1) |
Adjustable- Rate(2) |
Total | ||||||||||
| ($ in thousands) | ||||||||||||
| First mortgage |
$ | 19,030 | $ | 245,126 | $ | 264,156 | ||||||
| Senior secured asset-based |
4,285 | 69,479 | 73,764 | |||||||||
| Senior secured cash flow |
14,583 | 1,342,222 | 1,356,805 | |||||||||
| Other |
9,147 | 43,062 | 52,209 | |||||||||
| Total |
$ | 47,045 | $ | 1,699,889 | $ | 1,746,934 | ||||||
| (1) | As of December 31, 2010, we had purchased interest-rate protection products in the notional amount of $3.6 million against the $28.0 million of fixed-rate loans and other debt products outstanding. |
| (2) | As of December 31, 2010 we had interest rate floors on $956.9 million of adjustable-rate loans outstanding. |
Competition
Our markets are highly competitive and are characterized by competitive factors that vary based upon product and geographic region. We currently compete with a large number of financial services companies, including:
| • | specialty and commercial finance companies, including business development companies and real estate investment trusts; |
| • | private investment funds and hedge funds; |
| • | national and regional banks; |
| • | investment banks; and |
| • | insurance companies. |
The markets in which we operate are highly fragmented. We compete based on the following factors, which vary by industry, asset class and property types:
| • | the interest rates and other pricing and/or loan or other debt product terms; |
| • | the quality of our people and their relationships; |
| • | our knowledge of our customers’ industries and business needs; |
| • | the flexibility of our product offering; |
| • | the responsiveness of our process; and |
| • | our focus on customer service. |
10
Table of Contents
Regulation
Some aspects of our operations are subject to supervision and regulation by state and federal governmental authorities and may be subject to various laws and regulations imposing various requirements and restrictions, which, among other things:
| • | regulate credit granting activities, including establishing licensing requirements in some jurisdictions; |
| • | establish the maximum interest rates, finance charges and other fees we may charge our customers; |
| • | govern secured transactions; |
| • | require specified information disclosures to our customers; |
| • | set collection, foreclosure, repossession and claims handling customer procedures and other trade practices; |
| • | regulate our customers’ insurance coverage; |
| • | prohibit discrimination in the extension of credit and administration of our loans; and |
| • | regulate the use and reporting of information related to a customer’s credit experience. |
Many of our competitors are subject to more extensive supervision and regulation. If we were to become subject to similar supervision or regulation in the future, it could impact our ability to conduct our business.
Employees
As of December 31, 2010, we employed 82 people compared to 61 people at December 31, 2009. At December 31, 2010, our origination group had 20 employees, including 16 bankers who were either managing directors, directors or vice presidents, and 4 associates and analysts. Our credit organization had 25 employees, including 10 managing directors. Additionally, we employed 37 people who were involved in administrative roles. We believe our relations with our employees are good. We had 84 employees as of March 2, 2011.
Available Information
NewStar files Annual, Quarterly and Current Reports, proxy statements and other information with the Securities and Exchange Commission (SEC). These documents are available free of charge at www.newstarfin.com shortly after such material is electronically filed with or furnished to the SEC. In addition, NewStar’s codes of business conduct and ethics as well as the various charters governing the actions of certain of NewStar’s Committees of its Board of Directors, including its Audit Committee, Risk Policy Committee, Compensation Committee and its Nominating and Corporate Governance Committee, are available at www.newstarfin.com. References to our website are not intended to incorporate information on our website into this Annual Report by reference.
The public may read and copy any materials that we file with the SEC at the SEC’s Public Reference Room at 100 F Street, NE, Washington, DC 20549. The public may obtain information on the operation of the Public Reference Room by calling the SEC at 1-800-SEC-0330. The SEC maintains an Internet site that contains reports, proxy and information statements, and other information regarding issuers, including NewStar, that file electronically with the SEC, which is available at www.SEC.gov.
We will provide to any shareholder, upon request and without charge, copies of these documents (excluding any applicable exhibits unless specifically requested). Written requests should be directed to: Investor Relations, NewStar Financial, Inc., 500 Boylston St., Suite 1250, Boston, Massachusetts 02116.
11
Table of Contents
| Item 1A. | Risk Factors |
The following are important risks and uncertainties we have identified that could materially affect our future results. You should consider them carefully when evaluating forward-looking statements contained in this Annual Report and otherwise made by us or on our behalf because these contingencies could cause actual results and circumstances to differ materially from those projected in forward-looking statements. The Company’s actual future results and trends may differ materially depending on a variety of factors including, but not limited to, the risks and uncertainties discussed below. If any of those contingencies actually occurs, our business, financial condition and results of operations could be negatively impacted and the trading price of our common stock could decline.
Risks Related to Our Loan Portfolio and Lending Activities
We may not recover all amounts contractually owed to us by our borrowers resulting in charge-offs, impairments and non-accruals, which may exceed our allowance for credit losses and could negatively impact our financial results and our ability to secure additional funding.
We charged off $62.7 million during 2010, and expect to have additional credit losses in the future through the normal course of our lending operations. If we were to experience a material increase in credit losses exceeding our allowance for loan losses in the future, our assets, net income and operating results would be adversely impacted, which could also lead to challenges in securing additional financing.
As of December 31, 2010, we had delinquent loans of $114.5 million and had loans with an aggregate outstanding balance of $356.6 million classified as impaired. Of these impaired loans, loans with an aggregate outstanding balance of $135.6 million at December 31, 2010 were also on non-accrual status.
Like other commercial lenders, we experience delinquencies, impairments and non-accruals, which may indicate that our risk of credit loss for a particular loan has materially increased. When a loan is over 90 days past due or if management believes it is probable that we will be unable to collect principal and interest contractually owed to us, it is our policy to place the loan on non-accrual status and classify it is as impaired. In certain circumstances, a loan can be classified as impaired, but continue to be performing as a result of a troubled debt restructuring.
As of December 31, 2010, we had an allowance for credit losses of $84.8 million, including specific reserves of $60.4 million. Management periodically reviews the appropriateness of our allowance for credit losses. However, the relatively limited history of our loans makes it difficult to judge the expected credit performance of our loans. Our estimates and judgments with respect to the appropriateness of our allowance for credit losses may not be accurate, and the assumptions we use to make such estimates and judgments may be inaccurate. Our allowance may not be adequate to cover credit or other losses related to our loans as a result of unanticipated adverse changes in the economy or events adversely affecting specific customers, industries or markets. If we were to experience material credit losses related to our loans, such losses could adversely impact our ability to fund future loans and our business and, to the extent losses exceed our allowance for credit losses, our results of operations and financial condition would be adversely affected.
Disruptions in global financial markets have and may continue to increase the number of charge-offs, impairments and non-accruals in our loan portfolio, which may exceed our allowance for credit losses and could negatively impact our financial results.
Our business, financial condition and results of operations may be adversely affected by the economic and business conditions in the markets in which we operate. Delinquencies, non-accruals and credit losses generally increase during economic slowdowns or recessions. Our Leveraged Finance and Business Credit groups primarily consist of loans to small and medium-sized businesses that may be particularly susceptible to economic slowdowns or recessions and may be unable to make scheduled payments of interest or principal on their
12
Table of Contents
borrowings during these periods. In our Real Estate group, the recent economic slowdown and recession has led to increases in payment defaults on the underlying commercial real estate. Therefore, to the extent that economic and business conditions are unfavorable as they were during recent periods, our non-performing assets are likely to remain elevated and the value of our loan portfolio is likely to decrease. Adverse economic conditions also may decrease the estimated value of the collateral, particularly real estate, securing some of our loans or other debt products. As a result, we may have certain commercial real estate loans that we have not classified as impaired with outstanding balances greater than the estimated value of the underlying collateral. Further or prolonged economic slowdowns or recessions could lead to financial losses in our loan portfolio and a decrease in our net interest income, net income and book value.
We make loans primarily to privately-owned, small and medium-sized companies that may carry more inherent risk and present an increased potential for loss than loans to larger companies.
Our loan portfolio consists primarily of loans to small and medium-sized, privately-owned companies, most of which do not publicly report their financial condition. Compared to larger, publicly-traded firms, loans to these types of companies may carry more inherent risk. The companies that we lend to generally have more limited access to capital and higher funding costs, may be in a weaker financial position, may need more capital to expand or compete, and may be unable to obtain financing from public capital markets or from traditional sources, such as commercial banks. Accordingly, loans and leases made to these types of customers involve higher risks than loans and leases made to companies that have larger businesses, greater financial resources or are otherwise able to access traditional credit sources. Numerous factors may make these types of companies more vulnerable to variations in results of operations, changes impacting their industry and changes in general market conditions. Companies in this market segment also face intense competition, including from companies with greater financial, technical, managerial and marketing resources. Any of these factors could impair a customer’s cash flow or result in other adverse events, such as bankruptcy, which could limit a customer’s ability to make scheduled payments on our loans and leases, and may lead to losses in our loan portfolio and a decrease in our net interest income, net income and book value.
Additionally, because most of our customers do not publicly report their financial condition, we are more susceptible to a customer’s fraud, which could cause us to suffer losses on our loan portfolio. The failure of a customer to accurately report its financial position, compliance with loan covenants or eligibility for additional borrowings could result in our providing loans or other debt products that do not meet our underwriting criteria, defaults in loan and lease payments, the loss of some or all of the principal of a particular loan or loans, including, in the case of revolving loans, amounts we may not have advanced had we possessed complete and accurate information.
Our concentration of loans and other debt products within a particular industry or region could impair our financial condition or results of operations if that industry or region were to experience adverse changes to economic or business conditions.
We specialize in certain broad industry segments, such as commercial real estate, healthcare and media in which our bankers have experience and strong networks of proprietary deal sources and our credit personnel have significant underwriting expertise. As a result, our portfolio currently has and may develop other concentrations of risk exposure related to those industry segments. If industry segments in which we have a concentration of investments experience adverse economic or business conditions, our delinquencies, default rate and loan charge-offs in those segments may increase, which may negatively impact our financial condition and results of operations.
Our balloon and bullet transactions may involve a greater degree of risk than other types of loans.
As of December 31, 2010, balloon and bullet transactions represented 85.2% of the outstanding balance of our loan portfolio. Balloon and bullet loans involve a greater degree of risk than other types of transactions
13
Table of Contents
because they are structured to allow for either small (balloon) or no (bullet) principal payments over the term of the loan, requiring the borrower to make a large final payment upon the maturity of the loan. The ability of our customers to make this final payment upon the maturity of the loan typically depends upon their ability either to refinance the loan prior to maturity or to generate sufficient cash flow to repay the loan at maturity. The ability of a customer to accomplish any of these goals will be affected by many factors, including the availability of financing at acceptable rates to the customer, the financial condition of the customer, the marketability of the related collateral, the operating history of the related business, tax laws and the prevailing general economic conditions. Consequently, the customer may not have the ability to repay the loan at maturity, and we could lose all or most of the principal of our loan. Given their relative size and limited resources and access to capital, our small and mid-sized customers may have difficulty in repaying or financing their balloon and bullet loans on a timely basis or at all.
Our cash flow transactions are not fully covered by the value of tangible assets or collateral of the customer and, consequently, if any of these transactions become non-performing, we could suffer a loss of some or all of our value in the assets.
Cash flow lending involves lending money to a customer based primarily on the expected cash flow, profitability and enterprise value of a customer, with the value of any tangible assets as secondary protection. In some cases, these loans may have more leverage than traditional bank debt. As of December 31, 2010, cash flow transactions comprised $1.4 billion, or 78%, of the outstanding balance of our loan portfolio. In the case of our senior cash flow loans, we generally take a lien on substantially all of a customer’s assets, but the value of those assets is typically substantially less than the amount of money we advance to the customer under a cash flow transaction. In addition, some of our cash flow loans may be viewed as stretch loans, meaning they may be at leverage multiples that exceed traditional accepted bank lending standards for senior cash flow loans. Thus, if a cash flow transaction becomes non-performing, our primary recourse to recover some or all of the principal of our loan or other debt product would be to force the sale of all or part of the company as a going concern. Additionally, we may obtain equity ownership in a borrower as a means to recover some or all of the principal of our loan. The risks inherent in cash flow lending include, among other things:
| • | reduced use of or demand for the customer’s products or services and, thus, reduced cash flow of the customer to service the loan and other debt product as well as reduced value of the customer as a going concern; |
| • | inability of the customer to manage working capital, which could result in lower cash flow; |
| • | inaccurate or fraudulent reporting of our customer’s positions or financial statements; |
| • | economic downturns, political events, regulatory changes, litigation or acts of terrorism that affect the customer’s business, financial condition and prospects; and |
| • | our customer’s poor management of their business. |
Additionally, many of our customers use the proceeds of our cash flow transactions to make acquisitions. Poorly executed or poorly conceived acquisitions can tax management, systems and the operations of the existing business, causing a decline in both the customer’s cash flow and the value of its business as a going concern. In addition, many acquisitions involve new management teams taking over control of a business. These new management teams may fail to execute at the same level as the former management team, which could reduce the cash flow of the customer available to service the loan or other debt product, as well as reduce the value of the customer as a going concern.
If interest rates rise, demand for our loans or other debt products may decrease and some of our existing customers may be unable to service interest on their loans or other debt products.
Most of our loans and other debt products bear interest at floating interest rates. To the extent interest rates increase, monthly interest obligations owed by our customers to us will also increase. Demand for our loans or
14
Table of Contents
other debt products may decrease as interest rates rise or if interest rates are expected to rise in the future. In addition, if prevailing interest rates increase, some of our customers may not be able to make the increased interest payments or refinance their balloon and bullet transaction, resulting in payment defaults and loan impairments. Conversely if interest rates decline, our customers may refinance the loans they have with us at lower interest rates, or with others, leading to lower revenues.
Errors by, or dishonesty of, our employees in making credit decisions or in our loan and other debt product servicing activities could result in credit losses and harm our reputation.
We rely heavily on the performance and integrity of our employees in making our initial credit decisions with respect to our loans and other debt products and in servicing our loans and other debt products after they have closed. Because there is generally little or no publicly available information about our customers, we cannot independently confirm or verify the information our employees provide us for use in making our credit and funding decisions. Errors by our employees in assembling, analyzing or recording information concerning our customers could cause us to originate loans or fund subsequent advances that we would not otherwise originate or fund, which could result in loan losses. Losses could also arise if any of our employees were dishonest, particularly if they colluded with a customer to misrepresent the creditworthiness of a prospective customer or to provide inaccurate reports regarding the customer’s compliance with the covenants in its loan or other debt products agreement. If, based on an employee’s dishonesty, we made a loan or other debt product to a customer that was not creditworthy or failed to exercise our rights under a loan or other debt product agreement against a customer that was not in compliance with covenants in the agreement, we could lose some or all of the principal of the loan or other debt product. Fraud or dishonesty on the part of our employees could also damage our reputation which could harm our competitive position and adversely affect our business.
We are not the sole lender or agent for most of our loans or other debt products. Consequently, we do not have absolute control over how these loans or other debt products are administered or have control over those loans. When we are not the sole lender or agent, we may be required to seek approvals from other lenders before we take actions to enforce our rights.
A majority of our loan portfolio consists of loans and other debt products in which we are neither the sole lender, the agent for the lending group that receives payments under the loan or other debt product nor the agent that controls the underlying collateral. For these loans and other debt products, we may not have direct access to the customer and, as a result, may not receive the same financial or operational information as we receive for loans or other debt products for which we are the agent. This may make it more difficult for us to track or rate these loans or other debt products. Additionally, we may be prohibited or otherwise restricted from taking actions to enforce the loan or other debt product or to foreclose upon the collateral securing the loan or other debt product without the agreement of other lenders holding a specified minimum aggregate percentage, generally a majority or two-thirds of the outstanding principal balance. It is possible that an agent for one of these loans or other debt products may choose not to take the same actions to enforce the loan or other debt product or to foreclose upon the collateral securing the loan that we would have taken had we been the agent for the loan or other debt product.
Our commitments to lend additional sums to customers may exceed our resources available to fund these commitments, adversely affecting our financial condition and results of operations.
Our contractual commitments to lend additional sums to our customers may exceed our resources available to fund these commitments. Some of our funding sources are only available to fund a portion of a loan and other funding sources may not be immediately available. Our customers’ ability to borrow these funds may be restricted until they are able to demonstrate, among other things, that they have sufficient collateral to secure the requested additional borrowings or that the borrowing conforms to specific uses or meets certain conditions. We may have miscalculated the likelihood that our customers will request additional borrowings in excess of our readily available funds. If our calculations prove incorrect, we will not have the funds to make these loan
15
Table of Contents
advances without obtaining additional financing. Our failure to satisfy our full contractual funding commitment to one or more of our customers could create breach of contract or other liabilities for us and damage our reputation in the marketplace, which could then adversely affect our financial condition and results of operations.
Because there is no active trading market for most of the loans and other debt products in our loan portfolio, we might not be able to sell them at a favorable price or at all. The lack of active secondary markets for some of our investments may also create uncertainty as to the value of these investments.
We may seek to dispose of one or more of our loans and other debt products to obtain liquidity or to reduce or limit potential losses with respect to non-performing assets. There is no established trading market for most of our loans and other debt products. In addition, the fair value of other debt products that have lower levels of liquidity or are not publicly-traded may not be readily determinable and may fluctuate significantly on a monthly, quarterly and annual basis. Because these valuations are inherently uncertain, may fluctuate over short periods of time and may be based on estimates, our determinations of fair value may differ materially from the values that we ultimately attain for these debt products or would be able to attain if we have to sell our other debt products. The value of our common stock could be adversely affected if our determinations regarding the fair value of these investments are materially higher than the values that we ultimately realize upon their disposal. In addition, given the limited trading market for our loans and other debt products and the uncertainty as to their fair value at any point in time, if we seek to sell a loan or other debt product to obtain liquidity or reduce or limit losses, we may not be able to do so at a favorable price or at all.
We selectively underwrite transactions that we may be unable to syndicate.
On a selective basis, we commit to underwrite transactions that are significantly larger than our internal hold targets and we then seek to syndicate any amounts in excess of our target. We may syndicate these loans to the NCOF or to other lenders. As part of the syndication process to the NCOF, we must hold the targeted loans for at least 31 days. After 31 days the NCOF may reject the loan should credit deteriorate. If we are unable to syndicate these commitments, we may have to sell the additional exposure on unfavorable terms, which could adversely affect our financial condition or results of operations. In addition, if we must hold a larger portion of a transaction than we would like, we may not be able to complete other transactions and our loan portfolio may become more concentrated, which could affect our business, financial condition and results of operations. If we hold a loan that exceeds our internal hold targets, we obtain a separate credit approval for the excess portion.
We provide second lien, subordinated / mezzanine loans, other debt products and equity-linked products that may rank junior to rights of other lenders, representing a higher risk of loss than our other loans and debt products in which we have a first priority position.
To a lesser extent, we provide second lien, subordinated / mezzanine loans, other debt products and equity-linked products, which are typically junior in right of payment to obligations to customers’ senior secured lenders and contain either junior or no collateral rights. As a result of their junior nature, we may be limited in our ability to enforce our rights to collect principal and interest on these loans and other debt products or to recover any of their outstanding balance through a foreclosure of collateral. For example, typically we are not contractually entitled to receive payments of principal on a junior loan or other debt product until the senior loan or other debt product is paid in full, and we may only receive interest payments on a second lien or subordinated / mezzanine asset if the customer is not in default under its senior secured loan. In many instances, we are also prohibited from foreclosing on collateral securing a second lien, subordinated / mezzanine loan or other debt product until the senior loan is paid in full. Moreover, any amounts that we might realize as a result of our collection efforts or in connection with a bankruptcy or insolvency proceeding involving a customer under a second lien, subordinated / mezzanine loan or other debt product must generally be turned over to the senior secured lender until the senior secured lender has realized the full value of its own claims. These restrictions may materially and adversely affect our ability to recover the principal of any non-performing senior subordinate, second lien, subordinated / mezzanine loans and other
16
Table of Contents
debt product. In addition, on occasion we provide senior loans or other debt products that are contractually subordinated to one or more senior secured loans for the customer. In those cases we may have a first lien security interest, but one or more creditors have payment priority over us. As of December 31, 2010, our second lien and, subordinated/mezzanine loans totaled $29.7 million.
Risks Related to Our Funding and Leverage
Our ability to grow our business depends on our ability to obtain external financing. If our lenders terminate any of our credit facilities or if we default on our credit facilities, we may not be able to continue to fund our business.
We require a substantial amount of cash to provide new loans and other debt products and to fund our obligations to existing customers. In the past, we have obtained the cash required for our operations through the issuance of equity interests and by borrowing money through credit facilities, term debt securitizations and repurchase agreements. We may not be able to continue to access these or other sources of funds.
As of December 31, 2010, our $75 million credit facility with Citicorp was subject to an annual liquidity renewal and was scheduled to mature on November 7, 2011. On February 14, 2011, we entered into an amendment with Citicorp which modified the maturity date to June 15, 2011. If Citicorp decides not to renew its credit facility with us on the maturity date, our ability to make new borrowings under that credit facility would terminate. We expect to repay the entire outstanding balance of the credit facility with Citicorp on or before June 15, 2011. In addition, we have another credit facility with a commitment of $50 million that matures in May 2011. During 2010, we paid off one $250 million term debt facility and a $10 million credit facility matured. Additionally, we entered into two new credit facilities with commitments totaling $325 million.
Substantially all of our non-securitized loans and other debt products are held in these facilities. Our credit facilities contain customary representations and warranties, covenants, conditions, events of default and termination events that if breached, not satisfied or triggered, could result in termination of the facility. These events of default and termination events include, but are not limited to, failure to service debt obligations, failure to meet liquidity covenants and tangible net worth covenants, and failure to remain within prescribed facility portfolio delinquency and charge-off levels. Further, all cash flow generated by our loans and other debt products subject to a particular facility would go to pay down our borrowings thereunder rather than to us if we are in default. Additionally, if the facility were terminated due to our breach, noncompliance or default, our lenders could liquidate or sell all or a portion of our loans and other debt products held in that facility. Also, if we trigger a default or there is a termination event under one facility and that default or termination results in a payment default or in the acceleration of that facility’s debt, it may trigger a default or termination event under our other facilities that have cross-acceleration or payment cross-default provisions. Consequently, if one or more of these facilities were to terminate prior to its expected maturity date, our liquidity position would be materially adversely affected, and we may not be able to satisfy our undrawn commitment balances, originate new loans or other debt products or continue to fund our operations. Even if we are able to refinance our debt, we may not be able to do so on favorable terms. If we are not able to obtain additional funding on favorable terms or at all, our ability to grow our business will be impaired.
Our deferred financing fees amortize over the contractual life of the related financing facility.
We have recorded deferred financing fees associated with most of our financing facilities. These deferred financing fees amortize over the contractual life of the financing facility. If a financing facility were to terminate before the contractual maturity date, we would be required to accelerate amortization of the remaining balance of the deferred financing fees which could have a negative impact our results of operations and financial condition. For example, in 2010 we used funds from our new term debt securitization to repay our term debt facility with Deutsche Bank, which resulted in the accelerated amortization of deferred financing fees under this facility.
17
Table of Contents
Our lenders and noteholders could terminate us as servicer of our loans, which would adversely affect our ability to manage our loan portfolio and reduce our net interest income.
Upon the occurrence of specified default events, our lenders under our credit facilities and the holders of the notes issued in our term debt securitizations may elect to terminate us as servicer of the loans and other debt products under the applicable facility and appoint a successor servicer. These default events include, but are not limited to, certain financial covenants and the loss of certain key members of our senior management, including our Chief Executive Officer and Chief Investment Officer. We do not maintain key man life insurance on any of our senior management nor have we taken any other precautions to offset the financial loss we could incur as a result of any of their departures. Certain of our credit facilities include cure rights which would enable us to correct the event of default and maintain our status as servicer.
If we are terminated as servicer, we will no longer receive our servicing fee. In addition, because any successor servicer may not be able to service our loan portfolio according to our standards, any transfer of servicing to a successor servicer could result in reduced or delayed collections, delays in processing payments and information regarding the loans and other debt products and a failure to meet all of the servicing procedures required by the applicable servicing agreement. Consequently, the performance of our loans and other debt products could be adversely affected and our income generated from those loans and other debt products significantly reduced.
Our liquidity position could be adversely affected if we were unable to complete additional term debt securitizations in the future, or if the reinvestment periods in our term debt securitizations terminate early, which could create a material adverse affect on our financial condition and results of operations.
We have completed four term debt securitizations to fund our loans and other debt products, all of which we accounted for on our balance sheet, through which we issued $1.8 billion of notes. On January 7, 2010, we completed our first term debt securitization since 2007. Our term debt securitizations consist of asset securitization transactions in which we transfer loans and other debt products to a trust that aggregates our loans and, in turn, sells notes, collateralized by the trust’s assets, to institutional investors. The notes issued by the trusts have been rated by nationally recognized statistical rating organizations. The ratings range from AAA to CC by Standard & Poor’s, Inc. and Fitch Ratings, Inc. and Aa2 to Caa2 by Moody’s Investors Service, Inc., depending on the class of notes.
We intend to complete additional term debt securitizations in the future. Several factors will affect demand for, and our ability to complete additional term debt securitizations, including:
| • | disruptions in the capital markets generally, and the asset-backed securities market in particular; |
| • | disruptions in the credit quality and performance of our loan portfolio, particularly that portion which has been previously securitized and serves as collateral for existing term debt securitizations; |
| • | regulatory considerations; |
| • | our ability to service our loan portfolio must continue to be perceived as adequate to make the issued securities attractive to investors; and |
| • | any material downgrading or withdrawal of ratings given to securities previously issued in our term debt securitizations. |
If we are unable to complete additional term debt securitizations, our ability to obtain the capital needed for us to continue to operate and grow our business would be adversely affected. In addition, our credit facilities are only intended to provide short-term financing for our transactions. If we are unable to finance our transactions over the longer term through our term debt securitizations, our credit facilities may not be renewed. Moreover, our credit facilities typically carry a higher interest rate than our term debt securitizations. Accordingly, our inability to complete additional term debt securitizations in the future could have a material adverse effect on our
18
Table of Contents
financial conditions and result of operations. See “Management’s Discussion and Analysis of Financial Condition and Results of Operations—Market Conditions.”
If a specified default event occurred in a term debt securitization, the reinvestment period would be terminated. This could have an adverse effect on our ability to fund new assets.
The cash flows we receive from the interests we retain in our term debt securitizations could be delayed or reduced due to the requirements of the term debt securitization.
We have retained 100% of the junior-most interests, which we refer to as the trust certificates, issued in the term debt securitizations, totaling $217.3 million in principal amount, issued in each of our four term debt securitizations that we have completed through December 31, 2010. The notes issued in the term debt securitizations that we did not retain are senior to the trust certificates we did retain. Cash flows generated by the retained interest in these trust certificates were $7.4 million and $30.7 million for the years ended December 31, 2010 and 2009, respectively. Our receipt of future cash flows on the trust certificates is governed by provisions that control the distribution of cash flows from the loans and other debt products included in our term debt securitizations. On a quarterly basis, interest cash flows from the loans and other debt products must first be used to pay the interest on the senior notes and expenses of the term debt securitization. Any funds remaining after the payment of these amounts are distributed to us.
Several factors may influence the timing and amount of the cash flows we receive from loans and other debt products included in our term debt securitizations, including:
| • | if any loan or other debt product included in a term debt securitization becomes 60 days or more delinquent or is charged off, all funds, after paying expenses and interest to the senior notes, go to a reserve account which then pays down an amount of senior notes equal to the amount of the delinquent loan or other debt product. Except for specified management fees, we will not receive any distributions from funds during this period; and |
| • | if other specified events occur to the trusts, for example an event of default, our cash flows would be used to reduce the outstanding balance of the senior notes and would not be available to us until the full principal balance of the senior notes has been repaid. |
We have obtained a significant portion of our debt financing through a limited number of financial institutions. This concentration of funding sources exposes us to funding risks.
We have obtained our credit facility financing from a limited number of financial institutions. Our reliance on the underwriters of our debt financing and their affiliates for a significant amount of our funding exposes us to funding risks. If these participating lenders decided to terminate our credit facilities, we would need to establish new lending relationships to satisfy our funding needs.
Risks Related to Our Operations and Financial Results
Our quarterly net interest income and results of operations are difficult to forecast and may fluctuate substantially.
Our quarterly net interest income and results of operations are difficult to forecast. We have and may continue to experience substantial fluctuations in net interest income and results of operations from quarter to quarter. You should not rely on our results of operations in any prior reporting period to be indicative of our performance in future reporting periods. Many different factors could cause our results of operations to vary from quarter to quarter, including:
| • | the success of our origination activities; |
| • | pre-payments on our loan portfolio; |
19
Table of Contents
| • | credit losses and default rates; |
| • | our ability to enter into financing arrangements; |
| • | competition; |
| • | seasonal fluctuations in our business, including the timing of transactions; |
| • | costs of compliance with regulatory requirements; |
| • | private equity activity; |
| • | the timing and affect of any future acquisitions; |
| • | personnel changes; |
| • | changes in accounting rules; |
| • | changes in prevailing interest rates; |
| • | general changes to the U.S. and global economies; and |
| • | political conditions or events. |
We base our current and future operating expense levels and our investment plans on estimates of future net interest income, transaction activity and rate of growth. We expect that our expenses will increase in the future, and we may not be able to adjust our spending quickly enough if our net interest income falls short of our expectations. Any shortfalls in our net interest income or in our expected growth rates could result in decreases in our stock price.
Our business is highly dependent on key personnel.
Our future success depends to a significant extent on the continued services of our Chief Executive Officer and our Chief Investment Officer as well as other key personnel. While we entered into new three-year employment agreements with each of these officers in December 2009, if we were to lose the services of any of these executives for any reason, including voluntary resignation or retirement, we may not be able to replace them with someone of equal skill or ability and our business may be adversely affected. Moreover, we may not function well without the continued services of these executives.
We may not be able to attract and retain the highly skilled employees we need to support our business.
Our ability to originate and underwrite loans and other debt products is dependent on the experience and expertise of our employees. In order to grow our business, we must attract and retain qualified personnel, especially origination and credit personnel with relationships with referral sources and an understanding of small and middle-market businesses and the industries in which our borrowers operate. Many of the financial institutions with which we compete for experienced personnel may be able to offer more attractive terms of employment. If any of our key origination personnel leave, our new loan and other debt product volume from their business contacts may decline or cease, regardless of the terms of our loan and other debt product offerings or our level of service. In addition, we invest significant time and expense in training our employees, which increases their value to competitors who may seek to recruit them and increases the costs of replacing them. As competition for qualified employees grows, our cost of labor could increase, which could adversely impact our results of operations.
Maintenance of our Investment Company Act exemption imposes limits on our operations.
We intend to conduct our operations so that we are not required to register as an investment company under the Investment Company Act of 1940, as amended, which we refer to as the Investment Company Act. Section 3(a)(1)(C) of the Investment Company Act defines as an investment company any issuer that is engaged
20
Table of Contents
or proposes to engage in the business of investing, reinvesting, owning, holding or trading in securities and owns or proposes to acquire investment securities having a value exceeding 40.0% of the value of the issuer’s total assets (exclusive of government securities and cash items) on an unconsolidated basis. Excluded from the term “investment securities” are, among other things, securities issued by majority-owned subsidiaries that are not themselves investment companies and are not relying on the exception from the definition of investment company in Section 3(c)(1) or Section 3(c)(7) of the Investment Company Act.
We expect that many of our majority-owned subsidiaries, including those which we have created (or may in the future create) in connection with our term debt securitizations, will rely on exceptions and exemptions from the Investment Company Act available to certain structured finance companies and that our interests in those subsidiaries will not constitute “investment securities” for purposes of the Investment Company Act. Because these exceptions and exemptions may, among other things, limit the types of assets these subsidiaries may purchase or counterparties with which we may deal, we must monitor each subsidiary’s compliance with its applicable exception or exemption.
We must also monitor our loan portfolio to ensure that the value of the investment securities we hold does not exceed 40.0% of our total assets (exclusive of government securities and cash items) on an unconsolidated basis. If the combined value of the investment securities issued by our subsidiaries that are investment companies or that must rely on the exceptions provided by Section 3(c)(1) or Section 3(c)(7) of the Investment Company Act rather than another exception or exemption, together with any other investment securities we may own, exceeds 40.0% of our total assets on an unconsolidated basis, we may be deemed to be an investment company. Because we believe that the interests we hold in our subsidiaries generally will not be investment securities, we do not expect to own nor do we propose to acquire investment securities in excess of 40.0% of the value of our total assets on an unconsolidated basis.
We monitor for compliance with the Investment Company Act on an ongoing basis and may be compelled to take or refrain from taking actions, to acquire additional income or loss generating assets or to forego opportunities that might otherwise be beneficial or advisable, including, but not limited to selling assets that are considered to be investment securities or foregoing sale of assets which are not investment securities, in order to ensure that we (or a subsidiary) may continue to rely on the applicable exceptions or exemptions. These limitations on our freedom of action could have a material adverse effect on our financial condition and results of operations.
If we fail to maintain an exemption, exception or other exclusion from registration as an investment company, we could, among other things, be required to substantially change the manner in which we conduct our operations either to avoid being required to register as an investment company or to register as an investment company. If we were required to register as an investment company under the Investment Company Act, we would become subject to substantial regulation with respect to, among other things, our capital structure (including our ability to use leverage), management, operations, transactions with affiliated persons (as defined in the Investment Company Act), portfolio composition, including restrictions with respect to diversification and industry concentration, and our financial condition and results of operations may be adversely affected. Additionally, criminal and civil actions could be brought against us, our contracts would be unenforceable unless a court was to require enforcement, and a court could appoint a receiver to take control of us and liquidate our business.
Risks Related to Our Operating and Trading History
We have incurred losses in the past and may not achieve profitability in future periods.
For the years ended December 31, 2010 and 2008, we recorded net income of $10.2 million and $22.4 million, respectively. For the year ended December 31, 2009, we recorded a net loss of $44.3 million. The loss for 2009 was primarily due to the specific provision for loan losses of $132.5 million. We may not be profitable in future periods for a variety of reasons. If we are unable to achieve, maintain and increase our profitability in the future, the market value of our common stock could further decline.
21
Table of Contents
We are in a highly competitive business and may not be able to compete effectively, which could impact our profitability.
The commercial lending industry is highly competitive and includes a number of competitors who provide similar types of loans to our target customers. Our principal competitors include a variety of:
| • | specialty and commercial finance companies, including business development companies and real estate investment trusts; |
| • | private investment funds and hedge funds; |
| • | national and regional banks; |
| • | investment banks; and |
| • | insurance companies. |
Some of our competitors offer a broader range of financial, lending and banking services than we do and can leverage their existing customer relationships to offer and sell services that compete directly with our products and services. In addition, some of our competitors have greater financial, technical, marketing, origination and other resources than we do. They may also have greater access to capital than we do and at a lower cost than is available to us. For example, if national and regional banks or other large competitors seek to expand within or enter our target markets, they may provide loans at lower interest rates to gain market share, which could force us to lower our rates and result in decreased returns. As a result of competition, we may not be able to attract new customers, retain existing customers or sustain the rate of growth that we have experienced to date, and our ability to expand our loan portfolio and grow future revenue may decline. If our existing customers choose to use competing sources of credit to refinance their debt, our loan portfolio could be adversely affected.
We are subject to regulation, which limits our activities and exposes us to additional fines and penalties, and any changes in such regulations could affect our business and our profitability.
We are subject to federal, state and local laws and regulations that govern non-depository commercial lenders and businesses generally. We may also, beginning in the third quarter of 2011, be required to register with the SEC as an investment adviser and conform our activities to regulation under the Investment Advisers Act of 1940. Each of the regulatory bodies with jurisdiction over us has regulatory powers dealing with many aspects of financial services, including the authority to grant, and, in specific circumstances to cancel, permissions to carry on particular businesses. Our failure to comply with applicable laws or regulations could result in fines, censure, suspensions of personnel or other sanctions, including revocation of any registration that we may be required to hold. Even if a sanction imposed against us or our personnel is small in monetary amount, the adverse publicity arising from the imposition of sanctions against us by regulators could harm our reputation and impair our ability to retain clients and develop new client relationships, which may reduce our revenues.
Furthermore, the regulatory environment in which we operate is subject to further modifications and regulation. Any changes in such laws or regulations could affect our business and profitability. In addition, if we expand our business into areas or jurisdictions that are subject to, or have adopted, more stringent laws and regulations than those that are currently applicable to us and our business, we may have to incur significant additional expense or restrict our operations in order to comply, which could adversely impact our business, results of operations or prospects.
Our common stock may continue to have a volatile public trading price.
Historically, the market price of our common stock has been highly volatile, and the market for our common stock has experienced significant price and volume fluctuations, some of which are unrelated to our company’s operating performance. Since our common stock began trading publicly on December 14, 2006, the trading price
22
Table of Contents
of our stock has fluctuated from a high of $20.85 to a low of $0.61. It is likely that the market price of our common stock will continue to fluctuate in the future. Factors which may have a significant adverse effect on our common stock’s market price include:
| • | the rate of charge-offs, impairments and non-accruals in our loan portfolio; |
| • | fluctuations in interest rates and the actual or perceived impact of these rates on our current customers and future prospects; |
| • | changes to the regulatory environment in which we operate; |
| • | our ability to raise additional capital and the terms on which we can secure such capital; |
| • | general market and economic conditions; and |
| • | quarterly fluctuations in our revenues and other financial results. |
The reported average daily trading volume of our common stock for the twelve-month period ending December 31, 2010 was approximately 114,000 shares, however our trading volume has exceeded 1,000,000 shares on several occasions since our initial public offering. Such a low average trading volume may impact our shareholders’ ability to buy and sell shares of our common stock.
| Item 1B. | Unresolved Staff Comments |
None.
| Item 2. | Properties |
Our headquarters is located at 500 Boylston Street, Suite 1250, Boston, Massachusetts 02116, where we sublease 15,116 square feet of office space under a sublease which expires in 2013. We also maintain leased offices in Darien, Connecticut, Chicago, Illinois, Dallas, Texas, Houston, Texas, Los Angeles, California, and Atlanta, Georgia. We believe our office facilities are suitable and adequate for us to conduct our business.
| Item 3. | Legal Proceedings |
The Company from time to time is involved in litigation in the ordinary course of business. We are not currently subject to any material pending legal proceedings.
| Item 4. | [Removed and Reserved] |
23
Table of Contents
PART II
| Item 5. | Market for Registrant’s Common Equity, Related Stockholder Matters and Issuer Purchases of Equity Securities |
As of March 2, 2011, there were approximately 99 stockholders of record. The number of stockholders does not include individuals or entities who beneficially own shares but whose shares are held of record by a broker or clearing agency, but does include each such broker or clearing agency as one stockholder. American Stock Transfer & Trust Company serves as transfer agent for our shares of common stock.
Our common stock has traded on the NASDAQ Global Market under the symbol “NEWS” since December 14, 2006. The quarterly range of the high and low sales price for our common stock during 2010 and 2009 is presented below:
| 2010 | 2009 | |||||||||||||||
| High | Low | High | Low | |||||||||||||
| Quarter ended: |
||||||||||||||||
| December 31 |
$ | 10.57 | $ | 7.34 | $ | 4.02 | $ | 2.32 | ||||||||
| September 30 |
7.70 | 6.06 | 3.56 | 1.45 | ||||||||||||
| June 30 |
8.28 | 6.36 | 3.01 | 1.72 | ||||||||||||
| March 31 |
6.71 | 3.99 | 4.23 | 0.61 | ||||||||||||
On March 2, 2011, the last reported closing price of our common stock on the NASDAQ Global Market was $10.40 per share.
The following graph shows a comparison from December 14, 2006 (the date our common stock commenced trading on the NASDAQ Global Market) through December 31, 2010 of cumulative total return for our common stock, the S&P 500 Index and the S&P Financials Index. The graph assumes a $100 investment at the closing price on December 14, 2006. Such returns are based on historical results and are not intended to suggest future performance. The following information in this Item 5 of this Annual Report on Form 10-K is not deemed to be “soliciting material” or to be “filed” with the SEC or subject to Regulation 14A or 14C under the Securities Exchange Act of 1934 or to the liabilities of Section 18 of the Securities Exchange Act of 1934, and will not be deemed to be incorporated by reference into any filing under the Securities Act of 1933 or the Securities Exchange Act of 1934, except to the extent we specifically incorporate it by reference into such a filing.
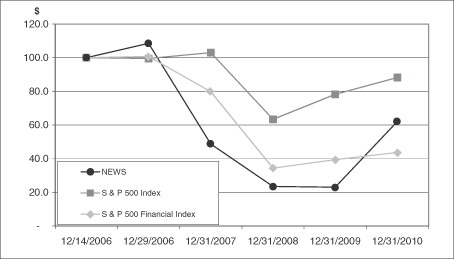
24
Table of Contents
Dividend Policy
We have never declared or paid cash dividends on our common stock. We do not anticipate paying any cash dividends on our common stock in the foreseeable future. We intend to retain all available funds and any future earnings to reduce debt and fund the development and growth of our business.
Issuer Purchases of Equity Securities
The following table sets forth the repurchases of our Common Stock that we made for the three-month period ending on December 31, 2010:
| Period |
Total Number of Shares Purchased (1) |
Weighted Average Price Paid Per Share (1) |
Total Number of Shares Purchased as Part of Publicly Announced Plans or Programs (2) |
Approximate Dollar Value of Shares that May Yet Be Purchased Under the Plans or Programs (2) |
||||||||||||
| October 1-31, 2010 |
124,306 | $ | 7.43 | 124,306 | $ | 2,355,284 | ||||||||||
| November 1-30, 2010 |
227,528 | 8.49 | 227,528 | 423,912 | ||||||||||||
| December 1-31, 2010 |
48,394 | 8.76 | 48,394 | — | ||||||||||||
| Total: Three months ended December 31, 2010 |
400,228 | 8.19 | 400,228 | — | ||||||||||||
| (1) | 400,228 shares were repurchased during the period in connection with our share repurchase program that we announced on January 25, 2010, and certain of these shares were repurchased on the open market pursuant to a trading plan under Rule 10b5-1 of the Exchange Act. |
| (2) | The repurchase program provided for the repurchase of up to $10 million of the Company’s common stock from time to time on the open market or in privately negotiated transactions. The repurchase program was completed on December 3, 2010 with the repurchase of $10 million of the Company’s common stock. For the entire program, shares of the Company’s common stock were repurchased at an average price of $7.26 per share. |
25
Table of Contents
| Item 6. | Selected Financial Data |
Selected consolidated financial and other data for the periods and at the dates indicated and should be read in conjunction with the consolidated audited financial statements, related notes and Management’s Discussion and Analysis of Financial Condition and Results of Operations included herein.
| Year Ended December 31, | ||||||||||||||||||||
| 2010 | 2009 | 2008 | 2007 | 2006 | ||||||||||||||||
| ($ in thousands, except for share and per share data) | ||||||||||||||||||||
| Statement of Operations Data: |
||||||||||||||||||||
| Interest income |
$ | 112,826 | $ | 136,569 | $ | 188,770 | $ | 204,295 | $ | 116,303 | ||||||||||
| Interest expense |
40,558 | 41,927 | 86,216 | 109,703 | 68,728 | |||||||||||||||
| Net interest income |
72,268 | 94,642 | 102,554 | 94,592 | 47,575 | |||||||||||||||
| Provision for credit losses |
32,997 | 133,093 | 38,224 | 19,510 | 12,535 | |||||||||||||||
| Net interest income (loss) after provision for credit losses |
39,271 | (38,451 | ) | 64,330 | 75,082 | 35,040 | ||||||||||||||
| Fee income |
2,409 | 1,657 | 4,518 | 15,797 | 5,849 | |||||||||||||||
| Asset management income |
2,872 | 2,934 | 6,283 | 5,304 | 1,443 | |||||||||||||||
| Gain on derivatives |
28 | 533 | 2,157 | 777 | 909 | |||||||||||||||
| Gain (loss) on sale of loans and debt securities |
(116 | ) | — | 282 | (4,615 | ) | 474 | |||||||||||||
| Gain on acquisition |
5,649 | — | — | — | — | |||||||||||||||
| Loss on investments in debt securities |
— | — | (932 | ) | (20,303 | ) | (597 | ) | ||||||||||||
| Loss on residual interest in securitization |
— | — | (631 | ) | (30,556 | ) | — | |||||||||||||
| Other income |
7,854 | 5,529 | 7,253 | 5,420 | 1,606 | |||||||||||||||
| Total non-interest income (loss) |
18,696 | 10,653 | 18,930 | (28,176 | ) | 9,684 | ||||||||||||||
| Compensation and benefits |
26,418 | 26,403 | 30,413 | 45,364 | 65,079 | |||||||||||||||
| Occupancy and equipment |
2,094 | 3,121 | 3,286 | 2,718 | 1,758 | |||||||||||||||
| General and administrative expenses |
12,101 | 12,911 | 11,090 | 9,412 | 7,445 | |||||||||||||||
| Total operating expenses |
40,613 | 42,435 | 44,789 | 57,494 | 74,282 | |||||||||||||||
| Income (loss) before income taxes |
17,354 | (70,233 | ) | 38,471 | (10,588 | ) | (29,558 | ) | ||||||||||||
| Income tax expense (benefit) |
6,935 | (24,353 | ) | 16,073 | (1,949 | ) | (2,377 | ) | ||||||||||||
| Net income (loss) before noncontrolling interest |
10,419 | (45,880 | ) | 22,398 | (8,639 | ) | (27,181 | ) | ||||||||||||
| Net loss (income) attributable to noncontrolling interest |
(187 | ) | 1,620 | — | — | — | ||||||||||||||
| Net income (loss) attributable to NewStar Financial, Inc. common stockholders |
$ | 10,232 | $ | (44,260 | ) | $ | 22,398 | $ | (8,639 | ) | $ | (27,181 | ) | |||||||
| Income (loss) per share: |
||||||||||||||||||||
| Basic |
$ | 0.21 | $ | (0.90 | ) | $ | 0.46 | $ | (0.23 | ) | $ | (1.65 | ) | |||||||
| Diluted |
0.19 | (0.90 | ) | 0.46 | (0.23 | ) | $ | (1.65 | ) | |||||||||||
| Weighted average shares outstanding: |
||||||||||||||||||||
| Basic |
49,449,314 | 49,119,285 | 48,340,067 | 36,900,640 | 16,480,836 | |||||||||||||||
| Diluted |
52,548,104 | 49,119,285 | 48,340,067 | 36,900,640 | 16,480,836 | |||||||||||||||
| Outstanding shares of common stock |
50,562,826 | 49,994,858 | 48,466,166 | 43,355,713 | 36,257,847 | |||||||||||||||
26
Table of Contents
| December 31, | ||||||||||||
| 2010 | 2009 | 2008 | ||||||||||
| Balance Sheet Data: |
||||||||||||
| Cash and cash equivalents |
$ | 54,365 | $ | 39,848 | $ | 50,279 | ||||||
| Restricted cash |
178,364 | 136,884 | 84,163 | |||||||||
| Investments in debt securities, available-for-sale |
4,014 | 4,183 | 3,025 | |||||||||
| Loans, held-for-sale |
41,386 | 15,736 | — | |||||||||
| Loans, net |
1,590,331 | 1,878,978 | 2,328,812 | |||||||||
| Other assets |
106,506 | 124,443 | 105,243 | |||||||||
| Total assets |
$ | 1,974,966 | $ | 2,200,072 | $ | 2,571,522 | ||||||
| Credit facilities |
$ | 108,502 | $ | 91,890 | $ | 411,267 | ||||||
| Term debt |
1,278,868 | 1,523,052 | 1,524,171 | |||||||||
| Other liabilities |
33,417 | 35,010 | 54,529 | |||||||||
| Total liabilities |
1,420,787 | 1,649,952 | 1,989,967 | |||||||||
| Total stockholders’ equity |
554,179 | 550,120 | 581,555 | |||||||||
| Supplemental Data: |
||||||||||||
| Investments in debt securities, gross |
$ | 6,468 | $ | 6,635 | $ | 6,839 | ||||||
| Loans held-for-sale, gross |
42,228 | 15,990 | — | |||||||||
| Loans held-for-investment, gross |
1,698,238 | 2,013,588 | 2,402,309 | |||||||||
| Loans and investments in debt securities, gross |
1,746,934 | 2,036,213 | 2,409,148 | |||||||||
| Unused lines of credit |
270,793 | 230,838 | 339,230 | |||||||||
| Standby letters of credit |
8,737 | 18,771 | 32,358 | |||||||||
| Total funding commitments |
$ | 2,026,464 | $ | 2,285,822 | $ | 2,780,736 | ||||||
| Loan portfolio |
$ | 1,746,934 | $ | 2,036,213 | $ | 2,409,148 | ||||||
| Loans owned by the NCOF |
451,929 | 542,504 | 561,241 | |||||||||
| Managed loan portfolio |
$ | 2,198,863 | $ | 2,578,717 | $ | 2,970,389 | ||||||
| Loans held-for-sale, gross |
$ | 42,228 | $ | 15,990 | $ | — | ||||||
| Loans held-for-investment, gross |
1,698,238 | 2,013,588 | 2,402,309 | |||||||||
| Total loans, gross |
1,740,466 | 2,029,578 | 2,402,309 | |||||||||
| Deferred fees, net |
(24,247 | ) | (20,999 | ) | (20,998 | ) | ||||||
| Allowance for loan losses—general |
(24,432 | ) | (38,485 | ) | (36,786 | ) | ||||||
| Allowance for loan losses—specific |
(60,350 | ) | (75,380 | ) | (15,713 | ) | ||||||
| Total loans, net |
$ | 1,631,437 | $ | 1,894,714 | $ | 2,328,812 | ||||||
| Average Balances (1): |
||||||||||||
| Loans and other debt products, gross |
$ | 1,870,178 | $ | 2,258,237 | $ | 2,415,436 | ||||||
| Interest earning assets (2) |
2,007,908 | 2,379,622 | 2,551,602 | |||||||||
| Total assets |
2,016,264 | 2,397,468 | 2,612,285 | |||||||||
| Interest bearing liabilities |
1,430,526 | 1,782,105 | 1,962,796 | |||||||||
| Equity |
546,974 | 572,417 | 566,173 | |||||||||
27
Table of Contents
| Year Ended December 31, | ||||||||||||
| 2010 | 2009 | 2008 | ||||||||||
| Performance Ratios (3): |
||||||||||||
| Return on average assets |
0.51 | % | (1.85 | )% | 0.86 | % | ||||||
| Return on average equity |
1.87 | (7.73 | ) | 3.96 | ||||||||
| Net interest margin, before provision |
3.60 | 3.98 | 4.02 | |||||||||
| Loan portfolio yield |
6.02 | 6.03 | 7.67 | |||||||||
| Efficiency ratio |
44.74 | 39.69 | 36.87 | |||||||||
| Credit Quality and Leverage Ratios (4): |
||||||||||||
| Delinquent loan rate (at period end) |
6.74 | % | 6.15 | % | 0.69 | % | ||||||
| Delinquent loan rate for accruing loans 60 days or more past due (at period end) |
0.50 | % | 0.99 | % | — | |||||||
| Non-accrual loan rate (at period end) |
7.98 | % | 8.08 | % | 2.52 | % | ||||||
| Non-performing asset rate (at period end) |
8.17 | % | 8.55 | % | 2.82 | % | ||||||
| Net charge off rate (end of period loans) |
3.69 | % | 3.61 | % | 0.82 | % | ||||||
| Net charge off rate (average period loans) |
3.36 | % | 3.22 | % | 0.82 | % | ||||||
| Allowance for credit losses ratio (at period end) |
4.99 | % | 5.68 | % | 2.25 | % | ||||||
| Debt to equity (at period end) |
2.50x | 2.96x | 3.33x | |||||||||
| Equity to assets (at period end) |
28.06 | % | 24.87 | % | 22.62 | % | ||||||
| (1) | Averages are based upon the average daily balance during the period. |
| (2) | Includes loan portfolio, cash, cash equivalents and restricted cash. |
| (3) | See “Management’s Discussion and Analysis of Financial Condition and Results of Operations” for a discussion of the calculation of performance ratios. |
| (4) | See “Management’s Discussion and Analysis of Financial Condition and Results of Operations” for additional information related to our credit quality and leverage ratios. |
28
Table of Contents
| Item 7. | Management’s Discussion and Analysis of Financial Condition and Results of Operations |
The following discussion contains forward-looking statements. Important factors that may cause actual results and circumstances to differ materially from those described in such statements is contained below and in Item 1A. “Risk Factors” of this report.
Overview
We are a specialized commercial finance company focused on meeting the complex financing needs of companies and private investors in the middle market. We principally focus on the direct origination of loans and leases that meet our risk and return parameters. Our direct origination efforts target mid-sized companies, private equity sponsors, corporate executives, regional banks, real estate investors and a variety of other financial intermediaries to source transaction opportunities. Direct origination provides direct access to customers’ management, enhances due diligence, and allows significant input into customers’ capital structure and direct negotiation of transaction pricing and terms. We also participate in loan syndicatins as a member of a lending group.
We operate as a single segment and derive revenues from four national lending groups:
| • | Leveraged Finance, which originates, structures and underwrites senior debt and, to a lesser extent, second lien, mezzanine and subordinated debt, and equity and equity-linked products for companies with annual EBITDA typically between $5 million and $50 million; |
| • | Real Estate, which originates, structures and underwrites first mortgage debt and, to a lesser extent, subordinated debt, primarily to finance acquisitions of real estate properties typically valued between $10 million and $50 million; |
| • | Business Credit, which originates, structures and underwrites senior asset-based debt for companies with sales typically totaling between $25 to $100 million; and |
| • | Equipment Finance, which originates, structures and underwrites operating leases, capital leases, and lease lines for capital expenditures for companies with annual sales of at least $25 million. |
Market Conditions
Conditions in the capital markets continued to improve in the fourth quarter of 2010 as economic growth in the US gained momentum. The recovery in credit markets also accelerated. Favorable liquidity conditions in the US corporate bond markets drove credit spreads tighter as new issuance surged in the fourth quarter of 2010. The larger more liquid, segments of the securitization markets have also substantially recovered, supporting increasing levels of new issuance for securities backed by mortgages, credit cards and auto loans. As liquidity has returned to those asset classes and market conditions normalized, the securitization markets for other asset types, including CLOs, have also recovered to a point that we believe they provide a reliable source of capital for companies like NewStar.
Conditions in the securitization market for bank loans, which the Company partially relies upon for funding, have continued to improve as loan values have recovered and default rates have declined. CLO bonds traded in the secondary market have increased in value along with the underlying loan collateral and are currently trading at levels and implied yields that have supported increasing levels of new issuance, including more than $5 billion of primary issuance in 2010 and a $275 million CLO that we completed in the first quarter of 2010. Several other CLOs have been completed this year and the forward calendar of new issuance appears to be building. The pace of recovery in this market has been slow, but we expect the favorable trends to continue as spreads tighten across other types of asset-backed securities and investors continue to emphasize a preference for higher yielding, floating rate asset classes.
In 2010, we added two new term credit facilities totaling $300 million to support our asset-based lending and equipment finance businesses, renewed a warehouse credit facility on more favorable terms, and amended a
29
Table of Contents
corporate debt facility to increase the size of the commitment and establish better pricing and advance rates among other improved terms. We believe that our ability to add, renew and amend these credit facilities reflects an overall improvement in the market conditions for funding and clearly represents a turning point in our ability to obtain additional funding and improve the terms of existing financings. In addition to these signs of improving market conditions, we believe the Company has substantially greater financial flexibility and other financing options due to the improvement in our financial performance.
We continue to believe that a significant lasting impact of the credit crisis will be a reduction in the number and capacity of lenders in the markets in which we compete. As a result, we anticipate that conditions in our lending markets will remain favorable for an extended period. In the first half of 2010, we experienced some downward pressure in pricing as lending capacity recovered faster than loan demand. In the second half, however, pricing stabilized and spreads widened as demand increased and lending capacity remained relatively flat.
After building substantial reserves through 2009 based on our best estimate of probable losses, our overall credit performance improved through most of 2010 as negative migration slowed and our provision for credit losses decreased substantially. Although we expect provisions for credit losses to stabilize at normalized levels in 2011, non-accrual loans and charge offs are expected to remain elevated as we work to resolve existing impaired loans.
Although the credit performance of our commercial real estate portfolio was particularly weak amid high unemployment and poor demand for office space, we believe that many commercial real estate markets have begun to stabilize. We have been repaid as agreed on certain loans and successfully resolved foreclosed real estate at values within expected ranges. While we remain cautious about the real estate sector, we believe that the availability of financing has improved and values have begun to stabilize. As a result, our borrowers’ ability and willingness to repay debt has also improved. As the commercial real estate markets began to weaken in early 2008, we discontinued originating new loans and began to reduce our credit exposure to this segment. We expect to begin to selectively evaluate new lending opportunities in this sector as market conditions continue to improve.
Recent Developments
Acquisition
On November 1, 2010, we acquired Core Business Credit, LLC, an asset-based lender located in Dallas, Texas with outstanding loans totaling $73.4 million as of October 31, 2010, and its wholly-owned subsidiaries (“Core”) for a purchase price of $25.3 million. We recognized a gain of $5.6 million in connection with the acquisition. In conjunction with the acquisition, we became party to an existing $225 million revolving credit facility with DZ Bank AG Deutsche Zentral-Genossenschaftsbank Frankfurt for asset-based lending origination.
New Business Initiative
We launched our Equipment Finance group in January 2011 to lease essential-use equipment for mid-sized companies. Concurrent with the acquisition of Core and the launch of the Equipment Finance group, we rebranded our business groups as Leveraged Finance, Real Estate, Business Credit, and Equipment Finance.
Liquidity
On January 25, 2011, we entered into a note purchase agreement with Wells Fargo Bank, National Association (Wells Fargo). Under the terms of the note purchase agreement, Wells Fargo agreed to provide a $75 million revolving credit facility to fund new equipment lease origination. The credit facility is scheduled to mature four years after the initial advance under the credit facility.
On February 14, 2011, we entered into an amendment to our credit facility with Citibank, N.A. which extended the maturity date to June 15, 2011 with a bullet maturity payment due at that time.
30
Table of Contents
Stock Repurchase Program
On January 25, 2010, we announced that our Board of Directors has authorized the repurchase of up to $10 million of the Company’s common stock from time to time on the open market or in privately negotiated transactions through January 22, 2011. On December 3, 2010, we completed the repurchase of $10 million of the Company’s common stock under that program.
RESULTS OF OPERATIONS FOR THE YEARS ENDED DECEMBER 31, 2010, 2009 AND 2008
NewStar’s basic and diluted income per share for 2010 was $0.21 and $0.19 on net income of $10.2 million compared to a basic and diluted loss per share for 2009 of $0.90 on a net loss of $44.3 million and basic and diluted income per share of $0.46 on net income of $22.4 million for 2008. Our managed loan portfolio was $2.2 billion at December 31, 2010 compared to $2.6 billion at December 31, 2009 and $3.0 billion at December 31, 2008. During 2010, loans owned by the NCOF decreased $90.6 million to $451.9 million at year end.
Loan portfolio yield
Loan portfolio yield, which is interest income on our loans divided by the average balances outstanding of our loans, was 6.02% for 2010, 6.03% for 2009 and 7.67% for 2008. The portfolio yield for accruing loans was 6.62% for 2010. The decrease from 2008 to 2009 in loan portfolio yield was primarily driven by a decrease in three-month LIBOR over the prior year, the increase of loans on non-accrual status and, to a lesser extent, changes in product mix and credit spreads in our loan portfolio. The portfolio yield for accruing loans was 6.41% for 2009.
Net interest margin
Net interest margin, which is net interest income divided by average interest earning assets, was 3.60% for 2010, 3.98% for 2009 and 4.02% for 2008. The primary factors impacting net interest margin were accelerated amortization of deferred financing fees resulting from the repayment of our Deutsche Bank term debt facility and the reduction of the commitment amount under our credit facility with Citicorp, changes in three-month LIBOR, non-accrual loans, our product mix, debt to equity ratio, credit spreads and cost of borrowings.
Efficiency ratio
Our efficiency ratio, which is total operating expenses divided by net interest income before provision for credit losses plus total non-interest income, was 44.74% for 2010, 39.69% for 2009 and 36.87% for 2008. The increase in our efficiency ratio during 2010 as compared to 2009 was primarily due to a decrease in net interest income during 2010, partially offset by an increase in non-interest income as a result of the gain on acquisition. The increase in our efficiency ratio during 2009 as compared to 2008 was primarily due to a decrease in net interest income and non-interest income during 2009.
Allowance for credit losses
Allowance for credit losses ratio, which is allowance for credit losses divided by outstanding gross loans excluding loans held-for-sale, was 4.99% at December 31, 2010, 5.68% as of December 31, 2009 and 2.25% as of December 31, 2008. The decrease in the allowance for credit losses ratio is primarily due to slowing negative credit migration, improving economic conditions and, a decrease in the balances of the general and specific allowance for credit losses. The decrease in the general allowance for credit losses was primarily due to the decrease in our outstanding loan portfolio. The decrease in our outstanding gross loans was primarily due to loan payments and charge-offs of impaired loans. At December 31, 2010, the specific allowance for credit losses was $60.4 million, and the general allowance for credit losses was $24.4 million. The allowance for credit losses at December 31, 2009 included a specific allowance of $75.4 million and a general allowance of $39.1 million.
31
Table of Contents
The allowance for credit losses at December 31, 2008 included specific allowance of $15.7 million and a general allowance of $38.3 million. The decrease in our specific allowance in 2010 as compared to 2009 is primarily due to charge offs of loans with a previously established specific allowance. We continually evaluate our allowance for credit losses methodology. If we determine that a change in our allowance for credit losses methodology is advisable, as a result of the rapidly changing economic environment or otherwise, the revised allowance methodology may result in higher or lower levels of allowance. Moreover, actual losses under our current or any revised methodology may differ materially from our estimate.
Delinquent loan rate
Delinquent loan rate, which is total delinquent loans that are 60 days or more past due, divided by outstanding gross loans, was 6.74% as of December 31, 2010 as compared to 6.15% as of December 31, 2009. Given prevailing economic and market conditions, we expect the delinquent loan rate to remain elevated if economic conditions continue to negatively impact the financial performance of certain borrowers and their ability to meet their obligations on a timely basis.
Delinquent loan rate for accruing loans 60 days or more past due
Delinquent loan rate for accruing loans 60 days or more past due, which is total delinquent accruing loans net of charge offs that are 60 days or more past due and less than 90 days past due, divided by outstanding gross loans, was 0.50% as of December 31, 2010 as compared to 0.99% as of December 31, 2009. Given prevailing economic and market conditions, we expect the delinquent accruing loan rate to remain elevated if economic conditions continue to negatively impact the financial performance of certain borrowers and their ability to meet their obligations on a timely basis.
Non-accrual loan rate
Non-accrual loan rate is defined as total balances outstanding of loans on non-accrual status divided by the total outstanding balance of our loans held for investment. Loans are put on non-accrual status if they are 90 days or more past due or if management believes it is probable that the Company will be unable to collect contractual principal and interest in the normal course of business. The non-accrual loan rate was 7.98% as of December 31, 2010 and 8.08% as of December 31, 2009. As of December 31, 2010 and 2009, the aggregate outstanding balance of non-accrual loans was $135.6 million and $162.7 million, respectively and total outstanding loans held for investment were $1.7 billion and $2.0 billion, respectively. Given prevailing economic and market conditions, we expect the non-accrual loan rate to remain elevated if economic conditions continue to impair certain borrowers’ ability to fully repay principal and interest under the terms of their loan agreement.
Non-performing asset rate
Non-performing asset rate is defined as the sum of total balances outstanding of loans on non-accrual status and other real estate owned, divided by the sum of the total outstanding balance of our loans held for investment and other real estate owned. The non-performing asset rate was 8.17% as of December 31, 2010 and 8.55% as of December 31, 2009. As of December 31, 2010 and 2009 the sum of the aggregate outstanding value of non-performing assets was $139.0 million and $172.1 million, respectively. Given prevailing economic and market conditions, we expect the non-performing asset rate to remain elevated if economic conditions continue to impair certain borrowers’ ability to fully repay principal and interest under the terms of their loan agreements.
Net charge off rate (end of period loans)
Net charge off rate as a percentage of end of period loan portfolio is defined as annualized charge offs net of recoveries divided by the total outstanding balance of our loans held for investment. A charge off occurs when management believes that all or part of the principal of a particular loan is no longer recoverable and will not be
32
Table of Contents
repaid. For 2010, 2009 and 2008, the net charge off rate was 3.69%, 3.61% and 0.82%, respectively. We expect the net charge off rate (end of period loans) to remain elevated if economic conditions continue to impair certain borrowers’ ability to fully repay principal and interest under the terms of their loan agreement.
Net charge off rate (average period loans)
Net charge off rate as a percentage of average period loan portfolio is defined as annualized charge offs net of recoveries divided by the average total outstanding balance of our loans held for investment for the period. For 2010, 2009 and 2008, the net charge off rate was 3.36%, 3.22% and 0.82%, respectively. We expect the net charge off rate (average period loans) to remain elevated if economic conditions continue to impair certain borrowers’ ability to fully repay principal and interest under the terms of their loan agreement.
Return on average assets
Return on average assets, which is net income divided by average total assets was 0.51% for 2010 and 0.86% for 2008. Return on average assets was not meaningful for 2009 as we had a net loss.
Return on average equity
Return on average equity, which is net income divided by average equity, was 1.87% for 2010 and 3.96% for 2008. Return on average equity was not meaningful for 2009 as we had a net loss.
33
Table of Contents
Review of Consolidated Results
A summary of NewStar’s consolidated financial results for the years ended December 31, 2010, 2009 and 2008 follows:
| Year Ended December 31, | ||||||||||||
| 2010 | 2009 | 2008 | ||||||||||
| ($ in thousands) | ||||||||||||
| Net interest income: |
||||||||||||
| Interest income |
$ | 112,826 | $ | 136,569 | $ | 188,770 | ||||||
| Interest expense |
40,558 | 41,927 | 86,216 | |||||||||
| Net interest income |
72,268 | 94,642 | 102,554 | |||||||||
| Provision for credit losses |
32,997 | 133,093 | 38,224 | |||||||||
| Net interest income (loss) after provision for credit losses |
39,271 | (38,451 | ) | 64,330 | ||||||||
| Non-interest income: |
||||||||||||
| Fee income |
2,409 | 1,657 | 4,518 | |||||||||
| Asset management income |
2,872 | 2,934 | 6,283 | |||||||||
| Gain on derivatives |
28 | 533 | 2,157 | |||||||||
| Gain (loss) on sale of loans and debt securities |
(116 | ) | — | 282 | ||||||||
| Gain on acquisition |
5,649 | — | — | |||||||||
| Loss on investments in debt securities |
— | — | (932 | ) | ||||||||
| Loss on residual interest in securitization |
— | — | (631 | ) | ||||||||
| Other income |
7,854 | 5,529 | 7,253 | |||||||||
| Total non-interest income |
18,696 | 10,653 | 18,930 | |||||||||
| Operating expenses: |
||||||||||||
| Compensation and benefits |
26,418 | 26,403 | 30,413 | |||||||||
| Occupancy and equipment |
2,094 | 3,121 | 3,286 | |||||||||
| General and administrative expenses |
12,101 | 12,911 | 11,090 | |||||||||
| Total operating expenses |
40,613 | 42,435 | 44,789 | |||||||||
| Income (loss) before income taxes |
17,354 | (70,233 | ) | 38,471 | ||||||||
| Income tax expense (benefit) |
6,935 | (24,353 | ) | 16,073 | ||||||||
| Net income (loss) before noncontrolling interest |
10,419 | (45,880 | ) | 22,398 | ||||||||
| Net loss (income ) attributable to noncontrolling interest |
(187 | ) | 1,620 | — | ||||||||
| Net income (loss) |
$ | 10,232 | $ | (44,260 | ) | $ | 22,398 | |||||
Comparison of the Years Ended December 31, 2010 and 2009
Interest income. Interest income decreased $23.8 million, to $112.8 million for 2010 from $136.6 million for 2009. The decrease was primarily due to a decrease in the yield on average interest earning assets to 5.62% from 5.74%, primarily driven by the decrease in the average balance of our interest earning assets, and a decrease in three-month LIBOR. Average three-month LIBOR decreased from 0.69% for 2009 to 0.34% for 2010.
Interest expense. Interest expense decreased $1.3 million, to $40.6 million for 2010 from $41.9 million for 2009. The decrease was primarily due to a decrease in the average balance of our interest bearing liabilities, partially offset by the accelerated amortization of certain deferred financing fees and an increase in our cost of borrowings. The decrease in the average balance of our interest bearing liabilities is primarily attributable to the reduction of total debt from $1.6 billion as of December 31, 2009 to $1.4 billion as of December 31, 2010. During 2010, we accelerated the amortization of $3.9 million of deferred financing fees resulted from the repayment of our Deutsche Bank term debt facility and the reduction of the commitment amount under our credit
34
Table of Contents
facility with Citicorp. The increase in our cost of borrowings, to 2.84% from 2.35%, was primarily attributable to the higher cost of borrowings associated with the recent amendments to our credit facilities and the term debt securitization that we completed in January 2010.
Net interest margin. Net interest margin decreased to 3.60% for 2010 from 3.98% for 2009. The decrease in net interest margin was primarily due to an increase in our average cost of interest bearing liabilities, a decrease in our average yield on interest earning assets, and non-payment of interest income from non-accrual loans, partially offset by an increase in interest yields on new loan originations and re-pricings subsequent to December 31, 2009. The increase in average cost of funds is primarily due to the accelerated amortization of $3.9 million of deferred financing fees resulting from the repayment of our Deutsche Bank term debt facility and the reduction of the commitment amount under our credit facility with Citicorp, and the higher cost of funds from our new term debt securitization and new revolving note credit facility with Fortress (both completed in January 2010). The decrease in yield is primarily due to a decrease in three-month LIBOR. The net interest spread, the difference between gross yield on our interest earning assets and the total cost of our interest bearing liabilities, decreased to 2.78% from 3.39%. The decline in LIBOR negatively impacted the net interest margin, which was more than offset by LIBOR floor provisions included in certain of our customer contracts. At December 31, 2010, 56% of our adjustable rate loans included interest rate floors. Non-accrual loans negatively impacted the net interest margin by 0.23%, which was offset by an increase in interest spreads of 0.23%.
The following table summarizes the yield and cost of interest earning assets and interest bearing liabilities for 2010 and 2009:
| Year Ended December 31, 2010 | Year Ended December 31, 2009 | |||||||||||||||||||||||
| ($ in thousands) | ||||||||||||||||||||||||
| Average Balance |
Interest Income/ Expense |
Average Yield/ Cost |
Average Balance |
Interest Income/ Expense |
Average Yield/ Cost |
|||||||||||||||||||
| Total interest earning assets |
$ | 2,007,908 | $ | 112,826 | 5.62 | % | $ | 2,379,622 | $ | 136,569 | 5.74 | % | ||||||||||||
| Total interest bearing liabilities |
1,430,526 | 40,558 | 2.84 | 1,782,105 | 41,927 | 2.35 | ||||||||||||||||||
| Net interest spread |
$ | 72,268 | 2.78 | % | $ | 94,642 | 3.39 | % | ||||||||||||||||
| Net interest margin |
3.60 | % | 3.98 | % | ||||||||||||||||||||
Provision for credit losses. The provision for credit losses decreased to $33.0 million for 2010 from $133.1 million for 2009. The decrease in the provision was primarily due to a decrease of $84.8 million of specific provisions and a decrease of $15.3 million of general provisions recorded during 2010 as compared to 2009. During 2010, we recorded specific provisions of $47.7 million compared to $132.5 million recorded during 2009. The decrease in the specific component of the provision for credit losses was principally due to impaired loans charged off during 2010, slowing negative credit migration, and improving economic conditions. The decrease in the general component of the provision for credit losses was principally due to the $288.6 million decrease in total loans net as compared to December 31, 2009. Our general allowance for credit losses covers probable losses in our loan portfolio with respect to loans for which no specific impairment has been identified. A specific provision for credit losses is recorded with respect to loans for which it is probable that we will be unable to collect all amounts due in accordance with the contractual terms of the loan agreement for which there is impairment recognized. Impaired loans, which include all of our delinquent loans and troubled debt restructurings, as a percentage of “Loans, net” increased to 22% as of December 31, 2010 as compared to 18% as of December 31, 2009. When a loan is classified as impaired, the loan is evaluated for a specific allowance and a specific provision may be recorded, thereby removing it from consideration under the general component of the allowance analysis. Consequently, as the percentage of impaired loans in our loan portfolio increased as compared to December 31, 2009, the percentage of loans in our loan portfolio being evaluated under our general allowance analysis has decreased.
35
Table of Contents
A general allowance is provided for loans that are not impaired. The Company employs a variety of internally developed and third-party modeling and estimation tools for measuring credit risk, which are used in developing an allowance for loan losses on outstanding loans. The Company’s allowance framework addresses economic conditions, capital market liquidity and industry circumstances from both a top-down and bottom-up perspective. The Company considers and evaluates changes in economic conditions, credit availability, industry and multiple obligor concentrations in assessing both probabilities of default and loss severities as part of the general component of the allowance for loan losses.
On at least a quarterly basis, loans are internally risk-rated based on individual credit criteria, including loan type, loan structures (including balloon and bullet structures common in the Company’s Leveraged Finance and Real Estate cash flow loans), borrower industry, payment capacity, location and quality of collateral if any (including the Company’s Real Estate loans). Borrowers provide the Company with financial information on either a monthly or quarterly basis. Ratings, corresponding assumed default rates and assumed loss severities are dynamically updated to reflect any changes in borrower condition or profile.
For Leveraged Finance loans, the data set used to construct probabilities of default in its allowance for loan losses model, Moody’s CRD Private Firm Database, primarily contains middle market loans that share attributes similar to the Company’s loans. The Company also considers the quality of the loan terms in determining a loan loss in the event of default.
For Real Estate loans, the Company employs two mechanisms to capture the impact of industry and economic conditions. First, a loan’s risk rating, and thereby its assumed default likelihood, can be adjusted to account for overall commercial real estate market conditions. Second, to the extent that economic or industry trends adversely affect a substandard rated borrower’s loan-to-value ratio enough to impact its repayment ability, the Company applies a stress multiplier to the loan’s probability of default. The multiplier is designed to account for default characteristics that are difficult to quantify when market conditions cause commercial real estate prices to decline.
During 2010, the Company refined its allowance for credit losses methodology regarding commercial real estate. If the Company determines that additional changes in its allowance for credit losses methodology are advisable, as a result of changes in the economic environment or otherwise, the revised allowance methodology may result in higher or lower levels of allowance. Moreover, given uncertain market conditions, actual losses under the Company’s current or any revised allowance methodology may differ materially from the Company’s estimate.
Additionally, when determining the amount of the general allowance, the Company supplements the base amount with a judgmental amount which is governed by a score card system comprised of ten individually weighted risk factors. The risk factors are designed based on those outlined in the Comptrollers of the Currency’s Allowance for Loan and Lease Losses Handbook. The Company also performs a ratio analysis of comparable money center banks, regional banks and finance companies. While the Company does not rely on this peer group comparison to set the level of allowance for credit losses, it does assist management in identifying market trends and serves as an overall reasonableness check on the allowance for credit losses computation.
A loan is considered impaired when it is probable that a creditor will be unable to collect all amounts due according to the contractual terms of the loan agreement. Impairment of a loan is based upon (i) the present value of expected future cash flows discounted at the loan’s effective interest rate, (ii) the loan’s observable market price, or (iii) the fair value of the collateral if the loan is collateral dependent, depending on the circumstances and our collection strategy. Impaired loans are identified based on the loan-by-loan risk rating process described above. It is the Company’s policy during the reporting period to record a specific provision for credit losses for all loans for which we have serious doubts as to the ability of the borrowers to comply with the present loan repayment terms.
36
Table of Contents
Impaired loans at December 31, 2010 and 2009 were in both Real Estate and in Leveraged Finance, over a range of industries impacted by the then current economic environment including the following: Buildings and Commercial Real Estate, Broadcast and Entertainment, Nondurable Consumer Products, Energy and Chemical Services, Financial Services, Healthcare, Printing and Publishing, Restaurants, and Industrial and Other Business Services. For impaired Leveraged Finance loans, the Company measured impairment based on expected cash flows utilizing relevant information provided by the borrower and consideration of other market conditions or specific factors impacting recoverability. Such amounts are discounted based on original loan terms. For impaired Real Estate loans, the Company determined that the loans were collateral dependent and measured impairment based on the fair value of the related collateral utilizing recent appraisals from third-party appraisers, as well as internal estimates of market value.
Non-interest income. Non-interest income increased $8.0 million, to $18.7 million for 2010 from $10.7 million for 2009. The increase is primarily due to a gain of $5.6 million recognized in connection with the acquisition of Core, a $2.9 million improvement in impairment of other real estate owned, and a $1.9 million improvement in equity instrument impairments, partially offset by a $2.5 million gain recognized in 2009 in connection with the sale of an equity instrument.
Operating expenses. Operating expenses decreased $1.8 million, to $40.6 million for 2010 from $42.4 million for 2009. General and administrative expenses decreased $0.8 million due primarily to decrease in potential acquisition costs. Occupancy and equipment expenses decreased $1.1 million primarily due to less office space.
Income taxes. For 2010 and 2009, we provided for income taxes based on an effective tax rate of 40% and 35%, respectively. Our effective tax rate for 2010 and 2009 reflects the impact of nondeductible compensation expenses incurred in connection with our initial public offering and the impact of a related discrete item resulting from vesting events in 2009.
As of December 31, 2010 and 2009, we had net deferred tax assets of $48.1 million and $56.4 million, respectively. In assessing the realizability of deferred tax assets, management considers whether it is more likely than not that some portion or all of the deferred tax assets will not be realized. We considered all available evidence, both positive and negative, in determining the realizability of deferred tax assets at December 31, 2010. We considered carryback availability, the scheduled reversals of deferred tax liabilities, projected future taxable income during the reversal periods, and tax planning strategies in making this assessment. We also considered our recent history of taxable income, trends in our earnings and tax rate, positive financial ratios, and the impact of the downturn in the current economic environment (including the impact of credit on allowance and provision for loan losses; and the impact on funding levels) on the Company. Based upon our assessment, we believe that a valuation allowance of $0.1 million is necessary as of December 31, 2010. As of December 31, 2010, our deferred tax asset was primarily comprised of $34.1 million related to our allowance for credit losses and $11.9 million related to equity compensation.
Further, we evaluated our business plans and results during our forecast period of future taxable income (including consideration of liquidity, available sources of funding and capital from existing sources). Our forecast utilized in our December 31, 2010 analysis included a sufficient level of earnings over a reasonable period of time.
Based upon carryback availability, the timing of reversals of deferred tax assets and liabilities including the impact of available carryback and carryforward periods, and projections for future taxable income over the periods in which the deferred tax assets are deductible, management believes it is more likely than not that the Company will realize the benefits of these deductible differences. The amount of the deferred tax asset considered realizable, however, could be reduced in the near term if estimates of future taxable income during the carryforward period are reduced.
37
Table of Contents
Comparison of the Years Ended December 31, 2009 and 2008
Interest income. Interest income decreased $52.2 million, to $136.6 million for 2009 from $188.8 million for 2008. The decrease was primarily due to a decrease in the yield on average interest earning assets to 5.74% from 7.40%, primarily driven by a decrease in three-month LIBOR and the increase in loans on non-accrual status. Average three-month LIBOR decreased from 3.23% for the year ended December 31, 2008 to 0.69% for the year ended December 31, 2009.
Interest expense. Interest expense decreased $44.3 million, to $41.9 million for 2009 from $86.2 million for 2008. The decrease was primarily due to a decrease in our cost of borrowings and a decrease in the average balance of our interest bearing liabilities. The decrease in our cost of borrowings, to 2.35% from 4.39%, was primarily attributable to a decrease in three-month LIBOR and increased use of lower cost term debt securitizations. The decrease in the average balance of our interest bearing liabilities is primarily attributable to the reduction of total debt from $1.9 billion as of December 31, 2008 to $1.6 billion as of December 31, 2009.
Net interest margin. Net interest margin decreased to 3.98% for 2009 from 4.02% for 2008. The decrease in net interest margin was primarily due to a decrease in our average yield on interest earning assets and non-payment of interest income from non-accrual loans, partially offset by an increase in interest yields on 2009 new loan originations and re-pricings and a decrease in our average cost of interest bearing liabilities. The decrease in yield and cost is primarily due to a decrease in three-month LIBOR. The net interest spread, the difference between gross yield on our interest earning assets and the total cost of our interest bearing liabilities, increased to 3.39% from 3.01%. The decline in LIBOR negatively impacted the net interest margin, which was partially offset by LIBOR floor provisions included in our customer contracts. At December 31, 2009, 39% of our adjustable rate loans included interest rate floors. Non-accrual loans negatively impacted the net interest margin by 0.25%, which was offset by an increase in interest spreads 0.32%.
The following table summarizes the yield and cost of interest earning assets and interest bearing liabilities for 2009 and 2008:
| Year Ended December 31, 2009 | Year Ended December 31, 2008 | |||||||||||||||||||||||
| ($ in thousands) | ||||||||||||||||||||||||
| Average Balance |
Interest Income/ Expense |
Average Yield/ Cost |
Average Balance |
Interest Income/ Expense |
Average Yield/ Cost |
|||||||||||||||||||
| Total interest earning assets |
$ | 2,379,622 | $ | 136,569 | 5.74 | % | $ | 2,551,602 | $ | 188,770 | 7.40 | % | ||||||||||||
| Total interest bearing liabilities |
1,782,105 | 41,927 | 2.35 | 1,962,796 | 86,216 | 4.39 | ||||||||||||||||||
| Net interest spread |
$ | 94,642 | 3.39 | % | $ | 102,554 | 3.01 | % | ||||||||||||||||
| Net interest margin |
3.98 | % | 4.02 | % | ||||||||||||||||||||
Provision for credit losses. The provision for credit losses increased to $133.1 million for 2009 from $38.2 million for 2008. The increase in the provision was primarily due to $132.5 million of specific provisions recorded during 2009 for impaired loans. The decrease in the general component of the provision for credit losses to 0.5% of the total provision for 2009, as compared to 19.3% of the total provision for 2008, was principally due to the migration of loans covered by our general allowance for credit losses to impaired loans covered by our specific allowance for credit losses as difficult economic conditions continued to have a negative impact on the financial performance of our borrowers and their ability to make their scheduled payments. Loans subject to our general allowance for credit losses declined to $1.7 billion at December 31, 2009 as compared to $2.3 billion at both December 31, 2008 and 2007. Our general allowance for credit losses covers probable losses in our loan portfolio with respect to loans for which no specific impairment has been identified. A specific provision for credit losses is recorded with respect to loans for which it is probable that we will be unable to collect all amounts due in accordance with the contractual terms of the loan agreement for which there is impairment recognized. Impaired loans, which include all of our delinquent loans and all troubled debt restructurings, as a percentage of “Loans, net” increased to 18% as of December 31, 2009 as compared to 5% as of December 31,
38
Table of Contents
2008. When a loan is classified as impaired, the loan is evaluated for a specific allowance and a specific provision may be recorded, thereby removing it from consideration under the general component of the allowance analysis. Consequently, as the number and aggregate amount of impaired loans have increased and we have added to the specific reserve, the aggregate amount of loans being evaluated under our general allowance analysis has decreased.
Non-interest income. Non-interest income decreased $8.3 million, to $10.7 million for 2009 from $18.9 million for 2008. The decrease is primarily due to a $2.9 million decrease in fee income, a $3.3 million decrease in asset management income, a $2.3 million decline in fair value of other real estate owned, as well as the loss of $1.6 million attributable to the consolidation of the noncontrolling interest of the entity which owns the other real estate owned, a $1.9 million loss on the sale of other real estate owned, and a $6.9 million gain recognized in connection with the repurchase of debt during 2008, partially offset by a $7.8 million gain recognized in connection with the repurchase of debt during 2009, and a $3.0 million gain on sale of an equity instrument.
Operating expenses. Operating expenses decreased $2.4 million, to $42.4 million for 2009 from $44.8 million for 2008. Employee compensation and benefits decreased $4.0 million primarily due to a decrease in incentive compensation, a decrease in the non-cash compensation charge related to restricted stock grants made since our inception, including equity awards made in connection with the initial public offering and lower headcount, partially offset by severance costs. General and administrative expenses increased $1.8 million due primarily to $1.6 million of acquisition-related costs and loan workout costs of $1.1 million. Occupancy and equipment expenses decreased $0.2 million.
Income taxes. For 2009 and 2008, we provided for income taxes based on an effective tax rate of 35% and 42%, respectively. Our effective tax rate for 2009 reflects the impact of nondeductible compensation expenses incurred in connection with our initial public offering and the impact of a related discrete item resulting from vesting events in 2009. As of December 31, 2009 and 2008, we had net deferred tax assets of $56.4 million and $31.2 million, respectively.
39
Table of Contents
FINANCIAL CONDITION, LIQUIDITY AND CAPITAL RESOURCES
Our primary sources of liquidity consist of cash flow from operations, credit facilities, term debt securitizations and proceeds from equity and debt offerings. We believe these sources will be sufficient to fund our current operations, lending activities and other short-term liquidity needs. Our future liquidity needs will be determined primarily based on the credit performance of our loan portfolio and origination volume. We may need to raise additional capital through the incurrence of indebtedness or issuance of equity based on various factors, including if the level of non-accrual loans increases faster than expected, recoveries are lower than anticipated, we are unable to fund certain loans with credit facilities, or if our cash flow from operations is lower than expected. We may not be able to raise debt or equity capital on acceptable terms or at all. The incurrence of additional debt will increase our leverage and interest expense, and the issuance of any equity or securities exercisable, convertible or exchangeable into Company common stock may be dilutive for existing shareholders.
Conditions in the capital markets continued to improve in the fourth quarter of 2010 as economic growth in the US gained momentum. The larger, more liquid segments of the securitization markets have also substantially recovered, supporting increasing levels of new issuance for securities backed by mortgages, credit cards and auto loans. As liquidity has returned to those asset classes and market conditions normalized, the securitization markets for other asset types, including CLOs, have also recovered to a point that we believe they provide a reliable source of capital for companies like NewStar. Conditions in the securitization market for bank loans, which the Company partially relies upon for funding, have continued to improve as loan values have recovered and default rates have declined. The pace of recovery in this market has been slow, but we expect the favorable trends to continue as spreads tighten across other types of asset-backed securities and investors continue to emphasize a preference for higher yielding, floating rate asset classes. In addition to these signs of improving market conditions, we believe the Company has substantially greater financial flexibility and other financing options due to the improvement in our financial performance.
We continue to believe that a significant lasting impact of the credit crisis will be a reduction in the number and capacity of lenders in the markets in which we compete. As a result, we anticipate that conditions in our lending markets will remain favorable for an extended period. In the first half of 2010, we experienced some downward pressure in pricing as lending capacity recovered faster than loan demand. In the second half, however, pricing stabilized and spreads widened as demand increased and lending capacity remained relatively flat.
In 2010, we renewed a warehouse credit facility on more favorable terms and amended a corporate debt facility to increase the size of the commitment and establish better pricing and advance rates among other improved terms. We believe that our ability to renew and amend these credit facilities reflects an overall improvement in the market conditions for funding and may represent a turning point in our ability to obtain financings on improved terms in the future. Despite these signs of improving market conditions, we cannot assure you that this will continue, and it is possible that market conditions could become more uncertain or worsen. If they do, we could face materially higher financing costs, which would affect our operating strategy and could materially and adversely affect our financial condition.
Cash and Cash Equivalents
As of December 31, 2010 and 2009, we had $54.4 million and $39.8 million, respectively, in cash and cash equivalents. We may invest a portion of cash on hand in short-term liquid investments. From time to time, we may use a portion of our non-restricted cash to pay down our credit facilities.
Restricted Cash
Separately, we had $178.4 million and $136.9 million of restricted cash as of December 31, 2010 and 2009, respectively. The restricted cash represents the balance of the principal and interest collections accounts and
40
Table of Contents
pre-funding amounts in our credit facilities, our term debt securitizations and customer holdbacks and escrows. The use of the principal collection accounts’ cash is limited to funding the growth of our loan portfolio within the facilities or paying down related credit facilities or term debt securitizations. As of December 31, 2010, we could use $41.1 million of restricted cash to fund new or existing loans. The interest collection account cash is limited to the payment of interest, servicing fees and other expenses of our credit facilities and term debt securitizations and, if either a ratings downgrade or failure to receive ratings confirmation occurs on the rated notes in a term debt securitization at the end of the funding period or if coverage ratios are not met, paying down principal with respect thereto. Cash to fund the growth of our loan portfolio and to pay interest on our term debt securitizations represented a large portion of our restricted cash balance at December 31, 2010.
Asset Quality and Allowance for Loan Losses
If a loan is 90 days or more past due, or if management believes it is probable we will unable to collect contractual principal and interest in the normal course of business, it is our policy to place the loan on non-accrual status. If a loan financed by a term debt securitization is placed on non-accrual status, the loan may remain in the term debt securitization and excess interest spread cash distributions to us will cease until cash accumulated in the term debt securitization equals the outstanding balance of the non-accrual loan. When a loan is on non-accrual status, accrued interest previously recognized as interest income subsequent to the last cash receipt in the current year will be reversed, and the recognition of interest income on that loan will stop until factors indicating doubtful collection no longer exist and the loan has been brought current. We may make exceptions to this policy if the loan is well secured and is in the process of collection. As of December 31, 2010, we had impaired loans with an aggregate outstanding balance of $356.6 million. Impaired loans with an aggregate outstanding balance of $222.6 million have been restructured and classified as troubled debt restructurings. Impaired loans with an aggregate outstanding balance of $135.6 million were on non-accrual status. Impaired loans of $114.5 million were greater than 60 days past due and classified as delinquent. During 2010, we recorded $47.7 million of specific provisions for impaired loans. Included in our specific allowance for impaired loans was $26.7 million related to delinquent loans.
We are closely monitoring the credit quality of our loans. We may experience additional loan delinquencies, losses, specific reserves, non-accruals, troubled debt restructurings and charge offs due to changes in economic conditions and as our portfolio continues to season.
We have provided an allowance for loan losses to provide for probable losses inherent in our loan portfolio. Our allowance for loan losses as of December 31, 2010 and 2009 was $84.5 million and $113.9 million, or 4.98% and 5.65% of loans, gross, respectively. As of December 31, 2010, we also had a $0.3 million allowance for unfunded commitments, resulting in an allowance for credit losses of 4.99%.
The allowance for credit losses is based on a review of the appropriateness of the allowance for credit losses and its two components on a quarterly basis. The estimate of each component is based on observable information and on market and third-party data believed to be reflective of the underlying credit losses being estimated.
It is the Company’s policy that during the reporting period to record a specific provision for credit losses for all loans which we have identified impairments. Subsequently, we may charge off the portion of the loan for which a specific provision was recorded. All of these loans are classified as impaired (if they have not been so classified already as a result of a troubled debt restructuring) and are disclosed in the Allowance for Credit Losses footnote to the financial statements.
41
Table of Contents
Activity in the allowance for loan losses for the years ended December 31, 2010, 2009 and 2008 was as follows:
| Year Ended December 31, | ||||||||||||
| 2010 | 2009 | 2008 | ||||||||||
| ($ in thousands) | ||||||||||||
| Balance as of beginning of period |
$ | 113,865 | $ | 52,498 | $ | 33,387 | ||||||
| General provision for loan losses |
(14,371 | ) | 1,493 | 7,990 | ||||||||
| Specific provision for loan losses |
47,695 | 132,474 | 30,855 | |||||||||
| Net charge offs |
(62,686 | ) | (67,600 | ) | (19,734 | ) | ||||||
| Charge offs upon transfer to loans held-for-sale |
–– | (5,000 | ) | — | ||||||||
| Balance as of end of period |
84,503 | 113,865 | 52,498 | |||||||||
| Allowance for losses on unfunded loan commitments |
278 | 605 | 1,479 | |||||||||
| Allowance for credit losses |
$ | 84,781 | $ | 114,470 | $ | 53,977 | ||||||
During 2010 we recorded a total provision for credit losses of $33.0 million. The Company decreased its allowance for credit losses 69 basis points to 4.99% of gross loans at December 31, 2010 from 5.68% at December 31, 2009.
Borrowings and Liquidity
As of December 31, 2010 and 2009, we had outstanding borrowings totaling $1.4 billion and $1.6 billion, respectively. Borrowings under our various credit facilities and term debt securitizations have supported our loan growth.
As of December 31, 2010, our funding sources, maximum debt amounts, amounts outstanding and unused debt capacity, subject to certain covenants and conditions, are summarized below:
| Funding Source |
Maximum Debt Amount |
Amounts Outstanding |
Unused Debt Capacity |
Maturity | ||||||||||||
| ($ in thousands) | ||||||||||||||||
| Credit facilities |
$ | 400,000 | $ | 108,502 | $ | 291,498 | 2011 – 2013 | |||||||||
| Term debt (1) |
1,465,703 | 1,278,868 | 181,261 | 2012 – 2022 | ||||||||||||
| Total |
$ | 1,865,703 | $ | 1,387,370 | $ | 472,759 | ||||||||||
| (1) | Maturities for term debt are based on contractual maturity dates. Actual maturities may occur earlier. |
We must comply with various covenants, the breach of which could result in a termination event, and at December 31, 2010, we were in compliance with all such covenants. These covenants vary depending on the type of facility and are customary for facilities of this type. These covenants include, but are not limited to, failure to service debt obligations, failure to meet liquidity covenants and tangible net worth covenants, and failure to remain within prescribed facility portfolio delinquency and charge-off levels.
Credit Facilities
As of December 31, 2010 we had three credit facilities: (i) a $75.0 million credit facility with Citicorp North America, Inc. (“Citicorp”), (ii) a $50.0 million facility with NATIXIS Financial Products, Inc. (“NATIXIS”) and (iii) a $225.0 million credit facility with DZ Bank AG Deutsche Zentral-Genossenschaftsbank Frankfurt (“DZ”).
We have a $75.0 million credit facility agreement with Citicorp that had an outstanding balance of $28.8 million and unamortized deferred financing fees of $0.7 million as of December 31, 2010. Interest on this facility
42
Table of Contents
accrues at a variable rate per annum, which was 2.84% at December 31, 2010. On March 19, 2010, we entered into an amendment to this credit facility that reduced the commitment amount under the facility to $75 million from $150 million and reduced the related demand note to $7.5 million from $15.0 million. Our $75.0 million credit facility with Citicorp was subject to an annual renewal in November 2010, which we extended to February 14, 2011. On February 14, 2011, we entered into an amendment to this credit facility which extended the maturity date to June 15, 2011 with a bullet maturity payment due at that time. Advances may be made at 28% of the borrowing base up to $10.0 million and may only be used to fund existing revolving loans. If in the future Citicorp decides not to renew its credit facility with us on the June 15, 2011 maturity date, our ability to make new borrowings under that facility would terminate. We expect to repay the outstanding balance of this credit facility on or before the maturity date.
We have a $50.0 million credit facility agreement with NATIXIS that had an outstanding balance of $41.5 million and unamortized deferred financing fees of $0.2 million as of December 31, 2010. Interest on this facility accrues at a variable rate per annum, which was 3.76% at December 31, 2010. On May 4, 2010, we entered into an amendment with NATIXIS which extended the maturity date from May 21, 2010 to May 20, 2011, among other things.
As part of our acquisition of Core, we became a party to an existing $225.0 million credit facility with DZ. The credit facility with DZ had an outstanding balance of $38.3 million as of December 31, 2010. Interest on this facility accrues at a variable rate per annum, which was 2.30% at December 31, 2010. As part of the agreement, there is a minimum payment of $2.8 million per annum required to be made. If the facility is not utilized to cover this minimum requirement a make-whole fee is required to be made. We are permitted to use the proceeds of borrowings under the credit facility to fund commitments under existing or new asset-based loans. This facility is scheduled to mature on April 25, 2013.
We had an $11.0 million credit facility agreement with Union Bank, N.A. The credit facility terminated on October 21, 2010.
Corporate Credit Facility
On January 5, 2010, we entered into a note agreement with Fortress Credit Corp., establishing a $75.0 million revolving credit facility. Under the credit facility, we could draw, repay and draw again prior to the maturity date, subject to availability under a borrowing base. The credit facility was scheduled to begin to reduce revolver commitments on July 5, 2011 and was scheduled to mature on July 5, 2013. On August 31, 2010, we entered into an amendment to this credit facility which increased the size of the credit facility to $100.0 million, consisting of a $50.0 million revolving credit facility and a $50.0 million term loan facility, extended the maturity date to August 31, 2014, and removed the scheduled revolver commitment reductions. In addition, the amendment decreased the credit facility pricing of advances to the London Interbank Offered Rate (LIBOR) plus 7.00%.
We are permitted to use the proceeds of borrowings under the credit facility for general corporate purposes including, but not limited to, funding loans, working capital, paying down outstanding debt, making certain types of acquisitions and repurchasing capital stock up to $10 million.
The applicable unused fee rate of the revolving credit facility is 4.0% of the undrawn amount of the facility when the total outstanding amount is less than 50% of the commitment amount, 3.0% of the undrawn amount of the facility when the total outstanding amount is greater than or equal to 50% but less than 75% of the commitment amount, and 2.0% of the undrawn amount of the facility when the total outstanding amount is greater than or equal to 75% of the commitment amount. As of December 31, 2010, we had not drawn any amounts from the revolving credit facility. As of December 31, 2010 unamortized deferred financing fees were $3.7 million.
43
Table of Contents
The term loan facility may be prepaid subject to a prepayment fee, payable whether the prepayment is voluntary or involuntary. If any such prepayment is made on or before August 30, 2012, the prepayment fee will be calculated for the period commencing on the date of such prepayment and continuing through August 30, 2012 and shall be equal to the product of 7.00% per annum multiplied by the amount of the prepayment. If any such prepayment is made after August 30, 2012, such prepayment fee will be equal to the product of (a) the amount of the prepayment and (b)(i) in the case of any such prepayment made during the period commencing on August 31, 2012 and ending on August 30, 2013, 2.00% and (ii) in the case of any such prepayment made at any time after August 30, 2013, 1%. On October 29, 2010, we drew $20.0 million from the term loan facility in connection with its acquisition of Core, and we subsequently drew the remaining $30.0 million on or before November 29, 2010. As of December 31, 2010, the term loan facility had an outstanding balance of $50.0 million.
Term Debt Facilities
As of December 31, 2010, we had one $75.5 million term debt facility with Wachovia Capital Markets, LLC (“Wachovia”). Interest on this facility accrues at a variable rate per annum, which was 4.01% at December 31, 2010. As of December 31, 2010, the outstanding balance was $70.6 million and unamortized deferred financing fees were $1.2 million. Wachovia completed a merger with Wells Fargo on December 31, 2008, but this merger did not impact the terms of our agreement.
We previously had a $250 million term debt financing agreement with Deutsche Bank AG, New York Branch. We paid off all outstanding borrowings and retired this facility with the proceeds received from the term debt securitization completed on January 7, 2010 described below.
Term Debt Securitizations
In August 2005 we completed a term debt transaction. In conjunction with this transaction we established a separate single-purpose bankruptcy-remote subsidiary, NewStar Trust 2005-1 (the “2005 CLO Trust”) and contributed $375 million in loans and investments (including unfunded commitments), or portions thereof, to the 2005 CLO Trust. We remain the servicer of the loans and investments. Simultaneously with the initial contributions, the 2005 CLO Trust issued $343.4 million of notes to institutional investors and issued $31.6 million of trust certificates of which we retained 100%. At December 31, 2010, the $220.4 million of outstanding drawn notes were collateralized by the specific loans and investments, principal collections account cash and principal payment receivables totaling $251.9 million. At December 31, 2010, deferred financing fees were $0.9 million. The 2005 CLO Trust permitted reinvestment of collateral principal repayments for a three-year period which ended in October 2008. During 2010, we repurchased $4.6 million of the 2005 CLO Trust’s Class D notes. During 2009, we repurchased $1.4 million of the 2005 CLO Trust’s Class D notes and $1.2 million of the Class E notes. During 2008, we repurchased $5.8 million of the 2005 CLO Trust’s Class E notes. During 2007, we repurchased $5.0 million of the 2005 CLO Trust’s Class E notes. During 2009, Moody’s downgraded all of the notes of the 2005 CLO Trust. As a result of the downgrades, amortization of the 2005 CLO Trust changed from pro rata to sequential, resulting in scheduled principal payments made in order of the notes seniority until all available funds are exhausted for each payment. During the second quarter of 2010, Standard and Poor’s downgraded all of the notes of the 2005 CLO Trust. During the third quarter of 2010, Fitch affirmed its ratings of the Class A-1 notes, the Class A-2 notes and the Class B notes, and downgraded the Class C notes, the Class D notes and the Class E notes. The downgrades during 2010 did not have any material consequence as the amortization of the 2005 CLO Trust changed from pro rata to sequential after the Moody’s downgrade in 2009. We receive a loan collateral management fee and excess interest spread.
We expect to receive a principal distribution when the term debt is retired. The most recent quarterly report dated January 13, 2011 identified $43.4 million of certain loan collateral in the 2005 CLO Trust as delinquent or charged-off under the terms of the trust indenture. As a result, the excess interest spread from the 2005 CLO Trust will be redirected and combined with recoveries and will be used to repay the outstanding notes until note
44
Table of Contents
redemptions equal the underlying non-accrual loan balances or until we purchase such loans. As of the most recent quarterly report, the amount trapped was $12.6 million. We may have additional defaults in the 2005-1 CLO Trust in the future. If we do not elect to remove any future defaulted loans, we would not expect to receive excess interest spread payments until the undistributed cash plus any recoveries equal the outstanding balances of defaulted loan collateral.
The following table sets forth selected information with respect to the 2005 CLO Trust:
| Notes and certificates originally issued |
Outstanding balance December 31, 2010 |
Borrowing spread to LIBOR |
Ratings (S&P/Moody’s/ Fitch)(1) |
|||||||||||||
| ($ in thousands) | % | |||||||||||||||
| 2005 CLO Trust: |
||||||||||||||||
| Class A-1 |
$ | 156,000 | $ | 87,374 | 0.28 | % | AA+/Aa2/AAA | |||||||||
| Class A-2 |
80,477 | 44,603 | 0.30 | AA+/Aa2/AAA | ||||||||||||
| Class B |
18,750 | 18,683 | 0.50 | A+/A2/AA | ||||||||||||
| Class C |
39,375 | 39,233 | 0.85 | B+/Ba1/BB | ||||||||||||
| Class D |
24,375 | 18,224 | 1.50 | CCC-/B1/CCC | ||||||||||||
| Class E |
24,375 | 12,279 | 4.75 | CCC-/Caa2/CC | ||||||||||||
| Total notes |
343,352 | 220,396 | ||||||||||||||
| Class F (trust certificates) |
31,648 | 31,538 | N/A | N/A | ||||||||||||
| Total for 2005 CLO Trust |
$ | 375,000 | $ | 251,934 | ||||||||||||
| (1) | The ratings were initially given in August 2005, are unaudited and are subject to change from time to time. Fitch affirmed its ratings on February 24, 2009 and downgraded the Class D notes and Class E notes. The Fitch downgrade did not have an impact on the 2005 CLO Trust. During the first quarter of 2009, Moody’s downgraded the Class C notes, the Class D notes and the Class E notes to the ratings shown above. During the third quarter of 2009, Moody’s downgraded the Class A-1 notes, the Class A-2 notes and the Class B notes to the ratings shown above. During the second quarter of 2010, Standard and Poor’s downgraded all of the notes to the ratings shown above. During the third quarter of 2010, Fitch downgraded the Class C notes, the Class D notes and the Class E notes to the ratings shown above. (source: Bloomberg Finance L.P.). |
In June 2006 we completed a term debt transaction. In conjunction with this transaction we established a separate single-purpose bankruptcy remote subsidiary, NewStar Commercial Loan Trust 2006-1 (the “2006 CLO Trust”) and contributed $500 million in loans and investments (including unfunded commitments), or portions thereof, to the 2006 CLO Trust. We remain the servicer of the loans. Simultaneously with the initial contributions, the 2006 CLO Trust issued $456.3 million of notes to institutional investors. We retained $43.8 million, comprising 100% of the 2006 Trust’s trust certificates. At December 31, 2010, the $392.6 million of outstanding drawn notes were collateralized by the specific loans and investments, principal collection account cash and principal payment receivables totaling $436.3 million. At December 31, 2010, deferred financing fees were $2.7 million. The 2006 CLO Trust permits reinvestment of collateral principal repayments for a five-year period ending in June 2011. Should we determine that reinvestment of collateral principal repayments are impractical in light of market conditions or if collateral principal repayments are not reinvested within a prescribed timeframe, such funds may be used to repay the outstanding notes. During 2010, we repurchased $3.0 million of the 2006 CLO Trust’s Class D notes and $3.0 million of the 2006 CLO Trust’s Class E notes. During 2009, we repurchased $6.5 million of the 2006 CLO Trust’s Class D notes and $1.8 million of the 2006 CLO Trust’s Class E notes. During 2008, we repurchased $3.3 million of the 2006 CLO Trust’s Class D and $2.5 million of the 2006 CLO Trust’s Class E notes, respectively. During 2009, Moody’s downgraded all of the notes of the 2006 CLO Trust. As a result of the downgrade, amortization of the 2006 CLO Trust changed from pro rata to sequential, resulting in future scheduled principal payments made in order of the notes seniority until all available funds are exhausted for each payment. During the second quarter of 2010, Standard and Poor’s
45
Table of Contents
downgraded the Class A-1 notes, the Class A-2 notes, the Class C notes, the Class D notes and the Class E notes of the 2006 CLO Trust. The downgrade did not have any material consequence as the amortization of the 2006 CLO Trust changed from pro rata to sequential after the Moody’s downgrade in 2009. We receive a loan collateral management fee and excess interest spread.
We expect to receive a principal distribution when the term debt is retired. The most recent quarterly report dated December 13, 2010 identified $37.6 million of certain loan collateral in the 2006 CLO Trust as delinquent or charged-off under the terms of the trust indenture. As a result, the excess interest spread from the 2006 CLO Trust will be redirected and combined with recoveries and will be used to repay the outstanding notes until note redemptions equal the underlying non-accrual loan balances or until we purchase such loans. As of the most recent quarterly report, the amount trapped was $21.6 million. We may have additional defaults in the 2006-1 CLO Trust in the future. If we do not elect to remove any future defaulted loans, we would not expect to receive excess interest spread payments until the undistributed cash plus any recoveries equal the outstanding balances of defaulted loan collateral.
The following table sets forth the selected information with respect to the 2006 CLO Trust:
| Notes and certificates originally issued |
Outstanding balance December 31, 2010 |
Borrowing spread to LIBOR |
Ratings (S&P/Moody’s/ Fitch)(1) |
|||||||||||||
| ($ in thousands) | % | |||||||||||||||
| 2006 CLO Trust: |
||||||||||||||||
| Class A-1 |
$ | 320,000 | $ | 298,881 | 0.27 | % | AA+/Aa2/AAA | |||||||||
| Class A-2 |
40,000 | 17,458 | 0.28 | AA+/Aa2/AAA | ||||||||||||
| Class B |
22,500 | 22,500 | 0.38 | AA/A3/AA | ||||||||||||
| Class C |
35,000 | 35,000 | 0.68 | BBB+/Ba1/A | ||||||||||||
| Class D |
25,000 | 12,250 | 1.35 | CCC+/B1/BBB | ||||||||||||
| Class E |
13,750 | 6,500 | 1.75 | CCC-/B2/BB | ||||||||||||
| Total notes |
456,250 | 392,589 | ||||||||||||||
| Class F (trust certificates) |
43,750 | 43,750 | N/A | N/A | ||||||||||||
| Total for 2006 CLO Trust |
$ | 500,000 | $ | 436,339 | ||||||||||||
| (1) | These ratings were initially given in June 2006, are unaudited and are subject to change from time to time. Fitch affirmed its ratings on February 24, 2009. During the first quarter of 2009, Moody’s downgraded the Class C notes, the Class D notes and the Class E notes to the ratings shown above. During the third quarter of 2009, Moody’s downgraded the Class A-1 notes, the Class A-2 notes and the Class B notes to the ratings shown above. During the second quarter of 2010, Standard and Poor’s downgraded the Class A-1 notes, the Class A-2 notes, the Class C notes, the Class D notes and the Class E notes to the ratings shown above. (source: Bloomberg Finance L.P.). |
In June 2007 we completed a term debt transaction. In conjunction with this transaction we established a separate single-purpose bankruptcy-remote subsidiary, NewStar Commercial Loan Trust 2007-1 (the “2007-1 CLO Trust”) and contributed $600 million in loans and investments (including unfunded commitments), or portions thereof, to the 2007-1 CLO Trust. The Company remains the servicer of the loans. Simultaneously with the initial contributions, the 2007-1 CLO Trust issued $546.0 million of notes to institutional investors. We retained $54.0 million, comprising 100% of the 2007-1 CLO Trust’s trust certificates. At December 31, 2010, the $445.8 million of outstanding drawn notes were collateralized by the specific loans and investments, principal collection account cash and principal payment receivables totaling $499.8 million. At December 31, 2010, deferred financing fees were $3.8 million. The 2007-1 CLO Trust permits reinvestment of collateral principal repayments for a six-year period ending in May 2013. Should we determine that reinvestment of collateral principal repayments are impractical in light of market conditions or if collateral principal repayments are not
46
Table of Contents
reinvested within a prescribed timeframe, such funds may be used to repay the outstanding notes. During 2010, we repurchased $5.0 million of the 2007-1 CLO Trust’s Class D notes. During 2009, we repurchased $1.0 million of the 2007-1 CLO Trust’s Class D notes. During 2009, Moody’s downgraded all of the notes of the 2007 CLO Trust. As a result of the downgrade, amortization of the 2007 CLO Trust changed from pro rata to sequential, resulting in future scheduled principal payments made in order of the notes seniority until all available funds are exhausted for each payment. During the second quarter of 2010, Standard and Poor’s downgraded the Class A-1 notes, the Class A-2 notes, the Class C notes, and the Class D notes of the 2007 CLO Trust. The downgrade did not have any material consequence as the amortization of the 2007 CLO Trust changed from pro rata to sequential after the Moody’s downgrade in 2009. We receive a loan collateral management fee and excess interest spread.
We expect to receive a principal distribution when the term debt is retired. If loan collateral in the 2007 CLO Trust is in default under the terms of the indenture, the excess interest spread from the 2007 CLO Trust could not be distributed until the undistributed cash plus recoveries equals the outstanding balance of the defaulted loan or if we elected to remove the defaulted collateral. We may have future defaults in the 2007-1 CLO Trust in the future. If we do not elect to remove any future defaulted loans, we would not expect to receive excess interest spread payments until the undistributed cash plus any recoveries equal the outstanding balances of any potential defaulted loan collateral. During 2010, we elected to purchase $38.8 million of defaulted collateral from the 2007-1 CLO to reduce the amount of excess interest spread that otherwise would have been required to be redistributed.
The following table sets forth selected information with respect to the 2007-1 CLO Trust:
| Notes originally issued |
Outstanding balance December 31, 2010 |
Borrowing spread to LIBOR |
Ratings (S&P/Moody’s/ Fitch)(1) |
|||||||||||||
| ($ in thousands) | ||||||||||||||||
| 2007-1 CLO Trust |
||||||||||||||||
| Class A-1 |
$ | 336,500 | $ | 318,587 | 0.24 | % | AA+/Aa2/AAA | |||||||||
| Class A-2 |
100,000 | 23,700 | 0.26 | AA+/Aa2/AAA | ||||||||||||
| Class B |
24,000 | 24,000 | 0.55 | AA/A2/AA | ||||||||||||
| Class C |
58,500 | 58,500 | 1.30 | BBB+/Ba1/A | ||||||||||||
| Class D |
27,000 | 21,000 | 2.30 | CCC+/Ba3/BBB+ | ||||||||||||
| Total notes |
546,000 | 445,787 | ||||||||||||||
| Class E (trust certificates) |
29,100 | 29,100 | N/A | N/A | ||||||||||||
| Class F (trust certificates) |
24,900 | 24,900 | N/A | N/A | ||||||||||||
| Total for 2007-1 CLO Trust |
$ | 600,000 | $ | 499,787 | ||||||||||||
| (1) | These ratings were initially given in June 2007, are unaudited and are subject to change from time to time. Fitch affirmed its ratings on February 24, 2009. During the first quarter of 2009, Moody’s downgraded the Class C notes and the Class D notes to the ratings shown above. During the third quarter of 2009, Moody’s downgraded the Class A-1 notes, the Class A-2 notes and the Class B notes to the ratings shown above. During the second quarter of 2010, Standard and Poor’s downgraded the Class A-1 notes, the Class A-2 notes, the Class C notes, and the Class D notes to the ratings shown above. (source: Bloomberg Finance L.P.). |
On January 7, 2010, we completed a term debt securitization. In conjunction with this transaction we established a separate single-purpose bankruptcy-remote subsidiary, NewStar Commercial Loan Trust 2009-1 (the “2009-1 CLO Trust”) and contributed $225 million in loans and investments (including unfunded commitments), or portions thereof, to the 2009-1 CLO Trust at close. We had the ability to contribute an additional $50 million of loan collateral by July 30, 2010 and contributed the full amount during the six months
47
Table of Contents
ended June 30, 2010. We remain the servicer of the loans. Simultaneously with the initial contributions, the 2009-1 CLO Trust issued $190.5 million of notes to institutional investors. We retained all of the Class C and subordinated notes, which totaled approximately $87.9 million, representing 32% of the value of the collateral pool. At December 31, 2010, the $99.5 million of outstanding notes were collateralized by the specific loans and investments, principal collection account cash and principal payment receivables totaling $187.4 million. At December 31, 2010, deferred financing fees were $2.3 million. The 2009-1 CLO Trust is a static pool of loans that does not permit for reinvestment of collateral principal repayments. Proceeds from this term debt securitization were used to repay all outstanding borrowings under our term debt facility with Deutsche Bank AG, New York Branch and certain advances under our credit facility with Citicorp North America, Inc. The 2009-1 CLO Trust is callable on the distribution date in July 2011.
| Notes originally issued |
Outstanding balance December 31, 2010 |
Interest rate |
Original maturity |
Ratings (Moody’s)(1) |
||||||||||||||||
| ($ in thousands) | ||||||||||||||||||||
| 2009-1 CLO Trust |
||||||||||||||||||||
| Class A |
$ | 148,500 | $ | 59,930 | Libor +3.75% | July 30, 2018 | Aaa | |||||||||||||
| Class B |
42,000 | 39,542 | Libor +5.00%(2) | July 30, 2018 | A2 | |||||||||||||||
| Total issued |
190,500 | 99,472 | ||||||||||||||||||
| Class C |
31,000 | 31,000 | Libor +5.50% | July 30, 2018 | Ba2 | |||||||||||||||
| Subordinated |
56,900 | 56,921 | N/A | July 30, 2018 | NR | |||||||||||||||
| $ | 278,400 | $ | 187,393 | |||||||||||||||||
| (1) | These ratings, initially given in January 2010, are unaudited and are subject to change from time to time. |
| (2) | The Class B notes carry a Libor +5.00% coupon rate but were priced at a 91.85% discount to yield Libor +7.50% on a par amount of $42.0 million. |
Stock Repurchase Program
On January 25, 2010, we announced that our Board of Directors had authorized the repurchase of up to $10 million of the Company’s common stock from time to time on the open market or in privately negotiated transactions. On December 3, 2010, we had repurchased the entire $10 million allotment of the Company’s stock. The timing and amount of any shares purchased were determined by our management based on its evaluation of market condition and other factors and required the use of cash. Upon the completion of our repurchase program, we had repurchased 1,372,300 shares of our common stock under the program at a weighted average price per share of $7.26.
Contractual Obligations
The following table sets forth information relating to our contractual obligations as of December 31, 2010:
| Payments due by period | Total | |||||||||||||||||||
| Less than 1 year |
1-3 years | 3-5 years | More than 5 years |
|||||||||||||||||
| ($ in thousands) | ||||||||||||||||||||
| Credit facilities (1) |
$ | 70,250 | $ | 38,252 | $ | — | $ | — | $ | 108,502 | ||||||||||
| Term debt (1) |
— | 70,624 | 50,000 | 1,158,244 | 1,278,868 | |||||||||||||||
| Non-cancelable operating leases |
1,243 | 1,000 | –– | — | 2,243 | |||||||||||||||
| Total |
$ | 71,493 | $ | 109,876 | $ | 50,000 | $ | 1,158,244 | $ | 1,389,613 | ||||||||||
| (1) | Amounts for credit facilities and term debt presented represent principal amounts due based on contractual maturity dates and do not include interest amounts owed. The actual timing of payments will ultimately vary from the above data due to future fundings and repayments we expect to occur. |
48
Table of Contents
DERIVATIVE INSTRUMENTS AND HEDGING ACTIVITIES
We maintain an overall risk management strategy that incorporates the use of derivative instruments to minimize significant unplanned fluctuations in earnings caused by interest rate volatility. Our operations are subject to risks resulting from interest rate fluctuations on our interest-earning assets and our interest-bearing liabilities. We seek to provide maximum levels of net interest income, while maintaining acceptable levels of interest rate and liquidity risk. As such, we enter into interest rate swap and interest rate cap agreements to hedge interest rate exposure to interest rate fluctuations on floating rate funding agreement liabilities that are matched with fixed rate securities. Under the interest rate swap contracts, we agree to exchange, at specified intervals, the difference between fixed and floating interest amounts calculated on an agreed-upon notional principal amount. We record the exchanged amount in net interest income in our statements of operations. Under the interest rate cap contracts, we agree to exchange, at specified intervals, the difference between a specified fixed interest (the cap) and floating interest amounts calculated on an agreed-upon notional principal amount, but only if the floating interest rate exceeds the cap rate. The interest rate caps currently are not matched to specific assets or liabilities and do not qualify for hedge accounting.
Interest rate risk mitigation products are offered to enable customers to meet their financing and risk management objectives. Derivative financial instruments consist predominantly of interest rate swaps, interest rate caps and floors. The interest rate risks to the Company of these customer derivatives is mitigated by entering into similar derivatives having offsetting terms with other counterparties consisting primarily of large financial institutions. The interest rate mitigation products do not qualify for hedge accounting treatment.
Gains and losses on derivatives not designated as hedges, including any cash payments made or received, are reported as gain (loss) on derivatives in our consolidated statements of operations.
During 2010, the Company entered into three short-term interest rate swap agreements which were designated and qualified as cash flow hedges of the risk of changes in the Company’s interest payments on LIBOR-indexed debt. All three swap agreements matured prior to December 31, 2010. During 2006, the Company entered into interest rate swap agreements which were designated and qualified as cash flow hedges of the risk of changes in the Company’s interest payments on LIBOR-indexed debt. At December 31, 2010, the lone remaining outstanding interest rate swap agreement had a notional value of $3.6 million and had a scheduled maturity of October 20, 2013. The Company records the contracted interest rate swap net amounts exchanged in interest expense in the accompanying consolidated statements of operations. During 2010 and 2009, the Company recorded hedge ineffectiveness of $(39,494) and $(28,405), respectively, which is included in gain (loss) on derivatives in the Company’s consolidated statements of operations. The Company estimates that the net amount of existing unrealized losses at December 31, 2010 expected to be classified from accumulated other comprehensive income into earnings within the next 12 months is approximately $0.5 million. The reclassification is expected to result in additional interest expense.
During 2008, we terminated interest rate swaps resulting in a net gain of $1.1 million. Additionally, we had $0.8 million of unrealized losses related to the terminated swaps which will be amortized over the lives of the hedged items. The deferred loss is classified in accumulated other comprehensive loss, net of tax, as a component of equity with the accretion of the deferred losses recognized into earnings.
49
Table of Contents
The table below provides information about our derivative financial instruments, excluding customer derivatives, as of December 31, 2010.
Summary of Derivative Positions at December 31, 2010
| 2011 | 2012 | 2013 | 2014 | 2015 | Thereafter | Total | Fair Value |
|||||||||||||||||||||||||
| ($ in thousands) | ||||||||||||||||||||||||||||||||
| Interest Rate Derivatives |
||||||||||||||||||||||||||||||||
| Interest rate swaps: |
||||||||||||||||||||||||||||||||
| Variable to fixed (average notional expected outstanding) |
$3,514 | $3,368 | $3,202 | $— | $— | $— | $10,084 | $(325) | ||||||||||||||||||||||||
| Average pay rate |
8.41% | 8.41% | 8.41% | — | — | — | ||||||||||||||||||||||||||
| Average receive rate |
|
1-mo USD LIBOR |
|
|
1-mo USD LIBOR |
|
|
1-mo USD LIBOR |
|
|
1-mo USD LIBOR |
|
|
1-mo USD LIBOR |
|
|
1-mo USD LIBOR |
|
||||||||||||||
50
Table of Contents
OFF BALANCE SHEET ARRANGEMENTS
We are party to financial instruments with off-balance sheet risk in the normal course of business to meet the financing needs of our borrowers. These financial instruments include unfunded commitments, standby letters of credit and interest rate mitigation products. The instruments involve, to varying degrees, elements of credit and interest rate risk in excess of the amount recognized in the consolidated balance sheet. The contract or notional amounts of those instruments reflect the extent of involvement we have in particular classes of financial instruments.
Our exposure to credit loss in the event of nonperformance by the other party to the financial instrument for standby letters of credit is represented by the contractual amount of those instruments. We use the same credit policies in making commitments and conditional obligations as we do for on-balance sheet instruments.
Unused lines of credit are commitments to lend to a borrower if certain conditions have been met. These commitments generally have fixed expiration dates or other termination clauses and may require payment of a fee. Because certain commitments may expire without being drawn upon, the total commitment amounts do not necessarily represent future cash requirements. We evaluate each borrower’s creditworthiness on a case-by-case basis. The amount of collateral required is based on factors that include management’s credit evaluation of the borrower and the borrower’s compliance with financial covenants. Due to their nature, we cannot know with certainty the aggregate amounts that will be required to fund our unfunded commitments. The aggregate amount of these unfunded commitments currently exceeds our available funds and will likely continue to exceed our available funds in the future.
At December 31, 2010, we had $270.8 million of unused lines of credit. Of these unused lines of credit, unfunded commitments related to revolving credit facilities were $239.2 million and unfunded commitments related to delayed draw term loans were $24.3 million. $7.3 million of the unused commitments are unavailable to the borrowers, which may be related to the borrowers’ inability to meet covenant obligations or other similar events.
Revolving credit facilities allow our borrowers to draw up to a specified amount subject to customary borrowing conditions. The unfunded revolving commitments of $239.2 million are further categorized as either contingent or unrestricted. Contingent commitments limit a borrower’s ability to access the revolver unless it meets an enumerated borrowing base covenant or other restrictions. At December 31, 2010, we categorized $136.3 million of the unfunded commitments related to revolving credit facilities as contingent. Unrestricted commitments represent commitments that are currently accessible, assuming the borrower is in compliance with certain customary loan terms and conditions. At December 31, 2010, we had $102.9 million of unfunded unrestricted revolving commitments.
During the three months ended December 31, 2010, revolver usage averaged approximately 33%, which is slightly lower than the average of 38% over the previous four quarters. Management’s experience indicates that borrowers typically do not seek to exercise their entire available line of credit at any point in time. During the three months and year ended December 31, 2010, revolving commitments increased $118.4 million and $52.9 million, respectively.
Delayed draw credit facilities allow our borrowers to draw predefined amounts of the approved loan commitment at contractually set times, subject to specific conditions, such as capital expenditures in corporate loans or for tenant improvements in commercial real estate loans. During the three months and year ended December 31, 2010, delayed draw credit facility commitments declined $32.1 million and $41.1 million, respectively.
Standby letters of credit are conditional commitments issued by us to guarantee the performance by a borrower to a third party. The credit risk involved in issuing letters of credit is essentially the same as that involved in extending credit to our borrowers. At December 31, 2010 we had $8.7 million of standby letters of credit.
51
Table of Contents
Interest rate risk mitigation products are offered to enable customers to meet their financing and risk management objectives. Derivative financial instruments consist predominantly of interest rate swaps, interest rate caps and floors. The interest rate risks to the Company of these customer derivatives is mitigated by entering into similar derivatives having offsetting terms with other counterparties. At December 31, 2010, the notional value of the interest rate mitigation products was $125.5 million.
At December 31, 2010, our Business Credit group had a $3.3 million potential off balance sheet commitment to another financial institution. In an event of default of a certain borrower, we would be obligated to reimburse the financial institution for the defaulted amount. The borrower paid off the loan on January 19, 2011, and the potential commitment was terminated.
Critical Accounting Policies
Accounting policies involving significant estimates and assumptions by management, which have, or could have, a material impact on our financial statements, are considered critical accounting policies. The following are our critical accounting policies:
Allowance for credit losses
The allowance for credit losses is based on a loan-by-loan build-up of inherent losses on loans, gross. We also maintain an allowance for losses on unfunded loan commitments, namely loan commitments and letters of credit that are reported in other liabilities on the balance sheet. The combined balance of the allowance for loan losses and the allowance for unfunded commitments is referred to as the allowance for credit losses. As of December 31, 2010, we had an allowance for credit losses of $84.8 million, with specific allowances totaling $60.4 million.
A base allowance is provided for loans that are not impaired. The Company employs a variety of internally developed and third-party modeling and estimation tools for measuring credit risk, which are used in developing an allowance for loan losses on outstanding loans. The Company’s allowance framework addresses economic conditions, capital market liquidity and industry circumstances from both a top-down and bottom-up perspective. The Company considers and evaluates changes in economic conditions, credit availability, industry and multiple obligor concentrations in assessing both probabilities of default and loss severities as part of the general component of the allowance for loan losses.
On at least a quarterly basis, loans are internally risk-rated based on individual credit criteria, including loan type, loan structures (including balloon and bullet structures common in the Company’s Leveraged Finance and Real Estate cash flow loans), borrower industry, payment capacity, location and quality of collateral if any (including the Company’s Real Estate loans). Borrowers provide the Company with financial information on either a monthly or quarterly basis. Ratings, corresponding assumed default rates and assumed loss severities are dynamically updated to reflect any changes in borrower condition or profile.
For Leveraged Finance loans, the data set used to construct probabilities of default in its allowance for loan losses model, Moody’s CRD Private Firm Database, principally contains middle market corporate loans that share attributes similar to the Company’s loans. The Company also considers the quality of the loan terms in determining a loan loss in the event of default.
For Real Estate loans, the Company employs two mechanisms to capture the impact of industry and economic conditions. First, a loan’s risk rating, and thereby its assumed default likelihood, can be adjusted to account for overall commercial real estate market conditions. Second, to the extent that economic or industry trends adversely affect a borrower’s loan-to-value ratio enough to impact its repayment ability, the Company applies a stress multiplier to the loan’s probability of default. The multiplier is designed to account for default characteristics that are difficult to quantify when market conditions cause commercial real estate prices to decline.
52
Table of Contents
During 2010, the Company refined its allowance for credit losses methodology regarding commercial real estate. If the Company determines that additional changes in its allowance for credit losses methodology are advisable, as a result of changes in the economic environment or otherwise, the revised allowance methodology may result in higher or lower levels of allowance.
Additionally, when determining the amount of the general allowance, the Company supplements the base amount with a judgmental amount which is governed by a score card system comprised of ten individually weighted risk factors. The risk factors are designed based on those outlined in the Comptrollers of the Currency’s Allowance for Loan and Lease Losses Handbook. The Company also performs a ratio analysis of comparable money center banks, regional banks and finance companies. While the Company does not rely on this peer group comparison to set the level of allowance for credit losses, it does assist management in identifying market trends and serves as an overall reasonable check on the allowance for credit losses computation.
A loan is considered impaired when it is probable that a creditor will be unable to collect all amounts due according to the contractual terms of the loan agreement. Impairment of a loan is based upon either the present value of expected future cash flows discounted at the loan’s effective interest rate, the loan’s observable market price or the fair value of the collateral if the loan is collateral dependent, depending on the circumstances and our collection strategy. Impaired loans are identified based on the loan-by-loan risk rating process described above. It is the Company’s policy that during the reporting period to record a specific provision for credit losses for all loans for which we have serious doubts as to the ability of the borrowers to comply with the present loan repayment terms. As of December 31, 2010, we had $356.6 million of impaired loans.
Impaired loans at December 31, 2010 were in both Real Estate and in Leveraged Finance, over a range of industries impacted by the then current economic environment including the following: Buildings and Commercial Real Estate, Healthcare, Broadcast and Entertainment, Nondurable Consumer Products, Energy and Chemical Services, Financial Services, Healthcare, Printing and Publishing, Restaurants, and Industrial and Other Business Services. For impaired Leveraged Finance loans, the Company measured impairment based on expected cash flows utilizing relevant information provided by the borrower and consideration of other market conditions or specific factors impacting recoverability. Such amounts are discounted based on original loan terms. For impaired Real Estate loans, the Company determined that the loans were collateral dependent and measured impairment based on the fair value of the related collateral utilizing recent appraisals from third-party appraisers, as well as internal estimates of market value.
Loans deemed to be uncollectible are charged off and deducted from the allowance. The provision for credit losses and recoveries on loans previously charged off are added to the allowance.
Valuation of deferred tax assets
We recognize deferred tax assets and liabilities resulting from the differences between the financial statement carrying amounts of existing assets and liabilities and their respective tax bases, and operating loss and tax credit carry forwards. Deferred tax assets and liabilities are measured using enacted tax rates expected to apply to taxable income in the years in which those temporary differences are expected to be recovered or settled. The effect on deferred tax assets and liabilities of a change in tax rates is recognized in income in the period that includes the enactment date. We regularly review our deferred tax assets to assess their potential realization and whether or not a valuation allowance is necessary. In performing these reviews we make estimates about future profits and tax planning strategies that would affect future taxable income and the realization of these deferred tax assets. A change in these assumptions could result in a difference in valuation and impact our results of operations. At December 31, 2010, we had a valuation allowance of $0.1 million related to our deferred tax asset.
On January 1, 2007, the Company adopted ASC 740 (Accounting for Uncertainty in Income Taxes—An interpretation of FASB Statement No. 109). ASC 740 clarifies the accounting for uncertainty in income taxes recognized in a company’s financial statements. A company can only recognize the tax position in the financial
53
Table of Contents
statements if the position is more-likely-than-not to be upheld on audit, based only on the technical merits of the tax position. If the recognition threshold is met, the tax benefit is measured at the largest amount that is more than 50% likely of being realized upon ultimate settlement.
ASC 740 also addresses how interest and penalties should be accrued for uncertain tax positions, requiring that interest expense should be recognized in the first period interest would be accrued under the tax law. The Company classifies all interest and penalties on recognized tax benefits as a part of income tax expense. At January 1, 2007, the Company did not have any accrued interest or penalties.
At December 31, 2010, the Company did not have any unrecognized tax benefits, and there have been no material changes since adoption. The Company does not expect any significant changes within the next 12 months.
The Company files U.S. federal and state income tax returns. As of December 31, 2010, the Company’s tax returns for the years ended 2009, 2008, 2007 and 2006 remain subject to examination by the Internal Revenue Service and state tax authorities.
Fair Value
The Company utilizes fair value measurements to record fair value adjustments to certain financial instruments and to determine fair value disclosures. The Company differentiates between those assets and liabilities required to be carried at fair value at every reporting period (“recurring”) and those assets and liabilities that are only required to be adjusted to fair value under certain circumstances (“nonrecurring”). Cash and cash equivalents, investments in debt securities, available-for-sale, residual interest in securitization and derivatives are financial instruments recorded at fair value on a recurring basis. Additionally, from time to time, the Company may be required to record at fair value other financial assets on a nonrecurring basis, such as loans held-for-sale and loans held-for-investment. These nonrecurring fair value adjustments typically involve application of the lower of cost or market accounting or write-downs of individual assets. Further, the notes to the consolidated financial statements include information about the extent to which fair value is used to measure assets and liabilities and the valuation methodologies used.
ASC 820, Fair Value Measurements (“ASC 820”) establishes a three-level valuation hierarchy for disclosure of fair value measurements. The valuation hierarchy is based upon the transparency of inputs to the valuation of an asset or liability as of the measurement date. The three levels are defined as follows:
| • | Level 1 – inputs to the valuation methodology are quoted prices (unadjusted) for identical assets or liabilities in active markets. |
| • | Level 2 – inputs to the valuation methodology include quoted prices for similar assets and liabilities in active markets, and inputs that are observable for the asset or liability, either directly or indirectly, for substantially the full term of the financial instrument. |
| • | Level 3 – inputs to the valuation methodology are unobservable and significant to the fair value measurement. |
A financial instrument’s categorization within the valuation hierarchy is based upon the lowest level of input that is significant to the fair value measurement.
For assets and liabilities recorded at fair value, it is the Company’s policy to maximize the use of observable inputs and minimize the use of unobservable inputs when developing fair value measurements, in accordance with the fair value hierarchy in ASC 820. When available, the Company utilizes quoted market prices to measure fair value. If market prices are not available, fair value measurement is based upon models that use primarily market-based or independently sourced market parameters, including interest rate yield curves, prepayment speeds, option volatilities and other assumptions. However, in certain cases, when market observable inputs for
54
Table of Contents
model-based valuation techniques may not be readily available, the Company is required to make judgments about assumptions market participants would use in estimating the fair value of the financial instrument. The models used by the Company to determine fair value adjustments are periodically evaluated by management for relevance under current facts and circumstances.
The degree of management judgment involved in determining the fair value of a financial instrument is dependent upon the availability of quoted market prices or observable market parameters. For financial instruments that trade actively and have quoted market prices or observable market parameters, there is minimal subjectivity involved in measuring fair value. When observable market prices and parameters are not fully available, management judgment is necessary to estimate fair value. In addition, changes in market conditions may reduce the availability of quoted prices or observable data. For example, reduced liquidity in the capital markets or changes in secondary market activities could result in observable market inputs becoming unavailable. Therefore, when market data is not available, the Company would use valuation techniques requiring more management judgment to estimate the appropriate fair value measurement.
As of December 31, 2010, 3.9% of total assets and 64.4% of the assets we measured at fair value used significant unobservable inputs (level 3 assets). During 2010 we recognized losses of $0.3 million in earnings and $0.002 million in other comprehensive income related to changes in fair value of these level 3 assets. The table below sets forth information regarding our level 3 assets as of December 31, 2010:
| Description |
Fair Value at December 31, 2010 |
|||
| ($ in thousands) | ||||
| Commercial loans, net: |
||||
| Commercial real estate |
$ | 69,067 | ||
| Other real estate owned |
3,400 | |||
| Investments in debt securities, available-for-sale: |
||||
| Securities backed by licenses and easements |
4,014 | |||
| Total level 3 assets at fair value |
$ | 76,481 | ||
Revenue recognition
Interest income is recorded on the accrual basis in accordance with the terms of the respective loan and debt product. The accrual of interest on loans and other debt products is discontinued when principal or interest payments are past due by 90 days or more or when, in the opinion of management, it is probable we will be unable to collect contractual principal and interest in the normal course of business. If loans are placed on non-accrual status, all interest previously accrued but not collected is reversed against current period interest income. Interest income on non-accrual loans is subsequently recognized only to the extent that cash is received and the principal balance is deemed collectible.
Nonrefundable fees and related direct costs associated with the origination or purchase of loans and other debt products are deferred and netted against balances outstanding. The net deferred fees or costs are recognized as an adjustment to interest income over the contractual life of the loans using a method which approximates the effective interest method. In connection with the prepayment of a loan or other debt product, a partial amount of the remaining unamortized net deferred fees, costs, premiums or discounts are accelerated and recognized as interest income. The amortization of fees is discontinued on non-accrual loans. Depending on the terms of a loan or other debt product, we may charge a prepayment fee and recognize it in the period of the prepayment. We accrete any discount and amortize any premium from purchased debt products or acquired loans in a business combination into interest income as a yield adjustment over the contractual life. Syndication, arrangement and structuring fees are recognized in the period the service is completed as a component of non-interest income.
55
Table of Contents
Stock-based compensation
Effective January 1, 2006, we adopted ASC 718 (Share-Based Payment), which requires all share-based payments to employees, including grants of employee stock options, to be recognized in the financial statements based on their fair values on the grant date. We adopted ASC 718 using the prospective method.
For awards granted, modified, repurchased or cancelled after January 1, 2006, we estimate the fair value of stock-based awards using the Black-Scholes valuation model, which requires the input of subjective assumptions, including expected term and expected price volatility. Changes in these assumptions can materially affect the calculated fair value of stock-based compensation and the related expense to be recognized. We expect the changes in our stock price during 2010 will impact our 2011 price volatility assumption and could result in an adverse affect to our financial statements. Further, for awards that contain performance measures and conditions, we make an assessment, based on management’s judgment, of the probability of these conditions being satisfied, which affects the timing and the amount of expense to be recognized. If our judgment as to whether these conditions are probable of occurrence are not appropriate, the financial statements could be materially affected.
Business combinations
Business combinations are accounted for under the acquisition method of accounting. Under the acquisition method, assets and liabilities of the business acquired are recorded at their estimated fair values as of the date of acquisition. Results of operations of the acquired business are included in the income statement from the date of acquisition.
Equity method of accounting
As the result of a troubled debt restructuring, we may acquire a portion of the equity in the borrower. In certain cases where we have the ability to exercise significant influence over the borrower, we account for our equity interest under the equity method of accounting. Under the equity method of accounting, we recognize our proportional share of the borrower’s net income as determined under U.S. generally accepted accounting principles (“GAAP”) in our results of operations. In cases where the equity of the underlying company has no value, and the borrower incurs losses, we will apply our proportional share of the GAAP loss against the principal of the outstanding loan to the borrower.
56
Table of Contents
| Item 7A. | Quantitative and Qualitative Disclosures About Market Risk |
We are exposed to changes in market values of our loans held-for-sale, which are carried at lower of cost or market, and our investment in debt securities, available-for-sale and derivatives, which are carried at fair value. Fair value is defined as the market price for those securities for which a market quotation is readily available and for all other investments and derivatives, fair value is determined pursuant to a valuation policy and a consistent valuation process. Where a market quotation is not readily available, we estimate fair value using various valuation methodologies, including cash flow analysis, as well as qualitative factors.
As of December 31, 2010 and 2009, investments in debt securities available-for-sale totaled $4.0 million and $4.2 million, respectively. At December 31, 2010 and 2009, our net unrealized loss on those debt securities totaled $0.2 million at each period end. Any unrealized gain or loss on these investments is included in Other Comprehensive Income in the equity section of the balance sheet, until realized.
Interest rate risk represents a market risk exposure to us. Our goal is to manage interest rate sensitivity so that movements in interest rates do not adversely affect our net interest income. Interest rate risk is measured as the potential volatility to our net interest income caused by changes in market interest rates. During the normal course of business our lending to clients and our investments in debt securities create some interest rate risk as does the impact of ever-changing market conditions. Our management attempts to mitigate this risk through our Asset Liability Committee (“ALCO”) process taking into consideration balance sheet dynamics such as loan and investment growth and pricing, changes in funding mix and maturity characteristics. The ALCO group reviews the overall rate risk position and strategy on an ongoing basis. The ALCO group also reviews the impact on net interest income caused by changes in the shape of the yield curve as well as parallel shifts in the yield curve.
The following table shows the hypothetical estimated change in net interest income for a 12-month period based on changes in the interest rates applied to our portfolio and cash and cash equivalents as of December 31, 2010. Our modeling is based on contractual terms and does not consider prepayment:
| Rate Change (Basis Points) |
Estimated Change in Net Interest Income Over 12 Months |
|||||||
| ($ in thousands) | ||||||||
| Decrease of |
100 | $ | 4,883 | |||||
| Increase of |
100 | (4,696 | ) | |||||
As shown above, we estimate to the best of our ability that a decrease in interest rates of 100 basis points would have resulted in an increase of $4.9 million in our annualized net interest income, and an increase in interest rates of 100 basis points would have resulted in a decrease in our net interest income of $4.7 million. The estimated changes in net interest income reflect the potential effect of interest rate floors on loans totaling approximately $956.9 million. If interest rates rise, the potential impact from interest rate floors would decrease resulting in lower net interest income. The cost of our variable rate debt would increase, while interest income from loans with interest rate floors would not change until interest rates exceed the stated rate of the interest rate floors or the loans paid off or re-priced.
57
Table of Contents
| Item 8. | Financial Statements and Supplementary Data |
NEWSTAR FINANCIAL, INC.
58
Table of Contents
REPORT OF INDEPENDENT REGISTERED PUBLIC ACCOUNTING FIRM
ON INTERNAL CONTROL OVER FINANCIAL REPORTING
The Board of Directors
NewStar Financial, Inc.:
We have audited NewStar Financial, Inc.’s internal control over financial reporting as of December 31, 2010, based on criteria established in Internal Control—Integrated Framework issued by the Committee of Sponsoring Organizations of the Treadway Commission (COSO). NewStar Financial, Inc.’s management is responsible for maintaining effective internal control over financial reporting and for its assessment of the effectiveness of internal control over financial reporting, included in the accompanying Management’s Report on Internal Control Over Financial Reporting. Our responsibility is to express an opinion on the Company’s internal control over financial reporting based on our audit.
We conducted our audit in accordance with the standards of the Public Company Accounting Oversight Board (United States). Those standards require that we plan and perform the audit to obtain reasonable assurance about whether effective internal control over financial reporting was maintained in all material respects. Our audit included obtaining an understanding of internal control over financial reporting, assessing the risk that a material weakness exists, and testing and evaluating the design and operating effectiveness of internal control based on the assessed risk. Our audit also included performing such other procedures as we considered necessary in the circumstances. We believe that our audit provides a reasonable basis for our opinion.
A company’s internal control over financial reporting is a process designed to provide reasonable assurance regarding the reliability of financial reporting and the preparation of financial statements for external purposes in accordance with generally accepted accounting principles. A company’s internal control over financial reporting includes those policies and procedures that (1) pertain to the maintenance of records that, in reasonable detail, accurately and fairly reflect the transactions and dispositions of the assets of the company; (2) provide reasonable assurance that transactions are recorded as necessary to permit preparation of financial statements in accordance with generally accepted accounting principles, and that receipts and expenditures of the company are being made only in accordance with authorizations of management and directors of the company; and (3) provide reasonable assurance regarding prevention or timely detection of unauthorized acquisition, use, or disposition of the company’s assets that could have a material effect on the financial statements.
Because of its inherent limitations, internal control over financial reporting may not prevent or detect misstatements. Also, projections of any evaluation of effectiveness to future periods are subject to the risk that controls may become inadequate because of changes in conditions, or that the degree of compliance with the policies or procedures may deteriorate.
In our opinion, NewStar Financial, Inc. maintained, in all material respects, effective internal control over financial reporting as of December 31, 2010, based on criteria established in Internal Control—Integrated Framework issued by the Committee of Sponsoring Organizations of the Treadway Commission.
We also have audited, in accordance with the standards of the Public Company Accounting Oversight Board (United States), the consolidated balance sheets of NewStar Financial, Inc. as of December 31, 2010 and 2009, and the related consolidated statements of operations, changes in stockholders’ equity, and cash flows for each of the years in the three-year period ended December 31, 2010, and our report dated March 4, 2011 expressed an unqualified opinion on those consolidated financial statements.
/s/ KPMG LLP
Boston, Massachusetts
March 4, 2011
59
Table of Contents
REPORT OF INDEPENDENT REGISTERED PUBLIC ACCOUNTING FIRM
The Board of Directors
NewStar Financial, Inc.:
We have audited the accompanying consolidated balance sheets of NewStar Financial, Inc. and subsidiaries (the “Company”) as of December 31, 2010 and 2009, and the related consolidated statements of operations, changes in stockholders’ equity, and cash flows for each of the years in the three-year period ended December 31, 2010. These consolidated financial statements are the responsibility of the Company’s management. Our responsibility is to express an opinion on these consolidated financial statements based on our audits.
We conducted our audits in accordance with the standards of the Public Company Accounting Oversight Board (United States). Those standards require that we plan and perform the audit to obtain reasonable assurance about whether the consolidated financial statements are free of material misstatement. An audit includes examining, on a test basis, evidence supporting the amounts and disclosures in the consolidated financial statements. An audit also includes assessing the accounting principles used and significant estimates made by management, as well as evaluating the overall financial statement presentation. We believe that our audits provide a reasonable basis for our opinion.
In our opinion, the consolidated financial statements referred to above present fairly, in all material respects, the financial position of NewStar Financial, Inc. and subsidiaries as of December 31, 2010 and 2009, and the results of their operations and their cash flows for each of the years in the three-year period ended December 31, 2010, in conformity with U.S. generally accepted accounting principles.
We have also audited, in accordance with the standards of the Public Company Accounting Oversight Board (United States), the Company’s internal control over financial reporting as of December 31, 2010, based on criteria established in Internal Control-Integrated Framework issued by the Committee of Sponsoring Organizations of the Treadway Commission (COSO), and our report dated March 4, 2011 expressed an unqualified opinion on the effectiveness of the Company’s internal control over financial reporting.
/s/ KPMG LLP
Boston, Massachusetts
March 4, 2011
60
Table of Contents
CONSOLIDATED BALANCE SHEETS
| December 31, 2010 |
December 31, 2009 |
|||||||
| ($ in thousands, except share and par value amounts) |
||||||||
| Assets: |
||||||||
| Cash and cash equivalents |
$ | 54,365 | $ | 39,848 | ||||
| Restricted cash |
178,364 | 136,884 | ||||||
| Investments in debt securities, available-for-sale |
4,014 | 4,183 | ||||||
| Loans held-for-sale, net |
41,386 | 15,736 | ||||||
| Loans, net |
1,590,331 | 1,878,978 | ||||||
| Deferred financing costs, net |
15,504 | 18,557 | ||||||
| Interest receivable |
6,797 | 7,949 | ||||||
| Property and equipment, net |
879 | 976 | ||||||
| Deferred income taxes, net |
48,093 | 56,449 | ||||||
| Income tax receivable |
5,435 | 7,260 | ||||||
| Other assets |
29,798 | 33,252 | ||||||
| Total assets |
$ | 1,974,966 | $ | 2,200,072 | ||||
| Liabilities: |
||||||||
| Credit facilities |
$ | 108,502 | $ | 91,890 | ||||
| Term debt |
1,278,868 | 1,523,052 | ||||||
| Accrued interest payable |
4,014 | 2,774 | ||||||
| Accounts payable |
242 | 645 | ||||||
| Other liabilities |
29,161 | 31,591 | ||||||
| Total liabilities |
1,420,787 | 1,649,952 | ||||||
| Stockholders’ equity and noncontrolling interest: |
||||||||
| Preferred stock, par value $0.01 per share (5,000,000 shares authorized; no shares outstanding) |
— | — | ||||||
| Common stock, par value $0.01 per share: |
||||||||
| Shares authorized: 145,000,000 in 2010 and 2009; |
||||||||
| Shares outstanding 50,562,826 in 2010 and 49,994,858 in 2009 |
506 | 500 | ||||||
| Additional paid-in capital |
626,177 | 616,762 | ||||||
| Accumulated deficit |
(58,851 | ) | (69,083 | ) | ||||
| Common stock held in treasury, at cost $0.01 par value; 1,864,263 in 2010 and 257,392 in 2009 |
(13,115 | ) | (1,331 | ) | ||||
| Accumulated other comprehensive loss, net |
(538 | ) | (786 | ) | ||||
| Total NewStar Financial, Inc. stockholders’ equity |
554,179 | 546,062 | ||||||
| Noncontrolling interest |
— | 4,058 | ||||||
| Total stockholders’ equity |
554,179 | 550,120 | ||||||
| Total liabilities and stockholders’ equity |
$ | 1,974,966 | $ | 2,200,072 | ||||
The accompanying notes are an integral part of these consolidated financial statements.
61
Table of Contents
CONSOLIDATED STATEMENTS OF OPERATIONS
| Year Ended December 31, | ||||||||||||
| 2010 | 2009 | 2008 | ||||||||||
| ($ in thousands, except per share amounts) | ||||||||||||
| Net interest income: |
||||||||||||
| Interest income |
$ | 112,826 | $ | 136,569 | $ | 188,770 | ||||||
| Interest expense |
40,558 | 41,927 | 86,216 | |||||||||
| Net interest income |
72,268 | 94,642 | 102,554 | |||||||||
| Provision for credit losses |
32,997 | 133,093 | 38,224 | |||||||||
| Net interest income (loss) after provision for credit losses |
39,271 | (38,451 | ) | 64,330 | ||||||||
| Non-interest income: |
||||||||||||
| Fee income |
2,409 | 1,657 | 4,518 | |||||||||
| Asset management income—related party |
2,872 | 2,934 | 6,283 | |||||||||
| Gain on derivatives |
28 | 533 | 2,157 | |||||||||
| Gain (loss) on sale of loans and debt securities |
(116 | ) | — | 282 | ||||||||
| Gain on acquisition |
5,649 | –– | –– | |||||||||
| Loss on investments in debt securities |
— | — | (932 | ) | ||||||||
| Loss on residual interest in securitization |
— | — | (631 | ) | ||||||||
| Other income |
7,854 | 5,529 | 7,253 | |||||||||
| Total non-interest income |
18,696 | 10,653 | 18,930 | |||||||||
| Operating expenses: |
||||||||||||
| Compensation and benefits |
26,418 | 26,403 | 30,413 | |||||||||
| Occupancy and equipment |
2,094 | 3,121 | 3,286 | |||||||||
| General and administrative expenses |
12,101 | 12,911 | 11,090 | |||||||||
| Total operating expenses |
40,613 | 42,435 | 44,789 | |||||||||
| Income (loss) before income taxes |
17,354 | (70,233 | ) | 38,471 | ||||||||
| Income tax expense (benefit) |
6,935 | (24,353 | ) | 16,073 | ||||||||
| Net income (loss) before noncontrolling interest |
10,419 | (45,880 | ) | 22,398 | ||||||||
| Net loss (income) attributable to noncontrolling interest |
(187 | ) | 1,620 | — | ||||||||
| Net income (loss) attributable to NewStar Financial, Inc. common stockholders |
$ | 10,232 | $ | (44,260 | ) | $ | 22,398 | |||||
| Basic income (loss) per share |
$ | 0.21 | $ | (0.90 | ) | $ | 0.46 | |||||
| Diluted income (loss) per share |
0.19 | (0.90 | ) | 0.46 | ||||||||
The accompanying notes are an integral part of these consolidated financial statements.
62
Table of Contents
CONSOLIDATED STATEMENT OF CHANGES IN STOCKHOLDERS’ EQUITY
| NewStar Financial, Inc. Stockholders’ Equity | Noncontrolling Interest |
|||||||||||||||||||||||||||||||
| Preferred Stock |
Common Stock |
Additional Paid-in Capital |
Accumulated Deficit |
Treasury Stock |
Accumulated Other Comprehensive Loss, net |
Common Stockholders’ Equity |
||||||||||||||||||||||||||
| ($ in thousands) | ||||||||||||||||||||||||||||||||
| Balance at January 1, 2008 |
$ | — | $ | 434 | $ | 551,704 | $ | (47,221 | ) | $ | (763 | ) | $ | (1,464 | ) | $ | 502,690 | $ | — | |||||||||||||
| Net income |
— | — | — | 22,398 | — | — | 22,398 | — | ||||||||||||||||||||||||
| Other comprehensive income: |
||||||||||||||||||||||||||||||||
| Net unrealized securities losses, net of tax benefit of $601 |
— | — | — | — | — | (915 | ) | (915 | ) | — | ||||||||||||||||||||||
| Recognition of net unrealized losses, net of tax benefit of $322 |
— | — | — | — | — | 624 | 624 | — | ||||||||||||||||||||||||
| Net unrealized derivatives gains, net of tax benefit of $194 |
— | — | — | — | — | (271 | ) | (271 | ) | — | ||||||||||||||||||||||
| Total comprehensive income |
21,836 | |||||||||||||||||||||||||||||||
| Net proceeds from issuance of common stock |
— | 52 | 48,839 | — | — | — | 48,891 | — | ||||||||||||||||||||||||
| Shares reacquired from employee transactions |
— | — | — | — | (315 | ) | — | (315 | ) | — | ||||||||||||||||||||||
| Amortization of restricted common stock awards |
— | — | 5,889 | — | — | — | 5,889 | — | ||||||||||||||||||||||||
| Amortization of stock option awards |
— | — | 2,564 | — | — | — | 2,564 | — | ||||||||||||||||||||||||
| Balance at December 31, 2008 |
— | 486 | 608,996 | (24,823 | ) | (1,078 | ) | (2,026 | ) | 581,555 | — | |||||||||||||||||||||
| Net loss |
— | — | — | (44,260 | ) | — | — | (44,260 | ) | (1,620 | ) | |||||||||||||||||||||
| Other comprehensive income: |
||||||||||||||||||||||||||||||||
| Net unrealized securities gains, net of tax expense of $ 540 |
— | — | — | — | — | 822 | 822 | |||||||||||||||||||||||||
| Net unrealized derivatives gains, net of tax expense of $ 412 |
— | — | — | — | — | 418 | 418 | — | ||||||||||||||||||||||||
| Total comprehensive income |
(43,020 | ) | ||||||||||||||||||||||||||||||
| Contributions from noncontrolling interest |
5,678 | |||||||||||||||||||||||||||||||
| Issuance of restricted stock |
— | 14 | (14 | ) | — | — | — | — | — | |||||||||||||||||||||||
| Shares reacquired from employee transactions |
— | — | — | — | (253 | ) | — | (253 | ) | — | ||||||||||||||||||||||
| Amortization of restricted common stock awards |
— | — | 4,364 | — | — | — | 4,364 | — | ||||||||||||||||||||||||
| Amortization of stock option awards |
— | — | 3,416 | — | — | — | 3,416 | — | ||||||||||||||||||||||||
| Balance December 31, 2009 |
— | 500 | 616,762 | (69,083 | ) | (1,331 | ) | (786 | ) | 546,062 | 4,058 | |||||||||||||||||||||
| Net income |
— | — | — | 10,232 | — | — | 10,232 | 187 | ||||||||||||||||||||||||
| Other comprehensive income: |
||||||||||||||||||||||||||||||||
| Net unrealized securities losses, net of tax benefit of $1 |
— | — | — | — | — | (1 | ) | (1 | ) | — | ||||||||||||||||||||||
| Net unrealized derivatives gains, net of tax expense of $104 |
— | — | — | — | — | 249 | 249 | — | ||||||||||||||||||||||||
| Total comprehensive income |
10,480 | |||||||||||||||||||||||||||||||
| Distributions from noncontrolling interest |
— | — | — | — | — | — | — | (4,245 | ) | |||||||||||||||||||||||
| Issuance of restricted stock |
— | 22 | (22 | ) | — | — | — | — | — | |||||||||||||||||||||||
| Shares reacquired from employee transactions |
— | (2 | ) | 21 | — | (1,784 | ) | — | (1,765 | ) | — | |||||||||||||||||||||
| Tax benefit from vesting of restricted common stock awards |
— | — | 10 | — | — | — | 10 | — | ||||||||||||||||||||||||
| Repurchase of common stock |
— | (14 | ) | 14 | — | (10,000 | ) | — | (10,000 | ) | — | |||||||||||||||||||||
| Amortization of restricted common stock awards |
— | — | 6,019 | — | — | — | 6,019 | — | ||||||||||||||||||||||||
| Amortization of stock option awards |
— | — | 3,373 | — | — | — | 3,373 | — | ||||||||||||||||||||||||
| Balance December 31, 2010 |
$ | — | $ | 506 | $ | 626,177 | $ | (58,851 | ) | $ | (13,115 | ) | $ | (538 | ) | $ | 554,179 | $ | — | |||||||||||||
The accompanying notes are an integral part of these consolidated financial statements.
63
Table of Contents
CONSOLIDATED STATEMENTS OF CASH FLOWS
| Year Ended December 31, | ||||||||||||
| 2010 | 2009 | 2008 | ||||||||||
| ($ in thousands) | ||||||||||||
| Cash flows from operating activities: |
||||||||||||
| Net income (loss) |
$ | 10,232 | $ | (44,260 | ) | $ | 22,398 | |||||
| Adjustments to reconcile net income (loss) to net cash used for operations: |
||||||||||||
| Provision for credit losses |
32,997 | 133,093 | 38,224 | |||||||||
| Depreciation and amortization and accretion |
(10,193 | ) | (12,502 | ) | (9,014 | ) | ||||||
| Amortization of debt issuance costs |
12,239 | 6,803 | 5,026 | |||||||||
| Equity compensation expense |
9,420 | 7,780 | 8,453 | |||||||||
| Net loss on investments in debt securities |
— | — | 932 | |||||||||
| Net loss on residual interest in securitization |
— | — | 631 | |||||||||
| Net (gain) loss on sale of loans and securities |
116 | — | (282 | ) | ||||||||
| Gain on acquisition and repurchase of debt |
(12,382 | ) | (7,822 | ) | (6,897 | ) | ||||||
| Net change in deferred income taxes |
8,338 | (25,622 | ) | (17,400 | ) | |||||||
| Loans held-for-sale originated |
(91,769 | ) | (15,736 | ) | 79,036 | |||||||
| Proceeds from the sale of loans held-for-sale |
66,119 | — | — | |||||||||
| Net change in interest receivable |
1,152 | 2,659 | 3,512 | |||||||||
| Net change in other assets |
(11,449 | ) | (1,378 | ) | (8,321 | ) | ||||||
| Net change in accrued interest payable |
1,240 | (6,999 | ) | (7,764 | ) | |||||||
| Net change in accounts payable and other liabilities |
5,104 | (18,617 | ) | (15,109 | ) | |||||||
| Net cash provided by operating activities |
21,164 | 17,399 | 93,425 | |||||||||
| Cash flows from investing activities: |
||||||||||||
| Payment for acquisition, net of cash acquired |
(25,320 | ) | — | — | ||||||||
| Net change in restricted cash |
(41,480 | ) | (52,721 | ) | 31,644 | |||||||
| Net change in loans |
297,391 | 336,997 | (122,619 | ) | ||||||||
| Proceeds from sale of other real estate owned |
5,331 | 4,049 | — | |||||||||
| Proceeds from repayments of debt securities available-for-sale |
239 | 311 | 1,340 | |||||||||
| Proceeds from sale of debt securities available-for-sale |
— | — | 29,737 | |||||||||
| Acquisition of property and equipment |
(260 | ) | 819 | (157 | ) | |||||||
| Net cash provided by (used in) investing activities |
235,901 | 289,455 | (60,055 | ) | ||||||||
| Cash flows from financing activities: |
||||||||||||
| Proceeds from issuance of common stock |
— | — | 48,891 | |||||||||
| Repayments under repurchase agreements, net |
— | — | (63 | ) | ||||||||
| Borrowings on credit facilities |
216,796 | 69,139 | 731,348 | |||||||||
| Repayment of borrowings on credit facilities |
(200,184 | ) | (244,567 | ) | (997,820 | ) | ||||||
| Issuance of term debt |
187,304 | — | — | |||||||||
| Borrowings on term debt |
137,453 | 58,925 | 444,996 | |||||||||
| Repayment of borrowings on term debt |
(562,946 | ) | (196,172 | ) | (278,653 | ) | ||||||
| Payment of deferred financing costs |
(9,187 | ) | (4,357 | ) | (7,630 | ) | ||||||
| Purchase of treasury stock |
(11,784 | ) | (253 | ) | (315 | ) | ||||||
| Net cash used in financing activities |
(242,548 | ) | (317,285 | ) | (59,246 | ) | ||||||
| Net increase (decrease) in cash during the period |
14,517 | (10,431 | ) | (25,876 | ) | |||||||
| Cash and cash equivalents at beginning of period |
39,848 | 50,279 | 76,155 | |||||||||
| Cash and cash equivalents at end of period |
$ | 54,365 | $ | 39,848 | $ | 50,279 | ||||||
| Supplemental cash flows information: |
||||||||||||
| Interest paid |
$ | 39,317 | $ | 48,926 | $ | 93,980 | ||||||
| Taxes paid |
50 | 9,181 | 29,948 | |||||||||
| Decrease (increase) in fair value of investments in debt securities |
2 | (1,362 | ) | 1,516 | ||||||||
| Assets acquired |
75,196 | — | — | |||||||||
| Liabilities assumed |
44,220 | — | — | |||||||||
| Transfers of loans, net to loans held-for-sale |
— | 7,909 | — | |||||||||
| Transfers of loans held-for-sale to loans, net |
— | — | 33,101 | |||||||||
| Transfers of loans and loans held-for-sale to other real estate owned |
— | 10,836 | — | |||||||||
| Transfers of debt from credit facilities to term debt |
— | 143,950 | — | |||||||||
The accompanying notes are an integral part of these consolidated financial statements.
64
Table of Contents
NOTES TO CONSOLIDATED FINANCIAL STATEMENTS
Note 1. Organization
NewStar Financial, Inc. (the “Company”), a Delaware corporation, is a commercial finance company focused on the meeting the complex financial needs of companies and private investors in the middle market. The Company principally focuses on the direct origination of loans and leases that meet its risk and return parameters. The Company’s direct origination efforts target mid-sized companies, private equity sponsors, corporate executives, regional banks, real estate investors and a variety of other financial intermediaries to source transaction opportunities. Direct origination provides direct access to customers’ management, enhances due diligence, and allows significant input into customers’ capital structure and direct negotiation of transaction pricing and terms. We also participate in loan syndications as a member of a lending group.
The Company operates as a single segment and derives its revenues from four national lending groups:
| • | Leveraged Finance, which originates, structures and underwrites senior debt and, to a lesser extent, second lien, mezzanine and subordinated debt, and equity and other equity-linked products for companies with annual EBITDA typically between $5 million and $50 million; |
| • | Real Estate, which originates, structures and underwrites first mortgage debt and, to a lesser extent, subordinated debt, primarily to finance acquisitions of commercial real estate properties typically valued between $10 million and $50 million; |
| • | Business Credit, which originates, structures and underwrites senior asset-based loans for companies with sales typically totaling between $25 million and $500 million; and |
| • | Equipment Finance, which originates, structures and underwrites leases and lease lines for capital expenditures for companies with annual sales of at least $25 million. |
The Company launched its Equipment Finance group in January 2011 and as such, it did not have any equipment finance leases as of December 31, 2010.
Note 2. Summary of Significant Accounting Policies
Consolidation
The accompanying consolidated financial statements include the accounts of the Company and its subsidiaries (collectively, “NewStar”) and have been prepared in accordance with U.S. generally accepted accounting principles (“GAAP”). All significant intercompany transactions have been eliminated in consolidation.
Noncontrolling Interest
During 2009, the Company along with a wholly-owned subsidiary of the NewStar Credit Opportunities Fund, Ltd. (“NCOF”) created a limited liability company as part of the resolution of a commercial real estate loan. The limited liability company was formed to take control of the underlying commercial real estate property which was its sole asset. The Company maintained a majority and controlling interest in the limited liability company which was classified as other real estate owned (“OREO”). On May 11, 2010, the limited liability company sold the commercial real estate property.
The consolidated financial statements include the results of operations of the Company as well as the NCOF’s noncontrolling interest of the limited liability company which previously owned the OREO. All significant intercompany balances and transactions have been eliminated in consolidation. The noncontrolling
65
Table of Contents
interest represents the minority partner’s equity and accumulated earnings in the limited liability company. The NCOF’s noncontrolling interest had no recourse to the Company.
Use of Estimates
The preparation of financial statements in conformity with GAAP requires management to make estimates and assumptions that affect certain reported amounts and disclosure of contingent assets and liabilities. Actual results could differ from those estimates. Estimates most susceptible to change in the near-term are the Company’s estimates of their allowance for credit losses, impairment of loans and recorded amounts of deferred income taxes.
Cash and Cash Equivalents
Cash and cash equivalents include all demand deposits held in banks and certain highly liquid instruments with original maturities of 90 days or less.
Investments in Debt Securities
Management determines the classification of securities at the time of purchase. If management has the intent and the Company has the ability at the time of purchase to hold securities until maturity, they are classified as held-to-maturity. Investment securities held-to-maturity are stated at amortized cost. Securities to be held for indefinite periods of time, but not necessarily to be held-to-maturity or on a long-term basis, are classified as available-for-sale and carried at fair value with unrealized gains or losses reported as a separate component of stockholders’ equity in other comprehensive income, net of applicable income taxes. The carrying values of all securities are adjusted for amortization of premiums and accretion of discounts over the shorter of the period to call or maturity of the related security using a method that approximates the interest method. Realized gains or losses on the sale of securities, if any, are determined using the amortized cost of the specific securities sold. If a decline in the fair value of a security below its amortized cost is judged by management to be other than temporary, the cost basis of the security is written down to fair value and the amount of the write-down is included in operations. The fair value of debt securities are based on quoted market prices, when available, at the reporting date for those or similar investments. When no market is available, the Company estimates fair value using various valuation tools, including cash flow analyses that utilize financial statements, business plans, as well as qualitative factors.
Loans Held-for-Sale
Loans classified as held-for-sale consist of loans originated by the Company, intended to be sold or syndicated to third parties. These loans are carried at the lower of aggregate cost, net of any deferred origination costs or fees, or market value.
Loans
Loans are stated at the principal amount outstanding. Interest income is recorded on the accrual basis in accordance with the terms of the respective loan. Loans on which the accrual of interest has been discontinued are designated as nonaccrual loans. The accrual of interest on loans is discontinued when principal or interest payments are past due 90 days or when, in the opinion of management, it is probable it will be unable to collect contractual principal and interest in the normal course of business. When loans are placed on nonaccrual status, all interest previously accrued but not collected is reversed against current period interest income. Income on nonaccrual loans is subsequently recognized only to the extent that cash is received and the loan’s principal balance is deemed collectible.
Nonrefundable loan fees and related direct costs associated with the origination or purchase of loans are deferred and included in loans, net in the consolidated balance sheet. The net deferred fees or costs are
66
Table of Contents
recognized as an adjustment to interest income over the contractual life of the loans using a method which approximates the interest method or taken into income when the related loans are paid off or sold. The Company accretes any discount from purchased loans into loan fee income as a yield adjustment over the contractual life of the loan. The amortization of loan fees is discontinued on non-accrual loans.
Provision and Allowance for Credit Losses
The allowance for credit losses is based on a loan-by-loan build-up of inherent losses on loans, gross. The Company also maintains an allowance for losses on unfunded loan commitments, namely loan commitments and letters of credit that are reported in other liabilities on the balance sheet. The combined balance of the allowance for loan losses and the allowance for unfunded commitments is referred to as the allowance for credit losses. Provision expense is recorded for both the allowance for loan losses and the allowance for losses on unfunded loan commitments.
A general allowance is provided for loans that are not impaired. The Company employs a variety of internally developed and third-party modeling and estimation tools for measuring credit risk, which are used in developing an allowance for loan losses on outstanding loans. The Company’s allowance framework addresses economic conditions, capital market liquidity and industry circumstances from both a top-down and bottom-up perspective. The Company considers and evaluates changes in economic conditions, credit availability, industry and multiple obligor concentrations in assessing both probabilities of default and loss severities as part of the general component of the allowance for loan losses.
On at least a quarterly basis, loans are internally risk-rated based on individual credit criteria, including loan type, loan structures (including balloon and bullet structures common in the Company’s Leveraged Finance and Real Estate cash flow loans), borrower industry, payment capacity, location and quality of collateral if any (including the Company’s Real Estate loans). Borrowers provide the Company with financial information on either a monthly or quarterly basis. Ratings, corresponding assumed default rates and assumed loss severities are dynamically updated to reflect any changes in borrower condition or profile.
For Leveraged Finance loans, the data set used to construct probabilities of default in its allowance for loan losses model, Moody’s CRD Private Firm Database, principally contains middle market corporate loans that share attributes similar to the Company’s loans. The Company also considers the quality of the loan terms in determining a loan loss in the event of default.
For Real Estate loans, the Company employs two mechanisms to capture the impact of industry and economic conditions. First, a loan’s risk rating, and thereby its assumed default likelihood, can be adjusted to account for overall commercial real estate market conditions. Second, to the extent that economic or industry trends adversely affect a borrower’s loan-to-value ratio enough to impact its repayment ability, the Company applies a stress multiplier to the loan’s probability of default. The multiplier is designed to account for default characteristics that are difficult to quantify when market conditions cause commercial real estate prices to decline.
During 2010, the Company refined its allowance for credit losses methodology regarding commercial real estate. If the Company determines that additional changes in its allowance for credit losses methodology are advisable, as a result of changes in the economic environment or otherwise, the revised allowance methodology may result in higher or lower levels of allowance.
Additionally, when determining the amount of the general allowance, the Company supplements the base amount with a judgmental amount which is governed by a score card system comprised of ten individually weighted risk factors. The risk factors are designed based on those outlined in the Comptrollers of the Currency’s Allowance for Loan and Lease Losses Handbook. The Company also performs a ratio analysis of comparable money center banks, regional banks and finance companies. While the Company does not rely on this peer group
67
Table of Contents
comparison to set the level of allowance for credit losses, it does assist management in identifying market trends and serves as an overall reasonable check on the allowance for credit losses computation.
A loan is considered impaired when it is probable that a creditor will be unable to collect all amounts due according to the contractual terms of the loan agreement. Impairment of a loan is based upon either the present value of expected future cash flows discounted at the loan’s effective interest rate, the loan’s observable market price or the fair value of the collateral if the loan is collateral dependent, depending on the circumstances and our collection strategy. Impaired loans are identified based on the loan-by-loan risk rating process described above. It is the Company’s policy during the reporting period to record a specific provision for credit losses for all loans for which we have serious doubts as to the ability of the borrowers to comply with the present loan repayment terms.
Impaired loans at December 31, 2010 were in both Real Estate and in Leveraged Finance, over a range of industries impacted by the then current economic environment including the following: Buildings and Commercial Real Estate, Healthcare, Broadcast and Entertainment, Nondurable Consumer Products, Energy and Chemical Services, Financial Services, Healthcare, Printing and Publishing, Restaurants, and Industrial and Other Business Services. For impaired Leveraged Finance loans, the Company measured impairment based on expected cash flows utilizing relevant information provided by the borrower and consideration of other market conditions or specific factors impacting recoverability. Such amounts are discounted based on original loan terms. For impaired Real Estate loans, the Company determined that the loans were collateral dependent and measured impairment based on the fair value of the related collateral.
Loans deemed to be uncollectible are charged off and deducted from the allowance. The provision for credit losses and recoveries on loans previously charged off are added to the allowance.
Deferred Financing Costs
Deferred financing costs represent fees and other direct incremental costs incurred in connection with borrowings. These amounts are amortized using the straight-line method into earnings as interest expense ratably over the contractual term of the facility.
Property and Equipment
Property and equipment are carried at cost and are depreciated or amortized on a straight-line basis over the following useful lives:
| Leasehold improvements |
Shorter of estimated life or remaining lease term | |
| Computer equipment and software |
3 years |
Income Taxes
Income taxes are accounted for under the asset and liability method. Deferred tax assets and liabilities are recognized for the future tax consequences attributable to differences between the financial statement carrying amounts of existing assets and liabilities and their respective tax bases, and operating loss and tax credit carryforwards. Deferred tax assets and liabilities are measured using enacted tax rates expected to apply to taxable income in the years in which those temporary differences are expected to be recovered or settled. The effect on deferred tax assets and liabilities of a change in tax rates is recognized in income in the period that includes the enactment date.
Derivative Instruments and Hedging Activities
The Company accounts for derivatives and hedging activities on the balance sheet in either other assets or other liabilities at their respective fair values.
68
Table of Contents
On the date a derivative contract is entered into, the Company designates the derivative as either (1) a hedge of a forecasted transaction or the variability of cash flows to be received or paid related to a recognized asset or liability (cash flow hedge) or as (2) a derivative trading instrument. For all hedging relationships the Company formally documents the hedging relationship and its risk-management objective and strategy for undertaking the hedge, the hedging instrument, the item, the nature of the risk being hedged, how the hedging instrument’s effectiveness in offsetting the hedged risk will be assessed, and a description of the method of measuring ineffectiveness. This process includes linking all derivatives that are designated as hedges to specific assets and liabilities on the balance sheet or to forecasted transactions. The Company also formally assesses, both at the hedge’s inception and on an ongoing basis, whether the derivatives that are used in hedging transactions are highly effective in offsetting changes in cash flows of hedged items. Changes in the fair value of a derivative that is highly effective and that is designated and qualifies as a cash-flow hedge are recorded in other comprehensive income to the extent that the derivative is effective as a hedge, until earnings are affected by the variability in cash flows of the designated hedged item. The ineffective portion of the change in fair value of a derivative instrument that qualifies as a cash-flow hedge is reported in earnings.
The Company discontinues hedge accounting prospectively when it is determined that the derivative is no longer effective in offsetting changes in the cash flows of the hedged item, the derivative expires or is sold, terminated, or exercised, the derivative is de-designated as a hedging instrument because it is unlikely that a forecasted transaction will occur, or management determines that designation of the derivative as a hedging instrument is no longer appropriate. In all situations in which hedge accounting is discontinued, the Company continues to carry the derivative at its fair value on the balance sheet and recognizes any subsequent changes in its fair value in earnings. When hedge accounting is discontinued because it is probable that a forecasted transaction will not occur by the date (or within the time period) originally specified or within an additional two-month period of time thereafter, the Company recognizes immediately in earnings gains and losses that were accumulated in other comprehensive income. Gains and losses on derivatives not designated as hedges, including any cash payments made or received, are reported as gain (loss) on derivatives in the accompanying consolidated statements of operations.
Comprehensive Income (Loss), net of tax
The Company records the change in fair value of cash flow hedge derivatives and unrealized gains and losses on available-for-sale securities in comprehensive income. Gains and losses on available-for-sale securities are reclassified to net income as the gains and losses are realized upon sale of the securities. Other than temporary impairment charges are reclassified to earnings at the time of the charge.
Fee Income Recognition
Origination fees and costs are deferred and amortized as yield adjustments over the contractual life of the loans and investments. In connection with the prepayment of a loan or other debt product, any remaining unamortized net deferred fees for that loan are accelerated and, depending on the terms of the loan, there may be an additional fee charged based upon the prepayment and recognized in the period of the prepayment. Syndication and structuring fees are recognized in the period the service is completed as fee income.
Asset Management Income
NewStar Financial, Inc. earns asset management income for investment management services performed for the NewStar Credit Opportunities Fund, Ltd. NewStar accrues this income when earned, on a monthly basis, and classifies it as asset management income in the consolidated statements of operations.
Stock Based Compensation
The Company accounts for stock-based compensation under the guideline of ASC 718 (formerly SFAS 123R).
69
Table of Contents
Effective January 1, 2006, the Company adopted the fair value recognition provisions of ASC 718 for all share-based payments, using the prospective transition method. As such, ASC 718 is applied only to awards granted, modified, repurchased, or cancelled after January 1, 2006. The prospective method of adoption does not permit ASC 718 to be applied to the nonvested portion of awards outstanding at the date of initial application. In accordance with the prospective transition method, the Company’s consolidated financial statements for prior periods have not been restated to reflect, and do not include, the impact of ASC 718.
The Company recognizes compensation cost on a tranche-by tranche basis over the vesting period of the equity award.
Gain on sale of loans
All loans sold to date have been sold without recourse. When loans are sold, a gain or loss is recognized to the extent that the sales proceeds plus unamortized fees and costs exceed or are less than the carrying value of the loans. Gains and losses are determined using the specific identification method.
Income Tax Interest and Penalties
The Company classifies all interest and penalties on recognized tax benefits as a part of income tax expense. As of December 31, 2010, the Company did not have any accrued interest or penalties.
Equity Method of Accounting
As the result of a troubled debt restructuring, the Company may acquire a portion of the equity in the borrower. In certain cases where the Company has the ability to exercise significant influence over the borrower, it accounts for its equity interest under the equity method of accounting. Under the equity method of accounting, the Company recognizes its proportional share of the borrower’s GAAP net income in its results of operations. In cases where the equity of the underlying company has no value, and the borrower incurs losses, the Company will apply its proportional share of the GAAP loss against the principal of the outstanding loan to the borrower.
Recently Adopted Accounting Standards
On June 12, 2009, the FASB issued ASC 860 (formerly SFAS 166, Accounting for Transfers of Financial Assets) and ASC 810 (formerly SFAS 167, Amendments to FASB Interpretation No. 46(R)). ASC 860 eliminates the concept of a qualifying special-purpose entity (“QSPE”) and, accordingly, any existing QSPE must be evaluated for consolidation upon adoption of ASC 860. Under ASC 860, the appropriateness of derecognition is evaluated based on whether or not the transferor has surrendered control of the transferred assets. The evaluation must consider any continuing involvement by the transferor. ASC 810 amends FIN 46R to require a reporting entity to perform an analysis to determine if its variable interests give it a controlling financial interest in a variable interest entity (“VIE”). The analysis required under ASC 810 identifies the primary beneficiary of a VIE as the entity having both of the following: (1) the power to direct the activities of a variable interest entity that most significantly impact the entity’s economic performance and (2) the obligation to absorb losses of the entity that could potentially be significant to the VIE or the right to receive benefits from the entity that could potentially be significant to the VIE.
In addition, a reporting entity must assess whether it has an implicit financial responsibility to ensure that a VIE operates as designed when determining if it has the power to direct the activities of the VIE that most significantly affect the entity’s economic performance. ASC 810 amends FIN 46R to require ongoing reassessments of whether a reporting entity is the primary beneficiary of a VIE. Specifically, the list of reconsideration events includes a change in facts and circumstances where the holders of an equity investment at risk as a group lose the power to direct the activities of the entity that most significantly affect the entity’s economic performance. In addition, a troubled debt-restructuring is now defined as a reconsideration event. Both
70
Table of Contents
statements expand required disclosures and are effective as of the beginning of the first annual reporting period that begins after November 15, 2009. The adoption of ASC 860 and ASC 810 did not have a material effect on the Company’s results from operation or financial position.
In July 2010, the FASB issued ASU 2010-20, Receivables (Topic 310): Disclosures about the Credit Quality of Financing Receivables and the Allowance for Credit Losses. ASU 2010-20 amends Topic 310 to provide greater transparency about an entity’s allowance for credit losses and the credit quality of its financing receivables. The new disclosures as of the end of the reporting period are effective for interim and annual reporting periods ending on or after December 15, 2010. The new disclosures about activity that occurs during a reporting period are effective for interim and annual reporting periods beginning on or after December 15, 2010. The adoption of ASU 2010-20 did not have a material effect on the Company’s results from operations or financial position as it only impacts the required disclosures as incorporated into Note 3.
Recently Issued Accounting Standards
In January 2010, the FASB issued ASU 2010-06, Fair Value Measurements and Disclosures (Topic 820): Improving Disclosures about Fair Value Measurements. ASU 2010-06 provides amendments to Topic 820 that require new disclosures about (1) the different classes of assets and liabilities measured at fair value, (2) the valuation techniques and inputs used, (3) the activity in Level 3 fair value measurements, and (4) the transfers between Levels 1, 2, and 3. The new disclosures regarding the activity in Level 3 fair value measurements is effective for fiscal years beginning after December 15, 2010, and for interim periods within those fiscal years. Early adoption is permitted. All other requirements of ASU 2010-06 are effective in interim and annual periods beginning after December 15, 2009. The adoption of ASU 2010-06 did not have a material effect on the Company’s results from operations or financial position. The adoption of the requirements effective in 2011 is not expected to have a material effect on the Company’s results from operations or financial position.
Note 3. Acquisition
On November 1, 2010, the Company acquired Core Business Credit, LLC, an asset-based lender located in Dallas, Texas with outstanding loans totaling $73.4 million as of October 31, 2010, and its wholly-owned subsidiaries (collectively “Core”) for a purchase price of $25.3 million in cash. The Company recognized a gain of $5.6 million in connection with the acquisition based upon the difference of the fair value of $75.2 million of assets acquired, net of $44.2 million of liabilities assumed and the $25.3 million of cash paid. In conjunction with the acquisition, the Company became party to an existing $225 million revolving credit facility with DZ Bank AG Deutsche Zentral-Genossenschaftsbank Frankfurt for asset-based lending origination. The acquisition was accounted for under the acquisition method of accounting. Under the acquisition method, assets and liabilities of the business acquired are recorded at their estimated fair values as of the date of acquisition. Results of operations of the acquired business are included in the income statement from the date of acquisition.
Note 4. Loans Held-for-Sale, Loans and Allowance for Credit Losses
Loans classified as held-for-sale may consist of loans originated by the Company and intended to be sold or syndicated to third parties (including the NCOF) or impaired loans for which a sale of the loan is expected as a result of a workout strategy. At December 31, 2010 loans held-for-sale consisted of leveraged finance loans to 11 borrowers which are intended to be sold to the NCOF at an agreed upon price. Subsequent to December 31, 2010, the Company sold loans with an aggregate outstanding balance of $31,950 million to the NCOF.
These loans are carried at the lower of aggregate cost, net of any deferred origination costs or fees, or market value.
71
Table of Contents
As of December 31, 2010 and 2009, loans held-for-sale consisted of the following:
| December 31, 2010 |
December 31, 2009 |
|||||||
| ($ in thousands) | ||||||||
| Leveraged Finance |
$ | 42,228 | $ | 15,990 | ||||
| Gross loans |
42,228 | 15,990 | ||||||
| Deferred loan fees, net |
(842 | ) | (254 | ) | ||||
| Total loans, net |
$ | 41,386 | $ | 15,736 | ||||
The Company sold two loans for a loss of $0.1 million to entities other than the NCOF during 2010. The Company did not sell any loans to entities other than the NCOF during 2009. During 2008, the Company sold six loans for an aggregate gain of $1.1 million to entities other than the NCOF and transferred loans with an aggregate outstanding balance of $33.1 million from loans held-for-sale to loans held-for-investment.
During 2009, the Company transferred one $7.1 million commercial real estate loan which was classified as held-for-sale to other real estate owned, recorded a $5.0 million charge-off and recognized a loss of $0.8 million resulting from a decline in fair value of the loan.
During 2008, the Company recognized losses of $0.8 million resulting from a decline in fair value of loans held-for-sale.
As of December 31, 2010 and 2009, loans consisted of the following:
| December 31, | ||||||||
| 2010 | 2009 | |||||||
| ($ in thousands) | ||||||||
| Leveraged Finance |
$ | 1,348,238 | $ | 1,692,929 | ||||
| Real Estate |
282,610 | 320,659 | ||||||
| Business Credit |
67,390 | — | ||||||
| Gross loans |
1,698,238 | 2,013,588 | ||||||
| Deferred loan fees, net |
(23,405 | ) | (20,745 | ) | ||||
| Allowance for loan losses |
(84,502 | ) | (113,865 | ) | ||||
| Total loans, net |
$ | 1,590,331 | $ | 1,878,978 | ||||
The Company grants commercial loans, real estate loans, and leases to customers throughout the United States. Although the Company has a diversified loan and lease portfolio, certain events have occurred, including, but not limited to, adverse economic conditions and adverse events affecting specific clients, industries or markets, that may adversely affect the ability of borrowers to make timely scheduled principal and interest payments on their loans and leases.
The following table sets forth the activity relating to accretable discount related to the acquisition of Core :
| Year Ended December 31, |
||||||||
| 2010 | 2009 | |||||||
| ($ in thousands) | ||||||||
| Balance, beginning of year |
$ | — | $ | — | ||||
| Additions due to acquisitions |
94 | — | ||||||
| Accretion |
(10 | ) | — | |||||
| Reduction due to payments or sale |
— | — | ||||||
| Balance, end of year |
$ | 84 | $ | — | ||||
72
Table of Contents
The Company also recognized a $1.7 million non-accretable discount resulting from the fair value of loans acquired from Core.
As of December 31, 2010, the Company had impaired loans with an aggregate outstanding balance of $356.6 million. Impaired loans with an aggregate outstanding balance of $222.6 million have been restructured and classified as troubled debt restructurings (“TDR”). Impaired loans with an aggregate outstanding balance of $135.6 million were also on non-accrual status. For impaired loans on non-accrual status, the Company’s policy is to reverse the accrued interest previously recognized as interest income subsequent to the last cash receipt in the current year. The recognition of interest income on the loan only resumes when factors indicating doubtful collection no longer exist and the non-accrual loan has been brought current. During 2010, the Company recorded $47.7 million of specific provisions for impaired loans. At December 31, 2010, the Company had a $60.4 million specific allowance for impaired loans with an aggregate outstanding balance of $238.5 million. At December 31, 2010, additional funding commitments for impaired loans totaled $54.9 million. The Company’s obligation to fulfill the additional funding commitments on impaired loans is generally contingent on the borrower’s compliance with the terms of the credit agreement, or if the borrower is not in compliance additional funding commitments may be made at the Company’s discretion. As of December 31, 2010, $106.0 million of impaired loans and $8.4 million of accruing loans were greater than 60 days past due and classified as delinquent by the Company. Included in the $60.4 million specific allowance for impaired loans was $26.7 million related to delinquent loans.
As of December 31, 2009, the Company had impaired loans with an aggregate outstanding balance of $352.4 million. Impaired loans with an aggregate outstanding balance of $257.7 million have been restructured and classified as TDRs. Impaired loans with an aggregate outstanding balance of $162.7 million were also on non-accrual status. During 2009, the Company recorded $132.5 million of specific provisions for impaired loans. At December 31, 2009, the Company had a $75.4 million specific allowance for impaired loans with an aggregate outstanding balance of $306.5 million. At December 31, 2009, additional funding commitments for impaired loans totaled $27.8 million. As of December 31, 2009, impaired loans with an aggregate outstanding balance of $123.9 million were greater than 60 days past due and classified as delinquent by the Company. Included in the $75.4 million specific allowance for impaired loans was $24.9 million related to delinquent loans.
A summary of impaired loans is as follows:
| 2010 |
Investment | Unpaid Principal |
Recorded Investment with a Related Allowance for Credit Losses |
Recorded Investment without a Related Allowance for Credit Losses |
||||||||||||
| ($ in thousands) | ||||||||||||||||
| Leveraged Finance |
$ | 262,394 | $ | 336,054 | $ | 168,279 | $ | 94,115 | ||||||||
| Real Estate |
87,448 | 93,829 | 70,231 | 17,217 | ||||||||||||
| Business Credit |
6,732 | 8,250 | — | — | ||||||||||||
| Total |
$ | 356,574 | $ | 438,133 | $ | 238,510 | $ | 111,332 | ||||||||
| 2009 |
||||||||||||||||
| Leveraged Finance |
$ | 289,707 | $ | 328,347 | $ | 243,771 | $ | 45,936 | ||||||||
| Real Estate |
62,732 | 68,018 | 62,717 | 15 | ||||||||||||
| Business credit |
— | — | — | — | ||||||||||||
| Total |
$ | 352,439 | $ | 396,365 | $ | 306,488 | $ | 45,951 | ||||||||
The aggregate average balance of impaired loans during 2010 was $362.4 million. The total amount of interest income recognized during 2010 from impaired loans was $3.3 million. The amount of cash basis interest income that was recognized for 2010 was $2.3 million.
73
Table of Contents
The aggregate average balance of impaired loans during 2009 was $414.7 million. The total amount of interest income recognized during 2009 from impaired loans was $21.1 million. The amount of cash basis interest income that was recognized for 2009 was $17.5 million.
The aggregate average balance of impaired loans during 2008 was $116.3 million. The total amount of interest income recognized during 2008 from impaired loans was $9.7 million. The amount of cash basis interest income that was recognized for 2008 was $8.2 million.
Below is a summary of the Company’s evaluation of its portfolio and allowance for loan losses by impairment methodology:
| Leveraged Finance | Real Estate | Business Credit | ||||||||||||||||||||||
| 2010 |
Investment | Allowance | Investment | Allowance | Investment | Allowance | ||||||||||||||||||
| ($ in thousands) | ||||||||||||||||||||||||
| Collectively evaluated (1) |
$ | 1,085,844 | $ | 17,562 | $ | 195,162 | $ | 6,869 | $ | 60,658 | (3) | $ | — | |||||||||||
| Individually evaluated (2) |
262,394 | 41,350 | 87,448 | 19,000 | 6,732 | (3) | — | |||||||||||||||||
| Total |
$ | 1,348,238 | $ | 58,912 | $ | 282,610 | $ | 25,869 | $ | 67,390 | $ | — | ||||||||||||
| (1) | Represents loans collectively evaluated for impairment in accordance with ASC 450-20, Loss Contingencies, and pursuant to amendments by ASU 2010-20 regarding allowance for unimpaired loans. These loans had a weighted average risk rating of 5.5 based on the Company’s internally developed 12 point scale. |
| (2) | Represents loans individually evaluated for impairment in accordance with ASU 310-10, Receivables, and pursuant to amendments by ASU 2010-20 regarding allowance for impaired loans. |
| (3) | Represents the Core acquisition portfolio of loans which the Company recorded at fair value on the date of acquisition. |
The Company classifies a loan as Past Due when it is over 60 days delinquent.
An age analysis of the Company’s past due receivables is as follows:
| 2010 |
60-89 Days Past Due |
Greater than 90 Days |
Total Past Due |
Current | Total Loans | Investment in > 60 Days & Accruing |
||||||||||||||||||
| ($ in thousands) | ||||||||||||||||||||||||
| Leveraged Finance |
$ | 17,224 | $ | 70,061 | $ | 87,285 | $ | 1,309,649 | $ | 1,396,934 | $ | — | ||||||||||||
| Real Estate |
— | 27,196 | 27,196 | 255,414 | 282,610 | 8,438 | ||||||||||||||||||
| Business Credit |
— | — | — | 67,390 | 67,390 | — | ||||||||||||||||||
| Total |
$ | 17,224 | $ | 97,257 | $ | 114,481 | $ | 1,632,453 | $ | 1,746,934 | $ | 8,438 | ||||||||||||
| 2009 |
||||||||||||||||||||||||
| Leveraged Finance |
$ | 12,246 | $ | 96,389 | $ | 108,635 | $ | 1,606,919 | $ | 1,715,554 | $ | 19,915 | ||||||||||||
| Real Estate |
— | 15,251 | 15,251 | 305,408 | 320,659 | — | ||||||||||||||||||
| Business Credit |
— | — | — | — | — | — | ||||||||||||||||||
| Total |
$ | 12,246 | $ | 111,640 | $ | 123,886 | $ | 1,912,327 | $ | 2,036,213 | $ | 19,915 | ||||||||||||
74
Table of Contents
A summary of the activity in the allowance for credit losses is as follows:
| Year Ended December 31, | ||||||||||||
| 2010 | 2009 | 2008 | ||||||||||
| ($ in thousands) | ||||||||||||
| Balance, beginning of year |
$ | 114,470 | $ | 53,977 | $ | 35,487 | ||||||
| Provision for credit losses—general |
(14,698 | ) | 619 | 7,369 | ||||||||
| Provision for credit losses—specific |
47,695 | 132,474 | 30,855 | |||||||||
| Loans charged off, net of recoveries |
(62,686 | ) | (67,600 | ) | (19,734 | ) | ||||||
| Loans charged off upon transfer to held-for-sale, net of recoveries |
— | (5,000 | ) | — | ||||||||
| Balance, end of year |
$ | 84,781 | $ | 114,470 | $ | 53,977 | ||||||
| Balance, end of year—specific |
$ | 60,350 | $ | 75,380 | $ | 15,713 | ||||||
| Balance, end of year—general |
$ | 24,431 | $ | 39,090 | $ | 38,264 | ||||||
| Loans, net |
||||||||||||
| Impaired loans, net with specific allowance |
$ | 238,510 | $ | 306,488 | $ | 112,788 | ||||||
| Impaired loans, net with no specific allowance |
117,930 | 45,950 | — | |||||||||
| Loans, net acquired with deteriorating credit quality |
6,732 | — | — | |||||||||
| Loans, net without specific allowance |
1,227,159 | 1,526,540 | 2,216,024 | |||||||||
| Total loans, net |
$ | 1,590,331 | $ | 1,878,978 | $ | 2,328,812 | ||||||
During 2010 the Company recorded a total provision for credit losses of $33.0 million. The Company decreased its allowance for credit losses to $84.8 million at December 31, 2010 from $114.5 million at December 31, 2009. This decrease in allowance for credit losses resulted primarily from impaired loans charged off during 2010 and the $288.6 million decrease in total loans net as compared to December 31, 2009. The general allowance for credit losses covers probable losses in the Company’s loan portfolio with respect to loans for which no specific impairment has been identified. The general allowance decreased as negative credit migration slowed and general economic conditions improved. A specific provision for credit losses is recorded with respect to loans for which it is probable that the Company will be unable to collect all amounts due in accordance with the contractual terms of the loan agreement for which there is impairment recognized. The outstanding balance of impaired loans, which include all of the outstanding balances of the Company’s delinquent loans and its troubled debt restructurings, as a percentage of “Loans, net” increased to 22% as of December 31, 2010 as compared to 18% as of December 31, 2009. When a loan is classified as impaired, the loan is evaluated for a specific allowance and a specific provision may be recorded, thereby removing it from consideration under the general component of the allowance analysis. Loans that are deemed to be uncollectible are charged off and deducted from the allowance, and recoveries on loans previously charged off are netted against loans charged off.
The Company is closely monitoring the credit quality of its loans and loan delinquencies, non-accruals and charge offs, and the occurrence of these events may increase due to changes in economic conditions and seasoning of the loan portfolio.
Included in the allowance for credit losses at December 31, 2010 and 2009 is an allowance for unfunded commitments of $0.3 million and $0.6 million, respectively, which is recorded as a component of other liabilities on the Company’s consolidated balance sheet with changes recorded in the provision for credit losses on the Company’s consolidated statement of operations. The methodology for determining the allowance for unfunded commitments is consistent with the methodology for determining the allowance for loan losses.
75
Table of Contents
Based on the Company’s evaluation process to determine the level of the allowance for loan losses, management believes the allowance to be adequate as of December 31, 2010 in light of the estimated known and inherent risks identified through its analysis. The Company continually evaluates the appropriateness of its allowance for credit losses methodology.
During the second quarter of 2009, the Company adjusted its allowance for credit losses methodology regarding commercial real estate to reflect deteriorating market conditions. During the third quarter of 2010, the Company refined its allowance for credit losses methodology regarding commercial real estate. If the Company determines that additional changes in its allowance for credit losses methodology are advisable, as a result of changes in the economic environment or otherwise, the revised allowance methodology may result in higher or lower levels of allowance. Moreover, given uncertain market conditions, actual losses under the Company’s current or any revised allowance methodology may differ materially from the Company’s estimate.
During 2009, as part of the resolution of two impaired commercial real estate loans, the Company took control of the underlying commercial real estate properties. During 2010, the Company sold one of these commercial real estate properties. At December 31, 2010, the remaining asset had a carrying amount of $3.4 million and was classified as other real estate owned (“OREO”) and included in “Other assets” in the Company’s balance sheet.
During 2009, the Company sold an asset which was classified as other real estate owned as a result of a foreclosure on an impaired real estate loan. During 2009, the Company recorded a loss of $3.2 million related to this asset to reflect its net fair value.
Note 5. Restricted Cash
Restricted cash as of December 31, 2010 and 2009 was as follows:
| December 31, | ||||||||
| 2010 | 2009 | |||||||
| ($ in thousands) | ||||||||
| Collections on loans pledged to credit facilities |
$ | 32,356 | $ | 21,727 | ||||
| Principal and interest collections on loans held in trust and prefunding amounts |
132,969 | 105,812 | ||||||
| Customer escrow accounts |
13,039 | 9,345 | ||||||
| Total |
$ | 178,364 | $ | 136,884 | ||||
As of December 31, 2010, the Company had the ability to use $41.1 million of restricted cash to fund new or existing loans.
Note 6. Investments in Debt Securities, Available-for-Sale
Amortized cost of investments in debt securities as of December 31, 2010 and 2009 was as follows:
| December 31, | ||||||||
| 2010 | 2009 | |||||||
| ($ in thousands) | ||||||||
| Investments in debt securities—gross |
$ | 6,468 | $ | 6,635 | ||||
| Unamortized discount |
(2,298 | ) | (2,298 | ) | ||||
| Investments in debt securities—amortized cost |
$ | 4,170 | $ | 4,337 | ||||
76
Table of Contents
The amortized cost, gross unrealized holding gains, gross unrealized holding losses, and fair value of available-for-sale securities at December 31, 2010 and 2009 were as follows:
| Amortized cost |
Gross unrealized holding gains |
Gross unrealized holding losses |
Fair value | |||||||||||||
| ($ in thousands) | ||||||||||||||||
| December 31, 2010: |
||||||||||||||||
| Other debt obligation (1) |
$ | 4,170 | $ | — | $ | (156 | ) | $ | 4,014 | |||||||
| $ | 4,170 | $ | — | $ | (156 | ) | $ | 4,014 | ||||||||
| Amortized cost |
Gross unrealized holding gains |
Gross unrealized holding losses |
Fair value | |||||||||||||
| ($ in thousands) | ||||||||||||||||
| December 31, 2009: |
||||||||||||||||
| Other debt obligation (1) |
$ | 4,337 | $ | — | $ | (154 | ) | $ | 4,183 | |||||||
| $ | 4,337 | $ | — | $ | (154 | ) | $ | 4,183 | ||||||||
| (1) | Securitization collateralized by future cash flows from multiple property easements. |
The Company did not sell any debt securities during 2010 and 2009. During 2008, the Company sold one debt security at a realized loss of $0.1 million.
The Company did not record any net Other Than Temporary Impairment charges during 2010 and 2009. During 2008, the Company recorded a net Other Than Temporary Impairment charge in non-interest income of $0.9 million relating to two debt securities.
The following is an analysis of the continuous periods during which NewStar has held investment positions which were carried at an unrealized loss as of December 31, 2010 and 2009:
| December 31, 2010 | ||||||||||||
| Less than 12 Months |
Greater than or Equal to 12 Months |
Total | ||||||||||
| ($ in thousands) | ||||||||||||
| Number of positions |
— | 1 | 1 | |||||||||
| Fair value |
$ | — | $ | 4,014 | $ | 4,014 | ||||||
| Amortized cost |
— | 4,170 | 4,170 | |||||||||
| Unrealized loss |
$ | — | $ | 156 | $ | 156 | ||||||
| December 31, 2009 | ||||||||||||
| Less than 12 Months |
Greater than or Equal to 12 Months |
Total | ||||||||||
| ($ in thousands) | ||||||||||||
| Number of positions |
— | 1 | 1 | |||||||||
| Fair value |
$ | — | $ | 4,183 | $ | 4,183 | ||||||
| Amortized cost |
— | 4,337 | 4,337 | |||||||||
| Unrealized loss |
$ | — | $ | 154 | $ | 154 | ||||||
77
Table of Contents
As a result of the Company’s evaluation of the security, management concluded that the unrealized losses at December 31, 2010 and 2009 were caused by changes in market prices driven by interest rates and credit spreads. The Company’s evaluation of impairment included adjustments to prepayment speeds, delinquency, an analysis of expected cash flows, interest rates, market discount rates, other contract terms, and the timing and level of losses on the loans and leases within the underlying trusts. At December 31, 2010, the Company has determined that it is not more likely than not that it will be required to sell the security before the Company recovers its amortized cost basis in the security. The Company has also determined that there has not been an adverse change in the cash flows expected to be collected. Based upon the Company’s impairment review process, and the Company’s ability and intent to hold these securities until maturity or a recovery of fair value, the decline in the value of these investments is not considered to be “Other Than Temporary”.
Maturities of debt securities classified as available-for-sale were as follows at December 31, 2010 and 2009 (maturities of asset-backed and mortgage-backed securities have been allocated based upon estimated maturities, assuming no change in the current interest rate environment):
| 2010 | 2009 | |||||||||||||||
| Amortized cost |
Fair value | Amortized cost |
Fair value | |||||||||||||
| ($ in thousands) | ||||||||||||||||
| Available-for-sale: |
||||||||||||||||
| Due one year or less |
$ | — | $ | — | $ | — | $ | — | ||||||||
| Due after one year through five years |
— | — | — | — | ||||||||||||
| Due after five years through ten years |
4,170 | 4,014 | 4,337 | 4,183 | ||||||||||||
| Total |
$ | 4,170 | $ | 4,014 | $ | 4,337 | $ | 4,183 | ||||||||
Note 7. Derivative Financial Instrument Hedging Activities
During 2010, the Company entered into three short-term interest rate swap agreements which were designated and qualified as cash flow hedges of the risk of changes in the Company’s interest payments on LIBOR-indexed debt. The three interest rate swap agreements matured prior to December 31, 2010. During 2006, the Company entered into interest rate swap agreements which were designated and qualified as cash flow hedges of the risk of changes in the Company’s interest payments on LIBOR-indexed debt. At December 31, 2010, the lone remaining outstanding interest rate swap agreement had a notional value of $3.6 million and had a scheduled maturity of October 20, 2013. The Company records the contracted interest rate swap net amounts exchanged in interest expense in the accompanying consolidated statements of operations. During 2010 and 2009, the Company recorded hedge ineffectiveness of $(39,494) and $(28,405), respectively, which is included in gain (loss) on derivatives in the Company’s consolidated statements of operations. The Company estimates that the net amount of existing unrealized losses at December 31, 2010 expected to be classified from accumulated other comprehensive income into earnings within the next 12 months is approximately $0.5 million. The reclassification is expected to result in additional interest expense.
Interest rate risk mitigation products are offered to enable customers to meet their financing and risk management objectives. Derivative financial instruments consist predominantly of interest rate swaps, interest rate caps and floors. The interest rate risks to the Company of these customer derivatives is mitigated by entering into similar derivatives having offsetting terms with other counterparties consisting primarily of large financial institutions. The interest rate mitigation products do not qualify for hedge accounting treatment.
During 2008, the Company terminated interest rate swaps resulting in a gain of $1.1 million.
78
Table of Contents
The fair values of the Company’s derivative instruments outstanding as of December 31, 2010 were as follows:
| Asset Derivatives | Liability Derivatives | |||||||||||||||
| ($ in thousands) |
Balance Sheet Location |
Fair Value | Balance Sheet Location |
Fair Value | ||||||||||||
| Derivative instruments designated as hedging instruments: |
||||||||||||||||
| Interest rate contracts |
Other assets | $ | — | Other liabilities | $ | 356 | ||||||||||
| Derivative instruments not designated as hedging instruments: |
||||||||||||||||
| Interest rate contracts |
Other assets | $ | 863 | Other liabilities | $ | 817 | ||||||||||
The gains and losses on the Company’s derivative instruments during 2010 were as follows:
| ($ in thousands) |
||||||||||||||||
| Derivatives in Cash Flow Hedging Relationships: |
Amount of Gain (Loss) Recognized in OCI (Effective Portion) |
Location of Gain |
Amount of Gain (Loss) Reclassified from Accumulated OCI into Income (Effective Portion) |
Location of Gain |
Amount of Gain (Loss) Recognized in Income (Ineffective Portion) |
|||||||||||
| Interest rate contracts |
$ | 548 | Gain (loss) on derivatives |
$ | (816 | ) | Gain (loss) on derivatives |
$ | (39 | ) | ||||||
| Derivatives Not Designated as Hedging Instruments |
Amount of Gain (Loss) Recognized in Income |
Location of Gain (Loss) |
||||||||||||||
| Interest rate contracts |
$ | 24 | Gain (loss) on derivatives |
|||||||||||||
As of December 31, 2010, the fair value of derivatives in a net liability position, which includes accrued interest but excludes any adjustment for nonperformance risk, was $2.9 million. The Company has minimum collateral posting thresholds with certain of its derivative counterparties and had posted collateral of $0.3 million at December 31, 2010.
If the Company defaults on any of its indebtedness under these derivatives, including defaults where repayment of the indebtedness has not been accelerated by the lender, or if the Company defaults on its credit facility with Wachovia Capital Markets, LLC or its note agreement with Fortress Credit Corp., then the Company could be declared in default on its derivative obligations with the respective counterparties. In addition, if the Company fails to maintain a minimum net worth of $300 million, then the Company could be declared in default on certain of its derivative obligations. As of December 31, 2010, the Company was in compliance with all of these provisions.
If the Company had been declared in default of any of these provisions at December 31, 2010, its derivative counterparties could have required the Company to settle its obligations under the respective derivatives at their termination value, which would have totaled $2.9 million in the aggregate.
79
Table of Contents
Note 8. Fixed Assets
| December 31, | ||||||||
| 2010 | 2009 | |||||||
| ($ in thousands) | ||||||||
| Leasehold improvements |
$ | 1,549 | $ | 1,460 | ||||
| Non-depreciable assets |
20 | 20 | ||||||
| Furniture and equipment |
319 | 133 | ||||||
| Software |
364 | 347 | ||||||
| 2,252 | 1,960 | |||||||
| Less: Accumulated depreciation and amortization |
(1,373 | ) | (984 | ) | ||||
| $ | 879 | $ | 976 | |||||
Depreciation expense for 2010, 2009 and 2008 was $0.1 million for each period.
Note 9. Borrowings
Credit Facilities
As of December 31, 2010 the Company had three credit facilities: (i) a $75 million credit facility with Citicorp North America, Inc. (“Citicorp”), (ii) a $50 million facility with NATIXIS Financial Products, Inc. (“NATIXIS”) and (iii) a $225.0 million credit facility with DZ Bank AG Deutsche Zentral-Genossenschaftsbank Frankfurt (“DZ Bank”).
During 2005, the Company formed a wholly owned subsidiary, NewStar Warehouse Funding 2005, LLC, a single-purpose bankruptcy-remote entity, to purchase or hold loans and investments, in connection with the credit facility agreement with Citicorp. On March 19, 2010, the Company entered into an amendment to this credit facility that reduced the commitment amount under the facility to $75 million from $150 million. In addition, the Company reduced the demand note to the facility to $7.5 million. The $75 million credit facility with Citicorp was subject to an annual renewal in November 2010. The Company extended the annual renewal date to February 14, 2011. On February 14, 2011, we entered into an amendment to this credit facility which extended the maturity date to June 15, 2011 with a bullet maturity payment due at that time. Advances may be made at 28% of the borrowing base up to $10.0 million and may only be used to fund existing revolving loans. If in the future Citicorp decides not to renew its credit facility with us on the June 15, 2011 maturity date, our ability to make new borrowings under that facility would terminate. The Company expects to repay the outstanding balance of this credit facility on or before the maturity date. NewStar Warehouse Funding 2005, LLC must comply with various covenants, the breach of which could result in a termination event. These covenants include, but are not limited to, failure to service debt obligations, insolvency tests, failure to meet tangible net worth covenants, and failure to remain within prescribed facility portfolio delinquency, charge-off, and interest coverage levels. At December 31, 2010, NewStar Warehouse Funding 2005, LLC was in compliance with all such covenants. Interest on this facility accrues at a variable rate per annum, which was 2.84% at December 31, 2010. As of December 31, 2010, unamortized deferred financing fees were $0.7 million and the outstanding balance was $28.8 million. The Company amortized $2.0 million of deferred financing fees during 2010 resulting from the reduction in the commitment amount under this credit facility.
In connection with the NATIXIS credit facility entered into in August 2005, the Company formed a wholly owned subsidiary, NewStar Short-Term Funding, LLC, a single-purpose bankruptcy-remote entity, to purchase or hold loans and investments for 90 days or less. The amount outstanding under the credit facility varies with the balances outstanding of pledged loans and investments depending on the mix of assets. On May 4, 2010, the Company entered into an amendment with NATIXIS which extended the maturity date from May 21, 2010 to May 20, 2011, among other things. NewStar Short-Term Funding, LLC must comply with various covenants, the
80
Table of Contents
breach of which could result in a termination event. These covenants include, but are not limited to, failure to service debt obligations and failure to remain within prescribed facility portfolio charge-off levels. At December 31, 2010, NewStar Short-Term Funding, LLC was in compliance with all such covenants. Interest on this facility accrues at a variable rate per annum, which was 3.76% at December 31, 2010. As of December 31, 2010, unamortized deferred financing fees were $0.2 million and the outstanding balance was $41.5 million.
As part of the Company’s acquisition of Core Business Credit, LLC and its wholly-owned subsidiaries (“Core”) on November 1, 2010, it became a party to an existing $225.0 million credit facility with DZ Bank. The credit facility with DZ Bank had an outstanding balance of $38.3 million as of December 31, 2010. Interest on this facility accrues at a variable rate per annum, which was 2.30% at December 31, 2010. As part of the agreement, there is a minimum payment of $2.8 million per annum required to be made. If the facility is not utilized to cover this minimum requirement, then a make-whole fee is required to be made. The Company is permitted to use the proceeds of borrowings under the credit facility to fund commitments under existing or new asset based loans. This facility is scheduled to mature on April 25, 2013.
On July 29, 2008, the Company entered into a credit facility agreement with Union Bank, N.A. The credit facility terminated on October 21, 2010.
Corporate Credit Facility
On January 5, 2010, the Company entered into a note agreement with Fortress Credit Corp., establishing a $75.0 million revolving credit facility. Under the credit facility, the Company could draw, repay and draw again prior to the maturity date, subject to availability under a borrowing base. The credit facility was scheduled to begin to reduce revolver commitments on July 5, 2011 and was scheduled to mature on July 5, 2013. On August 31, 2010, the Company entered into an amendment to this credit facility which increased the size of the credit facility to $100.0 million, consisting of a $50.0 million revolving credit facility and a $50.0 million term loan facility, extended the maturity date to August 31, 2014, and removed the scheduled revolver commitment reductions. In addition, the amendment decreased the credit facility pricing of advances to the London Interbank Offered Rate (LIBOR) plus 7.00%.
The Company is permitted to use the proceeds of borrowings under the credit facility for general corporate purposes including, but not limited to, funding loans, working capital, paying down outstanding debt, making certain types of acquisitions and repurchasing capital stock up to $10 million.
The applicable unused fee rate of the revolving credit facility is 4.0% of the undrawn amount of the facility when the total outstanding amount is less than 50% of the commitment amount, 3.0% of the undrawn amount of the facility when the total outstanding amount is greater than or equal to 50% but less than 75% of the commitment amount, and 2.0% of the undrawn amount of the facility when the total outstanding amount is greater than or equal to 75% of the commitment amount. As of December 31, 2010, the Company had not drawn any amounts from the revolving credit facility. As of December 31, 2010, unamortized deferred financing fees were $3.7 million.
The term loan facility may be prepaid subject to a prepayment fee, payable whether the prepayment is voluntary or involuntary. If any such prepayment is made on or before August 30, 2012, the prepayment fee will be calculated for the period commencing on the date of such prepayment and continuing through August 30, 2012 and shall be equal to the product of 7.00% per annum multiplied by the amount of the prepayment. If any such prepayment is made after August 30, 2012, such prepayment fee will be equal to the product of (a) the amount of the prepayment and (b)(i) in the case of any such prepayment made during the period commencing on August 31, 2012 and ending on August 30, 2013, 2.00% and (ii) in the case of any such prepayment made at any time after August 30, 2013, 1%. On October 29, 2010, the Company drew $20.0 million from the term loan facility in connection with its acquisition of Core, and it subsequently drew the remaining $30.0 million on or before November 29, 2010. As of December 31, 2010, the term loan facility had an outstanding balance of 50.0 million.
81
Table of Contents
Term Debt Facilities
As of December 31, 2010, the Company had one term debt facility, an $75.5 million facility with Wachovia Capital Markets, LLC (“Wachovia”).
In connection with the Wachovia credit facility, the Company formed a wholly owned subsidiary, NewStar CP Funding, LLC, a single-purpose bankruptcy-remote entity, to purchase or hold loans and investments. NewStar must comply with various covenants, the breach of which could result in a termination event. These covenants include, but are not limited to, failure to service debt obligations, and failure to meet tangible net worth covenants and overcollateralization tests. At December 31, 2010, NewStar was in compliance with all such covenants. This credit facility is scheduled to mature on July 15, 2012. Interest on this facility accrues at a variable rate per annum, which was 4.01% at December 31, 2010. As of December 31, 2010, unamortized deferred financing fees were $1.2 million and the outstanding balance was $70.6 million. Wachovia completed a merger with Wells Fargo on December 31, 2008, but this merger did not impact the terms of the Company’s agreement.
The Company had a $250 million term debt financing agreement with Deutsche Bank AG, New York Branch. The Company paid off all outstanding borrowings and retired this facility with the proceeds received from the term debt securitization completed on January 7, 2010, described below.
Term Debt Securitizations
In August 2005 the Company completed a term debt transaction. In conjunction with this transaction the Company established a separate single-purpose bankruptcy-remote subsidiary, NewStar Trust 2005-1 (the “2005 CLO Trust”) and contributed $375 million in loans and investments (including unfunded commitments), or portions thereof, to the 2005 CLO Trust. The Company remains the servicer of the loans and investments. Simultaneously with the initial contributions, the 2005 CLO Trust issued $343.4 million of notes to institutional investors and issued $31.6 million of trust certificates of which the Company retained 100%. At December 31, 2010, the $220.4 million of outstanding notes were collateralized by the specific loans and investments, principal collections account cash and principal payment receivables totaling $251.9 million. At December 31, 2010, deferred financing fees were $0.9 million. The 2005 CLO Trust permitted reinvestment of collateral principal repayments for a three-year period which ended in October 2008. During 2010, the Company repurchased $4.6 million of the 2005 CLO Trust’s Class D notes. During 2009, the Company repurchased $1.4 million of the 2005 CLO Trust’s Class D notes and $1.2 million of the Class E notes. During 2008, the Company repurchased $5.8 million of the 2005 CLO Trust’s Class E notes. During 2007, the Company repurchased $5.0 million of the 2005 CLO Trust’s Class E notes. During 2009, Moody’s downgraded all of the notes of the 2005 CLO Trust. As a result of the downgrades, amortization of the 2005 CLO Trust changed from pro rata to sequential, resulting in scheduled principal payments made in order of the notes seniority until all available funds are exhausted for each payment. During the second quarter of 2010, Standard and Poor’s downgraded all of the notes of the 2005 CLO Trust. During the third quarter of 2010, Fitch affirmed its ratings of the Class A-1 notes, the Class A-2 notes and the Class B notes, and downgraded the Class C notes, the Class D notes and the Class E notes. The downgrades during 2010 did not have any material consequence as the amortization of the 2005 CLO Trust changed from pro rata to sequential after the Moody’s downgrade in 2009. The Company receives a loan collateral management fee and excess interest spread.
The Company expects to receive a principal distribution when the term debt is retired. The most recent quarterly report dated January 13, 2011 identified $43.4 million of certain loan collateral in the 2005 CLO Trust as delinquent or charged-off under the terms of the trust indenture. As a result, the excess interest spread from the 2005 CLO Trust will be redirected and combined with recoveries and will be used to repay the outstanding notes until note redemptions equal the underlying non-accrual loan balances or until the Company purchases such loans. As of the most recent quarterly report, the amount redirected was $12.6 million. The Company may have additional defaults in the 2005-1 CLO Trust in the future. If the Company does not elect to remove any future
82
Table of Contents
defaulted loans, it would not expect to receive excess interest spread payments until the undistributed cash plus any recoveries equal the outstanding balances of defaulted loan collateral.
| Notes originally issued |
Outstanding balance December 31, 2010 |
Interest rate |
Original maturity |
Ratings (S&P/Moody’s/ Fitch)(1) |
||||||||||||||||
| ($ in thousands) | ||||||||||||||||||||
| 2005 CLO Trust: |
||||||||||||||||||||
| Class A-1 |
$ | 156,000 | $ | 87,374 | Libor + 0.28 | % | July 25, 2018 | AA+/Aa2/AAA | ||||||||||||
| Class A-2 |
80,477 | 44,603 | Libor + 0.30 | % | July 25, 2018 | AA+/Aa2/AAA | ||||||||||||||
| Class B |
18,750 | 18,683 | Libor + 0.50 | % | July 25, 2018 | A+/A2/AA | ||||||||||||||
| Class C |
39,375 | 39,233 | Libor + 0.85 | % | July 25, 2018 | B+/Ba1/BB | ||||||||||||||
| Class D |
24,375 | 18,224 | Libor + 1.50 | % | July 25, 2018 | CCC-/B1/CCC | ||||||||||||||
| Class E |
24,375 | 12,279 | Libor + 4.75 | % | July 25, 2018 | CCC-/Caa2/CC | ||||||||||||||
| $ | 343,352 | $ | 220,396 | |||||||||||||||||
| (1) | The ratings, initially given in August 2005, are unaudited and are subject to change from time to time. Fitch affirmed its ratings on February 24, 2009 and downgraded the Class D notes and the Class E notes. The Fitch downgrade did not have an impact on the 2005 CLO Trust. During the first quarter of 2009, Moody’s downgraded the Class C notes, the Class D notes and the Class E notes to the ratings shown above. During the third quarter of 2009, Moody’s downgraded the Class A-1 notes, the Class A-2 notes and the Class B notes to the ratings shown above. During the second quarter of 2010, Standard and Poor’s downgraded all of the notes to the ratings shown above. During the third quarter of 2010, Fitch downgraded the Class C notes, the Class D notes and the Class E notes to the ratings shown above. (source: Bloomberg Finance L.P.). |
In June 2006 the Company completed a term debt transaction. In conjunction with this transaction the Company established a separate single-purpose bankruptcy remote subsidiary, NewStar Commercial Loan Trust 2006-1 (the “2006 CLO Trust”) and contributed $500 million in loans and investments (including unfunded commitments), or portions thereof, to the 2006 CLO Trust. The Company remains the servicer of the loans. Simultaneously with the initial contributions, the 2006 CLO Trust issued $456.3 million of notes to institutional investors. The Company retained $43.8 million, comprising 100% of the 2006 Trust’s trust certificates. At December 31, 2010, the $392.6 million of outstanding drawn notes were collateralized by the specific loans and investments, principal collection account cash and principal payment receivables totaling $436.3 million. At December 31, 2010, deferred financing fees were $2.7 million. The 2006 CLO Trust permits reinvestment of collateral principal repayments for a five-year period ending in June 2011. Should the Company determine that reinvestment of collateral principal repayments are impractical in light of market conditions or if collateral principal repayments are not reinvested within a prescribed timeframe, such funds may be used to repay the outstanding notes. During 2010, the Company repurchased $3.0 million of the 2006 CLO Trust’s Class D notes and $3.0 million of the 2006 CLO Trust’s Class E notes. During 2009, the Company repurchased $6.5 million of the 2006 CLO Trust’s Class D notes and $1.8 million of the 2006 CLO Trust’s Class E notes. During 2008, the Company repurchased $3.3 million of the 2006 CLO Trust’s Class D and $2.5 million of the 2006 CLO Trust’s Class E notes, respectively. During 2009, Moody’s downgraded all of the notes of the 2006 CLO Trust. As a result of the downgrade, amortization of the 2006 CLO Trust changed from pro rata to sequential, resulting in future scheduled principal payments made in order of the notes seniority until all available funds are exhausted for each payment. During the second quarter of 2010, Standard and Poor’s downgraded the Class A-1 notes, the Class A-2 notes, the Class C notes, the Class D notes and the Class E notes of the 2006 CLO Trust. The downgrade did not have any material consequence as the amortization of the 2006 CLO Trust changed from pro rata to sequential after the Moody’s downgrade in 2009. The Company receives a loan collateral management fee and excess interest spread.
The Company expects to receive a principal distribution when the term debt is retired. The most recent quarterly report dated December 13, 2010 identified $37.6 million of certain loan collateral in the 2006 CLO
83
Table of Contents
Trust as delinquent or charged-off under the terms of the trust indenture. As a result, the excess interest spread from the 2006 CLO Trust will be redirected and combined with recoveries and will be used to repay the outstanding notes until note redemptions equal the underlying non-accrual loan balances or until the Company purchases such loans. As of the most recent quarterly report, the amount redirected was $21.6 million. The Company may have additional defaults in the 2006-1 CLO Trust in the future. If the Company does not elect to remove any future defaulted loans, it would not expect to receive excess interest spread payments until the undistributed cash plus any recoveries equal the outstanding balances of defaulted loan collateral.
| Notes originally issued |
Outstanding balance December 31, 2010 |
Interest rate |
Original maturity |
Ratings (S&P/Moody’s/ Fitch)(1) |
||||||||||||||||
| ($ in thousands) | ||||||||||||||||||||
| 2006 CLO Trust |
||||||||||||||||||||
| Class A-1 |
$ | 320,000 | $ | 298,881 | Libor +0.27 | % | March 30, 2022 | AA+/Aa2/AAA | ||||||||||||
| Class A-2 |
40,000 | 17,458 | Libor +0.28 | % | March 30, 2022 | AA+/Aa2/AAA | ||||||||||||||
| Class B |
22,500 | 22,500 | Libor +0.38 | % | March 30, 2022 | AA/A3/AA | ||||||||||||||
| Class C |
35,000 | 35,000 | Libor +0.68 | % | March 30, 2022 | BBB+/Ba1/A | ||||||||||||||
| Class D |
25,000 | 12,250 | Libor +1.35 | % | March 30, 2022 | CCC+/B1/BBB | ||||||||||||||
| Class E |
13,750 | 6,500 | Libor +1.75 | % | March 30, 2022 | CCC-/B2/BB | ||||||||||||||
| $ | 456,250 | $ | 392,589 | |||||||||||||||||
| (1) | These ratings, initially given in June 2006, are unaudited and are subject to change from time to time. Fitch affirmed its ratings on February 24, 2009. During the first quarter of 2009, Moody’s downgraded the Class C notes, the Class D notes and the Class E notes to the ratings shown above. During the third quarter of 2009, Moody’s downgraded the Class A-1 notes, the Class A-2 notes and the Class B notes to the ratings shown above. During the second quarter of 2010, Standard and Poor’s downgraded the Class A-1 notes, the Class A-2 notes, the Class C notes, the Class D notes and the Class E notes to the ratings shown above. (source: Bloomberg Finance L.P.). |
In June 2007 the Company completed a term debt transaction. In conjunction with this transaction the Company established a separate single-purpose bankruptcy-remote subsidiary, NewStar Commercial Loan Trust 2007-1 (the “2007-1 CLO Trust”) and contributed $600 million in loans and investments (including unfunded commitments), or portions thereof, to the 2007-1 CLO Trust. The Company remains the servicer of the loans. Simultaneously with the initial contributions, the 2007-1 CLO Trust issued $546.0 million of notes to institutional investors. The Company retained $54.0 million, comprising 100% of the 2007-1 CLO Trust’s trust certificates. At December 31, 2010, the $445.8 million of outstanding drawn notes were collateralized by the specific loans and investments, principal collection account cash and principal payment receivables totaling $499.8 million. At December 31, 2010, deferred financing fees were $3.8 million. The 2007-1 CLO Trust permits reinvestment of collateral principal repayments for a six-year period ending in May 2013. Should the Company determine that reinvestment of collateral principal repayments are impractical in light of market conditions or if collateral principal repayments are not reinvested within a prescribed timeframe, such funds may be used to repay the outstanding notes. During 2010, the Company repurchased $5.0 million of the 2007-1 CLO Trust’s Class D notes. During 2009, the Company repurchased $1.0 million of the 2007-1 CLO Trust’s Class D notes. During 2009, Moody’s downgraded all of the notes of the 2007 CLO Trust. As a result of the downgrade, amortization of the 2007 CLO Trust changed from pro rata to sequential, resulting in future scheduled principal payments made in order of the notes seniority until all available funds are exhausted for each payment. During the second quarter of 2010, Standard and Poor’s downgraded the Class A-1 notes, the Class A-2 notes, the Class C notes and the Class D notes of the 2007 CLO Trust. The downgrade did not have any material consequence as the amortization of the 2007 CLO Trust changed from pro rata to sequential after the Moody’s downgrade in 2009. The Company receives a loan collateral management fee and excess interest spread.
84
Table of Contents
The Company expects to receive a principal distribution when the term debt is retired. If loan collateral in the 2007 CLO Trust is in default under the terms of the indenture, the excess interest spread from the 2007 CLO Trust could not be distributed until the undistributed cash plus recoveries equals the outstanding balance of the defaulted loan or if the Company elected to remove the defaulted collateral. The Company may have future defaults in the 2007-1 CLO Trust in the future. If the Company does not elect to remove any future defaulted loans, it would not expect to receive excess interest spread payments until the undistributed cash plus any recoveries equal the outstanding balances of any potential defaulted loan collateral. During 2010, the Company elected to purchase $38.8 million of defaulted collateral from the 2007-1 CLO to reduce the amount of excess interest spread that otherwise would have been required to be redirected.
| Notes originally issued |
Outstanding balance December 31, 2010 |
Interest rate |
Original maturity |
Ratings (S&P/Moody’s/ Fitch)(1) |
||||||||||||||||
| ($ in thousands) | ||||||||||||||||||||
| 2007-1 CLO Trust |
||||||||||||||||||||
| Class A-1 |
$ | 336,500 | $ | 318,587 | Libor +0.24 | % | September 30, 2022 | AA+/Aa2/AAA | ||||||||||||
| Class A-2 |
100,000 | 23,700 | Libor +0.26 | % | September 30, 2022 | AA+/Aa2/AAA | ||||||||||||||
| Class B |
24,000 | 24,000 | Libor +0.55 | % | September 30, 2022 | AA/A2/AA | ||||||||||||||
| Class C |
58,500 | 58,500 | Libor +1.30 | % | September 30, 2022 | BBB+/Ba1/A | ||||||||||||||
| Class D |
27,000 | 21,000 | Libor +2.30 | % | September 30, 2022 | CCC+/Ba3/BBB+ | ||||||||||||||
| $ | 546,000 | $ | 445,787 | |||||||||||||||||
| (1) | These ratings, initially given in June 2007, are unaudited and are subject to change from time to time. Fitch affirmed its ratings on February 24, 2009. During the first quarter of 2009, Moody’s downgraded the Class C notes and the Class D notes to the ratings shown above. During the third quarter of 2009, Moody’s downgraded the Class A-1 notes, the Class A-2 notes and the Class B notes to the ratings shown above. During the second quarter of 2010, Standard and Poor’s downgraded the Class A-1 notes, the Class A-2 notes, the Class C notes, and the Class D notes to the ratings shown above. (source: Bloomberg Finance L.P.). |
On January 7, 2010, the Company completed a term debt securitization. In conjunction with this transaction the Company established a separate single-purpose bankruptcy-remote subsidiary, NewStar Commercial Loan Trust 2009-1 (the “2009-1 CLO Trust”) and contributed $225 million in loans and investments (including unfunded commitments), or portions thereof, to the 2009-1 CLO Trust at close. The Company had the ability to contribute an additional $50 million of loan collateral by July 30, 2010 and contributed the full amount during the six months ended June 30, 2010. The Company remains the servicer of the loans. Simultaneously with the initial contributions, the 2009-1 CLO Trust issued $190.5 million of notes to institutional investors. The Company retained all of the Class C and subordinated notes, which totaled approximately $87.9 million, representing 32% of the value of the collateral pool. At December 31, 2010, the $99.5 million of outstanding notes were collateralized by the specific loans and investments, principal collection account cash and principal payment receivables totaling $187.4 million. At December 31, 2010, deferred financing fees were $2.3 million. The 2009-1 CLO Trust is a static pool of loans that does not permit for reinvestment of collateral principal repayments. Proceeds from this term debt securitization were used to repay all outstanding borrowings under our term debt facility with Deutsche Bank AG, New York Branch and certain advances under our credit facility with Citicorp North America, Inc. The 2009-1 CLO is callable on the distribution date in July 2011.
85
Table of Contents
| Notes originally issued |
Outstanding balance December 31, 2010 |
Interest rate |
Original maturity |
Ratings (Moody’s) (1) |
||||||||||||||||
| ($ in thousands) | ||||||||||||||||||||
| 2009-1 CLO Trust |
||||||||||||||||||||
| Class A |
$ | 148,500 | $ | 59,930 | Libor +3.75 | % | July 30, 2018 | Aaa | ||||||||||||
| Class B |
42,000 | 39,542 | Libor +5.00 | %(2) | July 30, 2018 | A2 | ||||||||||||||
| $ | 190,500 | $ | 99,472 | |||||||||||||||||
| (1) | These ratings, initially given in January 2010, are unaudited and are subject to change from time to time. |
| (2) | The Class B notes carry a Libor +5.00% coupon rate but were priced at a 91.85% discount to yield Libor +7.50% on a par amount of $42.0 million. |
Debt Maturities
The contractual obligations under credit facilities and term debt as of December 31, 2010 were as follows:
| Credit facilities |
Term debt(1) | Total | ||||||||||
| ($ in thousands) | ||||||||||||
| 2011 |
$ | 70,250 | $ | — | $ | 70,250 | ||||||
| 2012 |
— | 70,624 | 70,624 | |||||||||
| 2013 |
38,252 | — | 38,252 | |||||||||
| 2014 |
— | 50,000 | 50,000 | |||||||||
| 2015 |
— | — | — | |||||||||
| Thereafter |
— | 1,158,244 | 1,158,244 | |||||||||
| Total |
$ | 108,502 | $ | 1,278,868 | $ | 1,387,370 | ||||||
| (1) | Maturities for term debt are based on contractual maturity dates. Actual maturities may occur earlier. |
Note 10. Commitments
The Company has non-cancelable operating leases for office space and office equipment and furniture. These leases expire over the next five years and contain provisions for certain annual rental escalations. Future minimum lease payments under non-cancelable operating leases as of December 31, 2010 were as follows:
| ($ in thousands) | ||||
| 2011 |
$ | 1,243 | ||
| 2012 |
855 | |||
| 2013 |
145 | |||
| 2014 |
— | |||
| 2015 |
— | |||
| Thereafter |
— | |||
Rent expense was $1.7 million, $2.5 million and $2.6 million for the years ended December 31, 2010, 2009 and 2008, respectively.
Early in 2005 the Company entered into a sale lease-back transaction for a significant portion of its office furniture and selected equipment. The rents on this transaction are included in the above amounts.
86
Table of Contents
Note 11. Stockholders’ Equity
Stockholders’ Equity
As of December 31, 2010 and 2009, the Company’s authorized capital consists of preferred and common stock and the following was authorized and outstanding:
| December 31, 2010 | December 31, 2009 | |||||||||||||||
| Shares authorized |
Shares outstanding |
Shares authorized |
Shares outstanding |
|||||||||||||
| (In thousands) | ||||||||||||||||
| Preferred stock |
5,000 | — | 5,000 | — | ||||||||||||
| Common stock |
145,000 | 50,563 | 145,000 | 49,995 | ||||||||||||
Preferred Stock
Upon completion of the Company’s initial public offering on December 13, 2006, the Company’s authorized capital stock included 5,000,000 shares of preferred stock with a par value of $0.01 per share. As of December 31, 2010, all of the shares remained undesignated.
Common Stock
In connection with the Company’s initial public offering on December 13, 2006, the Company issued and sold 12,000,000 shares of its common stock. On December 19, 2006, the underwriters of the initial public offering purchased an additional 1,800,000 shares of the Company’s common stock.
On November 12, 2007, the Company entered into a definitive agreement with institutional investors to issue 12.5 million shares of the Company’s common stock in a private placement at a price per share of $10.00. The gross proceeds from the offering, which closed in two tranches, were $125 million. The first tranche of 7.25 million shares closed on November 29, 2007. The second tranche of 5.25 million shares was subject to the Company obtaining stockholder approval, and was approved at a special meeting of stockholders held on January 15, 2008. The second tranche closed on January 18, 2008.
In connection with the private placement, the Company entered into a Registration Rights Agreement with the institutional investors, whereby the Company agreed to register common stock as defined in the agreement. The Company registered the stock on Form S-3 on May 1, 2008, and the SEC deemed the registration effective on May 8, 2008.
On January 25, 2010, the Company announced that its Board of Directors had authorized the repurchase of up to $10 million of the Company’s common stock from time to time on the open market or in privately negotiated transactions. On December 3, 2010, the Company had repurchased the entire $10 million allotment of its stock. The timing and amount of any shares purchased were determined by management based on its evaluation of market condition and other factors and required use of cash. Upon completion of the stock repurchase program, the Company had repurchased 1,372,300 shares of its common stock under the program at a weighted average price per share of $7.26.
Restricted Stock
In connection with the Company’s initial public offering, 1,631,160 shares of restricted stock were issued to certain employees of the Company. The shares of restricted stock have a purchase price equal to the pricing of the Company’s initial public offering. On May 14, 2008, the Company issued 30,000 shares of restricted stock to certain members of its Board of Directors. The shares of restricted stock had a fair value of $6.40 per share, which is equal to the closing price of the Company’s common stock on the date of issuance. The shares of restricted stock have a graded vesting schedule over a service period of up to five years.
87
Table of Contents
On February 20, 2009, the Company issued 704,571 shares of restricted stock to certain employees of the Company. The shares of restricted stock had a fair value of $1.64 per share, which is equal to the closing price of the Company’s common stock on the date of issuance. The shares of restricted stock vest in two equal installments on each of the first and second anniversary of the date of grant.
On May 13, 2009, the Company issued 35,000 shares of restricted stock to certain members of its Board of Directors. The shares of restricted stock had a fair value of $2.20 per share, which is equal to the closing price of the Company’s common stock on the date of issuance. The shares of restricted stock have a graded vesting schedule over a service period of up to five years.
On December 11, 2009, the Company issued 915,000 shares of restricted stock to certain employees of the Company. The shares of restricted stock had a fair value of $2.84 per share, which is equal to the closing price of the Company’s common stock on the date of issuance. The shares of restricted stock vest in their entirety on the third anniversary of the date of grant.
On May 12, 2010, the Company issued 35,000 shares of restricted stock to certain members of its Board of Directors. The shares of restricted stock had a fair value of $8.28 per share, which is equal to the closing price of the Company’s common stock on the date of issuance. The shares of restricted stock have a graded vesting schedule over a service period of up to five years.
On May 19, 2010, the Company issued 2,000,000 shares of restricted stock to the Company’s Executive Officers and other members of the senior management team. The shares of restricted stock had a fair value of $5.82 per share. The shares of restricted stock vest on the third anniversary of the date of grant if the employee has continued to be employed by the Company on that date and either: (i) the volume weighted average price (“VWAP”) of the Company’s common stock is equal to or greater than $7.88 per share during the period beginning on the first day following the release of the Company’s fourth quarter earnings results for the 2012 fiscal year and ending on May 19, 2013; or (ii) the VWAP of the Company’s common stock is less than $7.88 per share but greater than or equal to $7.00 per share at March 31, 2013 and the Company’s book value per share is greater than or equal to $10.37.
On November 1, 2010 the Company issued 110,000 shares of restricted stock to certain employees of the Company. The shares of restricted stock had a fair value of $7.52 per share, which is equal to the closing price of the Company’s common stock on the date of issuance. The shares of restricted stock vest in their entirety on the third anniversary of the date of grant.
On December 1, 2010 the Company issued 50,000 shares of restricted stock to certain employees of the Company. The shares of restricted stock had a fair value of $9.89 per share, which is equal to the closing price of the Company’s common stock on the date of issuance. The shares of restricted stock vest in their entirety on the third anniversary of the date of grant.
Restricted stock activity for 2010 and 2009 was as follows:
| Shares | Grant-date fair value |
|||||||
| ($ in thousands) | ||||||||
| Non-vested as of January 1, 2009 |
897,957 | $ | 14,968 | |||||
| Granted |
1,658,321 | 3,842 | ||||||
| Vested |
(318,824 | ) | (4,417 | ) | ||||
| Forfeited |
(39,913 | ) | (396 | ) | ||||
| Non-vested as of December 31, 2009 |
2,197,541 | 13,997 | ||||||
| Granted |
2,195,000 | 17,371 | ||||||
| Vested |
(709,376 | ) | (5,858 | ) | ||||
| Forfeited |
(36,024 | ) | (113 | ) | ||||
| Non-vested as of December 31, 2010 |
3,647,141 | $ | 25,397 | |||||
88
Table of Contents
The Company’s compensation expense related to its restricted stock was $6.0 million, $4.4 million and $5.9 million for 2010, 2009 and 2008, respectively. The unrecognized compensation cost of $13.4 million at December 31, 2010 is expected to be recognized over approximately the next three years.
Stock Options
Under the Company’s 2006 Incentive Plan, the Company’s compensation committee may grant options to purchase shares of common stock. Stock options may either be incentive stock options (“ISOs”) or non-qualified stock options. ISOs may only be granted to officers and employees. The compensation committee will, with regard to each stock option, determine the number of shares subject to the stock option, the manner and time of exercise, vesting, and the exercise price, which will not be less than 100% of the fair market value of the common stock on the date of the grant. The shares of common stock issuable upon exercise of options or other awards or upon grant of any other award may be either previously authorized but unissued shares or treasury shares.
On December 13, 2006, in connection with the Company’s initial public offering, stock options exercisable for an aggregate of 3,287,365 shares of common stock were issued to certain employees of the Company. Stock options exercisable for an aggregate of 2,613,615 shares of common stock were issued at an exercise price equal to the pricing of the Company’s initial public offering and were 60% vested at the IPO with the remaining 40% to vest ratably over a four-year service period. The remaining options for 673,750 shares of common stock were issued at an exercise price equal to the pricing of the Company’s initial public offering and vest ratably over a four-year service period.
On March 18, 2009 the Company completed an option exchange program with its senior management, including the Company’s principal executive officer, principal financial officer and other named executive officers whereby in exchange for a grant of stock options priced at fair market value on March 18, 2009, each executive agreed to surrender to the Company for cancellation the option award granted to him on December 13, 2006 and to abide by the terms of a lock-up agreement. The lock-up agreement requires 50% of the net proceeds from any exercise or partial exercise of the option received as part of the March 2009 option exchange program be held by the Company until the one-year anniversary of the time when the executive ceases to be employed by the Company. During that time, such portion of the proceeds from the option exercise is subject to forfeiture if the senior executive violates the restrictive covenants in his employment agreement with the Company. The option exchange program resulted in the forfeiture of 1,985,262 options to the Company in exchange for 2,725,000 new stock option grants. The options granted vest in three equal installments on each of the first three anniversaries of the March 18, 2009 grant date and have a seven-year life.
On May 12, 2010, stock options exercisable for an aggregate of 629,105 shares of common stock were issued to certain employees of the Company. The stock options have an exercise price of $8.28, which is equal to the closing price of the Company’s common stock on the date of issuance. The options granted vest in three equal installments on each of the first three anniversaries of the May 12, 2010 grant date and have a seven-year life.
On November 1, 2010, stock options exercisable for an aggregate of 60,000 shares of common stock were issued to certain employees of the Company. The stock options have an exercise price of $7.52, which is equal to the closing price of the Company’s common stock on the date of issuance. The options granted vest in two equal installments on each of the first two anniversaries of the November 1, 2010 grant date and have a seven-year life.
On December 1, 2010, stock options exercisable for an aggregate of 50,000 shares of common stock were issued to certain employees of the Company. The stock options have an exercise price of $8.74, which is equal to the closing price of the Company’s common stock on the date of issuance. The options granted vest in two equal installments on each of the first two anniversaries of the December 1, 2010 grant date and have a seven-year life.
89
Table of Contents
Stock option activity for 2010 and 2009 was as follows:
| Options | Weighted average exercise price |
Weighted average remaining contractual life (in years) |
||||||||||
| Outstanding as of January 1, 2009 |
4,268,471 | 14.23 | 6 | |||||||||
| Granted |
3,923,750 | 2.76 | 6 | |||||||||
| Exercised |
— | — | — | |||||||||
| Forfeited |
(2,834,558 | ) | 16.05 | 7 | ||||||||
| Outstanding as of December 31, 2009 |
5,357,663 | 4.87 | 6 | |||||||||
| Granted |
739,105 | 8.25 | 6 | |||||||||
| Exercised |
(15,866 | ) | 2.37 | 5 | ||||||||
| Forfeited |
(146,166 | ) | 11.41 | 6 | ||||||||
| Outstanding as of December 31, 2010 |
5,934,736 | 5.14 | 5 | |||||||||
| Vested or expected to vest as of December 31, 2010 |
2,354,106 | 6.44 | 5 | |||||||||
| Exercisable as of December 31, 2010 |
2,354,106 | 6.44 | 5 | |||||||||
For the years ended December 31, 2010 and 2009, the weighted average grant date fair value of options granted was $4.56 and $1.45, respectively. As of December 31, 2010, the total unrecognized compensation cost related to nonvested options granted was $3.0 million. This cost is expected to be recognized over a weighted average period of two years. During the years ended December 31, 2010, 2009 and 2008, the Company recognized compensation expense of $3.4 million, $3.4 million and $2.6 million, respectively related to its stock options.
We use the Black-Scholes weighted average option-pricing model to estimate the fair value of each stock option grant on its grant date. The weighted average assumptions used in this model for the years ended December 31, 2010 and 2009 were as follows:
| The year ended December 31, |
||||||||
| 2010 | 2009 | |||||||
| Expected volatility (1) |
68.81 | % | 64.00 | % | ||||
| Expected dividends (2) |
— | — | ||||||
| Risk-free interest rate (3) |
2.19 | 1.69 | ||||||
| Expected life (4) |
4.47 | 4.50 | ||||||
| 1. | The expected volatility is based on a study of the Company’s peers. |
| 2. | We do not expect to pay any dividends during the life of these stock options. |
| 3. | The risk-free interest rate is the zero coupon, U.S. Treasury rate at the time of the grant based on the expected life of the options. |
| 4. | The expected life is determined using the simplified method. |
90
Table of Contents
Note 12. Income (Loss) Per Share
The computations of basic and diluted income (loss) per share for the periods ended December 31, 2010, 2009 and 2008 are as follows:
| December 31, | ||||||||||||
| 2010 | 2009 | 2008 | ||||||||||
| (In thousands) | ||||||||||||
| Numerator: |
||||||||||||
| Net income (loss) |
$ | 10,232 | $ | (44,260 | ) | $ | 22,398 | |||||
| Denominator: |
||||||||||||
| Denominator for basic income (loss) per common share |
49,449 | 49,119 | 48,340 | |||||||||
| Denominator: |
||||||||||||
| Denominator for diluted income (loss) per common share |
49,449 | 49,119 | 48,340 | |||||||||
| Potentially dilutive securities—options |
1,099 | — | — | |||||||||
| Potentially dilutive securities—restricted stock |
2,000 | — | — | |||||||||
| Potentially dilutive securities—warrants |
— | — | — | |||||||||
| Total weighted average diluted shares |
52,548 | 49,119 | 48,340 | |||||||||
Warrants to purchase common stock totaling 1,452,656, were not included in the computation of diluted earnings per share for 2010 due to the fact that the results would be anti-dilutive.
Weighted average stock options of 5,390,085, and 1,452,656 warrants to purchase common stock were not included in the computation of diluted earnings per share for the year ended December 31, 2009 due to the fact that the results would be anti-dilutive.
Weighted average stock options of 4,157,047, and 1,452,656 warrants to purchase common stock were not included in the computation of diluted earnings per share for the year ended December 31, 2008 due to the fact that the results would be anti-dilutive.
Note 13. Financial Instruments with Off-Balance Sheet Risk
The Company is party to financial instruments with off-balance sheet risk in the normal course of business to meet the financing needs of its customers. These financial instruments include unused lines of credit, standby letters of credit and interest rate risk mitigation products. The instruments involve, to varying degrees, elements of credit and interest rate risk in excess of the amount recognized in the consolidated balance sheet. The contract or notional amounts of those instruments reflect the extent of involvement the Company has in particular classes of financial instruments.
The Company’s exposure to credit loss in the event of nonperformance by the other party to the financial instrument for standby letters of credit is represented by the contractual amount of those instruments. The Company uses the same credit policies in making commitments and conditional obligations as it does for on-balance sheet instruments.
Unused lines of credit are commitments to lend to a customer if certain conditions have been met. These commitments generally have fixed expiration dates or other termination clauses and may require payment of a fee. Since certain commitments may expire without being drawn upon, the total commitment amounts do not necessarily represent future cash requirements. The Company evaluates each customer’s creditworthiness on a case-by-case basis. The amount of collateral obtained, if deemed necessary by the Company upon extension of credit, is based on factors that include management’s credit evaluation of the borrower, the borrower’s compliance with financial covenants and management’s discretion, among other evaluations. Due to their nature,
91
Table of Contents
the Company cannot know with certainty the aggregate amounts that will be required to fund the Company’s unused lines of credit. The aggregate amount of these unfunded commitments currently does not exceed our available funds but may exceed our available funds in the future.
At December 31, 2010, we had $270.8 million of unused lines of credit. Of these unused lines of credit, unfunded commitments related to revolving credit facilities were $239.2 million and unfunded commitments related to delayed draw term loans were $24.3 million. $7.3 million of the unused commitments are unavailable to the borrowers, which may be related to the borrowers’ inability to meet covenant obligations or other similar events.
Revolving credit facilities allow our borrowers to draw up to a specified amount subject to customary borrowing conditions. The unfunded revolving commitments of $239.2 million are further categorized as either contingent or unrestricted. Contingent commitments limit a borrower’s ability to access the revolver unless it meets an enumerated borrowing base covenant or other restrictions. At December 31, 2010, we categorized $136.3 million of the unfunded commitments related to revolving credit facilities as contingent. Unrestricted commitments represent commitments that are currently accessible, assuming the borrower is in compliance with certain customary loan terms and conditions. At December 31, 2010, we had $102.9 million of unfunded unrestricted revolving commitments.
During the three months ended December 31, 2010, revolver usage averaged approximately 33%, which is slightly lower than the average of 38% over the previous four quarters. Management’s experience indicates that borrowers typically do not seek to exercise their entire available line of credit at any point in time. During the three months and year ended December 31, 2010, revolving commitments increased $118.4 million and $52.9 million, respectively.
Delayed draw credit facilities allow our borrowers to draw predefined amounts of the approved loan commitment at contractually set times, subject to specific conditions, such as capital expenditures in corporate loans or for tenant improvements in commercial real estate loans. During the three months and year ended December 31, 2010, delayed draw credit facility commitments declined $32.1 million and $41.1 million, respectively.
Standby letters of credit are conditional commitments issued by the Company to guarantee the performance by a borrower to a third party. The credit risk involved in issuing letters of credit is essentially the same as that involved in extending loan facilities to borrowers.
Interest rate risk mitigation products are offered to enable customers to meet their financing and risk management objectives. Derivative financial instruments consist predominantly of interest rate swaps, interest rate caps and floors. The interest rate risks to the Company of these customer derivatives is mitigated by entering into similar derivatives having offsetting terms with other counterparties.
These interest rate risk mitigation products do not qualify for hedge accounting treatment. These interest rate swaps and caps contracts are recorded at fair value on the Company’s balance sheet in either “Other assets” or “Other liabilities”. Gains and losses on derivatives not designated as cash flow hedges, including any cash payments made or received are reported as gains or losses on derivatives in the consolidated statements of operations.
Financial instruments with off-balance sheet risk are summarized as follows:
| December 31, | ||||||||
| 2010 | 2009 | |||||||
| ($ in thousands) | ||||||||
| Unused lines of credit |
$ | 270,793 | $ | 230,838 | ||||
| Standby letters of credit |
8,737 | 18,771 | ||||||
| Interest rate mitigation products (notional) |
125,450 | 287,854 | ||||||
92
Table of Contents
At December 31, 2010, the Company’s Business Credit group had a $3.3 million potential off balance sheet commitment to another financial institution. In an event of default of a certain borrower, the Company would be obligated to reimburse the financial institution for this amount. The borrower paid off the loan on January 19, 2011, and the potential commitment was terminated.
Note 14. Income Taxes
The components of income tax expense (benefit) are as follows:
| December 31, | ||||||||||||
| 2010 | 2009 | 2008 | ||||||||||
| ($ in thousands) | ||||||||||||
| Current tax expense (benefit): |
||||||||||||
| Federal |
$ | (2,229 | ) | $ | 633 | $ | 24,841 | |||||
| State |
826 | 636 | 8,632 | |||||||||
| Total current |
(1,403 | ) | 1,269 | 33,473 | ||||||||
| Deferred tax expense (benefit): |
||||||||||||
| Federal |
8,269 | (20,924 | ) | (12,254 | ) | |||||||
| State |
265 | (4,964 | ) | (5,146 | ) | |||||||
| Change in valuation allowance |
(196 | ) | 266 | — | ||||||||
| Total deferred |
8,338 | (25,622 | ) | (17,400 | ) | |||||||
| Income tax expense (benefit) |
$ | 6,935 | $ | (24,353 | ) | $ | 16,073 | |||||
The Company’s effective tax rate for 2010 and 2009 reflects the impact of nondeductible compensation expenses incurred in connection with its initial public offering and the impact of a related discrete item resulting from vesting events in those respective periods.
The Company’s effective tax rate for 2008 reflects the impact of timing differences related to the recognition of losses on the residual interest in securitization, the impact of nondeductible compensation expenses incurred in connection with its initial public offering and the impact of a related discrete tax item.
On July 3, 2008, the Commonwealth of Massachusetts enacted a law that included reducing future tax rates on net income applicable to financial institutions. For tax years beginning on or after January 1, 2010, the tax rate dropped from the current rate of 10.5% to 10%, for tax years beginning on or after January 1, 2011 the rate drops to 9.5%, and to 9% for tax years beginning on or after January 1, 2012 and thereafter. Therefore, the company recorded additional income tax expense of approximately $0.4 million in the third quarter of 2008 to adjust the company’s net deferred tax assets down to the future realizable tax rates.
The effective tax rate differed from the statutory federal corporate rate of 35% as follows:
| December 31, | ||||||||||||
| 2010 | 2009 | 2008 | ||||||||||
| ($ in thousands) | ||||||||||||
| Federal statutory rate |
$ | 6,009 | $ | (24,015 | ) | $ | 13,465 | |||||
| State income taxes, net of federal tax benefit |
709 | (2,813 | ) | 2,266 | ||||||||
| Equity compensation |
341 | 2,407 | 1,568 | |||||||||
| Statutory rate change |
— | — | (390 | ) | ||||||||
| Other |
72 | (198 | ) | (836 | ) | |||||||
| State valuation allowance |
(196 | ) | 266 | — | ||||||||
| $ | 6,935 | $ | (24,353 | ) | $ | 16,073 | ||||||
93
Table of Contents
Deferred income taxes are recorded when revenues and expenses are recognized in different periods for financial statement and income tax purposes. As of December 31, 2010 and 2009, components of deferred tax assets and liabilities are as follows:
| December 31, | ||||||||
| 2010 | 2009 | |||||||
| ($ in thousands) | ||||||||
| Deferred tax asset: |
||||||||
| Allowance for credit losses |
$ | 34,051 | $ | 45,536 | ||||
| Capitalized startup costs |
146 | — | ||||||
| Other |
2,023 | 1,745 | ||||||
| Securities fair value adjustments |
300 | 318 | ||||||
| Equity compensation |
11,945 | 10,732 | ||||||
| Impairment |
240 | 237 | ||||||
| Mark-to-market loans |
811 | — | ||||||
| Accrued bonus |
3,091 | 1,989 | ||||||
| Income from non-performing assets |
3,112 | 3,703 | ||||||
| Other real estate owned |
120 | 928 | ||||||
| Gross deferred tax asset |
55,839 | 65,188 | ||||||
| Valuation allowance |
(70 | ) | (266 | ) | ||||
| Deferred tax liability: |
||||||||
| Prepaid expenses |
934 | 1,139 | ||||||
| Mark-to-market loans |
— | 4,662 | ||||||
| Deferred loan costs |
1,218 | 1,146 | ||||||
| Cancellation of term debt income |
3,505 | — | ||||||
| Gain on acquired loans |
2,019 | — | ||||||
| Other |
— | 1,526 | ||||||
| Gross deferred tax liability |
7,676 | 8,473 | ||||||
| Net deferred tax asset |
$ | 48,093 | $ | 56,449 | ||||
In assessing the realizability of deferred tax assets, management considers whether it is more likely than not that some portion or all of the deferred tax assets will not be realized. The ultimate realization of deferred tax assets is also dependent upon the generation of future taxable income during the periods in which those temporary differences become deductible.
As of December 31, 2010 and 2009, we had net deferred tax assets of $48.1 million and $56.4 million, respectively. In assessing the realizability of deferred tax assets, management considers whether it is more likely than not that some portion or all of the deferred tax assets will not be realized. The Company’s management considered all available evidence, both positive and negative, in determining the realizability of deferred tax assets at December 31, 2010. Management considered carryback availability, the scheduled reversals of deferred tax liabilities, projected future taxable income during the reversal periods, and tax planning strategies in making this assessment. Management also considered our recent history of taxable income, trends in our earnings and tax rate, positive financial ratios, and the impact of the downturn in the current economic environment (including the impact of credit on allowance and provision for loan losses; and the impact on funding levels) on the Company. Based upon its assessment, management believes that a valuation allowance of $0.1 million is necessary as of December 31, 2010. As of December 31, 2010, our deferred tax asset was primarily comprised of $34.1 million related to our allowance for credit losses and $11.9 million related to equity compensation.
Based upon carryback availability, the timing of reversals of deferred tax assets and liabilities including the impact of available carryback and carryforward periods, and projections for future taxable income over the
94
Table of Contents
periods in which the deferred tax assets are deductible, management believes it is more likely than not that the Company will realize the benefits of these deductible differences. The amount of the deferred tax asset considered realizable, however, could be reduced in the near term if estimates of future taxable income during the carryforward period are reduced.
At December 31, 2010 and 2009, the Company did not have any unrecognized tax benefits and there have been no material changes. The Company does not expect any significant changes within the next 12 months.
The Company files U.S. federal and state income tax returns. As of December 31, 2010, the Company’s tax returns for the years ended 2009, 2008, 2007 and 2006 remain subject to examination by the Internal Revenue Service and state tax authorities.
Note 15. Fair Value
ASC 820, Fair Value Measurements (“ASC 820”) establishes a three-level valuation hierarchy for disclosure of fair value measurements. The valuation hierarchy is based upon the transparency of inputs to the valuation of an asset or liability as of the measurement date. The three levels are defined as follows:
| • | Level 1 – inputs to the valuation methodology are quoted prices (unadjusted) for identical assets or liabilities in active markets. |
| • | Level 2 – inputs to the valuation methodology include quoted prices for similar assets and liabilities in active markets, and inputs that are observable for the asset or liability, either directly or indirectly, for substantially the full term of the financial instrument. |
| • | Level 3 – inputs to the valuation methodology are unobservable and significant to the fair value measurement. |
A financial instrument’s categorization within the valuation hierarchy is based upon the lowest level of input that is significant to the fair value measurement.
The following is a description of the valuation methodologies used for instruments measured at fair value, including the general classification of such instruments pursuant to the valuation hierarchy.
Investments in debt securities, available-for-sale
Investments in debt securities available-for-sale are recorded at fair value on a recurring basis. The fair value measurement of investments in debt securities is based on either broker quotes or by using internally developed financial models. For securities in less liquid markets where there is limited activity and little transparency around broker quotes used to value such securities, the Company classifies securities valued using broker quotes as level 3. If quoted prices are not available, then fair value is estimated by using internally developed financial models. These securities are not actively traded and require a private sale, and the valuation involves application of significant management judgment. Inputs into the model-based valuations can include changes in market indexes, selling prices of similar securities, management’s assumptions related to the credit rating of the security, prepayment assumptions and other factors such as credit loss assumptions and management’s assessment of the current market conditions. Such securities are classified as level 3, as the valuation models are based on significant inputs that are unobservable in the market.
Loans
The Company does not record loans at fair value on a recurring basis. However, from time to time, a loan is considered impaired and an allowance for loan losses is established. If it is probable that payment of interest and principal on a loan will not be made in accordance with the contractual terms of the loan agreement, then it is
95
Table of Contents
considered impaired. Once a loan is identified as individually impaired, management measures the amount of impairment. The fair value of impaired loans is estimated using one of several methods, including collateral value, market value of similar debt, enterprise value, liquidation value and discounted cash flows. Those impaired loans not requiring an allowance represent loans for which the fair value of the expected repayments or collateral equals or exceeds the recorded investments in such loans. Impaired loans where an allowance is established based on the fair value of collateral require classification in the fair value hierarchy. When fair value of the collateral is based on an observable market price or a current appraised value, the Company records the impaired loan as level 2. When an appraised value is not available or management determines the fair value of the collateral is further impaired below the appraised value and there is no observable market price, the Company records the impaired loan as level 3.
Loans held-for-sale
Loans held-for-sale are not recorded at fair value on a recurring basis and are carried at the lower of cost or market value. Fair values for loans held-for-sale are based on quoted prices, where available, or are determined by discounting estimated cash flows using model-based valuation techniques. Inputs into the model-based valuations can include changes in market indexes, selling prices of similar loans, management’s assumption related to credit rating of the loan, prepayment assumptions and other factors, such as credit loss assumptions. Where quoted prices are available in an active market, loans held-for-sale are classified as level 1. Level 1 loans include instruments where the fair value is based on a contracted selling price. Loans are classified as level 3 in instances where valuation models are based on significant inputs that are unobservable in the market.
Other real estate owned
The Company does not record other real estate owned at fair value on a recurring basis. The fair value of other real estate owned is estimated using one of several methods, including collateral value, market value of similar properties, liquidation value and discounted cash flows. When an appraised value is not available or management determines the fair value of the collateral is further impaired below the appraised value and there is no observable market price or inputs, the Company records the other real estate owned as level 3.
Fair value of derivative instruments
Derivatives are recorded at fair value on a recurring basis. Substantially all derivative instruments held or issued by the Company for risk management or customer-initiated activities are traded in over-the-counter markets where quoted market prices are not readily available. For those derivatives, the Company measures fair value using broker quotes or financial models that use primarily market observable inputs, such as yield curves and option volatilities, and include the value associated with the counterparty credit risk. The Company classifies derivative instruments held or issued for risk management or customer-initiated activities as level 2. Examples of level 2 derivatives are interest rate swaps and interest rate cap contracts.
The Company also holds a portfolio of warrants for generally non-marketable equity securities. These warrants are primarily from non-public companies obtained as part of the loan origination process. Warrants which contain a net exercise provision are required to be accounted for as derivatives and recorded at fair value. The fair value of the derivative warrant portfolio is reviewed quarterly and adjustments to the fair value are recorded in current earnings. Fair value is determined using internally developed valuation models. Where sufficient data exists, a market approach method is utilized to estimate the current value of the underlying company. The estimated fair value of the underlying securities for warrants requiring valuation at fair value were adjusted for discounts related to lack of liquidity. The Company classifies warrants accounted for as derivatives as level 3.
The following table presents recorded amounts of assets and liabilities measured at fair value on a recurring and nonrecurring basis as of December 31, 2010, by caption in the consolidated balance sheet and by valuation hierarchy (as described above).
96
Table of Contents
| Quoted Prices in Active Markets for Identical Assets (Level 1) |
Significant Other Observable Inputs (Level 2) |
Significant Unobservable Inputs (Level 3) |
Total Carrying Value in Consolidated Balance Sheet |
|||||||||||||
| ($ in thousands) | ||||||||||||||||
| Recurring Basis: |
||||||||||||||||
| Investments in debt securities, available-for-sale |
$ | — | $ | — | $ | 4,014 | $ | 4,014 | ||||||||
| Derivatives—interest rate contracts (assets) |
— | 863 | — | 863 | ||||||||||||
| Total assets recorded at fair value on a recurring basis |
$ | — | $ | 863 | $ | 4,014 | $ | 4,877 | ||||||||
| Derivatives—interest rate contracts (liabilities) |
$ | — | $ | 1,174 | $ | — | $ | 1,174 | ||||||||
| Nonrecurring Basis: |
||||||||||||||||
| Loans, net |
$ | — | $ | — | $ | 69,067 | $ | 69,067 | ||||||||
| Loans held-for-sale, net |
41,386 | — | — | 41,386 | ||||||||||||
| Other real estate owned |
— | — | 3,400 | 3,400 | ||||||||||||
| Total assets recorded at fair value on a nonrecurring basis |
$ | 41,386 | $ | — | $ | 72,467 | $ | 113,853 | ||||||||
At December 31, 2010, “Loans, net” measured at fair value on a nonrecurring basis consisted of impaired collateral-dependent commercial real estate loans. The fair values of these loans are based on third party appraisals of the underlying collateral value as well as the Company’s internal analysis. During 2010, the Company recorded $12.6 million of specific provision for credit losses related to “Loans, net” measured at fair value.
At December 31, 2010, “Loans held-for-sale, net” consisted of leveraged finance loans intended to be sold to the NCOF. The fair values of the loans are based on contractual selling prices.
At December 31, 2010, “Other real estate owned” consisted of one commercial real estate property.
The following table presents recorded amounts of assets and liabilities measured at fair value on a recurring and nonrecurring basis as of December 31, 2009, by caption in the consolidated balance sheet and by ASC 820 valuation hierarchy (as described above).
| Quoted Prices in Active Markets for Identical Assets (Level 1) |
Significant Other Observable Inputs (Level 2) |
Significant Unobservable Inputs (Level 3) |
Total Carrying Value in Consolidated Balance Sheet |
|||||||||||||
| ($ in thousands) | ||||||||||||||||
| Recurring Basis: |
||||||||||||||||
| Investments in debt securities, available-for-sale |
$ | — | $ | — | $ | 4,183 | $ | 4,183 | ||||||||
| Warrants |
— | — | 1 | 1 | ||||||||||||
| Derivatives—interest rate contracts (assets) |
— | 7,458 | — | 7,458 | ||||||||||||
| Total assets recorded at fair value on a recurring basis |
$ | — | $ | 7,458 | $ | 4,184 | $ | 11,642 | ||||||||
| Derivatives—interest rate contracts (liabilities) |
$ | — | $ | 7,853 | $ | — | $ | 7,853 | ||||||||
97
Table of Contents
| Quoted Prices in Active Markets for Identical Assets (Level 1) |
Significant Other Observable Inputs (Level 2) |
Significant Unobservable Inputs (Level 3) |
Total Carrying Value in Consolidated Balance Sheet |
|||||||||||||
| ($ in thousands) | ||||||||||||||||
| Nonrecurring Basis: |
||||||||||||||||
| Loans, net |
$ | — | $ | — | $ | 46,182 | $ | 46,182 | ||||||||
| Loans held-for-sale, net |
15,736 | — | — | 15,736 | ||||||||||||
| Other real estate owned |
— | — | 13,413 | 13,413 | ||||||||||||
| Total assets recorded at fair value on a nonrecurring basis |
$ | 15,736 | $ | — | $ | 59,595 | $ | 75,331 | ||||||||
At December 31, 2009, “Loans, net” measured at fair value on a nonrecurring basis consisted of impaired collateral-dependent commercial real estate loans. The fair values of these loans are based on third party appraisals of the underlying collateral value as well as the Company’s internal analysis. During 2009, the Company recorded $33.3 million of specific provision for credit losses related to “Loans, net” measured at fair value.
At December 31, 2009, “Loans held-for-sale, net” consisted of leveraged finance loans intended to be sold to the NCOF. The fair values of the loans are based on contractual selling prices.
At December 31, 2009, “Other real estate owned” consisted of two commercial real estate properties. During 2009, the Company recorded a loss of $3.9 million due to the decline in fair value of one of the commercial real estate properties.
Changes in level 3 recurring fair value measurements
The table below illustrates the change in balance sheet amounts during 2010 and 2009 (including the change in fair value), for financial instruments measured on a recurring basis and classified by the Company as level 3 in the valuation hierarchy. When a determination is made to classify a financial instrument as level 3, the determination is based upon the significance of the unobservable parameters to the overall fair value measurement. However, level 3 financial instruments typically include, in addition to the unobservable or level 3 components, observable components (that is, components that are actively quoted and can be validated to external sources); accordingly, the gains and losses in the table below include changes in fair value due in part to observable factors that are part of the valuation methodology. The Company did not transfer any financial instruments in or out of levels 1,2 or 3 during 2010.
For the year ended December 31, 2010:
| Investments in Debt Securities, Available-for-sale |
Warrants | |||||||
| ($ in thousands) | ||||||||
| Balance as of December 31, 2009 |
$ | 4,183 | $ | 1 | ||||
| Total gains or losses (realized/unrealized) |
||||||||
| Included in earnings |
— | (1 | ) | |||||
| Included in other comprehensive income |
(2 | ) | — | |||||
| Purchases, issuances or settlements |
(167 | ) | — | |||||
| Balance as of December 31, 2010 |
$ | 4,014 | $ | — | ||||
98
Table of Contents
For the year ended December 31, 2009:
| Investments in Debt Securities, Available-for-sale |
Warrants | |||||||
| ($ in thousands) | ||||||||
| Balance as of December 31, 2008 |
$ | 3,025 | $ | 2,500 | ||||
| Total gains or losses (realized/unrealized) |
||||||||
| Included in earnings |
— | (500 | ) | |||||
| Included in other comprehensive income |
1,362 | — | ||||||
| Purchases, issuances or settlements |
(204 | ) | (1,999 | ) | ||||
| Balance as of December 31, 2009 |
$ | 4,183 | $ | 1 | ||||
The following table presents the carrying amounts and estimated fair values of the Company’s financial instruments at December 31, 2010 and 2009. The fair value of a financial instrument is the amount at which the instrument could be exchanged in a current transaction between willing parties.
| December 31, 2010 | December 31, 2009 | |||||||||||||||
| Carrying amount |
Fair value | Carrying amount |
Fair value | |||||||||||||
| ($ in thousands) | ||||||||||||||||
| Financial assets: |
||||||||||||||||
| Cash and cash equivalents |
$ | 54,365 | $ | 54,365 | $ | 39,848 | $ | 39,848 | ||||||||
| Restricted cash |
178,364 | 178,364 | 136,884 | 136,884 | ||||||||||||
| Loans held-for-sale |
41,386 | 41,386 | 15,736 | 15,736 | ||||||||||||
| Loans, net |
1,590,331 | 1,554,509 | 1,878,978 | 1,828,702 | ||||||||||||
| Investments in debt securities available-for-sale |
4,014 | 4,014 | 4,183 | 4,183 | ||||||||||||
| Derivative instruments |
863 | 863 | 7,458 | 7,458 | ||||||||||||
| Other assets |
7,546 | 7,546 | — | — | ||||||||||||
| Financial liabilities: |
||||||||||||||||
| Credit facilities |
$ | 108,502 | $ | 108,502 | $ | 91,890 | $ | 91,890 | ||||||||
| Term debt |
1,278,868 | 1,148,083 | 1,523,052 | 1,452,361 | ||||||||||||
| Derivatives instruments |
1,174 | 1,174 | 7,853 | 7,853 | ||||||||||||
The carrying amounts shown in the table are included in the consolidated balance sheets under the indicated captions.
The following methods and assumptions were used to estimate the fair value of each class of financial instruments:
Cash and cash equivalents and restricted cash: The carrying amounts approximate fair value because of the short maturity of these instruments.
Loans held-for-sale, net: The fair values are based on quoted prices, where available, or are determined by discounting estimated cash flows using model-based valuation techniques. Inputs into the model-based valuations can include changes in market indexes, selling prices of similar loans, management’s assumption related to credit rating of the loan, prepayment assumptions and other factors, such as credit loss assumptions.
Loans, net: The fair value was determined as the present value of expected future cash flows discounted at current market interest rates offered by similar lending institutions for loans with similar terms to companies with comparable credit risk. This method of estimating fair value does not incorporate the exit price concept of fair value.
99
Table of Contents
Investments in debt securities: The fair values of debt securities are based on quoted market prices, when available, at the reporting date for those or similar investments. When no market data is available, we estimate fair value using various valuation tools including cash flow models that utilize financial statements and business plans, as well as qualitative factors.
Credit facilities: Due to the adjustable rate nature of the borrowings, the fair value of the credit facilities are estimated to be their carrying values. Rates currently are comparable to those offered to the Company for similar debt instruments of comparable maturities by the Company’s lenders.
Term debt: The fair value was determined by applying prevailing term debt market interest rates to the Company’s current term debt structure.
Derivative instruments: Substantially all derivative instruments held or issued by the Company for risk management or customer-initiated activities are traded in over-the-counter markets where quoted market prices are not readily available. For those derivatives, the Company measures fair value using broker quotes or financial models that use primarily market observable inputs, such as yield curves and option volatilities, and include the value associated with the counterparty credit risk.
Other assets: Comprised of non-public investments which are initially valued at transaction price and subsequently adjusted when evidence is available to support such adjustments when appropriate. The estimated fair value was determined based on the Company’s valuation techniques, including discounting estimated cash flows and model-based valuations.
Note 16. Employee Benefit Plans
The Company maintains a contributory 401(k) plan covering all full-time employees. The Company matches 100% of employee’s voluntary contributions up to a limit of 6% of the employee’s base salary, subject to IRS guidelines. Expense for 2010, 2009 and 2008 was $0.5 million, $0.5 million and $0.9 million, respectively.
Note 17. Related-Party Transactions
Pursuant to an Investment Management Agreement dated August 3, 2005, the Company serves as investment manager of the NewStar Credit Opportunities Fund, Ltd. (the “Fund”), a Cayman Islands exempted company limited by shares incorporated under the provisions of The Companies Law of the Cayman Islands. The Fund pays the Company a management fee, payable monthly in arrears, based on the carrying value of the total gross assets attributable to the applicable series of each class of shares at the end of each month. For 2010, 2009 and 2008, the Fund’s asset management fees were $2.9 million, $2.9 million and $6.3 million, respectively. The decrease in the management fee from 2008 to 2009 was primarily due to a decline in the performance of the Fund.
During 2006, the Company made a loan based on market terms to a company with a director who is a relative of one of the Company’s officers. At December 31, 2010, the loan balance outstanding and amount of committed funds were $7.0 million and $7.7 million, respectively.
100
Table of Contents
Note 18. Selected Quarterly Financial Data (Unaudited)
Unaudited quarterly information for 2010 and 2009 is shown in the following table.
| For the three months ended | ||||||||||||||||||||||||||||||||
| Dec. 31, 2010 |
Sept. 30, 2010 |
June 30, 2010 |
March 31, 2010 |
Dec. 31, 2009 |
Sept. 30, 2009 |
June 30, 2009 |
March 31, 2009 |
|||||||||||||||||||||||||
| ($ in thousands) | ||||||||||||||||||||||||||||||||
| Summary Results of Operations Data: |
||||||||||||||||||||||||||||||||
| Interest income |
$ | 28,483 | $ | 27,022 | $ | 28,218 | $ | 29,103 | $ | 31,943 | $ | 33,675 | $ | 35,026 | $ | 35,925 | ||||||||||||||||
| Interest expense |
9,092 | 9,257 | 9,160 | 13,049 | 7,553 | 9,197 | 11,412 | 13,765 | ||||||||||||||||||||||||
| Net interest income |
19,391 | 17,765 | 19,058 | 16,054 | 24,390 | 24,478 | 23,614 | 22,160 | ||||||||||||||||||||||||
| Provision for credit losses |
(768 | ) | 1,176 | 5,542 | 27,047 | 39,032 | 32,577 | 36,177 | 25,307 | |||||||||||||||||||||||
| Net interest income (loss) after provision for credit losses |
20,159 | 16,589 | 13,516 | (10,993 | ) | (14,642 | ) | (8,099 | ) | (12,563 | ) | (3,147 | ) | |||||||||||||||||||
| Total non-interest income (loss) |
6,858 | 2,504 | 4,763 | 4,571 | 4,446 | 133 | (248 | ) | 6,322 | |||||||||||||||||||||||
| Total operating expenses |
11,230 | 10,047 | 9,543 | 9,793 | 9,560 | 10,927 | 12,040 | 9,908 | ||||||||||||||||||||||||
| Income (loss) before income taxes |
15,787 | 9,046 | 8,763 | (16,215 | ) | (19,756 | ) | (18,893 | ) | (24,851 | ) | (6,733 | ) | |||||||||||||||||||
| Income tax expense (benefit) |
6,414 | 3,583 | 3,310 | (6,373 | ) | (6,405 | ) | (6,957 | ) | (9,208 | ) | (1,783 | ) | |||||||||||||||||||
| Net income (loss) before noncontrolling interest |
9,373 | 5,463 | 5,426 | (9,842 | ) | (13,351 | ) | (11,936 | ) | (15,643 | ) | (4,950 | ) | |||||||||||||||||||
| Net (income) loss attributable to noncontrolling interest |
— | — | (98 | ) | (89 | ) | (54 | ) | 1,674 | — | — | |||||||||||||||||||||
| Net income (loss) attributable to common stockholders |
$ | 9,373 | $ | 5,463 | $ | 5,328 | $ | (9,931 | ) | $ | (13,405 | ) | $ | (10,262 | ) | $ | (15,643 | ) | $ | (4,950 | ) | |||||||||||
| Net income (loss) per share : |
||||||||||||||||||||||||||||||||
| Basic |
$ | 0.19 | $ | 0.11 | $ | 0.11 | $ | (0.20 | ) | $ | (0.27 | ) | $ | (0.21 | ) | $ | (0.32 | ) | $ | (0.10 | ) | |||||||||||
| Diluted |
0.18 | 0.11 | 0.10 | (0.20 | ) | (0.27 | ) | (0.21 | ) | (0.32 | ) | (0.10 | ) | |||||||||||||||||||
101
Table of Contents
| Item 9. | Changes in and Disagreements with Accountants on Accounting and Financial Disclosure |
None.
| Item 9A. | Controls and Procedures |
Management’s Report on Internal Control Over Financial Reporting
Our management is responsible for establishing and maintaining adequate internal control over financial reporting of the Company, as such term is defined in Exchange Act Rule 13a-15(f). Under the supervision and with the participation of our management, including our principal executive officer and principal financial officer, we conducted an evaluation of the effectiveness of our internal control over financial reporting based on the framework in Internal Control—Integrated Framework issued by the Committee of Sponsoring Organizations of the Treadway Commission. Based on our evaluation under the framework in Internal Control—Integrated Framework, our management concluded that our internal control over financial reporting was effective as of December 31, 2010. The effectiveness of our internal control over financial reporting as of December 31, 2010 has been audited by KPMG LLP, an independent registered public accounting firm, as stated in their report, which is included on page 59 of this Annual Report.
Evaluation of Disclosure Controls and Procedures
Our management, with the participation of our principal executive officer and principal financial officer, has evaluated the effectiveness of our disclosure controls and procedures (as defined in Rule 13a-15(e) and 15d-15(e) under the Securities Exchange Act of 1934, as amended (the “Exchange Act”)) as of the end of the period covered by this Annual Report (the “Evaluation Date”). Based on this evaluation, our principal executive officer and principal financial officer concluded that, as of the Evaluation Date, these disclosure controls and procedures are effective.
Changes in Internal Control over Financial Reporting
There was no change in our internal control over financial reporting (as defined in Rule 13a-15(f) and 15d-15(f) under the Exchange Act) identified in connection with the evaluation of our internal control that occurred during the fourth quarter of 2010 that has materially affected, or is reasonably likely to materially affect, our internal control over financial reporting.
| Item 9B. | Other Information |
None.
102
Table of Contents
PART III
| Item 10. | Directors, Executive Officers and Corporate Governance |
Information required by Item 10 is incorporated by reference from the information responsive thereto contained in the sections in our Proxy Statement for the Annual Meeting of Stockholders to be held on May 11, 2011 (the “2011 Proxy Statement”) captioned “Proposal 1: Election of Directors,” “Corporate Governance—Board Committees,” and “Section 16(a) Beneficial Ownership Reporting Compliance.”
Executive Officers of the Registrant
| Name |
Age | Position | ||||
| Timothy J. Conway |
56 | Chairman, Chief Executive Officer and President | ||||
| Peter A. Schmidt-Fellner |
54 | Chief Investment Officer and Director | ||||
| John K. Bray |
54 | Chief Financial Officer | ||||
| David R. Dobies |
45 | Head—Leveraged Finance Origination | ||||
| Robert T. Clemmens |
58 | Chief Credit Officer | ||||
Timothy J. Conway, 56, is our Chief Executive Officer and President and was elected to serve as Chairman of our Board of Directors in September 2006. He has been our Chief Executive Officer and President and has served on our Board of Directors since our inception in June 2004. From July 2002 to June 2004, Mr. Conway worked full-time on our founding. From 1996 to July 2002, Mr. Conway was a Managing Director at FleetBoston Financial Corporation or its predecessors responsible for Corporate Finance and Capital Markets. From 1987 to 1996, Mr. Conway held various senior management positions at Citicorp Securities, Inc. He was a Managing Director and Senior Securities Officer and was responsible for the bank’s private placement, loan syndication and acquisition finance businesses. Mr. Conway received his undergraduate degree from Fairfield University and his masters of business administration from the University of Connecticut.
Peter A. Schmidt-Fellner, 54, has served as our Chief Investment Officer since our inception in 2004 and was elected to our Board of Directors in November 2006. From 1993 to 2003, Mr. Schmidt-Fellner was at JPMorgan Securities, Inc. and its various subsidiaries and predecessor institutions, where during his tenure, he was responsible for High Yield Bond Sales, Trading and Research, Loan Trading and Co-Head of High Yield Bond Capital Markets. Mr. Schmidt-Fellner received his undergraduate degree from Colby College and his masters in business administration from the Tuck School of Business at Dartmouth.
John K. Bray, 54, has served as our Chief Financial Officer since January 2005. From April 2004 to October 2004, Mr. Bray was the Business Financial Officer at Bank of America. From August 1979 to April 2004, Mr. Bray held various positions at FleetBoston Financial Corporation or its predecessors, most recently as Director of Finance—Line of Businesses. Mr. Bray received his undergraduate degree from the College of the Holy Cross and his masters of business administration from the University of Hartford.
David R. Dobies, 45, has served as a Managing Director and Head of our Leveraged Finance Origination group since our inception in 2004. From 1995 to 2004, Mr. Dobies served in various capacities at FleetBoston Financial Corporation or its predecessors, most recently as Managing Director and Head of the Media, Entertainment and Sports Finance syndication businesses. Mr. Dobies received his undergraduate degree from Villanova University and his masters in business administration from the William E. Simon School of Business at the University of Rochester.
Robert T. Clemmens, 58, has served as a Managing Director of the Company since our inception in 2004 and serves as Chief Credit Officer. He is a member of the firm’s Management and Underwriting Committees. Mr. Clemmens has over 35 years of banking experience in Canada, the United Kingdom and the United States, focused on credit and risk management. From October 2002 to February 2004, Mr. Clemmens was at Tacitus
103
Table of Contents
Capital Management, a hedge fund, where he most recently served as Executive Vice President concentrating on fixed income research. He spent the majority of his career with Barclays Bank Plc (and its subsidiaries), where he held various positions of increasing leadership and executive management responsibility. Most recently, he served as Managing Director and Head of Risk for the Americas with primary responsibility for group-wide credit and market risk across the Americas. He was a member of the U.S. Executive Management Committee, Chairman of the Credit Committee and a voting member of the Group Credit Committee. He also served as a member of the Credit Risk Committee of the Counterparty Risk Management Policy Group formed by a consortium of financial institutions following the collapse of Long-Term Capital Management and, as a member of the Risk Management Committee of the Bond Market Association. Mr. Clemmens received his Bachelor of Commerce degree from Laurentian University and his masters in business administration from the Schulich School of Business at York University.
Code of Ethics
We have adopted a code of ethics that applies to our Chief Executive Officer, Chief Financial Officer, Controller, and certain other senior officers. A copy of the code is publicly available on the Investor Relations page of our website at www.newstarfin.com. If you would like to receive a copy of our Code of Ethics, free of charge, a request should be directed to: Investor Relations, NewStar Financial, Inc., 500 Boylston St., Suite 1250, Boston, Massachusetts 02116.
In addition we also have a Code of Business Conduct and Ethics, which applies to all directors, officers and employees in carrying out their responsibilities to and on behalf of the Company. A copy of the code is posted on the Company’s website at www.newstarfin.com.
| Item 11. | Executive Compensation |
Information required by Item 11 is incorporated by reference from the information responsive thereto contained in the sections of the 2011 Proxy Statement captioned “Board of Directors—Director Compensation” and “Executive Compensation.”
| Item 12. | Security Ownership of Certain Beneficial Owners and Management and Related Stockholder Matters |
Information required by Item 12 is incorporated by reference from the information responsive thereto contained in the sections of the 2011 Proxy Statement captioned “Shares held by Principal Stockholders and Management” and “Executive Compensation—Equity Compensation Plan Information.”
| Item 13. | Certain Relationships and Related Transactions, and Director Independence |
Information required by Item 13 is incorporated by reference from the information responsive thereto contained in the sections of the 2010 Proxy Statement captioned “Corporate Governance” and “Certain Relationships and Transactions.”
| Item 14. | Principal Accounting Fees and Services |
Information required by Item 14 is incorporated by reference from the information responsive thereto contained in the section of the 2011 Proxy Statement in the proposal titled “Ratification of Independent Registered Public Accounting Firm.”
104
Table of Contents
PART IV
| Item 15. | Exhibits, Financial Statement Schedules |
| a. | Documents Filed as Part of the Report |
The consolidated financial statements and reports of independent auditors have been filed as part of this Annual Report on Form 10-K as indicated in the Index to Financial Statements appearing on page 58 of this report.
| b. | Exhibits |
The exhibits filed with this Annual Report on Form 10-K are listed in the Exhibit Index immediately following the signature page hereof, which Exhibit Index is incorporated herein by reference.
| c. | Financial Statement Schedules |
Financial Statement Schedules have been omitted because the required information is not present, or not present in amounts sufficient to require submission of the schedules, or because the required information is provided in consolidated financial statements or notes thereto.
105
Table of Contents
Pursuant to the requirements of Section 13 or 15(d) of the Securities Exchange Act of 1934, the Company has duly caused this report to be signed on its behalf by the undersigned, thereunto duly authorized.
| NEWSTAR FINANCIAL, INC. | ||||||||
| Date: | March 4, 2011 | By: | /s/ JOHN K. BRAY | |||||
| John K. Bray Chief Financial Officer | ||||||||
Pursuant to the requirements of the Securities Exchange Act of 1934, this report has been signed below by the following persons on behalf of the Company and in the capacities and on the dates indicated.
| Signature |
Title |
Date | ||
| /s/ TIMOTHY J. CONWAY Timothy J. Conway |
Chairman, Chief Executive Officer and President (Principal Executive Officer) | March 4, 2011 | ||
| /s/ JOHN K. BRAY John K. Bray |
Chief Financial Officer (Principal Financial and Accounting Officer) |
March 4, 2011 | ||
| /s/ CHARLES N. BRALVER Charles N. Bralver |
Director | March 4, 2011 | ||
| /s/ T. KIMBALL BROOKER, JR. T. Kimball Brooker, Jr. |
Director | March 4, 2011 | ||
| /s/ BRADLEY E. COOPER Bradley E. Cooper |
Director | March 4, 2011 | ||
| /s/ BRIAN L.P. FALLON Brian L.P. Fallon |
Director | March 4, 2011 | ||
| /s/ FRANK R. NOONAN Frank R. Noonan |
Director | March 4, 2011 | ||
| /s/ MAUREEN P. O’HARA Maureen P. O’Hara |
Director | March 4, 2011 | ||
| /s/ PETER A. SCHMIDT-FELLNER Peter A. Schmidt-Fellner |
Chief Investment Officer and Director | March 4, 2011 | ||
| /s/ RICHARD E. THORNBURGH Richard E. Thornburgh |
Director | March 4, 2011 | ||
106
Table of Contents
INDEX TO EXHIBITS
| EXHIBIT NUMBER |
DESCRIPTION |
METHOD OF FILING | ||
| 2(a) | Interest Purchase Agreement by and among NewStar Financial, Inc. (the “Company”), Core Financial Holdings, LLC and Core Business Credit, LLC dated as of November 1, 2010. | Previously filed as Exhibit 2.1 to the Company’s Current Report on Form 8-K (File No. 001-33211) filed on November 2, 2010 and incorporated herein by reference. | ||
| 3(a) | Amended and Restated Certificate of Incorporation of the Company. | Previously filed as Exhibit 3(a) to the Company’s Annual Report on Form 10-K for the year ended December 31, 2006 (File No. 001-33211) filed on April 2, 2007 and incorporated herein by reference. | ||
| 3(b) | Amended and Restated Bylaws of the Company. | Previously filed as Exhibit 3(b) to the Company’s Annual Report on Form 10-K for the year ended December 31, 2006 (File No. 001-33211) filed on April 2, 2007 and incorporated herein by reference. | ||
| 4(a) | Stockholders’ Agreement, dated as of June 18, 2004, among the Company (f/k/a Novus Capital, Inc.) and the Stockholders party thereto. | Previously filed as Exhibit 4.1 to the Company’s Registration Statement on Form S-1 (File No. 333-137513) filed on September 21, 2006, and incorporated herein by reference. | ||
| 4(a)(1) | First Amendment to Stockholders’ Agreement, dated as of August 22, 2005, entered in connection with the Stockholders’ Agreement, dated as of June 18, 2004. | Previously filed as Exhibit 4(a)(1) to the Company’s Annual Report on Form 10-K for the year ended December 31, 2006 (File No. 001-33211) filed on April 2, 2007 and incorporated herein by reference. | ||
| 4(a)(2) | Second Amendment to Stockholders’ Agreement, dated as of June 5, 2006, entered in connection with the Stockholders’ Agreement, dated as of June 18, 2004. | Previously filed as Exhibit 4(a)(2) to the Company’s Annual Report on Form 10-K for the year ended December 31, 2006 (File No. 001-33211) filed on April 2, 2007 and incorporated herein by reference. | ||
| 4(a)(3) | Third Amendment to Stockholders’ Agreement, dated as of December 12, 2006, entered in connection with the Stockholders’ Agreement, dated as of June 18, 2004. | Previously filed as Exhibit 4(a)(3) to the Company’s Annual Report on Form 10-K for the year ended December 31, 2006 (File No. 001-33211) filed on April 2, 2007 and incorporated herein by reference. | ||
| 4(a)(4) | Fourth Amendment to Stockholders’ Agreement, dated as of March 26, 2007, entered in connection with the Stockholders’ Agreement, dated as of June 18, 2004. | Previously filed as Exhibit 4(a)(4) to the Company’s Annual Report on Form 10-K for the year ended December 31, 2007 (File No. 001-33211) filed on March 10, 2008 and incorporated herein by reference. | ||
| 4(b) | Form of Common Stock Certificate. | Previously filed as Exhibit 4.2 to Amendment No. 5 to the Company’s Registration Statement on Form S-1 (File No. 333-137513) filed on November 30, 2006 and incorporated herein by reference. | ||
Table of Contents
| EXHIBIT NUMBER |
DESCRIPTION |
METHOD OF FILING | ||
| 4(c) | Form of Warrant to Purchase Preferred Stock. | Previously filed as Exhibit 4.3 to Amendment No. 1 to the Company’s Registration Statement on Form S-1 (File No. 333-137513) filed on October 26, 2006 and incorporated herein by reference. | ||
| 4(d)(1) | Indenture, dated as of June 8, 2006, by and between NewStar Commercial Loan Trust 2006-01, as Issuer, and U.S. Bank National Association, as Trustee, relating to Class A-1, Class A-2, Class B, Class C, Class D, Class E and Class F Notes due March 30, 2022. | Previously filed as Exhibit 10.8.5 to Amendment No. 1 to the Company’s Registration Statement on Form S-1 (File No. 333-137513) filed on October 26, 2006 and incorporated herein by reference. | ||
| 4(d)(2) | Indenture, dated as of August 10, 2005, between NewStar Trust 2005-1, as Issuer, and U.S. Bank National Association, as Indenture Trustee. | Previously filed as Exhibit 10.12.5 to Amendment No. 1 to the Company’s Registration Statement on Form S-1 (File No. 333-137513) filed on October 26, 2006 and incorporated herein by reference. | ||
| 4(d)(3) | Indenture, dated as of December 30, 2005, by and between NewStar Warehouse Funding 2005 LLC, as Issuer, and U.S. Bank National Association, as Indenture Trustee and Custodian. | Previously filed as Exhibit 10.13.3 to Amendment No. 1 to the Company’s Registration Statement on Form S-1 (File No. 333-137513) filed on October 26, 2006 and incorporated herein by reference. | ||
| 4(d)(4) | Indenture, dated as of June 5, 2007, by and between NewStar Commercial Loan Trust 2007-1, as Issuer, and U.S. Bank National Association, as Trustee. | Previously filed as Exhibit 4.1 to the Company’s Current Report on Form 8-K (File No. 001-33211) filed on June 7, 2007 and incorporated herein by reference. | ||
| 4(d)(5) | Indenture, dated as of January 7, 2010, by and between NewStar Commercial Loan Trust 2009-1, as Issuer, and U.S. Bank National Association, as Trustee. | Previously filed as Exhibit 4(d)(5) to the Company’s Annual Report on Form 10-K for the year ended December 31, 2009 (File No. 001-33211) filed on March 8, 2010 and incorporated herein by reference. | ||
| 10(a)(1) | Lease, dated as of August 18, 2004, between Five Hundred Boylston West Venture, as Landlord, and the Company, as Tenant. | Previously filed as Exhibit 10.3.1 to Amendment No. 1 to the Company’s Registration Statement on Form S-1 (File No. 333-137513) filed on October 26, 2006 and incorporated herein by reference. | ||
| 10(a)(2) | First Amendment to Lease, dated as of March 26, 2005, between Five Hundred Boylston West Venture, as Landlord, and the Company, as Tenant. | Previously filed as Exhibit 10.3.2 to Amendment No. 1 to the Company’s Registration Statement on Form S-1 (File No. 333-137513) filed on October 26, 2006 and incorporated herein by reference. | ||
| 10(a)(3) | Sublease between Massachusetts Financial Services Company, as Tenant, and the Company, as Sub-tenant, dated February 1, 2007. | Previously filed as Exhibit 10(a) to the Company’s Quarterly Report on Form 10-Q for the quarterly period ended March 31, 2007 (File No. 001-33211) filed May 10, 2007 and incorporated herein by reference. | ||
Table of Contents
| EXHIBIT NUMBER |
DESCRIPTION |
METHOD OF FILING | ||
| 10(b)(1)(a) | Amended and Restated Sale and Servicing Agreement, dated as of April 5, 2006, by and among NewStar CP Funding LLC, as Seller, the Company, as Originator and Servicer, Wachovia Bank, National Association, as Swingline Purchaser, Wachovia Capital Markets, LLC, as Administrative Agent and VFCC Agent, U.S. Bank National Association, as Trustee, Lyon Financial Services, Inc. as Backup Servicer and each of the conduit purchaser and purchaser agents thereto from time to time. | Previously filed as Exhibit 10.7.1 to Amendment No. 1 to the Company’s Registration Statement on Form S-1 (File No. 333-137513) filed on October 26, 2006 and incorporated herein by reference. | ||
| 10(b)(1)(b) | Amendment No. 1 to the Amended and Restated Sale and Servicing Agreement dated as of June 7, 2006. | Previously filed as Exhibit 10.7.2 to Amendment No. 6 to the Company’s Registration Statement on Form S-1 (File No. 333-137513) filed on December 11, 2006 and incorporated herein by reference. | ||
| 10(b)(1)(c) | Amendment No. 2 to the Amended and Restated Sale and Servicing Agreement, dated as of July 10, 2006. | Previously filed as Exhibit 10(b)(1)(c) to the Company’s Annual Report on Form 10-K for the year ended December 31, 2006 (File No. 001-33211) filed on April 2, 2007 and incorporated herein by reference. | ||
| 10(b)(1)(d) | Amendment No. 3 to the Amended and Restated Sale and Servicing Agreement, dated as of August 9, 2006. | Previously filed as Exhibit 10.7.4 to Amendment No. 6 to the Company’s Registration Statement on Form S-1 (File No. 333-137513) filed on December 11, 2006 and incorporated herein by reference. | ||
| 10(b)(1)(e) | Amended, Restated and Substituted Variable Funding Certificate, dated as of August 9, 2006. | Previously filed as Exhibit 10.7.5 to Amendment No. 6 to the Company’s Registration Statement on Form S-1 (File No. 333-137513) filed on December 11, 2006 and incorporated herein by reference. | ||
| 10(b)(1)(f) | Amendment No. 4 and Waiver to the Amended and Restated Sale and Servicing Agreement, dated as of October 30, 2006. | Previously filed as Exhibit 10.7.6 to Amendment No. 6 to the Company’s Registration Statement on Form S-1 (File No. 333-137513) filed on December 11, 2006 and incorporated herein by reference. | ||
| 10(b)(1)(g) | Amendment No. 5 to the Amended and Restated Sale and Servicing Agreement, dated as of January 26, 2007. | Previously filed as Exhibit 10(b)(1) to the Company’s Quarterly Report on Form 10-Q for the quarterly period ended March 31, 2007 (File No. 001-33211) filed on May 10, 2007 and incorporated herein by reference. | ||
| 10(b)(1)(h) | Amendment No. 6 to the Amended and Restated Sale and Servicing Agreement, dated as of February 16, 2007. | Previously filed as Exhibit 10(b)(2) to the Company’s Quarterly Report on Form 10-Q for the quarterly period ended March 31, 2007 (File No. 001-33211) filed on May 10, 2007 and incorporated herein by reference. | ||
Table of Contents
| EXHIBIT NUMBER |
DESCRIPTION |
METHOD OF FILING | ||
| 10(b)(1)(i) | Amendment No. 7 and Waiver to the Amended and Restated Sale and Servicing Agreement, dated as of June 4, 2007. | Previously filed as Exhibit 10(b)(1)(i) to the Company’s Annual Report on Form 10-K for the year ended December 31, 2007 (File No. 001-33211) filed on March 10, 2008 and incorporated herein by reference. | ||
| 10(b)(1)(j) | Amendment No. 8 and Waiver to the Amended and Restated Sale and Servicing Agreement, dated as of June 27, 2007. | Previously filed as Exhibit 10(b)(1)(j) to the Company’s Annual Report on Form 10-K for the year ended December 31, 2007 (File No. 001-33211) filed on March 10, 2008 and incorporated herein by reference. | ||
| 10(b)(1)(k) | Amendment No. 9 to the Amended and Restated Sale and Servicing Agreement, dated as of August 8, 2007. | Previously filed as Exhibit 10(h) to the Company’s Quarterly Report on Form 10-Q for the quarter ended June 30, 2007 (File No. 001-33211) filed on August 8, 2007 and incorporated herein by reference. | ||
| 10(b)(1)(l) | Amendment No. 10 and Waiver to the Amended and Restated Sale and Servicing Agreement, dated as of September 28, 2007. | Previously filed as Exhibit 10(b)(1)(l) to the Company’s Annual Report on Form 10-K for the year ended December 31, 2007 (File No. 001-33211) filed on March 10, 2008 and incorporated herein by reference. | ||
| 10(b)(1)(m) | Second Amended and Restated Sale and Servicing Agreement, dated as of April 18, 2008, by and among NewStar CP Funding LLC, as Seller, the Company, as Originator and Servicer, Wachovia Bank, National Association, as Swingline Purchaser, Wachovia Capital Markets, LLC, as Administrative Agent and WBNA Agent, U.S. Bank National Association, as Trustee, Lyon Financial Services, Inc. as Backup Servicer and each of the conduit purchaser and purchaser agents thereto from time to time. | Previously filed as Exhibit 10(a) to the Company’s Quarterly Report on Form 10-Q for the quarter ended June 30, 2008 (File No. 001-33211) filed on August 6, 2008 and incorporated herein by reference. | ||
| 10(b)(1)(n) | Amendment No. 1 to the Second Amended and Restated Sale and Servicing Agreement, dated as of December 30, 2008. | Previously filed as Exhibit 10(b)(1)(n) to the Company’s Annual Report on Form 10-K for the year ended December 31, 2008 (File No. 001-33211) filed on March 10, 2009 and incorporated herein by reference. | ||
| 10(b)(1)(o) | Amendment No. 2 to the Second Amended and Restated Sale and Servicing Agreement, dated as of April 17, 2009. | Previously filed as Exhibit 10.1 to the Company’s Current Report on Form 8-K (File No. 001-33211) filed on April 20, 2009 and incorporated herein by reference. | ||
| 10(b)(1)(p) | Amendment No. 3 to the Second Amended and Restated Sale and Servicing Agreement, dated as of May 22, 2009. | Previously filed as Exhibit 10.2 to the Company’s Current Report on Form 8-K (File No. 001-33211) filed on May 27, 2009 and incorporated herein by reference. | ||
Table of Contents
| EXHIBIT NUMBER |
DESCRIPTION |
METHOD OF FILING | ||
| 10(b)(1)(q) | Third Amended and Restated Sale and Servicing Agreement, dated as of July 15, 2009, by and among NewStar CP Funding LLC, as Seller, the Company, as Originator and Servicer, Wachovia Bank, National Association, as Swingline Purchaser, Wachovia Capital Markets, LLC, as Administrative Agent and WBNA Agent, U.S. Bank National Association, as Trustee, Lyon Financial Services, Inc. as Backup Servicer and each of the conduit purchaser and purchaser agents thereto from time to time. | Previously filed as Exhibit 10.1 to the Company’s Current Report on Form 8-K (File No. 001-33211) filed on July 17, 2009 and incorporated herein by reference. | ||
| 10(b)(2)(a) | Sale and Servicing Agreement, dated as of June 8, 2006, by and among NewStar Commercial Loan Trust 2006-1, as Issuer, NewStar Commercial Loan LLC 2006-1, as Trust Depositor, the Company, as Servicer and Originator, U.S. Bank National Association, as Trustee, Lyon Financial Services Inc., as Backup Servicer, and Wilmington Trust Company, as Owner Trustee. | Previously filed as Exhibit 10.8.1 to Amendment No. 1 to the Company’s Registration Statement on Form S-1 (File No. 333-137513) filed on October 26, 2006 and incorporated herein by reference. | ||
| 10(b)(2)(b) | Commercial Loan Sale Agreement, dated as of June 8, 2006, between the Company, as Originator, and NewStar Commercial Loan LLC 2006-1, as Trust Depositor. | Previously filed as Exhibit 10.8.2 to Amendment No. 1 to the Company’s Registration Statement on Form S-1 (File No. 333-137513) filed on October 26, 2006 and incorporated herein by reference. | ||
| 10(b)(2)(c) | Note Purchase Agreements by NewStar Commercial Loan Trust 2006-1 dated as of May 25, 2006. | Previously filed as Exhibit 10.8.3 to Amendment No. 1 to the Company’s Registration Statement on Form S-1 (File No. 333-137513) filed on October 26, 2006 and incorporated herein by reference. | ||
| 10(b)(2)(d) | Purchase Agreement, dated as of May 25, 2006, between NewStar Commercial Loan Trust 2006-1, as Trust Depositor, and Wachovia Capital Markets, LLC, Citigroup Global Markets Inc. and Harris Nesbitt Corp., as Initial Purchasers. | Previously filed as Exhibit 10(b)(2)(d) to the Company’s Annual Report on Form 10-K for the year ended December 31, 2006 (File No. 001-33211) filed on April 2, 2007 and incorporated herein by reference. | ||
| 10(b)(3)(a) | Sale and Servicing Agreement, dated as of November 30, 2005, by and among NewStar Credit Opportunities Funding I Ltd., as Seller, NewStar Credit Opportunities Fund, Ltd., as the Fund, the Company, as Collateral Manager, IXIS Financial Products Inc., as Administrative Agent and Swingline Purchaser, Wachovia Capital Markets, LLC, as Documentation Agent, U.S. Bank National Association as Collateral Administrator and Collateral Custodian, Lyon Financial Services, Inc., as Backup Collateral Manager, and the conduit purchasers party thereto. | Previously filed as Exhibit 10.9.1.1 to Amendment No. 1 to the Company’s Registration Statement on Form S-1 (File No. 333-137513) filed on October 26, 2006 and incorporated herein by reference. | ||
Table of Contents
| EXHIBIT NUMBER |
DESCRIPTION |
METHOD OF FILING | ||
| 10(b)(4)(a) | Amended and Restated Secured Loan and Servicing Agreement, dated as of May 21, 2010, by and among NewStar Short-Term Funding LLC, as Borrower, the Company, as originator and servicer, MMP-7 Funding, LLC, as Lender, NATIXIS Financial Products Inc., as administrative agent, and U.S. Bank National Association, as Trustee. | Previously filed as Exhibit 10.1 to the Company’s Current Report on Form 8-K (File No. 001-33211) filed on May 6, 2010, and incorporated herein by reference. | ||
| 10(b)(4)(b) | Amended and Restated Guaranty Agreement, dated as of May 4, 2010 by the Company in favor or NATIXIS Financial Products Inc. for the benefit of the secured parties under the Secured Loan and Servicing Agreement. | Previously filed as Exhibit 10.2 to the Company’s Current Report on Form 8-K (File No. 001-33211) filed on May 6, 2010, and incorporated herein by reference. | ||
| 10(b)(5)(a) | Note Purchase Agreement, dated as of March 21, 2006, by and among NewStar Structured Finance Opportunities, LLC, as Issuer, the Company, as Limited Recourse Provider, MMP-5 Funding, LLC, as Swingline Investor, IXIS Financial Products Inc., as Investor Agent, and U.S. Bank National Association, as Trustee and the Investors Party thereto. | Previously filed as Exhibit 10.11.1 to Amendment No. 1 to the Company’s Registration Statement on Form S-1 (File No. 333-137513) filed on October 26, 2006 and incorporated herein by reference. | ||
| 10(b)(5)(b) | Amendment No. 1 dated as of March 6, 2008 to Note Purchase Agreement. | Previously filed as Exhibit 10(b)(5)(b) to the Company’s Annual Report on Form 10-K for the year ended December 31, 2007 (File No. 001-33211) filed on March 10, 2008 and incorporated herein by reference. | ||
| 10(b)(5)(c) | Amendment No. 2 dated as of June 1, 2007 to Note Purchase Agreement. | Previously filed as Exhibit 10(b)(5)(c) to the Company’s Annual Report on Form 10-K for the year ended December 31, 2007 (File No. 001-33211) filed on March 10, 2008 and incorporated herein by reference. | ||
| 10(b)(5)(d) | Assignment and Assumption Agreement, dated June 29, 2007, by and between NewStar Structured Finance Opportunities, LLC and NewStar Structured Finance Opportunities II, LLC. | Previously filed as Exhibit 10(g)(1) to the Company’s Quarterly Report on Form 10-Q for the quarterly period ended June 30, 2007 (File No. 001-33211) filed on August 8, 2007 and incorporated herein by reference. | ||
| 10(b)(5)(e) | Amendment No. 3, dated as of June 29, 2007, among NewStar Structured Finance Opportunities II, LLC as Issuer, the Company, as Limited Recourse Provider, MMP-5 Funding, LLC, Fenway Capital, LLC, Fenway Funding, LLC, Natixis Financial Products Inc., as Agent, and U.S. Bank National Association, as Trustee. | Previously filed as Exhibit 10(g)(2) to the Company’s Quarterly Report on Form 10-Q for the quarterly period ended June 30, 2007 (File No. 001-33211) filed on August 8, 2007 and incorporated herein by reference. | ||
Table of Contents
| EXHIBIT NUMBER |
DESCRIPTION |
METHOD OF FILING | ||
| 10(b)(5)(f) | Purchase and Sale Agreement, dated as of March 21, 2006, between NewStar Structured Finance Opportunities, LLC, as Buyer, and the Company, as Seller. | Previously filed as Exhibit 10.11.2 to Amendment No. 1 to the Company’s Registration Statement on Form S-1 (File No. 333-137513) filed on October 26, 2006 and incorporated herein by reference. | ||
| 10(b)(5)(g) | Collateral Management Agreement, dated as of March 21, 2006, between NewStar Structured Finance Opportunities, LLC, as Issuer, and the Company, as Collateral Manager. | Previously filed as Exhibit 10.11.3 to Amendment No. 1 to the Company’s Registration Statement on Form S-1 (File No. 333-137513) filed on October 26, 2006 and incorporated herein by reference. | ||
| 10(b)(5)(h) | Security Agreement, dated as of March 21, 2006, between NewStar Structured Finance Opportunities, LLC, as Issuer, and U.S. Bank National Association, as Trustee and Custodian. | Previously filed as Exhibit 10.11.4 to Amendment No. 1 to the Company’s Registration Statement on Form S-1 (File No. 333-137513) filed on October 26, 2006 and incorporated herein by reference. | ||
| 10(b)(6)(a) | Sale and Servicing Agreement, dated as of August 10, 2005, by and among NewStar Trust 2005-1, as Issuer, NewStar LLC 2005-1, as Trust Depositor, the Company, as Originator and Servicer, U.S. Bank National Association, as Indenture Trustee, Lyon Financial Services, Inc., as Backup Servicer, and Wilmington Trust Company, as Owner Trustee. | Previously filed as Exhibit 10.12.1 to Amendment No. 1 to the Company’s Registration Statement on Form S-1 (File No. 333-137513) filed on October 26, 2006 and incorporated herein by reference. | ||
| 10(b)(6)(b) | Commercial Loan Sale Agreement, date as of August 10, 2005, between the Company, as Originator, and NewStar LLC 2005-1, as Trust Depositor. | Previously filed as Exhibit 10.12.2 to Amendment No. 1 to the Company’s Registration Statement on Form S-1 (File No. 333-137513) filed on October 26, 2006 and incorporated herein by reference. | ||
| 10(b)(6)(c) | Class A-2 Note Purchase Agreement, dated as of August 10, 2005, between NewStar Trust 2005-1, as Issuer, and U.S. Bank National Association, as Indenture Trustee. | Previously filed as Exhibit 10.12.3 to Amendment No. 1 to the Company’s Registration Statement on Form S-1 (File No. 333-137513) filed on October 26, 2006 and incorporated herein by reference. | ||
| 10(b)(6)(d) | Purchase Agreement, dated August 10, 2005, between NewStar Trust 2005-1, as Trust Depositor, and Wachovia Capital Markets, LLC, Citigroup Global Markets Inc. and IXIS Securities North America Inc., as Initial Purchasers. | Previously filed as Exhibit 10.12.4 to the Company’s Registration Statement on Form S-1 (File No. 333-137513) filed on September 21, 2006 and incorporated herein by reference. | ||
| 10(b)(7)(a) | Sale and Servicing Agreement, dated as of December 30, 2005, by and among the Company, as Servicer and Seller, NewStar Warehouse Funding 2005 LLC, as Purchaser, and Lyon Financial Services, Inc. as Backup Servicer. | Previously filed as Exhibit 10.13.1 to Amendment No. 1 to the Company’s Registration Statement on Form S-1 (File No. 333-137513) filed on October 26, 2006 and incorporated herein by reference. | ||
Table of Contents
| EXHIBIT NUMBER |
DESCRIPTION |
METHOD OF FILING | ||
| 10(b)(7)(b) | Note Purchase Agreement, dated as of December 30, 2005, by and among NewStar Warehouse Funding 2005 LLC, as Issuer, the Company, as Seller and Servicer, and Citigroup Global Markets Realty Corp., as Note Purchaser. | Previously filed as Exhibit 10.13.2 to Amendment No. 1 to the Company’s Registration Statement on Form S-1 (File No. 333-137513) filed on October 26, 2006 and incorporated herein by reference. | ||
| 10(b)(7)(c) | First Omnibus Amendment to the Note Purchase Agreement, dated as of April 27, 2006. | Previously filed as Exhibit 10.13.4 to Amendment No. 1 to the Company’s Registration Statement on Form S-1 (File No. 333-137513) filed on October 26, 2006 and incorporated herein by reference. | ||
| 10(b)(7)(d) | Second Omnibus Amendment to the Note Purchase Agreement, dated as of June 7, 2006. | Previously filed as Exhibit 10.13.5 to Amendment No. 1 to the Company’s Registration Statement on Form S-1 (File No. 333-137513) filed on October 26, 2006 and incorporated herein by reference. | ||
| 10(b)(7)(e) | Third Omnibus Amendment to the Note Purchase Agreement, dated as of December 22, 2006. | Previously filed as Exhibit 10(c)(1) to the Company’s Quarterly Report on Form 10-Q for the period ended March 31, 2007 (File No. 001-33211) filed on May 10, 2007 and incorporated herein by reference. | ||
| 10(b)(7)(f) | Fourth Omnibus Amendment to the Note Purchase Agreement, dated as of February 21, 2007. | Previously filed as Exhibit 10(c)(2) to the Company’s Quarterly Report on Form 10-Q for the period ended March 31, 2007 (File No. 001-33211) filed on May 10, 2007 and incorporated herein by reference. | ||
| 10(b)(7)(g) | Fifth Omnibus Amendment to the Note Purchase Agreement, dated as of March 27, 2007. | Previously filed as Exhibit 10(c)(3) to the Company’s Quarterly Report on Form 10-Q for the period ended March 31, 2007 (File No. 001-33211) filed on May 10, 2007 and incorporated herein by reference. | ||
| 10(b)(7)(h) | Sixth Omnibus Amendment to the Note Purchase Agreement, dated as of November 7, 2007. | Previously filed as Exhibit 10(b)(7)(h) to the Company’s Annual Report on Form 10-K for the year ended December 31, 2007 (File No. 001-33211) filed on March 10, 2008 and incorporated herein by reference. | ||
| 10(b)(7)(i) | Note Purchase Agreement, dated as of November 19, 2008, by and among NewStar Warehouse Funding 2005 LLC, as Issuer, the Company, as Seller and Servicer, Citicorp North America, Inc., as Note Purchaser Agent, each of the investors from time to time a party thereto, and each of the liquidity banks from time to time a party thereto. | Previously filed as Exhibit 10(b)(7)(i) to the Company’s Annual Report on Form 10-K for the year ended December 31, 2008 (File No. 001-33211) filed on March 10, 2009 and incorporated herein by reference. | ||
Table of Contents
| EXHIBIT NUMBER |
DESCRIPTION |
METHOD OF FILING | ||
| 10(b)(7)(j) | Amended and Restated Sale and Servicing Agreement, dated as of November 19, 2008, among the Company, as Servicer and Seller, NewStar Warehouse Funding 2005 LLC, as Purchaser, and Lyon Financial Services, Inc., as Backup Servicer. | Previously filed as Exhibit 10(b)(7)(j) to the Company’s Annual Report on Form 10-K for the year ended December 31, 2008 (File No. 001-33211) filed on March 10, 2009 and incorporated herein by reference. | ||
| 10(b)(7)(k) | Second Omnibus Amendment to the Note Purchase Agreement, dated as of November 3, 2009. | Previously filed as Exhibit 10(b)(7)(k) to the Company’s Annual Report on Form 10-K for the year ended December 31, 2009 (File No. 001-33211) filed on March 8, 2010 and incorporated herein by reference. | ||
| 10(b)(7)(l) | Third Omnibus Amendment, dated as of March 19, 2010. | Previously filed as Exhibit 10.1 to the Company’s Current Report on Form 8-K (File No. 001-33211) filed on March 23, 2010 and incorporated herein by reference. | ||
| 10(b)(7)(m) | Fourth Omnibus Amendment, dated November 16, 2010. | Filed herewith. | ||
| 10(b)(7)(n) | Fifth Omnibus Amendment, dated November 22, 2010. | Filed herewith. | ||
| 10(b)(7)(o) | Sixth Omnibus Amendment, dated December 15, 2010 | Filed herewith. | ||
| 10(b)(8)(a) | Master Participation Agreement, dated as of May 4, 2007 by and among NewStar ArcTurus CLO I Ltd., Citigroup Financial Products Inc., and NewStar Asset Management LLC. | Previously filed as Exhibit 10.1 to the Company’s Current Report on Form 8-K (File No. 001-33211) filed on May 21, 2007 and incorporated herein by reference. | ||
| 10(b)(8)(b) | Asset Acquisition Agreement, dated as of May 4, 2007 by and among NewStar ArcTurus CLO I Ltd. as Issuer, NewStar Asset Management LLC as Collateral Manager, the Company and Citigroup Financial Products Inc. | Previously filed as Exhibit 10.2 to the Company’s Current Report on Form 8-K (File No. 001-33211) filed on May 21, 2007 and incorporated herein by reference. | ||
| 10(b)(9)(a) | Sale and Servicing Agreement, dated as of June 5, 2007, by and among NewStar Commercial Loan Trust 2007-1, as Issuer, NewStar Commercial Loan LLC 2007-1, as Trust Depositor, the Company, as Originator and Servicer, U.S. Bank N.A., as Trustee, Lyon Financial Services, Inc., as Backup Servicer and Wilmington Trust Company as Owner Trustee. | Previously filed as Exhibit 10.1 to the Company’s Current Report on Form 8-K (File No. 001-33211) filed on June 7, 2007 and incorporated herein by reference. | ||
| 10(b)(9)(b) | Commercial Loan Sale Agreement, dated as of June 5, 2007, by and between the Company, as Originator and NewStar Commercial Loan LLC 2007-1 as Trust Depositor. | Previously filed as Exhibit 10.2 to the Company’s Current Report on Form 8-K (File No. 001-33211) filed on June 7, 2007 and incorporated herein by reference. | ||
Table of Contents
| EXHIBIT NUMBER |
DESCRIPTION |
METHOD OF FILING | ||
| 10(b)(9)(c) | Note Purchase Agreements, dated as of June 5, 2007, by NewStar Commercial Loan Trust 2007-1. | Previously filed as Exhibit 10.3 to the Company’s Current Report on Form 8-K (File No. 001-33211) filed on June 7, 2007 and incorporated herein by reference. | ||
| 10(b)(9)(d) | Class A-2 Note Purchase Agreement, dated as of June 5, 2007, among NewStar Commercial Loan Trust 2007-1, as Issuer, U.S. Bank N.A., as Class A-2 Agent and the Class A-2 Holders party thereto. | Previously filed as Exhibit 10.4 to the Company’s Current Report on Form 8-K (File No. 001-33211) filed on June 7, 2007 and incorporated herein by reference. | ||
| 10(b)(10)(a) | Loan and Servicing Agreement dated as of November 7, 2007 by and among NewStar DB Term Funding LLC, as Borrower, the Company, as Originator and Servicer, Deutsche Bank AG, New York Branch, as the Administrative Agent, U.S. Bank National Association, as Trustee, Lyon Financial Services, Inc. as Backup Servicer, and each of the conduit lenders, each of the institutional lenders and each of the lender agents, from time to time party thereto. | Previously filed as Exhibit 10(d) to the Company’s Annual Report on Form 10-K for the year ended December 31, 2007 (File No. 001-33211) filed on March 10, 2008 and incorporated herein by reference. | ||
| 10(b)(10)(b) | First Amendment to the Loan and Servicing Agreement, dated as of May 6, 2008. | Previously filed as Exhibit 10(b) to the Company’s Quarterly Report on Form 10-Q for the quarter ended June 30, 2008 (File No. 001-33211) filed on August 6, 2008 and incorporated herein by reference. | ||
| 10(b)(10)(c) | Omnibus Amendment to the Loan and Servicing Agreement, dated as of January 15, 2009. | Previously filed as Exhibit 10.1 to the Company’s Current Report on Form 8-K (File No. 001-33211) filed on January 22, 2009 and incorporated herein by reference. | ||
| 10(b)(11)(a) | Revolving Note dated January 5, 2010, executed by the Company in favor of Fortress Credit Corp. | Previously filed as Exhibit 4.1 to the Company’s Current Report on Form 8-K (File No. 001-33211) filed on January 7, 2010 and incorporated herein by reference. | ||
| 10(b)(11)(b) | Note Agreement dated as of January 5, 2010, by and among the Company, Fortress Credit Corp., as Administrative Agent and the holders from time to time party thereto. | Previously filed as Exhibit 10.1 to the Company’s Current Report on Form 8-K (File No. 001-33211) filed on January 7, 2010 and incorporated herein by reference. | ||
| 10(b)(11)(c) | Amendment to Note Agreement dated as of April 6, 2010 among the Company, Fortress Credit Corp., as administrative agent for the holders from time to time party thereto. | Previously filed as Exhibit 10(a)(1) to the Company’s Quarterly Report on Form 10-Q for the quarter ended March 31, 2010 (File No. 001-33211) filed on May 6, 2010 and incorporated herein by reference. | ||
| 10(b)(11)(d) | Amended and Restated Note Agreement, dated as of August 31, 2010 by and among the Company, the holders from time to time party thereto, and Fortress Credit Corp., as administrative agent. | Previously filed as Exhibit 10.1 to the Company’s Current Report on Form 8-K (File No. 001-33211) filed on September 7, 2010 and incorporated herein by reference. | ||
Table of Contents
| EXHIBIT NUMBER |
DESCRIPTION |
METHOD OF FILING | ||
| 10(b)(11)(e) | Subsidiary Guaranty dated as of January 5, 2010, by NewStar California, LLC, NewStar Asset Management, LLC and NewStar Loan Funding, LLC in favor of Fortress Credit Corp. in its capacity as Administrative Agent. | Previously filed as Exhibit 10.2 to the Company’s Current Report on Form 8-K (File No. 001-33211) filed on January 7, 2010 and incorporated herein by reference. | ||
| 10(b)(11)(f) | Joinder Agreement dated as of March 31, 2010 to the Subsidiary Guaranty dated January 5, 2010 by Alameda NS Four Holding, LLC. | Previously filed as Exhibit 10(b)(1) to the Company’s Quarterly Report on Form 10-Q for the quarter ended March 31, 2010 (File No. 001-33211) filed on May 6, 2010 and incorporated herein by reference. | ||
| 10(b)(11)(g) | Pledge and Security Agreement dated as of January 5, 2010, by and between the Company, NewStar California, LLC, NewStar Asset Management, LLC NewStar Loan Funding, LLC and Fortress Credit Corp. in its capacity as Administrative Agent. | Previously filed as Exhibit 10.3 to the Company’s Current Report on Form 8-K (File No. 001-33211) filed on January 7, 2010 and incorporated herein by reference. | ||
| 10(b)(11)(h) | Supplement No. 1 dated as of March 31, 2010 to the Pledge and Security Agreement, among the Company, its subsidiary guarantors and Fortress Credit Corp. | Previously filed as Exhibit 10(c)(1) to the Company’s Quarterly Report on Form 10-Q for the quarter ended March 31, 2010 (File No. 001-33211) filed on May 6, 2010 and incorporated herein by reference. | ||
| 10(b)(12)(a) | Sale and Servicing Agreement dated as of January 7, 2010, by and among NewStar Commercial Loan Trust 2009-1, as Issuer, NewStar Commercial Loan LLC 2009-1, as Trust Depositor, the Company, as the Originator and the Servicer, U.S. Bank, National Association, as the Trustee, and Wilmington Trust Company, as Owner Trustee. | Previously filed as Exhibit 10(b)(12)(a) to the Company’s Annual Report on Form 10-K for the year ended December 31, 2009 (File No. 001-33211) filed on March 8, 2010 and incorporated herein by reference. | ||
| 10(b)(12)(b) | Commercial Loan Sale Agreement dated as of January 7, 2010, by and between the Company, as the Originator and NewStar Commercial Loan LLC 2009-1, as Trust Depositor. | Previously filed as Exhibit 10(b)(12)(b) to the Company’s Annual Report on Form 10-K for the year ended December 31, 2009 (File No. 001-33211) filed on March 8, 2010 and incorporated herein by reference. | ||
| 10(b)(12)(c) | Note Purchase Agreement dated as of January 7, 2010, by NewStar Commercial Loan Trust 2009-1. | Previously filed as Exhibit 10(b)(12)(c) to the Company’s Annual Report on Form 10-K for the year ended December 31, 2009 (File No. 001-33211) filed on March 8, 2010 and incorporated herein by reference. | ||
| 10(b)(13)(a) | Second Amended and Restated Revolving Credit Agreement among the Company, Core Business Credit, LLC, Core Business Funding LLC, Autobahn Funding Company LLC, DZ Bank AG Deutsche Zentral-Genossenschaftsbank Frankfurt am Main and US. Bank National Association, dated as of November 1, 2010. | Previously filed as Exhibit 10.1 to the Company’s Current Report on Form 8-K (File No. 001-33211) filed on November 2, 2010 and incorporated herein by reference. | ||
Table of Contents
| EXHIBIT NUMBER |
DESCRIPTION |
METHOD OF FILING | ||
| 10(b)(13)(b) | Performance Guaranty made by the Company in favor of DZ Bank AG Deutsche Zentral-Genossenschaftsbank Frankfurt am Main, dated as of November 1, 2010. | Previously filed as Exhibit 10.2 to the Company’s Current Report on Form 8-K (File No. 001-33211) filed on November 2, 2010 and incorporated herein by reference. | ||
| 10(b)(13)(c) | Amended and Restated Purchase and Contribution Agreement between Core Business Credit, LLC and Core Business Funding, LLC, dated as of November 1, 2010. | Previously filed as Exhibit 10.3 to the Company’s Current Report on Form 8-K (File No. 001-33211) filed on November 2, 2010 and incorporated herein by reference. | ||
| 10(c) | Management Agreement, dated as of August 3, 2005, by and between NewStar Credit Opportunities Fund, Ltd. and the Company, as Manager.† | Previously filed as Exhibit 10.14.1 to Amendment No. 2 to the Company’s Registration Statement on Form S-1 (File No. 333-137513) filed on October 27, 2006 and incorporated herein by reference. | ||
| 10(d)(1)(a) | Securities Purchase Agreement dated November 12, 2007 by and among the Company and the Investors named therein. | Previously filed as Exhibit 10.1 to the Company’s Current Report on Form 8-K (File No. 001-33211) filed on November 19, 2007 and incorporated herein by reference. | ||
| 10(d)(1)(b) | Registration Rights Agreement dated November 12, 2007 by and among the Company and the Purchasers named therein. | Previously filed as Exhibit 10.3 to the Company’s Current Report on Form 8-K (File No. 001-33211) filed on November 19, 2007 and incorporated herein by reference. | ||
| 10(d)(1)(c) | Nomination Rights Letter dated November 12, 2007 between the Company and Union Square Partners, L.P. | Previously filed as Exhibit 10.4 to the Company’s Current Report on Form 8-K (File No. 001-33211) filed on November 19, 2007 and incorporated herein by reference. | ||
| 10(d)(1)(d) | Management Rights Letter dated November 12, 2007 between the Company and Union Square Partners, L.P. | Previously filed as Exhibit 10.5 to the Company’s Current Report on Form 8-K (File No. 001-33211) filed on November 19, 2007 and incorporated herein by reference. | ||
| 10(e)(1) | Form of Restated Tier I Employment Agreement dated as of December 11, 2009, between the Company, and each of the Chief Executive Officer, Chief Financial Officer and Chief Investment Officer.* | Previously filed as Exhibit 10.1 to the Company’s Current Report on Form 8-K (File No. 001-33211) filed on December 15, 2009 and incorporated herein by reference. | ||
| 10(e)(2) | Form of Restated Tier II Employment Agreement dated as of December 11, 2009, between the Company, and each of its executive officers (excluding the Chief Executive Officer, Chief Financial Officer and Chief Investment Officer).* | Previously filed as Exhibit 10.2 to the Company’s Current Report on Form 8-K (File No. 001-33211) filed on December 15, 2009 and incorporated herein by reference. | ||
| 10(f) | Amended and Restated 2006 Incentive Plan, as amended. | Previously filed as Exhibit 10.1 to the Company’s Current Report on Form 8-K (File No. 001-33211) filed on May 14, 2010 and incorporated herein by reference | ||
Table of Contents
| EXHIBIT NUMBER |
DESCRIPTION |
METHOD OF FILING | ||
| 10(g) | Form of Restricted Stock Award Agreement under the 2006 Incentive Plan. | Previously filed as Exhibit 10.17.1 to Amendment No. 6 to the Company’s Registration Statement on Form S-1 (File No. 333-137513) filed on December 11, 2006 and incorporated herein by reference. | ||
| 10(h) | Form of Stock Option Award Agreement under the 2006 Incentive Plan. | Previously filed as Exhibit 10.18.1 to Amendment No. 6 to the Company’s Registration Statement on Form S-1 (File No. 333-137513) filed on December 11, 2006 and incorporated herein by reference. | ||
| 10(i)(1) | Amended and Restated Restricted Stock Agreement, dated as of December 13, 2006, between the Company and Timothy J. Conway.* | Previously filed as Exhibit 10(h)(1) to the Company’s Annual Report on Form 10-K for the year ended December 31, 2006 (File No. 001-33211) filed on April 2, 2007 and incorporated herein by reference. | ||
| 10(i)(2) | Amended and Restated Restricted Stock Agreement, dated as of December 13, 2006, between the Company and Peter A. Schmidt-Fellner.* | Previously filed as Exhibit 10(h)(2) to the Company’s Annual Report on Form 10-K for the year ended December 31, 2006 (File No. 001-33211) filed on April 2, 2007 and incorporated herein by reference. | ||
| 10(i)(3) | Amended and Restated Restricted Stock Agreement, dated as of December 13, 2006, between the Company and John Kirby Bray.* | Previously filed as Exhibit 10(h)(3) to the Company’s Annual Report on Form 10-K for the year ended December 31, 2006 (File No. 001-33211) filed on April 2, 2007 and incorporated herein by reference. | ||
| 10(i)(4) | Amended and Restated Restricted Stock Agreement, dated as of December 13, 2006, between the Company and David R. Dobies.* | Previously filed as Exhibit 10(h)(5) to the Company’s Annual Report on Form 10-K for the year ended December 31, 2006 (File No. 001-33211) filed on April 2, 2007 and incorporated herein by reference. | ||
| 10(j) | Lock Up Agreement, dated March 18, 2009 by and among the Company and the management stockholders named therein.* | Previously filed as Exhibit 10.1 to the Company’s Current Report on Form 8-K (File No. 001-33211) filed on March 20, 2009 and incorporated herein by reference. | ||
| 10(k) | Form of Restricted Stock Agreement. | Previously filed as Exhibit 10.21.1 to Amendment No. 6 to the Company’s Registration Statement on Form S-1 (File No. 333-137513) filed on December 11, 2006 and incorporated herein by reference. | ||
| 10(l) | Form of Management Restricted Stock Agreement. | Previously filed as Exhibit 10.20.1 to Amendment No. 6 to the Company’s Registration Statement on Form S-1 (File No. 333-137513) filed on December 11, 2006 and incorporated herein by reference. | ||
Table of Contents
| EXHIBIT NUMBER |
DESCRIPTION |
METHOD OF FILING | ||
| 10(m) | Form of Director Restricted Stock Agreement. | Previously filed as Exhibit 10.22.1 to Amendment No. 6 to the Company’s Registration Statement on Form S-1 (File No. 333-137513) filed on December 11, 2006 and incorporated herein by reference. | ||
| 21 | Subsidiaries of the Company. | Filed herewith. | ||
| 23 | Consent of KPMG LLP. | Filed herewith. | ||
| 31(a) | Certification of Chief Executive Officer pursuant to Section 302 of the Sarbanes-Oxley Act of 2002. | Filed herewith. | ||
| 31(b) | Certification of Chief Financial Officer pursuant to Section 302 of the Sarbanes-Oxley Act of 2002. | Filed herewith. | ||
| 32 | Certifications pursuant to 18 U.S.C. Section 1350. | Filed herewith. | ||
| † | Pursuant to a request for confidential treatment, portions of the exhibit have been redacted from the publicly filed document and have been furnished separately to the SEC as required by Rule 406 under the Securities Act. |
| * | Indicates management contracts and compensatory arrangements. |