Attached files
| file | filename |
|---|---|
| 8-K - FORM 8-K - TIMKEN CO | l38876e8vk.htm |
Exhibit 99.1

| Investor PresentationFebruary, 2010 |

| Investor Relations Contact:Steve Tschiegg, Director - Capital Markets & Investor RelationsPH: (330) 471-7446E-mail: steve.tschiegg@timken.com |

| SAFE HARBOR STATEMENT: Certain statements in this presentation (including statements regarding the company's forecasts, beliefs, estimates and expectations) that are not historical in nature are "forward-looking" statements within the meaning of the Private Securities Litigation Reform Act of 1995. In particular, the statements related to Timken's plans, outlook, future financial performance and liquidity, including the information under the headings "2012 Targets", are forward-looking. The company cautions that actual results may differ materially from those projected or implied in forward-looking statements due to a variety of important factors, including: the finalization of the company's financial statements for the fourth quarter and full year of 2009, the company's ability to respond to the changes in its end markets that could affect demand for the company's products; unanticipated changes in business relationships with customers or their purchases from the company; changes in the financial health of the company's customers which may have an impact on the company's revenues, earnings and impairment charges; fluctuations in raw-material and energy costs and their impact on the operation of the company's surcharge mechanisms; the impact of the company's LIFO (last-in first-out) accounting; continued weakness in global economic conditions and financial markets; changes in the expected costs associated with product warranty claims; the impact on operations of general economic conditions, higher or lower raw-material and energy costs, fluctuations in customer demand, and the company's ability to achieve the benefits of its future and ongoing programs and initiatives, including, without limitation, the initiative to reduce its employment levels and costs, the implementation of its Mobile Industries Segment restructuring program and initiatives and the rationalization of the company's Canton bearing operations. These and additional factors are described in greater detail in the company's Annual Report on Form 10-K for the year ended December 31, 2008, page 44, and in the company's Form 10-Q for the quarter ended September 30, 2009. The company undertakes no obligation to update or revise any forward-looking statement. |

| About The Timken Company A leading provider of friction management and power transmission solutions to diverse markets, including:- Aerospace - Construction - Mining - Truck- Energy - Automotive- Rail - DistributionEstablished in 1899Headquartered in Canton, Ohio2009 sales: $3.1 billionGlobal manufacturing footprint with operations in 26 countries17,000 associates An Industrial Technology Company |

| Diverse Global Industrial Portfolio Our strategy:Grow with differentiated products and services in attractive marketsIncreased sales from demanding applications in industrial markets, including:EnergyAerospaceHeavy IndustriesExpand channels into the aftermarket Broad-Based End Markets and Customers 2009 Sales: $3.1 Billion |

| Our strategy:Diversify global scope, growing disproportionately outside the U.S. Geographic Sales Diversification Restof World9% 2009 Sales: $3.1 Billion Asia12% Europe17% United States62% Sales Outside United States: 38% Asia Growth Initiative2009 sales of $370 million, or 12% of total companyEmployment of 4,500Asian headquarters in Shanghai, China8 manufacturing plants; 3 engineering centers; 3 distribution centers Industrial focus, including: infrastructure, mining, metals, industrial machinery, energy and aerospace Global Manufacturing Footprint |

| Our Strategy Model GROWOPTIMIZE Enhance existing products and servicesLeverage technology to create valueCapture lifetime of opportunity Structure portfolio for value creationFix/Exit under- performing sectors Industrial marketsGeographiesChannels Improve efficiencyLower cost structureIncrease agilityDeliver greater profitability and build on brand promise Shaping Our New Enterprise |

| (CHART) Our New Enterprise Leveraging our Capabilities in New Ways Aerospace & Defense: $418M Diversified growth in defense, commercial and the aftermarket... beyond bearings Steel Group: $673M Enhancing market leadership position where performance demands are high Process Industries: $806M Global growth, diversified, strong aftermarket Mobile Industries: $1,245M Portfolio transformation/ value-based pricing Note: Segmentation based on 2009 sales. Steel Group sales exclude inter-segment sales of $42M 2009 Sales: $3.1 Billion |
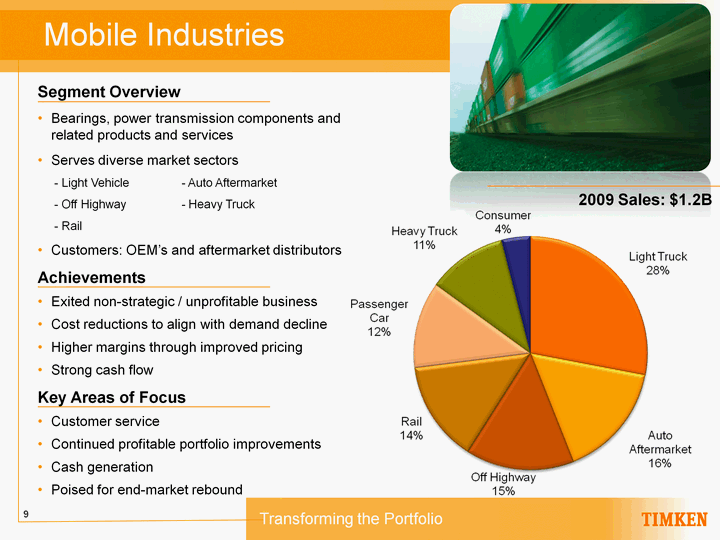
| Mobile Industries Segment OverviewBearings, power transmission components and related products and servicesServes diverse market sectors - Light Vehicle - Auto Aftermarket - Off Highway - Heavy Truck - RailCustomers: OEM's and aftermarket distributorsAchievementsExited non-strategic / unprofitable businessCost reductions to align with demand declineHigher margins through improved pricingStrong cash flowKey Areas of FocusCustomer service Continued profitable portfolio improvementsCash generationPoised for end-market rebound 2009 Sales: $1.2B Transforming the Portfolio |

| Process Industries Segment OverviewBearings and power transmission products and related services for broad industrial markets Diverse and global customer base~65% aftermarket; consistent, profitable businessAchievementsCost reductions to align with demand declineAligned capacity footprint to support Asia growthMaintained profit margin at low volumeInstallation and ramp-up of capacityXiangtan wind JV and ChennaiKey Areas of FocusManage operations at lower demandAsia growthInfrastructure, metals, aerospace, wind and aftermarketLaunch new products 2009 Sales: $809M Products for the Full Lifecycle of Applications |

| Segment OverviewPower transmission systems and flight-critical components for civil and military aircraft: - Helicopter transmissions - Rotor head assemblies - Bearings - Turbine engine components - Gears - HousingsAftermarket engine overhaul, replacement parts, bearing and component repair Health and positioning control applicationsAchievementsGrowth beyond bearing products and manufacturing know-howStronger aftermarket presenceHigher margins and growing demandIncreased capacity & capabilityKey Areas of FocusAdding power transmission parts, assemblies and servicesStrengthen aftermarket channels globallyExpand global capabilities through manufacturing initiatives Aerospace and Defense 2009 Sales: $418M Products and Services Beyond Bearings |
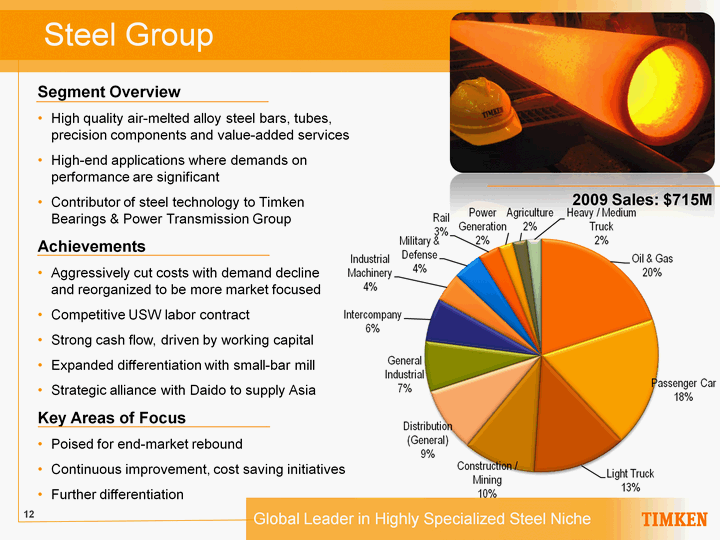
| Steel Group Segment OverviewHigh quality air-melted alloy steel bars, tubes, precision components and value-added servicesHigh-end applications where demands on performance are significantContributor of steel technology to Timken Bearings & Power Transmission GroupAchievementsAggressively cut costs with demand decline and reorganized to be more market focusedCompetitive USW labor contractStrong cash flow, driven by working capitalExpanded differentiation with small-bar millStrategic alliance with Daido to supply AsiaKey Areas of FocusPoised for end-market reboundContinuous improvement, cost saving initiativesFurther differentiation 2009 Sales: $715M Global Leader in Highly Specialized Steel Niche |

| Our Priorities Positioned for Improved Performance OPTIMIZEDrive performance improvements while continuing to implement our strategyMobile - transform through fix / exit strategySteel - rebound profitability and balance portfolioComplete Project O.N.E., achieve further working capital improvementsGROWExpand our business in industrial markets Process - new products / strategic acquisitionsAerospace - aftermarket / strategic acquisitionsExpand our business in Asia |

| Financial Review |

| 2009 - Year In Review Sales of $3.1 billion, down 38% from prior yearEPS of $0.32 (excluding special items)Continuing operations EPS of $0.53; loss of $0.21 from Needle Roller Bearings business, divested at year-endResults impacted by lower volumes and higher manufacturing costs partially offset by pricing, cost reductions and LIFO incomeSpecial items, net of tax, of $(1.71) -- primarily relating to impairment and severance costsRecord Free Cash Flow of $419 million, driven by working capital reductionsStrong Balance Sheet and LiquidityYear-end cash position of $756 million, exceeded total debt by $243 millionYear-end liquidity of $1.6 billionUnfunded pension obligation of $691 million, improved from $824 million last year Debt rated investment grade by both Moody's and Standard & Poor's Note: EPS excludes the impact of impairment and restructuring, manufacturing rationalization/integration/ reorganization and special charges and credits. Free cash flow is defined as net cash provided by operating activities (includes pension contributions) minus capital expenditures and dividends. See Appendix for GAAP Reconciliations. Well-Positioned with Structural Cost-Reduction Initiatives |
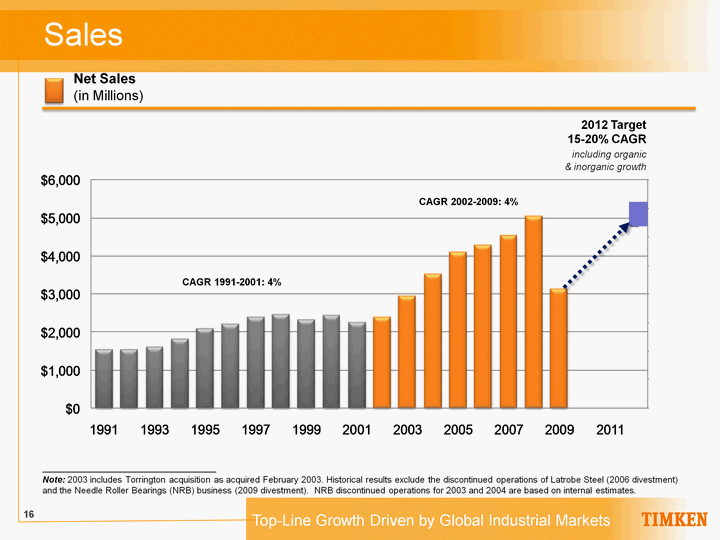
| 2012 Net Sales(in Millions) Sales CAGR 1991-2001: 4% CAGR 2002-2009: 4% Top-Line Growth Driven by Global Industrial Markets 2012 Target15-20% CAGR including organic & inorganic growth Note: 2003 includes Torrington acquisition as acquired February 2003. Historical results exclude the discontinued operations of Latrobe Steel (2006 divestment) and the Needle Roller Bearings (NRB) business (2009 divestment). NRB discontinued operations for 2003 and 2004 are based on internal estimates. |

| Earnings Per Share Earnings Per Share Earnings Should Rebound Faster than Prior Cycles 2012 EPS Target$3.25-$3.75 including organic & inorganic growth Net Sales(in Millions) 2012 Note: Earnings exclude special items, such as restructuring and reorganization expenses, CDO payments and goodwill amortization. EPS assumes dilution. 2003 includes Torrington acquisition as acquired February 2003. Historical results exclude the discontinued operations of Latrobe Steel (2006 divestment) and the Needle Roller Bearings (NRB) business (2009 divestment). NRB discontinued operations for 2003 and 2004 are based on internal estimates. |

| Free Cash Flow 2009 Record Driven by Working Capital Management Free Cash Flow(in Millions) (CHART) 2012 Target$150M-$250M '91-'01 Avg: $16M '02-'09 Avg: $86M Note: Free cash flow defined as net cash provided by operating activities (includes pension contributions) minus capital expenditures and dividends. A reconciliation to GAAP and description of this measure can be found in the Appendix. Results include discontinued operations until divested. |

| Target leverage of 30% - 35% Net Debt Position of Financial Strength Net Debt/Capital (CHART) Net Debt(in Millions) 1991 1993 1995 1997 1999 2001 2003 2005 2007 2009 Note: 2003 includes Torrington acquisition as acquired February 2003. Net Debt / Capital (leverage) defined as Net Debt / (Net Debt + Equity). A reconciliation to GAAP and description of this measure can be found in the Appendix. |

| 1991 1993 1995 1997 1999 2001 2003 2005 2007 2009 2012 Return on Invested Capital Cost of Capital Objective to Exceed Cost of Capital through Cycle Note: The company uses NOPAT/Average Invested Capital as a type of ratio that indicates return on capital (ROIC). A reconciliation to GAAP and description of this measure can be found in the Appendix. Return on InvestedCapital '91-'01 Avg. : 6.2% '02-'09 Avg. : 7.8% 2012Target 12-14% Cost of Capital ~ 9% (CHART) |

| Capital Allocation Organic growth and performance improvement initiativesTargeted in industrial market sectors; wind, aerospace, heavy industriesAsia GrowthProject O.N.E. (business processes & systems)AcquisitionsCriteria:Industrial and aftermarket focusMarket-leading positionStrong management teamInternational focusAccretive to earnings / cash in year oneEarn cost of capital within three yearsPension fundingDividends and share repurchase350th consecutive quarterly dividend paid in December 2009Authorized share repurchas e program to purchase up to 4 million shares or $180M Long-term Value Creation |
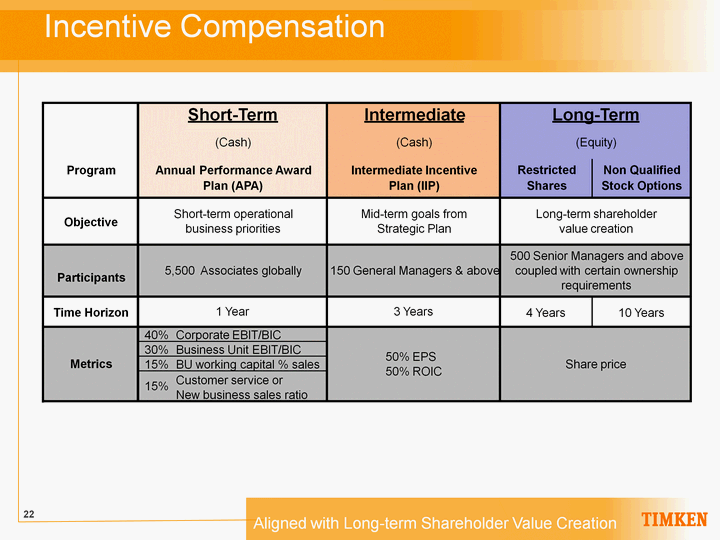
| Incentive Compensation Aligned with Long-term Shareholder Value Creation Program Restricted Non Qualified Shares Stock Options Objective Time Horizon 4 Years 10 Years 40% Corporate EBIT/BIC 30% Business Unit EBIT/BIC 15% BU working capital % sales Intermediate Incentive 50% EPS 50% ROIC Intermediate Long-Term Mid-term goals from Strategic Plan Share price 150 General Managers & above (Equity) Plan (IIP) (Cash) Short-Term (Cash) Short-term operational business priorities 5,500 Associates globally Plan (APA) Annual Performance Award Long-term shareholder value creation 3 Years Participants Customer service or New business sales ratio 15% 1 Year 500 Senior Managers and above coupled with certain ownership requirements Metrics |

| Our Strategy Model GROWOPTIMIZE Enhance existing products and servicesLeverage technology to create valueCapture lifetime of opportunity Structure portfolio for value creationFix/Exit under- performing sectors Industrial marketsGeographiesChannels Improve efficiencyLower cost structureIncrease agilityDeliver greater profitability and build on brand promise Shaping Our New Enterprise |

| Appendix |

| Reconciliation to GAAP (continued next page) |

| Reconciliation to GAAP |

| Reconciliation to GAAP |

| Reconciliation to GAAP |

| Reconciliation to GAAP |

| Reconciliation to GAAP |

| Reconciliation to GAAP |
