Attached files
Table of Contents
UNITED STATES
SECURITIES AND EXCHANGE COMMISSION
Washington, D.C. 20549
FORM 10-K
| x | Annual Report pursuant to Section 13 or 15(d) of the Securities Exchange Act of 1934 |
For the fiscal year ended December 31, 2009
OR
| ¨ | Transition Report pursuant to Section 13 or 15(d) of the Securities Exchange Act of 1934 |
For the transition period from to
Commission File Number 000-31029-40
MICROTUNE, INC.
(Exact name of registrant as specified in its charter)
| Delaware | 75-2883117 | |
| (State or other jurisdiction of incorporation or organization) |
(I.R.S. Employer Identification Number) | |
| 2201 10th Street Plano, Texas |
75074 | |
| (Address of principal executive offices) | (Zip code) | |
Registrant’s telephone number, including area code (972) 673-1600
Securities registered pursuant to Section 12(b) of the Act:
Common Stock, $0.001 par value per share
(Title of Class)
The NASDAQ Global Market
(Name of Exchange on Which Registered)
Indicate by check mark if the registrant is a well-known seasoned issuer, as defined in Rule 405 of the Securities Act. Yes ¨ No x
Indicate by check mark if the registrant is not required to file reports pursuant to Section 13 or Section 15(d) of the Exchange Act. Yes ¨ No x
Indicate by check mark whether the registrant (1) has filed all reports required to be filed by Section 13 or 15(d) of the Securities Exchange Act of 1934 during the preceding 12 months (or for such shorter period that the registrant was required to file such reports), and (2) has been subject to such filing requirements for the past 90 days. Yes x No ¨
Indicate by check mark if disclosure of delinquent filers pursuant to Item 405 of Regulation S-K (§ 229.405 of this chapter) is not contained herein, and will not be contained, to the best of registrant’s knowledge, in definitive proxy or information statements incorporated by reference in Part III of this Form 10-K or any amendment to this Form 10-K. x
Indicate by check mark whether the registrant has submitted electronically and posted on its corporate Web site, if any, every Interactive Data File required to be submitted and posted pursuant to Rule 405 of Regulation S-T (§ 232.405 of this chapter) during the preceding 12 months (or for such shorter period that the registrant was required to submit and post such files). Yes ¨ No ¨
Indicate by check mark whether the registrant is a large accelerated filer, an accelerated filer, a non-accelerated filer, or a smaller reporting company. See definition of “large accelerated filer,” “accelerated filer” and “smaller reporting company” in Rule 12b-2 of the Exchange Act.
| Large accelerated filer ¨ | Accelerated filer x | |
| Non-accelerated filer ¨ (Do not check if a smaller reporting company) | Smaller reporting company ¨ |
Indicate by check mark whether the registrant is a shell company (as defined in Rule 12b-2 of the Exchange Act). Yes ¨ No x
The aggregate market value of the registrant’s common stock, $0.001 par value per share, held by non-affiliates of the registrant on June 30, 2009, the last business day of the registrant’s most recently completed second fiscal quarter, was approximately $113 million (based on the closing sales price of the registrant’s common stock on that date). This is the only outstanding class of common stock of the registrant. Shares of the registrant’s common stock held by each executive officer and director and each person known to the registrant to own more than 10% of the outstanding voting power of the registrant have been excluded in that such persons may be deemed to be affiliates. This determination of affiliate status is not a determination for other purposes.
As of February 5, 2010, there were 53,970,086 shares of the registrant’s common stock, $0.001 par value per share, outstanding.
DOCUMENTS INCORPORATED BY REFERENCE
Part III incorporates by reference certain information from the registrant’s definitive proxy statement (the “Proxy Statement”) for the 2010 Annual Meeting of Stockholders.
Table of Contents
FORM 10-K
YEAR ENDED DECEMBER 31, 2009
INDEX
2
Table of Contents
CAUTION REGARDING FORWARD-LOOKING STATEMENTS
All statements included or incorporated by reference in this Annual Report on Form 10-K, other than statements of historical fact, are forward-looking statements. These forward-looking statements are based upon our current expectations, estimates and projections about our business and our industry, and reflect our beliefs and assumptions based upon information available to us as of the date of this report and are therefore subject to change. In some cases, you can identify these statements by words such as “if,” “may,” “might,” “will,” “should,” “could,” “would,” “expects,” “plans,” “anticipates,” “believes,” “estimates,” “predicts,” “potential,” “continue,” and other similar terms. These forward-looking statements include, but are not limited to, projections of our future financial performance and our anticipated growth, our accounting estimates, assumptions and judgments, the demand for our products, descriptions of our strategies, our product and market development plans, the trends we anticipate in our business and the markets in which we operate, the competitive nature and anticipated growth of those markets, our dependence on a few key customers for a substantial portion of our net revenue, our ability to continue to successfully partner with strategic partners, the successful integration of the operations and products of the companies we acquire, our ability to successfully address new markets where competition is intense, our ability to successfully predict the future product needs of our customers and develop products that meet their needs in time to meet product design-in windows and the success of our recently announced cost reduction efforts.
We caution readers that the forward-looking statements in this report are predictions based on our current expectations about future events. These forward-looking statements are not guarantees of future performance and are subject to risks, uncertainties and assumptions that are difficult to predict. Our actual results, performance or achievements could differ materially and adversely from those expressed or implied by any forward-looking statements as a result of various factors. We caution readers not to rely on these forward-looking statements, which reflect management’s analysis only as of the date of this report. These forward-looking statements speak only as of the date of this report. We undertake no obligation to revise or update any forward-looking statement for any reason, except as otherwise required by law.
NOTE: For a more complete understanding of our financial condition and results of operations, and the risks that could affect our future results, see “Risk Factors” in Part I, Item 1A. below which describes some of the important risk factors that may affect our business, results of operations and financial condition. You should carefully consider those risks, in addition to the other information in this report and in our other filings with the United States Securities and Exchange Commission (SEC), before deciding to make an investment in our stock. You should also read “Quantitative and Qualitative Disclosures About Market Risk” in Part II, Item 7A. below.
You should also read the following discussion and analysis in conjunction with our Consolidated Financial Statements and related Notes in Part II, Item 8., “Financial Statements and Supplementary Data.”
3
Table of Contents
PART I
| ITEM 1. | BUSINESS. |
Website Access to Reports and Other Information
We make our Proxy Statements, Annual Reports on Form 10-K, Quarterly Reports on Form 10-Q, Current Reports on Form 8-K, and amendments to those reports, filed or furnished pursuant to Section 13(a) or 15(d) of the Securities Exchange Act of 1934, as amended, available free of charge upon request by phone (telephone number: (972) 673-1610), by email to ir@microtune.com, in writing to our Investor Relations department at 2201 10th Street, Plano, Texas 75074 or through our internet website, www.microtune.com, as soon as reasonably practicable after we electronically file such material with, or furnish it to, the SEC. You may also access these materials at the SEC’s website located at www.sec.gov.
Overview
Microtune, Inc. was incorporated in 1996. We design and market receiver solutions for the cable, automotive entertainment electronics and digital television (DTV) markets. These solutions include radio frequency (RF) integrated circuits (ICs), digital signal processing ICs and subsystem module solutions. Our product portfolio consists of tuners, amplifiers, upconverters, demodulators and receivers, which permit the delivery, reception and exchange of broadband video, audio and data using terrestrial (off-air) and/or cable communications systems. Our tuner products shipped into the cable and DTV markets are in the form of ICs while our tuner products shipped into the automotive entertainment electronics market are principally in the form of subsystem modules, but are expected to be increasingly in the form of ICs in the near future. Our amplifier products are principally in the form of both ICs and subsystem modules and our upconverter products are principally in the form of subsystem modules, but also contain our ICs. Our demodulator and receiver products are in the form of ICs and are targeted principally for the digital TV market.
Our products target various consumer electronics, broadband communications and automotive entertainment electronics applications or devices, including cable television set-top boxes (STB); DOCSIS® -based, high-speed voice and data cable modems; car audio, television and antenna amplifier systems; integrated digital television systems (iDTV), including high-definition televisions (HDTV); digital-to-analog converter boxes; and personal computer television (PC/TV) multimedia products. We sell our products to original equipment manufacturers (OEMs) and original design manufacturers (ODMs) who sell devices, subsystems and applications to consumers or service providers within the cable, automotive entertainment electronics and DTV markets. We operate Microtune as a single business unit or reportable operating segment serving our target markets. We record our operating expenses by functional area and account type, but we do not record or analyze our operating expenses by market, product type or product. We attempt to analyze our net revenue by market, but in some cases we sell our products to resellers or distributors serving multiple end markets, giving us limited ability to determine market composition of our net revenue from these customers. In addition, certain of our OEM customers purchase products from us for applications in multiple end-markets, also limiting our ability to determine our net revenue contribution from each market.
The cable, automotive entertainment electronics and DTV markets are intensely competitive and historically have seen rapid changes in demand for specific products. Certain applications, such as PC/TV, within our target markets can be characterized as having short product life cycles due to rapid technological changes, relatively simple application designs and aggressive competitive pricing. These factors can result in rapidly decreasing average selling prices, which we attempt to mitigate with our product cost reduction efforts and higher levels of integration and functionality. The volatility of demand within our target markets makes it difficult for us to identify and discuss business trends or to predict future results.
4
Table of Contents
Today, our products are marketed principally to OEMs and ODMs in the following markets:
| • | Cable |
Products targeting this market send and/or receive cable broadband signals. These products include tuners used in consumer premise equipment (CPE), including high-speed voice and data cable modems, digital cable set-top boxes and hybrid analog/digital cable set-top boxes; upconverter modules and chipsets used in headend modulators; and RF amplifiers used to send and receive signals between the cable headend and CPE. In some cases, the same tuners may be used to receive digital terrestrial signals. In this market, performance, the ability to support industry standards, power efficiency and overall solution cost are key factors in competing for design wins. Design cycles in the cable market range from a few months to more than one year.
| • | Automotive Entertainment Electronics |
This market includes products targeting mobile automotive and, to a lesser extent, commercial aircraft environments. Our automotive entertainment electronics products range from components for traditional AM/FM radios (including tuners, RF-to-digital converters and antenna amplifiers) to components for emerging entertainment applications, including in-car television; in-flight video; digital radio, such as digital audio broadcast (DAB); and HD Radio Technology™. Performance, power efficiency and overall solution cost are key competitive factors in this market. Design cycles in the automotive entertainment electronics market are generally very long, in some cases, two to three years.
| • | Digital Television |
Products targeting this market receive and process digital and analog terrestrial and cable signals. These products are designed for use in consumer electronics devices such as iDTVs; digital terrestrial set-top boxes; IPTV set-top boxes that include one or more terrestrial tuners used to receive local high-definition television broadcasts; portable DVD players; digital video recorders (DVRs); DVD recorders; and PC/TV multimedia products, including both USB and PCI or PCI Express OEM and add-on devices. Products targeting these applications require high performance, power efficiency, competitive overall solution cost, small form factor and adherence to worldwide industry TV reception standards. Design cycles in the DTV market can range from a few months to more than one year for peripheral devices and from a few months to several months for PC/TV applications. The design cycles for PC/TV are relatively shorter and require very low overall solution cost.
Business Strategy
Our goal is to be the leading supplier of RF tuner, demodulator and receiver technology in our target markets. Key elements of our strategy include:
| • | Focusing on technologies and products where we believe our experience, expertise and patent portfolio provide strategic and competitive advantages; |
| • | Leveraging our systems and support expertise to help our customers design superior performing and cost effective applications and devices; |
| • | Leveraging our core technologies and experience in real-world terrestrial environments to provide silicon solutions for evolving markets, including the automotive entertainment electronics and DTV markets; |
| • | Protecting or increasing our opportunities through expanded relationships with existing or new key partners; |
| • | Continuing to grow revenues and profits in the cable market through innovative product introductions and market share increases; |
| • | Combining our RF IC and automotive systems expertise and established products to expand our presence in the automotive entertainment electronics market as this market transitions from modules to more highly-integrated RF IC solutions; |
5
Table of Contents
| • | Investing in new products, including our demodulator and receiver products, to target the significant long-term opportunities in the DTV market; |
| • | Investing in new products to achieve a higher level of integration of the digital functions necessary for applications in our target markets; and |
| • | Investing in new technologies to remain competitive in all our target markets to produce more cost-efficient, low power consumption and more highly-integrated products that leverage next-generation technology. |
Organization
To implement our strategy effectively, our systems engineering and marketing teams are organized into three specialties: cable television, automotive entertainment electronics and digital television. Our IC design, product and test engineering, mechanical design, quality, marketing communications, investor relations, sales, finance and accounting, information technology, legal, operations and human resources teams are generally centralized to achieve operational efficiencies.
Markets
The worldwide reliance on the internet; the transition from analog to digital transmission standards for both cable and terrestrial television; the greater use of broadband, mobile and wireless communications; and the growing interrelation of televisions, personal computers, cable communications and the internet, coupled with an end-user desire for mobility, have fostered dramatic changes in business and consumer electronics, broadband communications and automotive entertainment electronics. These drivers have propelled the development of new classes of products and new forms of entertainment and information, based on innovative technologies that deliver better, faster and improved communications.
| • | Cable |
According to In-Stat, there are over 435 million digital cable households worldwide. During the last several years, the worldwide cable industry has evolved from a supplier of analog video programming to a competitive provider of digital voice, data and video services, including ultra high speed telecommunications services, supporting high definition (HD) formats and DVR functionality. In-Stat predicts that over 250 million households will be subscribing to digital video services by 2013.
In order to support these new services, cable service providers continue to invest in new technology and infrastructure, to upgrade their networks to 1 GHz to deliver more channels to consumers; digital and HDTV programming; high-speed data communications; home networking; and two-way interactive services, including digital telecommunications and on-demand services. As a part of this upgrade, cable service providers continue to deploy new classes of digital consumer equipment that allow users to access a range of enhanced services such as:
| • | DOCSIS® 2.0 Modems: Cable modems and Embedded Multimedia Terminal Adapters (EMTAs) can be stand-alone devices or integrated into set-top boxes. DOCSIS® 2.0 cable modems enable high-speed internet service via two-way cable, while EMTAs enable Voice over Internet Protocol (VoIP) for digital phone service; |
| • | DOCSIS® 3.0 Modems and IPTV Set-top Boxes: Cable operators in Japan, Korea, the United Kingdom, the Netherlands, Brazil, the U.S. and Canada have launched new channel-bonded DOCSIS® 3.0 services. As part of the new modems and IPTV set-top box solutions required for these new services, we provide wideband RF tuners, which have been included in CableLabs® DOCSIS® 3.0 certified products. |
| • | CATV Set-top Boxes: Digital interactive set-top boxes serve as the home access point for a number of video services, including HD and standard-definition (SD) digital channels, analog channels and enhanced applications, such as digital video recording and video-on-demand services. In some deployments, the digital interactive set-top box is evolving into a “home gateway,” a multifunctional box designed to serve as the distribution “hub” for home networked video, voice and/or data services. |
6
Table of Contents
The cable industry’s adoption of industry standards, such as CableLabs® standards for DOCSIS® (cable modems) and PacketCable™ EMTAs, as well as support for complementary standards, such as Tru2way™ to enable digital set-top box functionality in television sets, has served as an additional catalyst to fuel the deployment of enhanced broadband services. These standards are designed to ensure interoperability between different manufacturers’ customer premise equipment and cable infrastructure (headend) equipment products. They have stimulated a number of vendors to develop cost-effective, non-proprietary products that can operate efficiently and harmoniously in cable environments. New versions of the DOCSIS standard, DOCSIS® 3.0 and Euro DOCSIS® 3.0 are designed to achieve data communications speeds of 160 Mbps downstream and 120 Mbps upstream, or higher, via the cable network. Earlier versions of the standards only supported 30 to 40 Mbps in each direction. DOCSIS 3.0 cable modems require multiple and/or specialized cable tuners as well as a new generation of high performance upstream amplifiers. This new standard enables cable operators to offer a more competitive, new class of ultra high speed telecommunications and business services. According to projections from Infonetics Research, total worldwide DOCSIS 3.0 cable subscribers are projected to exceed 20 million within the next 4 years.
We provide tuners and amplifiers for cable modems, EMTAs and set-top boxes, which support the two-way transmission of data to and from the consumer and the cable operator’s headend. Multiple tuners are increasingly implemented in cable set-top boxes to support simultaneous viewing of one channel while recording a second channel using a DVR, on-demand services and internet access.
Historically, we have seen the demand for our products in the cable market follow a seasonal pattern, with the highest demand occurring during our fiscal second quarter and the lowest demand occurring during our fiscal fourth quarter resulting in a sequential decrease in net revenue from our fiscal third quarter. This seasonal pattern has also influenced our total net revenue since our net revenue from the cable market has historically represented the majority of our total net revenue.
| • | Automotive Entertainment Electronics |
Technology convergence and integration is beginning to impact the automotive industry. In the automotive entertainment electronics market, for example, low-cost communications, navigation, information and entertainment technologies are combining with traditional in-car display and audio systems to create new applications and potential new markets for in-car systems. Driven by consumer demand, new applications are rapidly evolving beyond the conventional car audio system to include digital sound systems, digital radio, such as DAB and HD radioTM , and a suite of applications that allow passengers to watch digital television and video and play interactive games. These newer applications are expected to gain greater consumer acceptance during the next decade, driving continued market opportunity for providers of these products and services and for suppliers of the underlying technology.
Currently, the majority of our products sold into the automotive entertainment electronics market are utilized in car televisions and AM/FM radios, primarily for European end markets. Demand for car television and newer digital radio is expected to grow rapidly as automakers offer a range of systems in more vehicles, moving from luxury cars into mid-priced models.
Data delivered via RF communications is integral to these emerging automotive entertainment electronics applications, and we provide enabling technology, including AM/FM tuners, digital radio front-ends, antenna amplifiers and in-car television tuners, which are incorporated into automotive entertainment electronics subsystems to support these applications. Currently, we are supplying module-based tuner products for radio applications and both silicon and module-based tuner products for in-car television and antenna amplifier applications. We recently announced silicon products for radio applications and expect the transition to silicon products within this market to take several years, in part due to very long design cycles.
7
Table of Contents
| • | Digital Television |
The worldwide transition to digital technologies represents a massive technology transformation. According to estimates by Informa and other market research firms, the number of households with digital television will approach 500 million in 2010. On-going digital transitions throughout the world suggest robust demand for integrated DTV sets and set-top boxes for the next 3 to 5 years. As originally conceived, the idea of digital television was to deploy improved bandwidth efficiency techniques to provide either a picture with much greater detail (e.g. HDTV) than that provided by an analog channel, or to provide multiple digital video streams within the bandwidth of an existing analog channel. Any digital data, from digital video and audio to packetized internet data, can be broadcast using digital transmission.
The definition of terrestrial ‘digital television’ is determined by standards adopted by various countries. For fixed terrestrial reception, the Advanced Television Systems Committee (ATSC) standard is deployed primarily in North America and the Digital Video Broadcast—Terrestrial (DVB-T) standard is implemented in Europe and other parts of the world. Japan and Brazil have adopted the Integrated Services Digital Broadcast—Terrestrial (ISDB-T) standard for digital terrestrial broadcast. China has recently taken steps to unify its domestic digital television schemes under the GB20600-2006 standard, also known as Digital Terrestrial Multimedia Broadcast (DTMB) or China Terrestrial Television Broadcast (CTTB). In some cases, these same standards may also be suitable for and/or provide modes for mobile terrestrial reception, although there may also be separate standards for mobile reception (e.g. DVB-H in Europe, CMMB in China).
We provide tuners and demodulators used for the reception, tuning and processing of RF and digital signals for DTV products. Historically, DTV customers have relied on subsystem module tuners for the RF front-end, either produced internally by the customer or purchased from a third-party. We expect DTV manufacturers will transition to next-generation silicon tuner technology in the future due to cost, size and performance advantages as compared to subsystem module tuners and expect the complete transition from subsystem module tuners to silicon tuners to take several years.
Products
The applications or devices associated with the cable, automotive entertainment electronics and DTV markets require levels of performance specific to various industry standards, power efficiency, functionality and integration, which must all be delivered with a low overall solution cost. Our products are engineered to address the complex, high-performance RF requirements of broadband transmission and reception and the high performance requirements of video demodulation and decoding of broadcast signals.
We classify our products into two types: integrated circuit products or ICs (also referred to as “silicon”) and subsystem-level RF solutions (called “modules”).
| • | Integrated Circuit Products |
We offer a product portfolio that includes:
MicroTuner Single-Chip Broadband Tuners
Our principal products are our single-chip MicroTuner IC tuners. In 1999, we introduced the world’s first broadband television tuners with all active components implemented in a single microcircuit. We believe our MicroTuner chips are among the few single chip IC television tuners in high volume production today that incorporate all of the active elements of a RF broadband tuner, including low-noise and intermediate frequency amplifiers. Our MicroTuner chips are based on both a patented architecture and multiple patented integrated circuit implementations.
8
Table of Contents
Silicon Amplifiers
We offer a family of amplifiers, including upstream amplifiers, Intermediate Frequency (IF) amplifiers and broadband antenna amplifiers, which can be used as companion products to our single-chip tuners, or used separately. These products enable or support a variety of specialized functions, including high-speed upstream cable communications and the distribution of a broadband signal across multiple tuners. Our silicon amplifiers support these functions by conditioning signals within the RF front-end and boosting them for distribution through a system. The amplifiers also enable two-way communications capability in cable access applications and provide downstream amplification in automotive radio and in-car television applications.
Silicon Demodulators
We offer a family of demodulators that can be used in standalone end products or as companion products to our single-chip tuners. These products represent the next component in the receiver chain after the tuner and take a single RF analog channel from the tuner and convert that signal into a digital stream that can be fed into the display electronics of a television, set-top box or PC. Our products support these functions for different broadcast standards through efficient and proprietary architectures and algorithms.
MicroCeivers
We offer a very small, low-cost technology platform, named MicroCeiver™, that is the foundation for our next-generation of highly integrated receiver products for the digital TV and cable markets. Products based on this platform offer a complete RF-to-baseband solution by combining our RF analog tuner and demodulator technologies as an integrated system in a single chip. The MicroCeiver technology is engineered to provide the building-block architecture for a new family of fully-integrated, front-end receivers, that will bring low cost, miniature footprints and excellent signal reception quality to manufacturers creating next-generation digital televisions, set-top boxes, cable entertainment hubs and IP video electronics.
MicroDigitizers
We offer a new, highly integrated product called the MicroDigitizer™, that is the foundation for our next-generation products for the cable and automotive entertainment electronics market. This product combines the functions of a RF tuner and an advanced analog-to-digital converter in a single miniature chip. The MicroDigitizer is a multi-standard, automotive-grade RF-to-digital converter optimized to work with generic, high-performance digital signal processors (DSPs) and multimedia processors enabling manufacturers to create next-generation car radio applications using software defined radio (SDR) solutions. The MicroDigitizer technology is characterized by very high RF-to-bits performance, a high level of integration, low cost and very low profile and is designed to offer a global platform, increased design flexibility, substantial cost efficiencies and a migration path to new standards and enhanced features.
| • | Subsystem-Level RF Solutions |
Our subsystem-level products, called modules, are RF tuners that are pre-assembled into tested, production-ready RF front-ends. Our subsystem solutions are available for multiple applications, including analog and digital car radio, analog and digital in-car television, in-flight entertainment, automotive antenna amplifiers and cable system headend upconverters.
Some of our subsystem-level products contain our own IC components, which we believe provides a competitive advantage through high levels of functional integration. Our modules are pre-configured and pre-tested for ready placement on motherboards, printed circuit boards or chassis.
See Item 7., “Management’s Discussion and Analysis of Financial Condition and Results of Operations” for discussion of net revenue by product type.
9
Table of Contents
Technology, Intellectual Property and Research and Development
We were founded in 1996 on a commitment to RF IC innovation. We have an established track record of introducing advanced products that address emerging markets and serve customers in existing markets.
As of December 31, 2009, we had 174 technical personnel. Our technical team represents one of our most important strategic and competitive assets. Our team, comprised of RF, analog and digital IC, systems, and product and test engineers and technicians, enables us to produce differentiated RF IC and subsystem module solutions for applications in our targeted markets. Team members are located in our design centers in Plano, Texas; Plantation, Florida; Boulder, Colorado; San Jose, California; Shanghai, China and Ingolstadt, Germany.
We believe we have a strong intellectual property portfolio, which is of vital importance to our business as many of our competitors are larger, more diversified companies with substantially greater financial resources. Our ability to protect our proprietary innovations from exploitation by our competitors is crucial to our future success. We have in the past and will continue to vigorously pursue and maintain protection for the proprietary technology used in our products. Currently, we hold over 90 issued United States utility patents and have more than 30 additional United States patent applications pending. Our issued United States patents begin to expire in 2015. Our patents generally cover various aspects of our RF and analog technologies at the broad architectural, circuit and building-block levels.
See Part IV, Item 15., “Exhibits, Financial Statement Schedules” for our patent license agreement with Broadcom Corporation.
Our research and development expenses were $28.5 million, $25.9 million and $23.7 million for 2009, 2008 and 2007, respectively. Of these amounts, stock-based compensation expense comprised $2.2 million, $1.9 million and $2.4 million, respectively. Currently, we internally sponsor all of our research and development activities except for certain third-party technology that is used in our demodulator products. See “Risk Factors” in Item 1A. below. See Item 7., “Management’s Discussion and Analysis of Financial Condition and Results of Operations” for a discussion of research and development expenses.
Sales and Marketing
As of December 31, 2009, our worldwide sales organization consisted of 39 employees with offices located throughout the United States: Plano, Texas; Duluth, Georgia; Irvine, California; San Jose, California and Raleigh, North Carolina, and in regional centers around the world: Ingolstadt, Germany; Taipei, Taiwan; Tokyo, Japan; Seoul, South Korea; Shenzhen, China and Basingstoke, United Kingdom. Our sales organization consists of technical sales, service and customer support professionals and includes a field application engineering staff that is involved with customers during various phases of design and production. The field applications engineering function, located throughout our worldwide sales offices, is a critical element in achieving customer design wins. We also provide customers with application engineering support from our systems engineering personnel based in Plano and Ingolstadt.
We centralize and manage sales for all of our products across each of our target markets under one worldwide sales organization. We primarily sell our products directly to our customers and to a lesser extent via a network of distributors and independent sales representatives located around the world.
Historically, revenues from international markets have represented the majority of our total revenues. See Item 1A., “Risk Factors” for a description of this risk and other risks. See Note 14, “Geographic Information and Significant Customers” to the Notes to Consolidated Financial Statements for a discussion of financial information by geographic area.
Backlog
Our sales are made primarily pursuant to standard purchase orders for delivery of products. Industry fluctuations in the supply and demand balance for component parts result in frequent and potentially significant
10
Table of Contents
changes in the lead times provided by our customers when placing purchase orders. In addition, our standard terms and conditions typically provide that our customers may cancel orders scheduled to ship outside 90 days and reschedule orders that are scheduled to ship outside 30 days. Although our backlog at the beginning of a quarter represents a significant portion of the net revenue we anticipate for that quarter, we do not believe that backlog is a reliable indicator of future revenue levels.
Customers
We market and sell our ICs and subsystem module solutions directly to OEMs, ODMs and their suppliers who sell devices or applications to consumers, other OEMs or service providers (cable) within the cable, DTV and automotive entertainment electronics markets. The devices or applications that our customers produce include cable television set-top boxes; DOCSIS®-based, high-speed voice and data cable modems; car audio, television and antenna amplifier systems; and digital/analog television systems, including HDTV and PC/TV multimedia products. We also market and sell to third-party manufacturers and to distributors who sell directly to OEMs and ODMs. We engage with customers at multiple levels within their organizations, provide design and systems services and applications engineering support, and align our product roadmaps to meet their product requirements.
We supplied our ICs and module products to more than 50 customers or their contract manufacturers worldwide during 2009, including the following:
Cable: Advanced Digital Broadcast, ARRIS, Cisco, Hitron, Humax, Motorola, Pace, Panasonic and Samsung.
Automotive Entertainment Electronics: Delphi Delco Electronics (formerly Fuba), Harman Becker Automotive Systems, Hirschmann Car Communications, Lear Automotive, Magneti Marelli, Panasonic Automotive Systems and Pilkington.
Digital Television: Geniatech, Hauppage, Innortech, Kinvon, Pace, Samsung, TiVo, Winstar and Yuan.
See Item 7., “Management’s Discussion and Analysis of Financial Condition and Results of Operations” for a discussion of net revenue from significant customers and Item 1A., “Risk Factors” for a description of risks associated with our significant customers.
Manufacturing
We use subcontractors for IC wafer production, die packaging and testing. This allows us to eliminate the high capital requirements of owning and operating semiconductor fabrication, packaging and test facilities. It also enables us to focus on the design of our IC products as well as providing engineering support to our customers, where we believe we have the best opportunity to create and maintain a competitive advantage.
We have established relations with IC wafer foundries, IBM, TowerJazz, TSMC and X-FAB, to help ensure our future demands are in line with their manufacturing technology roadmaps and capacities. These foundries offer mature BiCMOS and advanced CMOS production processes. In addition, IBM and TowerJazz offer silicon germanium (SiGe) process technology. Our reliance on third-party suppliers involves risks such as reduced control over delivery schedules, quality assurance and fabrication costs and the risk of material supply disruptions. See Item 1A., “Risk Factors” for a description of risks associated with reliance upon third-party suppliers.
We use Amkor in South Korea and in the Philippines, ASE in South Korea, Cirtek Electronics in the Philippines and SPIL in China for IC packaging and final test. We use Criteria Labs in Austin, Texas for wafer probe and in Penrose, Colorado for tape and reel packaging. We also use ISE in Austin, Texas for wafer probe. We also perform RF testing at our facility in Plano, Texas. Our reliance on these subcontractors and on certain third-party test equipment manufacturers involves risks such as reduced control over delivery schedules, quality assurance and other related costs. See Item 1A., “Risk Factors.”
11
Table of Contents
During 2005, we entered into a five-year Manufacturing Agreement with Ionics EMS, Inc. (Ionics), a leading provider of electronics manufacturing services in the Philippines. This agreement will expire in May 2010. We are exposed to manufacturing risks as a result of our dependence on a single manufacturing facility and a single sub-contractor for our subsystem module solutions. In 2009, approximately 19% of our total net revenue was derived from the sale of our module products that were primarily manufactured by Ionics. See Item 1A., “Risk Factors.” We also use Katek in Germany to build a small portion of our RF module products.
We place orders with our suppliers based on forecasts of customer demand and, in some instances, we may establish buffer inventories to accommodate anticipated customer demand for our products. See Item 1A., “Risk Factors.”
Competition
The semiconductor industry, in general, and the markets in which we compete, in particular, are intensely competitive and are characterized by rapid technological change, increasing degrees of component integration, evolving industry standards and price erosion. Many of our competitors are larger, more diversified companies with substantially greater financial resources. Some of our competitors are also customers who have internal IC and RF subsystems design and manufacturing capability. We also compete with smaller, emerging companies whose strategy is to sell products into specialized markets or to provide a portion of the products or product capabilities that we offer. We expect competition to continue to intensify as current competitors expand their product offerings and new competitors enter our markets.
Although the specific basis on which we compete varies by market, we believe that the principal factors common to all our markets are:
| • | Conformity to industry standards; |
| • | Performance improvements; |
| • | Price reductions; |
| • | Power consumption; |
| • | Differentiating product features; |
| • | Time-to-market for new products; |
| • | Quality and reliability; |
| • | Application engineering support; and |
| • | Adaptability and flexibility to meet customers’ and target markets’ requirements. |
Cable
Our competitors in the cable market include Alps, Anadigics, Broadcom, Entropic, Maxlinear, NuTune, NXP Semiconductors and Samsung Electro-Mechanics.
Automotive Entertainment Electronics
Competitors in the automotive entertainment electronics market include Alps, Atmel, DiBcom, Maxim, Maxlinear, NXP Semiconductors and STMicroelectronics.
Digital Television
Our competitors in the digital television market include Alps, Maxlinear, NuTune, NXP Semiconductors, Silicon Labs, Xceive, Xuguang, as well as the captive tuner divisions of all the major consumer brands, including Konka, LG, Panasonic, Samsung Electro-Mechanics, Sanyo, Sharp, Sony and Toshiba. Our demodulator
12
Table of Contents
competitors in the digital television market include vendors of dedicated silicon demodulators including Altobeam, Guoxin, HDIC, Legend Silicon, LG, MaxScend, NXP Semiconductors, Silicon Labs, SONY, STMicroelectronics and Trident, as well as vendors of DTV or set-top box systems on a chip (SOCs) that integrate silicon demodulator functions inside these SOCs, including Mediatek/MTK, MorningStar/Mstar, Renesas, Sanyo, STMicroelectronics and Zoran.
Environmental Matters
International, federal, state and local requirements relating to the discharge of substances into the environment, the disposal of hazardous wastes and other activities affecting the environment may have an impact on our operations. We believe that we are in material compliance with applicable environmental laws and regulations. To date, compliance with environmental requirements and resolution of environmental claims has been accomplished without material effect on our liquidity or capital resources.
Beginning in July 2006, our product shipments into certain regions of the world were required to conform to the European Union’s directive for the restriction of certain hazardous substances (RoHS) in electrical and electronic equipment. All of our silicon products and applicable subsystem module solutions are currently RoHS-compliant. See Item 1A., “Risk Factors.”
Employees
As of December 31, 2009, we had a total of 276 employees worldwide, including 174 in research and development, 39 in sales and marketing and 63 in operations, finance and administration. Of these employees, 134 were located in the United States.
| ITEM 1A. | RISK FACTORS. |
Our success depends on the growth of the cable, automotive entertainment electronics and DTV markets generally, the demand for our products within these markets specifically and the success of our customers.
We derive our revenue from sales of our products into cable, automotive entertainment electronics and DTV applications or devices within the cable, automotive entertainment electronics and DTV markets. These markets are characterized by:
| • | intense competition; |
| • | rapid technological change; |
| • | long design cycles; and |
| • | short product life cycles, especially in the PC and consumer electronics markets. |
The cable, automotive entertainment electronics and DTV markets may not grow in the future as anticipated or a significant market slowdown may occur. Further, demand for applications or devices that include our products or are targeted by our products, in particular, cable television set-top boxes; high-speed voice and data cable modems; car audio, television and antenna amplifier systems; integrated digital televisions, including high-definition televisions; digital-to-analog converter boxes; and PC/TV multimedia products may not grow at a rate sufficient for us to sustain profitability, or our customers’ market share may decline, even though demand in general is high, which would also adversely affect our financial results. Because of the intense competition in the cable, automotive entertainment electronics and DTV markets, the unproven technology of many products addressing these markets and the short product life cycles of many consumer applications and devices, it is difficult to predict the potential size and future growth rate of the markets for our products. In addition, the cable, automotive entertainment electronics and DTV markets are transitioning from analog to digital standards, as well as expanding to new services, such as interactive television, portable television and on-demand services. The future growth of our product markets is dependent upon market acceptance of our customers’ applications and
13
Table of Contents
devices that incorporate our technologies and address the cable, automotive entertainment electronics and DTV markets, and we cannot assure you that our customers’ products and consequently, our underlying technologies, will be accepted by any of the end customers in these markets. If the demand for our products is not as great as we expect, if we are unable to produce competitive products to meet that demand or if we are otherwise unable to capitalize on market opportunities, we may not be able to generate revenue growth or profitability.
The current economic slowdown has negatively impacted our business. A delay in economic recovery could have a negative impact on our business, potentially resulting in additional significant operating losses and a decrease in our net cash position. Cost control activities may not be as successful as planned and reduced product development and customer design activity levels could result in decreased long-term business prospects.
The current economic slowdown is affecting all of our target markets and it is difficult to estimate the duration and significance of the slowdown and the resulting negative impact on our business. Our ability to manage expenses to a level commensurate with reduced business levels is difficult given our reduced visibility and the fixed nature of certain expense categories. Furthermore, due to the vital importance of research and development activities to our future product development, it could be difficult to reduce our research and development spending materially without jeopardizing our current position as an RF technology leader. Consequently, our efforts to control and reduce expenses may not be enough to maintain profitability, and we may incur significant operating losses and use a portion of our cash reserves.
The negative impact on operating results may preclude us from paying cash incentive compensation which could negatively affect employee morale. We may also see a continued negative impact on our stock price, significantly reducing or eliminating the financial benefit of long-term equity incentives, which could also negatively affect employee morale and impact our efforts at employee retention.
We are dependent on our D&O insurance carriers for the reimbursement of certain ongoing and substantial legal expenses incurred by certain former officers of the Company who are involved in litigation with the SEC related to its investigation into our historical stock option granting practices. Currently, approximately half of our $20 million policy has been consumed by the defense of these individuals. Should the remaining coverage be exhausted, our financial results could be materially and adversely affected.
The exhaustion of our D&O insurance coverage could materially and adversely affect our results of operations and financial condition. Through December 31, 2009, we have received cumulative reimbursements of $9.4 million and have a receivable of $1.4 million for amounts expected to be reimbursed by our directors’ and officers’ liability insurance carriers.
We depend on several significant customers for a substantial portion of our revenue. If we lose business from a significant customer, or if any of our significant customers lose market share in the markets in which they compete, our results would be significantly adversely affected.
We have historically derived a substantial portion of our revenue from sales to a relatively small number of significant customers and we expect this trend to continue. The loss of any significant customer would significantly harm our revenue. Net revenue from customers, including sales to their respective manufacturing subcontractors, exceeding 10% of net revenue was as follows:
| Year Ended December 31, | |||||||||
| 2009 | 2008 | 2007 | |||||||
| Cisco |
29 | % | 29 | % | 32 | % | |||
| Unihan (1) (2) |
14 | % | 13 | % | 18 | % | |||
| Panasonic |
13 | % | 12 | % | * | ||||
| Samsung |
10 | % | * | * | |||||
| Ten largest customers |
86 | % | 85 | % | 82 | % | |||
14
Table of Contents
| (1) | Primarily for the benefit of ARRIS Group, Inc. |
| (2) | A wholly-owned subsidiary of Asustek Computer |
| * | Less than 10% of total net revenue |
In light of uncertain economic recovery, our significant customers may curtail certain research and development spending which could impact the deployment of our latest generation products, which are designed to replace older technology products. A decision by any of our significant customers to curtail certain research and development spending could have a material adverse effect on our business, results of operations and future prospects.
Further, several existing and potential customers have substantial internal technological capabilities and could develop products internally that compete with or replace our products. A decision by any of our significant customers to internally design and manufacture products that compete with our products could have a material adverse effect on our business, results of operations and future prospects.
We believe that our future results of operations will continue to depend on the success of our significant customers, on our ability to sell existing and new products to these customers in significant quantities and without significant price erosion and on our ability to diversify our customer base. To attract new customers or retain existing customers, we may offer certain customers very attractive prices on our products, which could impact our overall pricing strategy. In that event, our average selling prices and gross margins would decline. Uncertain economic recovery could cause our customers to ask for greater pricing concessions. The loss of a significant customer, a reduction in sales to any significant customer or a significant decrease in our sales prices made to retain a significant customer would adversely impact our revenue and consequently our results of operations and financial condition.
We generate the vast majority of our net revenue and income from the cable market. Market specific risks affecting the cable market could result in significantly decreased net revenue and income.
We face significant competition from other module and silicon tuner suppliers as we compete for business with certain key set-top box and high-speed cable modem manufacturers. Protecting our share of this market and our ability to capture future growth opportunities in this market will depend on our ability to develop products that anticipate the needs of our customers, develop products in the timeframes required by our customers, and develop products at a cost that is attractive to our customers. If we are not successful, we may lose share of this market, or potentially lose a significant customer, which would have a material adverse effect on our financial condition and results of operations.
Our customers in the cable market face significant competition from other set-top box and high-speed cable modem manufacturers as they target the business of key cable service providers on a global basis. We also rely on our customers’ abilities to develop products that meet the needs of the cable service providers, in terms of functionality, performance, availability and price. If our customers do not successfully compete, they may lose market share, which would negatively impact our financial condition and results of operations.
Cable service providers face significant competition from communications carriers (including, in many cases, traditional telecommunications companies) and satellite service providers as they compete for customers in terms of video, voice and data services. We are also dependent on the ability of the cable service providers to effectively compete against communications carriers and satellite service providers. If the cable service providers do not successfully compete, they may lose market share, which would have a material adverse effect on our financial condition and results of operations.
15
Table of Contents
Market specific risks affecting the iDTV, PC/TV and television peripheral market segments of the DTV market could impair our ability to compete successfully in that market.
The market for DTV applications in iDTVs, PC/TVs and television peripherals is characterized by various market-specific risks, any of which may adversely affect our ability to compete in that market.
Examples of market-specific risks affecting these market segments include:
| • | the risk that module products that offer the same or similar functionality as our silicon solutions will continue to be used by OEMs and will be viewed as more attractive by our current and potential customers, including the use by our potential customers of “captive” module suppliers due to more favorable economic terms; |
| • | the risk that module products that offer the same or similar functionality as our silicon solutions will be sold at lower prices than our silicon solutions; |
| • | the risk that silicon products that offer the same or similar functionality as our silicon solutions will be sold at lower prices than our silicon solutions by competitors willing to accept lower gross margins to obtain design wins; |
| • | the risk that complex DTV or STB SOCs will integrate the demodulation function and be more readily accepted by the market than our standalone demodulator solutions; |
| • | the risk that the iDTV market will not be as large as anticipated or our share of the market will be lower than anticipated; |
| • | the risk that the terrestrial STB market will not be as large as anticipated or our share of the market will be lower than anticipated; |
| • | the risk that the PC/TV market will not be as large as anticipated or our share of the market will be lower than anticipated; |
| • | the risk that performance requirements for the PC/TV market are less stringent and thereby increase the competitive element in this market; |
| • | the risk that the suppliers of module products who currently sell products to television manufacturers that we are currently targeting with our silicon solutions may lower their prices, including to levels below their cost, in order to protect their existing relationships, thereby making our silicon solutions uncompetitive from a customer cost perspective; |
| • | the risk that we will be unable to develop silicon solutions that meet the performance requirements of our customers; |
| • | risks related to systems integration and other risks, including the timing of open design windows, inherent in the highly complex design-in process of the products designed to address this market; |
| • | the risk that we will not be able to finalize the highly complex design-in process for a particular customer application during the narrow customer design window; |
| • | the risk that module products implementing our silicon solutions will not be selected by potential end customers due to the economics of the entire module solution where other components are unattractively priced; |
| • | the risk that our products will not have the feature set desired by our customers or will not be architecturally compatible with other components in the customers’ designs; |
| • | the risk that an influx of entrants into the DTV market due to the transition to all digital broadcasts will accelerate average selling price erosion; and |
| • | the risk that multi-standard, multi-band, universal television solutions will be preferred by DTV manufacturers and our multi-standard, multi-band, universal television products may not meet performance expectations or be available in the necessary timeframe. |
16
Table of Contents
Our efforts to penetrate the DTV market, in particular, will depend on our ability to overcome the challenges described above and upon eventual acceptance of our new DTV products. To the extent our efforts are adversely affected by any of these risks or are otherwise unsuccessful, we could experience a material adverse effect on our business prospects, financial condition and results of operations.
We operate in an intensely competitive business and many of our competitors have significantly greater resources and operating flexibility, which allow them to compete effectively against us in existing markets and may affect our ability to enter or effectively compete in new markets.
The markets in which we compete are intensely competitive and are characterized by rapid technological changes, increasing degrees of component integration, evolving industry standards and price erosion. We cannot assure you that we will be able to compete successfully against current or new competitors. This competition has resulted and may continue to result in declining average selling prices for our products and a corresponding reduction in our ability to recover research and development and manufacturing costs. We expect competition to continue to increase as industry standards become well known and as other competitors enter our target markets. We compete with, or may in the future compete with, a number of major domestic and international suppliers of integrated circuit and system modules in the cable, automotive entertainment electronics and DTV markets. In most cases, we compete directly against system module solutions or against other integrated circuit module substitute products similar to our own. In some cases, our product is used inside a system module, in which case we compete against a large number of IC solutions providing various levels of integration. Companies providing system module solutions against whom we compete include captive and non-captive module suppliers such as Alps, Mitsumi, Panasonic Electronic Devices, Samsung Electro-Mechanics, Sanyo, Sharp, Sony, Toshiba and TTE. Integrated circuit companies against whom we compete for designs within system modules or compete for discrete designs intended to replace system modules include Anadigics, Broadcom, Entropic, Maxim, Maxlinear, NuTune, NXP Semiconductors and Xceive. Average selling prices for products offered by competitor tuner module manufacturers continue to erode substantially, causing our silicon product offerings to be less attractive to potential customers and further limiting our design win opportunities, especially in the DTV market.
Many of our current and potential competitors have advantages over us, including:
| • | longer operating histories and established market positions in key markets; |
| • | greater name recognition; |
| • | access to larger customer bases; |
| • | significantly greater financial, sales and marketing, manufacturing, distribution, management, technical and other resources; |
| • | existing relationships with potential customers as a result of the sales of other components, which can be leveraged into sales of products competitive with our products; |
| • | existing relationships with partners in joint ventures or investing activities, which can be leveraged into sales of products competitive with our products; and |
| • | broader product and service offerings that may allow them to compete effectively by bundling their tuner products with their other products and services, by legal or illegal means. |
As a result, our competitors may be able to adapt more quickly to new or emerging technologies and changes in customer requirements and may be able to devote greater resources to the development, promotion and sale of their products which may harm our current market position and impact our ability to enter or compete effectively in new markets. If we do not compete successfully, we may lose market share of our existing markets, our gross margins may fail to increase or may decline, and we may experience other material adverse effects on our business, financial condition and results of operations.
17
Table of Contents
Our success is highly dependent on our relationships with our strategic IC partners.
Our RF products are designed to be interoperable with various specific demodulator integrated circuit products that are designed and manufactured by other companies. Historically, we have relied on informal strategic relationships with various demodulator manufacturers to enable both parties to offer an interoperable tuner/demodulator solution to our mutual end customers. Although we work in concert with our third-party demodulator partners to complete highly functional reference designs, we have no control over our partners’ future product plans and product roadmaps and could be effectively designed out of future customer applications by the refusal of a demodulator partner to continue to support our products. Likewise, our ability to acquire new customers is highly dependent on the cooperation of third-party demodulator manufacturers. If such third-party manufacturers decide to partner with our competitors or to provide their own tuner solution, we would effectively be prevented from selling our products to potential new customers. Additionally, if a strategic third-party demodulator partner lacked the technical resources or expertise to complete a reference design in a timely fashion, we may lose an opportunity with a customer even though our tuner product was completed on time and was a compelling product to the customer. Furthermore, our dependence on these third-party demodulator manufacturers often limits the strategic direction of the company. If we were to design products that were competitive with any of such demodulator manufacturers, they may choose to stop working with us. Our recent acquisition of Auvitek, a supplier of advanced DTV demodulator ICs, may negatively impact our relationships with our demodulator partners. Additionally, certain of our demodulator partners may become insolvent in the current economic environment. We often partner with companies that provide demodulation and/or decoding ICs for our mutual customers or partner with captive divisions within our customers. These partners have included AMD, Guoxin, Mediatek, Micronas, Realtek, STMicroelectronics, Trident, Texas Instruments and Zoran.
If any of our current or prospective demodulator partners were to stop working with us in favor of other tuner manufacturers or in favor of deploying their own tuner products or were to go out of business, we would be effectively designed out of current and potential customers’ products and this could have a material adverse effect on our business, results of operations and our future prospects.
If we do not offer a competitive solution for applications where competitors offer integrated tuner/demodulator products, we may lose significant market share to our competitors.
If we cannot offer an attractive solution for applications where our competitors offer fully integrated tuner/demodulator products, we may lose significant market share to our competitors. Certain of our competitors have fully integrated tuner/demodulator solutions targeting high performance cable or DTV applications, and thereby potentially provide customers with smaller and cheaper solutions. We recently announced an integrated tuner/demodulator solution for DTV applications and currently rely on strategic demodulator partners for cable applications.
The average selling prices of our products will likely decrease over time. If the selling price reductions are greater than we expect, or if we are unable to effectively counter average selling price erosion through product cost reduction, our results of operations may be adversely affected.
Historically, the average selling prices of our products have decreased over their lives. In addition, as the markets for RF integrated circuit, demodulator and module products continue to mature, we believe that it is likely that the average unit prices of our products will decrease in response to competitive pricing pressures, increased sales discounts, new product introductions, competitive product bundling and a transition in our markets from higher priced module products to lower priced integrated circuits. In addition, uncertain economic recovery could cause our customers to ask for greater pricing concessions in response to pricing pressure from their end customers. To offset these decreases, we expect to primarily rely on achieving manufacturing cost reductions for existing products and introducing new products with higher levels of integration and greater performance that can be sold at higher average selling prices.
18
Table of Contents
Although we will seek to increase the sales of our higher margin products, our sales and product development efforts may not be successful and our new products may not achieve market acceptance. In addition, our new higher margin products may not be attractive to our customers to the extent that greater levels of performance and integration are not demanded by their end customers due to the current economic crisis. To the extent we are unable to reduce costs or sell our higher margin products, our results of operations may be adversely affected.
If we do not complete our design-in activities before a customer’s design window closes, we will lose the design opportunity, which could have a material adverse impact on our business, results of operations and future prospects.
The timing of our design-in activities with key customers and prospective customers may not align with their open design windows, which may or may not be known to us, making design win predictions more difficult. It may be difficult for us to determine our customers’ design window timing. If we miss a particular customer’s design window, we may be forced to wait an entire year or even longer for the next opportunity to compete for the customer’s next design. Because the timing of our design-in activities with key customers and prospective customers are not always aligned with these customers’ open design windows, it is extremely difficult for us to make design win predictions. Any failure to complete a design-in during a customer’s design window may eliminate or substantially delay revenues from certain target customers and markets, which could have a material adverse effect on our business, results of operations and future prospects.
Other solutions for the cable, automotive entertainment electronics and DTV markets compete with some of our solutions. If these solutions prove to be more reliable, faster, less expensive or more popular than our solutions, the demand for our products and our revenue may decrease.
Some of our target market segments, such as cable modem and cable telephony services, are competing with a variety of non-RF based broadband communications solutions, including digital subscriber line (DSL) technology and certain fiber to the home solutions. Many of these technologies compete effectively with cable modem and cable telephony services and do not require RF tuners like the ones that we sell. If any of these competing technologies are, or are perceived to be, more reliable, faster, less expensive, able to reach more customers or have other advantages over RF broadband technology, the demand for our products may decrease, which would cause our revenue to decrease accordingly. Also, some of the consumer devices that currently incorporate our products, e.g., televisions, may not use our products in the future. Such changes in device features or functionality could adversely affect our business, results of operations and future prospects.
Industry participants may consolidate or establish financial or strategic relationships, adversely impacting our ability to compete in our markets.
Consolidation by industry participants, such as acquisitions of our customers, suppliers or partners by our competitors, or acquisitions of our competitors by our customers, suppliers or partners, could result in competitors with increased market share, larger customer bases, greater diversified product offerings and greater technological and marketing expertise, which would allow them to compete more effectively against us. Current and potential competitors may also gain such competitive advantages by establishing financial or strategic relationships with existing or potential customers, suppliers or other third parties. These new competitors or alliances among competitors could emerge rapidly and acquire significant market share. In addition, some of our suppliers or partners offer or may offer products that compete with our products. Further, we rely upon some of our partners for certain joint reference design and marketing activities and some of our products are incorporated in some of our partners’ reference designs that are provided to potential customers. Depending on the participants, industry consolidation or the formation of strategic relationships could have a material adverse effect on our business and results of operations by reducing our ability to compete successfully in our current markets and the markets we are seeking to serve.
19
Table of Contents
We expect our quarterly results of operations to continue to fluctuate.
Our quarterly results of operations have fluctuated significantly in the past and we expect such quarterly results to continue to fluctuate significantly in the future due to a number of factors, many of which are not in our control. These factors may include:
| • | unexpected dramatic decreases in customer demand due to the current economic crisis; |
| • | the timing, cancellation and rescheduling of significant customer orders, potentially with short notice periods; |
| • | the ability of our customers to procure the other necessary components for their end-products that utilize our products in order to conduct their operations; |
| • | pricing concessions on volume sales to particular customers for established time frames and our ability to respond to general downward pressure on the average selling prices of our products; |
| • | cyclical or seasonal slowdowns and general downturns in customer demand or related industry-wide increases in inventories; |
| • | our ability to predict our customers’ demand for our products, manage production and inventory levels in response to product life cycles and other factors and minimize the effects of obsolete or excessive inventory; |
| • | design wins and changes in our product and customer mix; |
| • | labor disputes at our subsystem module manufacturer’s facility in the Philippines or at any of our other subcontractors, which may cause temporary slowdowns or shutdowns of operations; |
| • | problems with our products that result in significant returns; |
| • | inadequate allocation of wafer, assembly or test capacity for our silicon products by our subcontractors and/or allocation of components used in our module products by our suppliers; |
| • | inconsistent or non-linear quarterly revenue that may result from our entry into new markets or new consumer products because our customers may have difficulty accurately determining the initial demand for their new products; |
| • | acts of terrorism or military action occurring anywhere in the world; and |
| • | acts of God or force majeure. |
It is likely that our quarterly results of operations will be adversely affected by one or more of the factors listed above, or other factors. If our future results of operations fail to meet the expectations of stock market analysts or investors, the market price of our common stock may decline.
Our research and development efforts are critical to our business and if these efforts are unsuccessful, our business and results of operations will be adversely affected.
Any future success will depend, in large part, upon our ability to develop new products for existing and new markets, our ability to introduce these new products in a cost-effective and timely manner, and our ability to meet customer specifications and convince leading manufacturers to select these new products for design into their new products. Developing new products and improving our existing products requires substantial continuing investments of engineering resources. We have often encountered and continue to encounter difficulties attracting and retaining the highly sophisticated engineering personnel required to timely develop our products and meet our customers’ design windows. In addition, the development of new products is highly complex and, from time to time, we have experienced delays in completing the development and introduction of new products. In addition, some of our new product development efforts are focused on producing silicon products utilizing architectures and technologies with which we have little or no experience, and delivering performance
20
Table of Contents
characteristics, such as low power consumption, at levels that we have not previously achieved. Our success at addressing our target markets will often depend on our ability to co-develop certain integrated products with certain partners. These co-development efforts involve inherently higher development risk and because they involve third-parties, they provide us with less control over the development effort. In addition, some of our past research and development efforts have failed. Successful product development depends on a number of factors, including:
| • | the accuracy of our prediction of emerging market requirements and evolving standards; |
| • | the acceptance of our new product designs by our customers and of our customers’ products by their end customers and consumers; |
| • | the availability of qualified product designers and our ability to attract and retain them; and |
| • | our ability to successfully design, develop, manufacture and integrate new components to increase our product functionality in a timely manner. |
Due to the relatively small size of our product design team, our research and development efforts in our core technologies may lag behind those of our competitors, some of whom have substantially greater financial and technical resources. As a result of these factors, we may be unable to develop and introduce new products successfully and in a cost-effective and timely manner, and any new products we develop and offer may never achieve market acceptance. These failures would have a material adverse effect on our business, financial condition and results of operations.
We are subject to order and shipment uncertainties with respect to our products, and if we are unable to accurately predict customer demand for these products, we may incur excess or obsolete inventory, which would reduce our profit margin, or we may have insufficient inventory, which would result in lost revenue opportunities and potentially in loss of market share and damaged customer relationships.
Our sales are typically made pursuant to individual purchase orders, and we generally do not have long-term supply arrangements with our customers, including our most significant customers, in terms of volume of sales. Our standard terms and conditions (which do not apply to some of our key customers) typically provide that our customers may cancel orders scheduled to ship outside 90 days. Further, our terms typically provide that customers may reschedule orders that are scheduled to ship outside 30 days, but customers typically are restricted to the number of days they can delay the ship date and the number of times that they can reschedule orders. However, we have permitted customers to cancel orders less than 90 days before the expected date of shipment and to re-schedule shipments less than 30 days before the expected date of shipment, with little or no penalty. We currently do not have the ability to accurately predict what or how many products our customers will need in the future. Anticipating demand is difficult because our customers face volatile pricing and unpredictable demand for their own products and are increasingly focused on cash preservation and tighter inventory management. However, we place orders with our suppliers based on non-binding forecasts of customer demand and, in some instances, may establish buffer inventories to accommodate anticipated demand. Our forecasts are based on multiple assumptions, each of which may introduce error into our estimates. If we overestimate customer demand, we may allocate resources to manufacturing products that we may not be able to sell when we expect to, or at all. As a result, we would hold excess or obsolete inventory, which would reduce our profit margins and adversely affect our business and results of operations. Conversely, if we underestimate customer demand or if insufficient manufacturing capacity is available, we would forego revenue opportunities and potentially lose market share and damage our customer relationships. In addition, any future significant cancellations or deferrals of product orders or the return of previously sold products could materially and adversely affect our profit margins, increase product obsolescence and restrict our ability to fund our operations.
21
Table of Contents
The sales cycle for our products is long, and we incur substantial non-recoverable expenses and devote significant resources to sales that may not be realized when anticipated, if at all.
Our customers, and sometimes their customers, typically conduct significant evaluation, testing, implementation and acceptance procedures before they purchase our products. These evaluation processes are frequently lengthy and may range from three months to one year or more. As a result, we expend significant financial and human resources to develop customer relationships before we realize any revenue from these relationships. In fact, we may never realize any revenue from these efforts. In many situations, our customers design their products to specifically incorporate our products, and our products must be designed to meet their stringent specifications. This process can be complex and may require significant engineering, sales, marketing and management effort on our part. This process may also require significant engineering and testing by our customers and, if our customers do not have sufficient capabilities to complete the process, they may become dissatisfied with our products, and our business and results of operations could be materially adversely affected.
We customize a substantial portion of our RF subsystem module products to address our customers’ specific RF needs. If we do not sell our customer-specific products in large volumes, we may be unable to cover our fixed costs or may be left with substantial unsaleable inventory, which could have a material adverse effect on our financial condition and results of operations.
We manufacture a substantial portion of our RF subsystem module products to address the unique needs of our individual customers. Frequent product introductions by systems manufacturers make our future success dependent on our ability to select development projects that will result in sufficient volumes to enable us to achieve manufacturing efficiencies to cover our fixed costs. Because some of our customer-specific RF module products are developed for unique applications, we expect that some of our current and future customer-specific RF module products may never be produced in sufficient volume to cover our fixed costs. In addition, if our customers fail to purchase these customized RF module products from us, we risk having substantial unsaleable inventory, which could have a material adverse effect on our financial condition and results of operations.
A product recall by a major customer could materially adversely affect our business, financial condition and results of operations.
We generally warrant our commercial products for a period of one year, and longer for automotive entertainment electronics products. If a customer experiences a problem with our products and subsequently returns our products to us in large quantities for rework or replacement, the cost to us could be significant and could have a material adverse effect on our business, financial condition and results of operations.
Some of our agreements with our customers contain “line down” clauses, product liability clauses and/or intellectual property warranty and indemnification clauses.
We are currently subject to “line down” clauses in contracts with certain automotive entertainment electronics customers. Such clauses require us to pay financial penalties if our failure to supply product in a timely manner causes the customer to slow down or stop their production. Such penalties could be large and, if incurred, could have a material adverse effect on our financial condition and results of operations. We are also subject to product liability clauses and/or intellectual property warranty and indemnification clauses in some of our customer agreements, and where we do not have agreements, we are subject to such default provisions in the relevant jurisdiction’s embodiment of the Uniform Commercial Code. Such clauses and warranties require us to pay financial penalties if we supply defective product, which results in financial damages to the customer, or to indemnify the customer for third-party actions based on the alleged infringement by our products of a third party’s intellectual property. Such penalties or obligations could be large and, if incurred, could have a material adverse effect on our financial condition and results of operations.
22
Table of Contents
Our inability to maintain or grow revenue from international sales could harm our financial results.
Net revenue from outside of North America was 70%, 68% and 64% for 2009, 2008 and 2007, respectively. We plan to increase our international sales activities by adding international sales personnel, sales representatives or distributors. Our international sales will be limited if we cannot do so. Even if we are able to expand our international operations, we may not succeed in maintaining or increasing international market demand for our products which could have a material adverse effect on our financial condition and results of operations.
A majority of our revenues have historically come from our international customers, and, as a result, our business may be harmed by political and economic conditions in foreign markets and the challenges associated with operating internationally.
Historically, revenues from international markets have represented the majority of our total net revenue. We expect net revenue from international markets to continue to represent the majority of our total net revenue for the foreseeable future. International business activities involve certain risks, including:
| • | difficulties involved in the staffing and management of our geographically dispersed operations; |
| • | longer sales cycles in certain countries, especially on initial entry into a new geographical market; |
| • | greater difficulty evaluating a customer’s ability to pay, longer accounts receivable payment cycles and greater difficulty in the collection of past-due accounts; |
| • | general economic conditions in each country; |
| • | challenges associated with operating in diverse cultural and legal environments; |
| • | seasonal reductions in business activity specific to certain markets; |
| • | loss of revenue, property and equipment from expropriation, nationalization, war, insurrection, terrorism, drug trafficking and other political risks; |
| • | foreign taxes and the overlap of different tax structures, including modifications to the United States tax code as a result of international trade regulations; |
| • | greater difficulty in safeguarding intellectual property; |
| • | foreign technical standards; |
| • | import and export licensing requirements, tariffs, and other trade and travel restrictions; and |
| • | existence or adoption of laws and regulations affecting the operation and taxation of our business and the general business climate for foreign companies. |
To the extent our international sales are adversely affected by any of these risks or are otherwise unsuccessful, we could experience a material adverse effect on our business, financial condition and results of operations.
We extend credit to our customers, sometimes in large amounts, and there is no guarantee every customer will be able to pay our invoices when they become due. At various times, our accounts receivable is concentrated in a few customers.
As part of our routine business, we extend credit to customers purchasing our products. At December 31, 2009, approximately 55% of our net accounts receivable was due from five of our customers. While our customers may have the ability to pay on the date of shipment or on the date credit is granted, their financial condition could change and there is no guarantee that customers will ever pay the invoices.
Because all of our customers do not have the same credit terms, our outstanding accounts receivable balance can become concentrated in a smaller number of customers than our overall net revenue. This concentration can subject us to a higher financial risk and could have a material adverse effect on our business, financial condition and results of operations.
23
Table of Contents
Our customers’ products are subject to governmental regulation.
Governmental regulation could place constraints on our customers and consequently reduce their demand for our products. The Federal Communications Commission, or FCC, has broad jurisdiction over several of our target markets in the United States. Similar governmental agencies regulate our target markets in other countries. Although most of our products are not directly subject to current regulations of the FCC or any other federal or state communications regulatory agency, much of the equipment into which our products are incorporated is subject to direct governmental regulation. Accordingly, the effects of regulation on our customers or the industries in which they operate may, in turn, impede sales of our products. For example, demand for our products will decrease if equipment incorporating our products fails to comply with FCC specifications.
Our dependence on a single manufacturing facility and a single subcontractor for almost all of our subsystem module solutions could jeopardize our operations.
The majority of our subsystem module solutions manufacturing operations are subcontracted to Ionics EMS, Inc. (Ionics) under a manufacturing agreement entered into during 2005. This agreement expires in May 2010. Such operations are conducted at a single facility in Manila, Philippines. In 2009, approximately 19% of our total net revenue was derived from the sale of our module products that were primarily manufactured by Ionics.
We are exposed to manufacturing risks as a result of our dependence on a single manufacturing facility and a single sub-contractor for our subsystem module solutions. Such risks include lack of control over delivery schedules, manufacturing yields, quality and fabrication costs and the risk of material supply disruptions due to labor disputes, terrorism, political unrest, war, process abnormalities, human error, theft, government intervention, or a natural disaster such as a fire, earthquake, or flood. If we encounter any significant delays or disruptions, including those caused by our subcontractor’s inability to procure component parts or supply us with product, we may not be able to meet our manufacturing and testing requirements, which could cause a significant delay in our ability to deliver our products, resulting in losses and potential enforcement of contractual “line down” clauses by our customers, potentially subjecting us to legal expenses and settlement payments. Additionally, our subcontractor could decide not to renew the manufacturing agreement with us, elect to close its production facility or require us to move to another production facility or subcontractor. Any resulting delay could result in increased expense and costs and could have a material adverse effect on our business and results of operations.
We depend on third-party wafer subcontractors to manufacture all of our integrated circuit products, which reduce our control over the integrated circuit manufacturing process and could increase costs and decrease the availability of our integrated circuit products.
We do not own or operate a semiconductor fabrication facility. We primarily rely on IBM, TowerJazz, TSMC and X-FAB, outside subcontractors, to produce most of our integrated circuit products. Our reliance on third-party suppliers involves risks such as reduced control over delivery schedules, quality assurance and fabrication costs and the risk of material supply disruptions. We do not have a long-term supply agreement with our subcontractors and instead obtain manufacturing services on a purchase order basis. Our subcontractors have no obligation to supply products to us for any specific period or in any specific quantity, except as set forth in a particular purchase order. Our requirements, generally, represent a small portion of the total production capacity of these subcontractors, and they may reallocate capacity to other customers even during periods of high demand for our integrated circuits. If our subcontractors were unable or unwilling to continue manufacturing our integrated circuits, our business would be materially adversely affected. In such an event, we would be required to identify and qualify substitute subcontractors, which would be time consuming and difficult, and may result in unforeseen manufacturing and operational problems. In addition, if competition for foundry capacity increases, our product costs may increase, and we may be required to pay significant amounts to secure access to manufacturing services. If we do not qualify or receive supplies from additional subcontractors, we may be exposed to increased risk of capacity shortages due to our dependence on IBM, TowerJazz, TSMC and X-FAB. In addition, the processing of our IC products is specific to the manufacturing processes of a given supplier and
24
Table of Contents
substantial lead-time would be required to move the specific product to another supplier, if it were possible at all. Although we have begun using TowerJazz as an alternate source for certain of our IC products, there can be no assurance that the establishment of an alternate manufacturing source would successfully mitigate the risks identified above.
We depend on third-party subcontractors for integrated circuit probing, packaging and testing, which reduces our control over these processes and could result in increased costs and decreased availability of our integrated circuit products.
Our integrated circuit products are probed, packaged, and/or tested by independent subcontractors, including Amkor, ASE, Cirtek Electronics, ISE, SPIL and Criteria Labs, using facilities located in South Korea, Philippines, China and the United States. We do not have long-term agreements with these subcontractors and typically obtain services from them on a purchase order basis. Furthermore, our subcontractors are dependent on certain third-party test equipment manufacturers. Our reliance on these subcontractors and on certain third-party test equipment manufacturers involves risks such as reduced control over delivery schedules, quality assurance and costs. These risks could result in product shortages or increase our costs of probing, packaging and testing our products. If these subcontractors are unable or unwilling to continue to provide probing, packaging and testing services of acceptable quality, at acceptable costs and in a timely manner, it could have a material adverse effect on our business. In such an event, we would be required to identify and qualify substitute subcontractors, which could be time consuming and difficult and may result in unforeseen operational problems.
If our customers do not qualify our products or the manufacturing lines of our third-party suppliers for volume shipments, our revenue may be delayed or reduced.
Some customers will not purchase any of our products, other than limited numbers of evaluation units, prior to qualification of the manufacturing lines for the product. We may not always be able to satisfy the qualifications. Delays or failure to qualify can cause a customer to discontinue use of our products and result in a significant loss of revenue. If we change third-party suppliers, customers may require us to qualify the new supplier’s facility, or a product manufactured by that facility.
We believe that transitioning our silicon products to newer or better manufacturing process technologies will be important to our future competitive position. If we fail to make this transition efficiently, our competitive position could be seriously harmed.
We continually evaluate the benefits, on a product-by-product basis, of migrating to higher performance or lower cost process technologies in order to produce higher performance, more efficient or better integrated circuits because we believe this migration is required to remain competitive. Other companies in the industry have experienced difficulty in migrating to new process technologies and, consequently, have suffered reduced yields, delays in product deliveries and increased expense levels. We may experience similar difficulties. Moreover, we are dependent on our relationships with subcontractors to successfully migrate to newer or better processes. Our foundry suppliers may not make newer or better process technologies available to us on a timely or cost-effective basis, if at all. If our foundry suppliers do not make newer or better manufacturing process technologies available to us on a timely or cost-effective basis, or if we experience difficulties in migrating to these processes, it could have a material adverse effect on our competitive position and business prospects.
Uncertainties in our production planning process could have a material adverse effect on our business.
For many of our products, our manufacturing lead-time is greater than the delivery lead-times we quote our customers. Therefore, in many cases we routinely manufacture or purchase inventory based on estimates of customer demand for our products, which demand is difficult to predict. The cancellation or re-scheduling of product orders, the return of previously sold products or overproduction due to the failure of anticipated orders to materialize could result in our holding excess or obsolete inventory that could substantially harm our business,
25
Table of Contents
financial condition and results of operations. In addition, our inability to produce and ship products to our customers in a timely manner could harm our reputation and damage our relationships with our customers.
The semiconductor industry is cyclical. If there is a sustained upturn in the semiconductor market, there could be a resulting increase in demand for foundry and other subcontracted services, significantly reducing product availability and increasing our costs.
The semiconductor industry periodically experiences increased demand and production capacity constraints. An increase in demand for semiconductors could substantially increase the cost of producing our products, and consequently reduce our profit margins. As a result, we may experience substantial period-to-period fluctuations in future results of operations due to general semiconductor industry conditions.
Our business may be harmed if we fail to protect our proprietary technology.
We rely on a combination of patents, trademarks, copyrights, trade secret laws, confidentiality agreements and procedures and licensing arrangements to protect our intellectual property rights. We currently have patents issued and pending in the United States and in foreign countries. We intend to seek further United States and international patents on our technology. We cannot be certain that patents will be issued from any of our pending applications, that patents will be issued in all countries where our products can be sold or that any claims will be allowed from pending applications or will be of sufficient scope or strength to provide meaningful protection or commercial advantage. While we generally seek patent protection for our innovations, it is possible that some of these innovations may not be protectable. If our patents do not adequately protect our technology, our competitors may be able to offer products similar to ours. Our competitors may also be able to develop similar technology independently or design around our patents.
In addition, even when we do hold valid patents that we could potentially assert against a competitor’s infringing products, it may not be practicable, effective or cost-efficient for us to enforce our intellectual property and contractual rights fully, particularly, where the initiation of a claim might harm our business relationships or risk a debilitating countersuit by a competitor with patents that may read on our products.
Our competitors also may be able to design around our patents. The laws of some countries in which our products are or may be developed, manufactured or sold, including various countries in Asia, may not protect our products or intellectual property rights to the same extent as do the laws of the United States, increasing the possibility of piracy of our technology and products.
In addition to patent and copyright protection, we also rely on trade secrets, technical know-how and other non-patented proprietary information relating to our product development and manufacturing activities, which we seek to protect, in part, by confidentiality agreements with our customers, partners, suppliers and employees. We cannot be certain that our confidentiality agreements will not be breached, that we would have adequate remedies for any such breach or that trade-secrets and proprietary know-how will not otherwise become known by others. Although we intend to protect and vigorously defend our intellectual property rights, we may not be able to prevent misappropriation of our technology. Our competitors may also independently develop technologies that are substantially equivalent or superior to our technology.
Despite our efforts and procedures to protect our intellectual property through the prosecution of patents, trademarks, copyrights and trade secrets and other methods, we cannot assure you that our current intellectual property or any intellectual property we may obtain through acquisitions or by other means will be free from third-party claims which may be valid. Any third-party claims may lead to costly and time-consuming litigation, which could have a material adverse effect on our business, financial condition and results of operations.
26
Table of Contents
Our efforts to protect our intellectual property may cause us to become involved in costly and lengthy litigation that could seriously harm our business and compromise our intellectual property position.
We have been involved in intellectual property litigation in the past and may become involved in intellectual property litigation in the future to protect our intellectual property or defend against allegations of infringement asserted by others. Legal proceedings could subject us to significant liability for damages or invalidate our proprietary rights either through litigation or a petition for USPTO re-examination initiated by a competitor. Any litigation, regardless of its outcome, would likely be time-consuming and expensive to resolve and would divert the time and attention of our management and technical personnel.
The expense associated with intellectual property litigation, the diversion of time and attention of our management and technical personnel from our daily operations caused by such litigation and any legal limitation placed upon our products and/or our business related to such litigation may have a material adverse effect on our business and results of operations.
Furthermore, we have initiated, and may initiate in the future, claims or litigation against third-parties for infringement of our proprietary rights or to establish their validity. Even if we successfully assert our intellectual property against a competitor in litigation, our patents may be challenged through a USPTO re-examination, which cannot be settled by the mutual agreement of the parties.
Our ability to sell our products may be adversely affected if it is determined that we or our customers infringe on the intellectual property of a third-party or if any of our issued patents are determined to be invalid.
The electronics industry is characterized by vigorous protection and pursuit of intellectual property rights and positions, which may result in significant and often protracted and expensive litigation. Our customers may be subject to infringement claims for their products which incorporate our products. If any claims of infringement are made against any of our customers, our customers may seek to involve us in the litigation and demand indemnification from us. The resolution of such a claim against our customer may cause our customer to reduce or completely eliminate marketing its infringing product, which would decrease our sales of products to this customer. Further, if our customer were to prevail in its claim for indemnification against us, or if we were found to infringe any third-party intellectual property, we could be required to:
| • | pay substantial damages and royalties on our historical and future product sales; |
| • | indemnify our customers for their legal fees and damages paid; |
| • | stop manufacturing, using and selling the infringing products; |
| • | expend significant resources to develop non-infringing technology; |
| • | discontinue the use of some of our processes; or |
| • | obtain licenses to the infringed intellectual property to sell or use the relevant technology, which may not be available on commercially reasonable terms, if at all. |
We may be unsuccessful in developing non-infringing products or obtaining licenses upon commercially reasonable terms. We may be unable to resolve these problems which could have a material adverse affect on our business, financial condition and results of operations.
We sometimes rely on third parties to provide technology that is used in our demodulator products. In the future, we may license third-party intellectual property to speed our product development efforts. Any failure of our vendors, suppliers or licensors to provide this technology could have a material adverse effect on our business.
We incorporate third-party technology into and with some of our products, and we may make greater use of licensed third-party technology in our future products. The operation of our products could be impaired if errors
27
Table of Contents
occur in the third-party technology we use. It may be more difficult for us to correct any errors in a timely manner if at all because the development and maintenance of the technology is not within our control and because we may not have the expertise to make corrections to these errors. Furthermore, there can be no assurance that these third parties will continue to make their technology, or improvements to the technology, available to us, or that they will continue to support and maintain their technology. Further, due to the limited number of vendors of some types of technology, it may be difficult to obtain new licenses or replace existing technology. Once third-party technology is incorporated into our product designs, we are extremely dependent on that technology for the life of the product. If we were forced to stop utilizing that third-party technology, our product may immediately become obsolete or unsalable. Additionally, using third-party intellectual property puts us at risk of intellectual property litigation related to this technology and our third-party technology providers may not be able to indemnify us fully in the event of any such litigation. Any impairment of the technology or our relationship with these third parties could have a material adverse effect on our business.
If we do not anticipate and adapt to evolving industry standards in the cable, automotive entertainment electronics and DTV markets, or if industry standards develop faster or slower than we expect, our products could become obsolete and we could lose market share.
Applications and devices for cable, automotive entertainment electronics and DTV markets often are based on industry standards that are continuously evolving. We have often directed our development toward producing products that comply with these evolving standards. In some cases, the development of these standards takes longer than originally anticipated. The delayed development of a standard in our target markets has and could result in slower deployment of new technologies, which could harm our ability to sell our products, or frustrate the continued use of our proprietary technologies, due to the anticipation of the deployment of a standard. The acceleration or delay in the development of these industry standards could result in fewer manufacturers purchasing our products in favor of continuing to use the proprietary technologies designed by our competitors. Such accelerated or delayed development of industry standards and the resulting accelerated or delayed deployment of new technologies would result in diminished and/or delayed revenue and consequently harm our business. Additionally, our competitors may attempt to relax anticipated standards that we have expended significant research and development funds to meet, thereby eliminating any technical advantages that our products may have. Further, if new unexpected industry standards do emerge, and we have failed to accurately anticipate or design products that meet such standards, our products or our customers’ products could become unmarketable or obsolete.
Our ability to adapt to changes and to anticipate future standards and the rate of adoption and acceptance of those standards is a significant factor in maintaining or improving our competitive position and prospects for growth. Our inability to anticipate the evolving standards for our products in the cable, automotive entertainment electronics and DTV markets, or to develop and introduce new products that are functionally and economically competitive into these markets, could result in diminished revenue and, consequently, harm our business, financial condition and results of operations. In addition, we may incur substantial unanticipated costs to comply with these evolving standards.
We have experienced volatility in our stock price and it may fluctuate in the future. Therefore, you may be unable to resell shares of our common stock at or above the price you paid for them.
The market price of our common stock has fluctuated in the past and may fluctuate significantly in the future. For example, during 2009, our common stock traded at prices as low as $1.32 and as high as $2.65 per share. Such fluctuations may be influenced by many factors, many of which are outside of our control, including:
| • | quarterly variations in our financial performance; |
| • | our business prospects; |
| • | the performance and prospects of our major customers; |
28
Table of Contents
| • | the depth and liquidity of the market for our common stock; |
| • | investor perception of us and the industry in which we operate; |
| • | changes in earnings estimates or buy/sell recommendations by analysts; |
| • | short-term investor trading strategies; |
| • | general financial and other market conditions; and |
| • | domestic and international economic and political conditions. |
Public stock markets have experienced, and are currently experiencing as a result of the current economic crisis, extreme price and trading volume volatility, particularly in the technology sectors of the market. This volatility has significantly affected the market prices of securities of many technology companies for reasons frequently unrelated to or disproportionately impacted by the operating performance of these companies. These broad market fluctuations may materially and adversely affect the market price of our common stock. In addition, fluctuations in our stock price and our price-to-earnings multiple may have made our stock attractive to momentum, hedge or day trading investors who often shift funds into and out of stocks rapidly, exacerbating price fluctuations in either direction, particularly when viewed on a quarterly basis.
Currency fluctuations related to our international operations could have a material adverse effect on our financial results.
A significant portion of our international revenue and expenses are denominated in foreign currencies, primarily the Euro, and we have experienced significant fluctuations in our financial results due to changing exchange rates rather than operational changes. For example, the foreign currency exchange loss was $0.2 million in 2009. We expect to continue to rely significantly on international sales and foreign subcontractors for the foreseeable future. As a result, we expect currency fluctuations to continue, and such fluctuations may significantly impact our financial results in the future. Currently, we do not engage in currency hedging activities, and in the future, we may choose to engage in currency hedging activities to reduce these fluctuations, which may or may not prove to be successful.
Any future stock repurchase programs may not enhance long-term stockholder value, could increase the volatility of the price of our common stock and diminish our cash reserves.
Any future repurchases pursuant to a stock repurchase program could affect our stock price and increase its volatility. The existence of a stock repurchase program could also cause our stock price to be higher than it would be in the absence of such a program and could potentially reduce the market liquidity for our stock.
Additionally, a stock repurchase program would diminish our cash reserves, which could impact our ability to pursue strategic opportunities and acquisitions and could result in lower overall returns on our cash balances.
There can be no assurance that any future stock repurchases would enhance stockholder value because the market price of our common stock may decline below the levels at which we repurchased shares of stock. Although a stock repurchase program is intended to enhance long-term stockholder value, short-term stock price fluctuations could reduce any program’s effectiveness.
Our results of operations were and may continue to be adversely impacted by the worldwide macroeconomic downturn. As a result of this adverse impact on our business and general investor concern regarding the current economic crisis, the market price of our common stock may be negatively impacted.
In late 2008 and during 2009, general worldwide economic conditions experienced a downturn due to the effects of the lending crisis, general credit market crisis, collateral effects on the finance and banking industries, volatile energy costs, concerns about inflation, slower economic activity, decreased consumer confidence,
29
Table of Contents
reduced corporate profits and capital spending, adverse business conditions and liquidity concerns. These conditions made it difficult for our customers, our vendors and us to accurately forecast and plan future business activities, and caused U.S. and foreign businesses to slow spending on our products, which delayed and lengthened sales cycles. Forecasted demand of many of our customers declined in 2009 and as a result, we experienced order push-outs and cancellations. We cannot predict the timing or duration of any economic slowdown or the timing or strength of a subsequent economic recovery, worldwide or in the semiconductor industry, generally, or in the cable, automotive entertainment electronics or DTV markets specifically. If the cable, automotive entertainment electronics or DTV markets continue to significantly deteriorate due to these macroeconomic effects, our business, financial condition and results of operations will likely be materially and adversely affected. Additionally, our stock price could decrease if investors have concerns that our business, financial condition and results of operations will be negatively impacted by a worldwide macroeconomic downturn.
We may need to obtain capital required to grow our business.
From time to time, we may find it necessary or we may choose to seek additional financing if our strategic growth plans change, or if industry or market conditions are favorable for a particular type of financing. Our capital requirements depend upon several factors, including the need to fund future acquisitions, the capital required to meet our research and development objectives, the rate of market acceptance of our products, our ability to expand our customer base, our level of expenditures for sales and marketing, the cost of product and service upgrades and other factors. If our capital requirements vary materially from those currently planned, we may require additional financing sooner than anticipated. There can be no assurance that we will be able to raise additional funds if needed. If we raise additional funds through the issuance of equity or convertible debt securities, the percentage ownership of our stockholders will be reduced. Further, if we issue equity securities, the new equity securities may have rights, preferences or privileges senior to those of existing holders of common stock. If we issue debt securities, the debt securities generally will have rights senior to those of existing holders of equity securities. If we cannot raise needed funds on acceptable terms, we may not be able to acquire strategic businesses, develop our products and services, take advantage of future opportunities or respond to competitive pressures or unanticipated requirements, any of which could have a material adverse effect on our ability to grow our business.
Our business could be disrupted if we are unable to successfully integrate any businesses, technologies, product lines or services that we may acquire in the future.
As part of our business strategy, we may review and selectively pursue potential acquisitions that could complement our current product offerings, augment our market coverage, complement our technical capabilities, or that would otherwise provide growth opportunities. We may make strategic acquisitions or investments or enter into joint ventures or strategic alliances with other companies in the future, which may entail many risks. Specific examples of risks that could relate to such transactions include:
| • | risks that we will be unable to successfully integrate the acquired company’s personnel and businesses; |
| • | risks that we will be unable to realize anticipated synergies, economies of scale or other value associated with the transactions; |
| • | risks related to acquisition-related charges and amortization of acquired technology and other intangibles that could negatively affect our reported results of operations; |
| • | risks that such transactions will divert management’s time and attention and disrupt our ongoing business; |
| • | risks that we will be unable to retain key technical and managerial personnel of the acquired company; |
| • | risks that we will be unable to establish and maintain uniform standards controls, procedures and policies; |
30
Table of Contents
| • | risks related to unanticipated costs, capital expenditures or working capital requirements and the assumption of unknown liabilities or other unanticipated events or circumstances; |
| • | risks that the acquired company’s customers will not desire to conduct business with us; |
| • | risks related to strained relationships with employees, suppliers and customers resulting from the integration of new personnel; and |
| • | risks related to strained relationships with strategic partners who may compete with the acquired company. |
In addition, future acquisitions or investments may require us to materially reduce our cash reserves, issue additional equity, which would be dilutive to our stockholders, or to incur debt. We cannot assure you that any acquisition or joint venture will be successfully integrated with our operations and the failure to avoid these or other risks associated with such acquisitions or investments could have a material adverse effect on our business, financial condition and results of operations.
Our Quality Certifications are subject to periodic re-evaluation.
Our design facility located in Ingolstadt, Germany is currently ISO-9001:2000 and ISO-14001 certified. These certifications and others are subject to recertification on a periodic basis. If we are unable to obtain any such recertification, it could have a material adverse effect on our business.
Our products are subject to certain environmental standards.
Beginning in July 2006, our product shipments into certain regions of the world were required to conform to the European Union’s directive for the restriction of certain hazardous substances (RoHS) in electrical and electronic equipment. All of our silicon products and applicable subsystem module solutions are currently RoHS-compliant. We currently ship certain modules containing lead under waivers allowed under the RoHS directive. If these customers cannot continue sourcing these products under conditions of the RoHS directive, and if they are unable to re-quality the lead-free versions of these products or our subsystem module manufacturers are unable to meet the RoHS/lead-free standards in a timely manner, it could have a material adverse effect on our business, results of operations and financial condition.
Our international operations, including our operations in Germany, Japan, Taiwan, China, South Korea and the United Kingdom, the operations of our international suppliers and our overall financial results may be adversely affected by events that occur in or otherwise affect these countries.
We currently have facilities and suppliers located outside of the United States, including research and development operations in Germany and China and sales offices in Japan, Taiwan, China, South Korea and the United Kingdom. Other than IBM, TowerJazz, ISE and Criteria Labs, substantially all of our suppliers are located outside the United States, and substantially all of our products are manufactured outside the United States. As a result, our operations are affected by the local conditions in those countries, as well as actions taken by the governments of those countries. For example, if the Philippines government enacts restrictive laws or regulations, or increases taxes paid by manufacturing operations in that country, the cost of manufacturing our products in the Philippines could increase substantially, causing a decrease in our gross margins and profitability. In addition, if any country, including the United States, imposes significant import restrictions on our products, our ability to import our products into that country from our international manufacturing and packaging facilities could be diminished or eliminated. Local economic and political instability in areas in the Far East, in particular in the Philippines, China and South Korea, where there has been political instability in the past, could result in unpleasant or intolerable conditions for workers, and ultimately could result in a shutdown of our facilities or our subcontractor’s facilities.
31
Table of Contents
Our success could be jeopardized by the loss of key personnel or an inability to attract qualified candidates.
Any success we may have in the future, including our ability to grow and support future customers, will depend to a significant degree upon the continued service of our personnel, particularly our key personnel and executive management. The members of our executive management team are not generally parties to employment agreements with Microtune. The loss of one or more members of our executive management team or other key personnel could have an adverse effect on our operations.
Our future success also depends on our ability to attract, retain and motivate qualified personnel with experience in RF engineering, integrated circuit design and software and technical marketing and support. We are extremely dependent on certain key engineering personnel. Should we lose one or more of these key engineering personnel, it would have a material adverse effect on our ability to design our products and support our customers.
Additionally, if we do not meet any future hiring targets, we may be unable to support our key prospective customers and we may lose the ability to enter large emerging markets, resulting in a material adverse effect on our future prospects. We rely heavily upon equity compensation incentives, such as equity awards to purchase or receive our common stock to attract, retain and motivate such personnel. The equity incentives of our competitors and other elements of our competitors’ compensation structures, particularly cash compensation, may be significantly more attractive than the compensation packages we offer. In addition, due to the current market price of our common stock, most, if not all, of our outstanding stock option awards are “out-of–the-money,” further hampering our ability to retain our personnel.
With respect to retaining personnel, the market price of, or other price attainable for, our common stock directly affects the relative attractiveness and effectiveness of our equity awards as a recruiting and retention tool. In the past, our common stock price has been substantially higher than currently prevailing prices. Any future poor operating performance we experience may cause the price of our common stock to decline from current levels. A lower market price of our common stock, along with any related deterioration in the morale of our personnel regarding this component of their compensation, may result in our loss of personnel, including key personnel and executive management. These personnel losses could reasonably be expected to have a prompt, material and adverse effect on our business and operations.
Additionally, we may have to explore the possibility of opening design centers in locations where attractive candidates prefer to live. In prior years, we opened design centers in Plantation, Florida and in Boulder, Colorado in order to acquire additional engineering talent. To the extent we pursue the strategy of opening additional remote locations, our cost structure may increase at a higher rate than if attractive candidates were employed at existing facilities.
Finally, our recent reduction in force and restructuring, which was announced in October 2009, may negatively impact the morale of our remaining key engineering personnel and make them more likely to entertain offers of employment from our competitors. Our competitors routinely attempt to hire our key engineering personnel and we noticed increased recruitment efforts immediately following the public announcement of our reduction in force.
The competition for attracting qualified candidates is intense, particularly in the RF silicon and RF systems industries. Our ability to attract qualified candidates is essential to any success we may have in the future. For the reasons described above, there can be no assurance that we will be able to continue to attract, retain and motivate qualified technical, management, and other candidates necessary for the design, development, manufacture and sale of our products in the future.
32
Table of Contents
Provisions in our charter documents, Delaware law and our stockholder rights plan may deter takeover efforts and limit the ability of our stockholders to receive a premium for their shares of our common stock.
Several provisions of our restated certificate of incorporation, Delaware law and our stockholder rights plan may discourage, delay or prevent a merger or acquisition that you may consider favorable and therefore may prevent our stockholders from receiving a premium for their shares of our common stock.
Those provisions include:
| • | a provision authorizing the issuance of “blank check” preferred stock; |
| • | a provision prohibiting cumulative voting in the election of directors; |
| • | a provision limiting the persons who may call special meetings of the Board of Directors or the stockholders; |
| • | a provision prohibiting stockholder action by written consent; |
| • | a provision establishing advance notice requirements for nominations for election to the Board of Directors or for proposing matters that can be acted on by stockholders at stockholder meetings; |
| • | a provision establishing super-majority voting requirements in some instances; and |
| • | a provision providing rights to purchase fractional shares of preferred stock to our existing stockholders in the event of certain acquisition attempts. |
On May 25, 2005, our stockholders approved certain amendments to our amended and restated certificate of incorporation and amended and restated bylaws that had the effect of declassifying our Board of Directors so that all of our directors must stand for election every year at our annual meeting of stockholders. The declassification of our board of directors was a requirement of our settlement in 2005 of certain consolidated derivative stockholder litigation.
The investigation by the Audit Committee of our Board of Directors into our historical stock option granting practices and the restatement of our consolidated financial statements resulted in derivative litigation, an investigation by the United States Securities and Exchange Commission and litigation by the SEC against two of our former officers. The cost of the SEC litigation could harm our financial condition and results of operations.
On July 27, 2006, we announced that the Audit Committee of our Board of Directors, with the assistance of independent legal counsel, was conducting a review of our stock option granting practices covering the time from our initial public offering in August 2000 through June 2006.
On January 22, 2007, we filed with the SEC certain restated financial statements for the years ended December 31, 1999, 2000, 2001, 2002, 2003, 2004 and 2005, as well as unaudited interim financial statements for the quarter ended March 31, 2006.
On January 31, 2007, a purported stockholder derivative lawsuit was filed in the United States District Court for the Eastern District of Texas—Sherman Division against current and former officers and directors of Microtune and against Microtune, as a nominal defendant, alleging various breaches of fiduciary duties, conspiracy, improper financial reporting, insider trading, violations of the Sarbanes-Oxley Act of 2002, or the Sarbanes-Oxley Act, violations of Section 10(b) of the Securities Exchange Act of 1934, as amended, or the Exchange Act, and Rule 10b-5 promulgated thereunder, unjust enrichment, gross mismanagement, abuse of control, and waste of corporate assets related to the historical stock option granting practices of Microtune. This litigation was dismissed by the court on June 27, 2008.
We announced on June 30, 2008 that we had reached a settlement with the SEC relating to the SEC investigation into our historical stock option granting practices. We agreed to settle with the SEC, without
33
Table of Contents
admitting or denying the allegations in the SEC’s complaint, by consenting to the entry of permanent injunction against future violations of the federal securities laws. We were not required to pay any civil penalty or other money damages as part of the settlement. The SEC also filed suit against Douglas J. Bartek, our former Chairman and Chief Executive Officer, who resigned in June 2003, and Nancy A. Richardson, our former Chief Financial Officer and General Counsel, who resigned in March 2004, alleging various violations of the U.S. securities laws related to our historical stock option granting practices. The suit against Mr. Bartek and Ms. Richardson is still pending and due to our potential indemnification obligations to such persons, we have advanced a significant amount for legal fees. In the event that such litigation matters continue, the costs incurred could have a material adverse effect on our results of operations and financial position.
We are at risk of future securities class action and stockholder derivative litigation. Litigation filed in the future could result in substantial costs to us, drain our resources and divert our management’s time and attention.
Securities class action and stockholder derivative complaints could be filed against us in the future. Any such litigation could result in significant defense costs, reductions in our cash balances, distractions to management and could have a material adverse effect on our business and financial condition.
There is no guarantee that our insurance coverage, including our directors’ and officers’ liability insurance, will be sufficient to cover any potential liability and any shortfall in insurance coverage would impact our cash position which could have a material adverse effect on our financial condition.
We purchase various insurance policies to cover specifically designated risks in varying amounts. There is no guarantee that when a claim arises under any of the covered risks that our coverage will be sufficient to cover the entire claim or that any specific claim will be covered, even in part, by insurance. Specifically, if the SEC is the prevailing party in the current ongoing litigation against two of our former officers, our insurance carrier may demand the repayment by Microtune of previously reimbursed legal expenses incurred by the former officers in the defense of this litigation. Furthermore, directors’ and officers’ liability insurance may not be available to us in sufficient amounts to cover any claims made or defense costs incurred if securities litigation is filed against us in the future. These factors may result in rapid and substantial depletion of our cash reserves, and this depletion may result in our inability to properly operate our business and could have a material adverse effect on our financial condition.
Our business could be negatively affected as a result of a threatened proxy fight and other actions of activist stockholders.
On December 23, 2009, an activist stockholder group declared its intention to nominate four individuals for election to replace members of our Board of Directors at the 2010 annual stockholders’ meeting. We are currently in discussions with such group, however, if an agreement is not reached, our business could be adversely affected because:
| • | responding to proxy contests and other actions by activist stockholders can be costly and time-consuming, disrupting our operations and diverting the attention of management and our employees; |
| • | perceived uncertainties as to our future direction may impact our ability to attract and retain qualified personnel and affect existing and potential collaborations or strategic relationships; and |
| • | if individuals are elected to our Board of Directors with a specific agenda, it may adversely affect our ability to effectively and timely implement our strategic plans, which could have a material adverse effect on our results of operations and financial condition. |
These actions could cause our stock price to experience periods of volatility.
34
Table of Contents
| ITEM 1B. | UNRESOLVED STAFF COMMENTS. |
None.
| ITEM 2. | PROPERTIES. |
We lease our corporate headquarters and principal IC design center in Plano, Texas under an operating lease with a ten year term, which began in April 2005. Our Plano location includes administrative, finance, operations, research and development and sales and marketing functions and consists of approximately 44,000 square feet. Our lease in Germany, where we lease approximately 35,000 square feet for our research and development facility, has a twenty-two year term, which began in December 1999. In addition, we lease a research and development facility in Shanghai, China under an operating lease with a two year term, which began in September 2009, and consists of approximately 16,000 square feet. We also lease design centers in San Jose, California, Boulder, Colorado and Plantation, Florida and sales and technical support offices in Irvine, California; Duluth, Georgia; Raleigh, North Carolina; Tokyo, Japan; Taipei, Taiwan; Shenzhen, China; Seoul, South Korea and Basingstoke, United Kingdom. We believe our facilities are adequate for our current and near-term needs and that we will be able to locate additional facilities as needed.
Our future cash commitments are primarily for long-term facility leases. See Note 10, “Commitments and Contingencies,” to the Notes to Consolidated Financial Statements for more information about our lease commitments.
| ITEM 3. | LEGAL PROCEEDINGS. |
The information set forth under Note 10, “Commitments and Contingencies,” to the Notes to Consolidated Financial Statements, included in Item 8., “Financial Statements and Supplementary Data,” is incorporated herein by reference. For an additional discussion of certain risks associated with legal proceedings, see Item 1A., “Risk Factors.”
| ITEM 4. | SUBMISSION OF MATTERS TO A VOTE OF SECURITY HOLDERS. |
None.
35
Table of Contents
PART II
| ITEM 5. | MARKET FOR REGISTRANT’S COMMON EQUITY, RELATED STOCKHOLDER MATTERS AND ISSUER PURCHASES OF EQUITY SECURITIES. |
Our common stock is traded on The NASDAQ Global Market under the symbol “TUNE.” The following table shows the range of quarterly high and low sales prices from January 1, 2008 through December 31, 2009. On February 5, 2010, the closing price of our common stock was $2.20 as quoted on The NASDAQ Global Market.
| Year Ended December 31, | ||||||||||||
| 2009 | 2008 | |||||||||||
| High | Low | High | Low | |||||||||
| First Quarter |
$ | 2.17 | $ | 1.32 | $ | 6.59 | $ | 3.40 | ||||
| Second Quarter |
$ | 2.65 | $ | 1.80 | $ | 4.50 | $ | 3.20 | ||||
| Third Quarter |
$ | 2.39 | $ | 1.77 | $ | 3.85 | $ | 2.60 | ||||
| Fourth Quarter |
$ | 2.34 | $ | 1.65 | $ | 2.89 | $ | 1.60 | ||||
As a result of both investor concern and uncertainty in demand for our products due to the current economic crisis, the market price of our common stock has declined significantly and may continue to decline. In addition, we believe factors such as quarterly fluctuations in results of operations; announcements by us, our competitors or our customers; technological innovations; new product introductions; governmental regulations; litigation or changes in earnings estimates by analysts may cause the market price of our common stock to fluctuate, perhaps substantially. The stock prices of many technology companies fluctuate widely for reasons that may be unrelated to their operating results. The broad market and industry fluctuations may also adversely affect the market price of our common stock.
The following table presents information with respect to our purchases of our common stock during the fourth quarter of 2009:
| Total Number of Shares Purchased |
Average Price Paid per Share |
Total Number of Shares Purchased as Part of Publicly Announced Plans or Programs |
Approximate Dollar Value of Shares that May Yet Be Purchased Under the Plans or Programs | ||||||
| October 1—October 31 |
— | — | — | — | |||||
| November 1—November 30 |
|||||||||
| Employee transactions (1) |
862 | $ | 1.77 | — | N/A | ||||
| December 1—December 31 |
— | — | — | — | |||||
| Total |
|||||||||
| Employee transactions (1) |
862 | $ | 1.77 | — | N/A | ||||
| (1) | All shares were withheld for the payment of withholding taxes upon vesting of restricted stock units. |
36
Table of Contents
Stock Performance Graph
The following graph shows a comparison of cumulative total stockholder return, calculated on a dividend reinvested basis, from December 31, 2004 through December 31, 2009, with the Nasdaq Composite Index and the Philadelphia Semiconductor Index. The graph assumes that $100 was invested in Microtune’s common stock and in the above indices on December 31, 2004.
The comparisons in the graph below are based on historical data with our common stock prices based on the closing sales price on the dates indicated and are not intended to forecast the possible future performance of our common stock.
Comparison of 5 Year Cumulative Total Return
as of December 2009
Assumes Initial Investment of $100
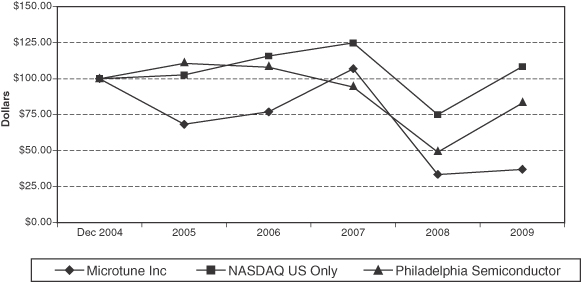
Stockholders
As of February 5, 2010, there were 53,970,086 shares of our common stock outstanding held by 193 holders of record.
Dividends
We have never paid any cash dividends on our common stock and we do not anticipate paying any cash dividends in the foreseeable future.
For information regarding stock-based compensation awards outstanding and available for future grants, see Item 12., “Security Ownership of Certain Beneficial Owners and Management and Related Stockholder Matters.” For additional information on our stock incentive plans and activity, see Note 11, “Stockholders’ Equity,” to the Notes to Consolidated Financial Statements, included in Item 8., “Financial Statements and Supplementary Data.”
Recent Sales of Unregistered Securities
On July 31, 2009, we completed the acquisition of Auvitek International Ltd. As partial consideration for all of the outstanding capital stock of Auvitek, we issued 1,000,000 shares of our common stock at a price of $2.06 per share, the market value of the common stock on the date the acquisition was completed. These shares were
37
Table of Contents
issued as restricted securities in reliance on the exemption available to us under Rule 506 promulgated under the Securities Act of 1933, as amended, based upon our reasonable belief that each investor was a sophisticated investor and was in a position of access to relevant material information regarding our operations. Each investor delivered appropriate investment representations satisfactory to us with respect to this transaction and consented to the imposition of restrictive legends upon the certificates evidencing such share certificates.
| ITEM 6. | SELECTED FINANCIAL DATA. |
The following selected consolidated financial data should be read in conjunction with the consolidated financial statements and notes thereto and with “Management’s Discussion and Analysis of Financial Condition and Results of Operations” in Item 7. and with the other financial data included elsewhere in this report. To better understand the information in the table, investors should read “Management’s Discussion and Analysis of Financial Condition and Results of Operations” in Item 7., and “Financial Statements and Supplementary Data” in Item 8. Our historical results of operations are not necessarily indicative of results of operations to be expected for any future period.
| Year Ended December 31, | |||||||||||||||||||
| 2009 (1) | 2008 (2) | 2007 (3) | 2006 (4) | 2005 (5) | |||||||||||||||
| Consolidated Statements of Operations Data: |
|||||||||||||||||||
| (In thousands, except per share data) |
|||||||||||||||||||
| Net revenue |
$ | 74,570 | $ | 108,020 | $ | 91,141 | $ | 69,232 | $ | 56,991 | |||||||||
| Gross margin |
38,474 | 53,329 | 46,443 | 34,527 | 29,661 | ||||||||||||||
| Income (loss) from operations |
(14,437 | ) | 5,624 | (2,569 | ) | (9,229 | ) | (4,823 | ) | ||||||||||
| Net income (loss) |
(13,299 | ) | 6,375 | 1,144 | (5,152 | ) | (2,438 | ) | |||||||||||
| Basic and diluted income (loss) per common share (6) |
$ | (0.25 | ) | $ | 0.12 | $ | 0.02 | $ | (0.10 | ) | $ | (0.05 | ) | ||||||
| December 31, | |||||||||||||||||||
| 2009 (1) | 2008 (2) | 2007 (3) | 2006 (4) | 2005 (5) | |||||||||||||||
| Consolidated Balance Sheets Data: |
|||||||||||||||||||
| (In thousands) |
|||||||||||||||||||
| Cash and cash equivalents |
$ | 32,291 | $ | 46,097 | $ | 87,537 | $ | 38,010 | $ | 5,068 | |||||||||
| Short-term investments |
50,000 | 40,000 | — | 44,750 | 77,120 | ||||||||||||||
| Working capital |
90,041 | 102,015 | 98,355 | 91,237 | 88,494 | ||||||||||||||
| Total assets |
116,171 | 118,495 | 117,309 | 105,602 | 103,321 | ||||||||||||||
| Total stockholders’ equity |
103,575 | 108,985 | 105,224 | 96,268 | 94,425 | ||||||||||||||
| (1) | The consolidated statement of operations and balance sheet data for 2009 reflect a $1.7 million benefit to cost of revenue for the sale of inventory that had previously been written-off as excess, a $1.8 million charge to cost of revenue for inventories that were excess to our demand forecasts, $4.8 million in stock-based compensation expense, a $1.7 million charge to operating expenses for one-time employee termination benefits from a restructuring plan and $0.9 million related to professional fees of our legal firms expensed in connection with the SEC litigation against two of our former officers. See Item 7., “Management’s Discussion and Analysis of Financial Condition and Results of Operations—Results of Operations” for further discussion of these events. |
| (2) | The consolidated statement of operations and balance sheet data for 2008 reflect a $0.6 million benefit to cost of revenue for the sale of inventory that had previously been written-off as excess, a $0.8 million charge to cost of revenue to recognize liabilities for subcontractor inventories that were excess to our demand forecasts, $4.8 million in stock-based compensation expense, a $0.4 million charge to operating expenses for the fiscal year 2008 incentive compensation program discussed below and $0.4 million in charges to operating expenses related to the derivative litigation, which was dismissed in June 2008, and the |
38
Table of Contents
| related SEC investigation, which was resolved with respect to the Company with a settlement in June 2008. See Item 7., “Management’s Discussion and Analysis of Financial Condition and Results of Operations—Results of Operations” for further discussion of these events. |
| (3) | The consolidated statement of operations and balance sheet data for 2007 reflect a $0.8 million benefit to cost of revenue for the sale of inventory which had previously been written-off as excess, a $1.4 million charge to cost of revenue to recognize liabilities for subcontractor inventories which were excess to our demand forecasts, $6.1 million in stock-based compensation expense, a $1.6 million charge to operating expenses for the fiscal year 2007 incentive compensation program discussed below, $3.1 million in charges to operating expenses related to professional fees incurred in connection with the restatement of our financial statements filed in January 2007, the related derivative litigation and the related SEC investigation and a $0.6 million charge to income tax expense relating to withholding taxes on certain cross-border transactions. See Item 7., “Management’s Discussion and Analysis of Financial Condition and Results of Operations—Results of Operations” for further discussion of these events. |
| (4) | The consolidated statement of operations and balance sheet data for 2006 reflect a $1.1 million benefit to cost of revenue for the sale of inventory which had previously been written-off as excess, a $0.7 million charge to cost of revenue to recognize liabilities for subcontractor inventories which were excess to our demand forecasts, $3.3 million in charges to operating expenses related to professional fees incurred in connection with the Audit Committee’s investigation into our stock option granting practices and $5.8 million in stock-based compensation expense. See Item 7., “Management’s Discussion and Analysis of Financial Condition and Results of Operations—Results of Operations” for further discussion of these events. |
| (5) | The consolidated statement of operations and balance sheet data for 2005 reflect a $1.1 million benefit to cost of revenue for the sale of inventory which had previously been written-off as excess, a $0.7 million benefit to cost of revenue related to replacing Three-Five Systems (TFS) as our RF subsystem module manufacturing partner as described below, a $0.4 million charge to cost of revenue to recognize liabilities for subcontractor inventories which were excess to our demand forecasts, a $0.5 million benefit for the reimbursement of legal fees by insurance carriers, a $0.3 million charge for various income tax and non-income tax liabilities as a result of several ongoing foreign tax reviews and examinations and a $0.3 million foreign currency loss. See “Item 7., “Management’s Discussion and Analysis of Financial Condition and Results of Operations—Results of Operations” for further discussion of these events. |
| (6) | See Note 1, “Summary of Significant Accounting Policies,” to the Notes to Consolidated Financial Statements for a description of how the number of shares used to calculate net income (loss) per common share is determined. |
| ITEM 7. | MANAGEMENT’S DISCUSSION AND ANALYSIS OF FINANCIAL CONDITION AND RESULTS OF OPERATIONS. |
NOTE: For a more complete understanding of our financial condition and results of operations, and the risks that could affect our future results, see “Risk Factors” in Part I, Item 1A., which describes some of the important risk factors that may affect our business, results of operations and financial condition. You should carefully consider those risks, in addition to the other information in this report and in our other filings with the SEC, before deciding to make an investment in our stock. You should also read “Quantitative and Qualitative Disclosures About Market Risk” in Part II, Item 7A.
You should also read the following discussion and analysis in conjunction with “Financial Statements and Supplementary Data” in Item 8.
OVERVIEW
We design and market receiver solutions for the cable, automotive entertainment electronics and DTV markets. We operate Microtune as a single business unit or reportable operating segment serving our target markets. We record our operating expenses by functional area and account type, but we do not record or analyze our operating expenses by market, product type or product. We attempt to analyze our net revenue by market, but
39
Table of Contents
in some cases we sell our products to resellers or distributors serving multiple end-markets, giving us limited ability to determine market composition of our net revenue from these customers. In addition, certain of our OEM customers purchase products from us for applications in multiple end-markets, also limiting our ability to determine our net revenue contribution from each market.
We monitor and analyze a number of key financial performance indicators in order to manage our business and evaluate our financial and operating performance. Those indicators include:
| • | Net Revenue: Our net revenue is generated principally by sales of our ICs and subsystem module products directly to OEMs and ODMs who sell devices or applications to consumers or service providers within the cable, automotive entertainment electronics and DTV markets. The devices or applications that our customers produce include cable television set-top boxes; DOCSIS®-based high-speed voice and data cable modems; car audio, television and antenna amplifier systems; integrated digital television (iDTV) systems, including high-definition televisions (HDTV); digital-to-analog converter boxes; and personal computer television (PC/TV) multimedia products. We also market and sell to third-party manufacturers and to distributors who sell directly to the OEMs and ODMs. The majority of our net revenue is generated through the efforts of our sales organization. However, we generated approximately 11%, 14% and 10% of our net revenue from sales made to distributors in 2009, 2008 and 2007, respectively. The decrease in net revenue from sales made to distributors in 2009 was due to increased shipments in 2008 of silicon tuner products for the nonrecurring CECB market segment. Our net revenue varies based upon economic and market conditions in the semiconductor industry and our target markets; the timing, rescheduling or cancellation of customer orders; our ability, as well as the ability of our customers, to manage inventory; seasonality in the demand for consumer products into which our products are incorporated; and large orders placed by our key customers. These factors may cause our quarterly and yearly net revenue to fluctuate significantly, which makes it difficult for us to discuss revenue trends or to predict future results. We expect these fluctuations will continue in the future. We analyze trends in total net revenue and we attempt to analyze total net revenue trends by market, which is limited due to our lack of visibility into customers and/or applications, as described above. We also analyze revenue from key customers, focusing on our ten-percent customers, and aggregate net revenue from our top ten customers. |
| • | Cost of Revenue and Gross Margin: Cost of revenue includes the cost of subcontracted materials and wafer fabrication, IC assembly, final test, factory labor and overhead, shipping of materials, shipping costs to customers, customs expenses, warranty costs, production employee expenses and inventory charges or benefits relating to excess or obsolete inventory. We also report expenses for the depreciation of our test and handling equipment and logistics in cost of revenue in addition to the amortization of intangible assets. Significant items impacting cost of revenue include our product mix and volumes of product sales; the position of our products in their respective life cycles; the effects of competitive pricing programs; manufacturing costs; fluctuations in direct product costs such as wafer pricing and assembly, packaging and testing costs, and overhead costs; and provisions for excess or obsolete inventory. Stock-based compensation expense recorded in cost of revenue under Accounting Standards Codification (ASC) Topic 718, Compensation—Stock Compensation (ASC 718), was insignificant, and is expected to continue to be insignificant as we use third-party contract manufacturers to produce the majority of our products enabling us to employ a limited number of production employees. Our cost of revenue may increase due to price fluctuations and cyclical demand and we may not be able to pass this increase on to our customers, which makes it difficult for us to determine if cost of revenue and gross margin trends will continue or to predict future results. We analyze absolute gross margin dollars and gross margin percentage. We also analyze the key drivers of gross margin, namely typical selling price trends and the components of cost of revenue. In 2009, the average selling prices of our products decreased at rates greater than experienced in recent periods. More significant decreases, should they occur, could have a material adverse effect on our gross margins, results of operations and financial condition. |
40
Table of Contents
| • | Operating Expenses: Operating expenses are substantially driven by personnel-related expenses, including cash and stock-based compensation expense, lab supplies, training, prototype materials, professional fees and insurance expenses. We record stock-based compensation expense in operating expenses in accordance with ASC 718, which has resulted in a significant charge each period as the majority of our employees are classified in this category. We analyze trends in the absolute dollar value and percentage of net revenue for research and development and selling, general and administrative expenses. We also analyze the underlying expense inputs of significant operating expenses. |
| • | Other Income and Expense: We analyze the individual components of other income and expense. We also analyze interest income and the rate of return earned on our cash and cash equivalents and short-term investments. |
| • | Liquidity and Cash Flows: Our cash flows are primarily driven by our cash operating results and sales and purchases of investments. The primary source of our liquidity is our cash and cash equivalents and short-term investments. From period to period, we experience fluctuations in various items, including our working capital accounts, capital expenditures and proceeds from the exercise of employee stock options and shares purchased under our employee stock purchase program. |
| • | Balance Sheet: We view cash and cash equivalents, short-term investments, accounts receivable, days sales outstanding, inventory, inventory turns, and working capital as important indicators of our financial health. |
ACQUISITION OF AUVITEK
On July 31, 2009, Microtune completed the acquisition of Auvitek International Ltd. (Auvitek) pursuant to the terms of the Agreement and Plan of Merger (Merger Agreement) dated as of July 10, 2009. Auvitek is a supplier of advanced DTV demodulator ICs for the HDTV and TV-enabled peripherals markets with primary engineering operations based in Shanghai, China. Pursuant to the Merger Agreement, Microtune acquired all of the outstanding capital stock of Auvitek. The merger consideration consisted of (i) cash payments totaling $7,066,324, (ii) the issuance of 1,000,000 shares of Microtune common stock and (iii) an earn-out payment to be determined based upon the achievement of certain performance metrics during the period July 1, 2009 through June 30, 2010. The cash payment total was adjusted based on the final closing balance sheet of Auvitek. In addition to the above described merger consideration, retention arrangements were established for the benefit of certain Auvitek employees, which is being recognized as expense over the requisite service period, and a second earn-out payment to be determined based upon the achievement of certain performance metrics during the period July 1, 2009 through June 30, 2010 (using the same performance metrics as the earn-out payment for the former holders of Auvitek capital stock). Prior to entering into the Merger Agreement, there were no material relationships between Auvitek and Microtune. The Merger Agreement, the merger and related matters were approved by the boards of directors of each company. See Note 2, “Acquisition of Auvitek International Ltd.,” to the Notes to Consolidated Financial Statements.
41
Table of Contents
RESULTS OF OPERATIONS
The following table shows certain data from our consolidated statements of operations expressed as a percentage of net revenue:
| Year Ended December 31, | |||||||||
| 2009 | 2008 | 2007 | |||||||
| Net revenue |
100 | % | 100 | % | 100 | % | |||
| Cost of revenue |
48 | 51 | 49 | ||||||
| Gross margin |
52 | 49 | 51 | ||||||
| Operating expenses: |
|||||||||
| Research and development |
38 | 24 | 26 | ||||||
| Selling, general and administrative |
31 | 20 | 28 | ||||||
| Restructuring costs |
2 | — | — | ||||||
| Total operating expenses |
71 | 44 | 54 | ||||||
| Income (loss) from operations |
(19 | ) | 5 | (3 | ) | ||||
| Other income (expense): |
2 | 2 | 5 | ||||||
| Income (loss) before income taxes |
(17 | ) | 7 | 2 | |||||
| Income tax expense |
— | 1 | 1 | ||||||
| Net income (loss) |
(17 | )% | 6 | % | 1 | % | |||
COMPARISON OF YEARS ENDED DECEMBER 31, 2009, 2008 AND 2007
Net Revenue
The following table presents a comparison of net revenue from each of our product types for 2009, 2008 and 2007 (in thousands):
| Year Ended December 31, | 2009 vs. 2008 | 2008 vs. 2007 | |||||||||||||||||||||
| 2009 | 2008 | 2007 | Change | % Change | Change | % Change | |||||||||||||||||
| Silicon |
$ | 60,581 | $ | 81,317 | $ | 70,932 | $ | (20,736 | ) | (26 | )% | $ | 10,385 | 15 | % | ||||||||
| Modules |
13,873 | 26,540 | 19,958 | (12,667 | ) | (48 | ) | 6,582 | 33 | ||||||||||||||
| Other |
116 | 163 | 251 | (47 | ) | (29 | ) | (88 | ) | (35 | ) | ||||||||||||
| Total |
$ | 74,570 | $ | 108,020 | $ | 91,141 | $ | (33,450 | ) | (31 | )% | $ | 16,879 | 19 | % | ||||||||
The decrease in net revenue in 2009 as compared to 2008 was primarily the result of decreased shipments of silicon tuner products for the cable market, module products for the automotive entertainment electronics market, silicon tuner products for the DTV market, primarily for the CECB market segment, and to a lesser extent, lower average selling prices of silicon tuner products for the cable market and module products for the automotive entertainment electronics market. No net revenue was recognized in 2009 from the CECB market segment. Silicon tuner unit shipments decreased approximately 25% in 2009 from 2008, primarily relating to the cable market and the CECB market segment. Module unit shipments for the automotive entertainment electronics market decreased approximately 42% in 2009 from 2008, primarily relating to car television applications.
The increase in net revenue in 2008 as compared to 2007 was primarily the result of increased shipments of silicon tuner products for the cable market, particularly for set-top box applications, module products for the automotive entertainment electronics market, particularly for car radio applications, and silicon tuner products for the DTV market, primarily relating to the CECB market segment, partially offset by slightly lower average selling prices of silicon tuner products for the cable market. Net revenue from the CECB market segment was $7.6 million for 2008. Silicon tuner unit shipments increased approximately 22% in 2008 from 2007, primarily relating to the cable market and the CECB market segment. Module unit shipments for the automotive entertainment electronics market increased approximately 26% in 2008 from 2007, primarily relating to car radio applications.
42
Table of Contents
Net revenue from customers, including sales to their respective manufacturing subcontractors, exceeding 10% of net revenue were as follows:
| Year Ended December 31, | |||||||||
| 2009 | 2008 | 2007 | |||||||
| Cisco |
29 | % | 29 | % | 32 | % | |||
| Unihan (1) (2) |
14 | % | 13 | % | 18 | % | |||
| Panasonic |
13 | % | 12 | % | * | ||||
| Samsung |
10 | % | * | * | |||||
| Ten largest customers |
86 | % | 85 | % | 82 | % | |||
| (1) | Primarily for the benefit of ARRIS Group, Inc. |
| (2) | A wholly-owned subsidiary of Asustek Computer |
| * | Less than 10% of total net revenue |
We expect that our largest customers will continue to account for a substantial portion of our net revenue in 2010 and the foreseeable future. The identity of our largest customers and their respective contributions to our net revenue has varied and will likely continue to vary from period to period, which makes it difficult for us to discuss cost of revenue and gross margin trends or to predict future results.
Net revenue derived from shipments to customer locations by geographical area is summarized below (in thousands):
| Year Ended December 31, | |||||||||
| 2009 | 2008 | 2007 | |||||||
| Asia Pacific |
$ | 37,731 | $ | 47,518 | $ | 38,635 | |||
| North America |
22,273 | 34,632 | 32,822 | ||||||
| Europe |
12,307 | 23,266 | 19,407 | ||||||
| Other |
2,259 | 2,604 | 277 | ||||||
| Total |
$ | 74,570 | $ | 108,020 | $ | 91,141 | |||
Net revenue derived from shipments to customer locations in countries exceeding 10% of total net revenue was as follows:
| Year Ended December 31, | |||||||||
| 2009 | 2008 | 2007 | |||||||
| China (including Hong Kong) |
28 | % | 30 | % | 27 | % | |||
| Mexico |
25 | % | 26 | % | 14 | % | |||
| Germany |
* | 10 | % | 11 | % | ||||
| United States |
* | * | 21 | % | |||||
| * | Less than 10% of total net revenue |
Cost of Revenue and Gross Margin
The following table presents a comparison of cost of revenue and gross margin for 2009, 2008 and 2007 (in thousands):
| Year Ended December 31, | 2009 vs. 2008 | 2008 vs. 2007 | |||||||||||||||||||||||
| 2009 | 2008 | 2007 | Change | % Change | Change | % Change | |||||||||||||||||||
| Cost of revenue |
$ | 36,096 | $ | 54,691 | $ | 44,698 | $ | (18,595 | ) | (34 | )% | $ | 9,993 | 22 | % | ||||||||||
| Gross margin |
38,474 | 53,329 | 46,443 | (14,855 | ) | (28 | ) | 6,886 | 15 | ||||||||||||||||
| Gross margin % |
51.6 | % | 49.4 | % | 51.0 | % | 2.2 pts. | (1.6) pts. | |||||||||||||||||
43
Table of Contents
Gross margin decreased in 2009 as compared to 2008 primarily due to an approximate $33.5 million decrease in net revenue, partially offset by a 220 basis point increase in gross margin percentage. Gross margin percentage in 2009 as compared to 2008 was positively impacted by an increase in net revenue for the cable market as a percentage of total net revenue, which had a higher gross margin percentage as compared to other markets and lower average costs of our silicon products for the cable market and module products for the automotive entertainment electronics market, partially offset by lower average selling prices of our silicon products for the cable market and module products for the automotive entertainment electronics market.
Gross margin increased in 2008 as compared to 2007 primarily due to an approximate $16.9 million increase in net revenue, partially offset by a 160 basis point decrease in gross margin percentage. Gross margin percentage in 2008 as compared to 2007 was negatively impacted by slightly lower average selling prices of silicon tuner products for the cable market, an increase in net revenue for the automotive entertainment electronics market as a percentage of total net revenue, which had a lower gross margin percentage as compared to other markets, and lower than expected yields on initial product runs of a new cable silicon tuner during the first quarter of 2008.
Our cost of revenue for 2009, 2008 and 2007 benefited from the sale of inventory, which had previously been identified as excess to expected demand and expensed in prior periods. The total value of these inventories for 2009, 2008 and 2007 was $1.7 million, $0.6 million and $0.8 million, respectively. The net impact of changes in the inventory valuation allowance and accrued noncancelable inventory purchase obligations was a charge to cost of revenue of $0.1 million, $0.2 million and $0.6 million for 2009, 2008 and 2007, respectively.
Stock-Based Compensation
The following table summarizes the allocation of stock-based compensation expense under ASC 718 (in thousands):
| Year Ended December 31, | |||||||||
| 2009 | 2008 | 2007 | |||||||
| Cost of revenue |
$ | 38 | $ | 35 | $ | 40 | |||
| Research and development |
2,176 | 1,893 | 2,448 | ||||||
| Selling, general and administrative |
2,593 | 2,866 | 3,608 | ||||||
| Total stock-based compensation expense included in operating expenses |
4,769 | 4,759 | 6,056 | ||||||
| Total stock-based compensation expense |
$ | 4,807 | $ | 4,794 | $ | 6,096 | |||
Stock-based compensation expense increased in 2009 as compared to 2008 primarily due to an increase in unvested restricted stock units in 2009, offset by a decrease in unvested stock options in 2009 and a decrease in incentive compensation charges due to the absence of a bonus program in 2009 as compared to the expense of the fiscal year 2008 bonus program. See Note 11, “Stockholders’ Equity,” to the Notes to Consolidated Financial Statements. Stock-based compensation expense decreased in 2008 as compared to 2007 primarily due to a decrease in unvested equity awards in 2008 and a decrease in incentive compensation charges related to the fiscal year 2008 Bonus Program as compared to the fiscal year 2007 Bonus Program.
Operating Expenses
The following tables present a comparison of operating expenses for 2009, 2008 and 2007 (in thousands):
| Year Ended December 31, | 2009 vs. 2008 | 2008 vs. 2007 | ||||||||||||||||||||
| 2009 | 2008 | 2007 | Change | % Change | Change | % Change | ||||||||||||||||
| Research and development |
$ | 28,488 | $ | 25,896 | $ | 23,695 | $ | 2,592 | 10 | % | $ | 2,201 | 9 | % | ||||||||
| Selling, general and administrative |
22,681 | 21,809 | 25,317 | 872 | 4 | (3,508 | ) | (14 | ) | |||||||||||||
| Restructuring costs |
1,742 | — | — | 1,742 | 100 | — | — | |||||||||||||||
| Total |
$ | 52,911 | $ | 47,705 | $ | 49,012 | $ | 5,206 | 11 | % | $ | (1,307 | ) | (3 | )% | |||||||
44
Table of Contents
Research and Development
Our research and development expenses consist primarily of personnel-related expenses, engineering software, prototype materials, lab supplies and training. To date, we have expensed all of our research and development costs in the period incurred as our process for developing our products has been essentially completed concurrently with the establishment of technological feasibility. Research and development efforts currently are focused primarily on the development of our next generation of products and designing more highly-integrated products that leverage next-generation technology.
The increase in research and development expenses in 2009 as compared to 2008 was primarily the result of an increase in personnel-related expenses and stock-based compensation expense resulting from the addition of employees due to the acquisition of Auvitek and an average headcount increase of approximately 5%, excluding Auvitek employees, an increase in prototyping expenses for new silicon projects and the timing of these expenditures, an increase in expenditures to design our silicon products, including license and maintenance fees for engineering software, and the effects of a benefit of $0.3 million for the reversal of taxes and interest accrued in excess of amounts paid to the IRS upon completion of its examination of our payroll tax returns for 2003 through 2006 recognized during 2008, partially offset by a decrease in costs incurred to recruit and hire new employees.
The increase in research and development expenses in 2008 as compared to 2007 was primarily the result of an increase in personnel-related expenses resulting from an average headcount increase of approximately 5%, an increase in compensation expense incurred in conjunction with our regular annual base compensation adjustments, an increase in prototyping expenses for new silicon projects and the timing of these expenditures and an increase in expenditures to design our silicon products, including license and maintenance fees for engineering software used to design our silicon products, partially offset by a decrease in incentive compensation charges related to the fiscal year 2008 Bonus Program as compared to the fiscal year 2007 Bonus Program, a decrease in stock-based compensation expense and a benefit of $0.3 million for the reversal of taxes and interest accrued in excess of amounts paid to the IRS upon completion of its examination of our payroll tax returns for 2003 through 2006. Stock-based compensation expense related to research and development was $1.9 million and $2.4 million in 2008 and 2007, respectively.
We remain committed to significant research and development efforts to support our technology leadership in the markets in which we operate. Currently, we hold over 90 issued United States utility patents and have over 30 additional United States patent applications pending. Our issued United States patents begin to expire in 2015. Our patents generally cover various aspects of our RF and analog technologies at the broad architectural, circuit and building-block levels.
Selling, General and Administrative
Selling, general and administrative expenses include our personnel-related expenses for our administrative, finance, human resources, sales and marketing, information technology and legal departments, and include expenditures related to professional fees for accounting and legal, public relations and financial advisors. These expenses also include promotional and marketing costs, sales commissions and provisions for doubtful accounts.
The increase in selling, general and administrative expenses in 2009 as compared to 2008 was primarily due to professional fees associated with the acquisition of Auvitek, professional fees expensed in connection with the SEC litigation against two of our former officers and personnel-related expenses resulting from the addition of employees due to the acquisition of Auvitek, partially offset by a decrease in general legal and accounting fees, commissions to outside sales representative firms, stock-based compensation expense and directors’ and officers’ liability insurance premiums. The results in 2009 included net charges of $0.9 million related to professional fees of our legal firms, for which reimbursement is doubtful, in connection with the SEC litigation against two of our
45
Table of Contents
former officers and excluded $1.4 million of professional fees of our former officers’ legal firms recorded as a receivable for amounts expected to be reimbursed by our directors’ and officers’ liability insurance carrier related to this matter. See Part I, Item 3. “Legal Proceedings.” Professional fees incurred in 2009 associated with acquisition activities were $1.2 million.
The decrease in selling, general and administrative expenses in 2008 as compared to 2007 was due to a decrease in professional fees expensed in connection with the derivative litigation, which was dismissed in June 2008, and the SEC investigation, which was resolved with respect to the Company with a settlement in June 2008, a decrease in stock-based compensation expense and a decrease in incentive compensation charges related to the fiscal year 2008 Bonus Program as compared to the fiscal year 2007 Bonus Program. Stock-based compensation expense related to selling, general and administrative expenses was $2.9 million and $3.6 million in 2008 and 2007, respectively. The results in 2008 included net charges of $0.4 million related to professional fees expensed in connection with the derivative litigation and the SEC investigation and excluded $1.9 million recorded as a receivable for amounts expected to be reimbursed by our directors’ and officers’ liability insurance carrier related to the SEC investigation and ongoing SEC litigation with two of our former officers. See Part I, Item 3. “Legal Proceedings.”
Restructuring Costs
In October 2009, we finalized a restructuring plan that included a reduction in force that resulted in the termination or attrition of approximately 10% of our workforce. The reduction in force was substantially completed during the fourth quarter of 2009. These actions were taken as part of a larger cost reduction effort in order to streamline operations and more closely align costs with revenue in an effort to achieve profitability as quickly as possible in the current challenging economic environment. We recorded restructuring charges related to this plan of $1.7 million during the fourth quarter of 2009. Of this amount, remaining cash severance payments of $0.9 million were accrued at December 31, 2009. The remaining cash severance payments will be made during the first half of 2010.
Other Income and Expense
Other income consists primarily of interest income from our cash and short-term investment balances, foreign currency gains and losses and other non-operating income.
The following table presents a comparison of other income and expense for 2009, 2008 and 2007 (in thousands):
| Year Ended December 31, | 2009 vs. 2008 | 2008 vs. 2007 | |||||||||||||||||||||||
| 2009 | 2008 | 2007 | Change | % Change | Change | % Change | |||||||||||||||||||
| Interest income |
$ | 1,273 | $ | 1,705 | $ | 4,156 | $ | (432 | ) | (25 | )% | $ | (2,451 | ) | (59 | )% | |||||||||
| Foreign currency gains (losses), net |
(179 | ) | (324 | ) | 268 | 145 | 45 | (592 | ) | (221 | ) | ||||||||||||||
| Other, net |
40 | 6 | 75 | 34 | 567 | (69 | ) | (92 | ) | ||||||||||||||||
| Total |
$ | 1,134 | $ | 1,387 | $ | 4,499 | $ | (253 | ) | (18 | )% | $ | (3,112 | ) | (69 | )% | |||||||||
The decrease in interest income in 2009 as compared to 2008 and 2008 as compared to 2007 was primarily the result of significantly lower average rates of return on our cash and investment balances.
Our functional currency is the United States Dollar. The impact from the re-measurement of accounts not denominated in United States Dollars is recognized currently in our results of operations as a component of net foreign currency gains (losses). Foreign currency gains (losses), net, were primarily a result of exchange rate fluctuations between the United States Dollar and the Euro.
46
Table of Contents
Income Taxes
The following table presents a comparison of our income tax expense (benefit) for 2009, 2008 and 2007 (in thousands):
| Year Ended December 31, | 2009 vs. 2008 | 2008 vs. 2007 | ||||||||||||||||||||||||
| 2009 | 2008 | 2007 | Change | % Change | Change | % Change | ||||||||||||||||||||
| Income tax expense (benefit) |
$ | (4 | ) | $ | 636 | $ | 786 | $ | (640 | ) | (101 | )% | $ | (150 | ) | (19 | )% | |||||||||
| Effective tax rate |
0.0 | % | 9.1 | % | 40.7 | % | (9.1 | ) pts. | (31.6 | ) pts. | ||||||||||||||||
In 2009, our effective tax rate differed from the 34% statutory corporate tax rate primarily due to a refund of alternative minimum taxes, changes in valuation allowances, permanent differences, lower withholding tax rates and lower foreign tax rates. Income tax benefit for 2009 included a refund of alternative minimum taxes paid in prior years due to recent regulation changes regarding the carryback of net operating losses, utilization of previously reserved net operating loss carryforwards and charges for withholding taxes on certain cross-border transactions, United States state income taxes and foreign income taxes.
In 2008 and 2007, our effective tax rate differed from the 34% statutory corporate tax rate primarily due to permanent differences, mostly foreign currency remeasurement, changes in valuation allowances, lower alternative minimum tax rates and lower foreign tax rates. Income tax expense for 2008 and 2007 primarily consisted of withholding taxes on certain cross-border transactions, alternative minimum taxes and foreign income taxes.
Net Income (Loss)
The following table presents a comparison of our net income (loss) for 2009, 2008 and 2007 (in thousands):
| Year Ended December 31, | 2009 vs. 2008 | 2008 vs. 2007 | |||||||||||||||||||||||
| 2009 | 2008 | 2007 | Change | % Change | Change | % Change | |||||||||||||||||||
| Net income (loss) |
$ | (13,299 | ) | $ | 6,375 | $ | 1,144 | $ | (19,674 | ) | (309 | )% | $ | 5,231 | 457 | % | |||||||||
| Percent of net revenue |
(17.8 | )% | 5.9 | % | 1.3 | % | |||||||||||||||||||
The net loss in 2009 as compared to the net income in 2008 was primarily the result of a decrease in net revenue, which resulted in a decrease of $14.9 million in gross margin, an increase in operating expenses and a decrease in interest income, partially offset by an increase in gross margin percentage and an increase in income tax benefit, as described above.
The increase in net income in 2008 as compared 2007 was primarily the result of an increase in net revenue, which resulted in an increase of $6.9 million in gross margin, and a decrease in selling, general and administrative expense, partially offset by a decrease in interest income and an increase in research and development expense, as described above.
Since inception, we have incurred significant losses resulting in an accumulated deficit of $363 million as of December 31, 2009. Our operating history and our business risks, including those risks set forth under the caption “Risk Factors” in Part I, Item 1A. and under the caption “Quantitative and Qualitative Disclosures About Market Risk,” in Part II, Item 7A., make the prediction of future results of operations difficult. As a result, we cannot assure you that we will achieve revenue growth or return to profitability in the future.
We have invested heavily in research and development of our ICs and subsystem module technology. We expect to continue our investment in these areas to further develop our products. This investment may include the continued recruitment of IC designers and systems engineers, and the acquisition of test and development equipment and software development tools for the expansion of our product portfolio. As a result, we may incur substantial losses from operations in the foreseeable future. Furthermore, there can be no assurance that our research and development efforts will result in the timely development and commercial release of products that achieve market acceptance.
47
Table of Contents
The time lag between product availability and volume shipment can be significant due to the sales process for our products, including customer qualification of our products. This delay can be from six months to as long as four years, during which we continue to develop our technology. Due to this lengthy product cycle, we may experience significant delays from the time we incur expenses for research and development, selling, general and administrative efforts, and investments in inventory, to the time we generate corresponding revenue. The rate of new orders may vary significantly from month to month and quarter to quarter. If anticipated sales or shipments in any quarter do not occur when expected, expenses and inventory levels could be disproportionately high, and our results of operations for that quarter, and potentially future quarters, would be materially and adversely affected.
Liquidity and Capital Resources
The following table presents a comparison of key components of our liquidity and capital resources for 2009, 2008 and 2007 (in thousands, except days sales outstanding in accounts receivable and inventory turns):
| Year Ended December 31, | 2009 vs. 2008 | 2008 vs. 2007 | |||||||||||||||||||||||
| 2009 | 2008 | 2007 | Change | % Change | Change | % Change | |||||||||||||||||||
| Operating cash flows |
$ | 2,811 | $ | 8,388 | $ | 4,358 | $ | (5,577 | ) | (66 | )% | $ | 4,030 | 92 | % | ||||||||||
| Investing cash flows |
(17,715 | ) | (42,462 | ) | 43,342 | 24,747 | 58 | (85,804 | ) | (198 | ) | ||||||||||||||
| Financing cash flows |
1,047 | (7,408 | ) | 1,971 | 8,455 | 114 | (9,379 | ) | (476 | ) | |||||||||||||||
| Capital expenditures |
$ | 821 | $ | 2,462 | $ | 1,408 | $ | (1,641 | ) | (67 | )% | $ | 1,054 | 75 | % | ||||||||||
| Days sales outstanding in accounts receivable |
38 | 32 | 37 | ||||||||||||||||||||||
| Inventory turns |
4.9 | 4.9 | 4.1 | ||||||||||||||||||||||
| December 31, | 2009 vs. 2008 | 2008 vs. 2007 | |||||||||||||||||||||||
| 2009 | 2008 | 2007 | Change | % Change | Change | % Change | |||||||||||||||||||
| Cash and cash equivalents |
$ | 32,291 | $ | 46,097 | $ | 87,537 | $ | (13,806 | ) | (30 | )% | $ | (41,440 | ) | (47 | )% | |||||||||
| Short-term investments |
50,000 | 40,000 | — | 10,000 | 25 | 40,000 | 100 | ||||||||||||||||||
| Total |
$ | 82,291 | $ | 86,097 | $ | 87,537 | $ | (3,806 | ) | (4 | )% | $ | (1,440 | ) | (2 | )% | |||||||||
| Accounts receivable, net |
$ | 7,830 | $ | 9,495 | $ | 9,489 | $ | (1,665 | ) | (18 | )% | $ | 6 | 0.0 | % | ||||||||||
| Inventories |
7,387 | 11,261 | 10,979 | (3,874 | ) | (34 | ) | 282 | 3 | ||||||||||||||||
| Working capital |
90,041 | 102,015 | 98,355 | (11,974 | ) | (12 | ) | 3,660 | 4 | ||||||||||||||||
In 2009, the decrease in cash provided by operating activities resulted primarily from a decrease in cash operating results, partially offset by working capital changes in inventory due to decreased inventory purchases, working capital changes in accounts receivable due to the timing of cash receipts and decreased net revenue, working capital changes in accrued compensation due to a decrease in the payment of amounts earned under the fiscal year 2008 Bonus Program and $7.7 million in reimbursements received from our directors’ and officers’ liability insurance carrier for professional fees incurred by two of our former officers who are involved in litigation with the SEC. See Note 10, “Commitments and Contingencies,” to the Notes to Consolidated Financial Statements. Cash operating results decreased in 2009 as compared to 2008 due to a decrease in net revenue, an increase in operating expenses and a decrease in interest income, as described above.
In 2008, the increase in cash provided by operating activities resulted primarily from an increase in cash operating results, significantly lower cash disbursements for license and maintenance fees for engineering software used to design our silicon products and $1.7 million reimbursed by our directors’ and officers’ liability insurance carrier for professional fees incurred by certain former officers of the Company who are involved in litigation with the SEC described above, partially offset by the payment of amounts earned under the fiscal year 2007 Bonus Program. Cash operating results increased in 2008 as compared to 2007 due to an increase in net revenue and a decrease in operating expenses, partially offset by a decrease in interest income, as described above. In 2007, the increase in cash provided by operating activities resulted primarily from an increase in cash operating results, partially offset by a $3.3 million payment for license and maintenance fees for engineering
48
Table of Contents
software used to design our silicon products and the purchase of inventories due to an increase in net revenue and expected demand for our products.
In 2009, our primary use of cash from investing activities was the purchase of certificates of deposit and the acquisition of Auvitek. In 2008, our primary use of cash from investing activities was the purchase of held-to-maturity investments and equipment related to testing and evaluation of our products. In 2007, our primary source of cash from investing activities was the sale of available-for-sale investments, partially offset by the purchase of available-for-sale investments.
In 2009, our primary source of cash from financing activities was the exercise of employee stock options and shares purchased by employees under the 2000 Employee Stock Purchase Plan. In 2008, our primary use of cash from financing activities was the repurchase of our common stock, partially offset by cash provided from shares purchased by employees under the 2000 Employee Stock Purchase Plan and the exercise of employee stock options. In 2007, our primary source of cash from financing activities was the exercise of employee stock options and shares purchased by employees under the 2000 Employee Stock Purchase Plan. See Note 11, “Stockholders’ Equity,” to the Notes to Consolidated Financial Statements.
Our cash and cash equivalents consisted of bank deposits and money market funds. Our short-term investments consisted of several certificates of deposit insured by the Federal Deposit Insurance Corporation (FDIC). The certificates of deposit have a contractual maturity of six months to one year and will mature during the second quarter and fourth quarter of 2010. We currently have no long-term debt. See Note 1, “Summary of Significant Accounting Policies,” to the Notes to Consolidated Financial Statements.
We expect our operating expenses to increase in the foreseeable future. As a result, our net cash flows will depend heavily on our level of future revenue and our ability to manage expenses.
Future Contractual Obligations
Lease Commitments
We lease our corporate headquarters and principal IC design center in Plano, Texas under an operating lease with a ten year term, which began in April 2005. Rent expense is calculated using the straight-line method over the lease term. We lease a research and development facility in Germany under an operating lease with a twenty-two year term, which began in December 1999. In addition, we lease a research and development facility in Shanghai, China under an operating lease with a two year term, which began in September 2009. We also lease certain other facilities under operating leases and certain equipment and software under operating and capital leases. Future minimum lease payments required under operating leases as of December 31, 2009 were as follows (in thousands):
| Year Ending December 31, |
|||
| 2010 |
$ | 1,717 | |
| 2011 |
1,475 | ||
| 2012 |
1,120 | ||
| 2013 |
982 | ||
| 2014 |
919 | ||
| Thereafter |
3,884 | ||
| Total future minimum lease payments |
$ | 10,097 | |
Rent expense for the years ended December 31, 2009, 2008 and 2007 was $1.6 million, $1.5 million and $1.4 million, respectively.
Purchase Commitments
As of February 5, 2010, we had approximately $13.8 million of cancelable and non-cancelable purchase commitments outstanding with our vendors. These commitments were entered into in the normal course of business.
49
Table of Contents
Other Commitments
We are currently subject to “line down” clauses in contracts with certain automotive entertainment electronics customers. Such clauses require us to pay financial penalties if our failure to supply product in a timely manner causes the customer to slow down or stop their production. We are also subject to product liability clauses and/or intellectual property indemnification clauses in some of our customer contracts. Such clauses require us to pay financial penalties if we supply defective product, which results in financial damages to the customer, or to indemnify the customer for third-party actions based on the alleged infringement by our products of a third party’s intellectual property. As of December 31, 2009, we were unaware of any significant claims by any of our customers.
See Note 10, “Commitments and Contingencies,” to the Notes to Consolidated Financial Statements.
CRITICAL ACCOUNTING POLICIES
Our discussion and analysis of our financial condition and results of operations are based on our Consolidated Financial Statements, which have been prepared in accordance with accounting principles generally accepted in the United States (GAAP). Note 1, “Summary of Significant Accounting Policies,” to the Notes to Consolidated Financial Statements describes the significant accounting policies essential to an understanding of our Consolidated Financial Statements. Preparation of our financial statements requires estimates, judgments and assumptions. We believe that the estimates, judgments and assumptions which we have used are appropriate and correct based upon information available to us at the time that they were made. These estimates, judgments and assumptions can affect our reported assets and liabilities as of the date of the financial statements, as well as the reported net revenue and expenses during the periods presented. If there are material differences between these estimates, judgments or assumptions and actual facts, our financial statements may be affected.
In many cases, the accounting treatment of a particular transaction is specifically dictated by GAAP and does not require our judgment in its application. There could be areas in which our judgment in selecting among available alternatives would not produce a materially different result, but there could be some areas in which our judgment in selecting among available alternatives would produce a materially different result. See the Notes to Consolidated Financial Statements that contain additional information regarding our accounting policies and other disclosures.
We believe the following to be our critical accounting policies. That is, they are both important to the portrayal of our financial condition and results, and they require significant estimates, judgments and assumptions about matters that are inherently uncertain.
Revenue Recognition
We recognize revenue when we receive a purchase order from our customer, our product has been shipped, title has transferred to our customer, the price that we will receive for our product is fixed or determinable and payment from our customer is considered probable. Title to our product transfers to our customer either when it is shipped to or received by our customer, based on the terms of our specific agreement with the customer.
Our revenue is recorded based on the facts then currently known to us. If we do not meet all the criteria above, we do not recognize revenue. If we are unable to determine the amount that is probable of collection once our product has shipped and title has transferred to our customer, we defer recognition of revenue until we can determine the amount that is probable of collection. We apply reasonable judgment in performing the credit assessment of each of our customers. Items that are considered when determining the amounts that are probable of collection include a customer’s overall creditworthiness, payment history and rights to return unsold product.
For certain of our customers, we do not recognize revenue until receipt of payment because collection is not probable or the amount we will ultimately collect is not determinable at the date of the shipment. Upon shipment of product to these customers, title to the inventory transfers to the customer and the customer is invoiced. We
50
Table of Contents
account for these transactions by recording accounts receivable for the revenue value of the shipments, as the shipments represent valid receivables, and reducing inventory for the cost of the inventory shipped. The difference, representing the gross margin on the transactions, is recorded as deferred revenue. For financial statement presentation purposes, this deferred revenue balance is offset against any outstanding corresponding accounts receivable balances from the customer. When payment is received for the transaction, revenue is recognized for the value of the cash payment, cost of revenue is recorded for the cost of the inventory and the deferred revenue is relieved for the gross margin on the transaction. At December 31, 2009 and 2008, the sales value of products shipped for which revenue was deferred was insignificant.
When we defer revenue, the timing and amount of revenue we ultimately recognize is determined upon our receipt of payment, which can result in significant fluctuations in net revenue from period to period. In 2009, 2008 and 2007, net revenue recognized upon receipt of payment was insignificant.
We also defer revenue when customers have made payments and we have not completed the earnings process. These payments are reflected as liabilities in our consolidated financial statements as deferred revenue. In these instances, we recognize revenue once the product is shipped, title has transferred to our customer and the earnings process is complete. Deferred revenue as a result of customer prepayments was insignificant as of December 31, 2009. Deferred revenue as a result of customer prepayments was $0.2 million as of December 31, 2008.
We grant limited stock rotation rights to certain distributors, allowing them to return qualifying product to us in accordance with their specific agreements for up to 5% of their aggregate net purchases for the previous six months. In these circumstances, we require the distributor to submit an offsetting purchase order that is, at a minimum, equivalent to the aggregate dollar amount of the product to be returned. We account for the return as a reduction to net revenue and a reduction to accounts receivable for the price of the items returned. Correspondingly, cost of revenue is reduced by the cost of returned inventory offset by an increase in inventory. Any returned inventory items are included in gross inventories, are reviewed along with our other inventory items and are recorded at the lower of cost or market. Historically, distributor returns under stock rotation rights have been insignificant. As a result, we do not establish a reserve for potential returns when product is shipped to distributors, rather we subsequently monitor distributor inventory levels and record a reserve for potential returns of estimated unsaleable inventory subject to stock rotation rights. We account for the reserve by reducing net revenue and cost of revenue. The difference, representing the gross margin on the transaction, is recorded as deferred revenue. We account for the shipment of replacement product as a sales transaction, which offsets the reduction of net revenue discussed above. At December 31, 2009, the sales value of product shipped for which revenue was reserved due to distributor stock rotation rights was insignificant. At December 31, 2008, the sales value of product shipped for which revenue was reserved due to distributor stock rotation rights was $0.2 million.
We typically have a significant portion of our quarterly net revenue represented in accounts receivable at the end of each financial quarter, often concentrated in significant balances from a limited number of customers. At December 31, 2009, approximately 55% of our net accounts receivable was due from five of our customers. The potential reduction in net revenue resulting from a hypothetical 10% adverse change in the ability or desire of our customers to pay amounts owed to us at December 31, 2009 resulting in the return of product previously delivered would have been approximately $0.8 million.
Allowance for Doubtful Accounts
We evaluate the collectability of our accounts receivable based on several factors, which inherently involves us applying judgment and determining certain estimates. In circumstances where we are aware of a specific customer’s inability to meet its financial obligations to us, we record a specific allowance for doubtful accounts against amounts due to us and reduce the net recorded receivable to the amount we reasonably believe will be collected. We also consider recognizing allowances for doubtful accounts based on the length of time the receivables are outstanding compared to contractual terms, industry and geographic concentrations, the current business environment and our historical experience. Accounts receivable included in the allowance for doubtful
51
Table of Contents
accounts are written-off after final collection efforts are exhausted. If the financial condition of our customers deteriorates or if economic conditions worsen, increases in the allowance for doubtful accounts may be required in the future. We cannot predict future changes in the financial stability of our customers, and there can be no assurance that our allowance for doubtful accounts will be adequate. Actual credit losses for 2009, 2008 and 2007 were insignificant. At December 31, 2009, the allowance for doubtful accounts was insignificant. No allowance for doubtful accounts was recorded as of December 31, 2008. The potential increase in the allowance for doubtful accounts resulting from a hypothetical 10% adverse change in the ability or desire of our customers to pay amounts owed to us at December 31, 2009 would have been approximately $0.8 million.
Inventory Valuation
Our inventories are stated at the lower of standard cost, which approximates actual cost, or estimated realizable value. Amounts are removed from inventory using the first-in, first-out (FIFO) method. Adjustments to reduce our inventories to estimated realizable value, including allowances for excess and obsolete inventories, are determined quarterly by comparing inventory levels of individual materials and parts to current demand forecasts for those items. Our analysis of current and future demand for our products involves estimates and judgments by us. In addition, we review other individual facts and circumstances to determine necessary adjustments to reduce our inventories to estimated realizable value, including current manufacturing yields, product returns and warranty claims, which may also involve judgments by us. Actual amounts realized upon the sale of inventories may differ from estimates used to determine inventory valuation allowances due to changes in customer demand, technology changes and other factors. The net impact of changes in the inventory valuation allowance and accrued noncancelable inventory purchase obligations was a charge to cost of revenue of $0.1 million, $0.2 million and $0.6 million for 2009, 2008 and 2007, respectively. The potential change in the inventory valuation allowance resulting from a hypothetical 10% adverse change in the current demand forecasts for individual materials and parts would have been insignificant at December 31, 2009.
Income Taxes
Our income taxes are computed using the asset and liability method of accounting. Under the asset and liability method, a deferred income tax asset or liability is recognized for estimated future tax effects attributable to temporary differences and carryforwards. The measurement of deferred income tax assets is adjusted by a valuation allowance, if necessary, to recognize future income tax benefits only to the extent, based on available evidence, it is more likely than not such benefits will be realized. These analyses often involve applying judgments or estimates. Our net deferred tax assets were fully reserved at December 31, 2009 and 2008 due to uncertainties in realizing future income tax benefits as a result of our history of generating net losses. Changes in uncertain income tax positions were as follows (in thousands):
| Balance at December 31, 2008 |
$ | 113 | ||
| Tax positions assumed in acquisition of Auvitek |
756 | |||
| Tax positions taken prior to 2009 |
(23 | ) | ||
| Tax positions taken in 2009 |
48 | |||
| Income taxes paid in 2009 |
(74 | ) | ||
| Interest recorded in 2009 |
9 | |||
| Effect of changes in foreign currency exchange rates |
4 | |||
| Balance at December 31, 2009 |
$ | 833 | ||
At December 31, 2009, the uncertain income tax positions were related to transfer pricing adjustments with foreign subsidiaries acquired with Auvitek and foreign withholding taxes on certain cross-border transactions. See Note 2 and Note 9 to Notes to Consolidated Financial Statements. Uncertain income tax positions could materially change within the next twelve months, depending on the resolution of transfer pricing adjustments discussed above.
52
Table of Contents
We recognize interest and penalties related to uncertain income tax positions in income tax expense. Interest and penalties of $0.2 million were accrued at December 31, 2009 related to uncertain income tax positions assumed in the acquisition of Auvitek. No interest and penalties related to uncertain income tax positions were accrued at December 31, 2008.
In conjunction with the purchase price allocation for the acquisition of Auvitek, we recorded an indemnification asset of $0.7 million representing the selling shareholders’ obligation to indemnify Microtune for the outcome of potential contingent liabilities relating to uncertain tax positions. See Note 2, “Acquisition of Auvitek International Ltd.,” to Notes to Consolidated Financial Statements. At December 31, 2009, the indemnification asset was $0.7 million. Upon expiration of the selling shareholders’ obligation to indemnify us in July 2011, we will incur a charge to write-off any remaining indemnification asset and be responsible for the outcome of potential contingent liabilities relating to uncertain tax positions.
Due to our net operating loss carryforward position, tax years in the United States remain open to examination until three years after the net operating losses from each year are utilized. Potential examination adjustments are limited to the net operating losses utilized from each year. For our international operations, the tax years 2005 through 2009 remain open to examination by the major taxing jurisdictions in which we operate.
We have established a valuation allowance to fully reserve our net deferred tax assets at December 31, 2009 and 2008 due to the uncertainty of the timing and amount of future taxable income. For United States federal income tax purposes, at December 31, 2009, we had a net operating loss carryforward of approximately $182.1 million and an unused research and development credit carryforward of approximately $4.4 million, that will begin to expire in 2021. If we generate United States taxable income in future periods, reversal of this valuation allowance could have a significant positive impact on net income in the period that it becomes more likely than not that the deferred tax assets will be utilized. A change in ownership, as defined in Section 382 of the Internal Revenue Code, may limit utilization of the United States federal net operating loss and research and development credit carryforwards.
Stock-Based Compensation
We account for all share-based payment awards to employees and directors, including stock options, restricted stock units and employee stock purchases related to our employee stock purchase plan, using the fair value recognition provisions of ASC 718 and the provisions of Staff Accounting Bulletin No. 107, issued by the SEC. We use the Black-Scholes-Merton option-pricing formula to value share-based payments granted to employees and attribute the value of stock-based compensation to expense using the straight-line single option method. Stock-based compensation expense recognized each period includes: (1) compensation cost for all share-based payments granted prior to, but not yet vested as of January 1, 2006, based on the measurement date fair value estimate in accordance with the original provisions of SFAS No. 123, and (2) compensation cost for all share-based payments granted subsequent to January 1, 2006, based on the measurement date fair value estimate in accordance with the provisions of ASC 718. Stock-based compensation expense recognized each period is based on the greater of the value of the portion of share-based payment awards under the straight-line method or the value of the portion of share-based payment awards that is ultimately expected to vest during the period. In accordance with ASC 718, we estimate forfeitures at the time of grant and revise our estimates, if necessary, in subsequent periods if actual forfeitures differ materially from those estimates. Stock-based compensation expense under ASC 718 for the 2009, 2008 and 2007 was $4.8 million, $4.8 million and $6.1 million, respectively, relating to employee and director stock options, restricted stock units and our employee stock purchase plan. See Note 11, “Stockholders’ Equity,” to Notes to Consolidated Financial Statements.
ASC 718 requires the cash flows resulting from the tax benefits resulting from tax deductions in excess of the compensation cost recognized for those options (excess tax benefits) to be classified as financing cash flows. Due to our historical net operating loss position, we have not recorded these excess tax benefits at December 31, 2009 and 2008.
53
Table of Contents
At December 31, 2009, we had five stock-based compensation plans covering employees and directors, including four equity award plans and our employee stock purchase plan. During 2009, we granted our employees and directors 861,210 restricted stock units. The restricted stock units generally vest over the following three to five years. No stock options were granted during 2009. The weighted-average estimated fair value of the stock options granted during 2008 and 2007 was approximately $2.01 and $2.43 per share, respectively, using the Black-Scholes-Merton option-pricing formula with the following weighted-average assumptions:
| Year Ended December 31, | |||||||||
| 2009 | 2008 | 2007 | |||||||
| Expected volatility |
57.92 | % | 57.30 | % | 55.50 | % | |||
| Risk-free interest rate |
2.19 | % | 2.60 | % | 4.50 | % | |||
| Expected dividends |
0.00 | % | 0.00 | % | 0.00 | % | |||
| Expected term (years) |
5 | 5 | 5 | ||||||
The expected volatility assumptions were based upon a combination of historical stock price volatility and implied volatility consistent with ASC 718. The historical stock price volatility was measured on a weekly basis due to the relatively high volatility of the market value of our common stock and excluded periods before the third quarter of 2003 as the volatility during these periods was not indicative of expected volatility. Due to the relatively low volume of the traded options on our common stock, we measured implied volatility using traded options with terms of at least 6 months. Expected volatility was calculated using 75% of the historical stock price volatility and 25% of the implied volatility. The fair value of a stock option would have increased approximately 7% from a hypothetical 10% increase in expected volatility as of December 31, 2008.
The risk-free interest rate assumptions were based upon the implied yields from the U.S. Treasury zero-coupon yield curve with a remaining term equal to the expected term of the options. The fair value of a stock option would have increased approximately 1% from a hypothetical 10% increase in the risk-free interest rate as of December 31, 2008.
The expected terms of employee stock options represented the weighted-average period the stock options were expected to remain outstanding and was based upon historical employee exercise behavior and expected employee turnover. The fair value of a stock option would have increased approximately 4% from a hypothetical 10% increase in the expected term as of December 31, 2008.
The average per share value of restricted stock units granted during 2009, 2008 and 2007 was $2.09, $4.58 and $4.49, respectively, using our closing stock price on the respective grant dates.
At December 31, 2009, the balance of unearned stock-based compensation to be expensed in future periods related to unvested share-based awards, as adjusted for expected forfeitures, was approximately $4.5 million. The weighted-average period over which the unearned stock-based compensation was expected to be recognized was approximately 2 years. We anticipate that we will grant additional share-based awards to employees in the future, which will increase the stock-based compensation expense by the additional unearned compensation resulting from these grants. The fair value of these grants is not included in the amount above, as the impact of these grants cannot be predicted at this time because it will depend on the number of share-based payments granted. In addition, if factors change and we employ different assumptions in the application of ASC 718 in future periods, the stock-based compensation expense that we record under ASC 718 may differ significantly from what we have recorded in the current period.
Employee Stock Purchase Plan
Our Employee Stock Purchase Plan has been deemed compensatory in accordance with ASC 718. Stock-based compensation relating to this plan was estimated as of the respective grant dates of the purchase rights provided to employees under the plan using a Black-Scholes-Merton option-pricing formula and the same
54
Table of Contents
assumptions used for valuing stock options as disclosed under ASC 718 above. The weighted-average estimated value of the purchase rights outstanding under this plan during 2009, 2008 and 2007 was $0.67, $1.29 and $1.77 per right, respectively. During 2009, 2008 and 2007, we recognized $0.4 million, $0.3 million and $0.4 million, respectively, of stock-based compensation expense relating to the plan.
Commitments and Contingencies
We may be subject to the possibility of loss contingencies for various legal matters. Our discussion of legal matters includes pending litigation and matters in which any party has manifested a present intention to commence litigation related to such matters. There can be no assurance that additional contingencies of a legal nature or having legal aspects will not be asserted in the future. Such matters could relate to prior transactions or events or future transactions and events. See Note 10, “Commitments and Contingencies,” to Notes to Consolidated Financial Statements. We regularly evaluate current information available to us to determine whether any provisions for loss should be made. If we ultimately determine that a provision for loss should be made for a legal matter, the provision for loss could have a material and adverse effect on our operating results and financial condition.
Our future cash commitments are primarily for long-term facility leases. See Note 10, “Commitments and Contingencies,” to Notes to Consolidated Financial Statements.
OTHER FINANCIAL INFORMATION
RECENT ACCOUNTING PRONOUNCEMENTS
Recent Accounting Pronouncements
ASC Topic 805, Business Combinations (ASC 805), (prior authoritative literature: Statement No. 141(R), Business Combinations (SFAS No. 141(R)) issued by the FASB in December 2007 and Statement No. 160, Accounting and Reporting of Noncontrolling Interests in Consolidated Financial Statements, an amendment of ARB No. 51) changed the financial accounting and reporting of business combination transactions and noncontrolling (or minority) interests in consolidated financial statements. ASC 805 is effective for business combination transactions for which the acquisition date is on or after the beginning of the first annual reporting period beginning on or after December 15, 2008. The requirements under this standard were applied to the acquisition of Auvitek. See Note 2, “Acquisition of Auvitek International Ltd.,” to Notes to Consolidated Financial Statements.
ASC Topic 820, Fair Value Measurements and Disclosures (ASC 820), (prior authoritative literature: Statement No. 157, Fair Value Measurements), issued by the FASB in September 2006, defines fair value, establishes a framework for measuring fair value in GAAP, and requires enhanced disclosures about fair value measurements. The provisions of ASC 820 relating to nonfinancial assets, primarily goodwill, and nonfinancial liabilities that are recognized or disclosed at fair value on a nonrecurring basis were effective as of January 1, 2009. The requirements under this standard were applied to the measurement of the fair value assigned to acquired assets and liabilities in the acquisition of Auvitek. See Note 2, “Acquisition of Auvitek International Ltd.,” to Notes to Consolidated Financial Statements.
ASC Topic 855, Subsequent Events (ASC 855), (prior authoritative literature: SFAS No. 165, Subsequent Events issued by the FASB in May 2009) establishes general standards of accounting for and disclosure of events that occur after the balance sheet date but before the date the financial statements are issued or available to be issued. ASC 855 requires companies to reflect in their financial statements the effects of subsequent events that provide additional evidence about conditions at the balance sheet date. Subsequent events that provide evidence about conditions that arose after the balance sheet date should be disclosed if the financial statements would otherwise be misleading. Disclosures should include the nature of the event and either an estimate of its financial effect or a statement that an estimate cannot be made. ASC 855 is effective for interim and annual financial periods ending after June 15, 2009, and should be applied prospectively. The requirements under this standard did not impact our financial condition or results of operations because they are consistent with our current practice.
55
Table of Contents
| ITEM 7A. | QUANTITATIVE AND QUALITATIVE DISCLOSURES ABOUT MARKET RISK. |
The following discusses our exposure to market risk related to changes in foreign currency exchange rates and interest rates. This discussion contains forward-looking statements that are subject to risks and uncertainties. Actual results could vary materially as a result of a number of factors including those set forth in Item 1A., “Risk Factors.”
Risks Related to Foreign Currency Exchange Rates
We transact both sales and purchases in foreign currencies. Due to the volatile nature of the currency markets, there is a potential risk of foreign currency translation losses, as well as gains. As a result, our financial results could be significantly affected by factors such as changes in foreign currency exchange rates or weak economic conditions in the foreign markets in which we produce and distribute our products.
A portion of our net revenue is transacted in the Euro. During 2009, we generated approximately $2.4 million in net revenue from Euro denominated transactions. The potential loss in net revenue for 2009 resulting from a hypothetical 10% adverse change in foreign exchange rates would have been approximately $0.2 million; however, this impact would likely be reduced or partially offset by a similar impact in our Euro denominated expenses.
A significant portion of our operations consists of design and sales activities in foreign jurisdictions. Our products are manufactured in the Philippines, Germany, China and South Korea as well as the United States. We incur operating costs in currencies other than the United States Dollar, particularly the Euro. During 2009, we incurred approximately $8.5 million in operating costs from Euro denominated transactions, mostly at our German design facility. The potential increase in operating costs for 2009 resulting from a hypothetical 10% adverse change in foreign exchange rates would have been approximately $0.9 million; however, this impact would likely be reduced or offset by a similar impact in our Euro denominated net revenue.
We currently do not use derivative financial instruments to hedge our balance sheet exposures against future movements in exchange rates. However, we are currently evaluating our exchange rate risk management strategy, including changes in our organizational structure and other capital structuring techniques to manage our currency risk. Our net investment in foreign subsidiaries, translated to United States Dollars using exchange rates at December 31, 2009, was insignificant. A potential loss in the value of net monetary assets related to this net investment resulting from a hypothetical 10% adverse change in foreign exchange rates would be insignificant as of December 31, 2009.
Risks Related to Interest Rates
Currently, our cash and cash equivalents are held in bank deposits and money market funds. Our short-term investments consisted of several certificates of deposit insured by the FDIC. The carrying values of our cash and cash equivalents and short-term investments approximate market value. Our cash and cash equivalents that exceed FDIC insurance limits are subject to interest rate risk, the risk that our financial condition and results of operations could be adversely affected due to movements in interest rates. If interest rates were to decrease by 100 basis points, our interest income would decrease by approximately $0.8 million based on our cash and cash equivalents and short-term investments as of December 31, 2009.
| ITEM 8. | FINANCIAL STATEMENTS AND SUPPLEMENTARY DATA. |
The information required by this item is incorporated by reference to our Consolidated Financial Statements set forth on pages F-1 through F-34 hereof.
56
Table of Contents
| ITEM 9. | CHANGES IN AND DISAGREEMENTS WITH ACCOUNTANTS ON ACCOUNTING AND FINANCIAL DISCLOSURE. |
None.
| ITEM 9A. | CONTROLS AND PROCEDURES. |
Effectiveness of Disclosure Controls and Procedures. We are required to maintain disclosure controls and procedures (as defined in Rules 13a-15(e) and 15d-15(e) under the Exchange Act) that are designed to ensure that required information is recorded, processed, summarized and reported within the required timeframe, as specified in the rules set forth by the SEC. Our disclosure controls and procedures are also designed to ensure that information required to be disclosed is accumulated and communicated to management, including our Chief Executive Officer and Chief Financial Officer, to allow timely decisions regarding required disclosures.
Our management, with the participation of our Chief Executive Officer and Chief Financial Officer, has evaluated the effectiveness of our disclosure controls and procedures as of December 31, 2009 and, based on this evaluation, our Chief Executive Officer and Chief Financial Officer have concluded that our disclosure controls and procedures were effective as of December 31, 2009.
Management’s Annual Report on Internal Control Over Financial Reporting. Management is responsible for establishing and maintaining adequate internal control over financial reporting, as such term is defined in Exchange Act Rules 13a-15(f) and 15d-15(f). Internal control over financial reporting is a process designed by, or under the supervision of, our Chief Executive Officer and Chief Financial Officer, and effected by our Board, management and other personnel, to provide reasonable assurance regarding the reliability of financial reporting and the preparation of financial statements for external purposes in accordance with generally accepted accounting principles.
Internal control over financial reporting includes those policies and procedures that (1) pertain to the maintenance of records that, in reasonable detail, accurately and fairly reflect the transactions and dispositions of the assets of the company; (2) provide reasonable assurance that transactions are recorded as necessary to permit preparation of financial statements in accordance with generally accepted accounting principles, and that our receipts and expenditures are being made only in accordance with authorizations of our management and directors; and (3) provide reasonable assurance regarding prevention or timely detection of unauthorized acquisition, use, or disposition of our assets that could have a material effect on our financial statements.
Because of its inherent limitations, internal control over financial reporting may not prevent or detect misstatements. Forward looking statements regarding the effectiveness of internal controls during future periods are subject to the risk that controls may become inadequate because of changes in conditions, or that the degree of compliance with the policies and procedures may deteriorate.
Management assessed the effectiveness of our internal control over financial reporting as of December 31, 2009. In making this assessment, management used the criteria set forth by the Committee of Sponsoring Organizations of the Treadway Commission (COSO) in Internal Control—Integrated Framework. Based on our assessment, we believe that, as of December 31, 2009, our internal control over financial reporting was effective based on those criteria.
The SEC’s general guidance permits the exclusion of an assessment of the effectiveness of a registrant’s disclosure controls and procedures as they relate to its internal control over financial reporting for an acquired business during the first year following such acquisition if, among other circumstances and factors, there is not adequate time between the acquisition date and the date of assessment. As previously noted in this Annual Report on Form 10-K, we completed the acquisition of Auvitek on July 31, 2009. Auvitek represented 2% of our total assets as of December 31, 2009 and 1% of our net revenues for the year ended December 31, 2009. Management’s assessment and conclusion on the effectiveness of our disclosure controls and procedures and internal control over financial reporting as of December 31, 2009 excludes an assessment of the internal control over financial reporting of Auvitek.
57
Table of Contents
Our internal control over financial reporting as of December 31, 2009, has been audited by KPMG LLP, the independent registered public accounting firm who also audited our consolidated financial statements. KPMG LLP’s report on our internal control over financial reporting appears on page F-3 hereof.
Changes in Internal Control over Financial Reporting. There has been no change in our internal control over financial reporting that occurred during the quarter ended December 31, 2009 that has materially affected, or is reasonably likely to materially affect, our internal control over financial reporting.
| ITEM 9B. | OTHER INFORMATION. |
None.
58
Table of Contents
PART III
Certain information required by Part III is omitted from this Form 10-K because we will file a definitive Proxy Statement pursuant to Regulation 14A (the “Proxy Statement”) not later than 120 days after the end of the fiscal year covered by this Form 10-K, and certain information to be included therein is incorporated herein by reference.
| ITEM 10. | DIRECTORS, EXECUTIVE OFFICERS AND CORPORATE GOVERNANCE. |
The information required by this Item is incorporated by reference to the Proxy Statement under the headings “Microtune Corporate Governance,” “Proposal No. 1-Election of Directors,” “Executive Compensation” and “Section 16(a) Beneficial Ownership Reporting Compliance.”
SECTION 16(A) BENEFICIAL OWNERSHIP REPORTING COMPLIANCE
The information required by this Item is incorporated by reference to the Proxy Statement under the heading “Section 16(a) Beneficial Ownership Reporting Compliance.”
CODE OF ETHICS
In June 2004, our Board adopted and we implemented a Code of Ethics and Business Conduct to promote the honest and ethical conduct of all of our directors, officers and employees, including the ethical handling of actual or apparent conflicts of interest between personal and professional relationships; to promote full, fair, accurate, timely and understandable disclosure in periodic reports required to be filed by us; to promote compliance with all applicable laws, rules and regulations that apply to us and our directors, officers and employees; to promote prompt internal reporting of violations of the code to an appropriate person identified in the code; and to promote accountability for adherence to the code. A copy of our Code of Ethics and Business Conduct is available on our website at www.microtune.com.
| ITEM 11. | EXECUTIVE COMPENSATION. |
The information required by this Item is incorporated by reference to the Proxy Statement under the heading “Executive Compensation.”
| ITEM 12. | SECURITY OWNERSHIP OF CERTAIN BENEFICIAL OWNERS AND MANAGEMENT AND RELATED STOCKHOLDER MATTERS. |
The information required by this Item is incorporated by reference to the Proxy Statement under the heading “Security Ownership of Certain Beneficial Owners and Management and Related Stockholder Matters.”
| ITEM 13. | CERTAIN RELATIONSHIPS AND RELATED TRANSACTIONS, AND DIRECTOR INDEPENDENCE. |
The information required by this Item is incorporated by reference to the Proxy Statement under the heading “Certain Relationships and Related Transactions, and Director Independence.”
| ITEM 14. | PRINCIPAL ACCOUNTING FEES AND SERVICES. |
The information required by this Item is incorporated by reference to the Proxy Statement under the heading “Principal Accounting Fees and Services.”
59
Table of Contents
PART IV
| ITEM 15. | EXHIBITS, FINANCIAL STATEMENT SCHEDULES. |
(a)(1) FINANCIAL STATEMENTS
The following Consolidated Financial Statements, related Notes and Reports of Independent Registered Public Accounting Firms are incorporated by reference into Item 8. of Part II of this Annual Report on Form 10-K:
(a)(2) FINANCIAL STATEMENT SCHEDULES
See Item 15.(c) below.
(a)(3) EXHIBITS
| Exhibit |
||
| 2.1(22) | Agreement and Plan of Merger dated July 10, 2009 by and among Microtune, Inc., Arrow Acquisition Ltd., Auvitek International Ltd. and the Shareholders Representative. | |
| 3.1(1) | Restated Certificate of Incorporation of Microtune, Inc. filed with the Secretary of State of the State of Delaware on May 25, 2005. | |
| 3.2(20) | Amended and Restated Bylaws of Microtune, Inc., as amended July 23, 2008. | |
| 10.1(2)# | Amended and Restated 1996 Stock Option Plan and form of agreements thereunder. | |
| 10.2(4)# | Amended and Restated Microtune, Inc. 2000 Stock Plan. | |
| 10.3(5)# | Form of Common Stock Equivalent Agreement between the Registrant and Participants in the Amended and Restated Microtune, Inc. 2000 Stock Plan. | |
| 10.4(4)# | Amended and Restated Microtune, Inc. 2000 Director Stock Plan and form of agreements thereunder. | |
| 10.5(4)# | Amended and Restated Microtune, Inc. 2000 Employee Stock Purchase Plan and form of agreements thereunder. | |
| 10.6(6)# | Description of Microtune, Inc. 2007 Incentive Compensation Program. | |
| 10.7(7)# | Description of Microtune, Inc. 2008 Incentive Compensation Program. | |
| 10.8(2)# | Form of Indemnification Agreement between the Registrant and each of its directors and executive officers. | |
| 10.9(8)# | Form of Section 16 Change of Control Agreement entered into with each of James A. Fontaine, Robert S. Kirk and Phillip D. Peterson. | |
| 10.10(9)# | Change of Control Agreement entered into between Barry F. Koch and the Registrant on October 24, 2007. | |
| 10.11(9)# | Amended and Restated Managing Director Contract entered into between Barry F. Koch and Microtune GmbH & Co. KG on October 24, 2007. | |
| 10.12(3)# | Executive Officer Sales Incentive Compensation Plan (as amended and restated on April 29, 2008). | |
60
Table of Contents
| Exhibit |
||
| 10.13(2) | Commercial Lease Agreement between Jupiter Service Center, Ltd. and the Registrant for the premises located at 2201 10th Street, Plano, Texas 75074, dated March 24, 2000. | |
| 10.14(10) | First Amendment to Commercial Lease Agreement by and between Jupiter Service Center, Ltd. and the Registrant for the premises located at 2201 10th Street, Plano, Texas 75074, dated April 8, 2005. | |
| 10.15(2) | Property Leasing Contract between Sanetor Grundstucks-Vermietungsgessellschaft GmbH & Co KG. and Temic Telefunken Hochfrequenztechnik GmbH for facility in Ingolstadt, Germany, as supplemented as of January 1, 2000. | |
| 10.16(11) | Rights Agreement between the Registrant and Computershare Investor Services, LLC, as Rights Agent (including as Exhibit A the Form of Certificate of Designation, Preferences and Rights of the terms of Registrants’ Series A Preferred Stock, as Exhibit B the Form of Right Certificate, and as Exhibit C the Summary of Terms of Rights Agreement), dated as of March 4, 2002. | |
| 10.17(12)* | Settlement Agreement between Broadcom Corporation and the Registrant, dated June 13, 2004. | |
| 10.18(12)* | Patent License Agreement between Broadcom Corporation and the Registrant, dated June 13, 2004. | |
| 10.19(12)* | Business Agreement between Broadcom Corporation and the Registrant, dated June 13, 2004. | |
| 10.20(13) | Amendment No. 1 dated August 13, 2004 to Settlement Agreement between Broadcom Corporation and the Registrant, dated June 13, 2004. | |
| 10.21(13)* | Amendment No. 1 dated August 13, 2004 to Patent License Agreement between Broadcom Corporation and the Registrant, dated June 13, 2004. | |
| 10.22(13) | Stipulation and Agreement of Settlement between Michael Blizman, Nathan Hostacky, Michael Morris, and Phung Vu and Microtune, Inc., James A. Fontaine, James H. Clardy, William P. Tai, Harvey B. Cash, Walter S. Ciciora, Steven Craddock, Anthony J. LeVecchio, Douglas J. Bartek, William Housley, Everett Rogers, and Nancy A. Richardson, dated January 10, 2005. | |
| 10.23(13)* | Custom Sales Agreement between International Business Machines Corporation and the Registrant, dated June 13, 2000. | |
| 10.24(13)* | Amendment 1 to the Custom Sales Agreement No. 000569 between International Business Machines Corporation and the Registrant, dated January 14, 2005. | |
| 10.25(14)* | Amendment 2 to the Custom Sales Agreement No. 000569 between International Business Machines Corporation and the Registrant, dated September 29, 2006. | |
| 10.26(16)* | Amendment 3 to the Custom Sales Agreement No. 000569 between International Business Machines Corporation and the Registrant, dated January 28, 2009. | |
| 10.27(15)* | Sixth Amended and Restated Semiconductor Custom Manufacturing Attachment No. 1 to the Custom Sales Agreement between International Business Machines Corporation and the Registrant, dated January 7, 2008. | |
| 10.28(16)* | Seventh Amended and Restated Semiconductor Custom Manufacturing Attachment No. 1 to the Custom Sales Agreement between International Business Machines Corporation and the Registrant, dated January 28, 2009. | |
| 10.29(16)* | Semiconductor Custom Manufacturing Attachment No. 2 to the Custom Sales Agreement between International Business Machines Corporation and the Registrant, dated January 28, 2009. | |
| 10.30(17)* | Manufacturing Agreement between Ionics EMS, Inc. and Microtune (Texas) L.P., dated May 24, 2005. | |
| 10.31(3) | Second Amendment to Manufacturing Agreement between Ionics EMS, Inc. and Microtune (Texas) L.P., dated as of January 1, 2008. | |
| 10.32(21) | Third Amendment to Manufacturing Agreement between Microtune (Texas), L.P. and Ionics EMS, Inc. dated September 21, 2009. | |
| 14.1(18) | Code of Ethics and Business Conduct. | |
| 16.1(19) | Letter from Ernst & Young, LLP, dated March 17, 2008 to the Securities and Exchange Commission. | |
61
Table of Contents
| Exhibit |
||
| 21.1 | Subsidiaries of Registrant. | |
| 23.1 | Consent of KPMG LLP, independent registered public accounting firm. | |
| 23.2 | Consent of Ernst & Young LLP, independent registered public accounting firm. | |
| 24.1 | Power of Attorney (see page 64). | |
| 31.1 | Certification of the Chief Executive Officer under Section 302 of the Sarbanes-Oxley Act of 2002. | |
| 31.2 | Certification of the Chief Financial Officer under Section 302 of the Sarbanes-Oxley Act of 2002. | |
| 32.1** | Certification of the Chief Executive Officer under Section 906 of the Sarbanes-Oxley Act of 2002. | |
| 32.2** | Certification of the Chief Financial Officer under Section 906 of the Sarbanes-Oxley Act of 2002. | |
| (1) | Incorporated by reference to the Registrant’s Current Report on Form 8-K filed on May 31, 2005. |
| (2) | Incorporated by reference to the Registrant’s Registration Statement on Form S-1 (Registration No. 333-36340), declared effective August 4, 2000. |
| (3) | Incorporated by reference to the Registrant’s Current Report on form 8-K filed on May 2, 2008. |
| (4) | Incorporated by reference to the Registrant’s Definitive Proxy Statement on Schedule 14A filed on March 12, 2009. |
| (5) | Incorporated by reference to the Registrant’s Current Report on Form 8-K filed on June 8, 2006. |
| (6) | Incorporated by reference to the Registrant’s Current Report on Form 8-K filed on March 5, 2007. |
| (7) | Incorporated by reference to the Registrant’s Current Report on Form 8-K filed on February 12, 2008. |
| (8) | Incorporated by reference to the Registrant’s Current Report on Form 8-K filed on May 3, 2007. |
| (9) | Incorporated by reference to the Registrant’s Current Report on Form 8-K filed on October 25, 2007. |
| (10) | Incorporated by reference to the Registrant’s Current Report on Form 8-K filed on April 14, 2005. |
| (11) | Incorporated by reference to the Registrant’s Current Report on Form 8-K filed on March 18, 2002 (File No. 000-31029-40). |
| (12) | Incorporated by reference to the Registrant’s Quarterly Report on Form 10-Q for the quarter ended June 30, 2004, filed on August 4, 2004 (File No. 000-31029-40). |
| (13) | Incorporated by reference to the Registrant’s Annual Report on Form 10-K for the year ended December 31, 2004, filed on March 11, 2005. |
| (14) | Incorporated by reference to the Registrant’s Current Report on Form 8-K filed on October 11, 2006. |
| (15) | Incorporated by reference to the Registrant’s Current Report on Form 8-K filed on January 8, 2008. |
| (16) | Incorporated by reference to the Registrant’s Current Report on Form 8-K filed on February 3, 2009. |
| (17) | Incorporated by reference to the Registrant’s Quarterly Report on Form 10-Q for the quarter ended June 30, 2005, filed on August 1, 2005. |
| (18) | Incorporated by reference to the Registrant’s Current Report on Form 10-K for the year ended December 31, 2005, filed on March 3, 2006. |
| (19) | Incorporated by reference to the Registrant’s Current Report on Form 8-K filed on March 17, 2008. |
| (20) | Incorporated by reference to the Registrant’s Current Report on Form 8-K filed on July 28, 2008. |
| (21) | Incorporated by reference to the Registrant’s Current Report on Form 8-K filed on September 22, 2009. |
| (22) | Incorporated by reference to the Registrant’s Current Report on Form 8-K filed on July 10, 2009. |
| * | Portions of this exhibit were omitted pursuant to a request for confidential treatment and filed separately. |
| ** | Furnished herewith. |
| # | Identifies exhibit that consists of or includes a management contract or compensatory plan or arrangement. |
(b) Exhibits
See Item 15.(a)(3) above.
(c) Financial Statement Schedules
All schedules for which provision is made in the applicable accounting regulations of the Securities and Exchange Commission have been omitted because of the absence of the conditions under which they are required or because the information required is included in our Consolidated Financial Statements or Notes thereof.
62
Table of Contents
Pursuant to the requirements of Section 13 or 15(d) of the Securities Exchange Act of 1934, the Registrant has duly caused this report to be signed on its behalf by the undersigned, thereunto duly authorized.
| MICROTUNE, INC. | ||
| By: | /S/ JUSTIN M. CHAPMAN | |
| Justin M. Chapman Chief Financial Officer (Principal Financial Officer and Principal
Accounting | ||
Date: February 16, 2010
63
Table of Contents
POWER OF ATTORNEY
By signing this Annual Report on Form 10-K below, I hereby appoint each of James A. Fontaine and Justin M. Chapman, as my attorney-in-fact to sign any and all amendments to this Annual Report on Form 10-K on my behalf, and to file this Annual Report on Form 10-K (including all exhibits and other documents related to the Annual Report on Form 10-K) with the Securities and Exchange Commission. I authorize each of my attorneys-in-fact to (1) appoint a substitute attorney-in-fact for himself and (2) perform any actions that he believes are necessary or appropriate to carry out the intention and purpose of this Power of Attorney. I ratify and confirm all lawful actions taken directly or indirectly by my attorneys-in-fact and by any properly appointed substitute attorneys-in-fact.
Pursuant to the requirements of the Securities Exchange Act of 1934, this Annual Report on Form 10-K has been signed below by the following persons on behalf of the Registrant and in the capacities and on the dates indicated.
| Signature |
Title |
Date | ||||
| By: |
/s/ JAMES A. FONTAINE James A. Fontaine |
Chief Executive Officer, President and Director (Principal Executive Officer) | February 16, 2010 | |||
| By: |
/s/ JUSTIN M. CHAPMAN Justin M. Chapman |
Chief Financial Officer (Principal Financial Officer and Principal Accounting Officer) | February 16, 2010 | |||
| By: |
/s/ WALTER S. CICIORA Walter S. Ciciora |
Director | February 16, 2010 | |||
| By: |
/s/ JAMES H. CLARDY James H. Clardy |
Director | February 16, 2010 | |||
| By: |
/s/ STEVE CRADDOCK Steve Craddock |
Director | February 16, 2010 | |||
| By: |
/s/ ANTHONY J. LEVECCHIO Anthony J. LeVecchio |
Director | February 16, 2010 | |||
| By: |
/s/ BERNARD T. MARREN Bernard T. Marren |
Director | February 16, 2010 | |||
| By: |
/s/ MICHAEL T. SCHUEPPERT Michael T. Schueppert |
Director | February 16, 2010 | |||
| By: |
/s/ WILLIAM P. TAI William P. Tai |
Director | February 16, 2010 | |||
| By: |
/s/ A. TRAVIS WHITE A. Travis White |
Director | February 16, 2010 | |||
64
Table of Contents
REPORT OF INDEPENDENT REGISTERED PUBLIC ACCOUNTING FIRM
The Board of Directors and Stockholders
Microtune, Inc.:
We have audited the accompanying consolidated balance sheets of Microtune, Inc. as of December 31, 2009 and 2008, and the related consolidated statements of operations, stockholders’ equity, and cash flows for each of the years then ended. These consolidated financial statements are the responsibility of the Company’s management. Our responsibility is to express an opinion on these consolidated financial statements based on our audits.
We conducted our audits in accordance with the standards of the Public Company Accounting Oversight Board (United States). Those standards require that we plan and perform the audit to obtain reasonable assurance about whether the financial statements are free of material misstatement. An audit includes examining, on a test basis, evidence supporting the amounts and disclosures in the financial statements. An audit also includes assessing the accounting principles used and significant estimates made by management, as well as evaluating the overall financial statement presentation. We believe that our audit provides a reasonable basis for our opinion.
In our opinion, the consolidated financial statements referred to above present fairly, in all material respects, the financial position of Microtune, Inc. as of December 31, 2009 and 2008, and the results of its operations and its cash flows for the years then ended, in conformity with U.S. generally accepted accounting principles.
We also have audited, in accordance with the standards of the Public Company Accounting Oversight Board (United States), Microtune, Inc.’s internal control over financial reporting as of December 31, 2009, based on criteria established in Internal Control—Integrated Framework issued by the Committee of Sponsoring Organizations of the Treadway Commission (COSO), and our report dated February 16, 2010 expressed an unqualified opinion on the effectiveness of the Company’s internal control over financial reporting.
KPMG LLP
Dallas, Texas
February 16, 2010
F-1
Table of Contents
REPORT OF INDEPENDENT REGISTERED PUBLIC ACCOUNTING FIRM
The Board of Directors and Stockholders of Microtune, Inc.
We have audited the consolidated balance sheet of Microtune, Inc. (the Company), as of December 31, 2007, and the related consolidated statements of operations, stockholders’ equity, and cash flows for the year ended December 31, 2007. These financial statements are the responsibility of the Company’s management. Our responsibility is to express an opinion on these financial statements based on our audits.
We conducted our audit in accordance with the standards of the Public Company Accounting Oversight Board (United States). Those standards require that we plan and perform the audit to obtain reasonable assurance about whether the financial statements are free of material misstatement. An audit includes examining, on a test basis, evidence supporting the amounts and disclosures in the financial statements. An audit also includes assessing the accounting principles used and significant estimates made by management, as well as evaluating the overall financial statement presentation. We believe that our audit provides a reasonable basis for our opinion.
In our opinion, the financial statements referred to above present fairly, in all material respects, the consolidated financial position of Microtune, Inc., at December 31, 2007, and the consolidated results of its operations and its cash flows for the year ended December 31, 2007, in conformity with U.S. generally accepted accounting principles.
ERNST & YOUNG LLP
Dallas, Texas
February 22, 2008
F-2
Table of Contents
REPORT OF INDEPENDENT REGISTERED PUBLIC ACCOUNTING FIRM
The Board of Directors and Stockholders
Microtune, Inc.:
We have audited Microtune, Inc.’s internal control over financial reporting as of December 31, 2009, based on criteria established in Internal Control—Integrated Framework issued by the Committee of Sponsoring Organizations of the Treadway Commission (COSO). Microtune, Inc.’s management is responsible for maintaining effective internal control over financial reporting and for its assessment of the effectiveness of internal control over financial reporting, included in the accompanying Management’s Annual Report on Internal Control Over Financial Reporting. Our responsibility is to express an opinion on the Company’s internal control over financial reporting based on our audit.
We conducted our audit in accordance with the standards of the Public Company Accounting Oversight Board (United States). Those standards require that we plan and perform the audit to obtain reasonable assurance about whether effective internal control over financial reporting was maintained in all material respects. Our audit included obtaining an understanding of internal control over financial reporting, assessing the risk that a material weakness exists, and testing and evaluating the design and operating effectiveness of internal control based on the assessed risk. Our audit also included performing such other procedures as we considered necessary in the circumstances. We believe that our audit provides a reasonable basis for our opinion.
A company’s internal control over financial reporting is a process designed to provide reasonable assurance regarding the reliability of financial reporting and the preparation of financial statements for external purposes in accordance with generally accepted accounting principles. A company’s internal control over financial reporting includes those policies and procedures that (1) pertain to the maintenance of records that, in reasonable detail, accurately and fairly reflect the transactions and dispositions of the assets of the company; (2) provide reasonable assurance that transactions are recorded as necessary to permit preparation of financial statements in accordance with generally accepted accounting principles, and that receipts and expenditures of the company are being made only in accordance with authorizations of management and directors of the company; and (3) provide reasonable assurance regarding prevention or timely detection of unauthorized acquisition, use, or disposition of the company’s assets that could have a material effect on the financial statements.
Because of its inherent limitations, internal control over financial reporting may not prevent or detect misstatements. Also, projections of any evaluation of effectiveness to future periods are subject to the risk that controls may become inadequate because of changes in conditions, or that the degree of compliance with the policies or procedures may deteriorate.
In our opinion, Microtune, Inc. maintained, in all material respects, effective internal control over financial reporting as of December 31, 2009, based on criteria established in Internal Control—Integrated Framework issued by the Committee of Sponsoring Organizations of the Treadway Commission.
Microtune, Inc. acquired Auvitek International Ltd. on July 31, 2009, and management excluded from its assessment of the effectiveness of Microtune, Inc.’s internal control over financial reporting as of December 31, 2009, Auvitek International Ltd.’s internal control over financial reporting associated with total assets of $1.9 million and total revenues of $0.4 million included in the consolidated financial statements of Microtune, Inc. as of and for the year ended December 31, 2009. Our audit of internal control over financial reporting of Microtune, Inc. also excluded an evaluation of the internal control over financial reporting of Auvitek International Ltd.
We also have audited, in accordance with the standards of the Public Company Accounting Oversight Board (United States), the consolidated balance sheets of Microtune, Inc. as of December 31, 2009 and 2008, and the related consolidated statements of operations, stockholders’ equity and cash flows for each of the years then ended, and our report dated February 16, 2010 expressed an unqualified opinion on those consolidated financial statements.
KPMG LLP
Dallas, Texas
February 16, 2010
F-3
Table of Contents
CONSOLIDATED BALANCE SHEETS
(In thousands, except per share data)
| December 31, | ||||||||
| 2009 | 2008 | |||||||
| Assets |
||||||||
| Current assets: |
||||||||
| Cash and cash equivalents |
$ | 32,291 | $ | 46,097 | ||||
| Short-term investments |
50,000 | 40,000 | ||||||
| Accounts receivable, net |
7,830 | 9,495 | ||||||
| Inventories |
7,387 | 11,261 | ||||||
| Other current assets |
4,906 | 4,469 | ||||||
| Total current assets |
102,414 | 111,322 | ||||||
| Property and equipment, net |
4,607 | 5,148 | ||||||
| Goodwill |
5,564 | — | ||||||
| Intangible assets, net |
2,804 | — | ||||||
| Other assets and deferred charges |
782 | 2,025 | ||||||
| Total assets |
$ | 116,171 | $ | 118,495 | ||||
| Liabilities and Stockholders’ Equity |
||||||||
| Current liabilities: |
||||||||
| Accounts payable |
$ | 6,572 | $ | 3,985 | ||||
| Accrued compensation |
3,171 | 2,495 | ||||||
| Accrued expenses |
2,601 | 2,472 | ||||||
| Deferred revenue |
29 | 355 | ||||||
| Total current liabilities |
12,373 | 9,307 | ||||||
| Non-current liabilities |
223 | 203 | ||||||
| Commitments and contingencies Stockholders’ equity: |
||||||||
| Preferred stock, $0.001 par value; |
— | — | ||||||
| Common stock, $0.001 par value; |
54 | 52 | ||||||
| Additional paid-in capital |
467,677 | 459,790 | ||||||
| Accumulated other comprehensive loss |
(988 | ) | (988 | ) | ||||
| Accumulated deficit |
(363,168 | ) | (349,869 | ) | ||||
| Total stockholders’ equity |
103,575 | 108,985 | ||||||
| Total liabilities and stockholders’ equity |
$ | 116,171 | $ | 118,495 | ||||
See accompanying notes.
F-4
Table of Contents
CONSOLIDATED STATEMENTS OF OPERATIONS
(In thousands, except per share data)
| Year Ended December 31, | ||||||||||||
| 2009 | 2008 | 2007 | ||||||||||
| Net revenue |
$ | 74,570 | $ | 108,020 | $ | 91,141 | ||||||
| Cost of revenue |
36,096 | 54,691 | 44,698 | |||||||||
| Gross margin |
38,474 | 53,329 | 46,443 | |||||||||
| Operating expenses: |
||||||||||||
| Research and development |
28,488 | 25,896 | 23,695 | |||||||||
| Selling, general and administrative |
22,681 | 21,809 | 25,317 | |||||||||
| Restructuring costs |
1,742 | — | — | |||||||||
| Total operating expenses |
52,911 | 47,705 | 49,012 | |||||||||
| Income (loss) from operations |
(14,437 | ) | 5,624 | (2,569 | ) | |||||||
| Other income (expense): |
||||||||||||
| Interest income |
1,273 | 1,705 | 4,156 | |||||||||
| Foreign currency gains (losses), net |
(179 | ) | (324 | ) | 268 | |||||||
| Other, net |
40 | 6 | 75 | |||||||||
| Income (loss) before income taxes |
(13,303 | ) | 7,011 | 1,930 | ||||||||
| Income tax expense (benefit) |
(4 | ) | 636 | 786 | ||||||||
| Net income (loss) |
$ | (13,299 | ) | $ | 6,375 | $ | 1,144 | |||||
| Net income (loss) per common share: |
||||||||||||
| Basic |
$ | (0.25 | ) | $ | 0.12 | $ | 0.02 | |||||
| Diluted |
$ | (0.25 | ) | $ | 0.12 | $ | 0.02 | |||||
| Weighted-average common shares outstanding: |
||||||||||||
| Basic |
52,778 | 53,062 | 53,692 | |||||||||
| Diluted |
52,778 | 54,439 | 56,022 | |||||||||
See accompanying notes.
F-5
Table of Contents
CONSOLIDATED STATEMENTS OF STOCKHOLDERS’ EQUITY
(In thousands)
| Common Stock | Additional Paid-In Capital |
Accumulated Other Comprehensive Loss |
Accumulated Deficit |
Total Stockholders’ Equity |
|||||||||||||||||||
| Number of Shares |
Par Value |
||||||||||||||||||||||
| Balance at December 31, 2006 |
53,290 | $ | 53 | $ | 454,591 | $ | (988 | ) | $ | (357,388 | ) | $ | 96,268 | ||||||||||
| Issuance of common stock upon exercise of stock options and from shares purchased under Employee Stock Purchase Plan |
709 | 1 | 1,970 | — | — | 1,971 | |||||||||||||||||
| Stock-based compensation |
— | — | 6,096 | — | — | 6,096 | |||||||||||||||||
| Amendment of stock options under tender offer |
— | — | (255 | ) | — | — | (255 | ) | |||||||||||||||
| Net income |
— | — | — | — | 1,144 | 1,144 | |||||||||||||||||
| Comprehensive income |
1,144 | ||||||||||||||||||||||
| Balance at December 31, 2007 |
53,999 | 54 | 462,402 | (988 | ) | (356,244 | ) | 105,224 | |||||||||||||||
| Issuance of common stock upon exercise of stock options, vesting of restricted stock units and from shares purchased under Employee Stock Purchase Plan |
820 | 1 | 1,409 | — | — | 1,410 | |||||||||||||||||
| Surrender of common stock by employees for payroll taxes |
(51 | ) | — | (277 | ) | — | — | (277 | ) | ||||||||||||||
| Repurchase and retirement of common stock, including direct expenses |
(2,719 | ) | (3 | ) | (8,538 | ) | — | — | (8,541 | ) | |||||||||||||
| Stock-based compensation |
— | — | 4,794 | — | — | 4,794 | |||||||||||||||||
| Net income |
— | — | — | — | 6,375 | 6,375 | |||||||||||||||||
| Comprehensive income |
6,375 | ||||||||||||||||||||||
| Balance at December 31, 2008 |
52,049 | 52 | 459,790 | (988 | ) | (349,869 | ) | 108,985 | |||||||||||||||
| Issuance of common stock upon exercise of stock options, vesting of restricted stock units and from shares purchased under Employee Stock Purchase Plan |
845 | 1 | 1,081 | — | — | 1,082 | |||||||||||||||||
| Issuance of common stock for acquisition of Auvitek International Ltd. |
1,000 | 1 | 2,059 | — | — | 2,060 | |||||||||||||||||
| Surrender of common stock by employees for payroll taxes |
(18 | ) | — | (35 | ) | — | — | (35 | ) | ||||||||||||||
| Repurchase and retirement of common stock, including direct expenses |
— | — | (25 | ) | — | — | (25 | ) | |||||||||||||||
| Stock-based compensation |
— | — | 4,807 | — | — | 4,807 | |||||||||||||||||
| Net loss |
— | — | — | — | (13,299 | ) | (13,299 | ) | |||||||||||||||
| Comprehensive income |
(13,299 | ) | |||||||||||||||||||||
| Balance at December 31, 2009 |
53,876 | $ | 54 | $ | 467,677 | $ | (988 | ) | $ | (363,168 | ) | $ | 103,575 | ||||||||||
See accompanying notes.
F-6
Table of Contents
CONSOLIDATED STATEMENTS OF CASH FLOWS
(In thousands)
| Year Ended December 31, | ||||||||||||
| 2009 | 2008 | 2007 | ||||||||||
| Operating activities: |
||||||||||||
| Net income (loss) |
$ | (13,299 | ) | $ | 6,375 | $ | 1,144 | |||||
| Adjustments to reconcile net income (loss) to net cash provided by operating activities: |
||||||||||||
| Depreciation |
1,815 | 1,910 | 1,496 | |||||||||
| Amortization of intangibles |
86 | — | — | |||||||||
| Allowance for uncollectible debt |
1 | — | — | |||||||||
| Stock-based compensation |
4,807 | 4,794 | 6,096 | |||||||||
| Loss (gain) on disposal of assets |
11 | 25 | (16 | ) | ||||||||
| Foreign currency (gain) loss |
210 | (8 | ) | 30 | ||||||||
| Changes in operating assets and liabilities, excluding the effects of acquisition: |
||||||||||||
| Accounts receivable, net |
1,762 | (24 | ) | (2,754 | ) | |||||||
| Inventories, net |
3,981 | (282 | ) | (1,991 | ) | |||||||
| Other assets |
1,433 | (1,432 | ) | (1,997 | ) | |||||||
| Accounts payable |
2,481 | (540 | ) | (426 | ) | |||||||
| Accrued expenses |
(642 | ) | (498 | ) | 919 | |||||||
| Accrued compensation |
472 | (2,120 | ) | 1,679 | ||||||||
| Deferred revenue |
(327 | ) | 182 | 143 | ||||||||
| Other liabilities |
20 | 6 | 35 | |||||||||
| Net cash provided by operating activities |
2,811 | 8,388 | 4,358 | |||||||||
| Investing activities: |
||||||||||||
| Purchases of property and equipment |
(821 | ) | (2,462 | ) | (1,408 | ) | ||||||
| Acquisition of Auvitek International Ltd., net of cash acquired |
(6,894 | ) | — | — | ||||||||
| Proceeds from maturity of certificates of deposits |
79,758 | — | — | |||||||||
| Purchase of certificates of deposit |
(89,758 | ) | (40,000 | ) | — | |||||||
| Proceeds from sale of available-for-sale investments |
— | — | 58,750 | |||||||||
| Purchase of available-for-sale investments |
— | — | (14,000 | ) | ||||||||
| Net cash provided by (used in) investing activities |
(17,715 | ) | (42,462 | ) | 43,342 | |||||||
| Financing activities: |
||||||||||||
| Proceeds from issuance of common stock |
1,082 | 1,410 | 1,971 | |||||||||
| Surrender of common stock by employees for payroll taxes |
(35 | ) | (277 | ) | — | |||||||
| Repurchase and retirement of common stock, including direct expenses |
— | (8,541 | ) | — | ||||||||
| Net cash provided by (used in) financing activities |
1,047 | (7,408 | ) | 1,971 | ||||||||
| Effect of foreign currency exchange rate changes on cash |
51 | 42 | (144 | ) | ||||||||
| Net increase (decrease) in cash and cash equivalents |
(13,806 | ) | (41,440 | ) | 49,527 | |||||||
| Cash and cash equivalents at beginning of period |
46,097 | 87,537 | 38,010 | |||||||||
| Cash and cash equivalents at end of period |
$ | 32,291 | $ | 46,097 | $ | 87,537 | ||||||
| Non-cash investing activities: |
||||||||||||
| Investment in enterprise software and equipment |
$ | (77 | ) | $ | (418 | ) | $ | — | ||||
| Issuance of common stock to acquire Auvitek International Ltd. |
(2,060 | ) | — | — | ||||||||
See accompanying notes.
F-7
Table of Contents
NOTES TO CONSOLIDATED FINANCIAL STATEMENTS
December 31, 2009
1. Summary of Significant Accounting Policies
Description of Business
Microtune, Inc. (Microtune) began operations in August 1996. We design and market receiver solutions for the cable, automotive entertainment electronics and digital television (DTV) markets. These solutions include radio frequency (RF) integrated circuits (ICs), digital signal processing ICs and subsystem module solutions. Our product portfolio consists of tuners, amplifiers, upconverters, demodulators and receivers, which permit the delivery, reception and exchange of broadband video, audio and data using terrestrial (off-air) and/or cable communications systems. Our products enable or target various consumer electronics, broadband communications and automotive entertainment electronics applications and devices, including cable television set-top boxes; DOCSIS®-based high-speed voice and data cable modems; car audio, television and antenna amplifier systems; integrated digital television systems (iDTV), including high-definition televisions (HDTV); digital-to-analog converter boxes; and personal computer television (PC/TV) multimedia products. We sell our products to original equipment manufacturers (OEMs) and original design manufacturers (ODMs) who sell devices, subsystems and applications to consumers or service providers within the cable, automotive entertainment electronics and DTV markets.
We operate Microtune as a single business unit, reporting unit or reportable operating segment serving our target markets. We record our operating expenses by functional area and account type, but we do not record or analyze our operating expenses by market, product type or product. We attempt to analyze our net revenue by market, but in some cases we sell our products to resellers or distributors serving multiple end markets, giving us limited ability to determine market composition of our net revenue from these customers. In addition, certain of our OEM customers purchase products from us for applications in multiple end-markets, also limiting our ability to determine our net revenue contribution from each market.
Codification of GAAP
On July 1, 2009, the Financial Accounting Standards Board (FASB) launched its new Accounting Standards Codification (ASC). On this date, the ASC became the single official source of authoritative, non-governmental GAAP, except for rules and interpretive releases of the SEC. All other non-grandfathered, non-SEC accounting literature not included in the ASC is non-authoritative. We have updated all our prior authoritative GAAP references with the new ASC references.
Risk and Uncertainties
Our future results of operations and financial condition will be impacted by the following factors, among others: worldwide macroeconomic downturn, dependence on the worldwide cable, automotive entertainment electronics and DTV markets characterized by intense competition and rapidly changing technology, dependence on a few significant customers, third-party manufacturers and subcontractors, third-party distributors in certain markets, partners when we go to market with a joint solution, the successful development and marketing of new products in new and existing markets, the successful integration of the Auvitek International Ltd. (Auvitek) operations and products, seasonality in the demand for consumer products into which our products are incorporated and the success of our recently announced cost reduction efforts. Our future results also may be impacted by foreign currency fluctuations as a result of our international operations and foreign currency based revenues, and product warranty liabilities and line down clauses.
F-8
Table of Contents
MICROTUNE, INC.
NOTES TO CONSOLIDATED FINANCIAL STATEMENTS—(Continued)
December 31, 2009
Consolidation
Our consolidated financial statements include the financial statements of Microtune and its wholly-owned subsidiaries. All intercompany balances and transactions have been eliminated in consolidation.
Reclassifications
Amounts in the Consolidated Statements of Cash Flows for 2008 and 2007 have been reclassified to conform to the current year presentation.
Use of Estimates
We make estimates, judgments and assumptions that affect the amounts reported in the consolidated financial statements and the disclosures made in the accompanying notes, including inventory valuation allowances, warranty costs, determining the collectability of accounts receivable and indemnification assets, the valuation of deferred tax assets, contingent liabilities, liabilities for uncertain tax positions, liabilities for potential incentive compensation and other amounts. We also use estimates, judgments and assumptions to determine the impairment of investments and intangible assets, including goodwill, and the remaining economic lives and carrying values of property and equipment and other long-lived assets. We believe that the estimates, judgments and assumptions upon which we rely are appropriate, based upon information available to us at the time that they are made. These estimates, judgments and assumptions can affect our reported assets and liabilities as of the date of the consolidated financial statements, as well as the reported net revenue and expenses during the periods presented. If there are material differences between these estimates, judgments or assumptions and actual facts, our consolidated financial statements will be affected.
Cash and Cash Equivalents
We consider highly liquid investments with maturities of three months or less at date of purchase to be cash equivalents. Cash and cash equivalents consist of bank deposits and money market funds.
Investments
Our investments are comprised of high-quality securities purchased in accordance with our investment policy. Investments in debt securities are classified as held-to-maturity when we intend to hold them to maturity. Held-to-maturity investments are carried at amortized cost with the amortization of the purchase discount recorded in interest income. Investments in debt securities not classified as held-to-maturity and equity securities are classified as available-for-sale and carried at fair value, with unrealized gains and losses, net of tax, recorded in stockholders’ equity. Realized gains and losses and other-than-temporary declines in value, if any, on available-for-sale securities are reported in other income and expense as incurred and are determined based on the specific identification method. At December 31, 2009, our short-term investments, which consisted of certificates of deposit insured by the Federal Deposit Insurance Corporation (FDIC), were categorized as held-to-maturity investments. The carrying value of our short-term investments approximates fair value as the certificates of deposit were entered into at market rates. The certificates of deposit have a contractual maturity of six months to one year and mature during the second quarter and fourth quarter of 2010. We held $50.0 million and $40.0 million in short-term investments at December 31, 2009 and 2008, respectively. At December 31, 2009 and 2008, we held no long-term investments.
F-9
Table of Contents
MICROTUNE, INC.
NOTES TO CONSOLIDATED FINANCIAL STATEMENTS—(Continued)
December 31, 2009
Allowance for Doubtful Accounts
We evaluate the collectability of our accounts receivable based on several factors. In circumstances where we are aware of a specific customer’s inability to meet its financial obligations to us, we record a specific allowance for doubtful accounts against amounts due to us and reduce the net recorded receivable to the amount we reasonably believe will be collected. We also consider recognizing allowances for doubtful accounts based on the length of time the receivables are outstanding compared to contractual terms, industry and geographic concentrations, the current business environment and our historical experience. Accounts receivable included in the allowance for doubtful accounts are written-off after final collection efforts are exhausted. If the financial condition of our customers deteriorates or if economic conditions worsen, increases in the allowance for doubtful accounts may be required in the future. We cannot predict future changes in the financial stability of our customers, and there can be no assurance that our allowance for doubtful accounts will be adequate. Actual credit losses for 2009, 2008 and 2007 were insignificant. At December 31, 2009, the allowance for doubtful accounts was insignificant. No allowance for doubtful accounts was recorded as of December 31, 2008.
Inventory Valuation
Our inventories are stated at the lower of standard cost, which approximates actual cost, or estimated realizable value. Amounts are removed from inventory using the first-in, first-out (FIFO) method. Adjustments to reduce our inventories to estimated realizable value, including allowances for excess and obsolete inventories, are determined quarterly by comparing inventory levels of individual materials and parts to current demand forecasts for those items. In addition, we review other individual facts and circumstances to determine necessary adjustments to reduce our inventories to estimated realizable value, including current manufacturing yields, product returns and warranty claims. Actual amounts realized upon the sale of inventories may differ from estimates used to determine inventory valuation allowances due to changes in customer demand, technology changes and other factors. The net impact of changes in the inventory valuation allowance and accrued noncancelable inventory purchase obligations was a charge to cost of revenue of $0.1 million, $0.2 million and $0.6 million for 2009, 2008 and 2007, respectively.
Property and Equipment
Our property and equipment are stated at cost, net of accumulated depreciation. We calculate depreciation using the straight-line method over the estimated useful lives of the assets, which generally range from 3 to 7 years. We depreciate leasehold improvements using the straight-line method over the lesser of their estimated useful lives or remaining lease terms.
Intangible Assets and Goodwill
Our intangible assets, which consist of developed technology, in-process research and development and goodwill, have been recorded as the result of our acquisition of Auvitek. See Note 2. Developed technology is being amortized on the straight-line basis over 6.4 years. In-process research and development will begin amortization after reaching technological feasibility and will be amortized over its useful life. Goodwill is the result of the difference between the aggregate consideration paid for Auvitek and the net of the fair values of the tangible and identifiable intangible assets acquired and the liabilities assumed.
Impairment of Goodwill and Other Long-lived Assets
We review goodwill for impairment at the reporting unit level on an annual basis in the fourth quarter or whenever events or changes in circumstances indicate impairment may exist. The performance of the test
F-10
Table of Contents
MICROTUNE, INC.
NOTES TO CONSOLIDATED FINANCIAL STATEMENTS—(Continued)
December 31, 2009
involves a two-step process. The first step of the impairment test involves comparing the fair values of the applicable reporting units with their aggregate carrying values, including goodwill. If the carrying amount of a reporting unit exceeds the reporting unit’s fair value, we perform the second step of the goodwill impairment test to determine the amount of impairment loss. The second step of the goodwill impairment test involves comparing the implied fair value of the affected reporting unit’s goodwill with the carrying value of that goodwill.
We review long-lived assets, including intangible assets, for impairment whenever events or changes in circumstances indicate that the carrying amount of these assets may not be recoverable. We evaluate the recoverability of other long-lived assets by a comparison of their carrying amount to projected undiscounted cash flows expected to be generated by the assets or asset group. If we determine our long-lived assets are impaired, we recognize the impairment in the amount by which the carrying amount of the assets exceeds the estimated fair value of the assets. No impairment was recognized during 2009, 2008 and 2007.
Revenue Recognition
We recognize revenue when we receive a purchase order from our customer, our product has been shipped, title has transferred to our customer, the price that we will receive for our product is fixed or determinable and payment from our customer is considered probable. Title to our product transfers to our customer either when it is shipped to or received by our customer, based on the terms of our specific agreement with the customer.
Our revenue is recorded based on the facts then currently known to us. If we do not meet all the criteria above, we do not recognize revenue. If we are unable to determine the amount that is probable of collection once our product has shipped and title has transferred to our customer, we defer recognition of revenue until we can determine the amount that is probable of collection. Items that are considered when determining the amounts that are probable of collection include a customer’s overall creditworthiness, payment history and rights to return unsold product.
For certain of our customers, we do not recognize revenue until receipt of payment because collection is not probable or the amount we will ultimately collect is not determinable at the date of the shipment. Upon shipment of product to these customers, title to the inventory transfers to the customer and the customer is invoiced. We account for these transactions by recording accounts receivable for the revenue value of the shipments, as the shipments represent valid receivables, and reducing inventory for the cost of the inventory shipped. The difference, representing the gross margin on the transactions, is recorded as deferred revenue. For financial statement presentation purposes, this deferred revenue balance is offset against any outstanding corresponding accounts receivable balances from the customer. When payment is received for the transaction, revenue is recognized for the value of the cash payment, cost of revenue is recorded for the cost of the inventory and the deferred revenue is relieved for the gross margin on the transaction. At December 31, 2009 and 2008, the sales value of products shipped for which revenue was deferred was insignificant.
When we defer revenue, the timing and amount of revenue we ultimately recognize is determined upon our receipt of payment, which can result in significant fluctuations in net revenue from period to period. In 2009, 2008 and 2007, net revenue recognized upon receipt of payment was insignificant.
We also defer revenue when customers have made payments and we have not completed the earnings process. These payments are reflected as liabilities in our consolidated financial statements as deferred revenue. In these instances, we recognize revenue once the product is shipped, title has transferred to our customer and the earnings process is complete. Deferred revenue as a result of customer prepayments was insignificant as of December 31, 2009. Deferred revenue as a result of customer prepayments was $0.2 million as of December 31, 2008.
F-11
Table of Contents
MICROTUNE, INC.
NOTES TO CONSOLIDATED FINANCIAL STATEMENTS—(Continued)
December 31, 2009
We grant limited stock rotation rights to certain distributors, allowing them to return qualifying product to us in accordance with their specific agreements for up to 5% of their aggregate net purchases for the previous six months. In these circumstances, we require the distributor to submit an offsetting purchase order that is, at a minimum, equivalent to the aggregate dollar amount of the product to be returned. We account for the return as a reduction to net revenue and a reduction to accounts receivable for the price of the items returned. Correspondingly, cost of revenue is reduced by the cost of returned inventory offset by an increase in inventory. Any returned inventory items are included in gross inventories, are reviewed along with our other inventory items and are recorded at the lower of cost or market. Historically, distributor returns under stock rotation rights have been insignificant. As a result, we do not establish a reserve for potential returns when product is shipped to distributors, rather we subsequently monitor distributor inventory levels and record a reserve for potential returns of estimated unsaleable inventory subject to stock rotation rights. We account for the reserve by reducing net revenue and cost of revenue. The difference, representing the gross margin on the transaction, is recorded as deferred revenue. We account for the shipment of replacement product as a sales transaction, which offsets the reduction of net revenue discussed above. At December 31, 2009, the sales value of product shipped for which revenue was reserved due to distributor stock rotation rights was insignificant. At December 31, 2008, the sales value of product shipped for which revenue was reserved due to distributor stock rotation rights was $0.2 million.
Research and Development Costs
Our research and development expenses consist primarily of personnel-related expenses, lab supplies, training and prototype materials. We expense all of our research and development costs in the period incurred as our current process for developing our products is essentially complete concurrent with the establishment of technological feasibility. Research and development efforts currently are focused primarily on the development of our next generation of products.
Shipping and Handling Costs
Shipping and handling costs related to product shipments to customers are included in cost of revenue.
Warranty Costs
We generally provide a minimum of a one-year warranty on all products. In certain instances, a warranty beyond one year is provided to comply with statutory requirements of foreign jurisdictions. We record specific warranty provisions for any identified product issues, which have not been significant to date. At December 31, 2009 and 2008, accrued warranty costs were insignificant.
Foreign Currency Remeasurement
Our functional currency and that of our foreign subsidiaries is the United States Dollar. The impact from the remeasurement of accounts not denominated in United States Dollars is recognized currently in our results of operations as a component of foreign currency gains and losses and results primarily from exchange rate fluctuations between the United States Dollar and the Euro. Net foreign currency gains (losses) were $(0.2) million, $(0.3) million and $0.3 million in 2009, 2008 and 2007, respectively.
F-12
Table of Contents
MICROTUNE, INC.
NOTES TO CONSOLIDATED FINANCIAL STATEMENTS—(Continued)
December 31, 2009
Income Taxes
Our income taxes are computed using the asset and liability method of accounting. Under the asset and liability method, a deferred income tax asset or liability is recognized for estimated future tax effects attributable to temporary differences and carryforwards. The measurement of deferred income tax assets is adjusted by a valuation allowance, if necessary, to recognize future income tax benefits only to the extent, based on available evidence, it is more likely than not such benefits will be realized. Our net deferred income tax assets were fully reserved at December 31, 2009 and 2008. Changes in uncertain income tax positions were as follows (in thousands):
| Balance at December 31, 2008 |
$ | 113 | ||
| Tax positions assumed in acquisition of Auvitek |
756 | |||
| Tax positions taken prior to 2009 |
(23 | ) | ||
| Tax positions taken in 2009 |
48 | |||
| Income taxes paid in 2009 |
(74 | ) | ||
| Interest recorded in 2009 |
9 | |||
| Effect of changes in foreign currency exchange rates |
4 | |||
| Balance at December 31, 2009 |
$ | 833 | ||
At December 31, 2009, the uncertain income tax positions were related to transfer pricing adjustments with foreign subsidiaries acquired with Auvitek and foreign withholding taxes on certain cross-border transactions. See Note 2 and Note 9. Uncertain income tax positions could materially change within the next twelve months, depending on the resolution of transfer pricing adjustments discussed above.
We recognize interest and penalties related to uncertain income tax positions in income tax expense. Interest and penalties of $0.2 million were accrued at December 31, 2009 related to uncertain income tax positions assumed in the acquisition of Auvitek. No interest and penalties related to uncertain income tax positions were accrued at December 31, 2008.
In conjunction with the purchase price allocation for the acquisition of Auvitek, we recorded an indemnification asset of $0.7 million representing the selling shareholders’ obligation to indemnify us for the outcome of potential contingent liabilities relating to uncertain tax positions. See Note 2. At December 31, 2009, the indemnification asset was $0.7 million.
Due to our net operating loss carryforward position, tax years in the United States remain open to examination until three years after the net operating losses from each year are utilized. Potential examination adjustments are limited to the net operating losses utilized from each year. For our international operations, the tax years 2005 through 2009 remain open to examination by the major taxing jurisdictions in which we operate.
Income (Loss) Per Share
Basic income (loss) per common share is computed by dividing net income (loss) by the weighted average number of common shares outstanding during each period. Diluted income (loss) per common share is computed by dividing net income (loss) by the weighted average number of common shares outstanding during each period and dilutive common equivalent shares consisting of stock options, restricted stock units and employee rights to purchase stock under our employee stock purchase plan. All potentially dilutive common equivalent shares were anti-dilutive and were excluded from diluted loss per common share for 2009.
F-13
Table of Contents
MICROTUNE, INC.
NOTES TO CONSOLIDATED FINANCIAL STATEMENTS—(Continued)
December 31, 2009
Our computation of income (loss) per common share was as follows (in thousands, except per share data):
| Year Ended December 31, | ||||||||||
| 2009 | 2008 | 2007 | ||||||||
| Net income (loss) |
$ | (13,299 | ) | $ | 6,375 | $ | 1,144 | |||
| Weighted average common shares outstanding |
52,778 | 53,062 | 53,692 | |||||||
| Weighted average dilutive potential common shares: |
||||||||||
| Stock options |
— | 1,296 | 2,266 | |||||||
| Restricted stock units |
— | 81 | 64 | |||||||
| Weighted average common and dilutive potential common shares |
52,778 | 54,439 | 56,022 | |||||||
| Basic income (loss) per common share |
$ | (0.25 | ) | $ | 0.12 | $ | 0.02 | |||
| Diluted income (loss) per common share |
$ | (0.25 | ) | $ | 0.12 | $ | 0.02 | |||
The following table sets forth anti-dilutive securities that have been excluded from net income (loss) per share (in thousands):
| Year Ended December 31, | ||||||
| 2009 | 2008 | 2007 | ||||
| Stock options |
9,629 | 7,438 | 4,912 | |||
| Restricted stock units |
1,308 | 284 | — | |||
| Employee stock purchase plan |
100 | 115 | 36 | |||
| Total anti-dilutive securities excluded |
11,037 | 7,837 | 4,948 | |||
Stock-Based Compensation
We account for all share-based payment awards to employees and directors, including stock options, restricted stock units and employee stock purchases related to our employee stock purchase plan, using the fair value recognition provisions of ASC Topic 718, Compensation—Stock Compensation (ASC 718), (prior authoritative literature: Statement of Financial Accounting Standard No. 123 (revised 2004), Share-Based Payment) and the provisions of Staff Accounting Bulletin No. 107, issued by the SEC. We use the Black-Scholes-Merton option-pricing formula to value share-based payments granted to employees and attribute the value of stock-based compensation to expense using the straight-line single option method. Stock-based compensation expense recognized each period includes: (1) compensation cost for all share-based payments granted prior to, but not yet vested as of January 1, 2006, based on the measurement date fair value estimate in accordance with the original provisions of SFAS No. 123, and (2) compensation cost for all share-based payments granted subsequent to January 1, 2006, based on the measurement date fair value estimate in accordance with the provisions of ASC 718. Stock-based compensation expense recognized each period is based on the greater of the value of the portion of share-based payment awards under the straight-line method or the value of the portion of share-based payment awards that is ultimately expected to vest during the period. In accordance with ASC 718, we estimate forfeitures at the time of grant and revise our estimates, if necessary, in subsequent periods if actual forfeitures differ materially from those estimates. Stock-based compensation expense under ASC 718 for the 2009, 2008 and 2007 was $4.8 million, $4.8 million and $6.1 million,
F-14
Table of Contents
MICROTUNE, INC.
NOTES TO CONSOLIDATED FINANCIAL STATEMENTS—(Continued)
December 31, 2009
respectively, relating to employee and director stock options, restricted stock units and our employee stock purchase plan. See Note 11.
ASC 718 requires the cash flows resulting from the tax benefits resulting from tax deductions in excess of the compensation cost recognized for those options (excess tax benefits) to be classified as financing cash flows. Due to our historical net operating loss position, we have not recorded these excess tax benefits at December 31, 2009 and 2008.
Comprehensive Income
ASC Topic 220, Comprehensive Income, (prior authoritative literature: SFAS No. 130, Reporting Comprehensive Income) establishes standards for reporting and displaying comprehensive income and its components in the consolidated financial statements. Accumulated other comprehensive loss at December 31, 2009, 2008 and 2007 included foreign currency translation adjustments of $1.0 million related to changing the functional currency of our German subsidiaries from the German Mark to the United States Dollar in 2000. Comprehensive income (loss) for all periods presented is equivalent to net income (loss).
Risk Concentrations
Financial instruments that potentially expose us to concentrations of credit risk consist primarily of trade accounts receivable. At December 31, 2009, approximately 55% of our net accounts receivable were due from five of our customers. We periodically evaluate the creditworthiness of our customers’ financial conditions and generally do not require collateral. We evaluate the collectability of our accounts receivable based on several factors. In circumstances when we are aware of a specific customer’s inability to meet its financial obligations to us, we record a specific reserve for bad debts against amounts due to us and reduce the net recorded receivable to the amount we reasonably believe will be collected. For all other customers, we recognize allowances for doubtful accounts based on the length of time the receivables are outstanding, industry and geographic concentrations, the current business environment and our historical experience. If the financial conditions of our customers deteriorate or if economic conditions worsen, additional allowances may be required in the future. Historically, our bad debts have been insignificant and we are not currently aware of any significant uncollectible accounts.
We depend on third-party foundries, primarily IBM, TowerJazz, TSMC and X-FAB, and third-party assembly and test firms, primarily ASE, Amkor and SPIL, to manufacture all of our ICs. We do not have long-term supply agreements with our foundries but obtain ICs on a purchase order basis. The inability of a third-party foundry to continue manufacturing our ICs would have a material adverse effect on our operations. Our ICs are primarily manufactured in the United States, South Korea, Taiwan, China and the Philippines.
We use Ionics EMS, Inc. (Ionics) for nearly all assembly and calibration functions for our subsystem module solutions under a manufacturing agreement entered into during 2005. This agreement expires in May 2010. In 2009, approximately 19% of our total net revenue was derived from the sale of our module products that were primarily manufactured by Ionics. We expect to continue to use a single provider for nearly all assembly and calibration functions for our subsystem module solutions. The unanticipated or sudden loss of this single provider would have a material adverse effect on our results of operations. We are also dependent upon third-parties, some of whom are competitors, for the supply of components used in subsystem module manufacturing. Our failure to obtain components for module manufacturing would significantly impact our ability to ship subsystem modules to customers in a timely manner.
F-15
Table of Contents
MICROTUNE, INC.
NOTES TO CONSOLIDATED FINANCIAL STATEMENTS—(Continued)
December 31, 2009
Commitments and Contingencies
We may be subject to the possibility of loss contingencies for various legal matters. Our discussion of legal matters includes pending litigation and matters in which any party has manifested a present intention to commence litigation related to such matters. There can be no assurance that additional contingencies of a legal nature or having legal aspects will not be asserted against us in the future. Such matters could relate to prior transactions or events or future transactions and events. See Note 10. We regularly evaluate current information available to us to determine whether any provisions for loss should be made. If we ultimately determine that a provision for loss should be made for a legal matter, the provision for loss could have a material adverse effect on our results of operations and financial condition.
Our future cash commitments are primarily for long-term facility leases. See Note 10.
Recent Accounting Pronouncements
ASC Topic 805, Business Combinations (ASC 805), (prior authoritative literature: Statement No. 141(R), Business Combinations (SFAS No. 141(R)) issued by the FASB in December 2007 and Statement No. 160, Accounting and Reporting of Noncontrolling Interests in Consolidated Financial Statements, an amendment of ARB No. 51) changed the financial accounting and reporting of business combination transactions and noncontrolling (or minority) interests in consolidated financial statements. ASC 805 is effective for business combination transactions for which the acquisition date is on or after the beginning of the first annual reporting period beginning on or after December 15, 2008. The requirements under this standard were applied to the acquisition of Auvitek. See Note 2.
ASC Topic 820, Fair Value Measurements and Disclosures (ASC 820), (prior authoritative literature: Statement No. 157, Fair Value Measurements), issued by the FASB in September 2006, defines fair value, establishes a framework for measuring fair value in GAAP, and requires enhanced disclosures about fair value measurements. The provisions of ASC 820 relating to nonfinancial assets, primarily goodwill, and nonfinancial liabilities that are recognized or disclosed at fair value on a nonrecurring basis were effective as of January 1, 2009. The requirements under this standard were applied to the goodwill generated in the acquisition of Auvitek. See Note 2.
ASC Topic 855, Subsequent Events (ASC 855), (prior authoritative literature: SFAS No. 165, Subsequent Events issued by the FASB in May 2009) establishes general standards of accounting for and disclosure of events that occur after the balance sheet date but before the date the financial statements are issued or available to be issued. ASC 855 requires companies to reflect in their financial statements the effects of subsequent events that provide additional evidence about conditions at the balance sheet date. Subsequent events that provide evidence about conditions that arose after the balance sheet date should be disclosed if the financial statements would otherwise be misleading. Disclosures should include the nature of the event and either an estimate of its financial effect or a statement that an estimate cannot be made. ASC 855 is effective for interim and annual financial periods ending after June 15, 2009, and should be applied prospectively. The requirements under this standard did not impact our financial condition or results of operations because they are consistent with our current practice.
2. Acquisition of Auvitek International Ltd.
On July 31, 2009, Microtune completed the acquisition of Auvitek pursuant to the terms of the Agreement and Plan of Merger (Merger Agreement) dated as of July 10, 2009. Auvitek was a supplier of advanced DTV demodulator ICs for the HDTV and TV-enabled peripherals markets with primary engineering operations based
F-16
Table of Contents
MICROTUNE, INC.
NOTES TO CONSOLIDATED FINANCIAL STATEMENTS—(Continued)
December 31, 2009
in Shanghai, China. The acquisition of Auvitek allows Microtune to develop highly-integrated RF-to-digital solutions targeting the worldwide integrated DTV market, provides customers with more complete solutions and accelerates penetration into the China DTV market. The results of operations for Auvitek were included in our consolidated statements of operations beginning August 1, 2009.
Pursuant to the Merger Agreement, Microtune acquired all of the outstanding capital stock of Auvitek. The merger consideration consisted of (i) cash payments totaling $7,066,324, (ii) the issuance of 1,000,000 shares of Microtune common stock and (iii) an earn-out payment to be determined based upon the achievement of certain performance metrics during the period July 1, 2009 through June 30, 2010. The cash payment total was adjusted based on the final closing balance sheet of Auvitek. In addition to the above described merger consideration, retention arrangements were established, for the benefit of certain Auvitek employees, which is being recognized as expense over the requisite service period, and a second earn-out payment to be determined based upon the achievement of certain performance metrics during the period July 1, 2009 through June 30, 2010 (using the same performance metrics as the earn-out payment for the former holders of Auvitek capital stock). Prior to entering into the Merger Agreement, there were no material relationships between Auvitek and Microtune. The Merger Agreement, the merger and related matters were approved by the boards of directors of each company.
The following presents the consideration paid by Microtune for Auvitek (in thousands):
| Cash consideration paid |
$ | 7,066 | |
| Stock consideration based on issuance of 1,000,000 shares of Microtune common stock at a price of $2.06 per share |
2,060 | ||
| Total purchase price |
$ | 9,126 | |
The purchase price was allocated to tangible and identifiable intangible assets acquired and liabilities assumed, based on our preliminary estimates of fair value as of the acquisition date of July 31, 2009. Our preliminary estimates utilize level 3 fair value measurements in accordance with ASC 820. The excess of the purchase price over the net tangible and identifiable intangible assets was recorded as goodwill. Based upon a preliminary valuation, the purchase price for this transaction was allocated as follows (in thousands):
| Current assets |
$ | 1,274 | ||
| Non-current assets |
644 | |||
| Intangible assets |
2,890 | |||
| Goodwill |
5,564 | |||
| Total assets acquired |
10,372 | |||
| Current liabilities assumed |
(1,246 | ) | ||
| Net assets acquired |
$ | 9,126 | ||
The purchase price allocated to current assets based on our preliminary estimates included an indemnification asset of $0.7 million representing the selling shareholders’ obligation to indemnify us for the outcome of potential contingent liabilities relating to uncertain tax positions. The indemnification asset was measured on the same basis as the liability for uncertain tax positions. Uncertain tax positions of $0.8 million were included in the purchase price allocated to current liabilities based on our preliminary estimates and was measured in accordance with ASC Topic 740 (prior authoritative literature: FASB Interpretation No. 48, Accounting for Uncertainty in Income Taxes—An Interpretation of FASB Statement No. 109 (FIN 48)). An escrow fund of $1,000,000 was established for indemnification obligations, subject to a minimum threshold of
F-17
Table of Contents
MICROTUNE, INC.
NOTES TO CONSOLIDATED FINANCIAL STATEMENTS—(Continued)
December 31, 2009
$100,000 and a deductible of $100,000 on tax matters, as defined, with unreleased funds to be distributed 24 months after the acquisition date of July 31, 2009. An additional escrow fund of $100,000 was established for working capital adjustments, excluding contingent tax liabilities, as defined, with unreleased funds to be distributed 95 days after the acquisition date of July 31, 2009. An insignificant payment was made from the escrow fund for working capital adjustments in November 2009. Upon expiration of the selling shareholders’ obligation to indemnify us in July 2011, we will incur a charge to write-off any remaining indemnification asset and be responsible for the outcome of potential contingent liabilities relating to uncertain tax positions.
Fair values assigned to customer relationships, which represent the value of underlying relationships and agreements with customers, and trade names, which represent the value of marketing-related acquired assets, were insignificant based on our preliminary estimates and not included in the preliminary purchase price allocation.
We determined the earn-out payments that are based upon the achievement of certain performance metrics during the period July 1, 2009 through June 30, 2010 are not probable based on our preliminary estimates. As such, the fair value assigned to the earn-out payments was insignificant and not included in the preliminary purchase price allocation. In accordance with ASC Topic 805, subsequent changes in the fair value of the earn-out payments will be recorded as an expense in our consolidated statement of operations.
For tax purposes, no goodwill is expected to be deductible.
The portion of the purchase price allocated to intangible assets based on our preliminary estimates consisted of the following (in thousands):
| Developed technology |
$ | 1,330 | |
| In-process research and development |
1,560 | ||
| Intangible assets |
$ | 2,890 | |
Developed technology will be amortized over 6.4 years on a straight-line basis. In-process research and development will be amortized over its useful life after reaching technological feasibility. If technological feasibility of the related projects is not achieved, a portion or all of the in-process research and development could be expensed in future periods, which could have a material impact on our results of operations. No amounts were written-off for in-process research and development as part of the preliminary purchase price allocation.
The preliminary purchase price allocation for the acquisition of Auvitek was based on a preliminary valuation and our estimates and assumptions are subject to change as we obtain additional information for our estimates during the measurement period. The primary areas of the purchase price allocation that are not yet finalized relate to identifiable intangible assets and liabilities for uncertain income tax positions.
The following unaudited condensed financial information of Auvitek since the date of the acquisition of July 31, 2009 was included in our consolidated results of operations for 2009 (in thousands):
| Net revenue |
$ | 804 | ||
| Net loss |
(3,017 | ) |
F-18
Table of Contents
MICROTUNE, INC.
NOTES TO CONSOLIDATED FINANCIAL STATEMENTS—(Continued)
December 31, 2009
Certain expenses included in cost of sales and other income and expense were not included in determining the above unaudited condensed financial information as it is impracticable to separate amounts related solely to Auvitek from our consolidated financial results due to the integration of certain Auvitek functions during the third quarter of 2009.
The following unaudited pro forma condensed financial information assumes that the acquisition of Auvitek was accounted for using the acquisition method of accounting for business combinations in accordance with ASC 805 and represents a pro forma presentation based upon available information of the combining companies giving effect to the acquisition transaction as if it had occurred on January 1, 2008, the first date of fiscal 2008, with adjustments for amortization expense of intangible assets, depreciation expense for the fair value of property and equipment above its book value, stock-based compensation expense for restricted stock units granted to certain Auvitek employees, compensation expense on cash retention payments to certain Auvitek employees, professional fees associated with the acquisition, interest expense associated with debt of Auvitek and income tax expense (in thousands):
| Year Ended December 31, | |||||||
| 2009 | 2008 | ||||||
| Net revenue |
$ | 75,459 | $ | 112,093 | |||
| Net income (loss) |
(14,053 | ) | 227 | ||||
| Net income (loss) per common share: |
|||||||
| Basic |
$ | (0.26 | ) | $ | 0.00 | ||
| Diluted |
$ | (0.26 | ) | $ | 0.00 | ||
| Weighted-average common shares outstanding: |
|||||||
| Basic |
53,361 | 54,062 | |||||
| Diluted |
53,361 | 55,439 | |||||
The unaudited pro forma condensed financial information is based on the assumptions and adjustments which give effect to events that are: (i) directly attributable to the acquisition transaction; (ii) expected to have a continuing impact; and (iii) factually supportable. The unaudited pro forma condensed financial information is presented for informational purposes only and is not necessarily indicative of the operating results that would have been achieved had the acquisition been consummated as of the dates indicated or of the results that may be obtained in the future.
3. Accounts Receivable, net
Accounts receivable, net consisted of the following (in thousands):
| December 31, | ||||||||
| 2009 | 2008 | |||||||
| Gross accounts receivable |
$ | 7,848 | $ | 9,606 | ||||
| Deferred revenue |
— | (111 | ) | |||||
| Allowance for doubtful accounts |
(18 | ) | — | |||||
| Accounts receivable, net |
$ | 7,830 | $ | 9,495 | ||||
F-19
Table of Contents
MICROTUNE, INC.
NOTES TO CONSOLIDATED FINANCIAL STATEMENTS—(Continued)
December 31, 2009
4. Inventories
Inventories consisted of the following (in thousands):
| December 31, | ||||||
| 2009 | 2008 | |||||
| Finished goods |
$ | 4,478 | $ | 7,799 | ||
| Work-in-process |
2,802 | 3,097 | ||||
| Raw materials |
107 | 365 | ||||
| Total inventories |
$ | 7,387 | $ | 11,261 | ||
5. Goodwill and Intangible Assets, net
Goodwill and intangible assets, net consisted of the following (in thousands):
| Remaining Weighted Average Useful Life in Years |
December 31, 2009 | ||||||||
| Gross Carrying Amount |
Accum. Amort. | ||||||||
| Goodwill |
— | $ | 5,564 | $ | — | ||||
| In-process research and development |
— | 1,560 | — | ||||||
| Developed technology |
6.0 | 1,330 | (86 | ) | |||||
| Total intangible assets, net |
$ | 8,454 | $ | (86 | ) | ||||
Amortization expense was $0.1 million for 2009. No amortization expense was recorded for 2008 and 2007.
The following table sets forth the estimated future amortization of intangible assets (in thousands):
| Year Ending December 31, |
|||
| 2010 |
$ | 207 | |
| 2011 |
207 | ||
| 2012 |
207 | ||
| 2013 |
207 | ||
| 2014 |
207 | ||
| Thereafter |
209 | ||
| Total future amortization |
$ | 1,244 | |
F-20
Table of Contents
MICROTUNE, INC.
NOTES TO CONSOLIDATED FINANCIAL STATEMENTS—(Continued)
December 31, 2009
6. Property and Equipment
Property and equipment, at cost, consisted of the following (in thousands):
| December 31, | Useful Life in Years | |||||||
| 2009 | 2008 | |||||||
| Computer software |
$ | 6,453 | $ | 6,443 | 3 - 7 | |||
| Manufacturing equipment |
2,235 | 2,133 | 3 - 7 | |||||
| Furniture and fixtures |
1,259 | 1,258 | 3 - 6 | |||||
| Leasehold improvements |
1,033 | 1,016 | 3 - 22 | |||||
| Other equipment |
11,333 | 10,326 | 3 - 7 | |||||
| Total property and equipment. |
22,313 | 21,176 | ||||||
| Less accumulated depreciation |
17,706 | 16,028 | ||||||
| Property and equipment, net |
$ | 4,607 | $ | 5,148 | ||||
7. Accrued Compensation
Accrued compensation consisted of the following (in thousands):
| December 31, | ||||||
| 2009 | 2008 | |||||
| Accrued vacation |
$ | 1,145 | $ | 1,191 | ||
| Accrued restructuring compensation |
854 | — | ||||
| Other |
1,172 | 1,304 | ||||
| Total accrued compensation |
$ | 3,171 | $ | 2,495 | ||
At December 31, 2009, accrued restructuring compensation related to one-time employee termination benefits, primarily cash severance payments, from a restructuring plan. See Note 13.
8. Accrued Expenses
Accrued expenses consisted of the following (in thousands):
| December 31, | ||||||
| 2009 | 2008 | |||||
| Accrued legal fees |
$ | 583 | $ | 640 | ||
| Accrued non-cancelable inventory purchase obligations |
198 | 624 | ||||
| Other |
1,820 | 1,208 | ||||
| Total accrued expenses |
$ | 2,601 | $ | 2,472 | ||
The accrued non-cancelable inventory purchase obligations related to non-cancelable orders to subcontractors for inventories determined to be excess compared to current inventory levels and current demand forecasts. At December 31, 2009 and 2008, the accrued legal fees related primarily to amounts incurred in connection with the SEC litigation against certain former officers. See Note 10.
F-21
Table of Contents
MICROTUNE, INC.
NOTES TO CONSOLIDATED FINANCIAL STATEMENTS—(Continued)
December 31, 2009
9. Income Taxes
Income tax expense (benefit) is reconciled with the United States federal statutory rate as follows (in thousands):
| Year Ended December 31, | ||||||||||||
| 2009 | 2008 | 2007 | ||||||||||
| Income tax expense (benefit) computed at the U.S. federal statutory rate |
$ | (4,527 | ) | $ | 2,384 | $ | 656 | |||||
| Benefit of losses (recognized) not recognized |
3,595 | (1,927 | ) | (120 | ) | |||||||
| Deemed dividends of foreign earnings |
— | — | 6 | |||||||||
| Foreign income taxable in the U.S. |
— | — | 578 | |||||||||
| Withholding taxes |
112 | 342 | 553 | |||||||||
| Effect of foreign income taxes rate differential |
(247 | ) | (997 | ) | (1,170 | ) | ||||||
| Stock-based compensation |
545 | 606 | 341 | |||||||||
| Alternative minimum tax |
(325 | ) | 115 | 120 | ||||||||
| Other, net |
843 | 113 | (178 | ) | ||||||||
| Income tax expense (benefit) |
$ | (4 | ) | $ | 636 | $ | 786 | |||||
Income tax expense (benefit) consisted of the following (in thousands):
| Year Ended December 31, | ||||||||||
| 2009 | 2008 | 2007 | ||||||||
| Domestic income taxes: |
||||||||||
| Current |
$ | (197 | ) | $ | 352 | $ | 680 | |||
| Deferred |
— | — | — | |||||||
| Foreign income taxes: |
||||||||||
| Current |
193 | 284 | 106 | |||||||
| Deferred |
— | — | — | |||||||
| Income tax expense |
$ | (4 | ) | $ | 636 | $ | 786 | |||
Income tax benefit for 2009 included a refund of alternative minimum taxes paid in prior years due to recent regulation changes regarding the carryback of net operating losses, utilization of previously reserved net operating loss carryforwards and charges for withholding taxes on certain cross-border transactions, United States state income taxes and foreign income taxes. In 2009, our effective tax rate differed from the 34% statutory corporate tax rate primarily due to a refund of alternative minimum taxes, changes in valuation allowances, permanent differences, lower withholding tax rates and lower foreign tax rates.
Income tax expense for 2008 included the utilization of previously reserved net operating loss carryforwards and consisted of $0.3 million relating to withholding taxes on certain cross-border transactions, $0.1 million for alternative minimum taxes and $0.3 million for foreign income taxes and United States state income taxes. In 2008, our effective tax rate differed from the 34% statutory corporate tax rate primarily due to changes in valuation allowances, permanent differences, lower withholding tax rates, lower alternative minimum tax rates and lower foreign tax rates.
Income tax expense for 2007 included the utilization of previously reserved net operating loss carryforwards and consisted of $0.6 million relating to withholding taxes on certain cross-border transactions, $0.1 million for alternative minimum taxes and $0.1 million for foreign income taxes and United States state income taxes. In
F-22
Table of Contents
MICROTUNE, INC.
NOTES TO CONSOLIDATED FINANCIAL STATEMENTS—(Continued)
December 31, 2009
2007, our effective tax rate differed from the 34% statutory corporate tax rate primarily due to changes in valuation allowances, permanent differences, lower withholding tax rates, lower alternative minimum tax rates and lower foreign tax rates.
The loss from foreign operations before income taxes for 2009 was $1.4 million. The income from foreign operations before income taxes was insignificant for 2008. The income from foreign operations before income taxes for 2007 was $3.5 million. We assert that earnings of our foreign subsidiaries are permanently reinvested. It is not practical for us to determine the amount of unrecognized deferred income tax liability related to such earnings due to the complexities associated with the United States taxation of earnings of foreign subsidiaries repatriated to the United States.
Income taxes paid in 2009, 2008 and 2007 were $0.2 million, $1.0 million and $0.1 million, respectively, and related primarily to foreign operations.
The significant components of our deferred tax assets and liabilities were as follows (in thousands):
| December 31, | ||||||||
| 2009 | 2008 | |||||||
| Deferred tax assets: |
||||||||
| Inventories |
$ | 447 | $ | 414 | ||||
| Intangible assets |
5,125 | 4,081 | ||||||
| Accrued expenses |
642 | 735 | ||||||
| Deferred revenue |
8 | 60 | ||||||
| Net operating loss carryforwards |
65,195 | 63,026 | ||||||
| Research and development credits |
4,361 | 4,360 | ||||||
| Alternative minimum tax credit |
— | 234 | ||||||
| Stock-based compensation expense |
6,227 | 5,231 | ||||||
| Other |
594 | 635 | ||||||
| Total deferred tax assets |
82,599 | 78,776 | ||||||
| Valuation allowance |
(81,879 | ) | (77,640 | ) | ||||
| Total deferred tax assets, net |
$ | 720 | $ | 1,136 | ||||
| Deferred tax liabilities: |
||||||||
| Unrealized currency gains |
$ | (218 | ) | $ | (923 | ) | ||
| Property and equipment |
(261 | ) | — | |||||
| Prepaid expenses |
(241 | ) | (213 | ) | ||||
| Total deferred tax liabilities |
(720 | ) | (1,136 | ) | ||||
| Net deferred tax assets |
$ | — | $ | — | ||||
We have established a valuation allowance to fully reserve our net deferred tax assets at December 31, 2009 and 2008 due to the uncertainty of the timing and amount of future taxable income. For United States federal income tax purposes, at December 31, 2009, we had a net operating loss carryforward of approximately $181.6 million and an unused research and development credit carryforward of approximately $4.4 million, that will begin to expire in 2021. A change in ownership, as defined in Section 382 of the Internal Revenue Code, may limit utilization of the United States federal net operating loss and research and development credit carryforwards.
F-23
Table of Contents
MICROTUNE, INC.
NOTES TO CONSOLIDATED FINANCIAL STATEMENTS—(Continued)
December 31, 2009
10. Commitments and Contingencies
Lease Commitments
We lease our corporate headquarters and principal IC design center in Plano, Texas under an operating lease with a ten year term, which began in April 2005. Rent expense is calculated using the straight-line method over the lease term. We lease a research and development facility in Germany under an operating lease with a twenty-two year term, which began in December 1999. In addition, we lease a research and development facility in Shanghai, China under an operating lease with a two year term, which began in September 2009. We also lease certain other facilities under operating leases and certain equipment and software under operating and capital leases. Future minimum lease payments required under operating leases as of December 31, 2009 were as follows (in thousands):
| Year Ending December 31, |
|||
| 2010 |
$ | 1,717 | |
| 2011 |
1,475 | ||
| 2012 |
1,120 | ||
| 2013 |
982 | ||
| 2014 |
919 | ||
| Thereafter |
3,884 | ||
| Total future minimum lease payments |
$ | 10,097 | |
Rent expense for the years ended December 31, 2009, 2008 and 2007 was $1.6 million, $1.5 million and $1.4 million, respectively.
Purchase Commitments
As of February 5, 2010, we had approximately $13.8 million of cancelable and non-cancelable purchase commitments outstanding with our vendors. These commitments were entered into in the normal course of business.
Other Commitments
We are currently subject to “line down” clauses in contracts with certain automotive entertainment electronics customers. Such clauses require us to pay financial penalties if our failure to supply product in a timely manner causes the customer to slow down or stop their production. We are also subject to product liability clauses and/or intellectual property indemnification clauses in some of our customer contracts. Such clauses require us to pay financial penalties if we supply defective product, which results in financial damages to the customer, or to indemnify the customer for third-party actions based on the alleged infringement by our products of a third party’s intellectual property. As of December 31, 2009, we were unaware of any significant claims by any of our customers.
Legal Proceedings
From time to time, we may be involved in routine legal proceedings, as well as demands, claims and threatened litigation that arise in the normal course of our business. The ultimate amount of liability, if any, for any claims of any type (either alone or in the aggregate) may materially and adversely affect our financial
F-24
Table of Contents
MICROTUNE, INC.
NOTES TO CONSOLIDATED FINANCIAL STATEMENTS—(Continued)
December 31, 2009
condition, results of operations and liquidity. In addition, the ultimate outcome of any litigation is uncertain. Any outcome, whether favorable or unfavorable, may materially and adversely affect us due to legal costs and expenses, diversion of management attention and other factors. We expense legal costs in the period incurred. We cannot assure you that additional contingencies of a legal nature or contingencies having legal aspects will not be asserted against us in the future, and these matters could relate to prior, current or future transactions or events. Except as described below, we are not currently a party to any material litigation.
Audit Committee Investigation, Restatement, Derivative Litigation, and SEC Investigation
In June 2006, the Audit Committee of our Board of Directors self-initiated an independent investigation into our stock option granting practices covering the period from the date of our initial public offering on August 4, 2000 through June 2006. As a result of the findings of the Audit Committee’s investigation, on January 22, 2007, we restated our consolidated financial statements for the years ended December 31, 2005, 2004 and 2003, and the selected consolidated financial data as of and for the years ended December 31, 2005, 2004, 2003, 2002, 2001, 2000 and 1999 to record additional non-cash stock-based compensation expense and related tax liabilities related to certain mispriced stock option grants.
We voluntarily contacted the SEC in July 2006 regarding the Audit Committee’s independent investigation, and representatives of the Audit Committee met with the SEC in February 2007 and again in July 2007 to discuss the findings of the Audit Committee’s investigation. We fully cooperated with the SEC in its investigation of these matters. On June 30, 2008, we announced that we had agreed to settle with the SEC, without admitting or denying the allegations in the SEC’s complaint, by consenting to the entry of a permanent injunction against future violations of the federal securities laws. We were not required to pay any civil penalty or other money damages as part of the settlement.
On June 30, 2008, the SEC filed suit against Douglas J. Bartek, our former Chairman and Chief Executive Officer, who resigned in June 2003, and Nancy A. Richardson, our former Chief Financial Officer and General Counsel, who resigned in March 2004, alleging various violations of the U.S. securities laws related to our historical stock option granting practices. The suit against Mr. Bartek and Ms. Richardson is still pending and attorneys for Mr. Bartek and Ms. Richardson are actively engaging in motion practice and conducting pre-trial discovery.
We have incurred substantial expenses for legal, accounting, tax and other professional services in connection with the Audit Committee’s investigation, the preparation of our restated consolidated financial statements, the defense of the related derivative lawsuit and the SEC investigation. We continue to incur substantial legal expenses related to the SEC litigation against Mr. Bartek and Ms. Richardson. We have advanced substantial legal expenses to Mr. Bartek and Ms. Richardson pursuant to our indemnification agreements with such former officers for legal proceedings related to these matters. We have recognized expenses of approximately $7.6 million through December 31, 2009 related to these matters, net of amounts reimbursed by our directors’ and officers’ liability insurance carrier, and currently have a receivable of $1.4 million at December 31, 2009 for amounts expected to be reimbursed by our directors’ and officers’ liability insurance carriers. As of December 31, 2009, we have exhausted $9.4 million of our $20 million directors’ and officers’ liability insurance coverage. We expect further legal fees related to the SEC litigation against Mr. Bartek and Ms. Richardson to be substantial, and our directors’ and officers’ liability insurance policy is expected to cover a significant portion of any future expenses with any non-reimbursable amounts being covered solely by Microtune. Legal fees incurred responding to the discovery requests and subpoenas of counsel to Mr. Bartek and Ms. Richardson are generally not reimbursable and these legal fees have been and may continue to be substantial.
F-25
Table of Contents
MICROTUNE, INC.
NOTES TO CONSOLIDATED FINANCIAL STATEMENTS—(Continued)
December 31, 2009
Initial Public Offering Litigation
Starting on July 11, 2001, multiple securities fraud class action complaints were filed in the United States District Court for the Southern District of New York naming as defendants several investment banking firms that served as underwriters of our initial public offering, and in one instance, naming Microtune and several of our former officers. The complaints were brought purportedly on behalf of all persons who purchased our common stock from August 4, 2000 through December 6, 2000 and were consolidated into In re Initial Public Offering Securities Litigation (IPO cases), which includes hundreds of other lawsuits filed in the Southern District of New York, challenging over 300 other initial public offerings and secondary offerings conducted in 1998, 1999 and 2000. The consolidated complaint alleges liability on the grounds that the registration statement for our initial public offering did not disclose that (1) the underwriters had agreed to allow certain of their customers to purchase shares in the offering in exchange for excess commissions paid to the underwriters, and (2) the underwriters had arranged for certain of their customers to purchase additional shares in the aftermarket at pre-determined prices to artificially inflate the market price of our shares.
On April 2, 2009, a new global settlement of the IPO cases was submitted to the district court for its approval. This settlement would not require Microtune or its affiliated defendants to pay any money. In June 2009, the court gave preliminary approval to the new global settlement and then on October 6, 2009 gave its final approval to the global settlement.
11. Stockholders’ Equity
Common Stock
On March 4, 2002, our Board declared a dividend of one right for each share of our common stock issued and outstanding at the close of business on March 16, 2002. One right also attaches to each share of our common stock issued subsequent to March 16, 2002. The rights become exercisable to purchase one one-thousandth of a share of new Series A Preferred Stock (Series A), at $115.00 per right, when a person or entity acquires 15 percent or more of our common stock or announces a tender offer which could result in such a person or entity owning 15 percent or more of our common stock. Each one one-thousandth of a share of the Series A has terms designed to make it substantially the economic equivalent of one share of our common stock. Prior to a person or entity acquiring 15 percent, the rights can be redeemed for $0.001 each by action of our Board. Under certain circumstances, if a person or entity acquires 15 percent or more of our common stock, the rights permit our stockholders other than the acquirer to purchase our common stock having a market value of twice the exercise price of the rights, in lieu of the Series A. Alternatively, when the rights become exercisable, the Board may authorize the issuance of one share of our common stock in exchange for each right that is then exercisable. In addition, in the event of certain business combinations, the rights permit the purchase of the common stock of an acquirer at a 50 percent discount. Rights held by the acquirer will become null and void in both cases. The rights expire on March 3, 2012. On December 31, 2009, 53,876,498 rights were outstanding.
Stock Option Plans
In August 1996, our Board of Directors and the stockholders approved the 1996 Stock Option Plan that provided for incentive stock options and nonqualified stock options to be granted to key employees, certain directors and consultants of Microtune. Our Board of Directors or designated committee established the terms of each option granted under the 1996 Stock Option Plan. The stock options granted under this plan generally vested over 4 to 5 years and have a maximum contractual life of 10 years. At December 31, 2009, we had no shares available for grant and 137,611 options granted and outstanding under the 1996 Stock Option Plan. At
F-26
Table of Contents
MICROTUNE, INC.
NOTES TO CONSOLIDATED FINANCIAL STATEMENTS—(Continued)
December 31, 2009
December 31, 2009, we reserved 137,611 shares of common stock for issuance upon exercise of options granted pursuant to the 1996 Stock Option Plan.
In August 2000, we adopted the 2000 Stock Plan. The 2000 Stock Plan, as amended, provides for incentive stock options, nonqualified stock options, restricted stock and restricted stock units to be granted to our employees and consultants. Our Board of Directors or designated committee establishes the terms of each option granted under the 2000 Stock Plan. The equity awards granted under this plan generally vest over 3 to 5 years and the stock options granted under this plan have a maximum contractual life of 10 years. At December 31, 2009, we had 3,405,526 shares available for grant and 8,589,773 options and 1,240,469 restricted stock units granted and outstanding under the 2000 Stock Plan. At December 31, 2009, we reserved 13,235,768 shares of common stock for issuance upon exercise of options granted, vesting of restricted stock units and granting of other equity awards pursuant to the 2000 Stock Plan.
In August 2000, we adopted the Directors’ Stock Plan. The Directors’ Stock Plan, as amended, provides for nonqualified stock options to be granted to non-employee members of the Board of Directors. The equity awards granted under this plan generally vest over 3 years and the stock options granted under this plan have a maximum contractual life of 10 years. At December 31, 2009, we had 226,800 shares available for grant and 884,750 options and 67,200 restricted stock units granted and outstanding under the Directors’ Stock Plan. At December 31, 2009, we reserved 1,178,750 shares of common stock for issuance upon exercise of options granted, vesting of restricted stock units and granting of other equity awards pursuant to the Directors’ Stock Plan.
On November 28, 2001, we acquired all of the outstanding capital stock of Transcilica Inc. (Transcilica), a publicly held company based in California, and assumed the obligations under Transilica’s Stock Option Plan. The Transilica Stock Option Plan provided for incentive stock options and nonqualified stock options to be granted to key employees and consultants of Transilica. Their Board of Directors established the terms of each option granted under the Transilica Stock Option Plan at the time of grant. The stock options granted under this plan generally vested over 4 years and have a maximum contractual life of 10 years. At December 31, 2009, we had no shares available for grant and 17,170 options granted and outstanding under the Transilica Stock Option Plan. At December 31, 2009, we reserved 17,170 shares of common stock for issuance upon exercise of options granted pursuant to the Transilica Stock Option Plan.
The following presents a summary of our stock option activity, excluding restricted stock units, and related information for the year ended December 31, 2009:
| Options Outstanding | ||||||
| Number of Shares | Weighted Average Exercise Price Per Share | |||||
| Balance at December 31, 2008 |
11,043,191 | $ | 3.96 | |||
| Exercised |
(252,055 | ) | 0.83 | |||
| Canceled |
(1,161,832 | ) | 3.95 | |||
| Balance at December 31, 2009 |
9,629,304 | $ | 4.05 | |||
The total intrinsic value of options exercised during 2009, 2008 and 2007 was $0.3 million, $0.6 million and $1.0 million, respectively. During 2009, there were no grants to non-employees.
F-27
Table of Contents
MICROTUNE, INC.
NOTES TO CONSOLIDATED FINANCIAL STATEMENTS—(Continued)
December 31, 2009
The following presents information about outstanding stock options at December 31, 2009 (in thousands, except shares and per share data):
| Options Outstanding | Options Exercisable | |||||||||||||||||||
| Range of Exercise Price |
Number | Weighted Average Remaining Contractual Life (Years) |
Weighted Average Exercise Price |
Aggregate Intrinsic Value |
Number | Weighted Average Remaining Contractual Life (Years) |
Weighted Average Exercise Price |
Aggregate Intrinsic Value | ||||||||||||
| $0.88 - $ 2.40 | 1,173,578 | 3.11 | $ | 2.15 | $ | 129,094 | 1,173,578 | 3.11 | $ | 2.15 | $ | 129,094 | ||||||||
| 2.41 - 2.70 | 1,124,195 | 3.51 | 2.63 | — | 1,124,195 | 3.51 | 2.63 | — | ||||||||||||
| 2.71 - 3.61 | 1,232,121 | 3.50 | 3.16 | — | 1,104,121 | 2.95 | 3.14 | — | ||||||||||||
| 3.62 - 3.75 | 11,100 | 0.04 | 3.74 | — | 11,100 | 0.04 | 3.74 | — | ||||||||||||
| 3.84 - 3.84 | 1,380,686 | 5.39 | 3.84 | — | 1,380,686 | 5.39 | 3.84 | — | ||||||||||||
| 3.86 - 4.30 | 988,712 | 4.60 | 4.20 | — | 920,704 | 4.51 | 4.20 | — | ||||||||||||
| 4.31 - 4.48 | 262,532 | 5.00 | 4.45 | — | 242,782 | 4.73 | 4.46 | — | ||||||||||||
| 4.53 - 4.53 | 1,245,105 | 7.24 | 4.53 | — | 62,217 | 5.02 | 4.53 | — | ||||||||||||
| 4.55 - 5.48 | 1,279,805 | 4.81 | 5.13 | — | 1,123,086 | 4.50 | 5.16 | — | ||||||||||||
| 5.60 - 37.88 | 931,470 | 5.49 | 7.21 | — | 753,502 | 5.22 | 7.54 | — | ||||||||||||
| $0.88 - $37.88 | 9,629,304 | 4.73 | $ | 4.05 | $ | 129,094 | 7,895,971 | 4.17 | $ | 3.93 | $ | 129,094 | ||||||||
The aggregate intrinsic values in the table above were based on the closing price of our common stock of $2.26 as of December 31, 2009. The aggregate grant date fair value of stock options vesting during 2009 and 2008 was $3.2 million and $6.1 million, respectively. At December 31, 2008, we had 7,299,973 options exercisable at a weighted average exercise price of $3.70 per option. At December 31, 2007, we had 6,056,713 options exercisable at a weighted average exercise price of $3.48 per option.
The following presents a summary of our restricted stock unit activity for the year ended December 31, 2009:
| Restricted Stock Units | ||||||
| Outstanding | Weighted Average Grant Date Fair Value Price Per Share | |||||
| Balance at December 31, 2008 |
944,414 | $ | 4.57 | |||
| Granted |
861,210 | 2.09 | ||||
| Vested |
(55,105 | ) | 5.10 | |||
| Canceled |
(442,850 | ) | 4.24 | |||
| Balance at December 31, 2009 |
1,307,669 | $ | 3.03 | |||
The aggregate grant date fair value of restricted stock units vesting during 2009 and 2008 was $0.3 million and $0.9 million, respectively. No restricted stock units vested in 2007. The total intrinsic value of restricted stock units vesting during 2009 and 2008 was $0.1 million and $1.1 million, respectively.
F-28
Table of Contents
MICROTUNE, INC.
NOTES TO CONSOLIDATED FINANCIAL STATEMENTS—(Continued)
December 31, 2009
Employee Stock Purchase Plan
In August 2000, we adopted an Employee Stock Purchase Plan under Section 423 of the Internal Revenue Code. The plan allows eligible employees to purchase our common stock at 85% of the lower of the market value of the common stock at the beginning or end of each successive six-month offering period. Amounts deducted and accumulated by the participant are used to purchase shares of common stock at the end of each purchase period. At December 31, 2009, we had 105,140 shares available for purchase and reserved for issuance pursuant to the Employee Stock Purchase Plan.
2008 Incentive Compensation Program
During the first quarter of 2008, our Board of Directors approved an annual incentive compensation program for fiscal year 2008 (2008 Bonus Program) covering executive officers and certain key managers and providing for incentive compensation to be paid, to the extent any such compensation is earned, 40% in cash and 60% through the performance vesting of restricted stock units under the 2000 Stock Plan. An aggregate of 213,000 restricted stock units were awarded under the 2008 Bonus Program with a grant date fair value of $5.42 per share. The 2008 Bonus Program also provided for the payment of cash awards to certain key employees to the extent profitability goals were met under the 2008 Bonus Program.
On February 3, 2009, our Board of Directors determined that the executive officers covered by the 2008 Bonus Program each achieved only a portion of the awards set forth in the 2008 Bonus Program based upon the program’s profitability and revenue targets. As such, cash awards earned under the 2008 Bonus Program totaling $0.2 million were paid and approximately 49,000 restricted stock units issued under the 2008 Bonus Program vested and the underlying shares were issued pursuant to the terms of the 2008 Bonus Program. Of the total shares issued under the 2008 Bonus Program, executive officers and certain key managers surrendered an aggregate of 14,000 shares to satisfy minimum payroll tax withholding requirements. The cash awards were paid in February 2009. During 2008, stock-based compensation expense recognized under the 2008 Bonus Program was $0.2 million. Stock-based compensation expense recognized during the first quarter of 2009 under the 2008 Bonus Program was insignificant as participants were required to be employed with us on the payment date to be eligible for awards under the 2008 Bonus Program. During 2008, we recognized $0.2 million relating to cash awards under the 2008 Bonus Program. Charges relating to the cash awards during the first quarter of 2009 under the 2008 Bonus Program were insignificant.
2007 Incentive Compensation Program
During the first quarter of 2007, our Board of Directors approved an annual incentive compensation program for fiscal year 2007 (2007 Bonus Program) covering executive officers and providing for incentive compensation, to the extent any such compensation was earned, to be paid 35% in cash and 65% through the performance vesting of restricted stock units under the 2000 Stock Plan. An aggregate of 197,600 restricted stock units were awarded under the 2007 Bonus Program with a grant date fair value of $4.43 per share. The 2007 Bonus Program also provided for the payment of cash awards to certain employees to the extent any such compensation was earned.
On February 8, 2008, our Board of Directors determined that the executive officers covered by the 2007 Bonus Program each achieved the maximum awards set forth in the 2007 Bonus Program based upon the program’s profitability and revenue targets. As such, the maximum amount of cash awards under the 2007 Bonus Program were paid and the entire amount of restricted stock units awarded under the 2007 Bonus Program vested and the underlying shares were issued pursuant to the terms of the 2007 Bonus Program. Of the total shares
F-29
Table of Contents
MICROTUNE, INC.
NOTES TO CONSOLIDATED FINANCIAL STATEMENTS—(Continued)
December 31, 2009
issued under the 2007 Bonus Program, certain executive officers surrendered an aggregate of 51,266 shares to satisfy minimum payroll tax withholding requirements. The cash awards were paid in February 2008. During 2007, stock-based compensation expense recognized under the 2007 Bonus Program was $0.8 million. Stock-based compensation expense of $0.1 million was recognized during the first quarter of 2008 under the 2007 Bonus Program as participants were required to be employed with us on the payment date to be eligible for awards under the 2007 Bonus Program. During 2007, we recognized $1.6 million relating to the cash awards under the 2007 Bonus Program. We recognized $0.3 million relating to the cash awards during the first quarter of 2008 under the 2007 Bonus Program.
Tender Offer to Amend Stock Options
On December 4, 2007, we completed a tender offer with eligible employees, as defined in the tender offer documents, to amend certain stock options to purchase 1,313,738 shares of our common stock to increase the exercise price of portions of those stock options in order to limit the potential adverse personal tax consequences that applied to those stock options under Section 409A of the Internal Revenue Code and the final regulations promulgated by the IRS thereunder. The eligible stock option grants, as defined in the tender offer documents, that were the subject of the tender offer were granted under either our 1996 Stock Option Plan or our 2000 Stock Plan. At December 31, 2007, the accrued compensation included $0.5 million for cash payments due under the tender offer. These cash payments were made in January 2008 in accordance with the provisions of the tender offer. During the fourth quarter of 2007, we recorded a charge of $0.2 million to account for the stock option amendments under the tender offer in accordance with ASC 718. At December 31, 2009, the cash payments due under the tender offer included in accrued compensation were insignificant. These cash payments were made during January 2010 in accordance with the provisions of the tender offer. During 2009 and 2008, the charge to account for the stock option amendments under the tender offer was $0.1 million and $0.1 million, respectively. Charges in 2010 for potential future cash payments as a result of this tender offer are expected to be insignificant.
Stock Repurchase Program
On April 29, 2008, our Board of Directors approved a stock repurchase program. Under the program, we were authorized to repurchase up to $10 million of our outstanding shares of common stock until the end of 2008, through open market and privately negotiated transactions, at times and in such amounts as we deemed appropriate. The timing and actual number of shares repurchased depended on a variety of factors including the timing of open trading windows, price, corporate and regulatory requirements and other market conditions. The program could have been suspended or discontinued at any time without prior notice. The stock repurchase program was funded using our available cash balances and working capital. At December 31, 2008, upon completion of the program, we had repurchased and retired approximately 2,719,000 shares of our common stock at a cost of $8.5 million and $1.5 million was unused under the program. The program was completed on December 31, 2008 with final repurchase activity concluding on November 30, 2008.
F-30
Table of Contents
MICROTUNE, INC.
NOTES TO CONSOLIDATED FINANCIAL STATEMENTS—(Continued)
December 31, 2009
Stock-based Compensation
The following table summarizes the allocation of stock-based compensation expense under ASC 718 (in thousands):
| Year Ended December 31, | |||||||||
| 2009 | 2008 | 2007 | |||||||
| Cost of revenue |
$ | 38 | $ | 35 | $ | 40 | |||
| Research and development |
2,176 | 1,893 | 2,448 | ||||||
| Selling, general and administrative |
2,593 | 2,866 | 3,608 | ||||||
| Total stock-based compensation expense included in operating expenses |
4,769 | 4,759 | 6,056 | ||||||
| Total stock-based compensation expense |
$ | 4,807 | $ | 4,794 | $ | 6,096 | |||
No stock options were granted during 2009. The weighted-average estimated fair value of stock options granted during 2008 and 2007 was $2.01 and $2.43 per share, respectively, using the Black-Scholes-Merton option-pricing formula with the following weighted-average assumptions:
| Year Ended December 31, | |||||||||
| 2009 | 2008 | 2007 | |||||||
| Expected volatility |
57.92 | % | 57.30 | % | 55.50 | % | |||
| Risk-free interest rate |
2.19 | % | 2.60 | % | 4.50 | % | |||
| Expected dividends |
0.00 | % | 0.00 | % | 0.00 | % | |||
| Expected term (years) |
5 | 5 | 5 | ||||||
The expected volatility assumptions were based upon a combination of historical stock price volatility and implied volatility consistent with ASC 718. The historical stock price volatility was measured on a weekly basis due to the relatively high volatility of the market value of our common stock and excluded periods before the third quarter of 2003 as the volatility during these periods was not indicative of expected volatility. Due to the relatively low volume of the traded options on our common stock, we measured implied volatility using traded options with terms of at least 6 months. Expected volatility was calculated using 75% of the historical stock price volatility and 25% of the implied volatility.
The risk-free interest rate assumptions were based upon the implied yields from the U.S. Treasury zero-coupon yield curve with a remaining term equal to the expected term of the options.
The expected terms of employee stock options represented the weighted-average period the stock options were expected to remain outstanding and was based upon historical employee exercise behavior and expected employee turnover.
The average per share value of restricted stock units granted during 2009, 2008 and 2007 was $2.09, $4.58 and $4.49, respectively, using our closing stock price on the respective grant dates.
Our Employee Stock Purchase Plan has been deemed compensatory in accordance with ASC 718. Stock-based compensation relating to this plan was estimated as of the respective grant dates of the purchase rights provided to employees under the plan using a Black-Scholes-Merton option-pricing formula and the same
F-31
Table of Contents
MICROTUNE, INC.
NOTES TO CONSOLIDATED FINANCIAL STATEMENTS—(Continued)
December 31, 2009
assumptions used for valuing stock options as disclosed under ASC 718 above. The weighted-average estimated value of the purchase rights outstanding under this plan during 2009, 2008 and 2007 was $0.67, $1.29 and $1.77 per right, respectively. During 2009, 2008 and 2007, we recognized $0.4 million, $0.3 million and $0.4 million, respectively, of stock-based compensation expense relating to the plan. The total intrinsic value of purchase rights exercised during 2009, 2008 and 2007 was $0.4 million, $0.2 million and $0.2 million, respectively.
At December 31, 2009, the balance of unearned stock-based compensation to be expensed in future periods related to unvested share-based awards, as adjusted for expected forfeitures, was approximately $4.5 million. The weighted-average period over which the unearned stock-based compensation was expected to be recognized was approximately 2 years. We anticipate that we will grant additional share-based awards to employees in the future, which will increase the stock-based compensation expense by the additional unearned compensation resulting from these grants. The fair value of these grants is not included in the amount above, as the impact of these grants cannot be predicted at this time because it will depend on the number of share-based payments granted. In addition, if factors change and we employ different assumptions in the application of ASC 718 in future periods, the stock-based compensation expense that we record under ASC 718 may differ significantly from what we have recorded in the current period.
12. Employee Benefit Plans
We offer a 401(k) plan whereby employees who participate may contribute up to 20% of pre-tax salary to the plan, subject to IRS limitations including any catch-up provisions. Under our 401(k) plan, we may elect to make voluntary contributions. In the first quarter of 2007, our Board of Directors approved a program to match a portion of the cash contributions made by employees to their 401(k) accounts. During 2009, 2008 and 2007, we made matching contributions of $0.2 million, $0.2 million and $0.1 million, respectively, to 401(k) accounts of our employees.
Microtune KG, our German operating company, and its subsidiaries sponsor defined contribution retirement plans for its employees. Retirement benefit expense was $0.2 million for 2009 and $0.1 million for 2008 and 2007, respectively.
13. Restructuring Cost
In October 2009, we finalized a restructuring plan that included a reduction in force that resulted in the termination or attrition of approximately 10% of our workforce. The reduction in force was substantially completed during the fourth quarter of 2009. These actions were taken as part of a larger cost reduction effort in order to streamline operations and more closely align costs with revenue in an effort to achieve profitability as quickly as possible in the current challenging economic environment. We recorded restructuring charges related to this plan of $1.7 million during the fourth quarter of 2009. The following table summarizes the restructuring activity (in thousands):
| Termination Benefits |
Other Associated Cost |
Total | ||||||||||
| Balance at December 31, 2008 |
$ | — | $ | — | $ | — | ||||||
| Additions |
1,673 | 69 | 1,742 | |||||||||
| Payments |
(819 | ) | (69 | ) | (888 | ) | ||||||
| Balance at December 31, 2009 |
$ | 854 | $ | — | $ | 854 | ||||||
The remaining cash severance payments will be made during the first half of 2010.
F-32
Table of Contents
MICROTUNE, INC.
NOTES TO CONSOLIDATED FINANCIAL STATEMENTS—(Continued)
December 31, 2009
14. Geographic Information and Significant Customers
Our corporate headquarters and main design center are located in Plano, Texas. We have other sales offices and design centers in the United States and other worldwide locations. Net income (loss) from foreign operations totaled $(1.9) million, $(0.2) million and $3.4 million for 2009, 2008 and 2007, respectively.
Net revenue derived from shipments to customer locations by geographical area is summarized below (in thousands):
| Year Ended December 31, | |||||||||
| 2009 | 2008 | 2007 | |||||||
| Asia Pacific |
$ | 37,731 | $ | 47,518 | $ | 38,635 | |||
| North America |
22,273 | 34,632 | 32,822 | ||||||
| Europe |
12,307 | 23,266 | 19,407 | ||||||
| Other |
2,259 | 2,604 | 277 | ||||||
| Total |
$ | 74,570 | $ | 108,020 | $ | 91,141 | |||
Net revenue derived from shipments to customer locations in countries exceeding 10% of total net revenue was as follows:
| Year Ended December 31, | |||||||||
| 2009 | 2008 | 2007 | |||||||
| China (including Hong Kong) |
28 | % | 30 | % | 27 | % | |||
| Mexico |
25 | % | 26 | % | 14 | % | |||
| Germany |
* | 10 | % | 11 | % | ||||
| United States |
* | * | 21 | % | |||||
| * | Less than 10% of total net revenue |
The locations of property and equipment, net, are summarized below (in thousands):
| December 31, | ||||||
| 2009 | 2008 | |||||
| United States |
$ | 2,935 | $ | 3,599 | ||
| Germany |
1,049 | 1,109 | ||||
| Asia Pacific |
623 | 440 | ||||
| Total |
$ | 4,607 | $ | 5,148 | ||
Net revenue from customers, including their respective manufacturing subcontractors, exceeding 10% of net revenue was as follows:
| Year Ended December 31, | |||||||||
| 2009 | 2008 | 2007 | |||||||
| Cisco |
29 | % | 29 | % | 32 | % | |||
| Unihan (1) (2) |
14 | % | 13 | % | 18 | % | |||
| Panasonic |
13 | % | 12 | % | * | ||||
| Samsung |
10 | % | * | * | |||||
| Ten largest customers |
86 | % | 85 | % | 82 | % | |||
F-33
Table of Contents
MICROTUNE, INC.
NOTES TO CONSOLIDATED FINANCIAL STATEMENTS—(Continued)
December 31, 2009
| (1) | Primarily for the benefit of ARRIS Group, Inc. |
| (2) | A wholly-owned subsidiary of Asustek Computer |
| * | Less than 10% of total net revenue |
15. Selected Quarterly Consolidated Financial Data (unaudited)
The following tables present selected unaudited consolidated statement of operations information for each of the quarters in the years ended December 31, 2009 and 2008 as reported (in thousands, except per share data):
| For the Quarter Ended | ||||||||||||||||
| Year Ended December 31, 2009 |
December 31 | September 30 | June 30 | March 31 | ||||||||||||
| Net revenue |
$ | 21,106 | $ | 17,997 | $ | 17,572 | $ | 17,895 | ||||||||
| Cost of revenue |
9,058 | 8,466 | 9,108 | 9,464 | ||||||||||||
| Gross margin |
12,048 | 9,531 | 8,464 | 8,431 | ||||||||||||
| Loss from operations |
(1,626 | ) | (4,557 | ) | (4,401 | ) | (3,853 | ) | ||||||||
| Loss before income taxes |
(1,486 | ) | (4,251 | ) | (3,957 | ) | (3,609 | ) | ||||||||
| Net loss |
(1,224 | ) | (4,378 | ) | (4,040 | ) | (3,657 | ) | ||||||||
| Basic and diluted loss per common share |
$ | (0.02 | ) | $ | (0.08 | ) | $ | (0.08 | ) | $ | (0.07 | ) | ||||
| For the Quarter Ended | ||||||||||||||||
| Year Ended December 31, 2008 |
December 31 | September 30 | June 30 | March 31 | ||||||||||||
| Net revenue |
$ | 24,017 | $ | 31,928 | $ | 26,612 | $ | 25,463 | ||||||||
| Cost of revenue |
11,859 | 16,477 | 13,133 | 13,222 | ||||||||||||
| Gross margin |
12,158 | 15,451 | 13,479 | 12,241 | ||||||||||||
| Income from operations |
724 | 3,089 | 1,546 | 265 | ||||||||||||
| Income before income taxes |
920 | 3,287 | 1,871 | 933 | ||||||||||||
| Net income |
822 | 3,175 | 1,726 | 652 | ||||||||||||
| Basic and diluted income per common share |
$ | 0.02 | $ | 0.06 | $ | 0.03 | $ | 0.01 | ||||||||
The consolidated statement of operations for the fourth quarter of 2009 reflects a $0.8 million benefit to cost of revenue for the sale of inventory that had previously been written-off as excess, $1.1 million in stock-based compensation expense, a $1.7 million charge to operating expenses for one-time employee termination benefits from a restructuring plan and a $0.4 million benefit related to professional fees of our legal firms expensed in connection with the SEC litigation against two of our former officers.
16. Subsequent Events
We evaluated subsequent events through February 16, 2010, the date the financial statements were issued. No reportable subsequent events were identified as a result of our evaluation.
F-34