Attached files
Table of Contents
UNITED STATES
SECURITIES AND EXCHANGE COMMISSION
Washington, D.C. 20549
Form 10-K
(Mark One)
| x | ANNUAL REPORT PURSUANT TO SECTION 13 OR 15(d) OF THE SECURITIES EXCHANGE ACT OF 1934 |
For the fiscal year ended December 31, 2009
or
| ¨ | TRANSITION REPORT PURSUANT TO SECTION 13 OR 15(d) OF THE SECURITIES EXCHANGE ACT OF 1934 |
For the transition period from to
Commission file number: 000-53413
Rovi Corporation
(Exact name of registrant as specified in its charter)
| Delaware | 26-1739297 | |
| (State or other jurisdiction of | (I.R.S. Employer | |
| incorporation or organization) | Identification Number) |
2830 De La Cruz Boulevard
Santa Clara, California
95050
(Address of principal executive offices)
(Zip Code)
Registrant’s telephone number, including area code:
(408) 562-8400
Securities registered pursuant to Section 12(b) of the Act:
| Title of Each Class |
Name of Exchange on Which Registered | |
| Common Stock, $0.001 Par Value | The NASDAQ Global Select Market |
Securities registered pursuant to Section 12(g) of the Act: None
Indicate by check mark if the registrant is a well-known seasoned issuer, as defined in Rule 405 of the Securities Act. Yes þ No ¨
Indicate by check mark if the registrant is not required to file reports pursuant to Section 13 or Section 15(d) of the Securities Act. Yes ¨ No þ
Indicate by check mark whether the registrant: (1) has filed all reports required to be filed by Section 13 or 15(d) of the Exchange Act during the preceding 12 months (or for such shorter period that the registrant was required to file such reports), and (2) has been subject to such filing requirements for the past 90 days. Yes þ No ¨
Indicate by check mark whether the registrant has submitted electronically and posted on its corporate Web site, if any, every Interactive Data File required to be submitted and posted pursuant to Rule 405 of Regulation S-T during the preceding 12 months (or for such shorter period that the registrant was required to submit and post such files). Yes ¨ No ¨
Indicate by check mark if disclosure of delinquent filers pursuant to Item 405 of Regulation S-K is not contained herein, and will not be contained, to the best of the registrant’s knowledge, in definitive proxy or information statements incorporated by reference in Part III of this Form 10-K or any amendment to this Form 10-K. þ
Indicate by check mark whether the registrant is a large accelerated filer, an accelerated filer, a non-accelerated filer or a smaller reporting company. See definitions of “large accelerated filer”, “accelerated filer”, “non-accelerated filer” and “smaller reporting company” in Rule 12b-2 of the Exchange Act. (Check One):
Large accelerated filer þ Accelerated filer ¨ Non-accelerated filer ¨ Smaller reporting company ¨
Indicate by check mark whether the registrant is a shell company (as defined in Rule 12b-2 of the Exchange Act). Yes ¨ No þ
The aggregate market value of voting and non-voting common equity held by non-affiliates of the Registrant was approximately $2.2 billion as of June 30, 2009, based upon the closing price on the NASDAQ Global Select Market reported for such date. This calculation does not reflect a determination that certain persons are affiliates of the Registrant for any other purpose. The number of shares outstanding of the Registrant’s Common Stock on February 2, 2010, was 104,187,970 shares.
DOCUMENTS INCORPORATED BY REFERENCE
Portions of the registrant’s definitive Proxy Statement related to the 2010 Annual Meeting of Stockholders, to be filed with the Securities and Exchange Commission within 120 days after December 31, 2009, are incorporated by reference into Part III of this Form 10-K.
Table of Contents
| PART I | ||||
| ITEM 1. |
1 | |||
| ITEM 1A. |
14 | |||
| ITEM 1B. |
31 | |||
| ITEM 2. |
32 | |||
| ITEM 3. |
32 | |||
| ITEM 4. |
33 | |||
| PART II | ||||
| ITEM 5. |
34 | |||
| ITEM 6. |
36 | |||
| ITEM 7. |
MANAGEMENT’S DISCUSSION AND ANALYSIS OF FINANCIAL CONDITION AND RESULTS OF OPERATIONS |
38 | ||
| ITEM 7A. |
51 | |||
| ITEM 8. |
52 | |||
| ITEM 9. |
CHANGES IN AND DISAGREEMENTS WITH ACCOUNTANTS ON ACCOUNTING AND FINANCIAL DISCLOSURES |
52 | ||
| ITEM 9A. |
52 | |||
| ITEM 9B. |
55 | |||
| PART III | ||||
| ITEM 10. |
55 | |||
| ITEM 11. |
55 | |||
| ITEM 12. |
SECURITY OWNERSHIP OF CERTAIN BENEFICIAL OWNERS AND MANAGEMENT AND RELATED STOCKHOLDER MATTERS |
55 | ||
| ITEM 13. |
CERTAIN RELATIONSHIPS AND RELATED TRANSACTIONS , AND DIRECTOR INDEPENDENCE |
55 | ||
| ITEM 14. |
55 | |||
| PART IV | ||||
| ITEM 15. |
56 | |||
| 60 | ||||
Table of Contents
Discussions of some of the matters contained in this Annual Report on Form 10-K for Rovi Corporation (the “Company,” “we” or “us”) may constitute forward-looking statements within the meaning of the Section 27A of the Securities Act of 1933, as amended, and Section 21E of the Securities and Exchange Act of 1934, as amended, and as such, may involve risks and uncertainties. Some of these discussions are contained under the captions “Item 1. Business” and “Item 7. Management’s Discussion and Analysis of Financial Condition and Results of Operations.” We have based these forward-looking statements on our current expectations and projections about future events or future financial performance, which include implementing our business strategy, developing and introducing new technologies, obtaining, maintaining and expanding market acceptance of the technologies we offer, and competition in our markets.
In some cases, you can identify these forward-looking statements by terminology such as “may,” “will,” “should,” “expect,” “plan,” “anticipate,” “believe,” “estimate,” “future,” “predict,” “potential,” “intend,” or “continue,” and similar expressions. These statements are based on the beliefs and assumptions of our management and on information currently available to our management. Our actual results, performance and achievements may differ materially from the results, performance and achievements expressed or implied in such forward-looking statements. For a discussion of some of the factors that might cause such a difference, see “Item 1A. – Risk Factors” and elsewhere in this Form 10-K. We specifically disclaim any obligation to update such forward-looking statements.
| ITEM 1. | BUSINESS |
Overview
We are focused on powering the discovery and enjoyment of digital entertainment by providing a broad set of integrated solutions that are embedded in our customers’ products and services and used by end consumers to simplify and guide their interaction with digital entertainment. Our offerings include interactive program guides (“IPGs”); embedded licensing technologies (such as recommendations and search capability); standards based media connectivity middleware; media recognition technologies; licensing of our extensive database of descriptive information about television, movie, music, books, and game content; and content protection technologies and services. In addition to offering Company developed IPGs, our customers may also license our patents and deploy their own IPG or a third party IPG.
In May 2008, we acquired Gemstar-TV Guide International, Inc. (“Gemstar”) and, in April 2009, we acquired substantially all of the operations of Muze, Inc. (“Muze”). Our results of operations include the operations of Gemstar and Muze from those dates forward.
In April 2008, we sold our software and games businesses (referred to as “Software” and “Games”, respectively). In November 2008, we sold our RightCommerce (also known as “eMeta”) business. In December 2008, we sold our TV Guide Magazine business. In January 2009, we sold our TVG Network business and, in February 2009, we sold our TV Guide Network and TV Guide Online businesses. Together TV Guide Magazine, TVG Network, TV Guide Network and TV Guide Online are collectively referred to as the “Media Properties”. The results of operations and cash flows of Software, Games, eMeta and the Media Properties have been classified as discontinued operations for all periods presented.
Industry Background
The entertainment media market is experiencing a major transformation from analog to digital content. The design, distribution, protection and consumption of all forms of digital content continues to experience an unprecedented amount of change. The expansion of network bandwidth, increased availability of devices that allow people to enjoy digital content, availability of digital content, and increased mobility are all helping to
1
Table of Contents
accelerate the market shift. As part of this change, consumers are demanding high-quality digital content in many formats and places. Users are also seeking flexible means by which to legally acquire and add content to their digital libraries permanently or for a period of time and want to be able to enjoy that content in numerous locations on different devices. They want to easily discover and access content (movies, music, photos, and programming) and enjoy it where they want and when they want.
No matter what content consumers desire or are enjoying, video content remains key. New devices and services are continually being created that bring video content to consumers. Consumers are in an upgrade cycle investing in high end HDTV’s that maximize video enjoyment. These devices require the ability to provide information identifying what is available to the viewer in broadcast television (TV listings), stored or packaged video, and video on demand (“VOD”). We refer to providing this information as “guidance”. Guidance becomes more complex as more sources of entertainment become available to consumers. Beyond existing pay TV options, consumers can now download or stream Internet-based content to their media devices, accessed via several different business models. In addition, the current home media device infrastructure is very complex. Setting up such an environment requires integrating numerous devices, a deep understanding of the interoperability of media formats and creation of mechanisms for managing and enjoying content. The alternative is to purchase products from a single vendor and sacrifice the ability to integrate all types of media into many devices or have many devices operating in silos, significantly limiting the mobility and flexibility that consumers desire.
These changes are impacting every part of the entertainment supply chain, from content producers, to distribution channels and consumption device manufacturers, causing them each to reevaluate their business models, as well as introducing new competitors at each phase of the supply chain.
In the case of content producers, the industry shift to digital media, PC-based entertainment platforms, digital portable devices, networked devices, and Internet downloads threatens current revenue models built on tightly controlled distribution “windows” that leaves content producers vulnerable to unauthorized use of their content. Inexpensive, easy-to-use in-home copying devices, such as DVD recorders, and PC-based hard drive recorders, enable consumers to make unauthorized copies of video, audio and software content. Content owners lose billions of dollars every year to casual copying and professional or bootleg piracy and Internet/peer-to-peer (P2P) piracy. As technological advances facilitate digital downloads and digital copying, motion picture studios, music labels, cable television and program distributors have become more concerned with how to protect their intellectual property, make it available to consumers in the manner they wish to receive it, and maintain their distribution windows.
Distribution channels, such as cable and satellite operators, web portals and retailers, and others are all seeking ways to best retain their competitive advantage in a digital entertainment world. They are requiring highly customizable solutions that aid the consumer experience, such as additional data about the entertainment content, while still allowing the distribution channel to retain its unique identity. They are also seeking to increase their interaction with a consumer and create new revenue opportunities. This requires substantial investment in technology infrastructure to augment their current businesses. Additionally, content producers are exploring new forms of distribution to protect or advance their position in the distribution window chain, which includes experimenting with direct to consumer models and new forms of content licensing, such as exclusive downloads, subscription to a studio’s portfolio, or making a streamed or downloaded movie available for purchase simultaneous with the home video distribution window. All of this results in increased competition for distributors, leading to their need to create unique distribution arrangements and to integrate with many partners to reach consumers.
The markets for consumer electronics (“CE”) manufacturers are also in major flux. Consumers are demanding capabilities to interact with broad ranges of media, not just viewing content that is broadcast to the device. Increased functionality requires extensive software to be embedded into these devices, which is not a core competency for CE manufacturers. CE manufacturers also desire an ongoing revenue relationship with their customer, not just to sell them a new device every few years. This leads to a demand for add-on services or advertising that allow the CE manufacturer to profit from the on-going distribution or maintenance of entertainment content.
2
Table of Contents
As traditional media changes, the opportunities for advertisers evolve as well. Currently advertisers spend more heavily on television commercials than any other form of advertising. As television viewership becomes more fragmented, advertisers have sought new ways to reach consumers. Additionally, the growth of web advertising has increased the criteria advertisers use to evaluate successful advertising, adding metrics such as personalization and guaranteed views.
Rovi’s Markets
We sell our products into the following market verticals (i) service providers (cable, satellite, telecommunications, mobile and internet service providers among others), (ii) CE manufacturers, and (iii) other.
Service Providers
IPGs
An IPG is an interactive listing of television or video program information that enables viewers to navigate through, sort, select and schedule video programming for viewing and recording. We believe that interactive video guidance technology is a necessary tool for television viewers bombarded with an increasing amount of available content and an increasing number of digital cable and satellite television channels, VOD services, and Internet download services. The IPG is evolving from a guide to television to a guide for all the digital content that users have access to in the home or available to them on their TV, including programming delivered over the Internet.
Our service provider licensees either deploy IPGs provided by the Company or, pursuant to an IPG patent license, their own IPG or a third party IPG. For service providers that deploy one of our IPGs, we also offer operational support, content, professional services and data. Our IPGs allow service providers to customize certain elements of the IPGs for their subscribers and also allow these providers to upgrade, over time, the features and services they can offer to their subscribers. Our service provider IPGs are compatible with service providers’ subscription management, pay-per-view (“PPV”) and VOD services. Our IPGs allow service providers to provide their viewers with current and future program information. We currently offer IPGs marketed to service providers under the i-Guide, Passport, Passport Echo, Passport DCT and Passport tru2way brands. In addition, in response to interest from service providers, we are currently investing in developing a TotalGuide solution for service providers (See Consumer Electronics – IPGs below).
The majority of our service provider IPGs also feature advertising. We sell advertisers, often broadcasters, or their agencies the opportunity to promote their products via ads inserted in our guides. We offer packages to advertisers to provide them nationwide or targeted advertising on a guide for a period of time. Advertisers place ads through a variety of display formats incorporated into the guide screens. Depending on the IPG deployed, advertisements can display additional text information or video when clicked on via the remote control. Our most recent guides even allow an ad for a specific television program to link directly to the TV channel it is on or allow consumers to program a recording or a reminder from the ad. Advertisers can target specific audiences by airing ads at certain times of the day or in specific geographies.
To demonstrate the value of this advertising, we began measuring usage and ad views by consumers for certain service provider guides deployed in the United States (a click stream analysis) in late 2008. We believe this information may enable us to increase our revenue from advertising by offering the advertiser evidence of the reach of a given ad or time slot. Service providers who have a patent license from us are not required to provide advertising in their IPG. However, our agreements with domestic service providers generally require the sharing of advertising revenue if IPG advertising is provided.
Service providers generally pay us a monthly per subscriber fee. Service providers in the Online space generally pay us a fee based on unique users. We have also entered into agreements with certain licensees that enable them to provide an IPG to an unlimited number of subscribers or unique users, provided they pay us a
3
Table of Contents
specified flat fee. We also include in service provider revenues any revenue related to an IPG deployed by a service provider in a subscriber household whether the ultimate payment for that IPG comes from the service provider or from a manufacturer of a set-top box. We generally do not receive a license fee from manufacturers for set-top boxes deployed by a cable or satellite provider, where that provider has also licensed our IPG technology.
Our service provider customers include British Sky Broadcasting Group, Canal+, Charter, Comcast Corporation (“Comcast”), Cox Communications, DirecTV, EchoStar Communications, Foxtel, MegaCable, Sky Deutschland, Sky Italia, Shaw Communications, Time Warner Cable, UPC, Verizon, Yahoo! and others. We also have license agreements with third party IPG providers such as Motorola, NDS, Scientific-Atlanta and others. The majority of subscribers for which we are paid a license fee are receiving an IPG pursuant to a patent license between us and the service provider or third party IPG provider. As of December 31, 2009 approximately 115 million subscribers worldwide are receiving a licensed or Rovi provided IPG, including 34 million internationally.
The Company and Comcast have a joint venture, Guideworks LLC (“Guideworks”), to develop i-Guide IPGs for the U.S. cable industry. We own 49% of the joint venture and Comcast owns 51%, with Comcast serving as the managing member. Comcast has the right to use the joint development products in connection with products and services Comcast offers across its digital subscriber base. We have the exclusive right to distribute the i-Guide to other multi-channel video service providers. We are currently in discussions with Comcast to end the Guideworks joint venture. We believe having control of our IPG development will allow us to reduce overall IPG development costs.
Content Protection
Digital PPV/VOD services enable consumers to purchase and view movies and other programming in their homes through cable, satellite or Internet-based delivery systems. As entertainment content producers explore the idea of simultaneous or more closely staged theatrical, DVD, and/or PPV/VOD release of content, studios have realized the importance of content security in digital PPV/VOD networks because high-quality VHS and DVD copies can be made from the source analog video signal. Many digital PPV/VOD system operators have implemented our content security capability in their digital set-top boxes. Our solutions allow content owners to copy protect their PPV/VOD movies, while at the same time allowing consumers to store, move or share content, as long as it is done within the parameters defined by copyright owners. For additional details on ACP technology see “Content Protection” in the “Other” section below.
Cable and satellite television system operators pay us a one-time license fee and/or transaction-based royalty payments (i) for the right to incorporate our video content security technology into their networks for PPV or VOD services and (ii) when content security for digital PPV or VOD programming is activated by them and content protected programs are purchased by subscribers.
Consumer Electronics
IPGs
We currently offer multiple IPGs to the CE industry, including those marketed under the G-GUIDE brand in Japan, the GUIDE Plus+ brand in Europe and the TV Guide On Screen brand in North America. These IPGs are generally incorporated into mid-to high-end plasma, DLP and LCD televisions and Blu-ray or DVD hard drive recorder based products. Our IPGs generally deliver continuously updated multi-day program listings to users, regardless of whether they receive their television signal via cable or over-the-air broadcast. We use a variety of terrestrial, satellite and broadband Internet transmission means to deliver listings data to our IPGs.
Our CE IPG products also feature advertising. Some of our CE IPG product agreements require that we share a portion of this IPG advertising revenue with the CE manufacturer. CE manufacturers who have a patent license from us are not required to provide advertising in their IPG.
4
Table of Contents
Our CE IPG licensees include devices distributed under the Hitachi, LG, Panasonic, Mitsubishi, Philips, Pioneer, Samsung, Sharp, Sony, Vizio and other brands. Generally, our agreements enable our licensees to incorporate our CE IPG technology or utilize our CE IPG patents in specified products in certain territories provided we receive license fees based on the number of units produced and shipped that incorporate our technology or utilize our patents. We have also entered into agreements with certain licensees that enable them to ship an unlimited number of units, provided they pay us a specified flat fee.
In the second quarter of 2010 the Company plans to launch a new IPG which will be marketed under the TotalGuide brand in North America and Europe. TotalGuide is the Company’s next generation guide, expanding guidance and available content beyond a traditional IPG. We believe TotalGuide will allow CE manufacturers to increase customer satisfaction by offering simple and intuitive access to multiple content types: broadcast, premium, Internet-based and personal. In addition, TotalGuide enhances the consumer experience through the TV guide database, extended multimedia and increased personalization options. With search and recommendations technologies, TotalGuide guides consumers to find favorites and discover new content. CE manufacturers can elect to deploy a full TotalGuide consisting of the broadcast, broadband and personal guides, or deploy selected components implemented via a professional services agreement. An important element of TotalGuide is its ability to not only provide guidance to Internet-based content, but to also allow the consumer to view the Internet-based content they find. To facilitate this activity, the Company has relationships with on-line content distributors, such as Blockbuster, Showtime, Rhapsody and ZillionTV, to make their content available via TotalGuide. Their content is then integrated with our database so that a consumer can search and access the media that content partner makes available (for free, purchase or rental). Whether these relationships provide us with revenue depends on the content distributor as well as the Company’s agreement with CE manufacturers who then must determine which content distributor’s services they desire to have integrated into their devices.
TotalGuide will also provide increased advertising options for both program promoters and conventional advertisers. Advertisements within TotalGuide will be selectable, allowing a more interactive experience, including commerce. Banner advertisements can be clicked on and a consumer can then access trailers, special offers and social media. TotalGuide will also offer new forms of in-grid advertising which can be inserted into the grid either in a row or into a cell. Once selected an interactive experience can be triggered.
In Japan, Interactive Program Guide Inc. (“IPG JV”) is our joint venture with Dentsu Inc. and Tokyo News Service Limited is the exclusive provider of program listings and advertising for our IPGs marketed under the G-Guide name. We own 46% of the IPG JV and have certain contractual rights with respect to the ongoing management of the IPG JV. We also retain the right to license our technology and intellectual property to third parties in Japan who will receive program listings and advertising from the IPG JV, and we retain all rights to the revenue from such licenses. We have entered into licensing agreements with CE manufacturers and other third parties for televisions, digital recorders, personal computers and cell phones that are enabled to receive the G-Guide service.
Content Protection
Our analog video content security, commercially known as ACP, has been used to protect billions of videocassettes since 1985 and billions of DVDs since 1997. CE devices need to protect content in order to prevent playback devices from being used to illegally copy a video. Nearly every DVD player, DVD recorder, DVD drive and PC manufactured contains software and/or hardware technology licensed by us to ensure that ACP-secured DVDs are properly recognized and thus secured. For additional details on ACP technology see “Content Protection” in the “Other” section below.
We sell directly to CE manufacturers as well as semiconductor companies that supply the CE manufacturers. Semiconductor companies that incorporate our digital pay-per-view (PPV), VOD and DVD content security solutions into their semiconductor chips pay us a one-time service fee to verify correct implementation of our content security technology in their digital-to-analog application-specific integrated
5
Table of Contents
circuits (“ASICs”) that are embedded in digital set-top boxes and DVD hardware. They are authorized to sell these Rovi-capable ASICs to Rovi-licensed DVD hardware manufacturers and to Rovi-licensed digital set-top box and DVR manufacturers.
CE device manufacturers license our technology for an up-front fee and annual license fee, as well as per-device fee for shipped devices. Digital set-top box and DVR manufacturers license our video content security solutions typically for an up-front fee and a per-unit royalty, a portion of which may be tied to product activation by system operators. We have also entered into agreements with a number of CE manufacturers in which they paid us a one-time fee for a perpetual license to our technology.
Our CE content protection customers sell set-top boxes and hardware under the Scientific Atlanta, Fujitsu Limited, Mitsubishi Electronics, Motorola, Pace, Panasonic, Pioneer Electronics, Samsung Electronics, Sharp, Sony Electronics, TiVo, Toshiba and other brands.
Connected Platform
Connected Platform is a standards-compliant software solution embedded in consumer electronics and networking equipment designed to allow consumers to access content such as photos, music, and movies stored remotely on any of their connected devices. The Connected Platform complies with the Digital Living Network Alliance (DLNA) and Universal Plug and Play (UPnP) Forum standards. It is sold to CE manufacturers and is comprised of several different components: Digital Media Server (DMS) software, Digital Media Adapter (DMA) software, and Digital Media Player (DMP) software, each sold as a software development kit (SDK). The SDK is used by developers to build digital home products on top of our software foundation for networked digital media devices. They are able to integrate the SDK into their devices to quickly create custom digital media solutions. The DMA software is built with the SDK and can be installed on PCs, DVRs, network-attached storage devices, or even mobile phones to allow users to stream digital media files from their personal home network or via the Internet. The DMP and DMA software, built with the SDK, enables original equipment manufacturers and original design manufacturers to ship standards-based connected entertainment products that allow consumers to enjoy their personal media, such as music, photos, and video files—on a wide variety of player products. Additionally, the Company provides add-on services that support the Connected Platform, such as the Software Update Service, which enables digital home entertainment products to be configured for automated software updates.
Our Connected Platform customers currently include Buffalo, Pace, Scientific-Atlanta, Samsung and others.
Media Recognition
Our LASSO media recognition solution is embedded in a CE device (including automobiles) or service that reads media and associates it with the correct data from our data solutions database (such as title, artist, tracks). The data look-up is accomplished either via a remote call to the infrastructure we operate or to a database we provide to embed on the device. The recognition is accomplished via either a table of contents review (for instance, read the table of contents of a CD) or taking a fingerprint of the media (for instance, identify wave formats of the media) and matching it to our database. The recognition technology is sold in conjunction with supporting data services. CE manufacturers typically pay us per device royalties for each device within which our media recognition data services are implemented.
Media Manager
The Rovi Media Manager is a product which will be sold as a companion to LASSO or Connected Platform creating a solution targeting CE manufacturers. It is a PC application enabling consumers to manage personal media they have stored throughout their home including music, photos and video files. It is integrated with
6
Table of Contents
LASSO enabling a consumer to identify and tag any media they may have on their home storage. It is integrated with Connected Platform allowing consumers to move media between devices. The Media Manager is an incremental cost to LASSO and/or Connected Platform and will be sold on a per unit basis.
VCR Plus+
Our VCR Plus+ (ShowView/Video Plus+ in Europe and G-Code in Asia) technology is an industry standard for setting the recording of television programming on VCRs and has been adopted by most major consumer electronics manufacturers. VCR Plus+ is offered internationally in over 20 countries. It is incorporated into VCRs and certain low priced DVRs and DVD recorders and enables consumers to record a television program by simply using a proprietary one to eight-digit PlusCode number. Revenues related to our VCR Plus+ business have been steadily declining as manufacturers chose to incorporate more advanced forms of guidance, such as an IPG, in their digital products. PlusCode numbers are generated through a patented process developed by us and are printed next to television listings in newspapers and program guides worldwide.
Other
Other includes our data solutions business and our business of licensing our content protection products and services to entertainment companies.
Data Solutions
We offer music, television, movie, book, and video game metadata. In addition, we catalog information on celebrities, awards, sports, and other data necessary to provide a robust set of metadata. Our television guidance information database includes unique data on more than 2.5 million TV programs, 400,000 movies, and searchable data on almost every TV show produced since 1960. Our database also has information on approximately 1.8 million music albums, 16 million tracks, 7.5 million books and 62,000 video games. Our data services are operated with systematic processes that are designed to ensure completeness and quality of the data as well as linking the relationships among the data elements. The data services are broken into levels of data: basic data (such as artist, album), navigational data (such as relationships between actor and other movies or television series), and editorial data (such as actor biographies, television, movie or music reviews).
Besides licensing the data to web properties or embedding the data in CE devices, the databases are also available via our web sites, specifically allmusic.com, allmovie.com, and allgame.com. Each is a complete view of the database, but not exportable for commercial use by others and is an advertising-supported business.
Web properties typically pay us a monthly or annual fee for the rights to use the metadata, receive regular updates and integrate it into their own service. Our music, movie and video game metadata customers include Amazon, Apple, Best Buy, Barnes and Noble, Comcast, Ebay, MTV Networks and others.
We provide resources for all types of media and businesses in print, on-screen and online formats—as well as through interactive and electronic program guides. Additionally, the data covers multiple geographies including the US, Latin America, and major Western European countries. We license a number of data and service offerings, including schedules, listings, TV supplements, and Web services. Our data can be sold stand alone or as a complement to an IPG.
Content Protection
Motion pictures typically generate significant revenue from the sales of packaged media, primarily DVDs. Any household that owns a DVD-R, personal video recorder (“PVR”), PC, or a media center, is capable of making unauthorized, high-quality digital and analog copies unless that content is properly copy protected
7
Table of Contents
against this variety of threats. As new distribution models evolve, including portability of video across devices, Internet and other electronic distribution and the developing PC-based home theater experience, solutions that protect the DVD from unauthorized copying are critical to preserving motion picture studio revenues.
As discussed above, our ACP technologies allow consumers to view programming stored on prerecorded videocassettes and DVDs or transmitted as digital pay-per-view or video-on-demand programs via cable or satellite, but deter unauthorized consumer copying of such programming on recordable DVD devices. Motion Picture Association of America (“MPAA”) and independent studios can use our video content security technology to protect movie releases on videocassette or DVD. For the protection to work, ACP must be present on both the media (physical or digital) and the hardware device.
Studios are also releasing programming in the Blu-ray high definition DVD format (“Blu-ray”). Blu-ray includes a high level of protection implemented via BD+ technology. For a device to be certified as Blu-ray enabled, it must have BD+ technology embedded within it and MPAA studios can license BD+ to take advantage of that embedded protection. BD+ is designed to be self-renewing, therefore inhibiting rippers from being able to create unauthorized copies of the DVD. It is applied to the DVD at the time of manufacturing and interacts with elements of BD+ embedded in the Blu-ray player through the entire playback of the movie to ensure that it is an authorized copy. This sophisticated protection increases the security of a Blu-ray DVD and is designed to result in a longer protection period for a title.
We sell directly to MPAA and independent studios. Content owners utilize our solutions to secure their content and thus ensure that the end customer pays them for the use of their content. Studios generally pay us an annual license fee to use our ACP technology and generally pay us a per disc fee to license our BD+ technology.
Our content security technology customers included the following companies: Buena Vista Home Video, Paramount Pictures, Twentieth Century Fox Home Entertainment and others.
Rovi’s Growth Strategy
Build Upon Key Customer Relationships. We maintain relationships with customers in various industry and market segments, including:
| • | CE manufacturers of digital television, Blu-ray and standard DVD players, CD and DVD drives, PVRs, network attached storage devices (NAS) and digital set-top boxes and other types of devices |
| • | Service providers such as the leading cable and satellite television system operators and telecommunications operators |
| • | Large online retailers, music services, advertisers and portal websites |
| • | Video content providers such as the MPAA and independent movie studios |
We intend to grow our business by capitalizing on existing customer relationships and creating new ones. We will target existing customers and seek to expand the technologies we provide them, both now and in the future. Specifically, we will target existing IPG patent licensees and seek to sell them our IPG product. We believe TotalGuide as well as other of our products are the types of products that makes this feasible. We also believe that as the TotalGuide installed base increases, we can substantially grow our advertising revenue. Additionally, we will focus on non-customer companies seeking to capture a portion of the digital entertainment opportunity. We believe our compelling solutions will help us create new customer relationships.
Introduce New Product Applications and Technologies. We intend to develop additional digital entertainment content solutions to sell to our extensive customer base. We have committed significant resources to expand our technology base, to enhance our existing products, to introduce additional products, and to participate in industry standard-setting efforts and organizations. We intend to pursue opportunities to improve technologies in our current fields of operations as well as in future formats and digital distribution solutions.
8
Table of Contents
Expand and Protect Patent Position. We have built, and continue to add to, a large patent portfolio that helps differentiate our products. We believe that our future success will depend on our ability to continue to introduce proprietary solutions for IPGs, connected devices and data. We have patented many of these proprietary solutions, and our patents underpin our strong competitive position and financial model. We also have acquired patents from others. We intend to continue to obtain patents and to protect and defend our patented technologies aggressively.
Continue to Make Strategic Acquisitions. We may continue to expand our technology portfolio and extend our businesses by pursuing licensing arrangements, joint ventures, and strategic acquisitions of companies whose technologies or proprietary rights complement our technologies.
Copyrights, Trademarks, and Tradenames
We own or have rights to various copyrights, trademarks and trade names used in our business. For our continuing business units, these include, but are not limited to, Rovi®, All Game Guide®, All Music Guide®, AMG®, AMG All-Game Guide®, AMG All-Media Guide®, AMG All-Movie Guide®, AMG Sonicguide®, Explore Movies®, Explore Music®, Lasso™, M1 Mediabolic®, Music Map™, RipGuard®, Tapestry™, TV Guide On Screen, (GUIDE Plus+ in Europe and G-GUIDE in Asia), Passport, VCR Plus+ (VIDEO Plus+, ShowView and G-CODE in Europe and Asia), PlusCode, and Gemstar.
Research and Development
Our internal research and development efforts are focused on developing enhancements to existing products and new applications for our current technologies. We have acquired other companies and technologies to supplement our research and development expenditures.
Our primary locations for product development are in Santa Clara/San Francisco (California), Burbank (California), Ann Arbor (Michigan), Radnor (Pennsylvania) and Hong Kong (China).
Operations and Technical Support
We have technical support and certification operations to support our entertainment, CE and system operator products.
We provide a variety of technical support to our customers:
| • | We provide post-sales training, technical support, and integration services to service provider licensees of our IPG applications software as part of their service offerings. |
| • | We provide post-sales professional services and technical support, training, integration, non-recurring engineering and software development services to CE, set-top box and NAS manufacturers incorporating the Connected Platform in their products. |
| • | We provide pre- and post-sales professional services and technical support to companies incorporating our media recognition data services or media recognition into their products. |
| • | We support the efforts of television, PVR, and DVD hardware manufacturers, digital PPV/VOD system operators and PPV/VOD set-top box manufacturers to design hardware that properly incorporates and is compatible with our video content security solutions or that meet the Blu-ray standards that require incorporation of our BD+ technology. |
| • | We provide broadcast data delivery of television line-up data and advertising to TVs and set-top boxes enabled with our IPGs in North America, major European markets and Japan. This service provides the |
9
Table of Contents
| data that populates the guides with the listings and advertising necessary to make the IPG useful to a consumer. In addition, we deliver, via the Internet or satellite, similar line-up and advertising data to cable and satellite providers in North America. |
| • | We support our customers’ efforts to ensure our IPGs operate properly within their devices, by offering porting services. |
| • | We provide customer care for IPG customers following deployment of our IPGs. This service deals with issues with data and advertising distribution as well as functional issues for a consumer. |
| • | We assist semiconductor manufacturers in incorporating and certifying our video content security solutions into a variety of digital video integrated circuits. |
| • | We regularly test the effectiveness and transparency of our video content protection technologies on representative samples of consumer televisions, VCRs, DVD players, DVD drives, PVRs, and recorder devices to determine whether modifications or enhancements may be necessary. |
| • | We test for RipGuard compatibility and effectiveness with a variety of CD/DVD drive software and hardware. |
| • | We support our licensed duplicators and replicators with hardware and software installation assistance and quality assurance. In addition, we support licensed duplicator/replicator sales personnel by providing sales training and marketing literature, and by participating in trade shows. |
Intellectual Property Rights
We operate in an industry in which innovation, investment in new ideas and protection of our intellectual property rights are critical for success. We protect our innovations and inventions through a variety of means, including but not limited to applying for patent protection domestically and internationally.
As of December 31, 2009, we hold 479 U.S. patents and have 675 U.S. patent applications pending. We also have 2,220 foreign patents issued and 1,064 foreign patent applications pending. Each of our U.S issued patents will expire at a different time based on the particular filing date of that respective patent, with expiration dates as late as June 2027.
Competition
IPGs
There are a number of companies that produce and market IPGs as well as television schedule information in various other formats, that compete or we believe will compete with our IPG products and services. These alternative formats include passive and interactive on-screen electronic guide services, online listings, printed television guides in newspapers and weekly publications, and local cable television guides.
A common competitor we encounter is a customer who chooses to build its own IPG and license our intellectual property. We believe that we provide a strong alternative to “do-it-yourself,” as we have products ready to be implemented and already have data distribution infrastructure and content as well as integration to third party services (such as VOD services for service providers). We intend to build differentiation by integrating our products into a suite of products and services to provide solutions for our customers. We believe our solutions can speed our customers’ time to market, be deployed at a lower cost than internally built products, and are superior to “do-it-yourself” products.
We have begun to see activity from web properties, such as Yahoo and Google, entering the CE market, namely embedded in TVs in North America. While we today are working with them cooperatively, such web properties could offer competitive functionality in the future.
10
Table of Contents
We believe improvements in software porting and in software substitutability, together with government mandated introduction of an Open Cable Applications Platform, will increasingly permit the creation of new guides and their quick placement in set-top boxes—both those purchased or leased from service providers and those purchased at retail.
Many of our competitors and other companies and individuals have obtained, and may be expected to obtain in the future, patents that may directly or indirectly affect the products or services offered or under development by us. We are currently developing a variety of enhancements to our IPGs. We cannot assure that any enhancements developed by us would not be found to infringe patents that are currently held or may be issued to others. There can be no assurance that we are or will be aware of all patents containing claims that may pose a risk of infringement by our products and services. In addition, patent applications are generally confidential for a period of 18 months from the filing date, or until a patent is issued in some cases, so we cannot evaluate the extent to which certain products and services may be covered or asserted to be covered by claims contained in pending patent applications prior to their publication. In general, if one or more of our products or services were to infringe patents held by others, we may be required to stop developing or marketing the products or services, to obtain licenses to develop and market the products or services from the holders of the patents or to redesign the products or services in such a way as to avoid infringing the patent claims. This could have an affect on our ability to compete in the IPG marketplace.
Content Security Technology
Our video content security solutions are proprietary and have broad U.S. and international patent coverage. We have an analog content security solution that has been widely deployed on commercial products that significantly distorts or inhibits copying by VHS VCRs, DVD recorders, and hard drive recorders. Currently, our video content security technology is embedded in nearly all DVD players and most digital set-top boxes worldwide. While it is possible that a competitive video content security technology could be developed and deployed, we believe it would take years for the competitive technology to be accepted by hardware manufacturers and embedded into the consumer electronic devices. Given the time this would take, it is unlikely any other analog content security technology would displace our content security infrastructure and our extensive video content security “ecosystem.” The greatest competitive threat to our content security technology is content providers choosing not to copy protect their content.
With the increase in online content distribution over the Internet, and with the continuing advance of digital content and high-definition formats, our analog video content security solutions that protect standard definition content on optical media and digital PPV/VOD signals are viewed by some of our customers as being less important than the other digital and network content protection solutions. As a result, other Internet-based digital content security or DRM technologies may present significant competition to our video content security business, such as DRM offerings by Intertrust, Microsoft, Apple, RealNetworks, Contentguard, Philips, IBM and Sony.
The two forms of approved copy protection adopted by the Blu-ray Disc Association specification are AACS and BD+. AACS is required on all discs and we believe that BD+ is a stronger and more attractive copy protection option for studios. The success of BD+ will be driven by whether the MPAA studios choose to apply it.
VCR Plus+ System
We are not aware of any product or service other than the VCR Plus+ system that allows the user to program a VCR or low-end DVD recorder by entering a numerical code. However, several products and services on the market offer other simplified programming functions and thus compete with the VCR Plus+ system. Such products and services include on-screen program guides incorporating point-and-click recording capability, such as our CE IPG and third party IPGs. In addition, some products, such as DVRs, permit consumers to record programs directly from air, cable or satellite for later viewing through the use of memory chips and hard disk drives contained in the devices or through remote record capability from an individuals computer.
11
Table of Contents
Data Services
In the database and data services area, we compete with other providers of entertainment-related content data such as Tribune Media Services, Internet Movie Database (IMDB) and Gracenote. While we do not believe that our competitors’ data sets are focused on exploration, discovery, and content management in the way that our data is, nor are they tightly tied to a portfolio of software to which they add significant value, they may present competition to our data services business.
Media Recognition Technology
In the recognition technology and CE manufacturer area, our primary competitor is Gracenote, who provides media recognition technology as part of their CDDB data set. Their core technology provides basic album and track metadata when a CD is inserted into a drive. Shazam Entertainment also sells a music media recognition technology.
Connected Platform
The competition for the Connected Platform are CE and set-top box manufacturers developing their own capability and others such as Twonky and Digi-on. However, we believe the integration of standards and DLNA reference status into the Connected Platform provides us with significant competitive advantages. Additional competitors consist of companies that focus on CE middleware and set-top box software companies with CE middleware offerings.
Legislative and Regulatory Actions
A number of government and legislative initiatives have been enacted to encourage development and implementation of technologies that protect the rights and intellectual property of the content owners.
The United States and other countries have adopted certain laws, including the Digital Millennium Copyright Act of 1998, or DMCA, and the European Copyright Directive, which are aimed at the prevention of piracy of content and the manufacture and sale of products that circumvent copy protection technologies, such as those covered by our patents.
VBI and Digital Data Carriage Matters
We use the vertical blanking interval, or VBI, in the analog television signals of the local affiliates of major broadcast networks such as PBS (through National Datacast), ABC, CBS, NBC and Fox to supply updates throughout the day of program listing information to our TV Guide On Screen and GUIDE Plus+ branded consumer electronics devices in the United States. We have agreements with CBS Corporation (“CBS”) and National Datacast, Inc. (“NDI”) which allow for the distribution of our CE IPG data over the digital broadcast signals of both CBS and NDI participating stations, following the installation of necessary equipment. The FCC has ruled that it is within the discretion of a cable multiple system operator (“MSO”) to retransmit or strip out data transmitted in the VBI lines of broadcast stations carried on that MSO’s system. We have agreements with MSOs which provide for carriage of our program listing information in either the VBI or within the digital signal of broadcast television stations.
Compatibility Between Cable Systems and Consumer Electronic Equipment
The FCC has been working for over a decade to implement a congressional mandate that it create a competitive market for cable television set-top boxes and other devices to access video programming on cable systems (“navigation devices”) and give consumers a choice in the device used to access such programming, while still allowing the cable systems to have control over the secured access to their systems.
12
Table of Contents
To meet its statutory obligation without compromising the security of video services, the Commission required cable systems to make available a security element (now known as a CableCARD) separate from the basic navigation device needed to access video program channels. In 2003, the FCC adopted regulations implementing an agreement between cable television system operators and consumer electronics manufacturers to facilitate the retail availability of so-called “plug and play” devices that utilize unidirectional CableCARDs, including digital televisions and other digital devices that enable subscribers to access cable television programming without the need for a set-top box (but without the ability for consumers to use interactive content).
Due to certain legislative developments in the U.S., cable subscribers may be able to utilize interactive and other two-way services without the need for a set-top box, meaning that consumers could use an IPG built directly into a TV to access and operate their cable subscriptions and not need to purchase or rent a set-top box from the cable operator.
In an effort to ensure that cable operators adequately support CableCARDs, FCC regulations also prohibited multi-channel video service providers (except satellite providers) from deploying after July 1, 2007 navigation devices with combined security and non-security functions (the “integration ban”). Both cable operators and consumer electronics manufacturers are required to use the same security solution. Further developments with respect to these issues could impact the availability and/or demand for “plug and play” devices, particularly bi-directional devices, and set-top boxes, all of which could affect demand for IPGs incorporated in set-top boxes or CE devices.
Employees
As of December 31, 2009, we had approximately 1,200 full-time employees. Of these employees, approximately 250 were based outside of the United States. None of our employees are covered by a collective bargaining agreement or are represented by a labor union. We have not experienced any organized work stoppages. We believe that our future success will depend in part upon the continued service of our key employees and on our continued ability to hire and retain qualified personnel. We may not be able to retain our key employees and may not be successful in attracting and retaining sufficient numbers of qualified personnel to conduct our business in the future.
Information About Our Executive Officers
The names of our current executive officers, their ages as of February 10, 2010, and their positions are shown below. Biographical summaries of each of our executive officers are included below.
| Name |
Age | Positions | ||
| Alfred J. Amoroso |
59 | President and Chief Executive Officer | ||
| James Budge |
43 | Chief Financial Officer | ||
| Thomas Carson |
50 | Executive Vice President, Worldwide Sales & Services | ||
| Stephen Yu |
44 | Executive Vice President, General Counsel and Corporate Secretary |
Alfred J. Amoroso. Mr. Amoroso joined Rovi as our President and Chief Executive Officer and member of the Board of Directors in July 2005. From September 2004 to June 2005, Mr. Amoroso served as an advisor to Warburg Pincus, an investment firm. From July 2002 to August 2004, Mr. Amoroso served as the President, Chief Executive Officer and Vice Chairman of META Group, an information technology research and advisory firm. From November 1999 until its merger with IBM in January 2002, Mr. Amoroso served as President, Chief Executive Officer and a director of CrossWorlds Software, Inc. Mr. Amoroso holds a B.S. in systems engineering and M.S. in operations research from Polytechnic Institute of Brooklyn.
James Budge. Mr. Budge has served as our Chief Financial Officer since September 2005. Mr. Budge served as Chief Financial Officer of Trados, Inc., an enterprise management software provider, from January
13
Table of Contents
2004 until its merger with SDL International in August 2005. From August 2002 until joining Trados, Mr. Budge served as Chief Financial Officer of Sendmail, Inc., a secure email provider, and from April 1999 until its merger with IBM in January 2002, Mr. Budge served as Chief Financial Officer of CrossWorlds Software, Inc., a provider of business infrastructure software. Mr. Budge holds a B.S. in Accounting from Brigham Young University and is a Certified Public Accountant.
Thomas Carson. Mr. Carson has served as our Executive Vice President, Worldwide Sales & Services since May 2008 when the acquisition of Gemstar-TV Guide International by the Company was completed. From April 2006 to May 2008, Mr. Carson served in various capacities at Gemstar, including President of the North American IPG business and President for North American CE business. From February 2005 to April 2006, Mr. Carson served as Executive Vice President of Operational Efficiency programs at Thomson Multimedia Corporation and from February 2004 to February 2005, he served as Executive Vice President, Global Sales and Services at Thomson. Mr. Carson holds a B.S in business administration and an MBA from Villanova University.
Stephen Yu. Mr. Yu has served as our Executive Vice President, General Counsel and Corporate Secretary since May 2006. He served as Vice President, General Counsel and Secretary of Aspect Communications Corporation, a provider of contact center solutions, from April 2003 until its acquisition by Concerto Software, Inc. in September 2005. From June 2002 to January 2003, Mr. Yu served as Vice President, General Counsel and Secretary of Riverstone Networks, Inc., a provider of ethernet network solutions, and from September 1999 to May 2002, he served as Vice President, General Counsel and Secretary of Palm, Inc., a provider of mobile computing solutions. Mr. Yu holds a B.S. in electrical engineering from Purdue University and a J.D. cum laude from Georgetown University Law Center. Mr. Yu is a member of the California State Bar.
Available Information
Our Internet website is located at http://www.rovicorp.com. We make available free of charge on our website our annual report on Form 10-K, quarterly reports on Form 10-Q, current reports on Form 8-K and amendments to those reports filed or furnished pursuant to Section 13(a) or 15(d) of the Exchange Act, as soon as reasonably practicable after we electronically file such material with, or otherwise furnish it to, the Securities and Exchange Commission (the “SEC”). Copies will be provided to any stockholder upon request to Rovi Corporation, Attention: Corporate Secretary, 2830 De La Cruz Boulevard, Santa Clara, California 95050. The reference to our Internet website does not constitute incorporation by reference of the information contained on or hyperlinked from our Internet website and should not be considered part of this document.
The public may also read and copy any materials we file with the SEC at the SEC’s Public Reference Room at 450 Fifth Street, N.W., Washington, D.C. 20549. The public may obtain information on the operation of the Public Reference Rooms by calling the SEC at 1-800-SEC-0330. The SEC also maintains an Internet website that contains reports, proxy and information statements and other information regarding issuers that file electronically with the SEC. The SEC’s Internet website is located at http://www.sec.gov.
| ITEM 1A. | RISK FACTORS |
In addition to the other information contained in this Annual Report on Form 10-K, you should consider carefully the following risks. This list is not exhaustive and you should carefully consider these risks and uncertainties before investing in our common stock. If any of these risks occur, our business, financial condition or operating results could be adversely affected.
If we fail to develop and deliver innovative technologies in response to changes in the technology and entertainment industries, our business could decline.
The markets for our products and technologies are characterized by rapid change and technological evolution. We will need to continue to expend considerable resources on research and development in the future in order to continue to design and deliver enduring, innovative entertainment products and technologies. Despite
14
Table of Contents
our efforts, we may not be able to develop and effectively market new products, technologies and services that adequately or competitively address the needs of the changing marketplace. In addition, we may not correctly identify new or changing market trends at an early enough stage to capitalize on market opportunities. At times, such changes can be dramatic, such as the shift from VHS videocassettes to DVDs for consumer playback of movies in homes and elsewhere, the anticipated shift to high definition DVD or the transition from packaged media to Internet distribution. The continued decline in worldwide shipments of VCRs has resulted in a decline in our VCR Plus+ revenues over time, causing us to focus on growth in other parts of our business. Our future success depends to a great extent on our ability to develop and deliver innovative technologies that are widely adopted in response to changes in the technology and entertainment industries and that are compatible with the technologies or products introduced by other entertainment industry participants. Despite our efforts and investments in developing new products, services and technologies:
| • | we cannot assure you that the level of funding and significant resources we are committing for investments in new products, services and technologies will be sufficient or result in successful new products, services or technologies; |
| • | we cannot assure you that our newly developed products, services or technologies can be successfully protected as proprietary intellectual property rights or will not infringe the intellectual property rights of others; |
| • | we cannot assure you that any new products or services that we develop will achieve market acceptance; |
| • | our products, services and technologies may become obsolete due to rapid advancements in technology and changes in consumer preferences; and |
| • | our competitors and/or potential customers may develop products, services or technologies similar to those developed by us, resulting in a reduction in the potential demand for our newly developed products, services or technologies. |
Our failure to successfully develop new and improved products, services and technologies, including as a result of any of the risks described above, may reduce our future growth and profitability and may adversely affect our business results and financial condition.
If we are unable to compete effectively with existing or new competitors, we could experience price reductions, fewer customers, reduced margins or loss of market share.
Our IPGs face competition from companies that produce and market program guides as well as television schedule information in a variety of formats, including passive and interactive on-screen electronic guide services, online listings, printed television guides in newspapers and weekly publications, and local cable television guides. Our IPG products also compete against customers who choose to build their own IPG and license our intellectual property. In the connected device middleware and metadata marketplace, there is competition not only from other companies, but also from customer-implemented internally-developed solutions. We believe that our DVD digital-to-analog copy protection and videocassette copy protection systems currently have limited competition. It is possible, however, that alternative copy protection technologies could become competitive. Additionally, new competitors or alliances among competitors may emerge and rapidly acquire significant market share in any of these areas. Our competitors may be able to respond more quickly to new or emerging technologies and changes in customer requirements than we do, which could reduce demand for our products or render them obsolete. Increased competition would be likely to result in price reductions and loss of market share, either of which could harm our business.
Our business may be adversely affected by fluctuations in demand for consumer electronics devices incorporating our technologies.
We derive significant revenues from CE manufacturer license fees for our IPG and ACP technologies based on the number of units shipped. We do not manufacture hardware, but rather depend on the cooperation of CE
15
Table of Contents
manufacturers to incorporate our ACP and IPG technologies into their products. Generally, our license agreements do not require manufacturers to include our technology in any specific number or percentage of units, and only a few of these agreements guarantee a minimum aggregate licensing fee. Purchases of new CE devices, including television sets, integrated satellite receiver decoders, DVRs, DVD recorders, personal computers and Internet appliances are largely discretionary and may be adversely impacted by increasing market saturation, durability of products in the marketplace, new competing products, alternate consumer entertainment options and general economic trends in the countries or regions in which these products are offered. As a result, our future operating results may be adversely impacted by fluctuations in sales of consumer electronics devices employing our technologies.
In addition, the decision by manufacturers to incorporate our IPG technology into their products is a function of what other guide technologies and products are available. Our future operating results may be adversely impacted as a result of consumer electronics manufacturers opting not to incorporate our technology into their devices as a result of other available alternatives.
Dependence on the cooperation of MSOs and digital broadcast satellite (“DBS”) providers, television broadcasters, hardware manufacturers, publications, data providers and delivery mechanisms could adversely affect our revenues.
We rely on third party providers to deliver our IPG data to consumer electronics devices that include our IPG. Further, our national data network provides customized and localized listings to our IPG service for MSOs and DBS providers and licensees of our data used in third party IPGs for MSOs and DBS providers. There can be no assurance that these delivery mechanisms will distribute the data without error or that the agreements that govern some of these relationships can be maintained on favorable economic terms.
To deliver our IPG data to consumer electronics devices, we have arrangements to carry our data in a part of the television signal called the VBI or its digital signal equivalent, of television stations included in the public broadcasting network, independently owned stations, and stations owned and operated by various station group owners. We have historically only delivered our IPG data to consumer electronics devices through the VBI in analog broadcast signals.
In anticipation of the 2009 transition to 100% digital transmission in the United States mandated by the FCC, we entered into agreements with CBS and NDI which allow for the distribution of our CE IPG data over the digital broadcast signals of both CBS and NDI participating stations, following the installation of necessary equipment. The FCC has ruled that it is within the discretion of a cable MSO to retransmit or strip out data transmitted in the VBI lines of broadcast stations carried on that MSO’s system. We have agreements with MSOs which provide for carriage of our program listing information in either the VBI or within the digital signal of broadcast television stations.
We also rely on other arrangements in the United States, which are not long-term, with other broadcasters for secondary carriage of our IPG data to consumer electronics devices. We cannot assure you that we will be able to successfully renew or extend any of our existing carriage arrangements when they expire, or that renewals will be on terms that are as favorable to us as the arrangements currently in effect. Our inability to renew the existing arrangements on terms that are favorable to us, or enter into alternative arrangements that allow us to effectively transmit our IPG data to consumer electronics devices could have a material adverse effect on our CE IPG business.
Our IPG data to CE devices broadcast through the VBI can be, and has been in the past in some markets, deleted or modified by some of the local service providers. Widespread deletion or modification of this data by service providers could have a material adverse impact on our CE IPG business. To mitigate this risk in the United States, we have entered into agreements with many service providers to ensure that our IPG data to CE devices will not be deleted or modified by such systems. Additionally, cable companies in the United States are progressively moving their systems from an analog format to a digital format, which poses certain problems to
16
Table of Contents
the passage of our IPG data to CE devices carried in their signals. Solving such problems will require the cooperation of third parties such as the MSOs and hardware manufacturers, and may also require additional investment by us. Furthermore, in order for CE devices that incorporate our IPG to receive our data, such data must also be able to pass through any receivers through which such CE devices are receiving television programming signals. Even if our IPG data is passed to cable subscribers through cable networks by the service providers, there is a risk that the cable set-top boxes deployed by such subscribers can impede the passage of our IPG data to CE devices. Widespread impedance of our IPG data to CE devices in any of the manners set forth above could have a material adverse impact on our CE IPG business.
We are currently making significant investments in the United States, Europe and Japan to build the capability to provide our program listings information via digital broadcast signals to support the next generation of products from our manufacturing partners. This involves in some cases deploying equipment to aggregate and insert listings data, and securing bandwidth in digital broadcast streams to deliver that data. If we are unable to complete this digital delivery build-out in each of our regions in time to meet the planned deployment of the next generation of digital broadcast reliant CE devices, this could have a material adverse impact on our CE IPG business.
We deliver our data to our IPG service for MSOs and to licensees of our data used in third party IPGs for MSOs via satellite transmission, among other means. While we have built in certain redundancies in our data delivery operation, a third party provides us with satellite capacity to transmit our data to our IPG service for certain MSOs and to licensees of our data used in third party IPGs for MSOs. Our arrangement with the third party provider may be terminated on little or no notice. In the event that a provider of satellite capacity elects not to provide this capacity to transmit our data, there can be no assurance that all of our customers who currently receive our data via such provider will be able to receive our data via alternative means without significant delay or additional cost to us. In the event that such provider elects not to transmit our data, our business, operating results and financial condition could be adversely affected.
In addition, we purchase some of our program guide information from commercial vendors. The quality, accuracy and timeliness of that data may not continue to meet our standards or be acceptable to consumers.
The effects of the global recession may impact our business, operating results, financial condition or liquidity.
The global recession has caused a general tightening in the credit markets, lower levels of liquidity, increases in the rates of default and bankruptcy, an unprecedented level of intervention from the United States federal government and other foreign governments, decreased consumer confidence, overall slower economic activity and extreme volatility in credit, equity and fixed income markets. While the ultimate outcome of these events cannot be predicted, these macroeconomic developments could negatively affect our business, operating results, financial condition or liquidity in a number of ways. For example, if the economic downturn makes it difficult for our customers and suppliers to accurately forecast and plan future business activities, they may cause them to delay, decrease or cancel purchases of our solutions or reduce production of their products. As many of our solutions are licensed on a per-unit fee basis, our customers’ decision to decrease production of their products or devices may decrease our licensing revenue and adversely impact our operating results.
Furthermore, as our customers face a weak economy, they may not be able to gain sufficient credit in a timely manner, which could result in an impairment of their ability to place orders with us or to make timely payments to us for previous purchases. If this occurs, our revenue may be reduced, thereby having a negative impact on our results of operations. In addition, we may be forced to increase our allowance for doubtful accounts and our days sales outstanding may increase, which would have a negative impact on our cash position, liquidity and financial condition. We cannot predict the timing or the duration of this or any other economic downturn in the economy and we are not immune to the effects of general worldwide economic conditions.
17
Table of Contents
In addition, financial institution failures may cause us to incur increased expenses or make it more difficult either to utilize our existing debt capacity or otherwise obtain financing for our operations, investing activities (including the financing of any future acquisitions), or financing activities (including the timing and amount of any repurchases of our common stock or debt we may make in the future). Our investment portfolio, which includes short-term debt securities, is generally subject to general credit, liquidity, counterparty, market and interest rate risks that may be exacerbated by the recent global financial crisis. If the banking system or the fixed income, credit or equity markets continue to deteriorate or remain volatile, our investment portfolio may be impacted and the values and liquidity of our investments could be adversely affected.
Finally, like other stocks, our stock price can be affected by the global economic uncertainties and if investors have concerns that our business, operating results and financial condition will be negatively impacted by a worldwide economic downturn, our stock price could decrease.
If the volatility of credit market conditions continues or increases, it could adversely impact our investments and as a result, our liquidity.
The credit markets have experienced liquidity issues and failed auctions in the auction rate securities market. The auction rate securities we hold have failed to trade at auctions due to insufficient bids from buyers. We have recorded unrealized losses related to our available-for-sale auction rate securities to accumulated other comprehensive income due to temporary declines in fair value and have classified all available-for-sale auction rate securities as long-term marketable investments on our balance sheet. If there are future unsuccessful auctions, the fair value of these auction rate securities may continue to decline. The decline in fair value of our available-for-sale auction rate securities may become other than temporary and we may incur impairment charges in connection with these securities which would adversely impact our earnings and financial condition.
We are exposed to risks associated with our changing technology base through strategic acquisitions, investments and divestitures.
We have expanded our technology base in the past through strategic acquisitions and investments in companies with complementary technologies or intellectual property and intend to do so in the future. Acquisitions hold special challenges in terms of successful integration of technologies, products and employees. In addition to the acquisition of Gemstar in May 2008, over the last several years we completed the divestitures of our TV Guide Magazine business (December 2008), our Software business (April 2008), our Games business (April 2008), our eMeta business (November 2008), our TVG Network business (January 2009) and our TV Guide Network and TV Guide Online businesses (February 2009). We also completed the acquisitions of Mediabolic, Inc. (January 2007) and All Media Guide Holdings, Inc. (December 2007) and the acquisition of the assets of Cryptography Research, Inc. (November 2007) and Muze, Inc. (April 2009). We may not realize the anticipated benefits of these acquisitions and divestitures or the benefits of any other acquisitions we have completed or may complete in the future, and we may not be able to incorporate any acquired services, products or technologies with our existing operations, or integrate personnel from the acquired businesses, in which case our business could be harmed.
Acquisitions, divestitures and other strategic investments involve numerous risks, including:
| • | problems integrating and divesting the operations, technologies, personnel or products over geographically disparate locations; |
| • | unanticipated costs, litigation and other contingent liabilities; |
| • | continued liability for pre-closing activities of divested businesses or certain post-closing liabilities which we may agree to assume as part of the transaction in which a particular business is divested; |
| • | adverse effects on existing business relationships with suppliers and customers; |
| • | risks associated with entering into markets in which we have no, or limited, prior experience; |
| • | incurrence of significant exit charges if products acquired in business combinations are unsuccessful; |
18
Table of Contents
| • | significant diversion of management’s attention from our core business and diversion of key employees’ time and resources; |
| • | inability to retain key customers, distributors, vendors and other business partners of the acquired business; and |
| • | potential loss of our key employees or the key employees of an acquired organization. |
Financing for future acquisitions may not be available on favorable terms, or at all. If we identify an appropriate acquisition candidate for any of our businesses, we may not be able to negotiate the terms of the acquisition successfully, finance the acquisition or integrate the acquired business, products, technologies or employees into our existing business and operations. Future acquisitions and divestitures may not be well-received by the investment community, which may cause the value of our stock to fall. We cannot ensure that we will be able to identify or complete any acquisition or divestiture in the future, and our senior secured credit facility and the indenture related to the notes impose some restrictions on our ability to make and finance additional acquisitions or divestitures.
If we acquire businesses, new products or technologies in the future, we may incur significant acquisition-related costs. Divestitures could cause similar problems to occur. In addition, we may be required to amortize significant amounts of identifiable intangible assets and we may record significant amounts of goodwill that will be subject to annual testing for impairment. We have in the past and may in the future be required to write off all or part of one or more of these investments that could harm our operating results. If we consummate one or more significant future acquisitions in which the consideration consists of stock or other securities, our existing stockholders’ ownership could be significantly diluted. If we were to proceed with one or more significant future acquisitions in which the consideration included cash, we could be required to use a substantial portion of our available cash. Acquisition activities could also cause operating margins to fall depending upon the financial models of the businesses acquired.
Our strategic investments may involve joint development, joint marketing, or entry into new business ventures, or new technology licensing. Any joint development efforts may not result in the successful introduction of any new products by us or a third party, and any joint marketing efforts may not result in increased demand for our products. Further, any current or future strategic acquisitions and investments by us may not allow us to enter and compete effectively in new markets or enhance our business in our existing markets and we may have to write off our equity investments in companies as we have done in the past.
Covenants in our debt agreements restrict our business in many ways and if we do not effectively manage our covenants, our financial conditions and results of operations could be adversely affected.
Our credit facilities contain various covenants that limit our ability and/or our restricted subsidiaries’ ability to, among other things:
| • | incur or assume liens or additional debt or provide guarantees in respect of obligations of other persons; |
| • | issue redeemable stock and preferred stock; |
| • | pay dividends or distributions or redeem or repurchase capital stock; |
| • | prepay, redeem or repurchase debt; |
| • | make loans, investments and capital expenditures; |
| • | enter into agreements that restrict distributions from our subsidiaries; |
| • | sell assets and capital stock of our subsidiaries; |
| • | enter into certain transactions with affiliates; and |
| • | consolidate or merge with or into, or sell substantially all of our assets to, another person. |
19
Table of Contents
In addition, our senior secured credit facility contains restrictive covenants and requires us to maintain specified financial ratios. Our ability to meet those financial ratios can be affected by events beyond our control, and we may be unable to meet those tests. In addition, we have historically had less debt with fewer covenants. If we fail to maintain effective internal controls to comply with these covenants, we may be in breach. A breach of any of these covenants could result in a default under our senior secured credit facility and/or our other indebtedness. Upon the occurrence of an event of default under our senior secured credit facility, the lenders could elect to declare all amounts outstanding under our senior secured credit facility to be immediately due and payable. If we were unable to repay those amounts, the lenders could proceed against the collateral granted to them to secure that indebtedness. A significant portion of our assets are subject to liens. If the lenders under our senior secured credit facility accelerate the repayment of borrowings, we may not have sufficient assets to repay our senior secured credit facility and our other indebtedness. Our borrowings under our senior secured credit facility are, and are expected to continue to be, at variable rates of interest and expose us to interest rate risk. If interest rates increase, our debt service obligations on the variable rate indebtedness would increase even though the amount borrowed remained the same, and our net income would decrease.
We have indebtedness which could adversely affect our financial position and prevent us from fulfilling our debt obligations.
As of December 31, 2009, we had total debt from continuing operations of approximately $447.2 million, of which $207.2 million of borrowings are under our senior secured credit facility and $240.0 million of convertible notes. We may also incur additional indebtedness in the future. Our indebtedness may:
| • | make it difficult for us to satisfy our financial obligations, including making scheduled principal and interest payments on the notes and our other indebtedness; |
| • | limit our ability to borrow additional funds for working capital, capital expenditures, acquisitions or other general business purposes; |
| • | limit our ability to use our cash flow or obtain additional financing for future working capital, capital expenditures, acquisitions or other general business purposes; |
| • | require us to use a substantial portion of our cash flow from operations to make debt service payments; |
| • | limit our flexibility to plan for, or react to, changes in our business and industry; |
| • | place us at a competitive disadvantage compared to our less leveraged competitors; and |
| • | increase our vulnerability to the impact of adverse economic and industry conditions. |
Our ability to meet our debt service obligations will depend on our future performance, which will be subject to financial, business, and other factors affecting its operations, many of which are beyond our control.
We may not be able to generate sufficient cash to service our debt obligations.
Our ability to make payments on and to refinance our indebtedness will depend on our financial and operating performance, which is subject to prevailing economic and competitive conditions and to certain financial, business and other factors beyond our control. We may be unable to maintain a level of cash flows from operating activities sufficient to permit us to pay the principal, premium, if any, and interest on our indebtedness.
If our cash flows and capital resources are insufficient to fund our debt service obligations, we may be forced to reduce or delay investments and capital expenditures, or to sell assets, seek additional capital or restructure or refinance our indebtedness. These alternative measures may not be successful and may not permit us to meet our scheduled debt service obligations. In the absence of such operating results and resources, we could face substantial liquidity problems and might be required to dispose of material assets or operations to
20
Table of Contents
meet our debt service and other obligations. Our credit agreements restrict our ability to dispose of assets, use the proceeds from any disposition of assets and to refinance our indebtedness. We may not be able to consummate those dispositions or to obtain the proceeds that we could realize from them and these proceeds may not be adequate to meet any debt service obligations then due.
Repayment of our debt is dependent on cash flow generated by our subsidiaries.
Rovi Corporation’s subsidiaries, including Rovi Solutions Corporation (formerly known as Macrovision Corporation) and Rovi Guides Corporation (formerly known as Gemstar-TV Guide International), own a significant portion of our assets and conduct substantially all of our operations. Accordingly, repayment of our indebtedness is dependent, to a significant extent, on the generation of cash flow by the subsidiaries, including Rovi Solutions Corporation and Rovi Guides, and their ability to make such cash available to us, by dividend, debt repayment or otherwise. Unless they are guarantors or a co-issuer of our indebtedness, our subsidiaries do not have any obligation to pay amounts due on our indebtedness or to make funds available for that purpose. Our subsidiaries may not be able to, or may not be permitted to, make distributions to enable us to make payments in respect of our indebtedness. Each subsidiary is a distinct legal entity and, under certain circumstances, legal and contractual restrictions may limit our ability to obtain cash from our subsidiaries. In the event that we do not receive distributions from our subsidiaries, we may be unable to make required principal and interest payments on our indebtedness.
Despite our current level of indebtedness, we may still be able to incur more indebtedness. This could exacerbate the risks associated with our indebtedness.
We and our subsidiaries may incur additional indebtedness in the future. The terms of our credit agreements and indentures limit, but do not prohibit, us or our subsidiaries from incurring additional indebtedness. If we incur any additional indebtedness that ranks equally with existing indebtedness, the holders of that indebtedness will be entitled to share ratably with the holders of our existing debt obligations in any proceeds distributed in connection with any insolvency, liquidation, reorganization, dissolution or other winding-up of us. If new indebtedness is added to our current debt levels, the related risks that we and our subsidiaries now face could intensify.
Changes in, or interpretations of, tax rules and regulations, may adversely affect our effective tax rates.
We are subject to income taxes in the U.S. and foreign tax jurisdictions. Our future effective tax rates could be unfavorably affected by changes in tax laws or the interpretation of tax laws, by changes in the amount of revenue or earnings that we derive from international sources in countries with high or low statutory tax rates, or by changes in the valuation of our deferred tax assets and liabilities. Unanticipated changes in our tax rates could affect our future results of operations.
In addition, federal, state, and foreign tax jurisdictions may examine our income tax returns, including income tax returns of acquired companies and acquired tax attributes included therein. We regularly assess the likelihood of outcomes resulting from these examinations to determine the adequacy of our provision for income taxes. In making such assessments, we exercise judgment in estimating our provision for income taxes. While we believe our estimates are reasonable, we cannot assure you that the final determination from these examinations will not be materially different from that reflected in our historical income tax provisions and accruals. Any adverse outcome from these examinations may have a material adverse effect on our business and operating results, which could cause the market price of our stock to decline.
Our success is heavily dependent upon our proprietary technologies.
We believe that our future success will depend on our ability to continue to introduce proprietary solutions for digital content and technologies. We rely on a combination of patent, trademark, copyright and trade secret laws, nondisclosure and other contractual provisions, and technical measures to protect our intellectual property rights. Our patents, trademarks or copyrights may be challenged and invalidated or circumvented. Our patents
21
Table of Contents
may not be of sufficient scope or strength or be issued in all countries where products incorporating our technologies can be sold. We have filed applications to expand our patent claims and for improvement patents to extend the current expiration dates, however, expiration of some of our patents may harm our business. If we are not successful in protecting our intellectual property, our business would be harmed.
Others may develop technologies that are similar or superior to our technologies, duplicate our technologies or design around our patents. Effective intellectual property protection may be unavailable or limited in some foreign countries. Despite efforts to protect our proprietary rights, unauthorized parties may attempt to copy or otherwise use aspects of processes and devices that we regard as proprietary. Policing unauthorized use of our proprietary information is difficult, and the steps we have taken may not prevent misappropriation of our technologies. Such competitive threats could harm our business.
We may be subject to legal liability for the provision of third-party products, services or content.
We periodically enter into arrangements to offer third-party products, services, content or advertising under our brands or via distribution on our websites or in our products or service offerings. For example, we license or incorporate certain entertainment metadata into our data offerings. We may be subject to claims concerning these products, services, content or advertising by virtue of our involvement in marketing, branding, broadcasting or providing access to them. Our agreements with these parties may not adequately protect us from these potential liabilities. It is also possible that, if any information provided directly by us contains errors or is otherwise negligently provided to users, third parties could make claims against us, including, for example, claims for intellectual property infringement. Investigating and defending any of these types of claims is expensive, even if the claims do not result in liability. If any of these claims results in liability, we could be required to pay damages or other penalties, which could harm our business and our operating results.
We may initiate patent infringement or patent interference actions or other litigation to protect our intellectual property, which could be costly and harm our business.
We are currently engaged in litigation, and litigation may be necessary in the future, to enforce our patents and other intellectual property rights, to protect our trade secrets or to determine the validity and scope of the proprietary rights of others.
We, and many of our current and potential competitors, dedicate substantial resources to protection and enforcement of intellectual property rights. We believe that companies will continue to take steps to protect their technologies, including, but not limited to, seeking patent protection. Companies in the technology and content-related industries have frequently resorted to litigation regarding intellectual property rights. Disputes regarding the ownership of technologies and their associated rights are likely to arise in the future and we may be forced to litigate to determine the validity and scope of other parties’ proprietary rights. Any such litigation could be very costly, could distract our management from focusing on operating our business, and might ultimately be unsuccessful. The existence and/or outcome of such litigation could harm our business.
We may be subject to intellectual property infringement claims or other litigation, which are costly to defend and could limit our ability to use certain technologies in the future.
From time to time we receive claims and inquiries from third parties alleging that our internally developed technology, technology we have acquired or technology we license from third parties may infringe other third parties’ proprietary rights, especially patents. Third parties have also asserted and most likely will continue to assert claims against us alleging infringement of copyrights, trademark rights or other proprietary rights, or alleging unfair competition or violations of privacy rights. We could be required to spend significant amounts of time and money to defend ourselves against such claims. If any of these claims were to prevail, we could be forced to pay damages, comply with injunctions, or stop distributing our products and services while we re-engineer them or seek licenses to necessary technology, which might not be available on reasonable terms or
22
Table of Contents
at all. We could also be subject to claims for indemnification resulting from infringement claims made against our customers, strategic partners or the current owners of businesses that we divested, which could increase our defense costs and potential damages. For example, we have received notices and lawsuits from certain customers requesting indemnification in patent-related lawsuits. We evaluate the requests and assess whether we believe we are obligated to provide such indemnification to such customers on a case by case basis. Customers or strategic partners making such requests could become unwilling or hesitant to do business with us if we decline such requests. An adverse determination with respect to such requests or in any of these events described above could require us to change our business practices and have a material impact on our business and results of operations.
Litigation could harm our business and result in:
| • | substantial settlement or related costs, including indemnification of customers; |
| • | diversion of management and technical resources; |
| • | either our customers discontinuing to use or ourselves discontinuing to sell infringing products; |
| • | our expending significant resources to develop non-infringing technology; and |
| • | our obtaining licenses to infringed technology. |
We are involved in the business of powering the discovery and enjoyment of digital entertainment, including over the Internet. There has been, and we believe that there will continue to be, an increasing level of litigation to determine the applicability of current laws to, and impact of new technologies on, the use and distribution of content over the Internet and through new devices. As we develop products and services that protect, provide or enable the provision of content in such ways, the risk of litigation against us may increase.
For our business to succeed, we need to attract and retain qualified employees and manage our employee base effectively.
Our success depends on our ability to hire and retain qualified employees and to manage our employee base effectively. Because of the specialized nature of our business, our future success will depend upon our continuing ability to identify, attract, train and retain other highly skilled managerial, technical, sales and marketing personnel, particularly as we enter new markets. Competition for people with the skills that we require is intense, particularly in the San Francisco Bay area where our headquarters are located and Los Angeles where we have significant operations, and the high cost of living in these areas makes our recruiting and compensation costs higher. If we are unable to hire and retain qualified employees, our business and operating results could be adversely affected.
Establishing and maintaining licensing relationships with companies are important to build and support a worldwide entertainment technology licensing ecosystem and to expand our business, and failure to do so could harm our business prospects.
Our future success will depend upon our ability to establish and maintain licensing relationships with companies in related business fields, including:
| • | DVD authoring facilities, mastering houses and replicators; |
| • | DVD authoring tools software companies and replicator test equipment suppliers; |
| • | DVD hardware manufacturers; |
| • | semiconductor and equipment manufacturers; |
| • | operators of entertainment content distributors, including PPV and VOD networks; |
| • | consumer electronics, digital PPV/VOD set-top hardware manufacturers, and PC manufacturers; |
| • | DRM suppliers; and |
| • | Internet portals and other digital distribution companies. |
23
Table of Contents
Substantially all of our license agreements are non-exclusive, and therefore our licensees are free to enter into similar agreements with third parties, including our competitors. Our licensees may develop or pursue alternative technologies either on their own or in collaboration with others, including our competitors.
Some of our third party license arrangements will require that we license others’ technologies and/or integrate our solutions with others. In addition, we rely on third parties to report usage and volume information to us. Delays, errors or omissions in this information could harm our business. If these third parties choose not to support integration efforts or delay the integration, our business could be harmed.
If we fail to maintain and expand our relationships with a broad range of participants throughout the entertainment industry, including motion picture studios, broadcasters and manufacturers of CE products, our business and prospects could be materially harmed. Relationships have historically played an important role in the entertainment industries that we serve. If we fail to maintain and strengthen these relationships, these entertainment industry participants may not purchase and use our technologies, which could materially harm our business and prospects. In addition to directly providing a substantial portion of our revenue, these relationships are also critical to our ability to have our technologies adopted as industry standards. Moreover, if we fail to maintain our relationships, or if we are not able to develop relationships in new markets in which we intend to compete in the future, including markets for new technologies and expanding geographic markets, our business, operating results and prospects could be materially and adversely affected. In addition, if major industry participants form strategic relationships that exclude us, our business and prospects could be materially adversely affected.
It may be more difficult for us, in the future, to have our technologies adopted as individual industry standards if entertainment industry participants collaborate on the development of new or different industry standard technologies.
Increasingly, standards-setting organizations are adopting or establishing technology standards for use in a wide-range of CE products. As a result, it is more difficult for individual companies to have their technologies widely adopted as an informal industry standard. In addition, there are a large number of companies, including companies that typically compete against one another, involved in the development of new technologies for use in consumer entertainment products. As a result, these companies often license their collective intellectual property rights as a group, making it more difficult for any single company to have its technologies adopted widely as a de facto industry standard or to have its technologies adopted as an exclusive, explicit industry standard. Examples of this include MPEG-LA (DRM licensing); Blu-ray DVD (high definition DVD format); and Digital Living Network Alliance (DLNA) and the Universal Plug and Play (UPnP) Forum (interoperability of consumer electronics devices). If our technologies are not supported by these standards bodies or patent pools, it may be more difficult for us to grow our business in the future. Our major customers may have a large influence on industry standards and the widespread adoption of new technologies. The selection of alternative technologies to ours or to those on which our technologies operate would harm our business.
Continued consolidation of the cable and satellite broadcasting industry could adversely affect existing agreements.
We have entered into agreements with a large number of cable MSOs and DBS providers for the licensing or distribution of our technology, products and services. If consolidation of the cable and satellite broadcasting industry continues, some of these agreements may be affected by mergers, acquisitions or system swaps. We cannot assure you that any measures that we have taken to protect us against any negative consequences resulting from those transactions will be effective. Also, a service provider that files a bankruptcy petition or otherwise restructures or liquidates could avoid its future obligations and discharge its past payment obligations under the agreement in some circumstances. Any such events could have a material adverse effect on the amount of revenue we receive under these agreements.
24
Table of Contents
The markets for our data solutions and IPG advertising may not develop and we may fail in our ability to fully exploit these new opportunities if these markets do not develop as we anticipate.
The market for IPG advertising is at an early stage of development and we cannot assure you that we will succeed in our efforts to develop IPG advertising as an advertising medium widely accepted by consumers and advertisers. In addition, MSO, DBS and Internet protocol television, or IPTV, providers who have a patent license from us are not required to provide advertising in their IPG. Therefore our ability to derive advertising revenues from IPGs distributed by our patent licensees is also dependent on the implementation of IPG advertising by such licensees. Likewise, the market for our data solutions is at an early stage and we cannot assure you that we will succeed in growing our data business to the levels we anticipate.
Limitations on control of joint ventures may adversely impact our operations.
We hold our interests in certain businesses, including Guideworks and IPG Inc., as a joint venture or in partnership with nonaffiliated third parties. As a result of such arrangements, we may be unable to control the operations, strategies and financial decisions of such joint venture or partnership entities which could in turn result in limitations on our ability to implement strategies that we may favor, or to cause dividends or distributions to be paid. In addition, our ability to transfer our interests in businesses owned with third parties is limited under certain joint venture, partnership or similar agreements.
We have limited control over existing and potential customers’ and licensees’ decisions to include our technology in their product offerings.
In general, we are dependent on our customers and licensees—including producers and distributors of content for films and videos—to incorporate our technology into their products. Although we have license agreements with many of these companies, many of these license agreements do not require any minimum purchase commitments, or are on a non-exclusive basis, or do not require incorporation of our technology in their products. If our customers were to determine that the benefits of our technology do not justify the cost of licensing the technology, then demand for our technology would decline. Furthermore, while we may be successful in obtaining mandatory status for our technology in one or more industry standards, there is no guarantee that products associated with these standards will be successful in the market. Our licensees and other manufacturers might not utilize our technology in the future. If this were to occur, our business would be harmed.
Our operating results may fluctuate, which may cause us to not be able to sustain our revenue levels or rate of revenue growth on a quarterly or annual basis which may cause our common stock price to decline.
Our quarterly and annual revenues, expenses and operating results could vary significantly in the future and period-to-period comparisons should not be relied upon as indications of future performance. We may experience volatility in revenues which may cause us to not be able to sustain our revenue levels, or our rate of revenue growth, on a quarterly or annual basis. In addition, we may be required to delay or extend recognition of revenue on more complex licensing arrangements as required under generally accepted accounting principles in the United States. Fluctuations in our operating results have in the past caused, and may in the future cause, the price of our common stock to decline.
Other factors that could affect our operating results include:
| • | the acceptance of our technologies by system operators and CE manufacturers; |
| • | expenses related to, and the financial impact of, possible acquisitions of other businesses and the integration of such businesses; |
| • | the timing and ability of signing high-value licensing agreements during a specific period; |
| • | the potential that we may not be in a position to anticipate a decline in revenues in any quarter until (i) late in the quarter due to the closing of new sales agreements late in the quarter or (ii) after the quarter ends due to the delay inherent in reporting from certain licensees; |
25
Table of Contents
| • | the extent to which new content technologies or formats replace technologies to which our solutions are targeted; and |
| • | adverse changes in the level of economic activity in the United States or other major economies in which we do business as a result of the threat of terrorism, military actions taken by the United States or its allies, or generally weak and uncertain economic and industry conditions. |
Our quarterly operating results may also fluctuate depending upon when we receive royalty reports from certain licensees. We recognize a portion of our license revenue only after we receive royalty reports from our licensees regarding the manufacture of their products that incorporate our technologies. As a result, the timing of our revenue is dependent upon the timing of our receipt of those reports, some of which are not delivered until late in the quarter or after the end of the quarter. This may put us in a position of not being able to anticipate a decline in revenues in any given quarter. In addition, it is not uncommon for royalty reports to include corrective or retroactive royalties that cover extended periods of time. Furthermore, there have been times in the past when we have recognized an unusually large amount of licensing revenue from a licensee in a given quarter because not all of our revenue recognition criteria were met in prior periods. This can result in a large amount of licensing revenue from a licensee being recorded in a given quarter that is not necessarily indicative of the amounts of licensing revenue to be received from that licensee in future quarters, thus causing fluctuations in our operating results.
A significant portion of our revenue is derived from international sales. Economic, political, regulatory and other risks associated with our international business could have an adverse effect on our operating results.
We expect that international and export sales will continue to represent a substantial portion of our net revenues for the foreseeable future. Our future growth will depend to a large extent on worldwide acceptance and deployment of our solutions.
To the extent that foreign governments impose restrictions on importation of programming, technology or components from the United States, the demand for our solutions in these markets could diminish. In addition, the laws of some foreign countries may not protect our intellectual property rights to the same extent as do the laws of the United States, which increases the risk of unauthorized use of our technologies. Such laws also may not be conducive to copyright protection of digital content, which may make our content protection technology less effective and reduce the demand for it.
Because we sell our products worldwide, our business is subject to the risks associated with conducting business internationally, including:
| • | foreign government regulation; |
| • | changes in diplomatic and trade relationships; |
| • | changes in, or imposition of, foreign laws and regulatory requirements; |
| • | changes in, or weakening of copyright and intellectual property (patent) laws; |
| • | difficulty of effective enforcement of contractual provisions in local jurisdictions; |
| • | tariffs or taxes and other trade barriers and restrictions; |
| • | fluctuations in our net effective income tax rate driven by changes in the percentage of revenues that we derive from international sources; |
| • | changes in a specific country’s or region’s political or economic condition, including changes resulting from the threat of terrorism; |
| • | difficulty in staffing and managing foreign operations; and |
| • | fluctuations in foreign currency exchange rates. |
26
Table of Contents
Our business could be materially adversely affected if foreign markets do not continue to develop, if we do not receive additional orders to supply our technologies or products for use by foreign system operators, CE manufacturers and PPV/VOD providers or if regulations governing our international businesses change. Any changes to the statute or the regulations with respect to export of encryption technologies could require us to redesign our products or technologies or prevent us from selling our products and licensing our technologies internationally.
We have made and expect to make significant investments in infrastructure which, if ineffective, may adversely affect our business results.
We have made and expect to make significant investments in infrastructure, tools, systems, technologies and content, including initiatives relating to digital asset and rights management and data warehouses, aimed to create, assist in the development or operation of, or enhance our ability to deliver innovative products and services across multiple media, digital and emerging platforms. These investments may ultimately cost more than is anticipated, their implementation may take longer than expected and they may not meaningfully contribute to or result in successful new or enhanced products, services or technologies.
Some terms of our agreements with licensees could be interpreted in a manner that could adversely affect licensing revenue payable to us under those agreements.
Some of our license agreements contain “most favored nation” clauses. These clauses typically provide that if we enter into an agreement with another licensee on more favorable terms, we must offer some of those terms to our existing licensees. We have entered into a number of license agreements with terms that differ in some respects from those contained in other agreements. These agreements may obligate us to provide different, more favorable, terms to licensees, which could, if applied, result in lower revenues or otherwise adversely affect our business, financial condition, results of operations or prospects. While we believe that we have appropriately complied with the most favored nation terms included in our license agreements, these contracts are complex and other parties could reach a different conclusion that, if correct, could have an adverse effect on our financial condition or results of operations.
Our products could be susceptible to errors, defects, or unintended performance problems that could result in lost revenues, liability or delayed or limited market acceptance.
We develop and offer complex solutions, which we license to customers. The performance of these products typically involves working with sophisticated software, computing and communications systems. Due to the complexity of these products offered and developed, and despite our quality assurance testing, the products may contain undetected defects or errors that may affect the proper use or application of such products by the customer. Because our products are embedded in digital content and other software, our solutions’ performance could unintentionally jeopardize our customers’ product performance. Any such defects, errors, or unintended performance problems in existing or new products, and any inability to meet customer expectations in a timely manner, could result in loss of revenue or market share, failure to achieve market acceptance, diversion of development resources, injury to our reputation, increased insurance costs and increased service, any of which could materially harm our business.
In addition, we rely on the customer and third party replicators to properly use our products to protect the software and applications to which our technology may be applied. Any improper use or application of the software by the customer or the third party replicators may render our technologies useless and result in losses from claims arising out of such improper use of the products.
Because customers rely on our products as used in their software and applications, defects or errors in our products may discourage customers from purchasing our products.
27
Table of Contents
These defects or errors could also result in product liability or warranty claims. Although we attempt to reduce the risk of losses resulting from these claims through warranty disclaimers and limitation of liability clauses in our agreements, these contractual provisions may not be enforceable in every instance. Furthermore, although we maintain errors and omissions insurance, this insurance may not adequately cover these claims. If a court refused to enforce the liability-limiting provisions of our contracts for any reason, or if liabilities arose that were not contractually limited or adequately covered by insurance, our business could be materially harmed.
In protecting copyrights and other intellectual property rights of our customers, our products affect consumer use of our customers’ products. Consumers may view this negatively and discontinue or threaten to discontinue purchase or use of our customers’ products unless our customers stop using our technologies. This may cause a decline in demand for our products or legal actions against us by our customers or consumers.
Government regulations may adversely affect our business.
The satellite transmission, cable and telecommunications industries are subject to pervasive federal regulation, including FCC licensing and other requirements. These industries are also often subject to extensive regulation by local and state authorities. While these regulations do not apply directly to us, they affect cable television providers and other multi-channel video programming distributors, or MVPDs, which are the primary customers for certain of our products and services. FCC regulations prohibit MVPDs (except DBS providers) from deploying after July 1, 2007 consumer electronic navigation devices (e.g., set-top boxes) with combined security and non-security functions (the “integration ban”). The FCC has granted a number of requests for waiver of the integration ban, and denied several petitions for waivers or deferrals. Petitions for reconsideration of the decisions denying waivers are pending before the FCC. Resolution of these petitions and other FCC action with respect to these issues could affect demand for IPGs incorporated into set-top boxes or CE devices.
Legislative initiatives seeking to weaken copyright law or new governmental regulation or new interpretation of existing laws that cause resulting legal uncertainties could harm our business.
Consumer rights advocates and other constituencies continuously challenge copyright law, notably the U.S. Digital Millennium Copyright Act of 1998, or DMCA, through both legislative and judicial actions. Legal uncertainties surrounding the application of the DMCA may adversely affect our business. If copyright law is compromised, or devices that can circumvent our technology are permitted by law and become prevalent, this could result in reduced demand for our technologies, and our business would be harmed.
Many laws and regulations are pending and may be adopted in the United States, individual states and local jurisdictions and other countries with respect to the Internet. These laws may relate to many areas that impact our business, including copyright and other intellectual property rights, digital rights management, property ownership and taxation. These types of regulations are likely to differ between countries and other political and geographic divisions. Other countries and political organizations are likely to impose or favor more and different regulation than that which has been proposed in the United States, thus furthering the complexity of regulations. In addition, state and local governments may impose regulations in addition to, inconsistent with, or stricter than federal regulations. Changes to or the interpretation of these laws could increase our costs, expose us to increased litigation risk, substantial defense costs and other liabilities or require us or our customers to change business practices. It is not possible to predict whether or when such legislation may be adopted, and the adoption of such laws or regulations, and uncertainties associated with their validity, interpretation, applicability and enforcement, could materially and adversely affect our business.
Business interruptions could adversely affect our future operating results.
The provision of certain of our products and services depends on the continuing operation of communications and transmission systems and mechanisms, including satellite, cable, wire, over the air broadcast communications and transmission systems and mechanisms. These communication and transmission
28
Table of Contents
systems and mechanisms are subject to significant risks and any damage to or failure of these systems and mechanisms could result in an interruption of the provision of our products and services.
Several of our major business operations are subject to interruption by earthquake, fire, power shortages, terrorist attacks and other hostile acts, and other events beyond our control. The majority of our research and development activities, our corporate headquarters, our principal information technology systems, and other critical business operations are located near major seismic faults. Our operating results and financial condition could be materially harmed in the event of a major earthquake or other natural or man-made disaster that disrupts our business. The communications and transmission systems and mechanisms that we depend on are not fully redundant, and our disaster recovery planning cannot account for all eventualities.
Our telephone and computer networks are subject to security and stability risks that could harm our business and reputation and expose us to litigation or liability.
Online business activities depend on the ability to transmit confidential information and licensed intellectual property securely over private and public networks. Any compromise of our ability to transmit such information and data securely or reliably, and any costs associated with preventing or eliminating such problems, could harm our business. Online transmissions are subject to a number of security and stability risks, including:
| • | our own or licensed encryption and authentication technology, and access and security procedures, may be compromised, breached or otherwise be insufficient to ensure the security of customer information or intellectual property; |
| • | we could experience unauthorized access, computer viruses, system interference or destruction, “denial of service” attacks and other disruptive problems, whether intentional or accidental, that may inhibit or prevent access to our websites or use of our products and services; |
| • | someone could circumvent our security measures and misappropriate our, our partners’ or our customers’ proprietary information or content or interrupt operations, or jeopardize our licensing arrangements, which are contingent on our sustaining appropriate security protections; |
| • | our computer systems could fail and lead to service interruptions or down-time for our ecommerce web sites; or |
| • | we may need to grow, reconfigure or relocate our data centers in response to changing business needs, which may be costly and lead to unplanned disruptions of service. |
The occurrence of any of these or similar events could damage our business, hurt our ability to distribute products and services and collect revenue, threaten the proprietary or confidential nature of our technology, harm our reputation, and expose us to litigation or liability. Because some of our technologies and businesses are intended to inhibit use of or restrict access to our customers’ intellectual property, we may become the target of hackers or other persons whose use of or access to our customers’ intellectual property is affected by our technologies. We may be required to expend significant capital or other resources to protect against the threat of security breaches, hacker attacks or system malfunctions or to alleviate problems caused by such breaches, attacks or failures.
Our Internet-based product and service offerings rely on a variety of systems, networks and databases, many of which are maintained by us at our data centers. We do not have complete redundancy for all of our systems and we do not maintain real-time back-up of our data, so in the event of significant system disruption, particularly during peak periods, we could experience loss of data processing capabilities, which could cause us to lose customers and could harm our operating results. Notwithstanding our efforts to protect against “down time” for products and services, we do occasionally experience unplanned outages or technical difficulties. In order to provide our Internet-based products and services, we must protect the security of our systems, networks, databases and software.
29
Table of Contents
If we fail to maintain proper and effective internal controls, our ability to produce accurate financial statements could be impaired, which could increase our operating costs and affect our ability to operate our business.
We have a complex business that is international in scope. Ensuring that we have adequate internal financial and accounting controls and procedures in place to help ensure that we can produce accurate financial statements on a timely basis is a costly and time-consuming effort that needs to be re-evaluated frequently. We are continually in the process of documenting, reviewing and, if appropriate, improving our internal controls and procedures in connection with Section 404 of the Sarbanes-Oxley Act of 2002, which requires annual management assessments of the effectiveness of our internal control over financial reporting and a report by our independent registered public accountants on the effectiveness of our internal controls over financial reporting. If we or our independent registered public accountants identify areas for further attention or improvement, implementing any appropriate changes to our internal controls may require specific compliance training of our directors, officers and employees, entail substantial costs in order to modify our existing accounting systems, and take a significant period of time to complete. We have in the past identified, and may in the future identify, significant deficiencies in the design and operation of our internal controls, which have been or will in the future need to be remediated. Furthermore, our independent registered public accountants may interpret the Section 404 requirements and the related rules and regulations differently from how we interpret them, or our independent registered public accountants may not be satisfied with our internal control over financial reporting or with the level at which these controls are documented, operated or reviewed in the future. Finally, in the event we make a significant acquisition, or a series of smaller acquisitions, we may face significant challenges in implementing the required processes and procedures in the acquired operations. As a result, our independent registered public accountants may decline or be unable to report on the effectiveness of our internal controls over financial reporting or may issue a qualified report in the future. This could result in an adverse reaction in the financial markets due to investors’ perceptions that our internal controls are inadequate or that we are unable to produce accurate financial statements.
We will incur costs and demands upon management as a result of complying with the laws and regulations affecting public companies, which could affect our operating results.
We have incurred, and will continue to incur, significant legal, accounting and other expenses associated with corporate governance and public company reporting requirements, including requirements under the Sarbanes-Oxley Act of 2002, as well as rules implemented by the SEC and NASDAQ. As long as the SEC requires the current level of compliance for public companies of our size, we expect these rules and regulations to require significant legal and financial compliance costs and to make some activities time-consuming and costly. These rules and regulations may make it more expensive for us to obtain director and officer liability insurance, and we may be required to accept reduced policy limits and coverage or incur substantially higher costs to obtain the same or similar coverage than was previously available. As a result, it may be more difficult for us to attract and retain qualified individuals to serve on our board of directors or as our executive officers.
We may be subject to assessment of sales and other taxes for the sale of our products, license of technology or provision of services.
We do not currently collect sales or other taxes on the sale of our products, license of technology or provision of services in states and countries other than those in which we have offices or employees. Our business would be harmed if one or more states or any foreign country required us to collect sales or other taxes from past sales of products, licenses of technology or provision of services, particularly because we would be unable to go back to customers to collect sales taxes for past sales and would likely have to pay such taxes out of our own funds.
30
Table of Contents
The price of our common stock may be volatile.
The market price of our common stock has been, and in the future could be, significantly affected by factors such as:
| • | actual or anticipated fluctuations in operating results; |
| • | announcements of technical innovations; |
| • | new products or new contracts; |
| • | announcements by competitors or their customers; |
| • | announcements by our customers; |
| • | governmental regulatory and copyright action; |
| • | developments with respect to patents or proprietary rights; |
| • | announcements regarding acquisitions or divestitures; |
| • | announcements regarding litigation or regulatory matters; |
| • | changes in financial estimates or coverage by securities analysts; |
| • | changes in interest rates which affect the value of our investment portfolio; |
| • | changes in tax law or the interpretation of tax laws; and |
| • | general market conditions. |
Announcements by satellite television operators, cable television operators, major content providers or others regarding consumer electronics business combinations, evolving industry standards, consumer rights activists’ “wins” in government regulations or the courts, motion picture production or distribution or other developments could cause the market price of our common stock to fluctuate substantially.
There can be no assurance that our historic trading prices and price/earnings ratios, or those of technology companies in general, will be sustained. In the past, following periods of volatility in the market price of a company’s securities, some companies have been named in class action suits.
Further, the general stock market instability and economic uncertainty may adversely affect the global financial markets, which could cause the market price of our common stock to fluctuate substantially.
We utilize non-GAAP reporting in our quarterly earnings press releases.
We publish non-GAAP financial measures in our quarterly earnings press releases along with a reconciliation of non-GAAP financial measures to those measures compiled in accordance with accounting principles generally accepted in the United States (“GAAP”). The reconciling items have adjusted GAAP net income and GAAP earnings per share for certain non-cash, non-operating or non-recurring items and are described in detail in each such quarterly earnings press release. We believe that this presentation may be more meaningful to investors in analyzing the results of operations and income generation as this is how our business is managed. The market price of our stock may fluctuate based on future non-GAAP results if investors base their investment decisions upon such non-GAAP financial measures. If we decide to curtail use of non-GAAP financial measures in our quarterly earnings press releases, the market price of our stock could be affected if investors analyze our performance in a different manner.
| ITEM 1B. | UNRESOLVED STAFF COMMENTS |
None.
31
Table of Contents
| ITEM 2. | PROPERTIES |
The following table lists our principal locations.
| Location |
Approximate Square Footage |
Lease Expiration | ||
| Santa Clara, California (Corporate Headquarters) |
90,000 | January 2017 | ||
| Radnor, Pennsylvania |
64,000 | January 2015 | ||
| Tulsa, Oklahoma |
40,000 | June 2014 | ||
| Burbank, California |
62,000 | June 2019 | ||
| New York, New York |
28,000 | July 2011 | ||
| Ann Arbor, Michigan |
34,000 | April 2015 | ||
| San Francisco, California |
20,000 | July 2013 | ||
| Bedford, Massachusetts |
16,000 | December 2013 | ||
| Hong Kong |
13,000 | March 2013 |
Most U.S. sales, marketing and technical personnel for all product divisions are in these locations, with a small number of individuals operating out of their home offices. We believe that our existing facilities are adequate to meet current requirements and that additional or substitute space will be available as needed to accommodate any expansion of operations.
We also lease space for sales, marketing and technical staff in Schaumburg, Illinois, Maidenhead, United Kingdom; Tokyo, Japan; Seoul, South Korea; Hsinchu, Taiwan; Luxemburg and Ontario, Canada.
| ITEM 3. | LEGAL PROCEEDINGS |
The Company is involved in legal proceedings related to intellectual property rights and other matters. The following legal proceedings include those of the Company and its subsidiaries.
Indemnifications
DirecTV, Inc. v. Finisar Corporation. In April 2005, Gemstar received a notice of a potential claim for indemnification from DirecTV Group, Inc. (“DirecTV”) as a result of a lawsuit filed by Finisar Corporation (“Finisar”) against DirecTV in the United States District Court for the Eastern District of Texas. Finisar alleged that several aspects of the DirecTV satellite transmission system, including aspects of its advanced electronic program guide (“EPG”) and the storage, scheduling, and transmission of data for the EPG, infringed a Finisar patent. On July 7, 2006, the Court awarded Finisar approximately $117 million. In addition, the Court ordered DirecTV to pay approximately $1.60 per activated set-top box in licensing fees going forward in lieu of an injunction until the expiration of Finisar’s patent in 2012. The parties both filed appeals to the Federal Circuit, which subsequently ruled that the trial court’s construction of certain terms of the patent was too broad, vacated the jury’s verdict of infringement, held that one of the seven patent claims at issue is invalid, and left standing the remaining six claims for reconsideration by the trial court. The appeals court also reversed the jury’s finding that DirecTV’s infringement was willful. The trial court subsequently ruled in DirecTV’s favor on its summary judgment motion that the remaining claims of the subject patent were invalid, and in January 2010 the court of appeals confirmed that ruling. The Company has not established a reserve with respect to this matter in its consolidated financial statements.
Comcast Cable Communications Corp., LLC v. Finisar Corporation, in the United States District Court for the Northern District of California. In support of a potential claim for indemnification, Comcast Cable Communications Corp., LLC (“Comcast”) put the Company on notice that it had received communications from Finisar asserting infringement of U.S. Patent 5,404,505 (the “‘505 patent”). On July 7, 2006, Comcast filed a declaratory judgment action in the Northern District of California asking the Court to rule, among other things, that it does not infringe the ‘505 patent and/or that the patent is invalid. On May 15, 2008, Finisar entered into a
32
Table of Contents
covenant and stipulation with Comcast, filed with the California Court, that it would not assert any claim of the ‘505 patent against Comcast or certain related entities, other than claim 25. On July 11, 2008, the Court ruled on Comcast’s summary judgment motion, finding that claim 25 is invalid, and therefore finding that Comcast’s non-infringement motion is moot. Comcast has not taken any further action insofar as its potential indemnity claim against the Company is concerned.
Litigation
Thomson, Inc. v. Gemstar—TV Guide International, Inc., in the Superior Court of the State of Indiana for the County of Hamilton. On May 23, 2008, Thomson, Inc. (“Thomson”) initiated this action, seeking, among other things, indemnification from the Company in connection with its settlement of the patent claims against it in SuperGuide Corporation v. DirecTV Enterprises, Inc., et al., in the United States District Court for the Western District of North Carolina. Thomson alleges that it entered into multiple agreements with the Company between 1996 and 2003 that would require the Company to indemnify Thomson in the SuperGuide litigation. Specifically, Thomson asserts causes of action for fraud/fraudulent inducement, breach of contract, breach of implied in fact indemnity and warranty of title against infringement, and unjust enrichment. Thomson seeks a declaration from the Court that the Company owes Thomson defense and indemnity for SuperGuide’s claims, compensatory damages, including fees and expenses paid by Thomson in that case, the return of royalties paid by Thomson to the Company under the aforementioned agreements, pre and post-judgment interest, punitive damages, attorney fees, and costs of suit. The case is tentatively set for trial at a date to be determined in 2010.
DIRECTV, Inc. v. Gemstar-TV Guide Interactive, Inc., American Arbitration Association—Los Angeles. On March 20, 2009, DirecTV filed this arbitration demand seeking indemnity for payments made in settlement of two patent infringement lawsuits, including the SuperGuide Corporation v. DirecTV Enterprises, Inc., et al. matter. DirecTV seeks indemnity under the November 21, 2003, License and Distribution Agreement and Patent License Agreement between the parties and claims damages plus interest and its arbitration-related attorneys’ fees. The Company has filed a Response and Counterclaim for breach of contract. A hearing was held in December 2009, and we are awaiting the arbitrators’ ruling on the matter.
John Burke v. TV Guide Magazine Group, Inc., Open Gate Capital, Rovi Corp., Gemstar-TV Guide International, Inc. On August 11, 2009, plaintiff filed a purported class action lawsuit claiming that the Company’s former subsidiary, TV Guide Magazine, breached agreements with its subscribers and violated consumer protection laws with its practice of counting double issues toward the number of issues in a subscription. On September 10, 2009, the Company filed an answer to the complaint along with a petition to remove the case to federal court. On December 18, 2009, the case was dismissed with prejudice, and plaintiff has filed an appeal of that dismissal.
In addition to the items listed above, the Company is party to various legal actions, claims and proceedings as well as other actions, claims and proceedings incidental to its business. The Company has established loss provisions only for matters in which losses are probable and can be reasonably estimated. Some of the matters pending against the Company involve potential compensatory, punitive or treble damage claims, or sanctions, that if granted, could require them to pay damages or make other expenditures in amounts that could have a material adverse effect on their financial position or results of operations. At this time, management has not reached a determination that the matters listed above or any other litigation, individually or in the aggregate, are expected to result in liabilities that will have a material adverse effect on our financial position or results of operations or cash flows.
| ITEM 4. | SUBMISSION OF MATTERS TO A VOTE OF SECURITY HOLDERS |
We did not submit any matters to a vote of security holders during the quarter ended December 31, 2009.
We currently anticipate the Company will hold its annual meeting of stockholders in May 2010.
33
Table of Contents
| ITEM 5. | MARKET FOR REGISTRANT’S COMMON EQUITY, RELATED STOCKHOLDER MATTERS AND ISSUER PURCHASES OF EQUITY SECURITIES |
Market Information and Holders
The common stock of Rovi Corporation has been listed on the NASDAQ Global Select Market under the symbol “ROVI” since July 16, 2009. Macrovision Solutions Corporation was trading under the symbol “MVSN” prior to changing its name to Rovi Corporation on July 15, 2009. As part of Macrovision Solutions Corporation’s assumption of the ownership on May 2, 2008 of both Gemstar and Macrovision Corporation (See Note 1 to the Consolidated Financial Statements) Macrovision Corporation’s stock was delisted. The following table sets forth, for the periods indicated, the reported high and low closing prices for the common stock of Rovi Corporation:
| High | Low | |||||
| 2009 |
||||||
| First Quarter |
$ | 18.22 | $ | 12.39 | ||
| Second Quarter |
$ | 23.15 | $ | 17.26 | ||
| Third Quarter |
$ | 33.86 | $ | 20.76 | ||
| Fourth Quarter |
$ | 34.77 | $ | 27.00 | ||
| 2008 |
||||||
| Second Quarter (since May 2, 2008) |
$ | 17.55 | $ | 12.76 | ||
| Third Quarter |
$ | 18.62 | $ | 13.78 | ||
| Fourth Quarter |
$ | 15.59 | $ | 8.46 | ||
As of February 2, 2010, there were 670 holders of record of our common stock, based upon information furnished by American Stock Transfer & Trust Company, the transfer agent for our securities. The number of beneficial stockholders is substantially greater than the number of holders of record because a large portion of our common stock is held through brokerage firms. As of February 2, 2010, there were 104,187,970 shares of common stock outstanding.
34
Table of Contents
Stock Performance Graph
The graph below shows a comparison of the cumulative total stockholder return on our common stock with the cumulative total return on the NASDAQ Composite Index (the “NASDAQ”), the S&P 500 Composite Index (the “S&P 500”) and the Russell 2000 Index (“Russell 2000”) from May 2, 2008 through December 31, 2009. The graph assumes an investment of $100 in our common stock and in each of the market indices, and further assumes the reinvestment of all dividends. The comparisons in the graph below are based on historical data and are not intended to forecast the possible future performance of our common stock.
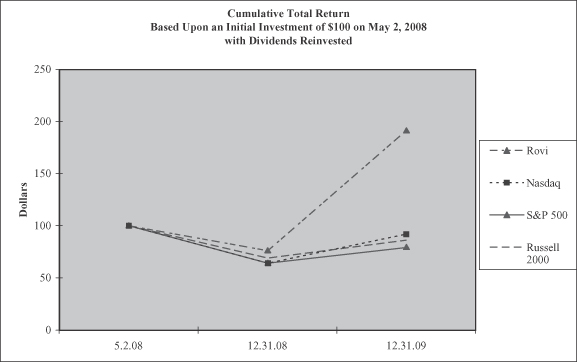
| Rovi Corporation |
NASDAQ Composite Index |
S&P 500 |
Russell 2000 Index | |||||||||
| May 2, 2008 |
$ | 100 | $ | 100 | $ | 100 | $ | 100 | ||||
| December 31, 2008 |
$ | 76 | $ | 64 | $ | 64 | $ | 69 | ||||
| December 31, 2009 |
$ | 191 | $ | 92 | $ | 79 | $ | 86 | ||||
Dividend Policy
We have not declared or paid any cash dividends on our common stock since 1994. We do not anticipate paying any cash dividends on our common stock in the foreseeable future. At this time, we intend to retain all earnings for use in our business operations and to pay down debt. Our Term Loan contains covenants limiting our ability to pay dividends. See “Liquidity and Capital Resources.”
Stock Repurchase Authorization
During the fourth quarter of 2008, the Company repurchased 2.3 million shares of common stock for approximately $25.1 million. These repurchases were recorded as treasury stock and resulted in a reduction of stockholders’ equity. As of December 31, 2009, treasury stock consisted of 2.3 million shares of common stock that had been repurchased, with a cost basis of approximately $25.1 million. As of December 31, 2009, $34.9 million remained available for share repurchases under the Company’s existing repurchase authorization.
35
Table of Contents
| ITEM 6. | SELECTED FINANCIAL DATA |
The following table sets forth selected consolidated financial data and other operating information. The financial data does not purport to indicate results of operations as of any future date or for any future period. The financial data is derived from our consolidated financial statements and should be read in conjunction with the consolidated financial statements, related notes and other financial information included herein. For further discussion of factors that could affect comparability of these consolidated financial statements, see the notes following the table.
On May 2, 2008, the Company acquired Gemstar-TV Guide International, Inc. (“Gemstar”) in a cash and stock transaction. On April 30, 2009, the Company acquired substantially all of the assets of Muze, Inc. (“Muze”) in a cash transaction. The Company’s results of operations include the operations of Gemstar and Muze from those dates forward.
On April 1, 2008, the Company closed the sale of its Software and Games businesses. In the fourth quarter of 2008, the Company closed the sale of its TV Guide Magazine and eMeta businesses. On January 27, 2009, the Company closed the sale of its TVG Network business and on February 28, 2009, the Company closed the sale of its TV Guide Network and TV Guide Online businesses. The results of operations and cash flows of Software, Games, TV Guide Magazine, TV Guide Network, TV Guide Online, TVG Network and eMeta have been classified as discontinued operations, for all periods presented (See Note 4 to the Consolidated Financial Statements).
| Year Ended December 31, | ||||||||||||||||||||
| 2009 | 2008 (1) | 2007 (1) | 2006 (1)(3) | 2005 (1) | ||||||||||||||||
| (in thousands, except per share data) | ||||||||||||||||||||
| Consolidated Statements of Operations Data: |
||||||||||||||||||||
| Revenues |
$ | 483,911 | $ | 330,045 | $ | 144,943 | $ | 111,569 | $ | 96,348 | ||||||||||
| Costs and expenses: |
||||||||||||||||||||
| Cost of revenues |
65,916 | 44,568 | 9,238 | 9,806 | 4,496 | |||||||||||||||
| Research and development |
94,632 | 67,714 | 13,204 | 14,565 | 9,269 | |||||||||||||||
| Selling, general and administrative |
133,207 | 114,614 | 55,316 | 48,027 | 41,070 | |||||||||||||||
| Depreciation |
18,408 | 13,832 | 5,090 | 5,288 | 3,602 | |||||||||||||||
| Amortization |
81,934 | 59,139 | 5,981 | 3,256 | 3,209 | |||||||||||||||
| Restructuring and asset impairment charges |
53,619 | — | 4,546 | — | 1,030 | |||||||||||||||
| Total costs and expenses |
447,716 | 299,867 | 93,375 | 80,942 | 62,676 | |||||||||||||||
| Operating income from continuing operations |
36,195 | 30,178 | 51,568 | 30,627 | 33,672 | |||||||||||||||
| Interest expense |
(52,028 | ) | (54,834 | ) | (15,446 | ) | (5,379 | ) | — | |||||||||||
| Interest income and other, net |
4,394 | 11,732 | 23,199 | 12,087 | 5,465 | |||||||||||||||
| Loss on debt redemption |
(8,687 | ) | — | — | — | — | ||||||||||||||
| Gain on sale of strategic investments |
— | 5,238 | — | — | — | |||||||||||||||
| Impairment losses on strategic investments |
— | — | (5,000 | ) | — | (5,822 | ) | |||||||||||||
| (Loss) income from continuing operations before income taxes |
(20,126 | ) | (7,686 | ) | 54,321 | 37,335 | 33,315 | |||||||||||||
| Income tax (benefit) expense |
(1,421 | ) | (23,409 | ) | 14,468 | 8,854 | 17,723 | |||||||||||||
| (Loss) income from continuing operations, net of tax |
(18,705 | ) | 15,723 | 39,853 | 28,481 | 15,592 | ||||||||||||||
| Discontinued operations, net of tax |
(34,246 | ) | (129,783 | ) | (14,537 | ) | 2,979 | 6,523 | ||||||||||||
| Net (loss) income |
$ | (52,951 | ) | $ | (114,060 | ) | $ | 25,316 | $ | 31,460 | $ | 22,115 | ||||||||
36
Table of Contents
| Year Ended December 31, | ||||||||||||||||||
| 2009 | 2008 (1) | 2007 (1) | 2006 (1)(3) | 2005 (1) | ||||||||||||||
| (in thousands, except per share data) | ||||||||||||||||||
| Basic earnings per common share: |
||||||||||||||||||
| Basic (loss) income per share from continuing operations |
$ | (0.18 | ) | $ | 0.18 | $ | 0.75 | $ | 0.55 | $ | 0.31 | |||||||
| Basic (loss) income per share from discontinued operations |
$ | (0.34 | ) | $ | (1.50 | ) | $ | (0.27 | ) | $ | 0.06 | $ | 0.13 | |||||
| Basic net earnings per share |
$ | (0.52 | ) | $ | (1.32 | ) | $ | 0.48 | $ | 0.61 | $ | 0.44 | ||||||
| Shares used in computing basic net earnings per common share |
100,860 | 85,334 | 52,470 | 51,349 | 50,653 | |||||||||||||
| Diluted earnings per common share: |
||||||||||||||||||
| Diluted (loss) income per share from continuing operations |
$ | (0.18 | ) | $ | 0.18 | $ | 0.74 | $ | 0.54 | $ | 0.30 | |||||||
| Diluted (loss) income per share from discontinued operations |
$ | (0.34 | ) | $ | (1.50 | ) | $ | (0.27 | ) | $ | 0.06 | $ | 0.13 | |||||
| Diluted net earnings per share |
$ | (0.52 | ) | $ | (1.32 | ) | $ | 0.47 | $ | 0.60 | $ | 0.43 | ||||||
| Shares used in computing diluted net earnings per common share |
100,860 | 85,357 | 53,104 | 52,077 | 51,318 | |||||||||||||
| December 31, | |||||||||||||||
| 2009 | 2008 (1) | 2007 (1) | 2006 (1) | 2005 (1) | |||||||||||
| (in thousands) | |||||||||||||||
| Consolidated Balance Sheet Data: |
|||||||||||||||
| Cash, cash equivalents, short and long-term investments and restricted cash |
$ | 336,284 | $ | 362,057 | $ | 439,289 | $ | 456,390 | $ | 249,704 | |||||
| Working capital |
289,962 | 561,313 | 435,552 | 292,783 | 218,610 | ||||||||||
| Total assets |
2,151,139 | 2,636,184 | 922,951 | 802,981 | 497,925 | ||||||||||
| Long-term liabilities (2) |
514,479 | 950,068 | 262,142 | 200,114 | 959 | ||||||||||
| Total stockholders’ equity |
1,520,269 | 1,515,195 | 576,731 | 492,953 | 428,150 | ||||||||||
| (1) | The information included in this five-year financial summary has been adjusted to reflect the retrospective adoption of updates to the Accounting Standards Codification related to the accounting for convertible debt and earnings per share. For additional information see Note 1 and Note 6 to the Consolidated Financial Statements. |
| (2) | In August 2006, we issued $240.0 million in convertible senior notes which has been included in long-term liabilities. In May 2008, in connection with the Gemstar acquisition, we entered into a $550 million senior secured term loan credit facility and issued $100 million in senior notes. |
| (3) | On January 1, 2006, the Company adopted updates to the Accounting Standards Codification related to the accounting for Share-Based Payments. The Company adopted these updates using the modified prospective method (See Note 1 to the Consolidated Financial Statements). |
37
Table of Contents
| ITEM 7. | MANAGEMENT’S DISCUSSION AND ANALYSIS OF FINANCIAL CONDITION AND RESULTS OF OPERATIONS |
The following commentary should be read in conjunction with the Consolidated Financial Statements and related notes contained elsewhere in this Form 10-K.
Overview
We are focused on powering the discovery and enjoyment of digital entertainment by providing a broad set of integrated solutions that are embedded in our customers’ products and services and used by end consumers to simplify and guide their interaction with digital entertainment. Our offerings include interactive program guides (IPGs), embedded licensing technologies (such as recommendations and search capability), media recognition technologies and licensing of our extensive database of descriptive information about television, movie, music, books, and game content and content protection technologies and services. In addition to offering Company developed IPGs, our customers may also license our patents and deploy their own IPG or a third party IPG. We group our revenue into the following categories – (i) CE manufacturers, (ii) service providers, and (iii) other. We include in service provider revenues any revenue related to an IPG deployed by a service provider in a subscriber household whether the ultimate payment for that IPG comes from the service provider or from a manufacturer of a set-top box. Revenues for IPGs included in a set-top box deployed by a service provider where payment was made by the set-top box manufacturer were previously classified in CE manufacturers. Revenue related to an IPG deployed in a set-top box sold at retail is included in CE manufacturers. Our management feels this classification is preferable as it allows a better association between service provider revenue and digital households deploying a Company-provided IPG or an IPG deployed under a patent license with us. CE manufacturers deploy such Company products and services as Connected Platform, TV Guide On Screen, Guide Plus+, G-GUIDE, VCR Plus+, web services, LASSO and Tapestry. Service providers deploy such Company products and services as Passport Echo, Passport DCT, Passport, i-Guide and web services. Other includes our business of licensing our extensive database of descriptive information about television, movie, music and game content and our entertainment company content protection products and services such as ACP, RipGuard, CopyBlock and BD+.
On May 2, 2008, we acquired Gemstar-TV Guide International, Inc. (“Gemstar”) in a cash and stock transaction. On April 30, 2009, we acquired substantially all of the assets of Muze, Inc. (“Muze”) in a cash transaction. Our results of operations include the operations of Gemstar and Muze from those dates forward.
On April 1, 2008, we sold our Software and Games businesses (referred to as “Software” and “Games”, respectively). In the fourth quarter of 2008, we sold our TV Guide Magazine and RightCommerce (also known as “eMeta”) businesses. On January 27, 2009, we sold our TVG Network business and on February 28, 2009 we sold our TV Guide Network and TV Guide Online businesses. Together TV Guide Magazine, TVG Network and TV Guide Online are collectively referred to as the “Media Properties”. The results of operations and cash flows of Software, Games, eMeta and the Media have been classified as discontinued operations, for all periods presented.
38
Table of Contents
Comparison of Years Ended December 31, 2009 and 2008 from continuing operations
The following tables present our 2009 results from continuing operations compared to the prior year (in thousands):
| Year Ended December 31, | ||||||||||||||
| 2009 | 2008 | Change $ | Change % | |||||||||||
| Revenues: |
||||||||||||||
| Service providers |
$ | 230,727 | $ | 131,763 | 98,964 | 75 | % | |||||||
| CE manufacturers |
199,905 | 148,962 | 50,943 | 34 | % | |||||||||
| Other |
53,279 | 49,320 | 3,959 | 8 | % | |||||||||
| Total revenues |
483,911 | 330,045 | 153,866 | 47 | % | |||||||||
| Costs and expenses: |
||||||||||||||
| Cost of revenues |
65,916 | 44,568 | 21,348 | 48 | % | |||||||||
| Research and development |
94,632 | 67,714 | 26,918 | 40 | % | |||||||||
| Selling, general and administrative |
133,207 | 114,614 | 18,593 | 16 | % | |||||||||
| Depreciation |
18,408 | 13,832 | 4,576 | 33 | % | |||||||||
| Amortization |
81,934 | 59,139 | 22,795 | 39 | % | |||||||||
| Restructuring and asset impairment charges |
53,619 | — | 53,619 | NM | ||||||||||
| Total operating expenses |
447,716 | 299,867 | 147,849 | 49 | % | |||||||||
| Operating income from continuing operations |
36,195 | 30,178 | 6,017 | 20 | % | |||||||||
| Interest expense |
(52,028 | ) | (54,834 | ) | 2,806 | -5 | % | |||||||
| Interest income and other, net |
4,394 | 11,732 | (7,338 | ) | -63 | % | ||||||||
| Loss on debt redemption |
(8,687 | ) | — | (8,687 | ) | NM | ||||||||
| Gain on sale of strategic investment |
— | 5,238 | (5,238 | ) | -100 | % | ||||||||
| Loss from continuing operations before taxes |
(20,126 | ) | (7,686 | ) | (12,440 | ) | 162 | % | ||||||
| Income tax benefit |
(1,421 | ) | (23,409 | ) | 21,988 | -94 | % | |||||||
| (Loss) income from continuing operations, net of tax |
(18,705 | ) | 15,723 | (34,428 | ) | -219 | % | |||||||
| Loss from discontinued operations, net of tax |
(34,246 | ) | (129,783 | ) | 95,537 | -74 | % | |||||||
| Net loss |
$ | (52,951 | ) | $ | (114,060 | ) | 61,109 | -54 | % | |||||
Net Revenue
Service Providers
For the year ended December 31, 2009, revenue from the sale of our products to service providers increased significantly compared to the prior year. This was largely due to 2009 including a full year of revenue from the sale of IPG products and patents that we obtained in the Gemstar acquisition. Revenue from the licensing of our IPG patents and products increased in the second half of 2009, as compared to the same period in 2008, due to new international licensing agreements and domestic digital subscriber growth. We expect revenue from licensing our IPG products and patents to continue to grow in the future due to increased international licensing and continued domestic digital subscriber growth.
CE Manufacturers
For the year ended December 31, 2009, revenue from the sale of our products and services to CE Manufacturers increased compared to the prior year. This was largely due to 2009 including a full year of revenue from the sale of products and patents that we obtained in the Gemstar acquisition. We expect revenue from the licensing of our IPG patents and products and our Lasso product will continue to increase in the future and offset the expected declines in VCR Plus+ and ACP revenue.
39
Table of Contents
Other
Other revenue consists primarily of licensing of our underlying media content/metadata and licensing of our content protection technologies to entertainment companies. For the year ended December 31, 2009, Other revenue increased compared to the prior year, primarily due to increased revenue from our data business, primarily driven by the Muze acquisition. This increase was partially offset by a decline in our content protection revenues from entertainment studios.
Cost of Revenues
For the year ended December 31, 2009, cost of revenues increased from the prior year, primarily due to 2009 including a full year of costs associated with products and services acquired in the Gemstar acquisition.
Research and Development
For the year ended December 31, 2009, research and development expenses increased from the prior year, primarily due to 2009 including a full year of research and development activities related to the Gemstar operations.
Selling, General and Administrative
For the year ended December 31, 2009, selling, general and administrative expenses increased from the prior year, primarily due to 2009 including a full year of costs associated with the Gemstar operations.
Depreciation and Amortization
For the year ended December 31, 2009, depreciation and amortization increased from the prior year, primarily due to 2009 including a full year of depreciation of fixed assets and amortization of intangible assets from the Gemstar acquisition.
Restructuring and Asset Impairment Charges
During the year ended December 31, 2009, we completed extensive consumer research regarding our brands. This consumer research indicated that the brands acquired by us did not represent the future vision of the Company and did not carry a positive connotation in the market. We determined these results to be an indicator of potential impairment of our trademark intangible assets. We determined the fair value of our trademark intangible assets to be $8.3 million and recorded a $43.1 million impairment charge during the year ended December 31, 2009. In addition, during the year ended December 31, 2009, we recorded $0.9 million in restructuring charges related to the Muze acquisition and $1.6 million in other asset impairment charges.
In conjunction with the disposition of the Media Properties, in the first quarter of 2009, our management approved several actions resulting in a restructuring and asset impairment charge of $8.4 million. Additionally, during the first quarter of 2009, we reversed the remaining $0.4 million in liabilities related to the fiscal 2007 restructuring plans.
Interest Expense
Interest expense decreased in 2009 as compared to 2008 primarily due to the paydown of the debt issued in connection with the Gemstar acquisition. In 2009, we redeemed our $100 million 11% Senior Notes and made $340 million in principal payments on our Term Loan. Interest expense for the year ended December 31, 2009, also included $4.1 million in accelerated amortization of note issuance costs related to the pay-down of principal related to the Term Loan.
40
Table of Contents
Interest Income and Other, Net
Interest income and other, net decreased as compared to the prior year due to lower prevailing interest rates and lower average cash and investment balances.
Loss on Debt Redemption
On August 5, 2009, we redeemed our $100 million 11% Senior Notes at par plus accrued interest and a $2.8 million make-whole payment representing the discounted value of interest which the note holders would have received through November 15, 2009, the first date the 11% Senior Notes could be retired without a premium. In connection with the redemption of the Senior Notes we have recorded an $8.7 million loss on debt redemption for the year ended December 31, 2009. This loss is comprised of $2.8 million make-whole payment discussed above, the write-off of $5.6 million in note issuance costs and $0.3 million in fees associated with the note redemption.
Gain on Sale of Strategic Investment
During 2008, we recognized a gain of $5.2 million on the sale of our investment in Digimarc Corporation.
Income Taxes
We recorded an income tax benefit from continuing operations of $1.4 million and $23.4 million for 2009 and 2008, respectively. Our income tax benefit for 2009 was primarily impacted by the geographic source of our profits and an increase in accrued tax contingency reserves. Our income tax benefit in 2008 was primarily impacted by the geographic source of our profits and the reversal of accrued tax contingency reserves due to audit settlements and statute of limitations closures.
Loss from Discontinued Operations
Loss from discontinued operations in 2009 is primarily due to income tax expense recorded for the sale of TVG Network, TV Guide Network and TV Guide Online. Loss from discontinued operations in 2008 is primarily due to impairments recorded related to the goodwill and intangible assets of the Media Properties partially offset by the gain on sale recorded when we sold our Software business.
41
Table of Contents
Comparison of Years Ended December 31, 2008 and 2007 from continuing operations
The following tables present our 2008 results from continuing operations compared to the prior year (in thousands):
| Year Ended December 31, | ||||||||||||||
| 2008 | 2007 | Change $ | Change % | |||||||||||
| Revenues: |
||||||||||||||
| CE manufacturers |
$ | 148,962 | $ | 94,056 | 54,906 | 58 | % | |||||||
| Service providers |
131,763 | 4,204 | 127,559 | 3034 | % | |||||||||
| Other |
49,320 | 46,683 | 2,637 | 6 | % | |||||||||
| Total revenues |
330,045 | 144,943 | 185,102 | 128 | % | |||||||||
| Costs and expenses: |
||||||||||||||
| Cost of revenues |
44,568 | 9,238 | 35,330 | 382 | % | |||||||||
| Research and development |
67,714 | 13,204 | 54,510 | 413 | % | |||||||||
| Selling, general and administrative |
114,614 | 55,316 | 59,298 | 107 | % | |||||||||
| Depreciation |
13,832 | 5,090 | 8,742 | 172 | % | |||||||||
| Amortization |
59,139 | 5,981 | 53,158 | 889 | % | |||||||||
| Restructuring and asset impairment charges |
— | 4,546 | (4,546 | ) | -100 | % | ||||||||
| Total operating expenses |
299,867 | 93,375 | 206,492 | 221 | % | |||||||||
| Operating income from continuing operations |
30,178 | 51,568 | (21,390 | ) | -41 | % | ||||||||
| Interest expense |
(54,834 | ) | (15,446 | ) | (39,388 | ) | 255 | % | ||||||
| Gain on sale of strategic investment |
5,238 | — | 5,238 | NM | ||||||||||
| Impairment loss on strategic investment |
— | (5,000 | ) | 5,000 | -100 | % | ||||||||
| Interest income and other, net |
11,732 | 23,199 | (11,467 | ) | -49 | % | ||||||||
| (Loss) income from continuing operations before taxes |
(7,686 | ) | 54,321 | (62,007 | ) | -114 | % | |||||||
| Income tax (benefit) expense |
(23,409 | ) | 14,468 | (37,877 | ) | -262 | % | |||||||
| Income from continuing operations, net of tax |
15,723 | 39,853 | (24,130 | ) | -61 | % | ||||||||
| Loss from discontinued operations, net of tax |
(129,783 | ) | (14,537 | ) | (115,246 | ) | 793 | % | ||||||
| Net (loss) income |
$ | (114,060 | ) | $ | 25,316 | (139,376 | ) | -551 | % | |||||
Net Revenue
CE Manufacturers
For the year ended December 31, 2008, revenue from the sale of our products and licensing of our patents to CE manufacturers increased significantly compared to the prior year. This was largely due to including revenue from products and services the Company obtained in the Gemstar acquisition. For the year ended December 31, 2008, legacy Macrovision revenue decreased by $9.2 million as compared to the prior year. This decrease was primarily due to the third quarter of 2007 including a significant set-top box licensing transaction.
Service Providers
For the year ended December 31, 2008, revenue from the sale of our products to service providers increased significantly compared to the prior year. This was largely due to including revenue from products and services the Company obtained in the Gemstar acquisition.
42
Table of Contents
Other
Other increased compared to the prior year primarily due to the Gemstar and the All Media Guide Holding, Inc. (“AMG”) acquisitions. The AMG acquisition occurred in December 2007. These increases were partially offset by a decrease in content protection revenues from entertainment studios, primarily due to price declines in new agreements.
Cost of Revenues
For the year ended December 31, 2008, cost of revenues increased from the prior year, primarily due to additional costs associated with products and services acquired in the Gemstar acquisition. Also contributing to the increase are costs associated with AMG, which was acquired in December 2007.
Research and Development
For the year ended December 31, 2008, research and development expenses increased from the prior year primarily due to additional costs related to the Gemstar operations as well as AMG and BD+ research and development activities.
Selling, General and Administrative
For the year ended December 31, 2008, selling, general and administrative increased from the same periods in the prior year, primarily due to additional costs associated with the Gemstar operations. Also contributing to the increase in general and administrative costs were costs associated with the integration of Gemstar and an increase in stock compensation expense.
Depreciation and Amortization
Depreciation and amortization increased from the same periods in the prior year due to the depreciation and amortization of intangible assets from the acquisitions of Gemstar, AMG and BD+ technology.
Restructuring and Asset Impairment Charges
During the year ended December 31, 2007, we implemented several restructuring programs. These programs included the termination of research and development programs, the abandonment of certain facilities, an organizational structure change and the termination of our Hawkeye anti-piracy service. As a result of such programs, we recorded an aggregate charge of $4.5 million for the year ended December 31, 2007 which included severance costs, asset impairment costs and contract cancellation costs.
Interest Expense
Interest expense increased compared to the same periods in the prior year due to the issuance of the $550 million Senior Secured Term Loan credit facility and the $100 million Senior Notes to finance the Gemstar acquisition.
Gain on Sale of Strategic Investment
During 2008, the Company sold its investment in Digimarc and recorded a gain of $5.2 million.
Impairment Loss on Strategic Investment
In 2006, the Company invested $5.0 million in a privately-held digital watermarking company. During the year ended December 31, 2007, the Company recorded a $5.0 million charge for other-than-temporary impairment losses related to such investment.
43
Table of Contents
Interest Income and Other, Net
Interest income and other, net decreased as compared to the prior year due to lower prevailing interest rates and lower average cash and investment balances.
Income Taxes
We recorded an income tax benefit of $23.4 million and income tax expense of $14.5 million for continuing operations for 2008 and 2007, respectively. This decrease from 2007 to 2008 was primarily a result of fluctuation in the geographic source of profits between the years and the reversal of accrued tax contingencies.
Loss from Discontinued Operations
Discontinued operations in 2008 includes Software, Games, eMeta, TV Guide Magazine, TV Guide Network, TV Guide Online and TVG Network. Discontinued operations in 2007 includes Software, Games and eMeta. The increase in the loss from discontinued operations is primarily due to $208.3 million in goodwill and intangible asset impairment charges related to TV Guide Network, TV Guide Online and TVG Network being recorded in 2008. These impairments were partially offset by $153.3 million in pre-tax net gains from the sale of our Software, Games and eMeta businesses.
Costs and Expenses
Cost of revenues consists primarily of service costs, patent prosecution, patent maintenance and patent litigation costs. Research and development expenses are comprised primarily of employee compensation and benefits, consulting costs, a 49% share of the Guideworks LLC joint venture and an allocation of overhead and facilities costs. The 49% share of the Guideworks LLC joint venture is accounted for as an operating expense. Selling and marketing expenses are comprised primarily of employee compensation and benefits, travel, advertising and an allocation of overhead and facilities costs. General and administrative expenses are comprised primarily of employee compensation and benefits, travel, accounting, tax and corporate legal fees and an allocation of overhead and facilities costs.
Critical Accounting Policies and Use of Estimates
The discussion and analysis of our financial condition and results of operations are based upon our consolidated financial statements. These consolidated financial statements have been prepared in accordance with the rules and regulations of the Securities and Exchange Commission. The preparation of these financial statements requires management to make estimates and judgments that affect the reported amounts of assets, liabilities, revenues and expenses, and related disclosure of contingent assets and liabilities. On an on-going basis, we evaluate our estimates, including those related to revenue recognition, allowance for doubtful accounts, equity-based compensation, goodwill and intangible assets, impairment of long lived assets and income taxes. Our estimates are based on historical experience and on various other assumptions that are believed to be reasonable under the circumstances. Actual results may differ from these estimates.
We have identified the accounting policies below as critical to our continuing business operations and the understanding of our results of operations.
Revenue Recognition
We recognize revenue when persuasive evidence of an arrangement exists, we have delivered the product or performed the service, the fee is fixed or determinable and collectability is reasonable assured. However, determining whether and when some of these criteria have been satisfied often involves assumptions and judgments that can have a significant impact on the timing and amount of revenue we report. For example, for
44
Table of Contents
multiple element arrangements we must make assumptions and judgments in order to allocate the total price among the various elements we must deliver, to determine whether undelivered services are essential to the functionality of the delivered products and services and to determine whether vendor-specific evidence of fair value exists for each undelivered element.
We license our proprietary IPG technology to CE manufacturers and to service providers. We generally recognize revenue from IPG product and patent licensing on a per-unit shipped model (with CE manufacturers) or a per subscriber model (with service providers). Our recognition of revenues from per-unit license fees is based on units reported shipped by the manufacturer. CE manufacturers normally report their unit shipments to us in the quarter immediately following that of actual shipment by the licensee. Revenues from per-subscriber fees are recognized in the period the services are provided by a licensee, as reported to us by the licensee. Revenues from annual or other license fees are recognized based on the specific terms of the license arrangement. For instance, certain IPG licensees enter into agreements for which they have the right to ship an unlimited number of units over a specified term for a flat fee. We record the fees associated with these arrangements on a straight-line basis over the specified term. We often enter into IPG patent license agreements in which we provide a licensee a release for past infringement as well as the right to ship an unlimited number of units over a future period for a flat fee. In this type of arrangement, we generally are not able to provide objective and reliable evidence of the fair value of the go-forward license arrangement (the undelivered element) and therefore would recognize all revenue for such agreement ratably over the term of the agreement.
Revenues from licensing our ACP technology are often generated from licensing agreements that pay a per-unit royalty fee for the shipment of DVDs and the shipment of digital set-top boxes. We rely on royalty reports from customers and/or third parties as the basis for revenue recognition, provided there is persuasive evidence of an arrangement and that collection of a fixed and determinable fee is considered probable. We have established significant experience and relationships with certain customers to reasonably estimate current period volume for purposes of making an accurate revenue accrual. Accordingly, royalty revenue from these customers is recognized as earned. Revenue from other customers is recognized as reported until such time that the Company can establish a basis for making reasonable estimates, in which case revenue is recognized on an as-earned basis. Licensees generally report activity within 30 to 60 days after the end of the month or quarter in which such activity takes place. Any unusual or unanticipated volumes in a particular period can add significant fluctuations on the revenue reported. We have also entered into agreements with certain entertainment studios for which they have the right to ship an unlimited number of DVDs that utilize our ACP technology over a specified term for a flat fee. We record the revenue associated with these arrangements on a straight-line basis over the specified term. In addition, we also enter into agreements with CE manufacturers in which they pay us a one-time fee for a perpetual license to our ACP technology. Provided that collectability is reasonable assured, we record revenue related to these agreements when the agreement is executed as we have no continuing obligation and the amounts are fixed and determinable.
Amounts for fees collected or invoiced and due relating to arrangements where revenue cannot be recognized are reflected on our balance sheet as deferred revenue and recognized when the applicable revenue recognition criteria are satisfied.
Allowance for Doubtful Accounts
We estimate the collectability of our accounts receivable on an account-by-account basis. We record an increase in the allowance for doubtful accounts when the prospect of collecting a specific account receivable becomes doubtful. We specifically analyze accounts receivable and historical bad debts experience, customer creditworthiness, current economic trends, international situations (such as currency devaluation), and changes in our customer payment history when evaluating the adequacy of the allowance for doubtful accounts. If the financial condition of our customers were to deteriorate, resulting in an impairment of their ability to make payments, additional allowances may be required.
45
Table of Contents
Equity-Based Compensation
We currently use the Black-Scholes option pricing model to determine the fair value of stock options and employee stock purchase plan shares. The fair value of equity-based payment awards on the date of grant is determined by using an option-pricing model using a number of complex and subjective variables. These variables include our expected stock price volatility over the term of the awards, actual and projected employee stock option exercise behaviors, risk-free interest rate and expected dividends. We estimate the volatility of our common stock by using a combination of historical volatility and implied volatility in market traded options.
The Black-Scholes option pricing model was developed for use in estimating the fair value of short-lived exchange traded options that have no vesting restrictions and are fully transferable. Existing valuation models, including the Black-Scholes and lattice binomial models, may not provide reliable measures of the fair values of our equity-based compensation. Consequently, there is a risk that our estimates of the fair values of our equity-based compensation awards on the grant dates may bear little resemblance to the actual values realized upon the exercise, expiration, early termination or forfeiture of those equity-based payments in the future. Certain equity-based payments, such as employee stock options, may expire worthless or otherwise result in zero intrinsic value as compared to the fair values originally estimated on the grant date and reported in our financial statements. Alternatively, value may be realized from these instruments that are significantly higher than the fair values originally estimated on the grant date and reported in our financial statements.
Classification and Fair Value Measurement of Auction Rate Securities
We hold investments in auction rate securities having contractual maturities of greater than one year and interest rate reset features of between 7 and 35 days. These auction rate securities were priced and subsequently traded as short-term investments because of the interest rate reset feature. As a result of recent adverse conditions in the financial markets, the auction rate securities we hold have failed to trade at recent auctions due to insufficient bids from buyers.
The fair values of these securities are estimated utilizing a discounted cash flow analysis or other type of valuation model rather than at par. These analyses are highly judgmental and consider, among other items, the likelihood of redemption, credit quality, duration, insurance wraps and expected future cash flows. These securities were also compared, when possible, to other observable market data with similar characteristics to the securities held by us.
Temporary declines in fair value for our available-for-sale auction rate securities, which we attribute to market liquidity issues rather than credit issues, are recorded in accumulated other comprehensive income. Any future fluctuation in fair value related to these instruments that we deem to be temporary, including any recoveries of previous write-downs, would be recorded to accumulated other comprehensive income. If we determine that any future valuation adjustment is other than temporary, we will record a charge to earnings as appropriate.
Goodwill and Other Intangible Assets
Goodwill represents the excess of cost over fair value of assets of an acquired business. Goodwill and intangible assets acquired in a business combination and determined to have an indefinite useful life are not amortized, but instead are tested for impairment at least annually. Intangible assets with estimable useful lives are amortized over their respective estimated useful lives.
Goodwill and intangible assets not subject to amortization are tested annually for impairment, and are tested for impairment more frequently if events and circumstances indicate that the assets might be impaired. In connection with our impairment analysis performed annually in our fourth quarter, we are required to perform an assessment of whether there is an indication that goodwill is impaired. To accomplish this, we are required to determine the carrying value of each reporting unit by assigning the assets and liabilities, including the existing
46
Table of Contents
goodwill and intangible assets, to those reporting units. We determine the fair value of each reporting unit using the discounted cash flow approach and a market based approach. To the extent the carrying amount of a reporting unit exceeds its fair value, we would be required to perform the second step of the impairment analysis, as this is an indication that the reporting unit goodwill may be impaired. In this step, we compare the implied fair value of the reporting unit goodwill with the carrying amount of the reporting unit goodwill. The implied fair value of goodwill is determined by allocating the fair value of the reporting unit to all of the assets (recognized and unrecognized) and liabilities of the reporting unit. The residual fair value after this allocation is the implied fair value of the reporting unit’s goodwill. To the extent the implied fair value of goodwill of each reporting unit is less than its carrying amount we would be required to recognize an impairment loss. The process of evaluating the potential impairment of goodwill is subjective and requires judgment at many points during the test including future revenue forecasts and discount rates.
Impairment of Long-Lived Assets
Long-lived assets, such as property and equipment, and purchased intangibles subject to amortization, are reviewed for impairment whenever events or changes in circumstances indicate that the carrying amount of an asset group may not be recoverable. Recoverability of assets to be held and used is measured by a comparison of the carrying amount of an asset group to estimated undiscounted future cash flows expected to be generated by the asset group. If the carrying amount of an asset group exceeds its estimated future cash flows, an impairment charge is recognized in the amount by which the carrying amount of the asset group exceeds the fair value of the asset group. Assets to be disposed of would be separately presented in the balance sheet and reported at the lower of the carrying amount or fair value less costs to sell, and would no longer be depreciated. The assets and liabilities of a disposal group classified as held for sale would be presented separately in the appropriate asset and liability sections of the balance sheet.
Income Taxes
We account for income taxes using the asset and liability method. Under this method, income tax expense is recognized for the amount of taxes payable or refundable for the current year and for deferred tax liabilities and assets for the future tax consequences of events that have been recognized in an entity’s financial statements or tax returns. We account for uncertainty in income taxes using the cumulative probability method. Management must make assumptions, judgments and estimates to determine our current provision for income taxes and also our deferred tax assets and liabilities and any valuation allowance to be recorded against a deferred tax asset. Our judgments, assumptions and estimates relative to the current provision take into account current tax laws, our interpretation of current tax laws and possible outcomes of current and future audits conducted by foreign and domestic tax authorities. Changes in tax law or our interpretation of tax laws and the resolution of current and future tax audits could significantly impact the amount provided for income taxes in our consolidated financial statements.
Liquidity and Capital Resources
Operations are financed primarily from cash generated by operations. Continuing operating activities provided net cash of $157.2 million and $55.4 million in the years ended December 31, 2009 and 2008, respectively. Cash provided by operating activities increased from the prior year primarily due to the Gemstar acquisition. The availability of cash generated by operations in the future could be affected by other business risks including, but not limited to, those factors set forth under the caption “Risk Factors”.
Net cash provided by investing activities from continuing operations for the year ended December 31, 2009, was $214.7 million and included $266.2 million in cash received from the sale of the Media Properties, partially offset by $36.8 million of proceeds being classified as restricted cash (see below), $19.8 million in capital expenditures and $24.0 million used to acquire Muze and a music metadata distribution business in the Asia Pacific region. Included in the 2008 investing activities were $911.2 million in cash used for the Gemstar
47
Table of Contents
acquisition and $195.9 million in cash received from the sale of Software and Games. We anticipate that capital expenditures to support the growth of our business and strengthen our operations infrastructure will be between $15 million and $20 million in 2010.
Net cash used in financing activities from continuing operations was $407.5 million for the year ended December 31, 2009, primarily due to us making $440 million in debt payments, partially offset by the receipt of $32.8 million in cash from the exercise of employee stock options and shares purchased under the employee stock purchase plan. Included in the 2008 financing activities was $615.4 million in proceeds from the issuance of debt, net of issuance costs, which was used to fund the Gemstar acquisition.
Included on our balance sheet at December 31, 2009, is $36.8 million in restricted cash. As part of the sale of TV Guide Network and TV Guide Online, we deposited this cash in an escrow account in the event the buyer has an indemnifiable claim. We currently expect the cash remaining in the escrow account will be released to us in May 2010.
In connection with the Gemstar acquisition, we entered into and fully drew-down the $550 million Term Loan. As of December 31, 2009, $207.2 million was outstanding. The Term Loan is guaranteed by our domestic subsidiaries, and the assets and shares of our domestic subsidiaries are pledged as collateral against the Term Loan. We are required to use the proceeds from asset sales of $75 million or more to pay down the Term Loan; proceeds from assets sales of less than $75 million may be retained for investment in fixed or capital assets. Beginning in 2010, the Company is required to make a payment on the Term Loan each February. This payment is a percentage, as calculated per the Term Loan agreement, of the prior years Excess Cash Flow, as defined in the Term Loan agreement. The required payment for 2010 is $18.5 million.
We may elect to pay interest on the Term Loan at a rate of (i) Libor plus 3.75%, with a Libor floor of 3.5% or (ii) the Term Loan administrative agent’s prime rate plus 2.75%. The Term Loan includes customary covenants, including total leverage ratio limits, fixed charge coverage minimums and restrictions on additional debt incurrence and dividend payments among others. As of December 31, 2009, we were in compliance with the Term Loan debt covenants.
In the event (i) our leverage ratio is greater than 2.5 to 1.0, and (ii) more than $50 million in aggregate principal amount of the 2.625% convertible senior notes due 2011 (the “Convertible Notes”) is still outstanding, and (iii) the scheduled maturity of such Convertible Notes is more than 181 days in the future, then our Term Loan will become due on that 182nd day prior to the maturity date of such Convertible Notes.
In connection with the Gemstar acquisition we issued $100 million of 11% Senior Notes due 2013. On August 5, 2009, the Company fully redeemed the 11% Senior Notes at par plus accrued interest and a $2.8 million make-whole payment representing the discounted value of interest which the note holders would have received through November 15, 2009, the first date the 11% Senior Notes could be retired without a premium.
In August 2006, we issued $240.0 million in Convertible Notes which may be converted, under certain circumstances described below, based on an initial conversion rate of 35.3571 shares of common stock per $1,000 principal amount of notes (which represents an initial conversion price of approximately $28.28 per share).
Prior to June 15, 2011, holders may convert their Convertible Notes into cash and our common stock, at the applicable conversion rate, under any of the following circumstances: (i) during any fiscal quarter after the calendar quarter ending September 30, 2006, if the last reported sale price of our common stock for at least 20 trading days during the 30 consecutive trading days ending on the last trading day of the immediately preceding calendar quarter is greater than or equal to 120% of the applicable conversion price in effect on the last trading day of the immediately preceding fiscal quarter; (ii) during the five business-day period after any ten consecutive trading-day period (the “measurement period”) in which the trading price per note for each day of such measurement period was less than 98% of the product of the last reported sale price of our common stock and the
48
Table of Contents
conversion rate on each such day; or (iii) upon the occurrence of specified corporate transactions, as defined in the indenture. From June 15, 2011, until the close of business on the scheduled trading day immediately preceding the maturity date of August 15, 2011, holders may convert their Convertible Notes into cash and shares of our common stock, if any, at the applicable conversion rate, at any time, regardless of the foregoing circumstances.
Upon conversion, a holder will receive the conversion value of the Convertible Notes converted equal to the conversion rate multiplied by the volume weighted average price of our common stock during a specified period following the conversion date. The conversion value of each Convertible Note will be paid in: (i) cash equal to the lesser of the principal amount of the Convertible Note or the conversion value, as defined, and (ii) to the extent the conversion value exceeds the principal amount of the Convertible Note, a combination of common stock and cash. In addition, upon a fundamental change at any time, as defined, the holders may require us to repurchase for cash all or a portion of their Convertible Notes upon a “designated event” at a price equal to 100% of the principal amount of the Convertible Notes being repurchased plus accrued and unpaid interest, if any.
In September 2007, the Board of Directors of Macrovision Corporation authorized a stock repurchase program, which allows us to purchase up to $60.0 million of our common stock in the open market from time to time at prevailing market prices or otherwise, as conditions warrant. On May 5, 2008, our Board of Directors reconfirmed this stock purchase program. During the fourth quarter of 2008, we repurchased 2.3 million shares of common stock for approximately $25.1 million. These repurchases were recorded as treasury stock and resulted in a reduction of stockholders’ equity. As of December 31, 2009, treasury stock consisted of 2.3 million shares of common stock that had been repurchased, with a cost basis of approximately $25.1 million.
As of December 31, 2009, we had $165.4 million in cash and cash equivalents, $107.4 million in short-term investments, $26.7 million in long-term marketable securities and $36.8 million in restricted cash.
As of December 31, 2009, approximately 80% of our cash, cash equivalents and marketable securities are held by our non-U.S. subsidiaries and would be subject to U.S. income tax if these amounts were repatriated. We believe that our current domestic cash, cash equivalents and marketable securities and our annual domestic cash flow from operations will be sufficient to meet our domestic working capital, capital expenditure and debt requirements for the foreseeable future.
Included in short-term investments and long-term marketable securities are auction rate securities with a fair value of $67.2 million and par value of $74.8 million. Our auction rate securities portfolio is solely comprised of AAA rated federally insured student loans and municipal and educational authority bonds. However, the auction rate securities we hold have failed to trade at recent auctions due to insufficient bids from buyers. This limits the short-term liquidity of these instruments and may limit our ability to liquidate and fully recover the carrying value of our auction rate securities if we needed to convert some or all to cash in the near term. Included in the above are auction rate securities acquired through UBS AG with a par value of $57.7 million. In December 2008, we entered into an agreement with UBS AG which provides (i) us the right to sell these auction rate securities back to UBS AG at par, at our sole discretion, anytime during the period from June 30, 2010, through July 2, 2012, and (ii) UBS AG the right to purchase these auction rate securities or sell them on our behalf at par anytime through July 2, 2012.
We believe that based upon our cash and cash equivalents, the put option described above relating to our auction rate securities acquired through UBS AG and our remaining short-term investment balances, the current lack of liquidity in the auction rate securities market will not have a material impact on our liquidity or our ability to fund our operations.
We believe that our current cash, cash equivalents and marketable securities and our annual cash flow from operations will be sufficient to meet our working capital, capital expenditure and debt requirements for the foreseeable future.
49
Table of Contents
Discontinued Operations
The collective results from all discontinued operations were as follows (in thousands):
| Year Ended December 31, | ||||||||||||
| 2009 | 2008 | 2007 | ||||||||||
| Net revenue: |
||||||||||||
| Software |
$ | — | $ | 27,503 | $ | 112,914 | ||||||
| Games |
— | 1,633 | 9,177 | |||||||||
| eMeta |
— | 6,222 | 10,742 | |||||||||
| TV Guide Magazine |
— | 70,072 | — | |||||||||
| TV Guide Network / TV Guide Online |
20,319 | 85,656 | — | |||||||||
| TVG Network |
2,616 | 38,145 | — | |||||||||
| Pre-tax (loss) income |
||||||||||||
| Software |
$ | — | $ | (7,187 | ) | $ | 11,701 | |||||
| Games |
— | (2,551 | ) | (33,215 | ) | |||||||
| eMeta |
— | (11,630 | ) | (3,396 | ) | |||||||
| TV Guide Magazine |
— | (13,422 | ) | — | ||||||||
| TV Guide Network / TV Guide Online |
1,825 | (126,610 | ) | — | ||||||||
| TVG Network |
(694 | ) | (67,859 | ) | — | |||||||
| Pre-tax (loss) gain on disposal of business units |
(3,661 | ) | 153,273 | — | ||||||||
| Income tax (expense) benefit |
(31,716 | ) | (53,797 | ) | 10,373 | |||||||
| Loss from discontinued operations, net of tax |
$ | (34,246 | ) | $ | (129,783 | ) | $ | (14,537 | ) | |||
Our Software business focused on independent software vendors and enterprise IT departments with solutions including the FLEXnet suite of electronic license management, electronic license delivery and software asset management products; InstallShield and other installer products; and AdminStudio software packaging tools. The sale of our Software business closed in April 2008.
Our Games business focused on providing tools and services needed to facilitate the digital distribution of providers of digital goods. Games pre-tax loss in 2007 included $13.2 million of restructuring charges and asset impairment charges. The sale of our Games business closed in April 2008.
eMeta provided software solutions that enable companies to manage and sell digital goods and services online. eMeta pre-tax loss in 2008 included $6.7 million in goodwill and intangible asset impairment charges. The sale of eMeta closed in November 2008.
TV Guide Magazine’s weekly publication was centered on TV-related news, feature stories, TV celebrity photos, behind-the-scenes coverage, reviews and recommendations and national television listings. The sale of TV Guide Magazine closed in December 2008.
TVG Network generated revenue primarily from wagering and licensing fees. TVG Network pre-tax loss in 2008 included $70.0 million in goodwill and intangible asset impairment charges. The sale of TVG Network closed in January 2009.
TV Guide Network and TV Guide Online generated revenue primarily from advertising and carriage fees. TV Guide Network and TV Guide Online pre-tax loss in 2008 included $138.3 million in goodwill and intangible asset impairment charges. The sale of TV Guide Network and TV Guide Online closed in February 2009.
50
Table of Contents
Contractual Obligations
The following table summarizes Rovi’s contractual obligations at December 31, 2009 (in thousands):
| Payments due by period | |||||||||||||||
| Contractual Obligations (3) |
Total | Less Than 1 year |
1-3 years | 3-5 years | More Than 5 years | ||||||||||
| Long-term debt obligations (1) |
$ | 447,248 | $ | 18,486 | $ | 240,000 | $ | 188,762 | $ | — | |||||
| Interest expense associated with long-term debt obligations |
48,996 | 17,562 | 28,641 | 2,793 | — | ||||||||||
| Contractual obligations |
9,650 | 5,559 | 4,091 | — | — | ||||||||||
| Operating lease obligations (2) |
95,876 | 18,969 | 29,554 | 21,692 | 25,661 | ||||||||||
| $ | 601,770 | $ | 60,576 | $ | 302,286 | $ | 213,247 | $ | 25,661 | ||||||
| (1) | Includes current portion as well. The Convertible Notes may be converted by the note holders prior to their maturity under certain circumstances. In addition, the Term Loan also requires the Company to make a payment each February based on the prior years Excess Cash Flow, as defined in the Term Loan agreement. See above for additional details. |
| (2) | Operating leases in the above table have been included on a gross basis. The Company has agreements to receive approximately $29.5 million under operating subleases. |
| (3) | We are unable to reliably estimate the timing of future payments related to uncertain tax positions, therefore, $80.7 million of income taxes payable has been excluded from the table above. |
Recently Issued Accounting Pronouncements
See Note 1 to the Consolidated Financial Statements.
| ITEM 7A. | QUANTITATIVE AND QUALITATIVE DISCLOSURES ABOUT MARKET RISK |
We are exposed to financial market risks, including changes in interest rates, foreign currency exchange rates and security investments. Changes in these factors may cause fluctuations in our earnings and cash flows. We evaluate and manage the exposure to these market risks as follows:
Fixed Income Investments: We have an investment portfolio of money market funds and fixed income securities, including those classified as cash equivalents, short-term investments and long-term marketable investment securities of $256.9 million as of December 31, 2009. Most of these securities are subject to interest rate fluctuations. An increase in interest rates could adversely affect the market value of our fixed income securities while a decrease in interest rates could adversely affect the amount of interest income we receive.
Our investment portfolio consists principally of investment grade municipal bonds, money market mutual funds, U.S. Treasury and agency securities, corporate bonds, commercial paper and auction rate securities. We regularly monitor the credit risk in our investment portfolio and take appropriate measures to manage such risks prudently in accordance with our investment policies.
As a result of adverse conditions in the financial markets, auction rate securities may present risks arising from liquidity and/or credit concerns. At December 31, 2009, the fair value of our auction rate securities portfolio totaled approximately $67.2 million. Our auction rate securities portfolio is comprised solely AAA rated federally insured student loans, municipal and educational authority bonds. The auction rate securities we hold have failed to trade for over one year due to insufficient bids from buyers. This limits the short-term liquidity of these securities.
Included in the aforementioned securities are auction rate securities acquired through UBS AG with a par value of $57.7 million. Due to the failure of the auction rate market in early 2008, UBS and other major banks entered into discussions with governmental agencies to provide liquidity to owners of auction rate securities. In
51
Table of Contents
December 2008, the Company entered into an agreement with UBS which provides (1) the Company the right to sell these auction rate securities back to UBS AG at par, at the Company’s sole discretion, anytime during the period from June 30, 2010 through July 2, 2012, and (2) UBS AG the right to purchase these auction rate securities or sell them on the Company’s behalf at par anytime through July 2, 2012.
We do not use derivative financial instruments in our investment portfolio to manage interest rate risk. We limit our exposure to interest rate and credit risk, however, by establishing and strictly monitoring clear policies and guidelines for our fixed income portfolios. The primary objective of these policies is to preserve principal while at the same time maximizing yields, without significantly increasing risk. A hypothetical 50 basis point increase in interest rates would result in a $0.2 million decrease in the fair value of our fixed income available-for-sale securities as of December 31, 2009.
While we cannot predict future market conditions or market liquidity, we believe that our investment policies provide an appropriate means to manage the risks in our investment portfolio.
Foreign Currency Exchange Rates. Due to our reliance on international and export sales, we are subject to the risks of fluctuations in currency exchange rates. Because a substantial majority of our international and export revenues, as well as expenses, are typically denominated in U.S. dollars, fluctuations in currency exchange rates could cause our products to become relatively more expensive to customers in a particular country, leading to a reduction in sales or profitability in that country. Many of our subsidiaries operate in their local currency, which mitigates a portion of the exposure related to the respective currency collected.
Indebtedness. The Company has two debt instruments outstanding: a $550 million Senior Credit Facility Term Loan (current balance outstanding $207.2 million) and $240 million in Convertible Notes. The terms of these debt instruments are more fully described in Note 6 to the Consolidated Financial Statements.
| ITEM 8. | FINANCIAL STATEMENTS AND SUPPLEMENTARY DATA |
The information required by this item is submitted in a separate section of this report beginning on F-1 of this report.
| ITEM 9. | CHANGES IN AND DISAGREEMENTS WITH ACCOUNTANTS ON ACCOUNTING AND FINANCIAL DISCLOSURE |
None.
| ITEM 9A. | CONTROLS AND PROCEDURES |
Evaluation of Disclosure Controls and Procedures
Under the supervision and with the participation of our management, including our chief executive officer and our chief financial officer, we conducted an evaluation of our disclosure controls and procedures, as such term is defined under Exchange Act Rule 13a-15(e). Based on this evaluation, our chief executive officer and our chief financial officer concluded that our disclosure controls and procedures were effective as of the end of the period covered by this annual report.
Management’s Report on Internal Control Over Financial Reporting
Our management is responsible for establishing and maintaining an adequate system of internal control over financial reporting. Our internal control over financial reporting includes those policies and procedures that:
| • | pertain to the maintenance of records that, in reasonable detail, accurately and fairly reflect the transactions and dispositions of our assets; |
52
Table of Contents
| • | provide reasonable assurance that transactions are recorded as necessary to permit preparation of our financial statements in accordance with generally accepted accounting principles in the United States, and that our receipts and expenditures are being made only in accordance with authorizations of our management and directors; and |
| • | provide reasonable assurance regarding prevention or timely detection of unauthorized acquisition, use or disposition of our assets that could have a material effect on the financial statements. |
Our management assessed the effectiveness of our system of internal control over financial reporting as of December 31, 2009. In making this assessment, we used the framework in Internal Control—Integrated Framework issued by the Committee of Sponsoring Organizations of the Treadway Commission (“COSO”). Based on our assessment and the criteria set forth by COSO, we believe that Rovi maintained effective internal control over financial reporting as of December 31, 2009.
The effectiveness of our internal control over financial reporting as of December 31, 2009 has been audited by Ernst & Young LLP, an independent registered public accounting firm, as stated in their report which is included herein.
Inherent Limitations on Effectiveness of Controls
Our system of internal control over financial reporting was designed to provide reasonable assurance regarding the reliability of financial reporting and the preparation of financial statements for external purposes in accordance with accounting principles generally accepted in the United States.
All internal control systems, no matter how well designed and operated, can provide only reasonable assurance with respect to financial statement preparation and presentation. Our management does not expect that our disclosure controls and procedures will prevent all error and fraud. Further, the design of a control system must reflect the fact that there are resource constraints, and the benefits of controls must be considered relative to their costs. Because of the inherent limitations in all control systems, no evaluation of controls can provide absolute assurance that all control issues within the company have been detected, even with respect to those systems of internal control that are determined to be effective. These inherent limitations include the realities that judgments in decision-making can be faulty, and that breakdown can occur because of simple error or mistake. The design of any system of controls also is based in part upon certain assumptions about the likelihood of future events, and there can be no assurance that any design will succeed in achieving its stated goals under all potential future conditions. Over time, controls may become inadequate because of changes in conditions, or the degree of compliance with the policies or procedures may deteriorate. Because of these inherent limitations in a cost-effective control system, misstatements due to error or fraud may occur and not be detected. Our system contains self monitoring mechanisms, and actions are taken to correct deficiencies as they are identified.
Audit Committee Oversight
The Audit Committee of the Board of Directors, which is comprised solely of independent directors, has oversight responsibility for our financial reporting process and the audits of our consolidated financial statements and internal control over financial reporting. The Audit Committee meets regularly with management and with our internal auditors and independent registered public accounting firm (collectively, the “accountants”) to review matters related to the quality and integrity of our financial reporting, internal control over financial reporting (including compliance matters related to our Code of Personal and Business Conduct and Ethics), and the nature, extent, and results of internal and external audits. Our accountants have full and free access and report directly to the Audit Committee. The Audit Committee recommended, and the Board of Directors approved, that the audited consolidated financial statements be included in this Annual Report on Form 10-K.
Changes in Internal Control Over Financial Reporting
During the quarter ended December 31, 2009, there have been no changes in our internal controls over financial reporting that have materially affected, or are reasonably likely to materially affect, these controls.
53
Table of Contents
Report of Independent Registered Public Accounting Firm
The Board of Directors and Stockholders
Rovi Corporation
We have audited Rovi Corporation and subsidiaries’ internal control over financial reporting as of December 31, 2009, based on criteria established in Internal Control—Integrated Framework issued by the Committee of Sponsoring Organizations of the Treadway Commission (the COSO criteria). Rovi Corporation and subsidiaries’ management is responsible for maintaining effective internal control over financial reporting, and for its assessment of the effectiveness of internal control over financial reporting included in the accompanying Management’s Report on Internal Control Over Financial Reporting appearing under Item 9A. Our responsibility is to express an opinion on the company’s internal control over financial reporting based on our audit.
We conducted our audit in accordance with the standards of the Public Company Accounting Oversight Board (United States). Those standards require that we plan and perform the audit to obtain reasonable assurance about whether effective internal control over financial reporting was maintained in all material respects. Our audit included obtaining an understanding of internal control over financial reporting, assessing the risk that a material weakness exists, testing and evaluating the design and operating effectiveness of internal control based on the assessed risk, and performing such other procedures as we considered necessary in the circumstances. We believe that our audit provides a reasonable basis for our opinion.
A company’s internal control over financial reporting is a process designed to provide reasonable assurance regarding the reliability of financial reporting and the preparation of financial statements for external purposes in accordance with generally accepted accounting principles. A company’s internal control over financial reporting includes those policies and procedures that (1) pertain to the maintenance of records that, in reasonable detail, accurately and fairly reflect the transactions and dispositions of the assets of the company; (2) provide reasonable assurance that transactions are recorded as necessary to permit preparation of financial statements in accordance with generally accepted accounting principles, and that receipts and expenditures of the company are being made only in accordance with authorizations of management and directors of the company; and (3) provide reasonable assurance regarding prevention or timely detection of unauthorized acquisition, use, or disposition of the company’s assets that could have a material effect on the financial statements.
Because of its inherent limitations, internal control over financial reporting may not prevent or detect misstatements. Also, projections of any evaluation of effectiveness to future periods are subject to the risk that controls may become inadequate because of changes in conditions, or that the degree of compliance with the policies or procedures may deteriorate.
In our opinion, Rovi Corporation and subsidiaries maintained, in all material respects, effective internal control over financial reporting as of December 31, 2009, based on the COSO criteria.
We also have audited, in accordance with the standards of the Public Company Accounting Oversight Board (United States), the consolidated balance sheets of Rovi Corporation and subsidiaries as of December 31, 2009 and 2008, and the related consolidated statements of operations, stockholders’ equity and comprehensive income (loss), and cash flows for each of the two years in the period ended December 31, 2009 of Rovi Corporation and subsidiaries and our report dated February 12, 2010 expressed an unqualified opinion thereon.
/s/ Ernst & Young LLP
Los Angeles, California
February 12, 2010
54
Table of Contents
| ITEM 9B. | OTHER INFORMATION |
None.
| ITEM 10. | DIRECTORS, EXECUTIVE OFFICERS AND CORPORATE GOVERNANCE |
The information regarding directors, the Company’s Audit Committee, Corporate Governance and Nominating Committee, stockholder nominations to our Board, and Section 16(a) beneficial ownership reporting compliance is incorporated herein by reference to our definitive proxy statement to be filed with the Securities and Exchange Commission within 120 days after the close of our fiscal year ended December 31, 2009. The information regarding executive officers appears under the heading “Executive Officers of the Registrant” in Item 1 of this Form 10-K and is also incorporated by reference in this section.
Code of Conduct. In February 2004, we adopted our Code of Personal and Business Conduct and Ethics (the “Code of Conduct”) as required by applicable securities laws, rules of the SEC and the listing standards of Nasdaq. The Code of Conduct applies to all of our directors and employees, including the principal executive officer, principal financial officer and principal accounting officer. A copy of such code of conduct and ethics was filed as an Exhibit to our Annual Report on Form 10-K for the year ended December 31, 2003. If we make any substantive amendments to the code of conduct and ethics or grant any waiver, including implicit waiver, from a provision of the code of conduct and ethics to our principal executive officer, principal financial officer or principal accounting officer, we will disclose the nature of such amendment or waiver on our website at www.rovicorp.com or in a current report on Form 8-K that will be publicly filed.
Corporate Governance Guidelines and Committee Charters. In February 2009, we adopted amended Corporate Governance Guidelines to assist the Board in following corporate practices that serve the best interest of the company and its stockholders. Our Corporate Governance Guidelines and the charters of each of our audit committee, compensation committee and corporate governance and nominating committee are available at our website at www.rovicorp.com.
| ITEM 11. | EXECUTIVE COMPENSATION |
Information for this item is incorporated herein by reference to our definitive proxy statement to be filed with the Securities and Exchange Commission within 120 days after the close of our fiscal year ended December 31, 2009.
| ITEM 12. | SECURITY OWNERSHIP OF CERTAIN BENEFICIAL OWNERS AND MANAGEMENT AND RELATED STOCKHOLDER MATTERS |
Information for this item is incorporated herein by reference to our definitive proxy statement to be filed with the Securities and Exchange Commission within 120 days after the close of our fiscal year ended December 31, 2009.
| ITEM 13. | CERTAIN RELATIONSHIPS AND RELATED TRANSACTIONS, AND DIRECTOR INDEPENDENCE |
Information for this item is incorporated herein by reference to our definitive proxy statement to be filed with the Securities and Exchange Commission within 120 days after the close of our fiscal year ended December 31, 2009.
| ITEM 14. | PRINCIPAL ACCOUNTANT FEES AND SERVICES |
Information for this item is incorporated herein by reference to our definitive proxy statement to be filed with the Securities and Exchange Commission within 120 days after the close of our fiscal year ended December 31, 2009.
55
Table of Contents
| ITEM 15. | EXHIBITS AND FINANCIAL STATEMENT SCHEDULES |
| (a) | The following documents are filed as part of this report: |
| 1. | Financial Statements |
| Page | ||||
| • | F-2 | |||
| • | F-4 | |||
| • | F-5 | |||
| • | Consolidated Statements of Stockholders’ Equity and Comprehensive Income (Loss) |
F-6 | ||
| • | F-7 | |||
| • | F-8 |
| 2. | Financial Statement Schedules |
All schedules are either included in the Notes to Consolidated Financial Statements or are omitted because they are not applicable.
| 3. | Exhibits |
Exhibits
| Exhibit |
Exhibit Description |
Incorporated by Reference |
Filed | |||||||
| Form |
Date |
Number |
||||||||
| 2.01 | Agreement and Plan of Merger dated November 5, 2007 by and among Macrovision Corporation, Aspen Acquisition Corp., All Media Guide Holdings, Inc., Digital On-Demand, Inc. (a Delaware corporation), and Digital On-Demand, Inc. (a California corporation) as Representative | 8-K | 11/9/07 | 10.1 | ||||||
| 2.02 | Asset Purchase Agreement dated November 17, 2007 by and among Macrovision Corporation, Macrovision International Holding Limited Partnership and Cryptography Research, Inc. | 8-K/A | 12/18/07 | 10.1 | ||||||
| 2.03 | Agreement and Plan of Mergers, dated as of December 6, 2007, among Macrovision Corporation, Saturn Holding Corp, Galaxy Merger Sub, Inc., Mars Merger Sub, Inc. and Gemstar-TV Guide International, Inc | 8-K | 5/5/08 | 2.1 | ||||||
| 2.04 | Company Voting and Support & Registration Rights Agreement, dated as of December 6, 2007, among News Corporation, Saturn Holding Corp and Macrovision Corporation | 425 | 12/7/07 | 2.02 | ||||||
| 2.05 | Asset Purchase Agreement dated February 13, 2008 by and among Macrovision Corporation and Flexco Holding Company, Inc. (a Delaware corporation later renamed Flexera Software Inc.). | 8-K | 2/21/08 | 10.1 | ||||||
56
Table of Contents
| Exhibit |
Exhibit Description |
Incorporated by Reference |
Filed | |||||||
| Form |
Date |
Number |
||||||||
| 2.06 | Asset Purchase Agreement dated October 10, 2008 by and among TV Guide Magazine Group, Inc., Sample Media, LLC, and, solely with respect to Sections 2.7, 6.2 and 6.3, Macrovision Solutions Corporation | 8-K | 10/14/08 | 10.1 | ||||||
| 2.07 | Equity Purchase Agreement dated January 5, 2009, by and among Gemstar-TV Guide International, Inc., TV Guide Entertainment Group, Inc., UV Corporation, Macrovision Solutions Corporation, and Lions Gate Entertainment, Inc. | 8-K | 1/9/09 | 10.1 | ||||||
| 3.01 | Certificate of Incorporation of Rovi Corporation, as amended, on July 15, 2009 | 8-K | 8/6/09 | 3.01 | ||||||
| 3.02 | Bylaws of Macrovision Solutions Corporation | 424B3 | 4/1/08 | Annex G | ||||||
| 4.01 | Indenture, dated August 23, 2006 among Macrovision Corporation and The Bank of New York Trust Company, N.A. | 8-K | 8/23/06 | 4.1 | ||||||
| 4.02 | Global Note representing the Macrovision Corporation 2.625% Convertible Senior Notes due 2011 | 8-K | 8/23/06 | 4.2 | ||||||
| 4.03 | Call Option Transaction Letter Agreement dated August 23, 2006 from JPMorgan Chase Bank, National Association to Macrovision Corporation. | 8-K | 5/5/08 | 4.4 | ||||||
| 4.04 | Warrant Letter Agreement dated August 23, 2006 from JPMorgan Chase Bank, National Association to Macrovision Corporation. | 8-K | 5/5/08 | 4.5 | ||||||
| 4.05 | Form of Common Stock Certificate | S-3 | 7/15/08 | 4.1 | ||||||
| 4.06 | Non-Contingent Warrant to Purchase Macrovision Common Stock with Cryptography Research, Inc. | 10-K/A | 2/29/08 | 4.06 | ||||||
| 10.01 | Credit Agreement, dated May 2, 2008, among Macrovision Solutions Corporation, Macrovision Corporation, the Guarantors party thereto, the Lenders party thereto, J.P. Morgan Securities Inc., Merrill Lynch, Pierce, Fenner & Smith Incorporated and JPMorgan Chase Bank, N.A. | 8-K | 5/5/08 | 10.2 | ||||||
| 10.02 | Amendment No. 1 dated August 4, 2009, to the Credit Agreement, dated as of May 2, 2008, among Macrovision Solutions Corporation, Macrovision Corporation, the Guarantors party thereto, the Lenders party thereto, J.P. Morgan Securities Inc., Merrill Lynch, Pierce, Fenner & Smith Incorporated and JPMorgan Chase Bank, N.A. | 8-K | 8/6/09 | 10.1 | ||||||
| 10.03 | Registration Rights Agreement, dated August 23, 2006, among Macrovision Corporation, J.P. Morgan Securities Inc. and Cowen and Company, LLC | 8-K | 8/23/06 | 10.1 | ||||||
57
Table of Contents
| Exhibit |
Exhibit Description |
Incorporated by Reference |
Filed | |||||||
| Form |
Date |
Number |
||||||||
| 10.04 | Rovi Corporation 2008 Equity Incentive Plan** | S-8 | 7/23/08 | 10.01 | ||||||
| 10.05 | Rovi Corporation 2008 Employee Stock Purchase Plan** | S-8 | 7/23/08 | 10.02 | ||||||
| 10.06 | Rovi Corporation 2000 Equity Incentive Plan** | DEF14A | 3/16/06 | Annex A | ||||||
| 10.07 | Form of Notice of Stock Option Grant/Nonstatutory Stock Option Agreement (U.S.) pursuant to 2008 Equity Incentive Plan | 10-Q | 11/6/08 | 10.04 | ||||||
| 10.08 | Form of Notice of Stock Option Grant/Nonstatutory Stock Option Agreement (Director grant form) pursuant to 2008 Equity Incentive Plan | 10-Q | 11/6/08 | 10.05 | ||||||
| 10.09 | Form of Notice of Restricted Stock Award/Restricted Stock Award Agreement (U.S.) pursuant to 2008 Equity Incentive Plan | 10-Q | 11/5/09 | 10.6 | ||||||
| 10.10 | 2009 Senior Executive Company Incentive Plan** | 8-K | 2/11/09 | 10.01 | ||||||
| 10.11 | Lease Between WB Airport Technology, L.L.C. (“Landlord”) and Macrovision Corporation (“Tenant”) dated August 2, 2001 | 10-Q | 11/13/01 | 10.39 | ||||||
| 10.12 | First Amendment to Lease between WB Airport Technology, L.L.C. (“Landlord”) and Macrovision Corporation (“Tenant”) dated December 13, 2004 | 10-K | 3/31/05 | 10.09 | ||||||
| 10.13 | Second Amendment to Lease between WB Airport Technology, L.L.C. (“Landlord”) and Macrovision Corporation (“Tenant”) dated December 13, 2004 | 10-K | 3/31/05 | 10.10 | ||||||
| 10.14 | Lease between WB Airport Technology, L.L.C. (“Landlord”) and Macrovision Corporation (“Tenant”) dated December 13, 2004 | 10-K | 3/31/05 | 10.11 | ||||||
| 10.15 | Form of Indemnification Agreement entered into by Rovi Corporation with each of its directors and executive officers | 10-K | 3/2/09 | 10.15 | ||||||
| 10.16 | Executive Severance and Arbitration Agreement with Alfred J. Amoroso dated August 6, 2007** | 8-K | 8/7/07 | 10.1 | ||||||
| 10.17 | Executive Severance and Arbitration Agreement with James Budge dated August 6, 2007** | 10-Q | 8/8/07 | 10.06 | ||||||
| 10.18 | Form of Executive Severance and Arbitration Agreement ** | 10-Q | 8/8/07 | 10.05 | ||||||
| 10.19 | Executive Severance and Arbitration Agreement with Thomas Carson dated December 21, 2009** | 8-K | 12/24/09 | 10.01 | ||||||
| 10.20 | Charter of the Audit Committee of the Board of Directors | X | ||||||||
| 10.21 | Summary of 2009 Director Compensation** | 10-K | 3/2/09 | 10.21 | ||||||
58
Table of Contents
| Incorporated by Reference |
Filed | |||||||||
| Exhibit |
Exhibit Description |
Form |
Date |
Number |
||||||
| 14.01 | Code of Personal and Business Conduct and Ethics | 10-K | 3/12/04 | 14.01 | ||||||
| 21.01 | List of subsidiaries | X | ||||||||
| 23.01 | Consent of Ernst & Young LLP, Independent Registered Public Accounting Firm | X | ||||||||
| 23.02 | Consent of KPMG LLP, Independent Registered Public Accounting Firm | X | ||||||||
| 31.01 | Certification of Chief Executive Officer pursuant to Section 302 of the Sarbanes-Oxley Act of 2002 | X | ||||||||
| 31.02 | Certification of Chief Financial Officer pursuant to Section 302 of the Sarbanes-Oxley Act of 2002 | X | ||||||||
| 32.01 | Section 1350 Certification | X | ||||||||
| 32.02 | Section 1350 Certification | X | ||||||||
| ** | Management contract or compensatory plan or arrangement. |
59
Table of Contents
Pursuant to the requirements of Section 13 or 15(d) of the Securities Exchange Act of 1934, the registrant caused this report to be signed on its behalf by the undersigned thereunto duly authorized on this 12th day of February, 2010.
| ROVI CORPORATION | ||
| By: | /S/ ALFRED J. AMOROSO | |
| Alfred J. Amoroso | ||
| President and Chief Executive Officer | ||
Pursuant to the requirements of the Securities Exchange Act of 1934, this report has been signed below by the following persons on behalf of the registrant, and in the capacities and on the date indicated.
| Name |
Title |
Date | ||
| Principal Executive Officer: |
||||
| /S/ ALFRED J. AMOROSO Alfred J. Amoroso |
President, Chief Executive Officer and Director | February 12, 2010 | ||
| Principal Financial Officer: |
||||
| /S/ JAMES BUDGE James Budge |
Chief Financial Officer | February 12, 2010 | ||
| Principal Accounting Officer: |
||||
| /S/ PETER C. HALT Peter C. Halt |
Chief Accounting Officer | February 12, 2010 | ||
| Additional Directors: |
||||
| /S/ ANDREW K. LUDWICK Andrew K. Ludwick |
Chairman of the Board of Directors | February 12, 2010 | ||
| /S/ ALAN L. EARHART Alan L. Earhart |
Director | February 12, 2010 | ||
| /S/ ROBERT J. MAJTELES Robert J. Majteles |
Director | February 12, 2010 | ||
| /S/ JAMES E. MEYER James E. Meyer |
Director | February 12, 2010 | ||
| /S/ JAMES P. O’SHAUGHNESSY James P. O’Shaughnessy |
Director | February 12, 2010 | ||
| /S/ RUTHANN QUINDLEN Ruthann Quindlen |
Director | February 12, 2010 | ||
60
Table of Contents
INDEX TO CONSOLIDATED FINANCIAL STATEMENTS
| PAGE | ||
| F-2 | ||
| F-4 | ||
| F-5 | ||
| Consolidated Statements of Stockholders’ Equity and Comprehensive Income (Loss) |
F-6 | |
| F-7 | ||
| F-8 | ||
F-1
Table of Contents
Report of Independent Registered Public Accounting Firm
The Board of Directors and Stockholders of
Rovi Corporation
We have audited the accompanying consolidated balance sheets of Rovi Corporation and subsidiaries as of December 31, 2009 and 2008, and the related consolidated statements of operations, stockholders’ equity and comprehensive income (loss), and cash flows for each of the two years in the period ended December 31, 2009. These financial statements are the responsibility of the Company’s management. Our responsibility is to express an opinion on these financial statements based on our audits.
We conducted our audits in accordance with the standards of the Public Company Accounting Oversight Board (United States). Those standards require that we plan and perform the audit to obtain reasonable assurance about whether the financial statements are free of material misstatement. An audit includes examining, on a test basis, evidence supporting the amounts and disclosures in the financial statements. An audit also includes assessing the accounting principles used and significant estimates made by management, as well as evaluating the overall financial statement presentation. We believe that our audits provide a reasonable basis for our opinion.
In our opinion, the financial statements referred to above present fairly, in all material respects, the consolidated financial position of Rovi Corporation and subsidiaries at December 31, 2009 and 2008, and the consolidated results of their operations and their cash flows for each of the two years in the period ended December 31, 2009, in conformity with U.S. generally accepted accounting principles.
As described in Note 6 to the financial statements, in 2009 the Company changed its method of accounting for convertible debt instruments that may be settled in cash upon conversion as required by an update to FASB ASC topic 470 (formerly FASB Staff Position APB 14-1).
We also have audited, in accordance with the standards of the Public Company Accounting Oversight Board (United States), Rovi Corporation and subsidiaries’ internal control over financial reporting as of December 31, 2009, based on criteria established in Internal Control-Integrated Framework issued by the Committee of Sponsoring Organizations of the Treadway Commission and our report dated February 12, 2010 expressed an unqualified opinion thereon.
/s/ Ernst & Young LLP
Los Angeles, California
February 12, 2010
F-2
Table of Contents
Report of Independent Registered Public Accounting Firm
The Board of Directors and Stockholders
Rovi Corporation:
We have audited the consolidated statements of operations, stockholders’ equity and comprehensive income (loss), and cash flows of Rovi Corporation and subsidiaries (the Company), successor registrant to Macrovision Corporation, for the year ended December 31, 2007. These consolidated financial statements are the responsibility of the Company’s management. Our responsibility is to express an opinion on these consolidated financial statements based on our audit.
We conducted our audit in accordance with the standards of the Public Company Accounting Oversight Board (United States). Those standards require that we plan and perform the audit to obtain reasonable assurance about whether the financial statements are free of material misstatement. An audit includes examining, on a test basis, evidence supporting the amounts and disclosures in the financial statements, assessing the accounting principles used and significant estimates made by management, as well as evaluating the overall financial statement presentation. We believe that our audit provides a reasonable basis for our opinion.
In our opinion, the consolidated financial statements referred to above present fairly, in all material respects, the results of operations and cash flows of Rovi Corporation and subsidiaries for the year ended December 31, 2007, in conformity with U.S. generally accepted accounting principles.
As discussed in note 1 to the consolidated financial statements, effective January 1, 2007, the Company changed its methods of accounting for uncertainty in income taxes and calculating its earnings per share resulting from the adoption of new accounting pronouncements. In addition, as discussed in note 6 to the consolidated financial statements, effective January 1, 2007, the Company changed its method of recognizing interest on its convertible note obligations resulting from the adoption of a new accounting pronouncement.
/s/ KPMG LLP
Mountain View, California
February 26, 2008, except as to Note 4, which is as of February 27, 2009,
and notes 1 and 6, which are as of February 12, 2010
F-3
Table of Contents
CONSOLIDATED BALANCE SHEETS
(In thousands, except share and per share data)
| December 31, | ||||||||
| 2009 | 2008 | |||||||
| ASSETS | ||||||||
| Current assets: |
||||||||
| Cash and cash equivalents |
$ | 165,410 | $ | 199,188 | ||||
| Short-term investments |
107,362 | 77,914 | ||||||
| Restricted cash |
36,838 | — | ||||||
| Trade accounts receivable, net |
71,875 | 84,020 | ||||||
| Taxes receivable |
6,363 | — | ||||||
| Deferred tax assets, net |
7,844 | 29,537 | ||||||
| Prepaid expenses and other current assets |
10,661 | 12,053 | ||||||
| Assets held for sale |
— | 329,522 | ||||||
| Total current assets |
406,353 | 732,234 | ||||||
| Long-term marketable securities |
26,674 | 84,955 | ||||||
| Property and equipment, net |
43,124 | 45,352 | ||||||
| Finite-lived intangible assets, net |
779,371 | 895,071 | ||||||
| Long-term deferred tax assets, net |
13,691 | — | ||||||
| Other assets |
27,861 | 50,387 | ||||||
| Goodwill |
854,065 | 828,185 | ||||||
| $ | 2,151,139 | $ | 2,636,184 | |||||
| LIABILITIES AND STOCKHOLDERS’ EQUITY | ||||||||
| Current liabilities: |
||||||||
| Accounts payable and accrued expenses |
$ | 81,369 | $ | 85,686 | ||||
| Taxes payable |
— | 8,996 | ||||||
| Deferred revenue |
16,536 | 14,376 | ||||||
| Current portion of debt and capital lease obligations |
18,486 | 5,842 | ||||||
| Liabilities held for sale |
— | 56,021 | ||||||
| Total current liabilities |
116,391 | 170,921 | ||||||
| Taxes payable, less current portion |
80,675 | 73,009 | ||||||
| Deferred tax liability, net |
— | 9,914 | ||||||
| Long-term debt and capital lease obligations, less current portion |
411,551 | 855,160 | ||||||
| Deferred revenue, less current portion |
4,919 | 4,909 | ||||||
| Other non current liabilities |
17,334 | 7,076 | ||||||
| 630,870 | 1,120,989 | |||||||
| Commitments and contingencies (Note 14) |
||||||||
| Stockholders’ equity: |
||||||||
| Common stock, $0.001 par value, 250,000,000 shares authorized; 105,720,821 shares issued and 103,457,846 outstanding as of December 31, 2009, and 102,972,546 shares issued and 100,709,571 outstanding as of December 31, 2008, at cost |
106 | 103 | ||||||
| Treasury stock, 2,262,975 shares at December 31, 2009 and December 31, 2008, at cost |
(25,068 | ) | (25,068 | ) | ||||
| Additional paid-in capital |
1,657,888 | 1,602,667 | ||||||
| Accumulated other comprehensive loss |
(2,078 | ) | (4,879 | ) | ||||
| Accumulated deficit |
(110,579 | ) | (57,628 | ) | ||||
| Total stockholders’ equity |
1,520,269 | 1,515,195 | ||||||
| $ | 2,151,139 | $ | 2,636,184 | |||||
See accompanying notes to consolidated financial statements.
F-4
Table of Contents
CONSOLIDATED STATEMENTS OF OPERATIONS
(In thousands, except per share data)
| Year ended December 31, | ||||||||||||
| 2009 | 2008 | 2007 | ||||||||||
| Revenues |
$ | 483,911 | $ | 330,045 | $ | 144,943 | ||||||
| Costs and expenses: |
||||||||||||
| Cost of revenues |
65,916 | 44,568 | 9,238 | |||||||||
| Research and development |
94,632 | 67,714 | 13,204 | |||||||||
| Selling, general and administrative |
133,207 | 114,614 | 55,316 | |||||||||
| Depreciation |
18,408 | 13,832 | 5,090 | |||||||||
| Amortization |
81,934 | 59,139 | 5,981 | |||||||||
| Restructuring and asset impairment charges |
53,619 | — | 4,546 | |||||||||
| Total costs and expenses |
447,716 | 299,867 | 93,375 | |||||||||
| Operating income from continuing operations |
36,195 | 30,178 | 51,568 | |||||||||
| Interest expense |
(52,028 | ) | (54,834 | ) | (15,446 | ) | ||||||
| Interest income and other, net |
4,394 | 11,732 | 23,199 | |||||||||
| Loss on debt redemption |
(8,687 | ) | — | — | ||||||||
| Gain on sale of strategic investments |
— | 5,238 | — | |||||||||
| Impairment losses on strategic investments |
— | — | (5,000 | ) | ||||||||
| (Loss) income from continuing operations before income taxes |
(20,126 | ) | (7,686 | ) | 54,321 | |||||||
| Income tax (benefit) expense |
(1,421 | ) | (23,409 | ) | 14,468 | |||||||
| (Loss) income from continuing operations, net of tax |
(18,705 | ) | 15,723 | 39,853 | ||||||||
| Discontinued operations, net of tax |
(34,246 | ) | (129,783 | ) | (14,537 | ) | ||||||
| Net (loss) income |
$ | (52,951 | ) | $ | (114,060 | ) | $ | 25,316 | ||||
| Basic earnings per common share: |
||||||||||||
| Basic (loss) income per share from continuing operations |
$ | (0.18 | ) | $ | 0.18 | $ | 0.75 | |||||
| Basic loss per share from discontinued operations |
$ | (0.34 | ) | $ | (1.50 | ) | $ | (0.27 | ) | |||
| Basic net earnings per share |
$ | (0.52 | ) | $ | (1.32 | ) | $ | 0.48 | ||||
| Shares used in computing basic net earnings per share |
100,860 | 85,334 | 52,470 | |||||||||
| Diluted earnings per common share: |
||||||||||||
| Diluted (loss) income per share from continuing operations |
$ | (0.18 | ) | $ | 0.18 | $ | 0.74 | |||||
| Diluted loss per share from discontinued operations |
$ | (0.34 | ) | $ | (1.50 | ) | $ | (0.27 | ) | |||
| Diluted net earnings per share |
$ | (0.52 | ) | $ | (1.32 | ) | $ | 0.47 | ||||
| Shares used in computing diluted net earnings per share |
100,860 | 85,357 | 53,104 | |||||||||
See accompanying notes to consolidated financial statements.
F-5
Table of Contents
CONSOLIDATED STATEMENTS OF STOCKHOLDERS’ EQUITY AND COMPREHENSIVE INCOME (LOSS)
(In thousands, except share data)
| Common stock | Treasury Stock | Additional paid-in capital |
Accumulated other comprehensive income (loss) |
Retained earnings (Accumulated deficit) |
Total Stockholders’ Equity |
|||||||||||||||||||||||||
| Shares | Amount | Shares | Amount | |||||||||||||||||||||||||||
| Balances as of December 31, 2006 |
57,011,137 | $ | 57 | (5,315,800 | ) | $ | (88,448 | ) | $ | 372,412 | $ | 10,974 | $ | 171,147 | $ | 466,142 | ||||||||||||||
| Cumulative effect of accounting change (See Note 6) |
28,394 | (1,583 | ) | 26,811 | ||||||||||||||||||||||||||
| Adjusted balances as of December 31, 2006 |
57,011,137 | $ | 57 | (5,315,800 | ) | $ | (88,448 | ) | $ | 400,806 | $ | 10,974 | $ | 169,564 | $ | 492,953 | ||||||||||||||
| Comprehensive income: |
||||||||||||||||||||||||||||||
| Net income |
25,316 | 25,316 | ||||||||||||||||||||||||||||
| Foreign currency translation adjustment, net of tax |
1,151 | 1,151 | ||||||||||||||||||||||||||||
| Unrealized gains in investments, net of tax |
282 | 282 | ||||||||||||||||||||||||||||
| Total comprehensive income |
26,749 | |||||||||||||||||||||||||||||
| Issuance of common stock upon exercise of options |
3,081,440 | 3 | 59,954 | 59,957 | ||||||||||||||||||||||||||
| Issuance of common stock under employee stock purchase plan |
429,133 | 7,065 | 7,065 | |||||||||||||||||||||||||||
| Issuance of restricted stock |
725,733 | 1 | (1 | ) | — | |||||||||||||||||||||||||
| Equity-based compensation |
16,158 | 16,158 | ||||||||||||||||||||||||||||
| Stock repurchase |
(2,118,719 | ) | (50,000 | ) | (50,000 | ) | ||||||||||||||||||||||||
| Cumulative effect from adoption of FIN 48 |
15,461 | 15,461 | ||||||||||||||||||||||||||||
| Issuance of warrants |
8,388 | 8,388 | ||||||||||||||||||||||||||||
| Balances as of December 31, 2007 |
61,247,443 | $ | 61 | (7,434,519 | ) | $ | (138,448 | ) | $ | 507,831 | $ | 12,407 | $ | 194,880 | $ | 576,731 | ||||||||||||||
| Comprehensive loss: |
||||||||||||||||||||||||||||||
| Net loss |
(114,060 | ) | (114,060 | ) | ||||||||||||||||||||||||||
| Foreign currency translation adjustment, net of tax |
(11,440 | ) | (11,440 | ) | ||||||||||||||||||||||||||
| Unrealized losses in investments, net of tax |
(5,846 | ) | (5,846 | ) | ||||||||||||||||||||||||||
| Total comprehensive loss |
(131,346 | ) | ||||||||||||||||||||||||||||
| Issuance of common stock upon exercise of options |
223,987 | 3,138 | 3,138 | |||||||||||||||||||||||||||
| Issuance of common stock under employee stock purchase plan |
347,866 | 4,825 | 4,825 | |||||||||||||||||||||||||||
| Issuance of restricted stock |
220,000 | — | ||||||||||||||||||||||||||||
| Restricted stock forfeitures |
(283,104 | ) | — | |||||||||||||||||||||||||||
| Equity-based compensation |
15,500 | 15,500 | ||||||||||||||||||||||||||||
| Issuance of common stock in connection with the Gemstar acquisition |
48,650,873 | 49 | 1,072,427 | 1,072,476 | ||||||||||||||||||||||||||
| Cancellation of treasury stock |
(7,434,519 | ) | (7 | ) | 7,434,519 | 138,448 | 7 | (138,448 | ) | — | ||||||||||||||||||||
| Excess tax benefit associated with stock plans |
(1,061 | ) | (1,061 | ) | ||||||||||||||||||||||||||
| Stock repurchase |
(2,262,975 | ) | (25,068 | ) | (25,068 | ) | ||||||||||||||||||||||||
| Balances as of December 31, 2008 |
102,972,546 | $ | 103 | (2,262,975 | ) | $ | (25,068 | ) | $ | 1,602,667 | $ | (4,879 | ) | $ | (57,628 | ) | $ | 1,515,195 | ||||||||||||
| Comprehensive loss: |
||||||||||||||||||||||||||||||
| Net loss |
(52,951 | ) | (52,951 | ) | ||||||||||||||||||||||||||
| Foreign currency translation adjustment, net of tax |
1,905 | 1,905 | ||||||||||||||||||||||||||||
| Unrealized losses in investments, net of tax |
896 | 896 | ||||||||||||||||||||||||||||
| Total comprehensive loss |
(50,150 | ) | ||||||||||||||||||||||||||||
| Issuance of common stock upon exercise of options |
1,563,001 | 2 | 27,485 | 27,487 | ||||||||||||||||||||||||||
| Issuance of common stock under employee stock purchase plan |
483,838 | 5,346 | 5,346 | |||||||||||||||||||||||||||
| Issuance of restricted stock, net |
701,436 | 1 | (1 | ) | — | |||||||||||||||||||||||||
| Equity-based compensation |
22,391 | 22,391 | ||||||||||||||||||||||||||||
| Balances as of December 31, 2009 |
105,720,821 | $ | 106 | (2,262,975 | ) | $ | (25,068 | ) | $ | 1,657,888 | $ | (2,078 | ) | $ | (110,579 | ) | $ | 1,520,269 | ||||||||||||
See accompanying notes to consolidated financial statements.
F-6
Table of Contents
CONSOLIDATED STATEMENTS OF CASH FLOWS
(In thousands)
| Year ended December 31 | ||||||||||||
| 2009 | 2008 | 2007 | ||||||||||
| Cash flows from operating activities: |
||||||||||||
| Net (loss) income |
$ | (52,951 | ) | $ | (114,060 | ) | $ | 25,316 | ||||
| Adjustments to reconcile net (loss) income to net cash provided by operations: |
||||||||||||
| Discontinued operations, net of tax |
34,246 | 129,783 | 14,537 | |||||||||
| Depreciation and amortization |
100,342 | 72,971 | 11,071 | |||||||||
| Amortization of note issuance costs and discount |
20,782 | 14,161 | 9,288 | |||||||||
| Equity-based compensation |
22,391 | 13,610 | 9,793 | |||||||||
| Impairment losses on strategic investments |
— | — | 5,000 | |||||||||
| Restructuring and asset impairment charges |
48,872 | — | 2,044 | |||||||||
| Deferred taxes |
(20,530 | ) | (27,035 | ) | (6,904 | ) | ||||||
| Write-off of note issuance costs |
5,633 | — | — | |||||||||
| Gain on sale of strategic investment |
— | (5,238 | ) | — | ||||||||
| Changes in operating assets and liabilities, net of assets and liabilities acquired: |
||||||||||||
| Accounts receivable, net |
12,254 | (10,216 | ) | (5,020 | ) | |||||||
| Deferred revenue |
1,663 | 13,342 | 290 | |||||||||
| Prepaid expenses, other current assets and other assets |
(3,869 | ) | 16,816 | (23,584 | ) | |||||||
| Accounts payable, accrued expenses, and other long-term liabilities |
(11,601 | ) | (48,709 | ) | 25,260 | |||||||
| Net cash provided by operating activities of continuing operations |
157,232 | 55,425 | 67,091 | |||||||||
| Net cash provided by operating activities of discontinued operations |
1,184 | 12,649 | 24,629 | |||||||||
| Net cash provided by operating activities |
158,416 | 68,074 | 91,720 | |||||||||
| Cash flows from investing activities: |
||||||||||||
| Purchases of long and short term marketable investment securities |
(84,354 | ) | (112,741 | ) | (1,156,590 | ) | ||||||
| Sales or maturities of long and short term marketable investments |
113,571 | 254,463 | 1,148,583 | |||||||||
| Acquisition of Gemstar, net of cash acquired |
— | (911,164 | ) | — | ||||||||
| Proceeds from dispositions of businesses, net of costs to sell |
266,205 | 195,860 | — | |||||||||
| Loan made in conjunction with TV Guide Magazine Sale |
— | (7,403 | ) | — | ||||||||
| Payments for other acquisitions, net of cash acquired |
(23,970 | ) | — | (129,813 | ) | |||||||
| Purchases of property and equipment |
(19,775 | ) | (10,381 | ) | (1,136 | ) | ||||||
| Other investing activities |
(110 | ) | (1,023 | ) | (1,518 | ) | ||||||
| (Increase) decrease in restricted cash |
(36,838 | ) | — | 12,000 | ||||||||
| Net cash provided by (used in) investing activities of continuing operations |
214,729 | (592,389 | ) | (128,474 | ) | |||||||
| Net cash used in investing activities of discontinued operations |
— | (1,576 | ) | (5,033 | ) | |||||||
| Net cash provided by (used in) investing activities |
214,729 | (593,965 | ) | (133,507 | ) | |||||||
| Cash flows from financing activities: |
||||||||||||
| Purchase of treasury stock |
— | (25,068 | ) | (50,000 | ) | |||||||
| Principal payment under capital lease and debt obligations |
(440,344 | ) | (4,299 | ) | (1,355 | ) | ||||||
| Proceeds from issuance of debt, net of issuance costs |
— | 615,353 | — | |||||||||
| Proceeds from exercise of options and other financing activities |
27,487 | 3,138 | 59,957 | |||||||||
| Proceeds from stock issued under employee stock purchase plan |
5,346 | 4,825 | 7,065 | |||||||||
| Net cash (used in) provided by financing activities of continuing operations |
(407,511 | ) | 593,949 | 15,667 | ||||||||
| Net cash used in financing activities of discontinued operations |
(114 | ) | (442 | ) | — | |||||||
| Net cash (used in) provided by financing activities |
(407,625 | ) | 593,507 | 15,667 | ||||||||
| Effect of exchange rate changes on cash |
702 | (2,498 | ) | 524 | ||||||||
| Net (decrease) increase in cash and cash equivalents |
(33,778 | ) | 65,118 | (25,596 | ) | |||||||
| Cash and cash equivalents at beginning of year |
199,188 | 134,070 | 159,666 | |||||||||
| Cash and cash equivalents at end of year |
$ | 165,410 | $ | 199,188 | $ | 134,070 | ||||||
| Cash paid during the year: |
||||||||||||
| Income taxes |
$ | 36,932 | $ | 6,764 | $ | 1,266 | ||||||
| Interest |
$ | 37,179 | $ | 34,188 | $ | 6,329 | ||||||
| Supplemental schedule of non-cash transactions: |
||||||||||||
| Issuance of warrants for business acquisition |
$ | — | $ | — | $ | 8,388 | ||||||
See accompanying notes to consolidated financial statements.
F-7
Table of Contents
Notes to Consolidated Financial Statements
(1) Description of Business and Summary of Significant Accounting Policies
Description of Business
Rovi Corporation (the “Company”), a Delaware Corporation, was formed in 2007. On May 2, 2008, Macrovision Corporation acquired Gemstar-TV Guide International, Inc. (“Gemstar”). Upon consummation of this transaction, the Company assumed ownership of both Gemstar and Macrovision Corporation. The common stock of Macrovision Corporation and Gemstar were de-registered and Macrovision Corporation stockholders were provided one share in Rovi Corporation for each share of Macrovision Corporation common stock owned as of the closing. In addition, all treasury stock held by Macrovision Corporation was cancelled. Macrovision Corporation is the predecessor registrant to Rovi Corporation and has been determined to be the predecessor for accounting purposes; therefore, for periods prior to May 2, 2008, the consolidated financial statements reflect the financial position and results of operations and cash flows of Macrovision Corporation. The Company’s results of operations include the operations of Gemstar from May 2, 2008, forward.
The Company’s offerings include interactive program guides (IPGs), embedded licensing technologies (such as recommendations and search capability), media recognition technologies and licensing of the Company’s database of descriptive information about television, movie, music, books, and game content and content protection technologies and services. In addition to offering Company developed IPGs, our customers may also license our patents and deploy their own IPG or a third party IPG. The Company’s solutions are deployed by companies in the consumer electronics, cable and satellite, entertainment and online distribution markets.
Basis of Presentation and Principles of Consolidation
The accompanying consolidated financial statements include the accounts of Rovi Corporation and its wholly and majority owned subsidiaries after elimination of intercompany accounts and transactions.
On April 1, 2008, the Company sold its software and games businesses (referred to as “Software” and “Games”, respectively). On November 17, 2008, the Company sold its RightCommerce (also known as “eMeta”) business and on December 1, 2008, the Company sold its TV Guide Magazine business. On January 27, 2009, the Company sold its TVG Network business and on February 28, 2009, the Company sold its TV Guide Network and TV Guide Online businesses. Together TV Guide Magazine, TVG Network, TV Guide Network and TV Guide Online are collectively referred to as the “Media Properties”. The results of operations and cash flows of Software, Games, eMeta and the Media Properties have been classified as discontinued operations for all periods presented (See Note 4).
Subsequent events have been evaluated up to and including February 12, 2010, which is the date these financial statements were issued.
Reclassifications
Certain financial statement items for prior periods have been reclassified to conform to the 2009 presentation.
Use of Estimates
The preparation of consolidated financial statements in conformity with generally accepted accounting principles in the United States requires management to make estimates and assumptions that affect the reported amounts of assets and liabilities and disclosure of contingent assets and liabilities at the date of the financial
F-8
Table of Contents
statements and reported results of operations during the reporting period. On an ongoing basis, the Company evaluates its estimates, including those related to revenue recognition, allowance for doubtful accounts, investments, equity-based compensation, goodwill and other intangible assets, long-lived assets and income taxes. Actual results could differ from those estimates.
Recent Accounting Pronouncements
In 2009, the Company adopted an update to Financial Accounting Standards Board (“FASB”) Accounting Standards Codification (“ASC”) topic 855 (formerly SFAS No. 165) related to subsequent events. This update defines subsequent events as either recognized (previously referred to in practice as Type I) or non-recognized (previously referred to in practice as Type II). The adoption did not have a material impact on the Company’s financial position or results from operations.
In 2009, the Company adopted Accounting Standards Update (“ASU”) 2009-05, Fair Value Measurements (Topic 820)—Measuring Liabilities at Fair Value. ASU 2009-5 amends ASC topic 820 by providing additional guidance clarifying the measurement of liabilities at fair value. When a quoted price in an active market for the identical liability is not available, the amendments require that the fair value of a liability be measured using one or more of the listed valuation techniques that should maximize the use of relevant observable inputs and minimize the use of unobservable inputs. The adoption did not have a material impact on the Company’s financial position or results from operations.
In 2009, the Company adopted an update to FASB ASC topic 320 (formerly FSP SFAS 115-2 and FAS 124-2) related to the recognition and presentation of other-than-temporary impairments. This update replaces the existing requirement that management assert it has both the intent and ability to hold an impaired security until recovery with the requirement that management assert: (i) it does not have the intent to sell the security; and (ii) it is more likely than not it will not have to sell the security before recovery of its cost basis. The update also incorporates examples of factors from existing literature that should be considered in determining whether a debt security is other-than-temporarily impaired. The adoption did not have a material impact on the Company’s financial position or results from operations.
In 2009, the Company adopted an update to FASB ASC topic 820 (formerly FSP SFAS 157-4) related to determining fair value when the volume and level of activity for the asset or liability have significantly decreased and identifying transactions that are not orderly. This update affirms that the objective of fair value, when the market for an asset is not active, is the price that would be received to sell the asset in an orderly transaction and clarifies and includes additional factors for determining whether potentially comparative transactions are orderly transactions or transactions that are not orderly (that is, distressed or forced). The adoption did not have a material impact on the Company’s financial position or results from operations.
In 2009, the Company adopted an update to FASB ASC topic 805 (formerly SFAS No. 141 (R)) related to business combinations. New requirements include: (i) the fair value of stock provided as consideration be measured as of the acquisition date instead of the announcement date; (ii) acquisition-related costs be recognized separately from the acquisition, generally as an expense, instead of treated as a part of the cost of the acquisition that was allocated to the assets acquired and the liabilities assumed; (iii) restructuring costs that the acquirer expected, but was not obligated to incur, be recognized separately from the acquisition instead of recognized as if they were a liability assumed at the acquisition date; (iv) contingent consideration be recognized at the acquisition date, measured at its fair value at that date, instead of recognized when the contingency was resolved and consideration was issued or became issuable; (v) recognizing a gain when the fair value of the identifiable net assets acquired exceeds the fair value of the consideration transferred instead of allocating the “negative goodwill” amount as a pro rata reduction of the amounts that otherwise would have been assigned to particular assets acquired; (vi) research and development assets acquired in a business combination will be recognized at their acquisition-date fair values as assets acquired in a business combination instead of being measured at their acquisition-date fair values and then immediately charged to expense; and (vii) changes in the amount of deferred
F-9
Table of Contents
tax benefits created in a business combination, outside of the valuation period, will be recognized either in income from continuing operations or directly in contributed capital, depending on the circumstances, instead of recognized through a corresponding reduction to goodwill or certain noncurrent assets or an increase in so-called negative goodwill. The adoption did not have a material impact on the Company’s financial position or results from operations.
In 2009, the Company adopted an update to FASB ASC topic 350 (formerly FSP SFAS 142-3) related to the determination of the useful life of intangible assets. This update amends the factors that should be considered in developing renewal or extension assumptions used to determine the useful life of a recognized intangible asset in order to improve the consistency between the useful life of a recognized intangible asset under FASB ASC topic 350 (formerly SFAS 142) and the period of expected cash flows used to measure the fair value of the asset under FASB ASC topic 805, (formerly SFAS No. 141(R)). The adoption did not have a material impact on the Company’s financial position or results from operations.
In 2008, the FASB issued an update to FASB ASC topic 820 (formerly FSP SFAS 157-2). This update deferred the effective date of changes to fair value measurements as it relates to non-financial assets and liabilities including items such as reporting units measured at fair value in a goodwill impairment test and non-financial assets acquired and liabilities assumed in a business combination until fiscal years beginning after November 15, 2008. Effective January 1, 2009, the Company began applying the changes to the fair value measurements which were previously deferred. The adoption of these changes did not have a material impact on the Company’s financial position or results from operations.
In October 2009, the FASB issued ASU 2009-13, Revenue Recognition (Topic 605): Multiple Deliverable Arrangements, which modifies the requirements for determining whether a deliverable in a multiple element arrangement can be treated as a separate unit of accounting by removing the criteria that objective and reliable evidence of fair value exists for the undelivered elements. The new guidance requires consideration be allocated to all deliverables based on their relative selling price using vendor specific objective evidence (VSOE) of selling price, if it exists; otherwise selling price is determined based on third-party evidence (TPE) of selling price. If neither VSOE nor TPE exist, management must use its best estimate of selling price (ESP) to allocate the arrangement consideration. The Company will adopt this update under the prospective method and will apply the new guidance to agreements entered into or materially modified after January 1, 2010.
The adoption of ASU 2009-13 may have a material impact on the Company’s revenue in any given future period. For example, the Company often enters into IPG patent license agreements in which it provides a licensee a release for past infringement as well as the right to ship an unlimited number of units over a specified period for a flat fee. Under the previous multiple element guidance, the Company generally would not be able to provide objective and reliable evidence of the fair value of the go-forward license arrangement (the undelivered element) and therefore would have recognized all revenue for such agreement ratably over the term of the agreement. Applying the guidance in the update, the Company would use ESP to allocate the consideration between the release for past infringement and the go-forward patent license. As the revenue recognition criteria for the past infringement would generally be satisfied upon the execution of the agreement, the amount of consideration allocated to the past infringement would be recognized in the quarter the agreement is executed and the amount allocated to the go forward license agreement would be recognized ratably over the term of the agreement.
In October 2009, the FASB issued ASU 2009-14, Revenue Recognition (Topic 605)—Applicability of AICPA Statement of Position 97-2 to Certain Arrangements That Include Software Elements (“ASU 2009-14”). ASU 2009-14 excludes tangible products containing software components and non-software components that function together to deliver the product’s essential functionality from the scope of ASC 605-985, Software-Revenue Recognition. The Company will adopt ASU 2009-14 on a prospective basis to revenue arrangements entered into or materially modified after January 1, 2010. The Company does not anticipate the adoption of ASU 2009-14 will have a material impact on its future financial position or results from operations.
F-10
Table of Contents
Cash, Cash Equivalents and Investments
The Company considers investments with original maturities of three months or less from the date of purchase to be cash equivalents. Cash and cash equivalents consist of cash on deposit with banks and money market funds. All other liquid investments with maturities over three months and less than 12 months are classified as short-term investments. Short-term investments in 2009 consist primarily of auction rate securities, U.S treasury and agency securities and corporate debt securities. Short-term investments in 2008 also included US and municipal securities, and commercial paper. All marketable securities with maturities over one year or those for which the Company’s intent is to retain for more than twelve months are classified as long-term marketable investment securities.
Management determines the appropriate classification of investment securities at the time of purchase and re-evaluates such designation as of each balance sheet date. Available-for-sale securities are carried at fair value, with unrealized gains and losses reported in accumulated other comprehensive income, as a separate component of stockholders’ equity. Trading securities are carried at fair value, with changes in fair value reported as part of interest and other income in the consolidated statements of operations.
Realized gains and losses and declines in value judged to be other-than-temporary for available-for-sale securities are reported in other income or expense as incurred. The cost of securities sold is based on the specific identification method. Interest and dividends on securities classified as available-for-sale and trading are included in interest and other income.
In December 2008, the Company entered into an agreement (the “Agreement”) with UBS AG which provides (1) the Company the right (“Put Option”) to sell these auction rate securities back to UBS AG at par, at the Company’s sole discretion, anytime during the period from June 30, 2010 through July 2, 2012, and (2) UBS AG the right to purchase these auction rate securities or sell them on the Company’s behalf at par anytime through July 2, 2012. The Company elected to measure the Put Option under the fair value option and recorded income of approximately $10.4 million pre-tax, and recorded a corresponding long term investment. Simultaneously, the Company transferred these auction rate securities from available-for-sale to trading investment securities. As a result of this transfer, the Company recognized an other-than-temporary impairment loss of approximately $10.4 million pre-tax, reflecting a reversal of the related temporary valuation allowance that was previously recorded in other comprehensive loss. The recording of the Put Option and the recognition of the other-than-temporary impairment loss resulted in no material impact to the Consolidated Statement of Operations for the year ended December 31, 2008. The Put Option will continue to be measured at fair value utilizing Level 3 inputs until the earlier of its maturity or exercise. The Company’s auction rate securities which were not purchased from this investment firm continue to be classified as available-for-sale securities.
Allowance for Doubtful Accounts
The Company maintains an allowance for doubtful accounts to reserve for potentially uncollectible trade receivables. The Company reviews its trade receivables by aging category to identify significant customers with known disputes or collection issues. For accounts not specifically identified, the Company provides reserves based on historical bad debt loss experience.
Property and Equipment
Property and equipment are stated at cost, net of accumulated depreciation and amortization. Depreciation and amortization is computed using the straight-line method over the estimated useful lives of the respective assets. Computer equipment and software are depreciated over three years. Furniture and fixtures are depreciated over five years. Leasehold improvements and assets recorded under capital leases are amortized on a straight-line basis over the shorter of the assets’ useful lives or lease terms.
F-11
Table of Contents
Joint Ventures and Other Investments
The Company accounts for its 49% share of the operations of the Guideworks, LLC joint venture with Comcast Corporation as research and development expense. Other investments of 50% or less in entities in which the Company has the ability to exercise significant influence over operations are accounted for using the equity method.
Deferred Revenue
Deferred revenue represents cash amounts received from customers under certain license, maintenance and service agreements for which the revenue earnings process has not been completed.
Comprehensive Income
Comprehensive income includes net (loss) income, foreign currency translation adjustments and unrealized gains and losses, net of related taxes, on marketable investment securities that have been excluded from the determination of net (loss) income. The Company has reported the components of comprehensive income on its consolidated statements of stockholders’ equity. The change in unrealized gains and losses on investments during the year ended December 31, 2008 includes the reduction of $3.2 million, net of taxes, of unrealized gains which became realized gains when the Company sold its investment in Digimarc Corporation during the first quarter of 2008 (See Note 9). Foreign currency translation adjustments during the year ended December 31, 2008 includes a reduction of $5.0 million arising from the sale of Software business.
Revenue Recognition
The Company’s revenue from continuing operations primarily consists of license fees for IPG products and patents, royalty fees on copy-protected products, licenses for its content protection technologies and licensee fees for its entertainment metadata. The Company recognizes revenue when the following conditions are met (i) there is persuasive evidence that an arrangement exists, (ii) delivery has occurred or service has been rendered, (iii) the price is fixed or determinable and (iv) collection is reasonably assured.
The Company licenses its proprietary IPG technology to consumer electronics (“CE”) manufacturers and to service providers. The Company generally recognizes revenue from IPG product and patent licensing on a per-unit shipped model (with CE manufacturers) or a per subscriber model (with service providers). The Company’s recognition of revenues from per-unit license fees is based on units reported shipped by the manufacturer. CE manufacturers normally report their unit shipments to us in the quarter immediately following that of actual shipment by the manufacturer. Revenues from per-subscriber fees are recognized in the period the services are provided by a licensee, as reported to us by the licensee. Revenues from annual or other license fees are recognized based on the specific terms of the license arrangement. For instance, certain IPG licensees enter into agreements for which they have the right to ship an unlimited number of units over a specified term for a flat fee. The Company records the fees associated with these arrangements on a straight-line basis over the specified term.
The Company’s ACP technology licensing agreements often pay a per-unit royalty fee for the shipment of DVDs and the shipment of digital set-top boxes that incorporate our technology. The Company relies on royalty reports from customers and/or third parties as the basis for revenue recognition, provided there is persuasive evidence of an arrangement and that collection of a fixed and determinable fee is considered probable. The Company has established significant experience and relationships with certain customers to reasonably estimate current period volume for purposes of making an accurate revenue accrual. Accordingly, royalty revenue from these customers is recognized as earned. Revenue from other customers is recognized as reported until such time that the Company can establish a basis for making reasonable estimates, in which case revenue is recognized on an as-earned basis. Licensees generally report activity within 30 to 60 days after the end of the month or quarter
F-12
Table of Contents
in which such activity takes place. The Company has also entered into agreements with certain entertainment studios for which they have the right to ship an unlimited number of DVDs that utilize our ACP technology over a specified term for a flat fee. The Company records the revenue associated with these arrangements on a straight-line basis over the specified term. In addition, the Company has also entered into agreements with CE manufacturers in which they pay us a one-time fee for a perpetual license to our ACP technology. Provided that collectability is reasonable assured, we record revenue related to these agreements when the agreement is executed as we have no continuing obligation and the amounts are fixed and determinable.
In accounting for multiple-element arrangements, one of the key judgments to be made is the accounting value that is attributable to the different contractual elements. The appropriate allocation of value impacts the amount and timing of revenue recorded in the consolidated statement of operations during a given period. Revenue arrangements with multiple deliverables are divided into separate units of accounting where the delivered item has value to the customer on a stand-alone basis and there is objective and reliable evidence of the fair value of the undelivered item. Consideration is allocated among the separate units of accounting based on their relative fair values.
Cost of Revenues
Cost of revenues consists primarily of data costs, patent prosecution, patent maintenance and patent litigation costs.
Equity-Based Compensation
Equity-based compensation cost is measured at the grant date based on the fair value of the award. The Company recognizes compensation costs for shares that are expected to vest, on a straight-line basis, over the requisite service period of the award.
Income Taxes
Income taxes are accounted for under the asset and liability method. Deferred tax assets and liabilities are recognized for the future tax consequences attributable to differences between the financial statement carrying amounts of existing assets and liabilities and their respective tax bases and operating loss and tax carry forwards. Deferred tax assets and liabilities are measured using enacted tax rates expected to apply to taxable income in the years in which those temporary differences are expected to be recovered or settled. The effect on deferred tax assets and liabilities of a change in tax rates is recognized in income in the period that includes the enactment date. The measurement of deferred tax assets is reduced, if necessary, by a valuation allowance for any tax benefits of which future realization is not evaluated to be more likely than not.
The Company adopted updates to ASC topic 740, Income Taxes (formerly FASB Interpretation No. 48, Accounting for Uncertainty in Income Taxes), effective January 1, 2007. This update prescribes a new recognition threshold and measurement attribute for the financial statement recognition and measurement of an income tax position taken or expected to be taken in a tax return. This update also provides guidance on derecognition, classification, interest and penalties, accounting in interim periods, disclosure and transition. Upon its adoption, the Company applied the provisions of this update to all income tax positions. The cumulative effect of applying the provisions of this update have been reported as an adjustment to the opening balance of additional paid-in-capital in the consolidated balance sheet as of the beginning of 2007.
Taxes Collected from Customers
The Company applies the net basis presentation for taxes collected from customers and remitted to governmental authorities.
F-13
Table of Contents
Foreign Currency Translation
The functional currency for the Company’s foreign subsidiaries is generally the applicable local currency. The translation of foreign currency denominated financial statements into United States Dollar is performed for balance sheet accounts using current exchange rates in effect at the balance sheet date and for revenues and expense accounts using an average exchange rate for the respective periods. Adjustments resulting from such translation are included in comprehensive income. Gains or losses resulting from foreign currency transactions included in the consolidated statements of operations were not material in any of the periods presented.
Business and Concentration of Credit Risk and Fair Value of Financial Instruments
Financial instruments that potentially subject the Company to significant concentrations of credit risk consist principally of cash, cash equivalents, marketable securities and trade accounts receivable. The Company places its cash and cash equivalents and marketable securities in deposits and money market funds with various high credit quality institutions.
The Company performs ongoing credit evaluations of its customers as necessary. As a percentage of net revenues from continuing operations, the Company did not have any customers that were equal to or greater than 10% of net revenue for the year ended December 31, 2008. In 2009, the Company generated revenue from one customer which exceeded 10% of its net revenue from continuing operations. In 2007, the Company generated revenue from a different customer which exceeded 10% of its net revenue from continuing operations. As a percentage of trade accounts receivable, net from continuing operations, the Company had one customer that was equal to or greater than 10% as of December 31, 2008 and two customers that were equal to or greater than 10% as of December 31, 2007. As of December 31, 2009 the Company did not have any customers whose receivable exceeded 10% of its net trade accounts receivable.
Earnings Per Share
On January 1, 2009, the Company adopted an update to FASB ASC topic 260 related to determining whether instruments granted in share-based payment transactions are participating securities (formerly FSP EITF 03-6-1). This update defines unvested share-based payment awards that contain nonforfeitable rights to dividends as participating securities that should be included in computing EPS using the two-class method. The Company’s non-vested restricted stock awards granted prior to June 30, 2009, qualify as participating securities. As required, all prior-period EPS data has been adjusted. The adoption did not have a material impact on the Company’s EPS.
Basic EPS is computed using the weighted average number of common shares outstanding during the period. Diluted EPS is computed using the weighted average number of common and dilutive common equivalent shares outstanding during the period except for periods of loss from continuing operations for which no common share equivalents are included because their effect would be anti-dilutive. Dilutive common equivalent shares consist of common stock issuable upon exercise of stock options and non-participating restricted stock using the treasury stock method.
F-14
Table of Contents
The calculation of earnings per common share and diluted earnings per common share is presented below.
| December 31, | ||||||||||||
| 2009 | 2008 | 2007 | ||||||||||
| Basic (loss) income per common share |
||||||||||||
| (Loss) income from continuing operations |
$ | (18,705 | ) | $ | 15,723 | $ | 39,853 | |||||
| Income allocated to participating securities |
— | (178 | ) | (720 | ) | |||||||
| (Loss) income allocated to common shareholders from continuing operations |
$ | (18,705 | ) | $ | 15,545 | $ | 39,133 | |||||
| Discontinued operations |
$ | (34,246 | ) | $ | (129,783 | ) | $ | (14,537 | ) | |||
| Loss allocated to participating securities |
— | 1,468 | 263 | |||||||||
| Discontinued operations allocated to common shareholders |
$ | (34,246 | ) | $ | (128,315 | ) | $ | (14,274 | ) | |||
| Net (loss) income |
$ | (52,951 | ) | $ | (114,060 | ) | $ | 25,316 | ||||
| Loss (income) allocated to participating securities |
— | 1,290 | (457 | ) | ||||||||
| Net (loss) income allocated to common shareholders |
$ | (52,951 | ) | $ | (112,770 | ) | $ | 24,859 | ||||
| Weighted average basic common shares outstanding |
100,860 | 85,334 | 52,470 | |||||||||
| (Loss) income per common share from continuing operations |
$ | (0.18 | ) | $ | 0.18 | $ | 0.75 | |||||
| Loss per common share from discontinued operations |
(0.34 | ) | (1.50 | ) | (0.27 | ) | ||||||
| Net earnings per common share |
$ | (0.52 | ) | $ | (1.32 | ) | $ | 0.48 | ||||
| Diluted (loss) income per common share |
||||||||||||
| (Loss) income from continuing operations |
$ | (18,705 | ) | $ | 15,723 | $ | 39,853 | |||||
| Income allocated to participating securities |
— | (178 | ) | (711 | ) | |||||||
| (Loss) income allocated to common shareholders from continuing operations |
$ | (18,705 | ) | $ | 15,545 | $ | 39,142 | |||||
| Discontinued operations |
$ | (34,246 | ) | $ | (129,783 | ) | $ | (14,537 | ) | |||
| Loss allocated to participating securities |
— | 1,468 | 259 | |||||||||
| Discontinued operations allocated to common shareholders |
$ | (34,246 | ) | $ | (128,315 | ) | $ | (14,278 | ) | |||
| Net (loss) income |
$ | (52,951 | ) | $ | (114,060 | ) | $ | 25,316 | ||||
| Loss (income) allocated to participating securities |
— | 1,290 | (452 | ) | ||||||||
| Net (loss) income allocated to common shareholders |
$ | (52,951 | ) | $ | (112,770 | ) | $ | 24,864 | ||||
| Weighted average diluted common shares outstanding |
100,860 | 85,334 | 52,470 | |||||||||
| Dilutive potential common shares |
— | 23 | 634 | |||||||||
| Weighted average diluted common shares outstanding |
100,860 | 85,357 | 53,104 | |||||||||
| (Loss) income per common share from continuing operations |
$ | (0.18 | ) | $ | 0.18 | $ | 0.74 | |||||
| Loss per common share from discontinued operations |
(0.34 | ) | (1.50 | ) | (0.27 | ) | ||||||
| Net earnings per common share |
$ | (0.52 | ) | $ | (1.32 | ) | $ | 0.47 | ||||
F-15
Table of Contents
The following weighted average potential common shares were excluded from the computation of diluted net earnings per share as their effect would have been anti-dilutive:
| December 31, | ||||||
| 2009 | 2008 | 2007 | ||||
| (In thousands) | ||||||
| Stock options |
7,933 | 6,332 | 2,141 | |||
| Restricted stock |
188 | — | — | |||
| Warrants (1) |
7,955 | 7,955 | 7,955 | |||
| Convertible senior notes (1) |
8,486 | 8,486 | 8,486 | |||
| Total weighted average potential common shares excluded from diluted net earnings per share |
24,562 | 22,773 | 18,582 | |||
| (1) | In August 2006, in conjunction with the issuance of the Convertible Notes, the Company sold warrants to purchase up to 7.96 million shares of its common stock at a price of $32.9248 per share. The Company also entered into a convertible bond call option whereby the Company has options to purchase up to 7.96 million shares of the Company’s common stock at a price of $28.2829 per share. For additional information on the terms of these instruments, see Note 6. In addition, in connection with a 2007 acquisition the Company agreed to issue a warrant for the purchase of 0.9 million shares of its common stock. This warrant is not included in the table above, as it has not been issued. |
Goodwill and Other Intangibles from Acquisitions
Goodwill is reviewed for impairment annually, or more frequently, if facts and circumstances warrant a review. The provisions require that a two-step test be performed to assess goodwill for impairment. First, the fair value of each reporting unit is compared to its carrying value. If the fair value exceeds the carrying value, goodwill is not impaired and no further testing is performed. The second step is performed if the carrying value exceeds the fair value. The implied fair value of the reporting unit’s goodwill must be determined and compared to the carrying value of the goodwill. If the carrying value of a reporting unit’s goodwill exceeds its implied fair value, an impairment loss equal to the difference will be recorded.
Intangible assets with definite lives are amortized over their estimated useful life, generally three to twenty years, and reviewed for impairment when events and circumstances indicate that the intangible asset might be impaired.
Impairment of Long-Lived Assets and Long-Lived Assets to Be Disposed of, Excluding Goodwill and Indefinite-Lived Intangible Assets
The Company records impairment losses on long-lived assets, excluding goodwill and indefinite-lived intangible assets, used in operations when events and circumstances indicate that long-lived assets might be impaired and the undiscounted cash flows estimated to be generated by those assets are less than the carrying amounts of those assets. If required, the impairment recognized is the difference between the fair value of the asset and its carrying amount.
Software Development Costs
Capitalization of software development costs begins upon the establishment of technological feasibility, which is generally the completion of a working prototype that has been certified as having no critical bugs and is a release candidate or when alternative future use exists. To date, software development costs incurred between completion of a working prototype and general availability of the related product have not been material and have not been capitalized.
F-16
Table of Contents
Research and Development
Expenditures for research and development are expensed as incurred. The Company had no capitalized research and development costs as of December 31, 2009, 2008 or 2007.
Advertising Expenses
The Company expenses all advertising costs as incurred and for its continuing operations classifies these costs under selling, general and administrative expense.
(2) Financial Statement Details
Property and Equipment, Net (in thousands):
| December 31, | ||||||||
| 2009 | 2008 | |||||||
| Computer software and equipment |
$ | 76,336 | $ | 59,609 | ||||
| Software under capital lease |
— | 347 | ||||||
| Leasehold improvements |
15,365 | 12,317 | ||||||
| Furniture and fixtures |
5,534 | 5,378 | ||||||
| 97,235 | 77,651 | |||||||
| Less accumulated depreciation and amortization |
(54,111 | ) | (32,299 | ) | ||||
| Property and equipment, net |
$ | 43,124 | $ | 45,352 | ||||
Depreciation expense for our continuing operations for the years ended December 31, 2009, 2008, and 2007 were $18.4 million, $13.8 million, and $5.1 million, respectively.
Accounts payable and Accrued Expenses (in thousands):
| December 31, | ||||||
| 2009 | 2008 | |||||
| Accounts payable |
$ | 2,576 | $ | 3,544 | ||
| Accrued compensation |
32,914 | 28,499 | ||||
| Interest payable |
2,397 | 8,661 | ||||
| Other accrued liabilities |
43,482 | 44,982 | ||||
| Accounts payable and accrued expenses |
$ | 81,369 | $ | 85,686 | ||
Interest Income and Other, Net (in thousands):
| Year ended December 31, | ||||||||||
| 2009 | 2008 | 2007 | ||||||||
| Interest income |
$ | 3,357 | $ | 10,461 | $ | 21,134 | ||||
| Foreign currency gains |
670 | 1,299 | 2,029 | |||||||
| Other income (expense) |
367 | (28 | ) | 36 | ||||||
| Interest income and other, net |
$ | 4,394 | $ | 11,732 | $ | 23,199 | ||||
F-17
Table of Contents
Allowance for Doubtful Accounts (in thousands):
Continuing Operations
| Balance at Beginning of Period |
Additions | Deductions | Other | Balance at End of Period | |||||||||||
| 2009 |
$ | 2,879 | $ | 687 | $ | 439 | $ | — | $ | 3,127 | |||||
| 2008 |
$ | 447 | $ | 2,125 | $ | 199 | $ | 506 | $ | 2,879 | |||||
| 2007 |
$ | 974 | $ | 469 | $ | 996 | $ | — | $ | 447 | |||||
(3) Business Combinations
2009 Acquisitions
Muze Acquisition
On April 30, 2009, the Company acquired substantially all of the assets of Muze for approximately $17.0 million in cash. Muze provides metadata on video, music, games and books to retailers, Internet destinations, software producers, consumer electronics manufacturers and mobile service providers in the United States and Europe. The Company acquired Muze to expand its worldwide entertainment metadata portfolio and enhance its technology platform for delivering metadata.
The Company also paid approximately $8.3 million for a music metadata distribution business in the Asia Pacific region. This transaction closed on July 1, 2009.
2008 Acquisition
Gemstar Acquisition
On May 2, 2008, the Company acquired Gemstar in a cash and stock transaction. Gemstar was a technology, media and entertainment company that developed, licensed, marketed and distributed products and services targeted at the video guidance and entertainment needs of consumers worldwide. The total purchase price for Gemstar was approximately $2.65 billion.
The Company, based upon estimated fair values as of May 2, 2008, made an allocation of the purchase price to the net tangible and intangible assets acquired. The excess of the purchase price over the estimated fair value of the underlying net tangible and intangible assets has been recorded as goodwill. The Company acquired Gemstar to increase its product offerings and believes the combined Company’s complementary solutions will lead to increased market opportunity and an expanded customer base. The combination of the Company and Gemstar also provides the opportunity for cost savings. The Company believes these factors support the amount of goodwill recorded. The goodwill from this transaction is not tax deductible.
F-18
Table of Contents
The Company’s purchase price allocation is as follows (in thousands):
| Weighted Average Estimated Useful Life |
||||||||
| Cash and cash equivalents |
$ | 663,618 | ||||||
| Trade accounts receivable |
74,848 | |||||||
| Property and equipment |
72,546 | |||||||
| Goodwill |
932,755 | |||||||
| Identifiable intangible assets: |
||||||||
| Developed technology and patents |
13 | 774,080 | ||||||
| Trademarks/Tradenames |
20 | 141,630 | ||||||
| Customer relationships |
14 | 184,050 | ||||||
| Content database |
15 | 18,810 | ||||||
| Total identifiable intangible assets |
1,118,570 | |||||||
| Other assets |
56,667 | |||||||
| Accounts payable and other liabilities |
(144,708 | ) | ||||||
| Restructuring charge (See note 8) |
(21,162 | ) | ||||||
| Deferred tax liabilities, net |
(3,815 | ) | ||||||
| Deferred revenue |
(85,461 | ) | ||||||
| Capital lease obligations |
(11,898 | ) | ||||||
| Total purchase price |
$ | 2,651,960 | ||||||
Developed technology and patents relate to Gemstar’s products that are technologically feasible and Gemstar’s patents. Trademarks/Tradenames are primarily related to Gemstar’s brands and tradenames acquired. Customer relationships represent existing contracts that relate primarily to underlying customer relationships. Content represents the database of program listings and descriptions gathered over time. Identifiable intangible assets will be amortized on a straight-line basis over their estimated useful lives. Included in deferred tax liabilities, net above is a $378 million deferred tax asset (See Note 12).
2007 Acquisitions
All Media Guide Holdings, Inc.
In December 2007, the Company acquired All Media Guide Holdings, Inc. (“AMG”), a privately-held company based in Michigan, for a total of $82.3 million of purchase consideration, in a taxable transaction. AMG was one of the world’s largest providers of information databases and metadata for entertainment products (music, movies, and games) as well as solutions that support the recognition, discovery and management of digital media.
Self Protecting Digital Content (“SPDC”) Technology
In November 2007, the Company acquired SPDC from a privately held business in a taxable transaction, for $45.2 million, plus warrants exercisable for 0.9 million shares of the Company’s stock valued at $8.4 million. SPDC created the BD+ technology.
Mediabolic
On January 1, 2007, the Company acquired Mediabolic, Inc. (“Mediabolic”), a privately held company based in San Mateo, California, for $43.6 million. Mediabolic was a provider of software solutions for connected consumer electronics devices, such as televisions, set-top boxes and digital video recorders.
F-19
Table of Contents
Unaudited Pro Forma Financial Information
The unaudited pro forma financial information presented below (in thousands, except per share amounts) assumes the acquisition of Gemstar, AMG, and SPDC had occurred on January 1, 2007. The unaudited pro forma financial information does not include the results of Software, Games, eMeta and the Media Properties as these businesses have been classified as discontinued operations and does not reflect the 2009 acquisitions as these acquisitions were immaterial. The unaudited pro forma financial information assumes $275 million of net proceeds from the sale of these businesses was used to reduce the amount of debt outstanding as of January 1, 2007. The unaudited pro forma information presented is for illustrative purposes only and is not necessarily indicative of the results of operations that would have been realized if the acquisition had been completed on the date indicated, nor is it indicative of future operating results. The unaudited pro forma financial information does not include any adjustments for operating efficiencies or cost savings.
| Year Ended December 31, | |||||||
| 2008 (1) | 2007 (2) | ||||||
| Net revenue |
$ | 432,047 | $ | 398,328 | |||
| Operating income |
$ | 71,436 | $ | 7,661 | |||
| Income (loss) from continuing operations |
$ | 46,594 | $ | (38,639 | ) | ||
| Basic and diluted earnings (loss) per share from continuing operations |
$ | 0.45 | $ | (0.38 | ) | ||
| (1) | The year ended December 31, 2008, includes a $32.5 million pre-tax benefit from a Gemstar insurance settlement. |
| (2) | The year ended December 31, 2007, includes a $10.7 million pre-tax benefit from the resolution of matters related to a former Gemstar CEO. |
(4) Discontinued Operations and Assets Held for Sale
TV Guide Network and TV Guide Online
On February 28, 2009, the Company sold its TV Guide Network and TV Guide Online business units for approximately $242 million in cash, of which $36.8 million was deposited in a 15 month escrow account as a source of recovery in the event the buyer has an indemnifiable claim. The Company has recorded this $36.8 million as restricted cash on its Consolidated Balance Sheet.
The assets and liabilities attributable to the Company’s TV Guide Network and TV Guide Online business units classified in the Consolidated Balance Sheet as held for sale at December 31, 2008, consist of the following (in thousands):
| December 31, 2008 |
||||
| Trade accounts receivable, net |
$ | 17,320 | ||
| Property and equipment, net |
22,914 | |||
| Other assets |
4,893 | |||
| Goodwill and intangible assets |
223,595 | |||
| Accounts payable and other liabilities |
(11,749 | ) | ||
| Capital lease |
(11,456 | ) | ||
| Deferred revenue |
(8,574 | ) | ||
| Total net assets held for sale |
$ | 236,943 | ||
TVG Network
On January 27, 2009, the Company sold its TVG Network business unit for approximately $50.7 million. Included in the net assets sold was $11.9 million in cash.
F-20
Table of Contents
The assets and liabilities attributable to the Company’s TVG Network business unit classified in Consolidated Balance Sheet as held for sale at December 31, 2008, consist of the following (in thousands):
| December 31, 2008 |
||||
| Trade accounts receivable, net |
$ | 5,255 | ||
| Property and equipment, net |
3,927 | |||
| Other assets |
1,499 | |||
| Goodwill and intangible assets |
50,119 | |||
| Accounts payable and other liabilities |
(24,242 | ) | ||
| Total net assets held for sale |
$ | 36,558 | ||
TV Guide Magazine
On December 1, 2008, the Company sold its TV Guide Magazine business unit in exchange for the assumption of its net liabilities. During the third quarter of 2009, the Company made a $2.6 million payment to the buyer of TV Guide Magazine to settle the final working capital adjustment. This payment is recorded in proceeds from disposition of businesses, net of costs to sell on the Consolidated Statement of Cash Flows.
eMeta
On November 17, 2008, the Company sold its eMeta business for $0.8 million in cash.
Software
On April 1, 2008, the Company sold its Software business unit for $191 million and its Games business unit for $4 million in cash.
All Discontinued Operations
The results of operations of the Company’s discontinued businesses through the date of disposition consists of the following (in thousands):
| Year Ended December 31, | ||||||||||||
| 2009 | 2008 | 2007 | ||||||||||
| Net revenue: |
||||||||||||
| Software |
$ | — | $ | 27,503 | $ | 112,914 | ||||||
| Games |
— | 1,633 | 9,177 | |||||||||
| eMeta |
— | 6,222 | 10,742 | |||||||||
| TV Guide Magazine |
— | 70,072 | — | |||||||||
| TV Guide Network / TV Guide Online |
20,319 | 85,656 | — | |||||||||
| TVG Network |
2,616 | 38,145 | — | |||||||||
| Pre-tax (loss) income |
||||||||||||
| Software (1) |
$ | — | $ | (7,187 | ) | $ | 11,701 | |||||
| Games (2) |
— | (2,551 | ) | (33,215 | ) | |||||||
| eMeta (3) |
— | (11,630 | ) | (3,396 | ) | |||||||
| TV Guide Magazine |
— | (13,422 | ) | — | ||||||||
| TV Guide Network / TV Guide Online (4) |
1,825 | (126,610 | ) | — | ||||||||
| TVG Network (5) |
(694 | ) | (67,859 | ) | — | |||||||
| Pre-tax (loss) gain on disposal of business units |
(3,661 | ) | 153,273 | — | ||||||||
| Income tax (expense) benefit |
(31,716 | ) | (53,797 | ) | 10,373 | |||||||
| Loss from discontinued operations, net of tax |
$ | (34,246 | ) | $ | (129,783 | ) | $ | (14,537 | ) | |||
F-21
Table of Contents
| (1) | Software pre-tax income in 2007 included $8.3 million of restructuring and asset impairment charges and $7.0 million in legal settlement charges. |
| (2) | Games pre-tax loss in 2007 included $13.2 million of restructuring charges and asset impairment charges. |
| (3) | eMeta pre-tax loss in 2008 included $6.7 million in goodwill and intangible asset impairment charges. |
| (4) | TV Guide Network / TV Guide Online pre-tax loss in 2008 included $138.3 million in goodwill and intangible asset impairment charges. |
| (5) | TVG Network pre-tax loss in 2008 included $70.0 million in goodwill and intangible asset impairment charges. |
(5) Goodwill and Other Intangibles
The Company assesses goodwill and indefinite-lived intangible assets for impairment annually as of October 1, or more frequently if circumstances indicate impairment may have occurred. To accomplish this, the Company determined the fair value of its reporting unit using a market approach and a discounted cash flow approach and compared it to the carrying amount of the reporting unit at the balance sheet date. There were no impairment charges related to continuing operations for any of the reported periods. See Note 4 regarding impairment charges for discontinued operations.
Goodwill information is as follows for continuing operations (in thousands):
| Balance at Beginning of Period |
Goodwill Acquired |
Assets Held for Sale |
Foreign Currency Translation |
Balance at End of Period | |||||||||||||
| 2009 |
$ | 828,185 | $ | 22,256 | $ | — | $ | 3,624 | $ | 854,065 | |||||||
| 2008 |
$ | 199,209 | $ | 927,330 | $ | (295,305 | ) | $ | (3,049 | ) | $ | 828,185 | |||||
During the second quarter of 2009, the Company completed extensive consumer research regarding its brands. This consumer research indicated that the brands acquired by the Company did not represent the future vision of the Company and did not carry a positive connotation in the market. The Company determined these results to be an indicator of potential impairment of its trademark intangible assets. The Company determined the fair value of its trademark intangible assets using the relief-from-royalty method. The relief-from-royalty method uses Level 3 inputs to estimate the after-tax saving enjoyed by owning the assets as opposed to paying a third party for its use. The Company determined the fair value of its trademark and intangible assets to be $8.3 million and recorded a $43.1 million impairment charge during the second quarter of 2009. This impairment charge is included in restructuring and asset impairment charges on the Consolidated Statements of Operations.
The following tables summarize the Company’s intangible assets for its continuing operations subject to amortization as of December 31, 2009 and 2008 (in thousands)
| December 31, 2009 | ||||||||||
| Gross Costs |
Accumulated Amortization |
Net | ||||||||
| Developed technology and patents |
$ | 827,838 | $ | (131,201 | ) | $ | 696,637 | |||
| Existing contracts and customer relationships |
46,577 | (11,323 | ) | 35,254 | ||||||
| Content databases |
50,973 | (10,086 | ) | 40,887 | ||||||
| Trademarks / Tradenames |
8,300 | (1,707 | ) | 6,593 | ||||||
| $ | 933,688 | $ | (154,317 | ) | $ | 779,371 | ||||
F-22
Table of Contents
| December 31, 2008 | ||||||||||
| Gross Costs |
Accumulated Amortization |
Net | ||||||||
| Developed technology and patents |
$ | 826,968 | $ | (61,438 | ) | $ | 765,530 | |||
| Existing contracts and customer relationships |
43,635 | (6,800 | ) | 36,835 | ||||||
| Content database |
44,652 | (4,690 | ) | 39,962 | ||||||
| Trademarks / Tradenames |
55,047 | (2,303 | ) | 52,744 | ||||||
| $ | 970,302 | $ | (75,231 | ) | $ | 895,071 | ||||
The following table summarizes the Company’s estimated amortization expense through the year 2014 and thereafter (in thousands):
| Year ending |
Amortization Expense | ||
| 2010 |
$ | 79,917 | |
| 2011 |
76,808 | ||
| 2012 |
72,896 | ||
| 2013 |
70,835 | ||
| 2014 |
69,981 | ||
| Thereafter |
408,934 | ||
| Total amortization expense |
$ | 779,371 | |
(6) Debt
Senior Secured Term Loan
In connection with the Gemstar acquisition, the Company, entered into a $550 million five year senior secured term loan credit facility (“Term Loan”). As of December 31, 2009, $207.2 million was outstanding. The Term Loan is guaranteed by Company domestic subsidiaries, and the assets and shares of Company domestic subsidiaries are pledged as collateral against the Term Loan. The Company is required to use the proceeds from asset sales of $75 million or more to pay down the Term Loan; proceeds from assets sales of less than $75 million may be retained for investment in fixed or capital assets. The Company may elect to pay interest at a rate of (i) libor plus 3.75%, with a libor floor of 3.5% or (ii) the Term Loan administrative agent’s prime rate plus 2.75%. As of December 31, 2009, the interest rate is 6%. The Term Loan includes customary covenants, including total leverage ratio limits, fixed charge coverage minimums and restrictions on additional debt incurrance and dividend payments among others. Beginning in 2010, the Company is required to make a payment on the Term Loan each February. This payment is a percentage, as calculated per the Term Loan agreement, of the prior year’s Excess Cash Flow, as defined in the Term Loan agreement. The payment due in February 2010 is $18.5 million. As of December 31, 2009, the Company was in compliance with the Term Loan debt covenants.
In the event (i) the Company’s leverage ratio is greater than 2.5 to 1.0, and (ii) more than $50 million in aggregate principal amount of the 2.625% convertible senior notes due 2011 (the “Convertible Notes”) is still outstanding, and (iii) the scheduled maturity of the Convertible Notes is more than 181 days in the future, then our Term Loan will become due on that 182nd day prior to the Convertible Notes’ maturity date.
Note issuance costs related to the Term Loan are being amortized to interest expense over the term of the Term Loan and have been included in “Other Assets” on the consolidated balance sheet. Note issuance costs related to the term loan were $15.1 million as of December 31, 2009.
F-23
Table of Contents
11% Senior Notes
In connection with the Gemstar acquisition, the Company issued $100 million of 11% senior notes (“11% Senior Notes”) due 2013. On August 5, 2009, the Company redeemed the $100 million 11% Senior Notes at par plus accrued interest and a $2.8 million make-whole payment representing the discounted value of interest which the note holders would have received through November 15, 2009, the first date the 11% Senior Notes could be retired without a premium. In addition, the Company paid $0.6 million to the Term Loan holders to obtain their consent to redeem the 11% Senior Notes. In connection with the redemption of the 11% Senior Notes, the Company has recorded an $8.7 million loss on debt redemption on its Consolidated Statement of Operations for the year ended December 31, 2009. This loss is comprised of the $2.8 million make-whole payment discussed above, the write-off of $5.6 million in note issuance costs and $0.3 million in fees associated with the note redemption.
Convertible Senior Notes
In August 2006, the Company issued, in a private offering, $240.0 million in 2.625% convertible senior notes (Convertible Notes) due 2011 at par. The Convertible Notes may be converted, under certain circumstances described below, based on an initial conversion rate of 35.3571 shares of common stock per $1,000 principal amount of notes (which represents an initial conversion price of approximately $28.28 per share).
Prior to June 15, 2011, holders may convert their Convertible Notes into cash and the Company’s common stock, at the applicable conversion rate, under any of the following circumstances: (i) during any fiscal quarter after the calendar quarter ending September 30, 2006, if the last reported sale price of the Company’s common stock for at least 20 trading days during the 30 consecutive trading days ending on the last trading day of the immediately preceding calendar quarter is greater than or equal to 120% of the applicable conversion price in effect on the last trading day of the immediately preceding fiscal quarter; (ii) during the five business-day period after any ten consecutive trading-day period (the “measurement period”) in which the trading price per note for each day of such measurement period was less than 98% of the product of the last reported sale price of the Company’s common stock and the conversion rate on each such day; or (iii) upon the occurrence of specified corporate transactions, as defined in the indenture. From June 15, 2011 until the close of business on the scheduled trading day immediately preceding the maturity date of August 15, 2011, holders may convert their Convertible Notes into cash and shares of the Company’s common stock, if any, at the applicable conversion rate, at any time, regardless of the foregoing circumstances.
Upon conversion, a holder will receive the conversion value of the Convertible Notes converted equal to the conversion rate multiplied by the volume weighted average price of the Company’s common stock during a specified period following the conversion date. The conversion value of each Convertible Note will be paid in: (i) cash equal to the lesser of the principal amount of the Convertible Note or the conversion value, as defined, and (ii) to the extent the conversion value exceeds the principal amount of the Convertible Note, a combination of common stock and cash. In addition, upon a fundamental change at any time, as defined, the holders may require the Company to repurchase for cash all or a portion of their Convertible Notes upon a “designated event” at a price equal to 100% of the principal amount of the Convertible Notes being repurchased plus accrued and unpaid interest, if any.
The Company pays cash interest at an annual rate of 2.625%, semi-annually on February 15 and August 15 of each year. Note issuance costs are being amortized to interest expense over the term of the Convertible Notes and have been included in “Other Assets” on the consolidated balance sheet. Note issuance costs related to the Convertible Notes were $1.9 million as of December 31, 2009.
Concurrently with the issuance of the Convertible Notes, the Company entered into a convertible bond call option whereby the Company has options to purchase up to 7.96 million shares, subject to anti-dilution adjustments similar to those contained in the Convertible Notes, of the Company’s common stock at a price of
F-24
Table of Contents
approximately $28.28 per share. These options expire on August 15, 2011 and must be settled in net shares. The cost of the convertible bond call option was approximately $46.1 million and has been recorded as a reduction to stockholders’ equity.
In addition, the Company sold warrants to purchase up to 7.96 million shares of its common stock at a price of $32.9248 per share. The warrants expire on various dates from August 16, 2011 through the 104th scheduled trading day following August 16, 2011, and must be settled in net shares. The Company received approximately $30.3 million in cash proceeds for the sales of these warrants which have been recorded as an increase to stockholders’ equity.
On January 1, 2009, the Company adopted an update to Financial Accounting Standards Board (“FASB”) Accounting Standards Codification (“ASC”) topic 470 related to accounting for convertible debt instruments that may be settled in cash upon conversion (including partial cash settlement) (formerly FASB Staff Position APB 14-1). This update specifies that issuers of such instruments should separately account for the liability and equity components in a manner that will reflect the entity’s nonconvertible debt borrowing rate on the instrument’s issuance date when interest cost is recognized. The Company applied the provisions retrospectively to all periods presented resulting in an increase to interest expense of $8.5 million, an increase to income tax benefit of $3.3 million, an increase to net loss of $5.2 million and an increase in diluted loss per share of $0.06 for the year ended December 31, 2008. For the year ended December 31, 2007, applying the provisions of the update resulted in an increase to interest expense of $7.8 million, a decrease to income tax expense of $1.6 million, a decrease to net income of $6.2 million, and a decrease in diluted earnings per share of $0.11. Additionally, stockholders’ equity as of December 31, 2008 and 2007, was increased by $15.9 million and $21.3 million, respectively. In addition, as of December 31, 2008, current deferred tax assets, net increased by $0.2 million, other long-term assets decreased by $0.7 million, long-term deferred tax liabilities, net increased by $10.2 million and long-term debt was decreased by $26.6 million.
As of December 31, 2009 and 2008, the principal amount of the Company’s Convertible Notes was $240.0 million. As of December 31, 2009 and 2008, the unamortized discount on the Convertible Notes due to applying these provisions was $17.2 million and $26.6 million, resulting in a carrying amount of $222.8 million and $213.4 million, respectively. During the years ended December 31, 2009, 2008 and 2007, the Company recorded $9.4 million, $8.7 million and $8.1 million, respectively, of interest expense for the Convertible Notes related to the amortization of the discount resulting in an effective yield of approximately 7.4%.
F-25
Table of Contents
(7) Cash, Cash Equivalents, Investments and Fair Value
The following is a summary of available-for-sale and other investment securities (in thousands) as of December 31, 2009:
| Cost | Unrealized Gains |
Unrealized Losses |
Fair Value | ||||||||||
| Cash |
$ | 36,801 | $ | — | $ | — | $ | 36,801 | |||||
| Cash Equivalents—money markets |
128,609 | — | — | 128,609 | |||||||||
| Total cash and cash equivalents |
$ | 165,410 | — | — | $ | 165,410 | |||||||
| Restricted cash |
$ | 36,838 | $ | — | $ | — | $ | 36,838 | |||||
| Available-for-sale investments: |
|||||||||||||
| Auction rate securities |
$ | 17,100 | $ | — | $ | (1,821 | ) | $ | 15,279 | ||||
| Corporate debt securities |
38,583 | 189 | (24 | ) | 38,748 | ||||||||
| Treasury/Agencies |
22,300 | 1 | (17 | ) | 22,284 | ||||||||
| Total available-for-sale investments |
$ | 77,983 | $ | 190 | $ | (1,862 | ) | $ | 76,311 | ||||
| Auction rate securities classified as trading |
$ | 51,952 | |||||||||||
| ARS Put Option |
$ | 5,773 | |||||||||||
| Total cash, cash equivalents, restricted cash and investments |
$ | 336,284 | |||||||||||
The following is a summary of available-for-sale securities (in thousands) as of December 31, 2008:
| Cost | Unrealized Gains |
Unrealized Losses |
Fair Value | ||||||||||
| Cash |
$ | 37,271 | — | — | $ | 37,271 | |||||||
| Cash Equivalents—money markets |
154,842 | — | — | 154,842 | |||||||||
| Cash Equivalents—0-90 day investments |
7,072 | 4 | (1 | ) | 7,075 | ||||||||
| Total cash and cash equivalents |
$ | 199,185 | $ | 4 | $ | (1 | ) | $ | 199,188 | ||||
| Available-for-sale investments: |
|||||||||||||
| Auction rate securities |
$ | 17,100 | — | $ | (2,758 | ) | $ | 14,342 | |||||
| Commercial paper |
22,066 | 24 | (21 | ) | 22,069 | ||||||||
| Corporate debt securities |
24,184 | 188 | (37 | ) | 24,335 | ||||||||
| Treasury/Agencies |
32,329 | 43 | (25 | ) | 32,347 | ||||||||
| US and municipal securities |
7,381 | 20 | — | 7,401 | |||||||||
| Total available-for-sale investments |
$ | 103,060 | $ | 275 | $ | (2,841 | ) | $ | 100,494 | ||||
| Auction rate securities classified as trading |
$ | 52,005 | |||||||||||
| ARS Put Option |
$ | 10,370 | |||||||||||
| Total cash, cash equivalents and investments |
$ | 362,057 | |||||||||||
In 2008, the Company recognized $10.4 million in other-than-temporary impairments due to the transfer of certain auction rate securities from available-for-sale to trading (See Note 1).
F-26
Table of Contents
The following table summarizes the fair value and gross unrealized losses related to available-for-sale securities, aggregated by investment category and length of time that individual securities have been in a continuous unrealized loss position as of December 31, 2009 and 2008 (in thousands):
| December 31, 2009 | |||||||||||||||||||
| Less than 12 Months | 12 Months or Longer | Total | |||||||||||||||||
| Description of Securities |
Fair Value | Unrealized Loss |
Fair Value | Unrealized Loss |
Fair Value | Unrealized Loss |
|||||||||||||
| Auction rate securities |
— | — | 15,279 | (1,821 | ) | $ | 15,279 | $ | (1,821 | ) | |||||||||
| Corporate securities |
6,173 | (24 | ) | — | — | 6,173 | (24 | ) | |||||||||||
| Treasuries / Agencies |
14,972 | (17 | ) | — | — | 14,972 | (17 | ) | |||||||||||
| December 31, 2008 | |||||||||||||||||||
| Less than 12 Months | 12 Months or Longer | Total | |||||||||||||||||
| Description of Securities |
Fair Value | Unrealized Loss |
Fair Value | Unrealized Loss |
Fair Value | Unrealized Loss |
|||||||||||||
| Auction rate securities |
$ | 14,342 | $ | (2,758 | ) | — | — | $ | 14,342 | $ | (2,758 | ) | |||||||
| Commercial paper |
9,970 | (21 | ) | — | — | 9,970 | (21 | ) | |||||||||||
| Corporate securities |
8,365 | (37 | ) | — | — | 8,365 | (37 | ) | |||||||||||
| Treasuries / Agencies |
8,916 | (25 | ) | — | — | 8,916 | (25 | ) | |||||||||||
Market values were determined for each individual security in the investment portfolio. The Company attributes the unrealized losses in its auction rate securities portfolio to liquidity issues rather than credit issues. The Company’s available-for-sale auction rate securities portfolio at December 31, 2009 is comprised solely of AAA rated investments, in federally insured student loans and municipal and educational authority bonds. Due to the Company’s belief that the market for such securities may take in excess of twelve months to fully recover and because the Company has the ability and intent to hold these investments until the market recovers, the Company has classified these investments as long-term marketable securities on the Consolidated Balance Sheet at December 31, 2009. The Company continues to earn interest on all of its auction rate security instruments.
The following inputs, as defined under FASB ASC 820, were used to determine the fair value of the Company’s investment securities at December 31, 2009 (in thousands):
| Total | Quoted Prices in Active Markets for Identical Assets |
Significant Other Observable Inputs |
Significant Unobservable Inputs | |||||||||
| (Level 1) | (Level 2) | (Level 3) | ||||||||||
| Money market funds |
$ | 128,609 | $ | 128,609 | $ | — | $ | — | ||||
| Money market funds (restricted cash) |
36,838 | 36,838 | — | — | ||||||||
| Fixed income available-for-sale securities |
61,032 | — | 61,032 | — | ||||||||
| Auction rate securities (Available-for-sale) |
15,279 | — | — | 15,279 | ||||||||
| Auction rate securities (Trading) |
51,952 | — | — | 51,952 | ||||||||
| ARS Put Option |
5,773 | — | — | 5,773 | ||||||||
| Total |
$ | 299,483 | $ | 165,447 | $ | 61,032 | $ | 73,004 | ||||
F-27
Table of Contents
The following table provides a summary of changes in the Company’s Level 3 auction rate securities and ARS Put Option as of December 31, 2009 (in thousands):
| Balance at December 31, 2008 |
$ | 76,717 | ||
| Gain on ARS classified as trading and recorded in other income |
4,597 | |||
| Unrealized gain included in accumulated other comprehensive income |
936 | |||
| ARS Put Option loss recorded in other income |
(4,596 | ) | ||
| Settlements |
(4,650 | ) | ||
| Balance at December 31, 2009 |
$ | 73,004 | ||
The following inputs were used to determine the fair value of the Company’s outstanding debt at December 31, 2009 (in thousands):
| Carrying Value |
Quoted Prices in Active Markets (Level 1) |
Significant Other Observable Inputs (Level 2) | |||||||
| Term Loan |
$ | 207,248 | $ | — | $ | 207,766 | |||
| Convertible Notes (1) |
222,789 | $ | 298,428 | $ | — | ||||
| $ | 430,037 | ||||||||
| (1) | The principal amount of the Convertible Notes is $240 million (see Note 4). |
(8) Restructuring and Asset Impairment Charges
Muze Restructuring Plan
In connection with the acquisition of the assets of Muze (see Note 3), management implemented a plan to restructure Muze’s operations resulting in a charge of $0.9 million during the second quarter of 2009. This was done to eliminate redundancies with the Company’s entertainment metadata business. This charge included $0.7 million for employee severance and a $0.2 million liability for the fair value of future lease payments on abandoned office space. The Company paid all of the employee severance costs in 2009. As of December 31, 2009, the Company had a liability of $0.1 million remaining for the future lease payments related to the abandoned office space.
Q109 Restructuring Plan
In conjunction with the disposition of the Media Properties, the Company’s management approved several actions resulting in a restructuring and asset impairment charge of $8.4 million. This was done to create cost efficiencies for the Company now that it no longer supports the Media Properties. These charges included $1.3 million in severance, a $2.9 million liability for the fair value of future lease payments on abandoned office space and $4.2 million in non–cash asset impairment charges related to the abandoned office space. The Company paid all of the employee severance costs in 2009. As of December 31, 2009, the liability for future lease payments related to the abandoned office space was $2.7 million.
Gemstar Acquisition Restructuring Plan
In conjunction with the Gemstar acquisition, management acted upon a pre-acquisition plan to restructure certain Gemstar operations resulting in severance of $21.2 million. This was done in order to create cost efficiencies for the combined Company. The severance liability was recognized as an assumed liability in the Gemstar acquisition and, accordingly, resulted in an increase to goodwill. As of December 31, 2008, the Company had paid $19.1 million of these costs and had a remaining liability of $2.1 million. During 2009, the Company paid $1.8 million of these costs and had a remaining liability of $0.3 million as of December 31, 2009.
F-28
Table of Contents
2007 Restructuring Plan
During fiscal year 2007, the Company’s Board of Directors approved several restructuring actions and an organizational realignment program. In addition, the Company discontinued its Hawkeye anti-piracy service. In connection with these actions, the Company recognized a total of $19.1 million in restructuring and asset impairment charges, of which $4.5 million relates to continuing operations. The continuing operations amount consists of $2.5 million in workforce reduction costs, $1.1 million in contract terminations, $0.5 million in asset impairment charges, and $0.4 million in abandonment of certain leased facilities. Workforce reduction costs consist of severance and related benefits in connection with the restructuring actions, the organizational realignment program and the discontinuation of the Hawkeye anti-piracy service. Contract terminations were related to the cancellation of certain service contracts in connection with the data center restructuring program and the discontinuation of the Hawkeye anti-piracy service. Asset impairment charges were related to asset losses in connection with the data center restructuring and the discontinuation of the Hawkeye anti-piracy service. The charge for the abandonment of leased facilities is related to the New York office space that was vacated in connection with the restructuring programs.
A summary of the restructuring and asset impairment amounts included in the Company’s consolidated statements of operations and the restructuring accrual activity was as follows (in thousands):
| Termination Benefits |
Contract Terminations |
Abandonment of Facilities |
Asset Impairment |
Total | ||||||||||||||||
| Charges and activity—continuing operations: |
||||||||||||||||||||
| Balance of accrual at January 1, 2007 |
$ | — | $ | — | $ | — | $ | — | $ | — | ||||||||||
| Charged during the year to continuing operations |
2,573 | 1,100 | 371 | 502 | 4,546 | |||||||||||||||
| Asset impairments charged to continuing operations |
— | — | — | (502 | ) | (502 | ) | |||||||||||||
| Non-cash equity-based compensation |
(321 | ) | — | — | — | (321 | ) | |||||||||||||
| Cash payments |
(2,151 | ) | (302 | ) | (239 | ) | — | (2,692 | ) | |||||||||||
| Accrual Balance as of December 31, 2007—continuing operations |
101 | 798 | 132 | — | 1,031 | |||||||||||||||
| Accrual balance as of December 31, 2007—discontinued operations |
6 | 397 | — | — | 403 | |||||||||||||||
| Accrual Balance as of December 31, 2007 |
$ | 107 | $ | 1,195 | $ | 132 | $ | — | $ | 1,434 | ||||||||||
| Cash payments in 2008 |
(107 | ) | (766 | ) | (132 | ) | — | (1,005 | ) | |||||||||||
| Accrual Balance as of December 31, 2008 |
$ | — | $ | 429 | $ | — | $ | — | $ | 429 | ||||||||||
| Accrual reversal (1) |
— | (429 | ) | — | — | (429 | ) | |||||||||||||
| Accrual Balance as of December 31, 2009 |
$ | — | $ | — | $ | — | $ | — | $ | — | ||||||||||
| (1) | This reversal was recorded in restructuring and asset impairment charges in the Consolidated Statement of Operations during the first quarter of 2009. |
(9) Strategic Investments
During 2008, the Company sold its investment in Digimarc and recorded a gain of $5.2 million. In 2006, the Company invested $5.0 million in a privately-held digital watermarking company. During the year ended December 31, 2007, the Company recorded a $5.0 million charge for other-than-temporary impairment losses related to such investment.
F-29
Table of Contents
(10) Equity-based Compensation
Stock Options Plans
The Company currently grants stock options and restricted stock awards from the 2008 Equity Incentive Plan (the “2008 Plan”) and the 2000 Equity Incentive Plan (the “2000 Plan”).
As of December 31, 2009, the Company had a total of 29.6 million shares reserved and 13.4 million shares available for issuance under the 2000 and 2008 Plans. The 2000 and 2008 Plans provide for the grant of stock options, restricted stock awards and similar types of equity awards by the Company to employees, officers, directors and consultants of the Company. For options granted after July 15, 2008, the vesting period was generally four years where one quarter of the grant vests at the end of the first year, and the remainder vests monthly. For options granted prior to July 15, 2008, the vesting periods were generally three years where one-sixth vests in the first year, one-third vests in the second year and the remainder vests in the third year. Option grants have contractual terms ranging from five to ten years.
Restricted stock awards generally vest annually over four years. As of December 31, 2009, the number of shares awarded but unvested was 1.2 million.
Employee Stock Purchase Plan
The Company’s 2008 Employee Stock Purchase Plan (“ESPP”) allows eligible employee participants to purchase shares of the Company’s common stock at a discount through payroll deductions. The ESPP consists of a twenty-four month offering period with four six-month purchase periods in each offering period. Employees purchase shares in each purchase period at 85% of the market value of the Company’s common stock at either the beginning of the offering period or the end of the purchase period, whichever price is lower.
As of December 31, 2009, the Company had reserved, and available for future issuance, 7.0 million shares of common stock for issuance under the ESPP.
Valuation and Assumptions
The Company uses the Black-Scholes option pricing model to determine the fair value of stock options and employee stock purchase plan shares. The fair value of equity-based payment awards on the date of grant is determined by an option-pricing model using a number of complex and subjective variables. These variables include expected stock price volatility over the term of the awards, actual and projected employee stock option exercise behaviors, risk-free interest rate and expected dividends. The Company determines the fair value of its restricted stock awards as the difference between the market value of the awards on the date of grant less the exercise price of the awards granted.
Estimated volatility of the Company’s common stock for new grants is determined by using a combination of historical volatility and implied volatility in market traded options. When historical data is available and relevant, the expected term of options granted is determined by calculating the average term from historical stock option exercise experience. When there is insufficient historical exercise data to provide a reasonable basis upon which to estimate expected term due to changes in the terms of option grants, the Company uses the “simplified method” as permitted under Staff Accounting Bulletin No. 110. For options granted after July 15, 2008, the Company changed its standard vesting terms from three to four years and its contractual term from five to seven years. Since the Company did not have sufficient data for options with four year vesting terms and seven year contractual life, the simplified method was used to calculate expected term. The risk-free interest rate used in the option valuation model is from U.S. Treasury zero-coupon issues with remaining terms similar to the expected term on the options. The Company does not anticipate paying any cash dividends in the foreseeable future and therefore uses an expected dividend yield of zero in the option valuation model. In accordance with ASC Topic 718, Compensation – Stock Compensation, the Company estimates forfeitures at the time of grant and revises
F-30
Table of Contents
those estimates in subsequent periods if actual forfeitures differ from those estimates. The Company uses historical data to estimate pre-vesting option forfeitures and records equity-based compensation expense only for those awards that are expected to vest. The assumptions used to value equity-based payments are as follows:
| Year ended December 31, | |||||||||
| 2009 | 2008 | 2007 | |||||||
| Option Plans: |
|||||||||
| Dividends |
None | None | None | ||||||
| Expected term |
4.5 years | 3.5 years | 3.1 years | ||||||
| Risk free interest rate |
2.0 | % | 2.8 | % | 4.5 | % | |||
| Volatility rate |
44 | % | 43 | % | 37 | % | |||
| ESPP Plan: |
|||||||||
| Dividends |
None | None | None | ||||||
| Expected term |
1.3 years | 1.3 years | 1.3 years | ||||||
| Risk free interest rate |
0.7 | % | 2.1 | % | 4.9 | % | |||
| Volatility rate |
49 | % | 45 | % | 35 | % | |||
The weighted average fair values of equity-based awards are as follows:
| Year ended December 31, | |||||||||
| 2009 | 2008 | 2007 | |||||||
| Weighted average fair value: |
|||||||||
| Option grants |
$ | 8.57 | $ | 4.96 | $ | 8.23 | |||
| Restricted stock awards |
$ | 26.95 | $ | 15.50 | $ | 24.86 | |||
| Employee purchase share rights |
$ | 6.82 | $ | 3.98 | $ | 6.19 | |||
As of December 31, 2009, there was $39.8 million of unrecognized compensation cost, adjusted for estimated forfeitures, related to unvested equity-based payments granted to employees. Total unrecognized compensation cost will be adjusted for future changes in estimated forfeitures and is expected to be recognized over a weighted average period of 2.4 years.
Activity under the Company’s stock option plans is as follows:
| Shares | Weighted-average exercise price |
Weighted-average remaining contractual term (years) |
Aggregate Intrinsic Value (in thousands) | ||||||||
| Outstanding at December 31, 2006 |
7,682,435 | $ | 21.78 | ||||||||
| Granted |
1,073,959 | $ | 26.39 | ||||||||
| Canceled |
(1,259,670 | ) | $ | 27.00 | |||||||
| Exercised |
(3,081,440 | ) | $ | 19.46 | |||||||
| Outstanding at December 31, 2007 |
4,415,284 | $ | 23.03 | ||||||||
| Granted |
6,046,360 | $ | 14.22 | ||||||||
| Canceled |
(2,104,422 | ) | $ | 21.78 | |||||||
| Exercised |
(223,987 | ) | $ | 14.01 | |||||||
| Outstanding at December 31, 2008 |
8,133,235 | $ | 17.05 | ||||||||
| Granted |
2,180,098 | $ | 22.52 | ||||||||
| Canceled |
(1,203,269 | ) | $ | 18.65 | |||||||
| Exercised |
(1,563,001 | ) | $ | 17.59 | |||||||
| Outstanding at December 31, 2009 |
7,547,063 | $ | 18.27 | 4.3 | $ | 103,147 | |||||
| Vested and expected to vest at December 31, 2009 |
5,947,875 | $ | 18.54 | 4.2 | $ | 79,742 | |||||
| Exercisable at December 31, 2009 |
2,308,059 | $ | 19.87 | 2.8 | $ | 28,146 | |||||
F-31
Table of Contents
The total intrinsic value of options exercised during the years ended December 31, 2009, 2008, and 2007 was $16.9 million, $0.6 million, and $23.7 million, respectively. The intrinsic value is calculated as the difference between the market value on the date of exercise and the exercise price of the shares.
Activity related to the Company’s restricted awards is as follows:
| Shares | Weighted-average Grant-Date Fair Value |
Aggregate Fair Value (1) (in thousands) | |||||||
| Outstanding at December 31, 2006 |
672,780 | $ | 20.01 | ||||||
| Granted |
910,985 | $ | 24.86 | ||||||
| Vested |
(157,499 | ) | $ | 20.02 | $ | 3,895 | |||
| Forfeited |
(185,252 | ) | $ | 19.48 | |||||
| Outstanding at December 31, 2007 |
1,241,014 | $ | 23.66 | ||||||
| Granted |
220,000 | $ | 15.50 | ||||||
| Vested |
(368,700 | ) | $ | 23.03 | $ | 5,436 | |||
| Forfeited |
(283,104 | ) | $ | 23.54 | |||||
| Outstanding at December 31, 2008 |
809,210 | $ | 21.77 | ||||||
| Granted |
717,055 | $ | 26.95 | ||||||
| Vested |
(281,046 | ) | $ | 22.04 | $ | 6,842 | |||
| Forfeited |
(15,619 | ) | $ | 24.10 | |||||
| Outstanding at December 31, 2009 |
1,229,600 | $ | 24.70 | ||||||
| (1) | Represents the fair value of the restricted award on the day the award vested. |
The Company recorded $22.6 million, $13.6 million and $9.8 million in stock compensation expense from continuing operations for the years ended December 31, 2009, 2008 and 2007, respectively.
(11) Stock Repurchase Program
In September 2007, the Board of Directors of Macrovision Corporation authorized a stock repurchase program, which allowed Macrovision Corporation to purchase up to $60.0 million of the Macrovision Corporation’s common stock in the open market from time to time at prevailing market prices or otherwise, as conditions warrant. On May 5, 2008, the Board of Directors of the Company reconfirmed this stock purchase program. During the fourth quarter of 2008, the Company repurchased 2.3 million shares of common stock for $25.1 million. These repurchases were recorded as treasury stock and resulted in a reduction of stockholders’ equity. As of December 31, 2008, treasury stock consisted of 2.3 million shares of common stock that had been repurchased, with a cost basis of approximately $25.1 million.
In August 2006, the Board of Directors of Macrovision Corporation authorized the purchase of up to $100.0 million of Macrovision Corporation’s common stock. In the year ended December 31, 2006, Macrovision Corporation repurchased approximately 2.3 million shares of common stock for $50.0 million. In August and September 2007, Macrovision Corporation repurchased the remaining $50.0 million authorized under the program, or approximately 2.1 million shares of common stock. These repurchases were recorded as treasury stock and resulted in a reduction of stockholders’ equity. As of December 31, 2007, there were no shares remaining for repurchase under the August 2006 program. As of December 31, 2007, treasury stock consisted of 7.4 million shares of common stock that had been repurchased, with a cost basis of approximately $138.4 million. As part of the Company’s assumption of ownership of both Gemstar and Macrovision Corporation (See Note 1) all treasury stock held by Macrovision Corporation was canceled.
F-32
Table of Contents
(12) Income Taxes
The components of income from continuing operations before income taxes are as follows (in thousands):
| Year Ended December 31, | |||||||||||
| 2009 | 2008 | 2007 | |||||||||
| Domestic income |
$ | (47,780 | ) | $ | (65,982 | ) | $ | 6 | |||
| Foreign income |
27,654 | 58,296 | 54,315 | ||||||||
| Income before provision for income taxes |
$ | (20,126 | ) | $ | (7,686 | ) | $ | 54,321 | |||
Disclosures for 2008 and 2007 have been updated to reflect the adoption of updates to ASC Topic 470 (See Note 6).
Income tax expense for the years ended December 31, 2009, 2008 and 2007 consisted of the following (in thousands):
| Year Ended December 31, | ||||||||||||
| 2009 | 2008 | 2007 | ||||||||||
| Current: |
||||||||||||
| Federal |
$ | 3,983 | $ | (57,862 | ) | $ | 17,814 | |||||
| State |
4,609 | 451 | (138 | ) | ||||||||
| Foreign |
11,058 | 10,559 | 3,694 | |||||||||
| Total current (benefit) expense |
19,650 | (46,852 | ) | 21,370 | ||||||||
| Deferred: |
||||||||||||
| Federal |
(17,471 | ) | 22,251 | (5,644 | ) | |||||||
| State |
(3,600 | ) | 1,192 | (1,258 | ) | |||||||
| Total deferred tax (benefit) expense |
(21,071 | ) | 23,443 | (6,902 | ) | |||||||
| Total tax expense (benefit) from continuing operations |
$ | (1,421 | ) | $ | (23,409 | ) | $ | 14,468 | ||||
| Total tax expense (benefit) from discontinued operations |
$ | 31,716 | $ | 53,797 | $ | (10,373 | ) | |||||
Income tax expense for the years ended December 31, 2009, 2008, and 2007 differed from the amounts computed by applying the U.S. federal income tax rate of 35% to pretax income as a result of the following (in thousands):
| Year ended December 31, | ||||||||||||
| 2009 | 2008 | 2007 | ||||||||||
| Federal tax statutory rate |
$ | (7,044 | ) | $ | (2,690 | ) | $ | 19,012 | ||||
| State taxes, net of federal benefit |
(1,727 | ) | 84 | (1,082 | ) | |||||||
| Tax credits |
(213 | ) | (1,368 | ) | (880 | ) | ||||||
| Tax impact on foreign operations and transfer pricing, net |
(2,304 | ) | (8,717 | ) | (2,460 | ) | ||||||
| Exempt interest |
(31 | ) | (137 | ) | (2,393 | ) | ||||||
| Settlements and statute closures |
— | (8,868 | ) | — | ||||||||
| Compensation expense |
4,842 | 529 | 379 | |||||||||
| Increase to contingencies |
3,578 | — | — | |||||||||
| Change in valuation allowance |
— | (3,648 | ) | — | ||||||||
| Others |
1,478 | 1,406 | 1,892 | |||||||||
| Total tax (benefit) expense |
$ | (1,421 | ) | $ | (23,409 | ) | $ | 14,468 | ||||
F-33
Table of Contents
The tax effects of the temporary differences that give rise to significant portions of the deferred tax assets and liabilities are presented below (in thousands):
| December 31, | ||||||||
| 2009 | 2008 | |||||||
| Deferred tax assets: |
||||||||
| Accruals, reserves and others |
$ | 17,455 | $ | 14,792 | ||||
| Impairment losses on investments |
8,415 | 16,701 | ||||||
| Equity-based compensation |
8,462 | 7,922 | ||||||
| Deferred revenue |
5,467 | 9,362 | ||||||
| Credits |
15,247 | 9,840 | ||||||
| Others |
18,257 | 18,134 | ||||||
| Net operating loss carryforwards |
249,718 | 367,464 | ||||||
| Total deferred tax assets |
323,021 | 444,215 | ||||||
| Deferred tax liabilities: |
||||||||
| Intangible assets |
(293,549 | ) | (419,134 | ) | ||||
| Others |
(7,937 | ) | (5,458 | ) | ||||
| Total deferred tax liabilities |
(301,486 | ) | (424,592 | ) | ||||
| Net deferred tax assets |
$ | 21,535 | $ | 19,623 | ||||
As of December 31, 2008, the Company released a valuation allowance of $3.6 million for capital loss carryforwards due to its ability to recognize these deferred tax assets. In addition, the Company increased net deferred tax assets recorded in conjunction with the Gemstar acquisition by $378 million with an offsetting decrease in goodwill.
As of December 31, 2009, the Company had federal tax loss carryforwards of approximately $734.5 million, of which $21.0 million related to stock option deductions and are not included in deferred tax assets. The federal loss carryforwards will expire in 2012 through 2028. The Company has state net operating loss carryforwards of approximately $37.3 million as of December 31, 2009. The state loss carryforwards will expire in 2010 through 2017.
The Company has federal research and development and foreign tax credits available to reduce future income tax expense of approximately $3.9 million and $11.4 million, respectively. The federal research credits will expire in 2024 through 2029 and the foreign tax credits will expire in 2014 through 2019.
Utilization of state and federal net operating loss and credit carryforwards may be subject to limitations due to ownership changes.
F-34
Table of Contents
The Company recognizes a liability for uncertain tax positions. The gross tax-affected unrecognized tax benefits which, if recognized, would affect our tax rate were $631.9 million and $302.7 million as of December 31, 2009 and 2008. The Company recorded interest related to unrecognized tax benefits of approximately $3.4 million and $3.5 million for the years ended December 31, 2009 and 2008. Total accrued interest and penalties was $23.5 million and $20.1 million at December 31, 2009 and 2008. Interest and penalties are classified in income tax expense. A reconciliation of the beginning and ending amount of gross unrecognized tax benefits is (in thousands):
| December 31, | |||||||
| 2009 | 2008 | ||||||
| Balance as of January 1 |
$ | 304,789 | $ | 45,165 | |||
| Additions from acquired companies |
— | 268,574 | |||||
| Additions for tax positions related to the current year |
329,231 | 2,135 | |||||
| Additions for tax provisions of prior years |
— | 822 | |||||
| Reductions for audit settlements |
— | (9,499 | ) | ||||
| Reductions for statute of limitations closures |
— | (2,408 | ) | ||||
| Balance as of December 31 |
$ | 634,020 | $ | 304,789 | |||
As of December 31, 2009, $57.2 million of the gross tax-affected unrecognized tax benefits have been recorded in long-term liabilities and $576.9 million have been recorded as an offset to long-term deferred tax assets.
The Company has not provided U.S. Federal or state taxes on approximately $104.1 million of undistributed earnings of non-U.S. subsidiaries as such earnings are considered to be permanently reinvested outside the U.S.
The Company conducts business globally and as a result files U.S. federal, state and foreign income tax returns in various jurisdictions. During 2008, the Internal Revenue Service concluded its examination of the Company’s federal income tax returns for 2003 and 2004. With few exceptions, the Company is no longer subject to income tax examinations for years prior to 2006. During 2009, at the Company’s request, the Internal Revenue Service began an examination under the Pre-Filing Agreement program to review certain divestiture related transactions. Continuing participation in the Pre-Filing Agreement examination is voluntary and either the Company or the Internal Revenue Service can withdraw from the Pre-Filing Agreement process at any time. Whether the Company and the Internal Revenue Service continue with the examination, the timing of a resolution of the examination and the amounts and timing of tax payments or refunds that may be part of concluding the Pre-Filing Agreement process are uncertain. The Company believes that before the end of calendar year 2010, it is reasonably possible that the examination will be completed.
(13) Geographic Information
Information on Revenue by Geographic Areas:
| Year ended December 31, | |||||||||
| 2009 | 2008 | 2007 | |||||||
| (in thousands) | |||||||||
| United States |
$ | 239,389 | $ | 153,563 | $ | 63,732 | |||
| International |
244,522 | 176,482 | 81,211 | ||||||
| Total Revenue |
$ | 483,911 | $ | 330,045 | $ | 144,943 | |||
F-35
Table of Contents
Information on Long Lived Assets by Geographic Areas:
| December 31, | ||||||
| 2009 | 2008 | |||||
| (in thousands) | ||||||
| United States |
||||||
| Property and Equipment, net |
$ | 40,407 | $ | 41,900 | ||
| Goodwill, net |
825,725 | 806,541 | ||||
| Intangibles, net |
766,660 | 883,039 | ||||
| Total United States |
1,632,792 | 1,731,480 | ||||
| International |
||||||
| Property and Equipment, net |
2,717 | 3,452 | ||||
| Goodwill, net |
28,340 | 21,644 | ||||
| Intangibles from Acquisitions, net |
12,711 | 12,032 | ||||
| Total International |
43,768 | 37,128 | ||||
| Total Long Lived Assets |
$ | 1,676,560 | $ | 1,768,608 | ||
(14) Commitments and Contingencies
Lease Commitments
The Company leases its facilities and certain equipment pursuant to noncancelable operating lease agreements expiring through 2019. The Company’s corporate headquarters are located in Santa Clara, California and such leases expire in January 2017. The Company also leases office space in Ann Arbor, Bedford, Burbank, Illinois, New York, Radnor, San Francisco, Tulsa, the United Kingdom, Luxembourg, Canada and Japan, which expire at various dates through 2019. The Company records rent expense on a straight-line basis based on contractual lease payments. Allowances from lessors for tenant improvements have been included in the straight-line rent expense for applicable locations. Tenant improvements are capitalized and depreciated over the remaining life of the applicable lease.
Future minimum lease payments pursuant to these leases as of December 31, 2009 were as follows (in thousands):
| Operating Leases | ||||
| 2010 |
$ | 18,969 | ||
| 2011 |
17,103 | |||
| 2012 |
12,451 | |||
| 2013 |
11,478 | |||
| 2014 |
10,214 | |||
| Thereafter |
25,661 | |||
| Total minimum lease payments |
$ | 95,876 | ||
| Less sublease revenues |
(29,514 | ) | ||
| Net future minimum lease payments |
$ | 66,362 | ||
Rent expense from continuing operations was $17.5 million, $13.5 million, and $5.2 million, for the years ended December 31, 2009, 2008, and 2007, respectively.
Indemnifications
In the normal course of business, the Company provides indemnification of varying scopes and amounts to certain of its licensees against claims made by third parties arising out of the use and/or incorporation of the
F-36
Table of Contents
Company’s products, intellectual property, services and/or technologies into the licensee’s products and services, provided the licensee is not in violation of the terms and conditions of the agreement and/or additional performance or other requirements for such indemnification. In some cases, the Company may receive tenders of defense and indemnity arising out of products that are no longer provided by the Company due to having divested certain assets, but which were previously licensed by the Company. The Company’s indemnification obligations are typically limited to the cumulative amount paid to the Company by the licensee under the license agreement, however some license agreements, including those with our largest multiple system operators and digital broadcast satellite providers, have larger limits or do not specify a limit on amounts that may be payable under the indemnity arrangements. The Company cannot estimate the possible range of losses that may affect the Company’s results of operations or cash flows in a given period or the maximum potential impact of these indemnification provisions on its future results of operations.
DirecTV, Inc. v. Finisar Corporation. In April 2005, Gemstar received a notice of a potential claim for indemnification from DirecTV Group, Inc. (“DirecTV”) as a result of a lawsuit filed by Finisar Corporation (“Finisar”) against DirecTV in the United States District Court for the Eastern District of Texas. Finisar alleged that several aspects of the DirecTV satellite transmission system, including aspects of its advanced electronic program guide (“EPG”) and the storage, scheduling, and transmission of data for the EPG, infringed a Finisar patent. On July 7, 2006, the Court awarded Finisar approximately $117 million. In addition, the Court ordered DirecTV to pay approximately $1.60 per activated set-top box in licensing fees going forward in lieu of an injunction until the expiration of Finisar’s patent in 2012. The parties both filed appeals to the Federal Circuit, which subsequently ruled that the trial court’s construction of certain terms of the patent was too broad, vacated the jury’s verdict of infringement, held that one of the seven patent claims at issue is invalid, and left standing the remaining six claims for reconsideration by the trial court. The appeals court also reversed the jury’s finding that DirecTV’s infringement was willful. The trial court subsequently ruled in DirecTV’s favor on its summary judgment motion that the remaining claims of the subject patent were invalid, and in January 2010 the court of appeals confirmed that ruling. The Company has not established a reserve with respect to this matter in its consolidated financial statements.
Comcast Cable Communications Corp., LLC v. Finisar Corporation, in the United States District Court for the Northern District of California. In support of a potential claim for indemnification, Comcast Cable Communications Corp., LLC (“Comcast”) put the Company on notice that it had received communications from Finisar asserting infringement of U.S. Patent 5,404,505 (the “‘505 patent”). On July 7, 2006, Comcast filed a declaratory judgment action in the Northern District of California asking the Court to rule, among other things, that it does not infringe the ‘505 patent and/or that the patent is invalid. On May 15, 2008, Finisar entered into a covenant and stipulation with Comcast, filed with the California Court, that it would not assert any claim of the ‘505 patent against Comcast or certain related entities, other than claim 25. On July 11, 2008, the Court ruled on Comcast’s summary judgment motion, finding that claim 25 is invalid, and therefore finding that Comcast’s non-infringement motion is moot. Comcast has not taken any further action insofar as its potential indemnity claim against the Company is concerned.
Legal Proceedings
Thomson, Inc. v. Gemstar-TV Guide International, Inc., in the Superior Court of the State of Indiana for the County of Hamilton. On May 23, 2008, Thomson, Inc. (“Thomson”) initiated this action, seeking, among other things, indemnification from the Company in connection with its settlement of the patent claims against it in SuperGuide Corporation v. DirecTV Enterprises, Inc., et al., in the United States District Court for the Western District of North Carolina. Thomson alleges that it entered into multiple agreements with the Company between 1996 and 2003 that would require the Company to indemnify Thomson in the SuperGuide litigation. Specifically, Thomson asserts causes of action for fraud/fraudulent inducement, breach of contract, breach of implied in fact indemnity and warranty of title against infringement, and unjust enrichment. Thomson seeks a declaration from the Court that the Company owes Thomson defense and indemnity for SuperGuide’s claims, compensatory damages, including fees and expenses paid by Thomson in that case, the return of royalties paid by Thomson to
F-37
Table of Contents
the Company under the aforementioned agreements, pre and post-judgment interest, punitive damages, attorney fees, and costs of suit. The case is tentatively set for trial at a date to be determined in 2010.
DIRECTV, Inc. v. Gemstar-TV Guide Interactive, Inc., American Arbitration Association—Los Angeles. On March 20, 2009, DirecTV filed this arbitration demand seeking indemnity for payments made in settlement of two patent infringement lawsuits, including the SuperGuide Corporation v. DirecTV Enterprises, Inc., et al. matter. DirecTV seeks indemnity under the November 21, 2003, License and Distribution Agreement and Patent License Agreement between the parties and claims damages plus interest and its arbitration-related attorneys’ fees. The Company has filed a Response and Counterclaim for breach of contract. A hearing was held in December 2009, and we are awaiting the arbitrators’ ruling on the matter.
John Burke v. TV Guide Magazine Group, Inc., Open Gate Capital, Rovi Corp., Gemstar-TV Guide International, Inc. On August 11, 2009, plaintiff filed a purported class action lawsuit claiming that the Company’s former subsidiary, TV Guide Magazine, breached agreements with its subscribers and violated consumer protection laws with its practice of counting double issues toward the number of issues in a subscription. On September 10, 2009, the Company filed an answer to the complaint along with a petition to remove the case to federal court. On December 18, 2009, the case was dismissed with prejudice, and plaintiff has filed an appeal of that dismissal.
In addition to the items listed above, the Company is party to various legal actions, claims and proceedings as well as other actions, claims and proceedings incidental to its business. The Company has established loss provisions only for matters in which losses are probable and can be reasonably estimated. Some of the matters pending against the Company involve potential compensatory, punitive or treble damage claims, or sanctions, that if granted, could require the Company to pay damages or make other expenditures in amounts that could have a material adverse effect on its financial position or results of operations. At this time, management has not reached a determination that the matters listed above or any other litigation, individually or in the aggregate, are expected to result in liabilities that will have a material adverse effect on our financial position or results of operations or cash flows.
F-38
Table of Contents
(15) Quarterly Consolidated Financial Data (Unaudited)
| Quarter | ||||||||||||||||||||
| Q1 | Q2 | Q3 | Q4 | Year | ||||||||||||||||
| (in thousands, except per share data) | ||||||||||||||||||||
| 2009 |
||||||||||||||||||||
| Revenues |
$ | 111,158 | $ | 119,478 | $ | 115,273 | $ | 138,002 | $ | 483,911 | ||||||||||
| (Loss) income from continuing operations, net of taxes (1) |
$ | (5,345 | ) | $ | (1,971 | ) | $ | (11,921 | ) | $ | 532 | $ | (18,705 | ) | ||||||
| Discontinued operations, net of taxes |
$ | (36,170 | ) | $ | (171 | ) | $ | — | $ | 2,095 | $ | (34,246 | ) | |||||||
| Net (loss) income (1) |
$ | (41,515 | ) | $ | (2,142 | ) | $ | (11,921 | ) | $ | 2,627 | $ | (52,951 | ) | ||||||
| Basic (loss) income per share from continuing operations |
$ | (0.05 | ) | $ | (0.02 | ) | $ | (0.12 | ) | $ | 0.01 | $ | (0.18 | ) | ||||||
| Basic (loss) income per share from discontinued operations |
(0.36 | ) | 0.00 | 0.00 | 0.02 | (0.34 | ) | |||||||||||||
| Basic net earnings per share |
$ | (0.41 | ) | $ | (0.02 | ) | $ | (0.12 | ) | $ | 0.03 | $ | (0.52 | ) | ||||||
| Diluted (loss) income per share from continuing operations |
$ | (0.05 | ) | $ | (0.02 | ) | $ | (0.12 | ) | $ | 0.00 | $ | (0.18 | ) | ||||||
| Diluted (loss) income per share from discontinued operations |
(0.36 | ) | 0.00 | 0.00 | 0.02 | (0.34 | ) | |||||||||||||
| Diluted net earnings per share |
$ | (0.41 | ) | $ | (0.02 | ) | $ | (0.12 | ) | $ | 0.02 | $ | (0.52 | ) | ||||||
| 2008 |
||||||||||||||||||||
| Revenues |
$ | 30,295 | $ | 73,054 | $ | 108,526 | $ | 118,170 | $ | 330,045 | ||||||||||
| Income (loss) from continuing operations, net of taxes (2) |
$ | 7,422 | $ | (10,805 | ) | $ | 11,212 | $ | 7,894 | $ | 15,723 | |||||||||
| Discontinued operations, net of taxes (3) |
$ | (2,392 | ) | $ | 95,458 | $ | (3,734 | ) | $ | (219,115 | ) | $ | (129,783 | ) | ||||||
| Net income (loss) |
$ | 5,030 | $ | 84,653 | $ | 7,478 | $ | (211,221 | ) | $ | (114,060 | ) | ||||||||
| Basic income (loss) per share from continuing operations |
$ | 0.13 | $ | (0.13 | ) | $ | 0.11 | $ | 0.08 | $ | 0.18 | |||||||||
| Basic (loss) income per share from discontinued operations |
(0.04 | ) | 1.12 | (0.04 | ) | (2.15 | ) | (1.50 | ) | |||||||||||
| Basic net earnings per share |
$ | 0.09 | $ | 0.99 | $ | 0.07 | $ | (2.07 | ) | $ | (1.32 | ) | ||||||||
| Diluted income (loss) per share from continuing operations |
$ | 0.13 | $ | (0.13 | ) | $ | 0.11 | $ | 0.08 | $ | 0.18 | |||||||||
| Diluted (loss) income per share from discontinued operations |
(0.04 | ) | 1.12 | (0.04 | ) | (2.15 | ) | (1.50 | ) | |||||||||||
| Diluted net earnings per share |
$ | 0.09 | $ | 0.99 | $ | 0.07 | $ | (2.07 | ) | $ | (1.32 | ) | ||||||||
| (1) | During the first quarter of 2009, the Company recorded $8.0 million in restructuring and asset impairment charges (See Note 8). During the second quarter of 2009 the Company recorded $45.6 million in restructuring and asset impairment charges (See Note 5 and Note 8). |
| (2) | During the third quarter of 2008, the Company recorded a discrete tax benefit of $10.1 million for the reversal of tax contingency reserves for which the statute of limitations expired. |
| (3) | During the second quarter of 2008, the Company sold its Software and Games business and recorded a pre-tax gain on sale of $151.3 million. In addition in the third quarter of 2008 the Company recorded $6.7 million of impairment charges related to its eMeta business. During the fourth quarter of 2008, the Company recorded $208.3 million in impairment charges related to its TV Guide Network, TV Guide Online and TVG Network businesses. See Note 4. |
F-39