Attached files
| file | filename |
|---|---|
| 8-K - FORM 8-K - HEALTH NET INC | d8k.htm |
 Health Net,
Inc. Health Net, Inc. 2010 Investor Day 2010 Investor Day February 11, 2010 Exhibit 99.1 |
 2 Cautionary Statement All statements in this presentation, other than statements of historical information provided herein,
including but not limited to the guidance for future periods included herein and the
assumptions and underlying such projections, may be deemed to be forward-looking
statements and as such are subject to a number of risks and uncertainties. These statements
are based on management’s analysis, judgment, belief and expectation only as of the date
hereof, and are subject to uncertainty and changes in circumstances. Without limiting the
foregoing, the guidance as to expected future period results and statements including the
words “believes,” “anticipates,” “plans,” “expects,” “may,” “should,” “could,” “estimate,” “intend” and other similar expressions are intended to identify
forward-looking statements. Actual results could differ materially due to, among other
things, costs, fees and expenses related to the post-closing administrative services to be
provided under the administrative services agreements entered into in connection with the sale
of our Northeast business; potential termination of the administrative services agreements by
the service recipients should we breach such agreements or fail to perform all or a material
part of the services required thereunder; any liabilities of the Northeast business that were
incurred prior to the closing of its sale as well as those liabilities incurred through the winding-up and running-out period of the Northeast business; potential termination of our TRICARE
North operations; rising health care costs; a continued decline in the economy; negative prior
period claims reserve developments; investment portfolio impairment charges; volatility in the
financial markets; trends in medical care ratios; unexpected utilization patterns or
unexpectedly severe or widespread illnesses; membership declines; rate cuts affecting our
Medicare or Medicaid businesses; litigation costs; regulatory issues; operational issues;
health care reform; and general business and market conditions. Additional factors that could cause actual results to differ materially from those reflected in the
forward- looking statements include, but are not limited to, the risks discussed in the
“Risk Factors” section included within the company's most recent Annual Report on
Form 10-K, subsequent quarterly reports on Form 10-Q, and the risks discussed in the
company’s other filings with the Securities and Exchange Commission. Readers are
cautioned not to place undue reliance on these forward-looking statements. The company
undertakes no obligation to publicly revise its guidance, the assessment of the underlying assumptions or any of its forward-looking statements to reflect events or circumstances that arise
after the date of this presentation. |
 3 Non-GAAP Measures These presentations include quarterly and full-year income statement measurements that are not calculated and presented in accordance with Generally Accepted Accounting Principles. Audience participants should refer to the reconciliation table included in the Appendix to the presentations, which is available on the company’s Web site at www.healthnet.com, and reconciles certain non- GAAP financial information to GAAP financial information. |
 Health Net,
Inc. Health Net, Inc. 2010 Investor Day 2010 Investor Day Overview Overview Jay Gellert President and Chief Executive Officer 4 |
 5 2009 Summary • Improve Medicare performance • Solidify commercial base • Close Northeast transaction • Strengthen balance sheet • Strong TRICARE performance • Position for the future |
 6 Our Positioning • Commercial product approach • Diverse portfolio, consistent performance • DoD / VA franchise • Simplified administration and medical management • Available cash |
 7 Aligned with Environment • New face of consumer • Ongoing affordability pressures • Not overinvested in high risk areas • Leverage with economic recovery • Opportunities from reform |
 8 To Do Today • Comfortable with 2010 • Approach that leads into 2011 • Administrative savings line of sight • Can handle TRICARE transition • Have cash, will use it wisely • Longer term margin expansion opportunities • Well-positioned for the future |
 9 2010 Earnings Guidance 2010 Earnings Guidance Year-end Membership • Commercial: -1% to -2% • Medicaid: +5% to +6% • Medicare Advantage: -2% to -3% • PDP: +1% to +2% Consolidated Revenues $13 billion to $13.5 billion Commercial Premium Yields (b) ~ 8.3% to 8.8% (Western Region 2009: ~$316 PMPM) Commercial Health Care Cost Trends (b) ~ 20-40 bps < Premium Yields (Western Region 2009: ~$274 PMPM) Selling Cost Ratio ~ 2.4% Gov’t Contracts Ratio ~ 94.5% to 95% G&A Expense Ratio ~ 8.8% to 9% Tax Rate ~ 39% Weighted-average Fully Diluted Shares Outstanding 103 million – 104 million GAAP EPS Non-GAAP EPS (a) $1.92 to $2.02 $2.32 to $2.42 (a) Excludes approximately $69 million in pretax charges. These charges include approximately $53
million related to the wind-down of the company’s Northeast businesses and
approximately $16 million related to the company’s operations strategy. (b)
Commercial premium yields and commercial health care cost comparisons are on a same-store
basis for the company’s Western health plans only for both 2009 and 2010.
|
 Earnings
 Guidance Guidance Bridge Bridge 2009-2010 2009-2010 (a) (a) • Expect pretax margin to improve by ~60 basis points • G&A ratio to improve by 70 to 90 basis points • Health plan MCR to rise by ~20 basis points • Selling costs improve by ~30 basis points • Government contracts cost ratio flat • Net non-operating gains lower by ~30 basis points 10 (a) Excludes the impact of charges taken during 2009 and charges expected during 2010. Also
excludes revenues and expenses associated with the run-out of the Northeast business. This information is non-GAAP financial information. A reconciliation of
non-GAAP financial measures is attached as an Appendix to this presentation. |
 11 Our Goal • Simple • Transparent • Aligned • Tailwinds over headwinds • Flexible |
 Operations
Review Operations Review Jim Woys Executive Vice President and Chief Operating Officer 12 |
 13 2010 and Long-Term Focus 2010 and Long-Term Focus • Expand Western commercial revenues and margins • Sustain Medicare membership and margins • “Stay the course” in Medi-Cal • Maintain and then grow Government contracts • Manage health care costs in a capitated group setting • Reduce administrative expenses to drive margin expansion 13 |
 Commercial
Business Commercial Business Steven Sell President, Western Region Health Plan President, Health Net of California 14 |
 Commercial Plan:
Build on Strength Commercial Plan: Build on Strength • Strong California HMO position – Gaining market share • Strategically changing the mix – Geographies, small and mid-market and low cost products – Positioned for changes in the market • Build on provider relationships – Multiple networks using capitated group model – Allows wide range of price points • Goal: steady margin improvement 15 |
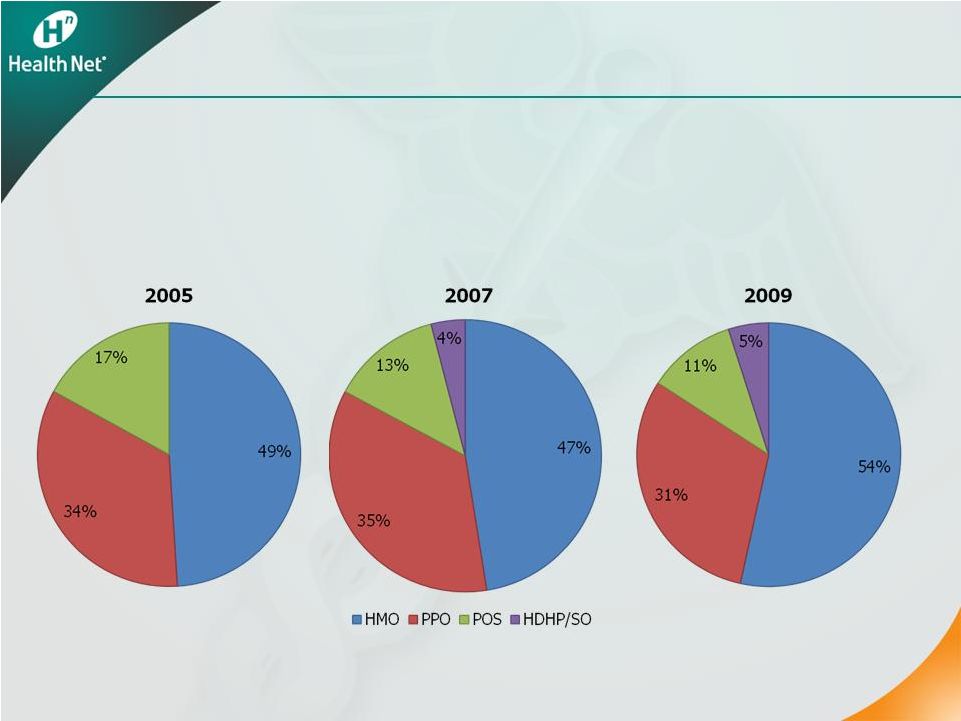 16 The New and Improved HMO The New and Improved HMO • HMO strong in California • HDHP growth has changed little since 2007 CA Commercial Market Share by Product Type Sources: California Health Care Foundation (CHCF)/NORC California Employer Health Benefits Survey:
2007-2009, 2005-2006, 2004, Kaiser/HRET CHCF Survey: 2001-2003,
2001-2009 |
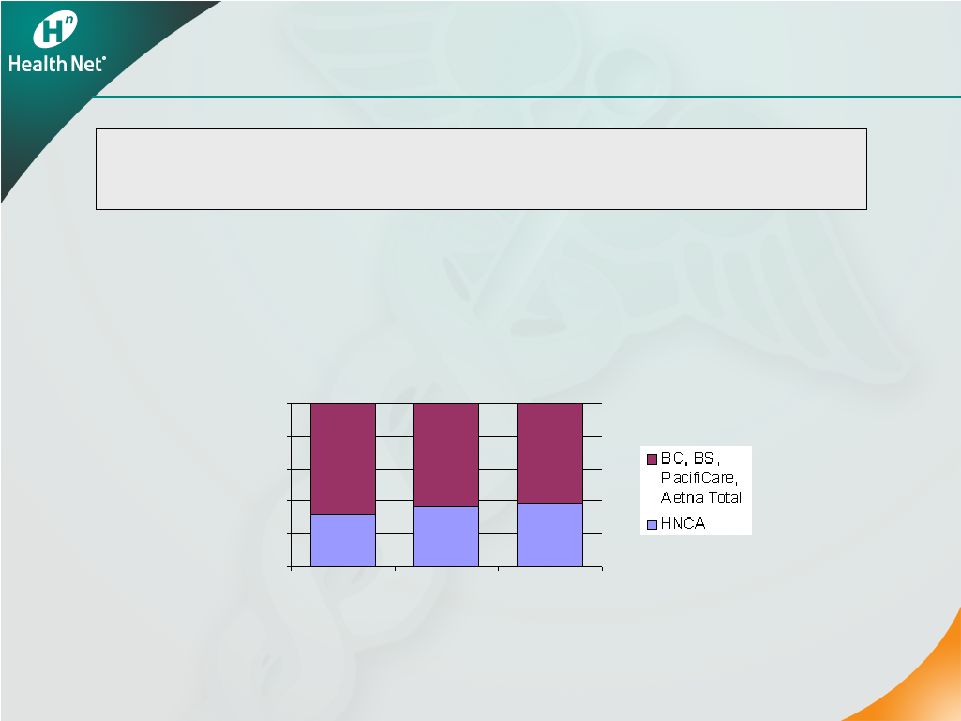
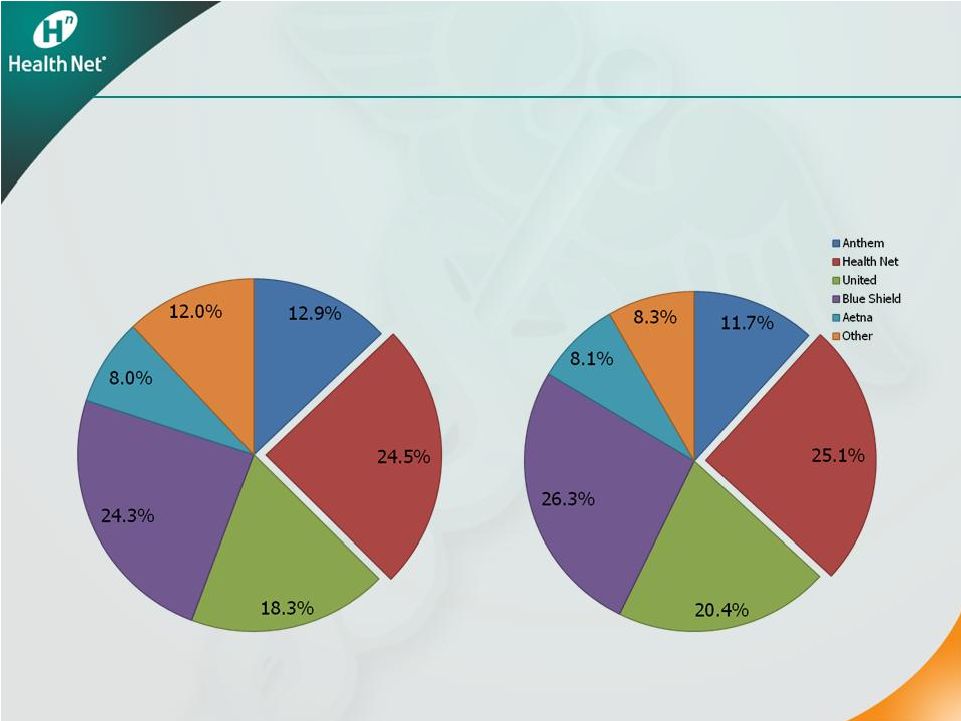 2009 Health Plan
Market Share in CA (Commercial HMO/POS) Network HMO 2009 Health Plan Market Share in Inland Empire, Los Angeles, and Orange County (Commercial HMO/POS) Network HMO 17 Health Net Strong in Commercial HMO Health Net Strong in Commercial HMO Note: Commercial HMO/POS excludes self-funded membership. Source: HealthLeaders, Managed Market Surveyor data, January 2009 |
 The New and
Improved HMO The New and Improved HMO • Integrated provider groups provide cost stability and predictability • Low cost products meet “value shopper” needs Comprehensive benefits at competitive price points • Prices for high deductible, consumer-directed products rising substantially Up to 40 percent 18 |
 Group Networks:
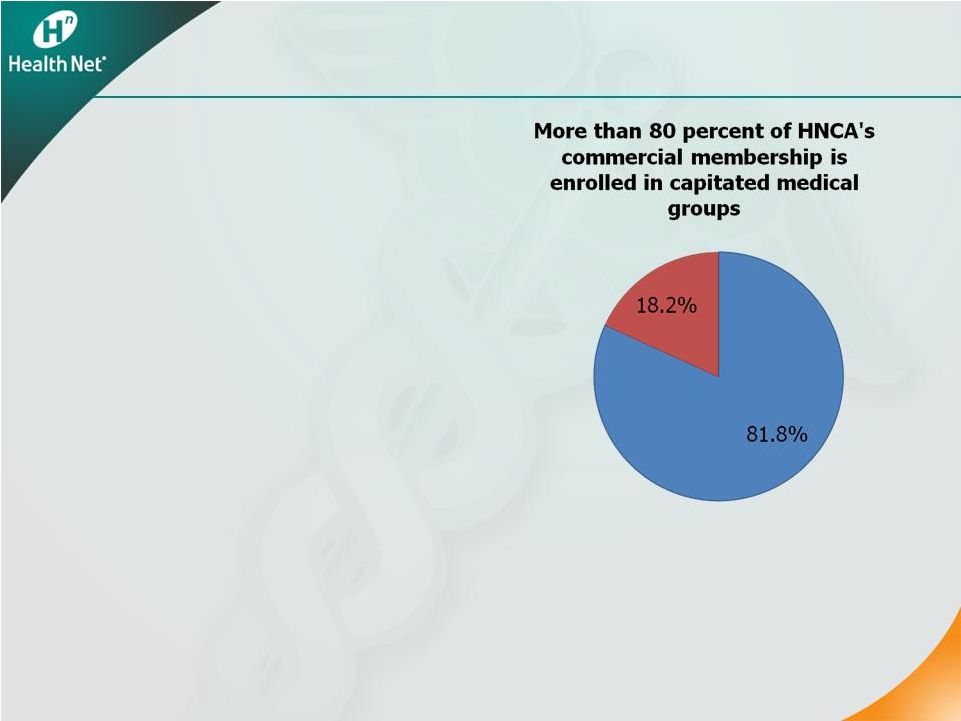
Our Sweet Spot Group Networks: Our Sweet Spot • A staple of Western markets • Health Net is the lead network model HMO player * • More penetrated landscape in Southern California – Health Net’s best geography • The most cost-effective delivery system – Reduces risk 19 * Based on membership |
 The Value of the
Group Model The Value of the Group Model • More predictable costs and pricing • Integrates care and avoids duplicative or unnecessary procedures • Care starts at low cost setting, “steps-up” only as necessary • Collaborate on cost and quality initiatives 20 |
 Economy Driving
to Affordable Products Economy Driving to Affordable Products • Affordability issues – need for lower cost products – Small and mid-market • Two approaches to lower cost products: – Narrow network products are growing – Consumer-driven, high deductible products not producing promised savings • Competitive prices – Capitated HMO is 30 percent less compared with PPO in Southern California 21 |
 Strength: Narrow
Network Products Strength: Narrow Network Products 22 • Steady growth in all narrow network products • Success with a growing Latino population • Growing interest in substantive coverage in lieu of broad access Health Net Narrow Network Products Membership 200,000 210,000 220,000 230,000 240,000 250,000 260,000 270,000 280,000 Q1'08 Q2'08 Q3'08 Q4'08 Q1'09 Q2'09 Q3'09 Q4'09 Total Narrow Network Products |
 31% 36% 38% 69% 64% 62% 0% 20% 40% 60% 80% 100% Q1-2007 Q1-2008 Q1-2009 Small Group Network Model HMO Market Share Health Net has continued to gain market share in small groups in network model HMO from 1Q07 to 1Q09 (1) Strength: Small Group Segment Strength: Small Group Segment • HNT small group membership increased 7 percent • Total membership for the other four largest network model HMO plans dropped 7 percent (1) Source: Data from DMHC and excludes Kaiser and all PPO data. Percent share reflects
percent share of top statewide competitors. 23 |
 Expanding Gross
Margin Expanding Gross Margin 24 • Disciplined pricing – 20 to 40 basis points MCR improvement • Segment shift to small and mid-markets • Mix shift to narrow network products • Geographic shift to profitable regions |
 Winning Strategy
for Today’s Market Winning Strategy for Today’s Market • Strong California HMO position • Built on strong provider group relationships • Change the mix to small and mid-group, lower costs and key geographies • Sustained disciplined pricing 25 Result: steady margin improvement |
 Medicare
& Medicare & State Programs State Programs Scott Kelly Chief Government Programs Officer 26 |
 Medicare
Positioning Medicare Positioning • Focus on network model markets in Western region – Established and accepting of MA since before BBA – Best “age-in” opportunities • Build on strength of capitated networks in California • Balance cost, revenue and benefits/premiums to maintain margins in challenging reimbursement environment 27 |
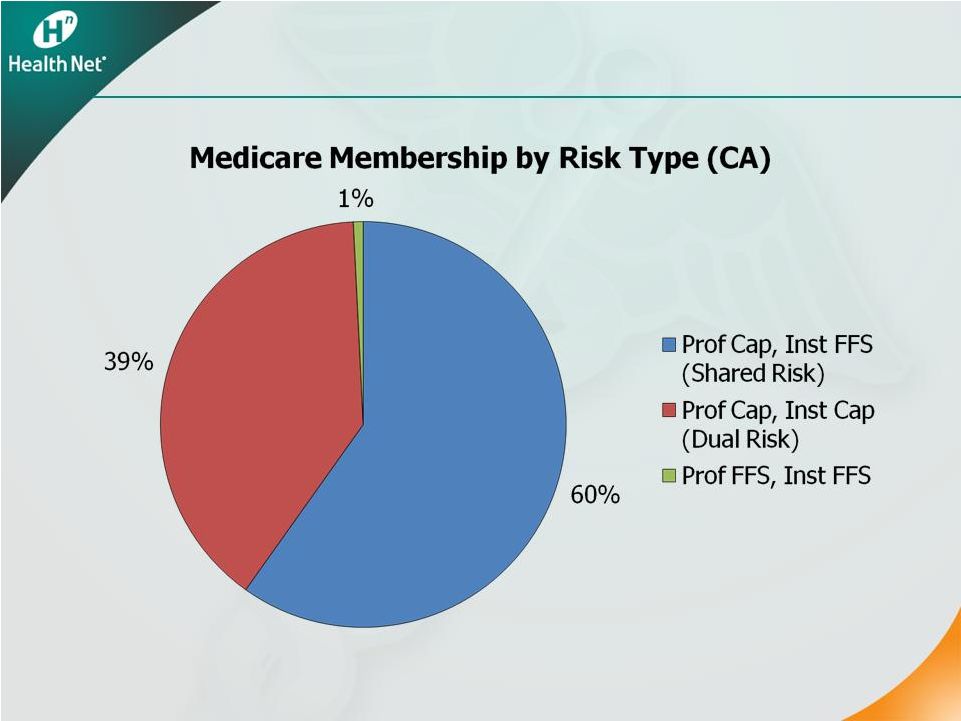 Medicare
 28 |
 Medicare
Advantage 2009 Medicare Advantage 2009 • Met goals in 2009 • Emphasized margin with reasonable growth – Risk mitigation • Improvement driven by targeted benefit and premium changes • Improved risk adjuster data collection • Stable enrollment – Exited Private Fee-for-Service 29 |
 Medicare
Advantage: 2010 Expectations Medicare Advantage: 2010 Expectations 30 • Early enrollment results positive • MCR expected to improve Premium and benefit design Exit Private Fee-for-Service • Margins consistent with long-term targets |
 Medicare Part
D Medicare Part D 31 • Solid franchise • 2009 enrollment slightly better than expected • Returned to solid margins • 2010 enrollment expected to increase 1 to 2 percent • 2010 margins consistent with long-term targets |
 State Programs:
Medi-Cal State Programs: Medi-Cal • Highest ranking HMO plan in California by U.S. News and World Report • 702,000 members at year-end 2009, an increase of 12.5 percent year-over-year • 2010 outlook – Expect 5 to 6 percent membership growth – Continued rate pressure – Continued provider partnership attention – Maintain stable financial performance – Key strategic position for health care reform 32 |
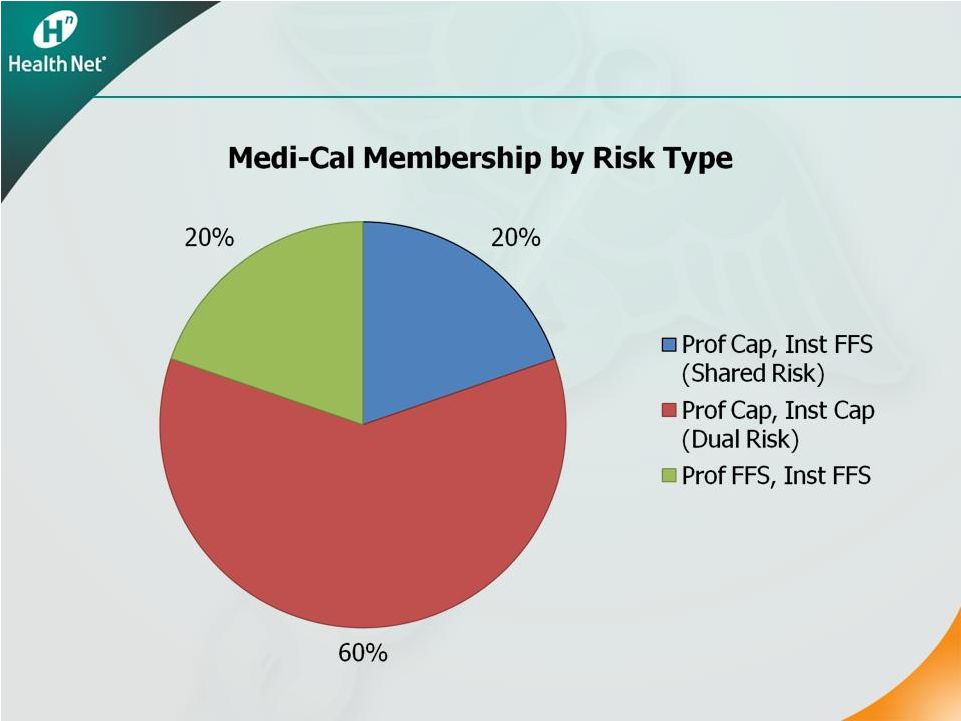 Medi-Cal Medi-Cal 33 |
 State Programs:
Healthy Families State Programs: Healthy Families • 153,000 members at year-end 2009, an increase of 10.3 percent year-over-year • 2010 program outlook – Expect 5 to 6 percent membership gains – Continued rate pressure – Margin stability 34 |
 Key
Takeaways Key Takeaways • Strong 2009 Medicare results lead to solid 2010 outlook based on benefits, premiums and enrollment • Medicare margin stability in long-standing MA network-model markets – Predictable cost structure • Maintain Medi-Cal stability and position in advance of health care reform – Support commercial and Medicare low-cost products, e.g. Salud con Health Net
35 |
 Government
Segment Government Segment Federal Services / MHN Federal Services / MHN Steve Tough President, Government Programs Division 36 |
 37 2009 Review and 2010 Outlook • 2009 Government contracts ratio of 94.6 percent – Better than planned due to lower health care cost trends and DoD behavioral health growth • 2010 Expectations – Current TRICARE contract and terms to continue through March of 2011 – Revenue growth of approximately 10 percent consistent with health care cost inflation and continued behavioral health growth – Government contracts ratio of 94.5 to 95.0 percent |
 38 Status of TRICARE Award Protest • GAO sustained Health Net’s protest Appearance of “conflict of interest” Evaluation of provider discounts GAO concluded errors could have impacted the • DoD agreed to consider “conflict” issue first • Awaiting next steps from DoD relative standing of the proposals |
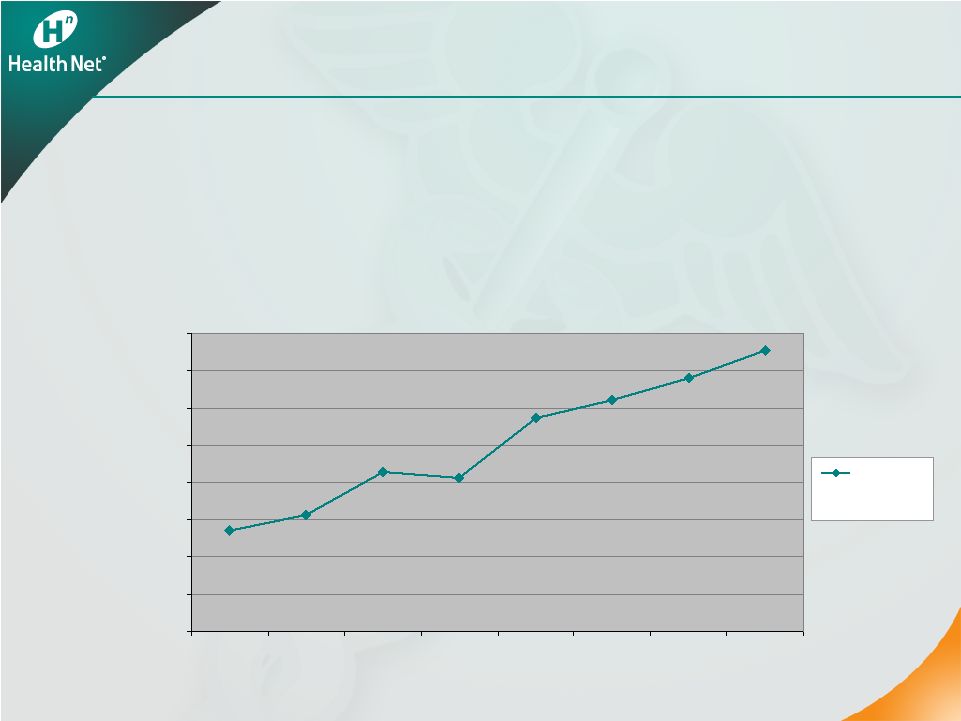
 39 MFLC: DoD Behavioral Health Program • Substantial year-over-year revenue growth, with 2009 revenues of more than $200 million • More than 1,500 consultants at approximately 300 locations worldwide seeing over 1 million encounters per month • Expect to achieve 2010 growth – Increasing demand for services (including base non- medical counseling and personal financial counseling) – Prepared to respond quickly to emergent events |
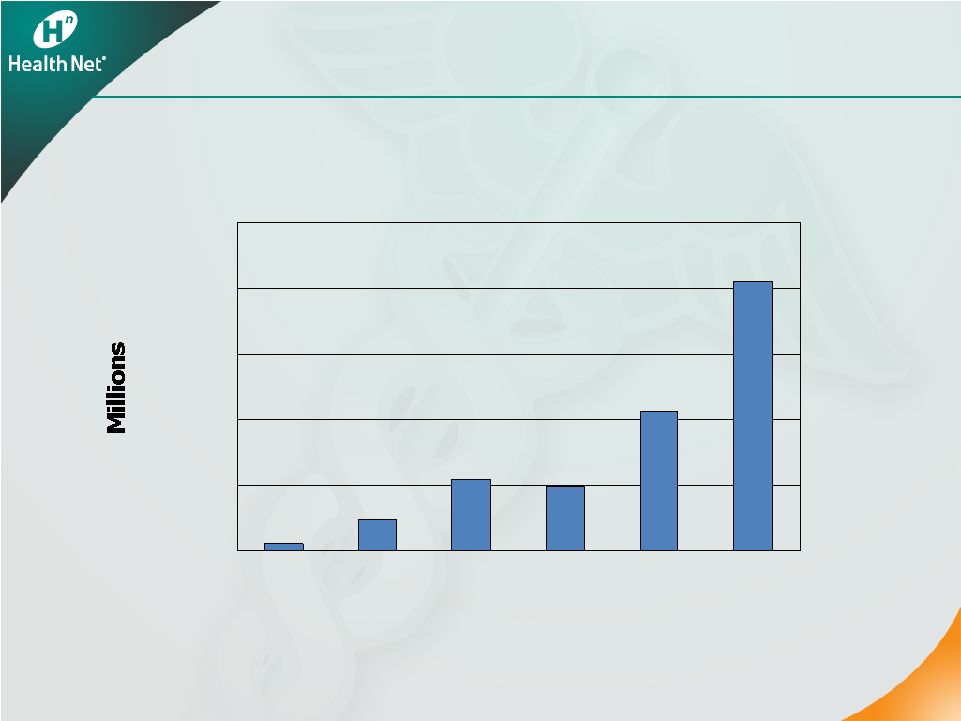 40 MFLC Program Revenue MFLC Program Revenue 40 $0 $50 $100 $150 $200 $250 2004 2005 2006 2007 2008 2009 |
 41 Future Opportunities • Department of Veterans Affairs • Department of Defense – MFLC expansion • Other government and commercial entities – Customized Behavioral Health & EAP for targeted market segments, including: • Colleges and universities / student health • Federal agencies • Correctional health |
 Health Care
Cost Health Care Cost Management Management John Sivori Health Care Services Officer 42 |
 Health Care Cost
Management • 2009 commercial trends higher than initial expectations – H1N1 and COBRA • Significant progress in network contracting • Better management of trend is key element of long-term margin expansion • Longer term opportunities with established capitated provider relationships – More stable cost environment – Unique medical management – Low-cost product flexibility 43 |
 2010
Expectations • Expect commercial costs to be 20 to 40 basis points better than premium yields • Stable physician (~6 percent) and inpatient (~10 percent) trends • Moderating outpatient trends (~12 percent) • Lower Rx trends compared with 2009 (~10 percent) • Assuming abatement in flu • COBRA impact included in assumptions • Effective medical management in capitated group setting is key to long-term success 44 |
 Medical
Management in a Capitated Group Setting • Focus on provider groups that optimize cost effectiveness and quality – Understand local delivery system issues – Influence with physician community – Support for complex management • Offer tools and resources to providers for improved performance • Targeted Efficiency Program using aligned incentives to reward effective management 45 |
 Execution on the
Basics • Care management – Active evidence-based interventions – Integrated with delegated providers and vendors • Complex case management – Enroll the sickest and most complicated patients • Monitor key measures – Inpatient days per thousand – ER visits per thousand – Re-admits 46 |
 Provider
Contracting Update • Completed more than 80 percent of 2010 contracts on dollar-spend basis – 90 percent completed in California • Expand cost-effective narrow network solutions with key provider groups (Salud, Silver, Bronze) • Enhance partnerships with key hospital systems • Renew physician awareness of shared risk benefits 47 |
 Pharmacy Cost
Management • Utilization trends moderating • Unit costs an area of focus • 2009 impact from H1N1 flu • Captive PBM allows aggressive formulary management • Integrated specialty management • Success with generics 48 |
 Pharmacy
Performance • Industry-leading generic fill rate (72 percent in 2009 in Western health plans) • Continued improvement in generic fill rate • Key driver of overall trend management to near single digits for the last eight years 49 |
 Key
Takeaways • Leveraging existing provider relationships to deliver products and a cost structure that meets customer needs • Delegated model recognized as vehicle for cost containment • Focused on improved execution of the basics in 2010 50 |
 Operational
Efficiency Operational Efficiency Jim Woys Executive Vice President and Chief Operating Officer 51 |
 52 Operations Strategy Rationale Operations Strategy Rationale • 2007: cost structure inefficient and expensive • 2009: repositioned G&A – efficient and cost- effective • Improved operating performance The majority of key metrics in claims, call center and enrollment have shown year-over-year improvement • Long-term sustainable savings |
 53 Operations Strategy Results Operations Strategy Results • A “high return” investment – Achieved more than $125 million in run-rate G&A savings since 2007 • Operations strategy nearly complete – Application and infrastructure outsourcing and systems efficiencies: $53 million in run-rate savings – Business process outsourcing and vendor management: $37 million in run-rate savings – Other restructuring and efficiency initiatives: $35 million in run-rate savings – Headcount reduced by approximately 1,300 • Further run-rate savings of $15 million from additional overhead reductions 53 |
 54 Operations Strategy Investments Operations Strategy Investments • Necessary charges of $191 million pretax to-date, with further charges of $16 million pretax in 2010 as headcount continues to decline – $43 million for noncash asset write-downs – $88 million for severance due to headcount reductions – $60 million for facilities, system consolidation and consulting • Without investments, 2009 G&A would have been $105 million higher – Assuming 3 percent annual inflation |
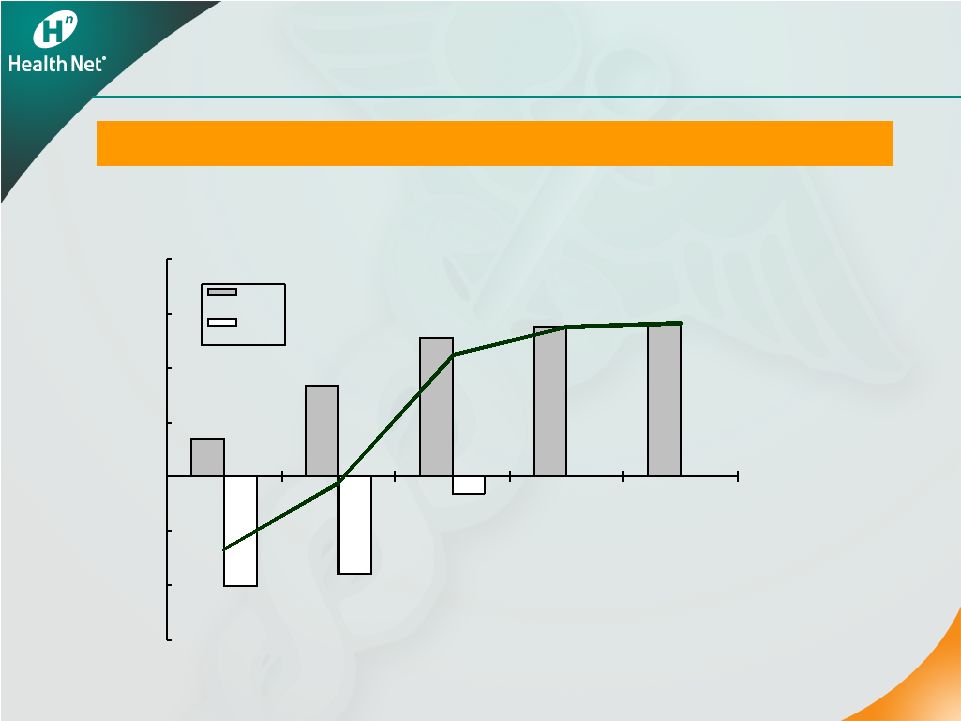 55 Ongoing savings exceed investments Operations Strategy Results Operations Strategy Results • Total charges = $207 million pretax • Positive return realized in second half of 2010 Operations Strategy Savings vs. Charges $'s in millions -$150 -$100 -$50 $0 $50 $100 $150 $200 2008 2009 2010 2011 2012 Savings Charge |
 56 Overhead Reductions Overhead Reductions • Further administrative cost savings necessary with Northeast sale • Expect to achieve savings by reducing corporate overhead • Eliminate $80 million to $100 million in run-rate G&A expenses by year-end 2011 • New G&A base will be scalable as growth resumes 56 |
 57 2010 and Long-Term Focus 2010 and Long-Term Focus • Expand Western commercial revenues and margins • Sustain Medicare membership and margins • “Stay the course” in Medi-Cal • Maintain and then grow Government contracts • Manage health care costs in a capitated group setting • Reduce administrative expenses to drive margin expansion 57 |
 Financial
Review Financial Review Joseph C. Capezza Executive Vice President and Chief Financial Officer 58 |
 59 On the Right Track On the Right Track • Completed Northeast transaction • Met 2009 expectations • Fixed Medicare • Contributed $100 million to subsidiaries in December 2009 RBC more than 400 percent • Strong cash at parent $450 million at year-end 2009 • Expect 2010 cash flow of $300 million to $325 million |
 Northeast
Transaction Cash Northeast Transaction Cash 2009 $377 million 2010 $ 23 million 2011 $ 90 million to $210 million Total $490 to $610 million 60 |
 Retained
regulatory capital ~$ 90 million Debt repayment ~$140 million Share repurchase ~$ 90 million* Severance, capital expenditures and other expenses ~$ 80 million TOTAL ~$400 million 61 * Assumes share repurchases equal to current authorization of approximately $103
million. 2010 Cash Uses 2010 Cash Uses |
 Capital
Summary Capital Summary Parent cash 12/31/10 ~$350 million Revolver capacity 12/31/10 ~$485 million Additional Northeast payments ~$90 million to $210 million Total debt 12/31/10 ~$475 million 62 |
 63 2010 Earnings Guidance 2010 Earnings Guidance Year-end Membership • Commercial: -1% to -2% • Medicaid: +5% to +6% • Medicare Advantage: -2% to -3% • PDP: +1% to +2% Consolidated Revenues $13 billion to $13.5 billion Commercial Premium Yields ~ 8.3% to 8.8% Commercial Health Care Cost Trends ~ 20-40 bps < Premium Yields Selling Cost Ratio ~ 2.4% Gov’t Contracts Ratio ~ 94.5% to 95% G&A Expense Ratio ~ 8.8% to 9% Tax Rate ~ 39% Weighted-average Fully Diluted Shares Outstanding 103 million – 104 million GAAP EPS Non-GAAP EPS* $1.92 to $2.02 $2.32 to $2.42 (a) Excludes approximately $69 million in pretax charges. These charges include approximately $53
million related to the wind-down of the company’s Northeast businesses and
approximately $16 million related to the company’s operations strategy. (b)
Commercial premium yields and commercial health care cost comparisons are on a same-store
basis for the company’s Western health plans only for both 2009 and 2010.
|
 Health Net,
Inc. Health Net, Inc. 2010 Investor Day 2010 Investor Day Appendix Appendix February 11, 2010 64 |
Health Net, Inc.
Reconciliation of Non-GAAP Financial Measures
Operating Results Excluding Charges
(Amounts in thousands, except per share, PMPM and ratio data)
This table presents the company’s consolidated operations for the periods presented below and the charges recorded in the consolidated statement of operations for such periods. Information for the quarter and year-ended December 31, 2009 also includes the financial impact from the December 11, 2009 sale of our Northeast health plans. Management believes that the presentation of certain financial information in the attached press release, excluding the charges that were recorded and excluding the impact from the divestiture of our Northeast health plans, all of which is non-GAAP financial information, is important to investors as it excludes special items that are not indicative of our core operating results. Non-GAAP financial information presented below should be considered in addition to, not as a substitute for, financial information prepared in accordance with GAAP.
| Quarter Ended December 31, 2008 |
Year Ended December 31, 2008 | Quarter Ended September 30, 2009 |
||||||||||||||||||||||||||||||||||
| As Reported |
Impact of Charge1 |
Excluding Impact of Charge1 (Non- GAAP) |
As Reported |
Impact of Charges2 |
Excluding Impact of Charges2 (Non- GAAP) |
As Reported |
Impact of Charge3 |
Excluding Impact of Charge3 (Non- GAAP) |
||||||||||||||||||||||||||||
| REVENUES: |
||||||||||||||||||||||||||||||||||||
| Health plan services premiums |
$ | 3,082,133 | $ | 3,082,133 | $ | 12,392,006 | $ | 12,392,006 | $ | 3,166,877 | $ | 3,166,877 | ||||||||||||||||||||||||
| Government contracts |
751,604 | 751,604 | 2,835,261 | 2,835,261 | 758,507 | 758,507 | ||||||||||||||||||||||||||||||
| Net investment income |
24,536 | 24,536 | 91,042 | (14,642 | ) | 105,684 | 27,691 | 27,691 | ||||||||||||||||||||||||||||
| Administrative services fees and other income |
11,209 | 11,209 | 48,280 | (3,400 | ) | 51,680 | 15,578 | 15,578 | ||||||||||||||||||||||||||||
| 3,869,482 | — | 3,869,482 | 15,366,589 | (18,042 | ) | 15,384,631 | 3,968,653 | — | 3,968,653 | |||||||||||||||||||||||||||
| EXPENSES: |
||||||||||||||||||||||||||||||||||||
| Health plan services |
2,629,398 | (5,700 | ) | 2,635,098 | 10,762,657 | 37,496 | 10,725,161 | 2,734,984 | (571 | ) | 2,735,555 | |||||||||||||||||||||||||
| Government contracts |
718,893 | 718,893 | 2,702,573 | 2,702,573 | 716,323 | 716,323 | ||||||||||||||||||||||||||||||
| General and administrative |
347,128 | 53,535 | 293,593 | 1,291,059 | 119,540 | 1,171,519 | 319,451 | 19,495 | 299,956 | |||||||||||||||||||||||||||
| Selling |
92,314 | 92,314 | 360,381 | 360,381 | 83,275 | 83,275 | ||||||||||||||||||||||||||||||
| Depreciation and amortization |
17,271 | 17,271 | 59,878 | 59,878 | 12,689 | 12,689 | ||||||||||||||||||||||||||||||
| Interest |
10,523 | 10,523 | 42,909 | 42,909 | 10,264 | 10,264 | ||||||||||||||||||||||||||||||
| Asset impairments |
— | — | — | — | 170,570 | 170,570 | — | |||||||||||||||||||||||||||||
| Loss on sale of businesses |
— | — | — | — | — | — | ||||||||||||||||||||||||||||||
| 3,815,527 | 47,835 | 3,767,692 | 15,219,457 | 157,036 | 15,062,421 | 4,047,556 | 189,494 | 3,858,062 | ||||||||||||||||||||||||||||
| Income (loss) from operations before income taxes |
53,955 | (47,835 | ) | 101,790 | 147,132 | (175,078 | ) | 322,210 | (78,903 | ) | (189,494 | ) | 110,591 | |||||||||||||||||||||||
| Income tax provision (benefit) |
18,420 | (20,227 | ) | 38,647 | 52,129 | (70,951 | ) | 123,080 | (12,881 | ) | (53,890 | ) | 41,009 | |||||||||||||||||||||||
| Net income (loss) |
$ | 35,535 | $ | (27,608 | ) | $ | 63,143 | $ | 95,003 | $ | (104,127 | ) | $ | 199,130 | $ | (66,022 | ) | $ | (135,604 | ) | $ | 69,582 | ||||||||||||||
| Basic earnings (loss) per share |
$ | 0.34 | $ | 0.61 | $ | 0.89 | $ | 1.87 | $ | (0.64 | ) | $ | 0.67 | |||||||||||||||||||||||
| Diluted earnings (loss) per share |
$ | 0.34 | $ | 0.61 | $ | 0.88 | $ | 1.85 | $ | (0.64 | ) | $ | 0.67 | |||||||||||||||||||||||
| Weighted average shares outstanding: |
||||||||||||||||||||||||||||||||||||
| Basic |
103,694 | 103,694 | 106,532 | 106,532 | 103,873 | 103,873 | ||||||||||||||||||||||||||||||
| Diluted |
104,063 | 104,063 | 107,610 | 107,610 | 103,873 | 104,432 | ||||||||||||||||||||||||||||||
| Pretax margin |
1.4 | % | 2.6 | % | 1.0 | % | 2.1 | % | -2.0 | % | 2.8 | % | ||||||||||||||||||||||||
| Health plan services MCR |
85.3 | % | 85.5 | % | 86.9 | % | 86.5 | % | 86.4 | % | 86.4 | % | ||||||||||||||||||||||||
| Government contracts cost ratio |
95.6 | % | 95.6 | % | 95.3 | % | 95.3 | % | 94.4 | % | 94.4 | % | ||||||||||||||||||||||||
| G&A expense ratio |
11.2 | % | 9.5 | % | 10.4 | % | 9.4 | % | 10.0 | % | 9.4 | % | ||||||||||||||||||||||||
| Selling costs ratio |
3.0 | % | 3.0 | % | 2.9 | % | 2.9 | % | 2.6 | % | 2.6 | % | ||||||||||||||||||||||||
| Effective tax rate |
34.1 | % | 38.0 | % | 35.4 | % | 38.2 | % | 16.3 | % | 37.1 | % | ||||||||||||||||||||||||
| 1 | Includes a $5.7 million pretax benefit for a litigation reserve true-up included in health plan services expenses and a $53.5 million pretax charge primarily for severance and other expenses related to the company’s operations strategy and included in G&A. |
| 2 | Includes a $175.1 million pretax charge in total of which: |
(a) $119.6 million was primarily related to severance and other expenses associated with the company’s operations strategy and included in G&A expenses
(b) $37.5 million was included in health plan services expenses for estimated litigation liability and regulatory actions for the company’s rescission practices in Arizona and California and for the execution of the settlement agreement for the McCoy, et al., lawsuits
(c) $14.6 million investment impairment charge taken in the third quarter of 2008 and included in net investment income
(d) $3.4 million pretax charge related to the estimated loss on the sale of the assets of a subsidiary taken in the first quarter of 2008 and included in other income
| 3 | Includes a $0.6 million pretax benefit for a litigation reserve true-up included in health care costs, a $19.5 million pretax charge primarily for IT systems and other expenses related to the company’s operations strategy and included in G&A expenses and a $170.6 million pretax asset impairment charge for goodwill, intangible and IT-related assets related to the sale of our Northeast health plans. |
65
Health Net, Inc.
Reconciliation of Non-GAAP Financial Measures
Operating Results Excluding Charges
(Amounts in thousands, except per share, PMPM and ratio data)
| Quarter Ended December 31, 2009 | Year Ended December 31, 2009 | |||||||||||||||||||||||||||||||
| As Reported |
Impact of Charges4 |
Divested Operations5 |
Excluding Impact of Charges and Divestiture4,5 (Non- GAAP) |
As Reported |
Impact of Charge6 |
Divested Operations5 |
Excluding Impact of Charge and Divestiture5,6 (Non- GAAP) |
|||||||||||||||||||||||||
| REVENUES: |
||||||||||||||||||||||||||||||||
| Health plan services premiums |
$ | 2,981,678 | $ | 5,483 | $ | 2,976,195 | $ | 12,440,589 | $ | 5,483 | $ | 12,435,106 | ||||||||||||||||||||
| Government contracts |
754,766 | 754,766 | 3,104,700 | 3,104,700 | ||||||||||||||||||||||||||||
| Net investment income |
33,486 | 1,126 | 32,360 | 105,930 | 1,126 | 104,804 | ||||||||||||||||||||||||||
| Administrative services fees and other income |
28,165 | 15,113 | 13,052 | 62,022 | 15,113 | 46,909 | ||||||||||||||||||||||||||
| 3,798,095 | — | 21,722 | 3,776,373 | 15,713,241 | — | 21,722 | 15,691,519 | |||||||||||||||||||||||||
| EXPENSES: |
||||||||||||||||||||||||||||||||
| Health plan services |
2,557,149 | 5,508 | 2,551,641 | 10,731,951 | (4,805 | ) | 5,508 | 10,731,248 | ||||||||||||||||||||||||
| Government contracts |
707,353 | 3,632 | 703,721 | 2,939,722 | 3,632 | 2,936,090 | ||||||||||||||||||||||||||
| General and administrative |
355,407 | 38,723 | 20,588 | 296,096 | 1,361,956 | 124,799 | 20,588 | 1,216,569 | ||||||||||||||||||||||||
| Selling |
84,068 | 249 | 83,819 | 330,112 | 249 | 329,863 | ||||||||||||||||||||||||||
| Depreciation and amortization |
8,605 | 589 | 8,016 | 53,042 | 589 | 52,453 | ||||||||||||||||||||||||||
| Interest |
9,538 | 9,538 | 40,887 | 40,887 | ||||||||||||||||||||||||||||
| Asset impairments |
4,309 | 4,309 | — | 174,879 | 174,879 | — | ||||||||||||||||||||||||||
| Loss on sale of businesses |
105,931 | 105,931 | — | 105,931 | 105,931 | — | ||||||||||||||||||||||||||
| 3,832,360 | 152,595 | 26,934 | 3,652,831 | 15,738,480 | 404,436 | 26,934 | 15,307,110 | |||||||||||||||||||||||||
| Income (loss) from operations before income taxes |
(34,265 | ) | (152,595 | ) | (5,212 | ) | 123,542 | (25,239 | ) | (404,436 | ) | (5,212 | ) | 384,409 | ||||||||||||||||||
| Income tax provision (benefit) |
10,892 | (38,149 | ) | (2,059 | ) | 51,100 | 23,765 | (123,533 | ) | (2,059 | ) | 149,357 | ||||||||||||||||||||
| Net income (loss) |
$ | (45,157 | ) | $ | (114,446 | ) | $ | (3,153 | ) | $ | 72,442 | $ | (49,004 | ) | $ | (280,903 | ) | $ | (3,153 | ) | $ | 235,052 | ||||||||||
| Basic earnings (loss) per share |
$ | (0.43 | ) | $ | 0.70 | $ | (0.47 | ) | $ | 2.26 | ||||||||||||||||||||||
| Diluted earnings (loss) per share |
$ | (0.43 | ) | $ | 0.69 | $ | (0.47 | ) | $ | 2.25 | ||||||||||||||||||||||
| Weighted average shares outstanding: |
||||||||||||||||||||||||||||||||
| Basic |
103,902 | 103,902 | 103,849 | 103,849 | ||||||||||||||||||||||||||||
| Diluted |
103,902 | 104,626 | 103,849 | 104,412 | ||||||||||||||||||||||||||||
| Pretax margin |
-0.9 | % | 3.3 | % | -0.2 | % | 2.4 | % | ||||||||||||||||||||||||
| Health plan services MCR |
85.8 | % | 85.7 | % | 86.3 | % | 86.3 | % | ||||||||||||||||||||||||
| Government contracts cost ratio |
93.2 | % | 92.8 | % | 94.6 | % | 94.5 | % | ||||||||||||||||||||||||
| G&A expense ratio |
11.9 | % | 10.0 | % | 10.9 | % | 9.8 | % | ||||||||||||||||||||||||
| Selling costs ratio |
2.8 | % | 2.8 | % | 2.7 | % | 2.7 | % | ||||||||||||||||||||||||
| Effective tax rate |
-31.8 | % | 41.4 | % | -94.2 | % | 38.9 | % | ||||||||||||||||||||||||
| 4 | Includes a $3.6 million charge for TRICARE contract procurement costs included in government contracts expenses and a $38.7 million operations strategy charge and Northeast divestiture related expenses, each of which are included in G&A expenses, and an asset impairment and loss on the sale of Northeast health plans recorded in 2009. |
| 5 | Represents revenues and expenses related to the run-off of the Northeast health plans divested on December 11, 2009. |
| 6 | Includes a $4.8 million pretax benefit for a litigation reserve true-up included in health care costs, $3.6 million charge for TRICARE contract procurement costs included in government contracts expenses, and $124.8 million of operations strategy and Northeast sale related expenses included in G&A expenses, and an asset impairment and loss on the sale of Northeast health plans recorded in 2009. |
66