Attached files
| file | filename |
|---|---|
| 8-K - 8-K - Allegiant Travel CO | a10-2635_18k.htm |
Exhibit 99.1
|
|
Management Presentation January 2010 |
|
|
Notice on Forward Looking Statements This presentation as well as oral statements made by officers or directors of Allegiant Travel Company, its advisors and affiliates (collectively or separately, the "Company") will contain forward-looking statements that are only predictions and involve risks and uncertainties. Forward-looking statements may include, among others, references to future performance , future growth and any comments about our strategic plans. There are many risk factors that could prevent us from achieving our goals and cause the underlying assumptions of these forward-looking statements, and our actual results, to differ materially from those expressed in, or implied by, our forward-looking statements. These risk factors and others are more fully discussed in our filings with the Securities and Exchange Commission. Any forward-looking statements are based on information available to us today and we undertake no obligation to update publicly any forward-looking statements, whether as a result of future events, new information or otherwise. The Company cautions users of this presentation not to place undue reliance on forward looking statements, which may be based on assumptions and anticipated events that do not materialize. |
|
|
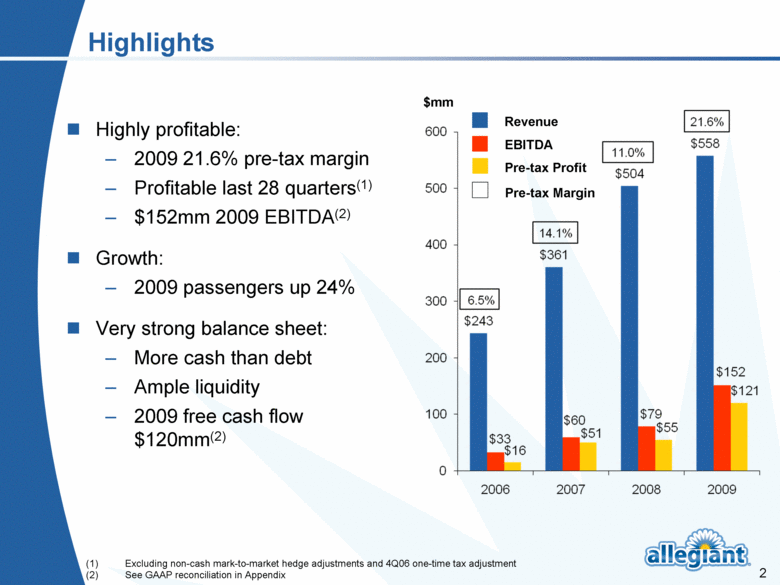
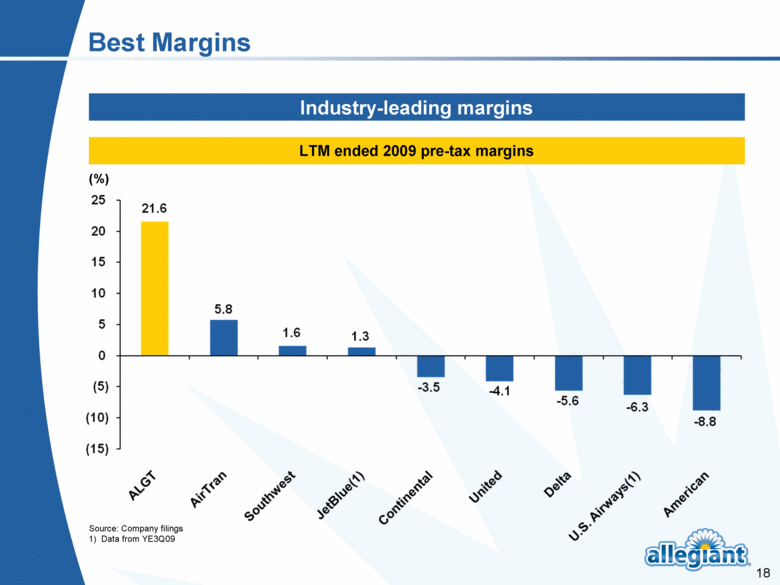
Highlights $mm Highly profitable: 2009 21.6% pre-tax margin Profitable last 28 quarters(1) $152mm 2009 EBITDA(2) Growth: 2009 passengers up 24% Very strong balance sheet: More cash than debt Ample liquidity 2009 free cash flow $120mm(2) Revenue Pre-tax Profit Pre-tax Margin Excluding non-cash mark-to-market hedge adjustments and 4Q06 one-time tax adjustment See GAAP reconciliation in Appendix EBITDA |
|
|
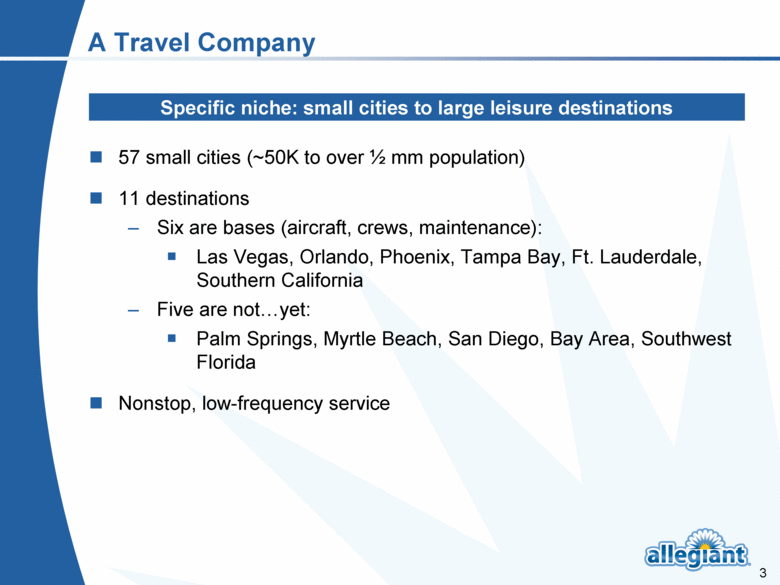
A Travel Company 57 small cities (~50K to over ½ mm population) 11 destinations Six are bases (aircraft, crews, maintenance): Las Vegas, Orlando, Phoenix, Tampa Bay, Ft. Lauderdale, Southern California Five are notyet: Palm Springs, Myrtle Beach, San Diego, Bay Area, Southwest Florida Nonstop, low-frequency service Specific niche: small cities to large leisure destinations |
|
|
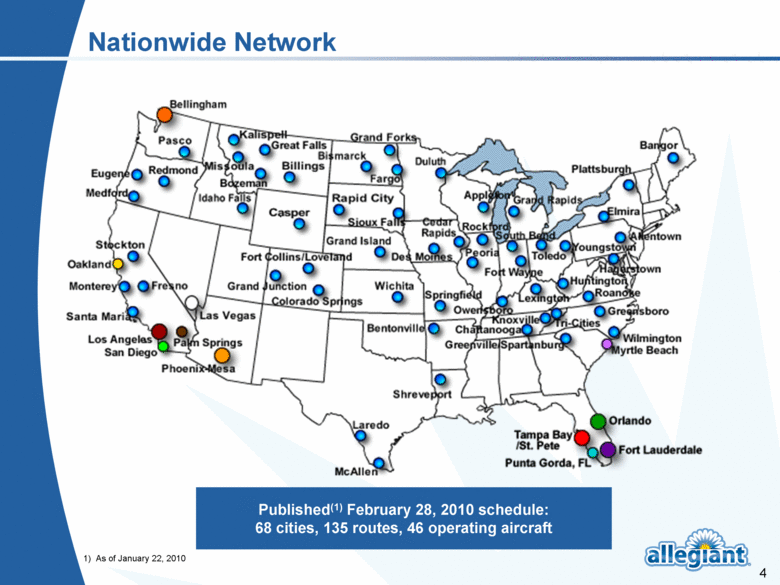
Nationwide Network Published(1) February 28, 2010 schedule: 68 cities, 135 routes, 46 operating aircraft 1) As of January 22, 2010 |
|
|
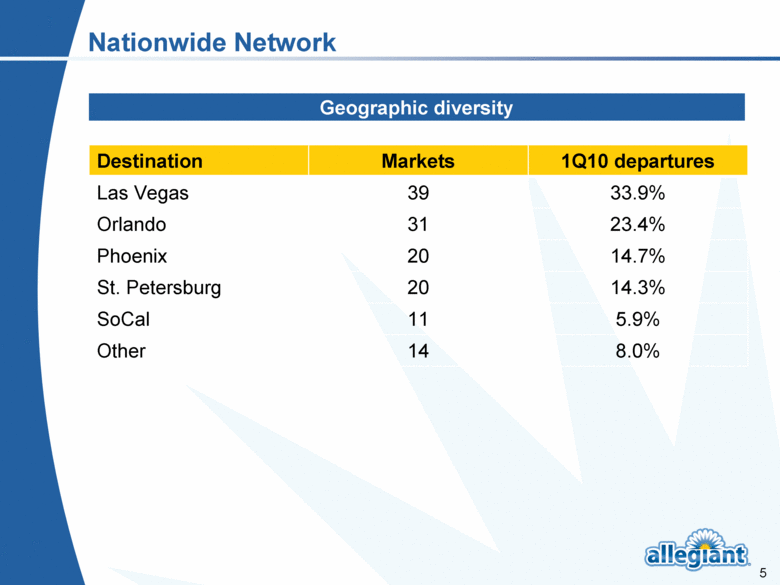
Nationwide Network Geographic diversity Destination Markets 1Q10 departures Las Vegas 39 33.9% Orlando 31 23.4% Phoenix 20 14.7% St. Petersburg 20 14.3% SoCal 11 5.9% Other 14 8.0% |
|
|
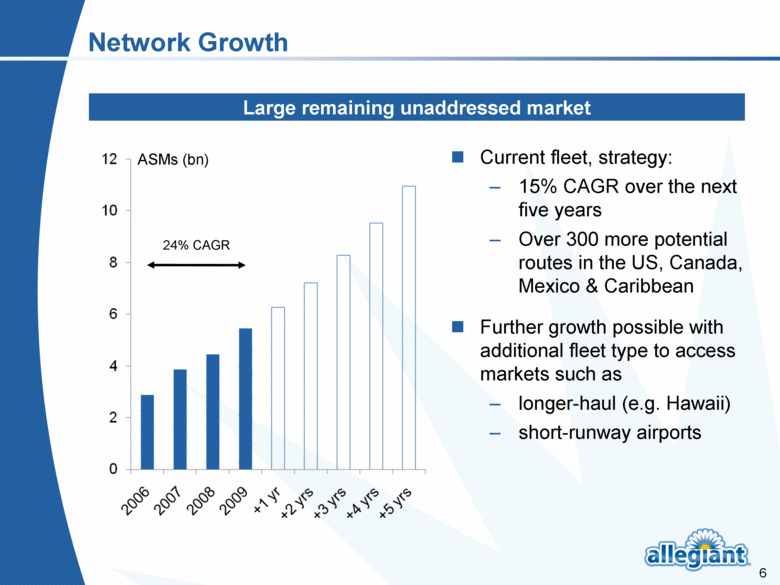
Network Growth Current fleet, strategy: 15% CAGR over the next five years Over 300 more potential routes in the US, Canada, Mexico & Caribbean Further growth possible with additional fleet type to access markets such as longer-haul (e.g. Hawaii) short-runway airports ASMs (bn) Large remaining unaddressed market 24% CAGR |
|
|
Network Growth Add new small cities Currently at 57 in US – believe we can get to around 100 in US and Canada Add new destinations Relatively riskless because once we’re established in a small city it’s relatively easy to start new route in that city to new destination Connect the dots – existing small city to an existing destination Add frequency on existing route – in a “normal” environment, this can be substantial year-over-year because word-of-mouth is a significant form of advertising for Allegiant Four ways to grow |
|
|
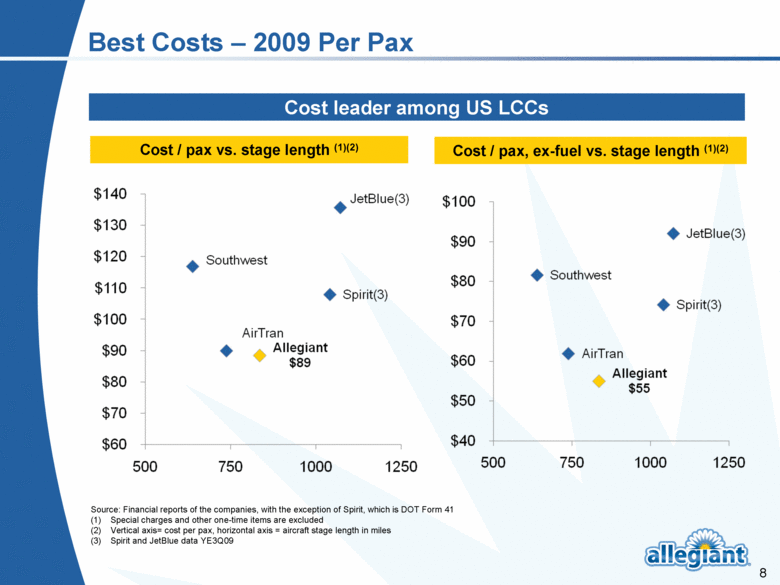
Best Costs – 2009 Per Pax Cost / pax vs. stage length (1)(2) Cost / pax, ex-fuel vs. stage length (1)(2) Cost leader among US LCCs Source: Financial reports of the companies, with the exception of Spirit, which is DOT Form 41 Special charges and other one-time items are excluded Vertical axis= cost per pax, horizontal axis = aircraft stage length in miles Spirit and JetBlue data YE3Q09 |
|
|
Low Cost Drivers Aircraft, efficiency, distribution Single fleet type - MD-80, low acquisition costs, avoid flying when we can’t make money (low utilization, 6.3 hrs/day 2009 compared to, say, Southwest at ~11 hrs per day) Simple, efficient product – one class, no connections Cost-based scheduling, e.g. aircraft/crew return to base every night Labor efficiencies – 35 full-time equivalent employees per aircraft Small city airports have lower costs Small cities are inexpensive media markets Direct distribution – “closed” system, ~90% use the website |
|
|
Unique Revenue Approach Minimal direct competition Capacity management Pricing philosophy Ancillary revenue Pricing power |
|
|
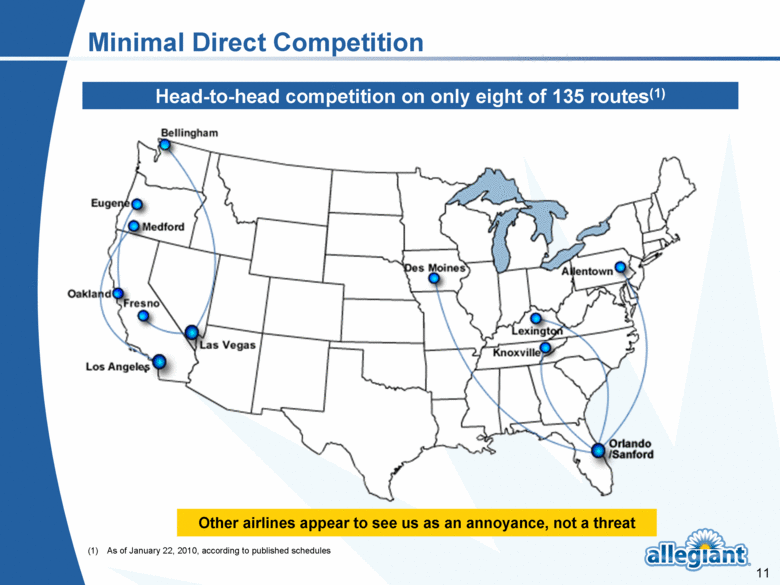
Minimal Direct Competition Head-to-head competition on only eight of 135 routes(1) Other airlines appear to see us as an annoyance, not a threat (1) As of January 22, 2010, according to published schedules |
|
|
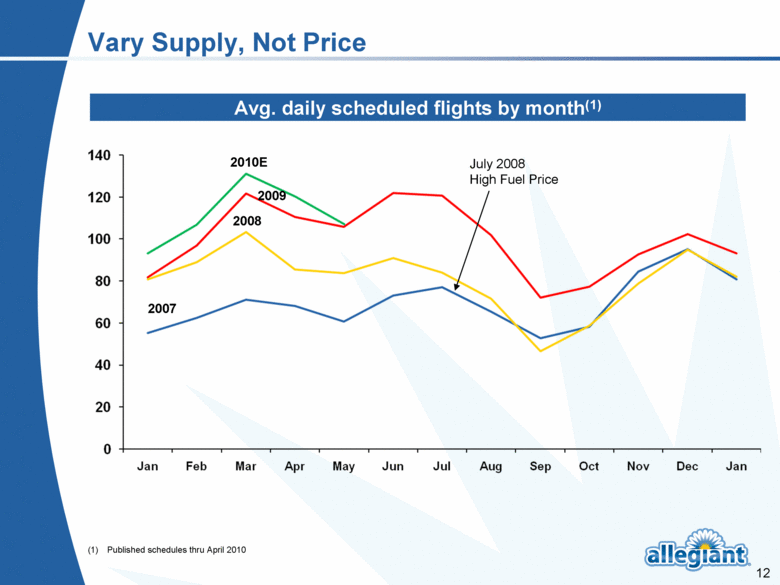
Avg. daily scheduled flights by month(1) Vary Supply, Not Price 2008 2007 2009 July 2008 High Fuel Price (1) Published schedules thru April 2010 2010E |
|
|
Price for Load 2009 scheduled load factor 90.4%, lowest month was 89.0% Las Vegas casinos price to fill rooms to maximize casino traffic – Allegiant prices to fill seats to maximize ancillary revenue Capacity plan (over long-term) & revenue plan (in short-term) to hit ~90% load factor $30+/pax ancillary incents us to fill airplanes Reduces cost/pax Low air fare gets potential customers to invest in transaction High load factors and high ancillary revenues permit low base fares Low base fares generate consumer interest Demand elasticity almost solely with respect to base fares Key is low base air fare |
|
|
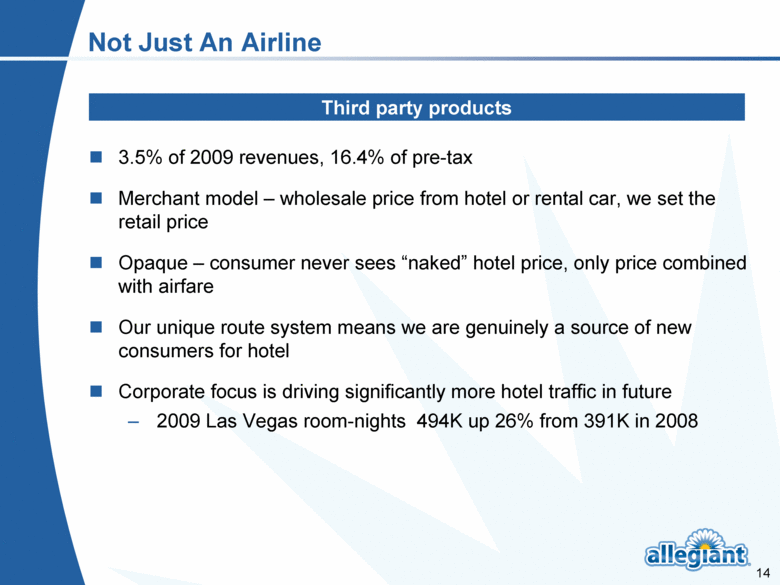
Not Just An Airline 3.5% of 2009 revenues, 16.4% of pre-tax Merchant model – wholesale price from hotel or rental car, we set the retail price Opaque – consumer never sees “naked” hotel price, only price combined with airfare Our unique route system means we are genuinely a source of new consumers for hotel Corporate focus is driving significantly more hotel traffic in future 2009 Las Vegas room-nights 494K up 26% from 391K in 2008 Third party products |
|
|
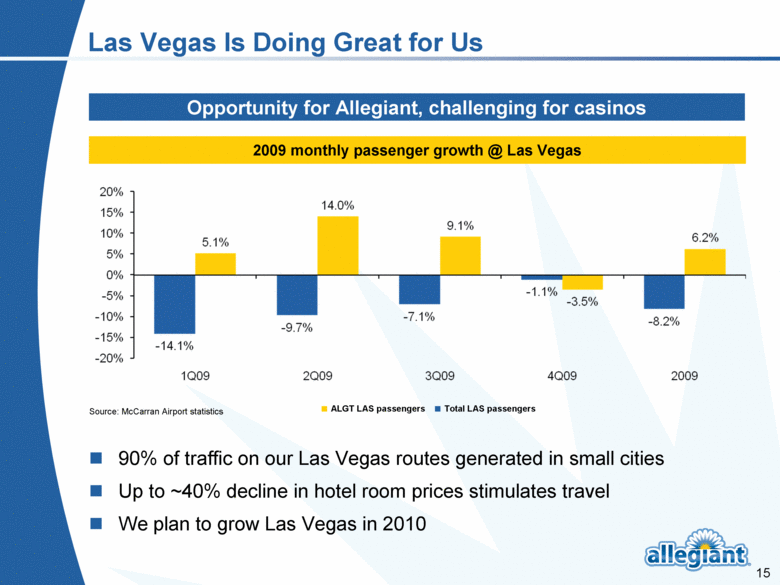
Las Vegas Is Doing Great for Us Opportunity for Allegiant, challenging for casinos 90% of traffic on our Las Vegas routes generated in small cities Up to ~40% decline in hotel room prices stimulates travel We plan to grow Las Vegas in 2010 2009 monthly passenger growth @ Las Vegas ALGT LAS passengers Total LAS passengers Source: McCarran Airport statistics |
|
|
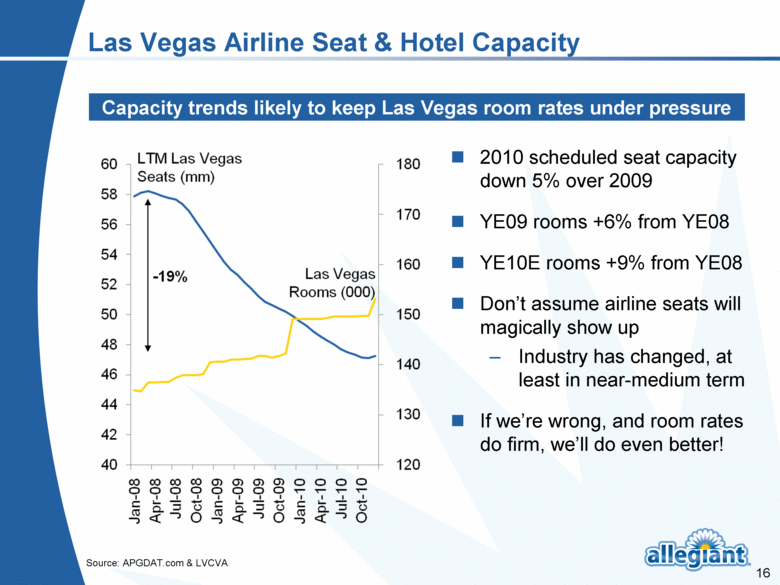
Las Vegas Airline Seat & Hotel Capacity 2010 scheduled seat capacity down 5% over 2009 YE09 rooms +6% from YE08 YE10E rooms +9% from YE08 Don’t assume airline seats will magically show up Industry has changed, at least in near-medium term If we’re wrong, and room rates do firm, we’ll do even better! Capacity trends likely to keep Las Vegas room rates under pressure Source: APGDAT.com & LVCVA |
|
|
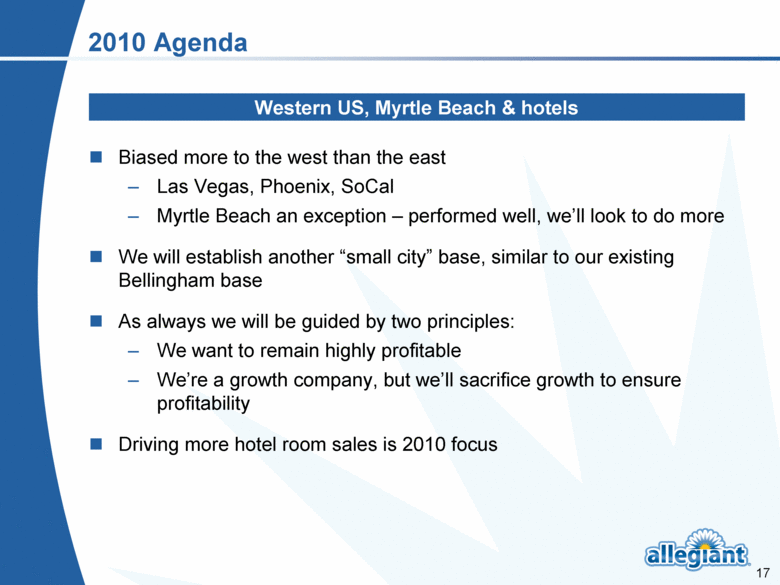
2010 Agenda Biased more to the west than the east Las Vegas, Phoenix, SoCal Myrtle Beach an exception – performed well, we’ll look to do more We will establish another “small city” base, similar to our existing Bellingham base As always we will be guided by two principles: We want to remain highly profitable We’re a growth company, but we’ll sacrifice growth to ensure profitability Driving more hotel room sales is 2010 focus Western US, Myrtle Beach & hotels |
|
|
Best Margins Source: Company filings 1) Data from YE3Q09 (%) LTM ended 2009 pre-tax margins Industry-leading margins |
|
|
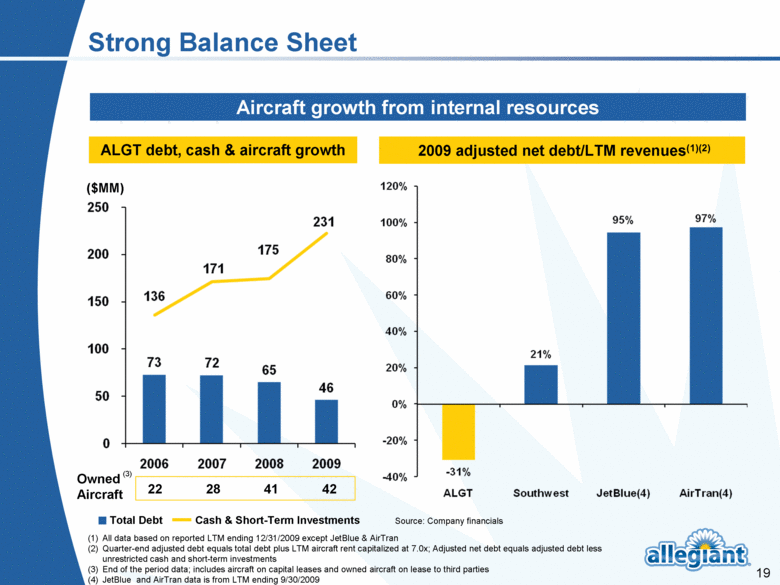
All data based on reported LTM ending 12/31/2009 except JetBlue & AirTran Quarter-end adjusted debt equals total debt plus LTM aircraft rent capitalized at 7.0x; Adjusted net debt equals adjusted debt less unrestricted cash and short-term investments End of the period data; includes aircraft on capital leases and owned aircraft on lease to third parties JetBlue and AirTran data is from LTM ending 9/30/2009 ALGT debt, cash & aircraft growth 2009 adjusted net debt/LTM revenues(1)(2) Source: Company financials Aircraft growth from internal resources Total Debt Cash & Short-Term Investments Owned Aircraft 22 28 41 42 ($MM) Strong Balance Sheet (3) |
|
|
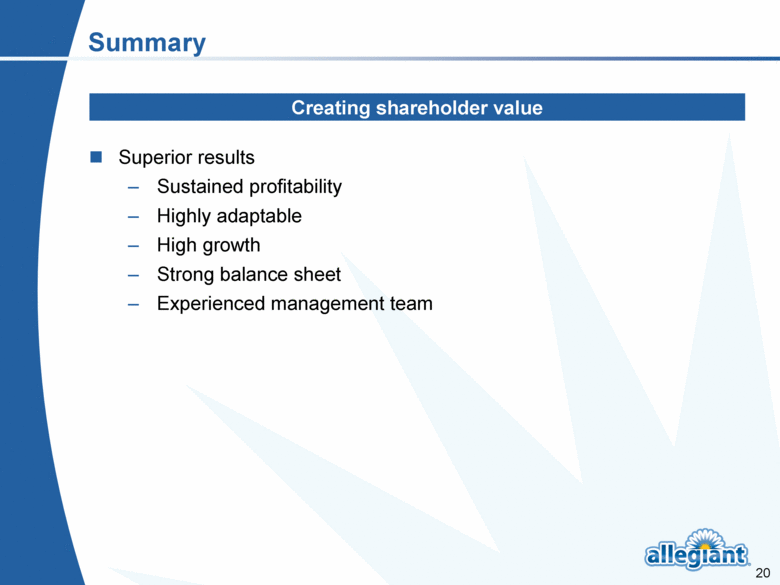
Summary Superior results Sustained profitability Highly adaptable High growth Strong balance sheet Experienced management team Creating shareholder value |
|
|
Appendix |
|
|
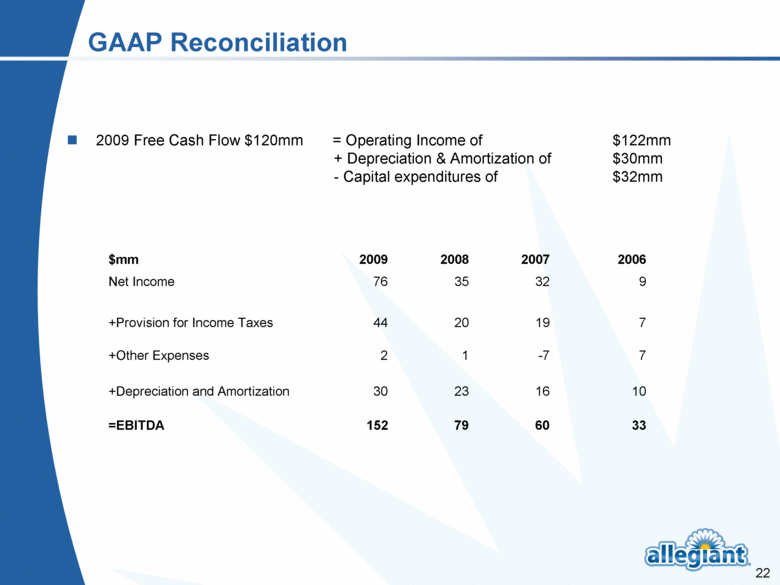
GAAP Reconciliation 2009 Free Cash Flow $120mm = Operating Income of $122mm + Depreciation & Amortization of $30mm - Capital expenditures of $32mm $mm 2009 2008 2007 2006 Net Income 76 35 32 9 +Provision for Income Taxes 44 20 19 7 +Other Expenses 2 1 -7 7 +Depreciation and Amortization 30 23 16 10 =EBITDA 152 79 60 33 |

