Attached files
| file | filename |
|---|---|
| 8-K - FORM 8-K - PRINCETON REVIEW INC | d8k.htm |
 The Princeton Review,
Inc. Investor Presentation January 2010 Exhibit 99.1 |
 All statements in this presentation that are not historical are forward-
looking statements within the meaning of Section 21E of the Securities
Exchange Act of 1934. Such forward-looking statements may be identified
by words such as "believe," "intend," "expect,"
"may," "could," "would," "will,"
"should," "plan," "project," "contemplate," "anticipate," or similar statements. Because these statements reflect The Princeton Review's current views concerning future events, these forward-looking statements
are subject to risks and uncertainties. The Princeton Review's actual
results could differ materially from those anticipated in these
forward- looking statements as a result of many factors, including,
but not limited to, demand for the company's products and services; the
company's ability to compete effectively and adjust to rapidly changing
market dynamics; the timing of revenue recognition from significant
contracts with schools and school districts; market acceptance of the
company's newer products and services; continued federal and state focus
on assessment and remediation in K-12 education; and the other
factors described under the caption "Risk Factors" in The
Princeton Review's most recent Forms 10- K and 10-Q filed with
the Securities and Exchange Commission. The Princeton Review undertakes
no obligation to update publicly any forward-looking statements
contained in this presentation. |
 3 Presenting Management Michael Perik President and Chief Executive Officer Stephen Richards Chief Operating Officer and Chief Financial Officer |
 4 The Princeton Review Test Preparation • Provides live and online college and graduate school test preparation and private tutoring • Offers comprehensive resources to students and parents on higher education • Partners with schools to assist in college readiness, test prep, and career planning services • 169 print and digital publications and a free website |
 5 Penn Foster • 134,000 active enrollments • 108 career programs (64 diplomas and 44 certificates) • Program focus: Allied Health, Business, Technology & Trade • Regionally and Nationally accredited • 37,000 active enrollments • 21 associate degrees and two bachelor’s degrees • Program focus: Business, Healthcare and Education • Nationally accredited • 52,000 active enrollments • Three diploma tracks – General Education – Healthcare Career – Virtual High School • Regionally and Nationally accredited • One of the oldest, largest and most recognized online career education providers in
the world • Operates three educational institutions serving more than 223,000 students in over
150 countries • Unique online academic model • Academic institutions leverage a highly scalable, in-house industry-leading
enrollment and student services infrastructure Information as of June 2009 |
 6 Company Highlights • Scaled platform provides comprehensive educational offerings covering the
post- secondary and test-preparation markets • Focus on affordable and accessible education, with proven results, addresses large,
unmet online market demand • The Princeton Review and Penn Foster brands are two of the most widely recognizable
education brands in the world • Significant opportunity remains in turnaround of legacy business and integration of Penn Foster acquisition • Attractive growth initiatives include both organic and external opportunities
• Cost-efficient business model is highly leveragable with strong revenue
visibility, free cash flow generation, and free of Title IV
regulation • Deep and experienced management team ready to execute its plan and take The
Princeton Review to the next level |
 7 Scaled Platform With Diversified Educational Offering 108 programs 134,000 active students 23 degree programs 37,000 active students Three diploma tracks 52,000 active students Consumer 100,000 students Test Prep Publishing/ Admissions 169 titles |
 8 Providing Accessible and Affordable Career Education Penn Foster Addresses Market Demands Quality • Regional and national accreditation • Programs address relevant 21st- century skills Accessible Affordable Outcomes • Asynchronous, self-paced • 100% online • Priced well below competitors • Flexible payment options • Immediate return on investment • High student satisfaction rates |
 9 rd Announced Partnership with the AFL-CIO National Labor College High quality online platform Industry-leading infrastructure enables low student acquisition costs and efficient student servicing Proven model with other 3 party institutions Only accredited higher education institution devoted exclusively to union leaders, members and activists Regional accreditation (Middle States) Access to 11.5 million AFL-CIO members and their families “College for Working Families” Target 11.5 million potential students at low student acquisition costs Offer affordable and accessible associate and full degree programs that are 100% online Regional accreditation |
 10 The Princeton Review Growth Initiatives Market Share Expansion Expansion Into New Segments Growth In Institutional Business Untapped Geographies • Approximately 12% of business today • Large district level test prep contracts had not been prior strategic focus • Increased focus on college readiness at district level throughout the country • Developed targeted sales effort; several 2008 wins indicative of larger opportunity Low High TPR Center Prep Population Key Currently cover 70% of geographic footprint opportunity Entry into lower priced segments can expand market opportunity Reasonable market share gain assumptions deliver 30% more revenue over long term 26% 10% 5% 0% 5% 10% 15% 20% 25% 30% 20% of Sites with Highest Shares Middle 60% of Markets 20% of Sites with Lowest Shares > $1,000 Price Point 45% $500 - $999 Price Point 21% < $500 Price Point 34% |
 11 Penn Foster Growth Initiatives • Pursue partnerships with top- 100 U.S. school districts – Launched in 2008 – Key partnership districts already under contract • Introduce specialty diplomas aimed toward post-secondary and career readiness • Acquire a regionally accredited college and leverage existing infrastructure • College redesign to improve retention • Introduce additional bachelor’s and master’s degree programs • Build, partner or acquire ground-based allied health institutes to augment existing course offering • Grow and penetrate new markets – Military – Community college – Workforce development • Continued optimization of all three schools – Increase enrollments through greater market penetration and improved student
quality – Opportunity to increase pricing without sacrificing enrollment volume – Further improve marketing efficiency and retention through continued implementation
of process improvement teams |
 FINANCIAL OVERVIEW |
 13 Overview of Financial Model High revenue visibility • Student tuition from test-prep classes and Penn Foster offerings provide reliable revenue streams • Free of Title IV regulation (90/10 rule) Operating leverage & margin expansion Strong free cash flow generation • Significant synergies between The Princeton Review and Penn Foster platforms • Incremental scale leverages infrastructure and fixed costs – Brand value and highly integrated student acquisition model provide low student acquisition costs – Partnerships such as National Labor College can provide significant revenue opportunities with low student acquisition costs • Online and bricks and mortar infrastructure is in-place • Modest maintenance capital expenditures required |
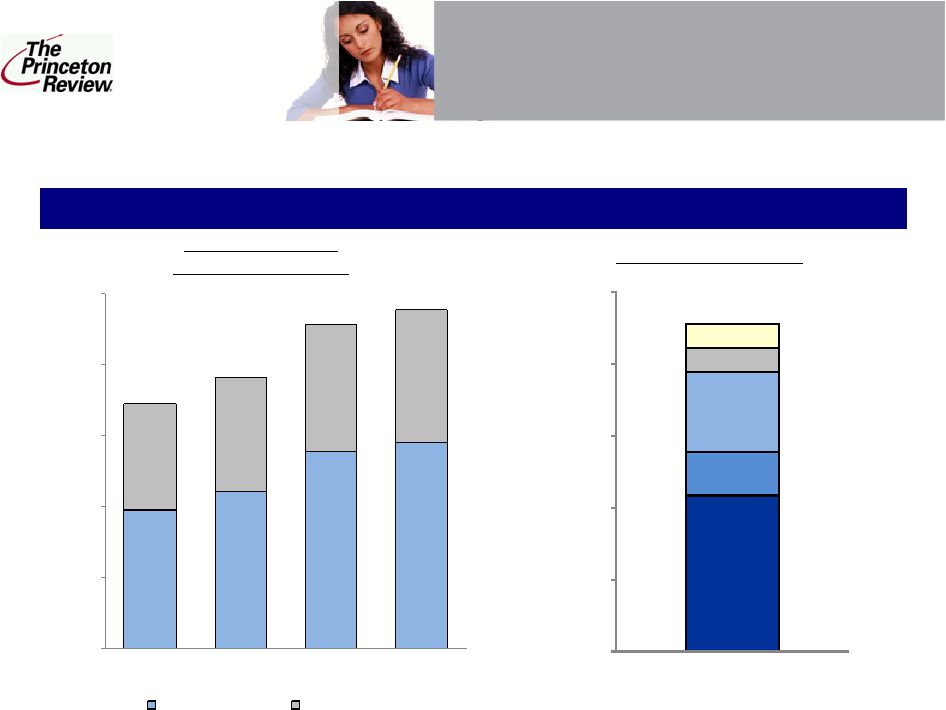 14 Pro-Forma Segmented Financials Pro Forma Revenue Breakdown Historical Revenue 2006 – LTM Sept 2009 2008 Revenue Breakout Pro forma combined revenue for the LTM period ended September 30, 2009 is $238.9 million, derived from several different revenue streams $97.2 $110.6 $138.8 $144.9 $75.2 $80.5 $89.4 $94.1 $172.4 $191.1 $228.2 $238.9 $0 $50 $100 $150 $200 $250 2006 2007 2008 LTM Sept-09 Princeton Review Penn Foster Test- Prep SES Career High School College $228.2 $0 $50 $100 $150 $200 $250 1 |
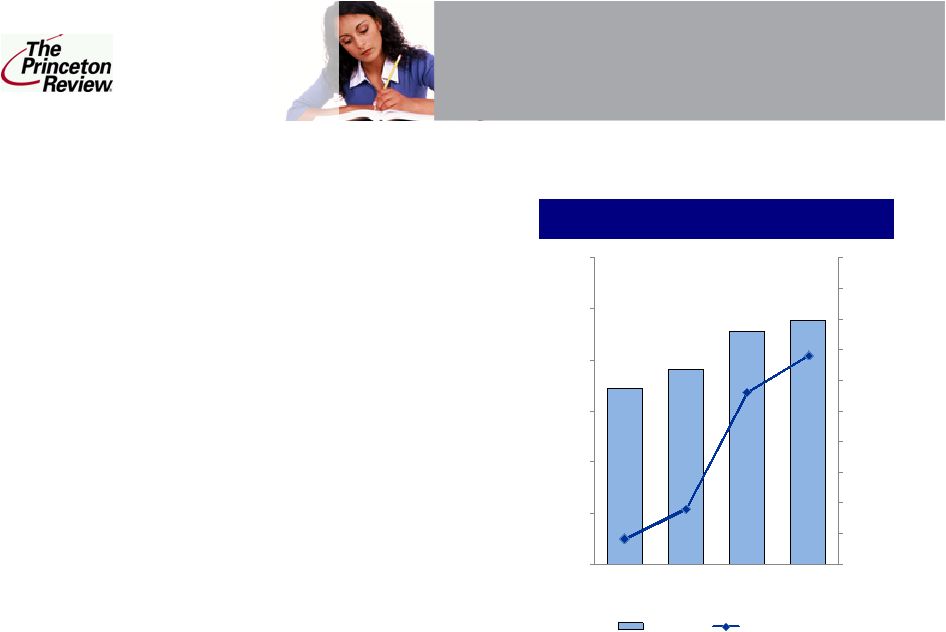 15 Pro Forma Historical Financials • Significant revenue and Adjusted EBITDA growth between 2006 and 2008 – Revenue CAGR of 15% – Adjusted EBITDA CAGR of 158% – Adjusted EBITDA margin increase of 11.6% • Continued strong performance year-to-date – LTM September 2009 Adjusted EBITDA grew 21.3% over FYE 2008 – LTM September 2009 Adjusted EBITDA margin grew 2% points over FYE 2008 Pro forma combined revenue and EBITDA demonstrate strong growth Note: LTM September 2009 pro forma combined Adjusted EBITDA includes $1 million of synergies to be realized within first 30 days post-close Strong Historical Performance $172.4 $191.1 $228.2 $238.9 $4.2 $9.1 $28.2 $34.2 $0 $5 $10 $15 $20 $25 $30 $35 $40 $45 $50 $0 $50 $100 $150 $200 $250 $300 2006 2007 2008 LTM Sept-09 Revenue Pro Forma EBITDA Please see Appendix for definition of Adjusted EBITDA |
 16 Company Highlights • Scaled platform provides comprehensive educational offerings covering the
post- secondary and test-preparation markets • Focus on affordable and accessible education, with proven results, addresses large,
unmet market demand • The Princeton Review and Penn Foster brands are two of the most widely recognizable
education brands in the world • Significant opportunity remains in turnaround of legacy business and integration of Penn Foster acquisition • Attractive growth initiatives include both organic and external opportunities
• Cost-efficient business model is highly leveragable with strong revenue
visibility, free cash flow generation, and free of Title IV
regulation • Deep and experienced management team ready to execute its plan and take The
Princeton Review to the next level |
 17 APPENDIX APPENDIX |
 18 Use of Non-GAAP Measures Use of Non-GAAP measures • In this presentation, The Princeton Review (the “Company”) discussed
Adjusted EBITDA, a non-GAAP (Generally Accepted Accounting
Principles) financial measure. The Company defines Adjusted EBITDA as income from continuing operations before income taxes, interest income and expense and depreciation, amortization,
restructuring and acquisition expenses and, with respect to Penn Foster,
expenses and fees paid to or on behalf of prior shareholders. We believe that these measures can facilitate operating performance comparisons from period to period and company to company by backing out
potential differences caused by variations in tax positions, capital
structures (affecting interest expense), the lives, methods and purchase accounting impact on fixed and intangible assets (affecting depreciation and amortization expense) and one-time charges not
expected to reoccur in the future. Adjusted EBITDA is not a measurement
of our financial performance under GAAP and should not be considered as
an alternative to net income, operating income or any other performance
measures derived in accordance with GAAP or as an alternative to cash flow from operating activities as a measure of our profitability or liquidity. Adjusted EBITDA has limitations as an analytical tool, and you should not consider them in isolation, or as a substitute for analysis of our results as reported under GAAP.
Some of these limitations are: • Adjusted EBITDA does not reflect our cash expenditures, or future requirements for
capital expenditures or contractual commitments; • Adjusted EBITDA does not reflect changes in, or cash requirements for, our working
capital needs; • Adjusted EBITDA does not reflect the interest expense, or the cash requirements necessary to service interest or principal payments, on our debts; • Although depreciation and amortization are non-cash charges, the assets being depreciated and amortized will often have to be replaced in the future, and Adjusted EBITDA does not reflect any cash requirements for such
replacements; and • Other companies in our industry may calculate Adjusted EBITDA differently than we do,
limiting its usefulness as a comparative measure. • The Company is unable to furnish a reconciliation of EBITDA or Adjusted EBITDA to the most comparable GAAP financial measures at this time because financial statements containing such
measures have not yet been prepared. The Company intends to file pro-forma financial information prepared in accordance with GAAP on Form 8-K
on or before February 22, 2010. This pro-forma financial
information will contain comparable GAAP financial measures. |
 19 |