Attached files
| file | filename |
|---|---|
| 8-K - FORM 8-K - WELLS FARGO & COMPANY/MN | f54645e8vk.htm |
| EX-99.1 - EX-99.1 - WELLS FARGO & COMPANY/MN | f54645exv99w1.htm |
Exhibit 99.2

| 4Q09 Quarterly Supplement January 20, 2010 |
| Forward-looking statements and additional information Forward-looking statements: This Quarterly Supplement contains forward-looking statements about our future financial performance. These forward-looking statements include statements using words such as "believe," "expect," "anticipate," "estimate," "should," "may," "can," "will," "outlook" or similar expressions. Forward-looking statements in this Quarterly Supplement include, among others, statements about: expected or estimated future losses in our loan portfolios; the future economic environment; reduction or mitigation of risk in our loan portfolios; potential sales of loan portfolios; future effects of loan modification programs; life-of-loan loss estimates; future recast risk in the Pick-a- Pay portfolio; the amount and timing of expected cost savings and integration expenses relating to the Wachovia merger; and the impact on our balance sheet and capital of the consolidation of certain off-balance sheet assets under FAS 166 and FAS 167. Investors are urged to not unduly rely on forward-looking statements as actual results could differ materially from expectations. Forward-looking statements speak only as of the date made, and we do not undertake to update them to reflect changes or events that occur after that date. For more information about factors that could cause actual results to differ materially from expectations, refer to pages 16 -17 of Wells Fargo's press release announcing our fourth quarter results, as well as Wells Fargo's reports filed with the Securities and Exchange Commission, including our Quarterly Reports on Form 10-Q for the periods ended September 30, 2009, June 30, 2009 and March 31, 2009, and our Annual Report on Form 10-K for the year ended December 31, 2008, as amended by our Current Report on Form 8-K filed May 11, 2009, including the discussion under "Risk Factors" in each of those reports. Purchased credit-impaired loan portfolio: Loans that were acquired from Wachovia that were considered credit impaired were written down at acquisition date in purchase accounting to an amount estimated to be collectible in accordance with FASB ASC 310-30 (formerly SOP 03-3), and the related allowance for loan losses was not carried over to Wells Fargo's allowance. In addition, such purchased credit-impaired loans are not classified as nonaccrual or nonperforming, and are not included in loans that were contractually 90+ days past due and still accruing. Any losses on such loans are charged against the nonaccretable difference established in purchase accounting and are not reported as charge- offs (until such difference is fully utilized). As a result of accounting for purchased loans with evidence of credit deterioration, certain ratios of the combined company are not comparable to a portfolio that does not include purchased credit-impaired loans accounted for under FASB ASC 310-30. In certain cases, the purchased credit-impaired loans may affect portfolio credit ratios and trends. Management believes that the presentation of information adjusted to exclude the purchased credit-impaired loans provides useful disclosure regarding the credit quality of the non-impaired loan portfolio. Accordingly, certain of the loan balances and credit ratios in this Quarterly Supplement have been adjusted to exclude the purchased credit- impaired loans. References in this Quarterly Supplement to impaired loans mean the purchased credit-impaired loans. Please see pages 30-32 of the press release for additional information regarding the purchased credit- impaired loans. |
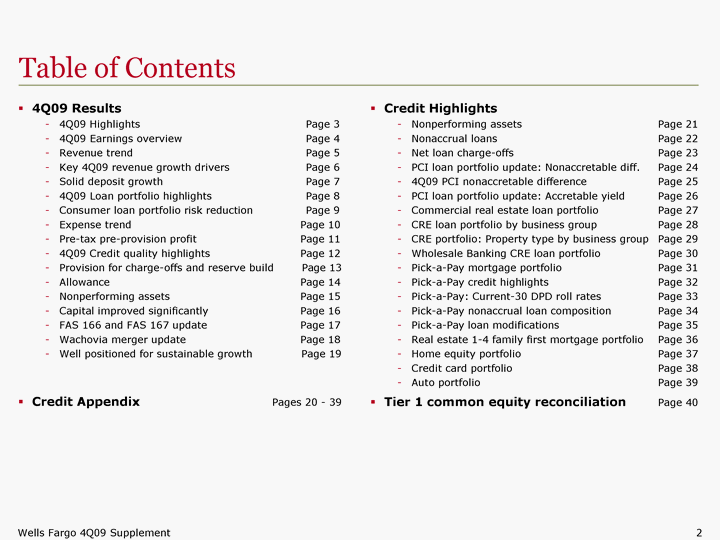
| Table of Contents 4Q09 Results 4Q09 Highlights Page 3 4Q09 Earnings overview Page 4 Revenue trend Page 5 Key 4Q09 revenue growth drivers Page 6 Solid deposit growth Page 7 4Q09 Loan portfolio highlights Page 8 Consumer loan portfolio risk reduction Page 9 Expense trend Page 10 Pre-tax pre-provision profit Page 11 4Q09 Credit quality highlights Page 12 Provision for charge-offs and reserve build Page 13 Allowance Page 14 Nonperforming assets Page 15 Capital improved significantly Page 16 FAS 166 and FAS 167 update Page 17 Wachovia merger update Page 18 Well positioned for sustainable growth Page 19 Credit Appendix Pages 20 - 39 Credit Highlights Nonperforming assets Page 21 Nonaccrual loans Page 22 Net loan charge-offs Page 23 PCI loan portfolio update: Nonaccretable diff. Page 24 4Q09 PCI nonaccretable difference Page 25 PCI loan portfolio update: Accretable yield Page 26 Commercial real estate loan portfolio Page 27 CRE loan portfolio by business group Page 28 CRE portfolio: Property type by business group Page 29 Wholesale Banking CRE loan portfolio Page 30 Pick-a-Pay mortgage portfolio Page 31 Pick-a-Pay credit highlights Page 32 Pick-a-Pay: Current-30 DPD roll rates Page 33 Pick-a-Pay nonaccrual loan composition Page 34 Pick-a-Pay loan modifications Page 35 Real estate 1-4 family first mortgage portfolio Page 36 Home equity portfolio Page 37 Credit card portfolio Page 38 Auto portfolio Page 39 Tier 1 common equity reconciliation Page 40 |
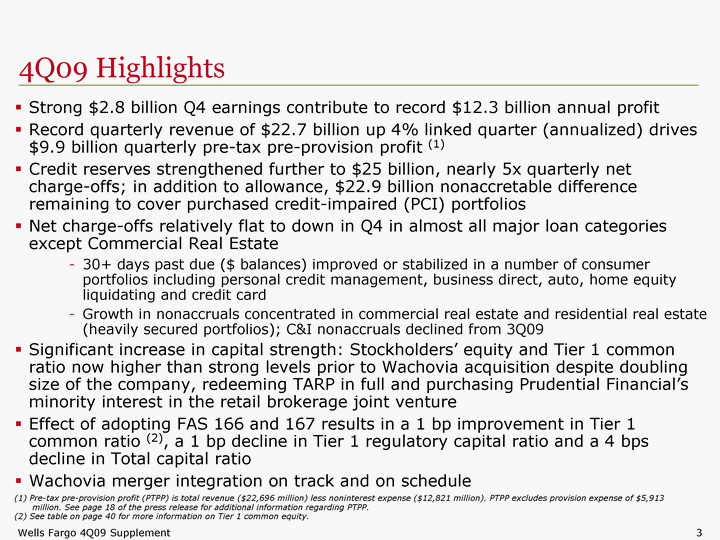
| 4Q09 Highlights Strong $2.8 billion Q4 earnings contribute to record $12.3 billion annual profit Record quarterly revenue of $22.7 billion up 4% linked quarter (annualized) drives $9.9 billion quarterly pre-tax pre-provision profit (1) Credit reserves strengthened further to $25 billion, nearly 5x quarterly net charge-offs; in addition to allowance, $22.9 billion nonaccretable difference remaining to cover purchased credit-impaired (PCI) portfolios Net charge-offs relatively flat to down in Q4 in almost all major loan categories except Commercial Real Estate 30+ days past due ($ balances) improved or stabilized in a number of consumer portfolios including personal credit management, business direct, auto, home equity liquidating and credit card Growth in nonaccruals concentrated in commercial real estate and residential real estate (heavily secured portfolios); C&I nonaccruals declined from 3Q09 Significant increase in capital strength: Stockholders' equity and Tier 1 common ratio now higher than strong levels prior to Wachovia acquisition despite doubling size of the company, redeeming TARP in full and purchasing Prudential Financial's minority interest in the retail brokerage joint venture Effect of adopting FAS 166 and 167 results in a 1 bp improvement in Tier 1 common ratio (2), a 1 bp decline in Tier 1 regulatory capital ratio and a 4 bps decline in Total capital ratio Wachovia merger integration on track and on schedule (1) Pre-tax pre-provision profit (PTPP) is total revenue ($22,696 million) less noninterest expense ($12,821 million). PTPP excludes provision expense of $5,913 million. See page 18 of the press release for additional information regarding PTPP. (2) See table on page 40 for more information on Tier 1 common equity. |
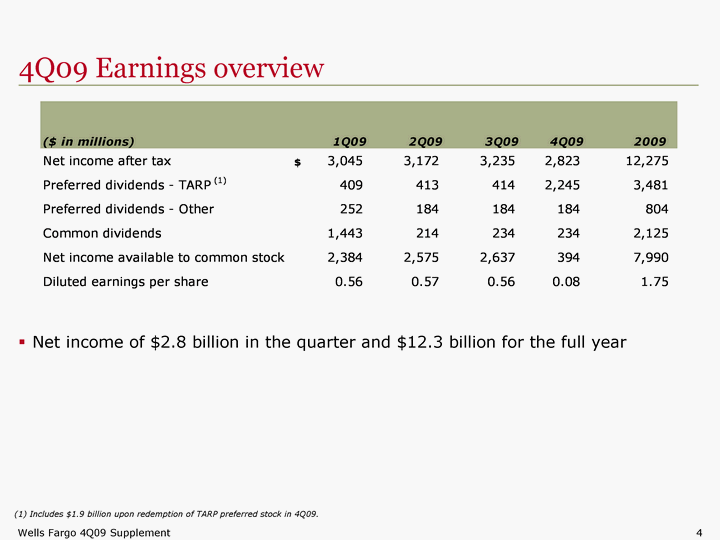
| 4Q09 Earnings overview Net income of $2.8 billion in the quarter and $12.3 billion for the full year Net income of $2.8 billion in the quarter and $12.3 billion for the full year (1) Includes $1.9 billion upon redemption of TARP preferred stock in 4Q09. |
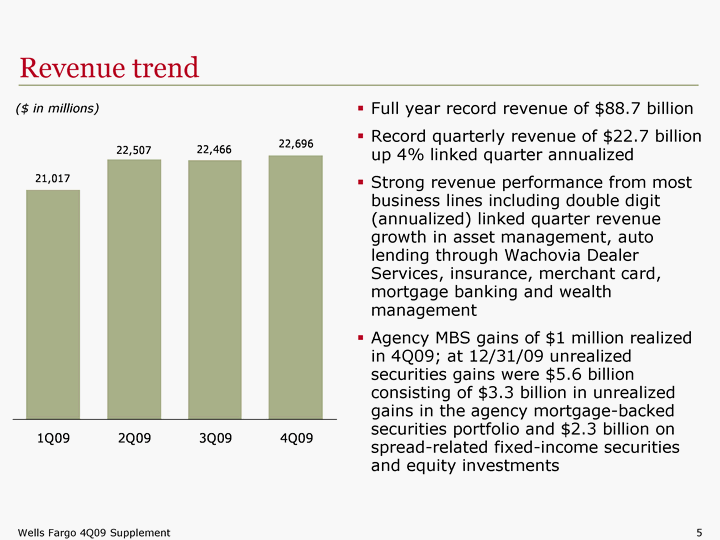
| Revenue trend 1Q08 2Q08 1Q09 2Q09 3Q09 4Q09 Column 1 0.0156 0.0188 21017 22507 22466 22696 Full year record revenue of $88.7 billion Record quarterly revenue of $22.7 billion up 4% linked quarter annualized Strong revenue performance from most business lines including double digit (annualized) linked quarter revenue growth in asset management, auto lending through Wachovia Dealer Services, insurance, merchant card, mortgage banking and wealth management Agency MBS gains of $1 million realized in 4Q09; at 12/31/09 unrealized securities gains were $5.6 billion consisting of $3.3 billion in unrealized gains in the agency mortgage-backed securities portfolio and $2.3 billion on spread-related fixed-income securities and equity investments ($ in millions) |
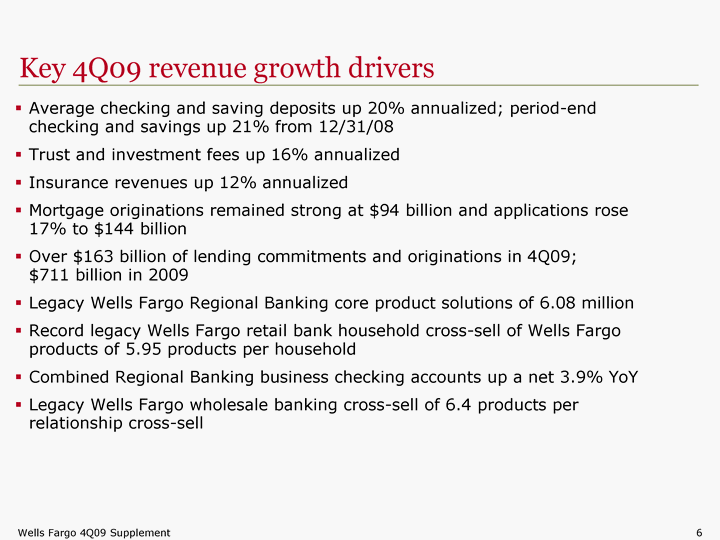
| Key 4Q09 revenue growth drivers Average checking and saving deposits up 20% annualized; period-end checking and savings up 21% from 12/31/08 Trust and investment fees up 16% annualized Insurance revenues up 12% annualized Mortgage originations remained strong at $94 billion and applications rose 17% to $144 billion Over $163 billion of lending commitments and originations in 4Q09; $711 billion in 2009 Legacy Wells Fargo Regional Banking core product solutions of 6.08 million Record legacy Wells Fargo retail bank household cross-sell of Wells Fargo products of 5.95 products per household Combined Regional Banking business checking accounts up a net 3.9% YoY Legacy Wells Fargo wholesale banking cross-sell of 6.4 products per relationship cross-sell |
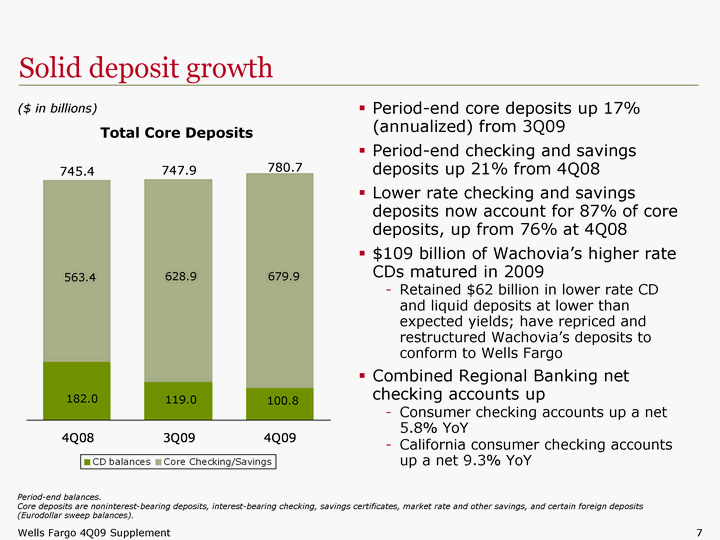
| Solid deposit growth 4Q08 3Q09 4Q09 CD balances 182.043 119 100.8 Core Checking/Savings 563.389 628.9 679.9 Period-end core deposits up 17% (annualized) from 3Q09 Period-end checking and savings deposits up 21% from 4Q08 Lower rate checking and savings deposits now account for 87% of core deposits, up from 76% at 4Q08 $109 billion of Wachovia's higher rate CDs matured in 2009 Retained $62 billion in lower rate CD and liquid deposits at lower than expected yields; have repriced and restructured Wachovia's deposits to conform to Wells Fargo Combined Regional Banking net checking accounts up Consumer checking accounts up a net 5.8% YoY California consumer checking accounts up a net 9.3% YoY Period-end balances. Core deposits are noninterest-bearing deposits, interest-bearing checking, savings certificates, market rate and other savings, and certain foreign deposits (Eurodollar sweep balances). 745.4 ($ in billions) Total Core Deposits 182.0 563.4 747.9 628.9 119.0 780.7 679.9 100.8 |
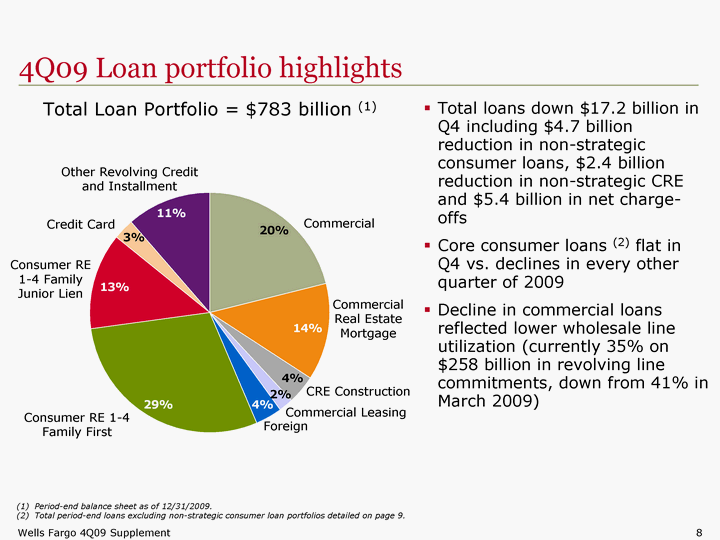
| comm cre - mortgage cre - construction lease Foreign RE 1-4 Family 1st RE 1-4 Fam Junior Lien Credit Card Other Revolving Credit 169610 103442 31719 14115 30282 232622 104538 23597 90027 Period-end balance sheet as of 12/31/2009. Total period-end loans excluding non-strategic consumer loan portfolios detailed on page 9. 4Q09 Loan portfolio highlights Total Loan Portfolio = $783 billion (1) Consumer RE 1-4 Family First Consumer RE 1-4 Family Junior Lien Credit Card Other Revolving Credit and Installment Commercial Commercial Real Estate Mortgage Commercial Leasing Foreign Total loans down $17.2 billion in Q4 including $4.7 billion reduction in non-strategic consumer loans, $2.4 billion reduction in non-strategic CRE and $5.4 billion in net charge- offs Core consumer loans (2) flat in Q4 vs. declines in every other quarter of 2009 Decline in commercial loans reflected lower wholesale line utilization (currently 35% on $258 billion in revolving line commitments, down from 41% in March 2009) CRE Construction |
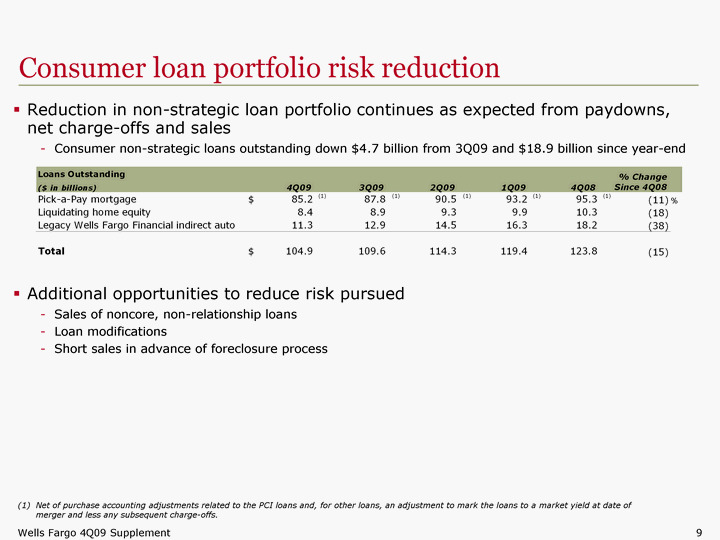
| Consumer loan portfolio risk reduction Reduction in non-strategic loan portfolio continues as expected from paydowns, net charge-offs and sales Consumer non-strategic loans outstanding down $4.7 billion from 3Q09 and $18.9 billion since year-end Additional opportunities to reduce risk pursued Sales of noncore, non-relationship loans Loan modifications Short sales in advance of foreclosure process (1) Net of purchase accounting adjustments related to the PCI loans and, for other loans, an adjustment to mark the loans to a market yield at date of merger and less any subsequent charge-offs. merger and less any subsequent charge-offs. merger and less any subsequent charge-offs. |
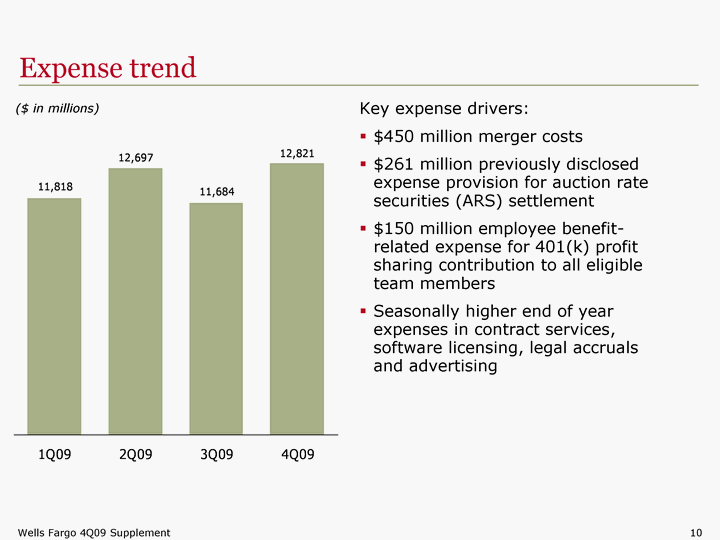
| Expense trend 1Q08 2Q08 1Q09 2Q09 3Q09 4Q09 Column 1 0.0156 0.0188 11818 12697 11684 12821 Key expense drivers: $450 million merger costs $261 million previously disclosed expense provision for auction rate securities (ARS) settlement $150 million employee benefit- related expense for 401(k) profit sharing contribution to all eligible team members Seasonally higher end of year expenses in contract services, software licensing, legal accruals and advertising ($ in millions) |
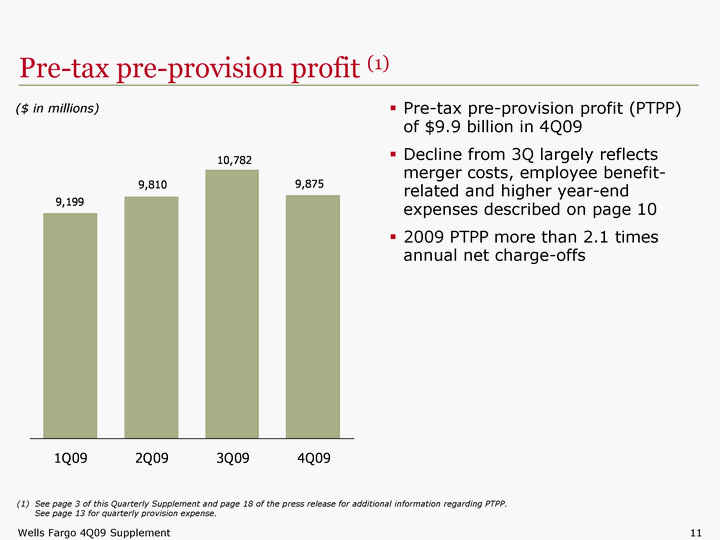
| Pre-tax pre-provision profit (1) 1Q08 2Q08 1Q09 2Q09 3Q09 4Q09 Column 1 0.0156 0.0188 9199 9810 10782 9875 Pre-tax pre-provision profit (PTPP) of $9.9 billion in 4Q09 Decline from 3Q largely reflects merger costs, employee benefit- related and higher year-end expenses described on page 10 2009 PTPP more than 2.1 times annual net charge-offs ($ in millions) (1) See page 3 of this Quarterly Supplement and page 18 of the press release for additional information regarding PTPP. See page 13 for quarterly provision expense. |
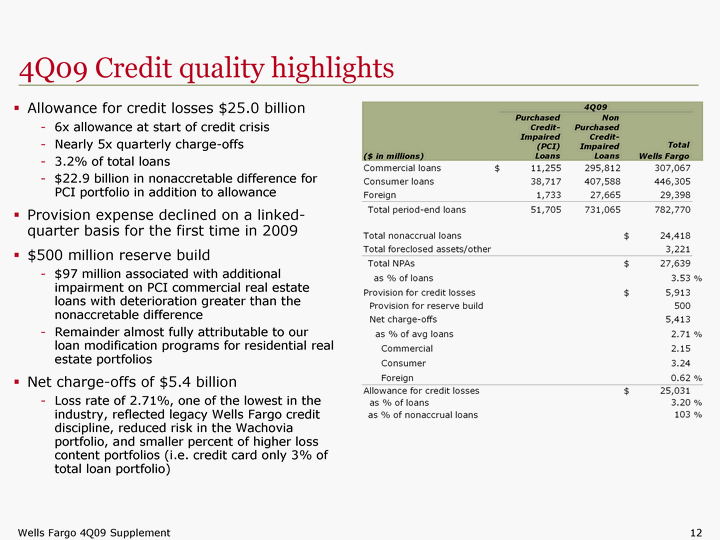
| 4Q09 Credit quality highlights Allowance for credit losses $25.0 billion 6x allowance at start of credit crisis Nearly 5x quarterly charge-offs 3.2% of total loans $22.9 billion in nonaccretable difference for PCI portfolio in addition to allowance Provision expense declined on a linked- quarter basis for the first time in 2009 $500 million reserve build $97 million associated with additional impairment on PCI commercial real estate loans with deterioration greater than the nonaccretable difference Remainder almost fully attributable to our loan modification programs for residential real estate portfolios Net charge-offs of $5.4 billion Loss rate of 2.71%, one of the lowest in the industry, reflected legacy Wells Fargo credit discipline, reduced risk in the Wachovia portfolio, and smaller percent of higher loss content portfolios (i.e. credit card only 3% of total loan portfolio) total loan portfolio) total loan portfolio) total loan portfolio) total loan portfolio) total loan portfolio) total loan portfolio) total loan portfolio) total loan portfolio) total loan portfolio) total loan portfolio) total loan portfolio) total loan portfolio) total loan portfolio) total loan portfolio) total loan portfolio) total loan portfolio) total loan portfolio) total loan portfolio) total loan portfolio) total loan portfolio) total loan portfolio) total loan portfolio) total loan portfolio) |
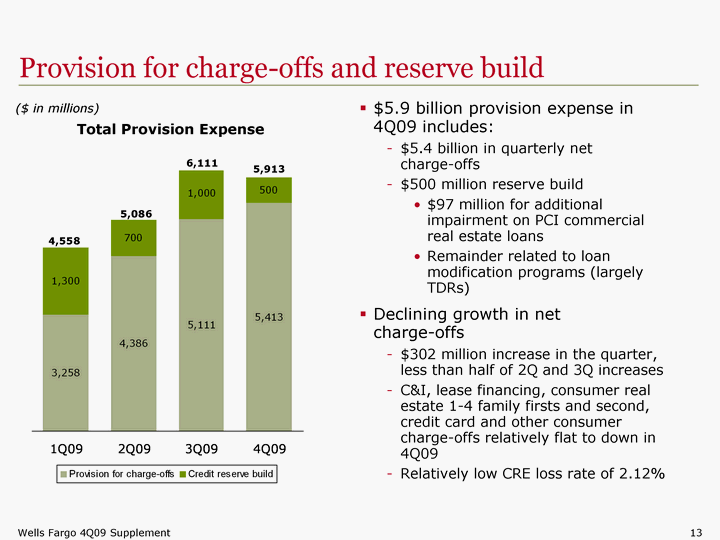
| Provision for charge-offs and reserve build 1Q08 2Q08 1Q09 2Q09 3Q09 4Q09 Provision for charge-offs 0.0156 0.0188 3258 4386 5111 5413 Credit reserve build 1300 700 1000 500 $5.9 billion provision expense in 4Q09 includes: $5.4 billion in quarterly net charge-offs $500 million reserve build $97 million for additional impairment on PCI commercial real estate loans Remainder related to loan modification programs (largely TDRs) Declining growth in net charge-offs $302 million increase in the quarter, less than half of 2Q and 3Q increases C&I, lease financing, consumer real estate 1-4 family firsts and second, credit card and other consumer charge-offs relatively flat to down in 4Q09 Relatively low CRE loss rate of 2.12% ($ in millions) Total Provision Expense 4,558 5,086 5,913 6,111 |
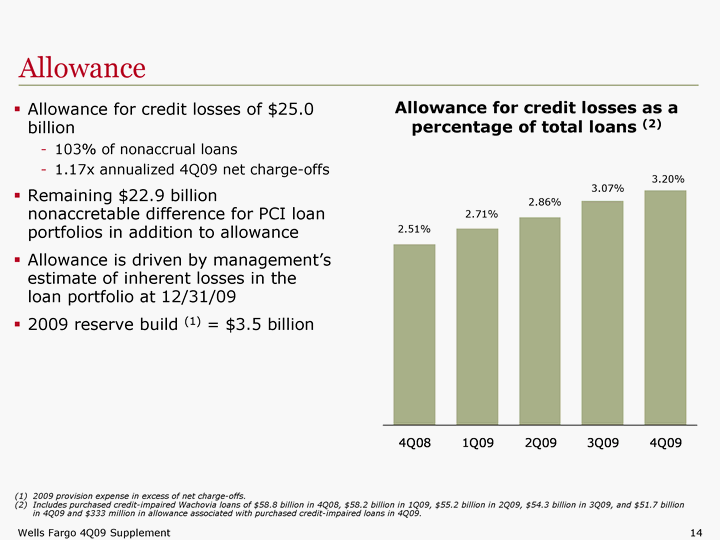
| Allowance 1Q08 2Q08 3Q08 4Q08 1Q09 2Q09 3Q09 4Q09 Column 1 0.0156 0.0188 0.0195 0.0251 0.0271 0.0286 0.0307 0.032 0.0018 0.002 0.00306 0.0019 Allowance for credit losses as a percentage of total loans (2) (1) 2009 provision expense in excess of net charge-offs. (2) Includes purchased credit-impaired Wachovia loans of $58.8 billion in 4Q08, $58.2 billion in 1Q09, $55.2 billion in 2Q09, $54.3 billion in 3Q09, and $51.7 billion in 4Q09 and $333 million in allowance associated with purchased credit-impaired loans in 4Q09. Allowance for credit losses of $25.0 billion 103% of nonaccrual loans 1.17x annualized 4Q09 net charge-offs Remaining $22.9 billion nonaccretable difference for PCI loan portfolios in addition to allowance Allowance is driven by management's estimate of inherent losses in the loan portfolio at 12/31/09 2009 reserve build (1) = $3.5 billion 2.71% 2.51% 2.86% 3.07% 3.20% |
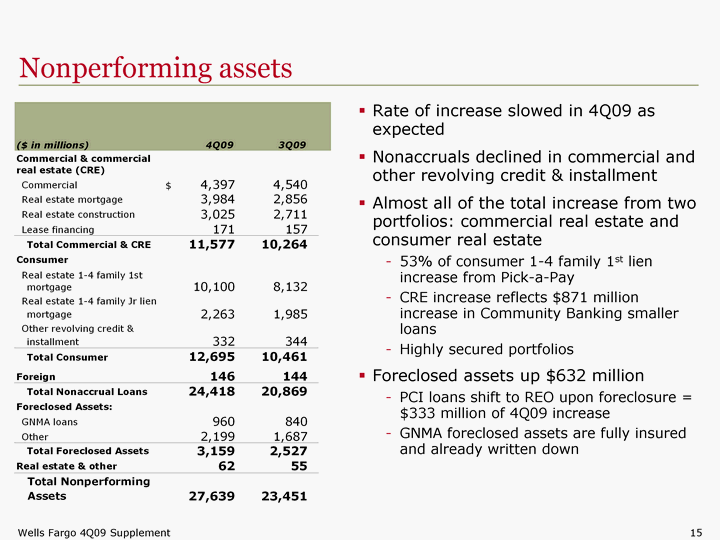
| Nonperforming assets Nonperforming assets Rate of increase slowed in 4Q09 as expected Nonaccruals declined in commercial and other revolving credit & installment Almost all of the total increase from two portfolios: commercial real estate and consumer real estate 53% of consumer 1-4 family 1st lien increase from Pick-a-Pay CRE increase reflects $871 million increase in Community Banking smaller loans Highly secured portfolios Foreclosed assets up $632 million PCI loans shift to REO upon foreclosure = $333 million of 4Q09 increase GNMA foreclosed assets are fully insured and already written down |
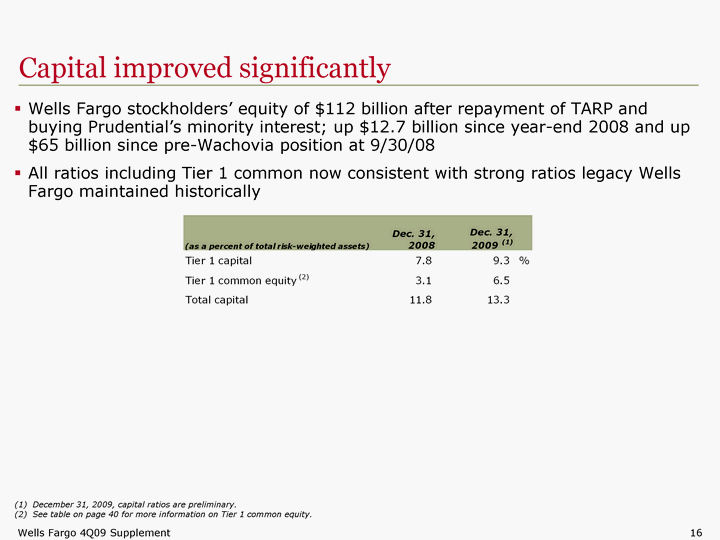
| Capital improved significantly Wells Fargo stockholders' equity of $112 billion after repayment of TARP and buying Prudential's minority interest; up $12.7 billion since year-end 2008 and up $65 billion since pre-Wachovia position at 9/30/08 All ratios including Tier 1 common now consistent with strong ratios legacy Wells Fargo maintained historically December 31, 2009, capital ratios are preliminary. (2) See table on page 40 for more information on Tier 1 common equity. (3) Based on average 4Q08 Wells Fargo assets only, excludes Wachovia. (3) Based on average 4Q08 Wells Fargo assets only, excludes Wachovia. (3) Based on average 4Q08 Wells Fargo assets only, excludes Wachovia. (3) Based on average 4Q08 Wells Fargo assets only, excludes Wachovia. |
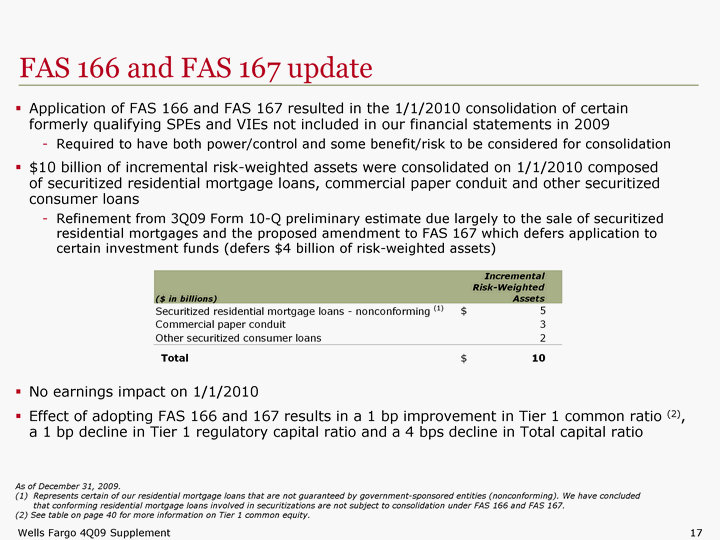
| FAS 166 and FAS 167 update Application of FAS 166 and FAS 167 resulted in the 1/1/2010 consolidation of certain formerly qualifying SPEs and VIEs not included in our financial statements in 2009 Required to have both power/control and some benefit/risk to be considered for consolidation $10 billion of incremental risk-weighted assets were consolidated on 1/1/2010 composed of securitized residential mortgage loans, commercial paper conduit and other securitized consumer loans Refinement from 3Q09 Form 10-Q preliminary estimate due largely to the sale of securitized residential mortgages and the proposed amendment to FAS 167 which defers application to certain investment funds (defers $4 billion of risk-weighted assets) No earnings impact on 1/1/2010 Effect of adopting FAS 166 and 167 results in a 1 bp improvement in Tier 1 common ratio (2), a 1 bp decline in Tier 1 regulatory capital ratio and a 4 bps decline in Total capital ratio As of December 31, 2009. Represents certain of our residential mortgage loans that are not guaranteed by government-sponsored entities (nonconforming). We have concluded that conforming residential mortgage loans involved in securitizations are not subject to consolidation under FAS 166 and FAS 167. (2) See table on page 40 for more information on Tier 1 common equity. |
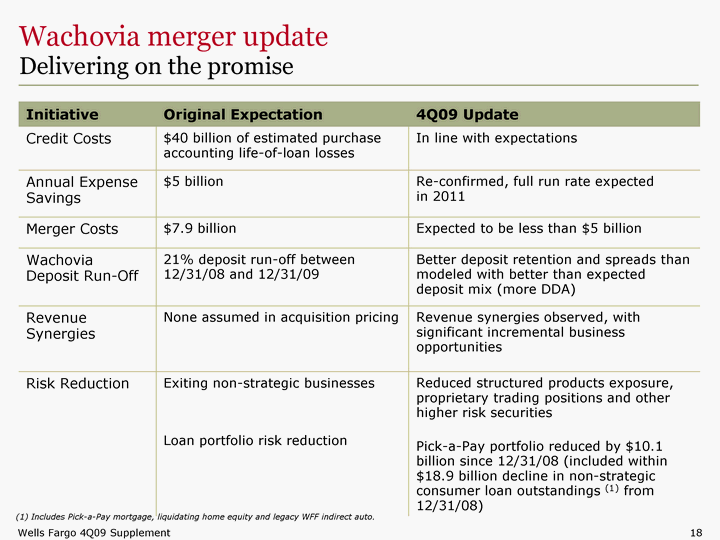
| Wachovia merger update Delivering on the promise Initiative Original Expectation 4Q09 Update Credit Costs $40 billion of estimated purchase accounting life-of-loan losses In line with expectations Annual Expense Savings $5 billion Re-confirmed, full run rate expected in 2011 Merger Costs $7.9 billion Expected to be less than $5 billion Wachovia Deposit Run-Off 21% deposit run-off between 12/31/08 and 12/31/09 Better deposit retention and spreads than modeled with better than expected deposit mix (more DDA) Revenue Synergies None assumed in acquisition pricing Revenue synergies observed, with significant incremental business opportunities Risk Reduction Exiting non-strategic businesses Loan portfolio risk reduction Reduced structured products exposure, proprietary trading positions and other higher risk securities Pick-a-Pay portfolio reduced by $10.1 billion since 12/31/08 (included within $18.9 billion decline in non-strategic consumer loan outstandings (1) from 12/31/08) (1) Includes Pick-a-Pay mortgage, liquidating home equity and legacy WFF indirect auto. |
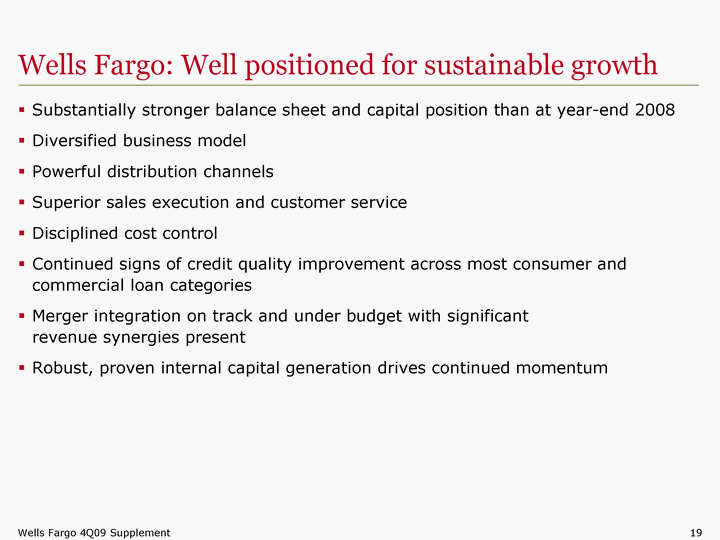
| Wells Fargo: Well positioned for sustainable growth Substantially stronger balance sheet and capital position than at year-end 2008 Diversified business model Powerful distribution channels Superior sales execution and customer service Disciplined cost control Continued signs of credit quality improvement across most consumer and commercial loan categories Merger integration on track and under budget with significant revenue synergies present Robust, proven internal capital generation drives continued momentum |
| Credit Appendix |
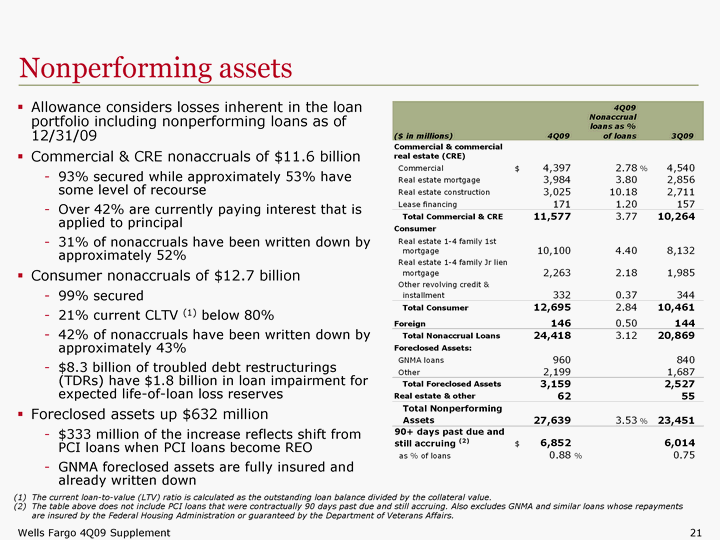
| Nonperforming assets The current loan-to-value (LTV) ratio is calculated as the outstanding loan balance divided by the collateral value. The table above does not include PCI loans that were contractually 90 days past due and still accruing. Also excludes GNMA and similar loans whose repayments are insured by the Federal Housing Administration or guaranteed by the Department of Veterans Affairs. Allowance considers losses inherent in the loan portfolio including nonperforming loans as of 12/31/09 Commercial & CRE nonaccruals of $11.6 billion 93% secured while approximately 53% have some level of recourse Over 42% are currently paying interest that is applied to principal 31% of nonaccruals have been written down by approximately 52% Consumer nonaccruals of $12.7 billion 99% secured 21% current CLTV (1) below 80% 42% of nonaccruals have been written down by approximately 43% $8.3 billion of troubled debt restructurings (TDRs) have $1.8 billion in loan impairment for expected life-of-loan loss reserves Foreclosed assets up $632 million $333 million of the increase reflects shift from PCI loans when PCI loans become REO GNMA foreclosed assets are fully insured and already written down already written down already written down already written down already written down already written down already written down already written down already written down already written down already written down already written down already written down already written down already written down already written down already written down already written down already written down already written down already written down already written down already written down already written down |
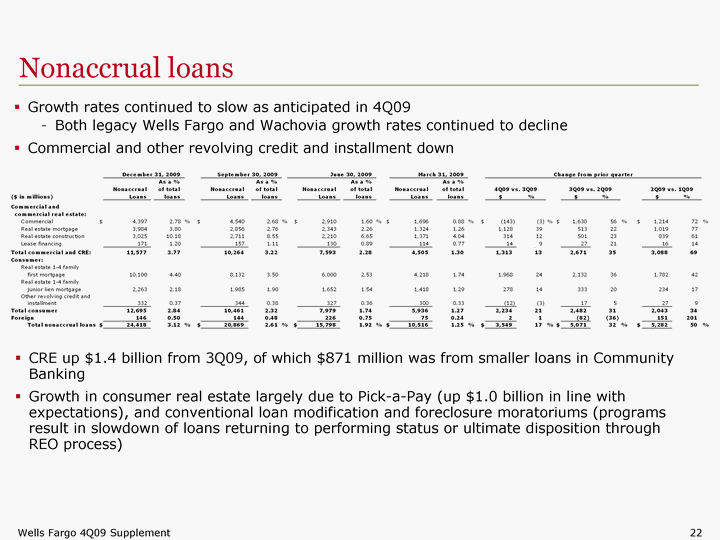
| Nonaccrual loans CRE up $1.4 billion from 3Q09, of which $871 million was from smaller loans in Community Banking Growth in consumer real estate largely due to Pick-a-Pay (up $1.0 billion in line with expectations), and conventional loan modification and foreclosure moratoriums (programs result in slowdown of loans returning to performing status or ultimate disposition through REO process) Growth rates continued to slow as anticipated in 4Q09 Both legacy Wells Fargo and Wachovia growth rates continued to decline Commercial and other revolving credit and installment down Commercial and other revolving credit and installment down Commercial and other revolving credit and installment down Commercial and other revolving credit and installment down |
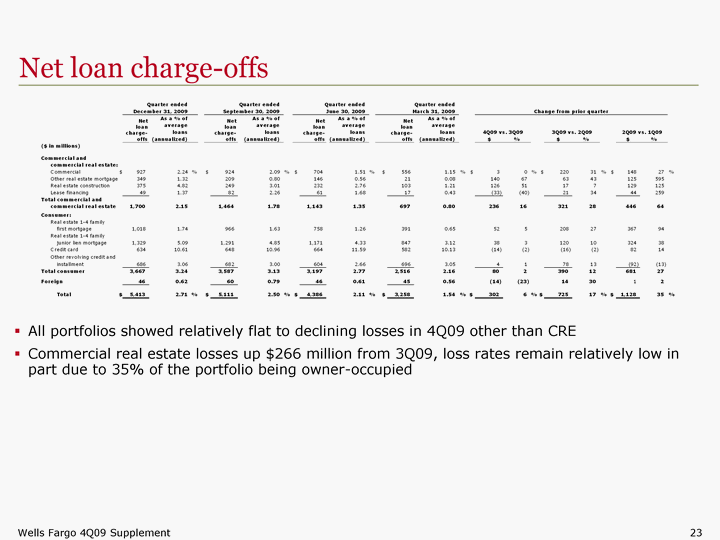
| Net loan charge-offs All portfolios showed relatively flat to declining losses in 4Q09 other than CRE Commercial real estate losses up $266 million from 3Q09, loss rates remain relatively low in part due to 35% of the portfolio being owner-occupied part due to 35% of the portfolio being owner-occupied part due to 35% of the portfolio being owner-occupied part due to 35% of the portfolio being owner-occupied |
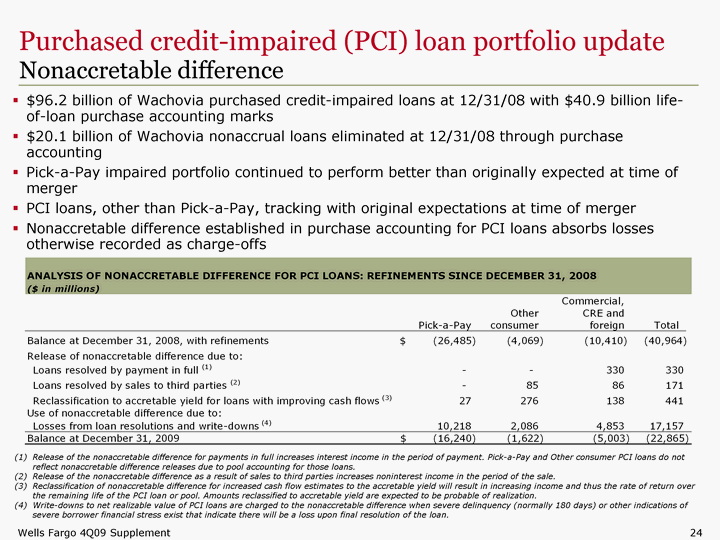
| Purchased credit-impaired (PCI) loan portfolio update Nonaccretable difference $96.2 billion of Wachovia purchased credit-impaired loans at 12/31/08 with $40.9 billion life- of-loan purchase accounting marks $20.1 billion of Wachovia nonaccrual loans eliminated at 12/31/08 through purchase accounting Pick-a-Pay impaired portfolio continued to perform better than originally expected at time of merger PCI loans, other than Pick-a-Pay, tracking with original expectations at time of merger Nonaccretable difference established in purchase accounting for PCI loans absorbs losses otherwise recorded as charge-offs otherwise recorded as charge-offs otherwise recorded as charge-offs otherwise recorded as charge-offs otherwise recorded as charge-offs otherwise recorded as charge-offs otherwise recorded as charge-offs otherwise recorded as charge-offs otherwise recorded as charge-offs otherwise recorded as charge-offs (1) Release of the nonaccretable difference for payments in full increases interest income in the period of payment. Pick-a-Pay and Other consumer PCI loans do not reflect nonaccretable difference releases due to pool accounting for those loans. (2) Release of the nonaccretable difference as a result of sales to third parties increases noninterest income in the period of the sale. (3) Reclassification of nonaccretable difference for increased cash flow estimates to the accretable yield will result in increasing income and thus the rate of return over the remaining life of the PCI loan or pool. Amounts reclassified to accretable yield are expected to be probable of realization. (4) Write-downs to net realizable value of PCI loans are charged to the nonaccretable difference when severe delinquency (normally 180 days) or other indications of severe borrower financial stress exist that indicate there will be a loss upon final resolution of the loan. |
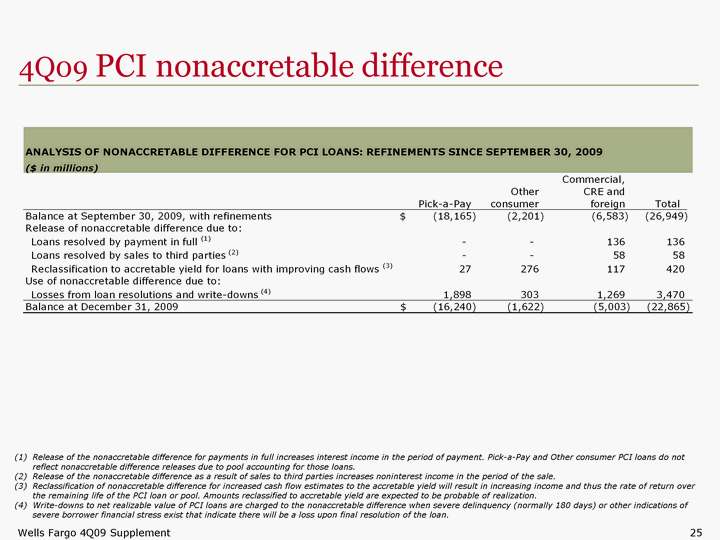
| 4Q09 PCI nonaccretable difference 4Q09 PCI nonaccretable difference 4Q09 PCI nonaccretable difference (1) Release of the nonaccretable difference for payments in full increases interest income in the period of payment. Pick-a-Pay and Other consumer PCI loans do not reflect nonaccretable difference releases due to pool accounting for those loans. (2) Release of the nonaccretable difference as a result of sales to third parties increases noninterest income in the period of the sale. (3) Reclassification of nonaccretable difference for increased cash flow estimates to the accretable yield will result in increasing income and thus the rate of return over the remaining life of the PCI loan or pool. Amounts reclassified to accretable yield are expected to be probable of realization. (4) Write-downs to net realizable value of PCI loans are charged to the nonaccretable difference when severe delinquency (normally 180 days) or other indications of severe borrower financial stress exist that indicate there will be a loss upon final resolution of the loan. |
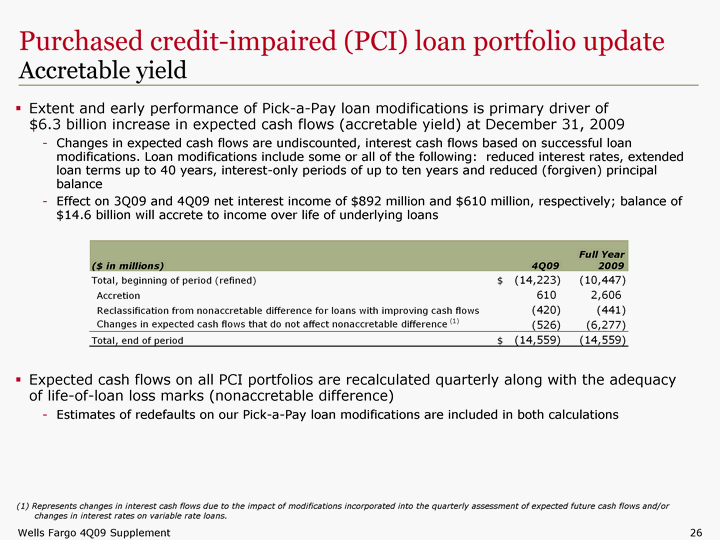
| Purchased credit-impaired (PCI) loan portfolio update Accretable yield Extent and early performance of Pick-a-Pay loan modifications is primary driver of $6.3 billion increase in expected cash flows (accretable yield) at December 31, 2009 Changes in expected cash flows are undiscounted, interest cash flows based on successful loan modifications. Loan modifications include some or all of the following: reduced interest rates, extended loan terms up to 40 years, interest-only periods of up to ten years and reduced (forgiven) principal balance Effect on 3Q09 and 4Q09 net interest income of $892 million and $610 million, respectively; balance of $14.6 billion will accrete to income over life of underlying loans Expected cash flows on all PCI portfolios are recalculated quarterly along with the adequacy of life-of-loan loss marks (nonaccretable difference) Estimates of redefaults on our Pick-a-Pay loan modifications are included in both calculations (1) Represents changes in interest cash flows due to the impact of modifications incorporated into the quarterly assessment of expected future cash flows and/or changes in interest rates on variable rate loans. changes in interest rates on variable rate loans. changes in interest rates on variable rate loans. |
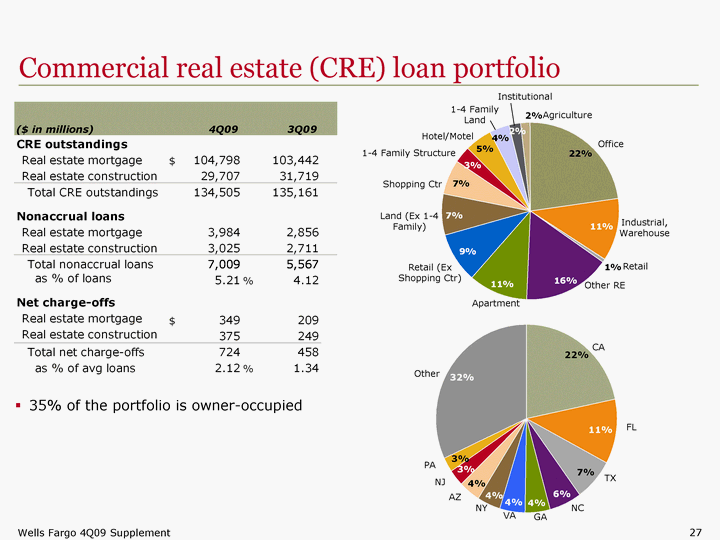
| Commercial real estate (CRE) loan portfolio Office Industrial, Warehouse Other RE Apartment Retail (Ex Shopping Ctr) Land (Ex 1-4 Family) Shopping Ctr 1-4 Family Structure Hotel/Motel 1-4 Family Land Institutional Agriculture CA FL TX NC GA NY VA AZ NJ PA Other 35% of the portfolio is owner-occupied Retail 27 27 |
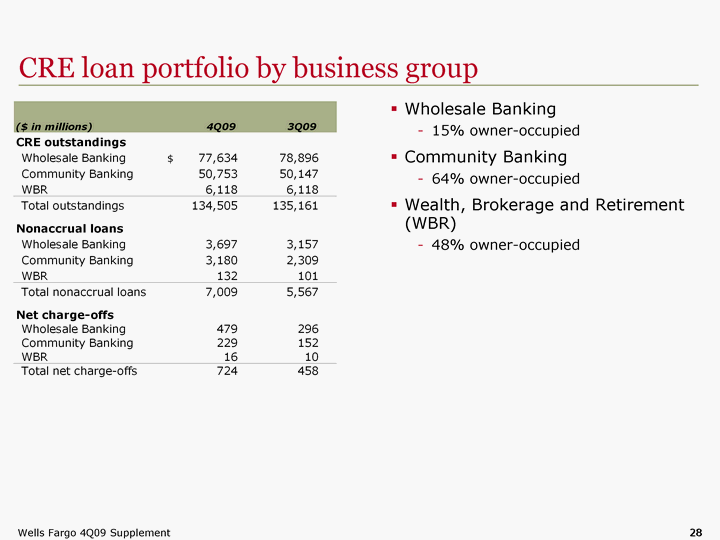
| CRE loan portfolio by business group CRE loan portfolio by business group Wholesale Banking 15% owner-occupied Community Banking 64% owner-occupied Wealth, Brokerage and Retirement (WBR) 48% owner-occupied 28 |
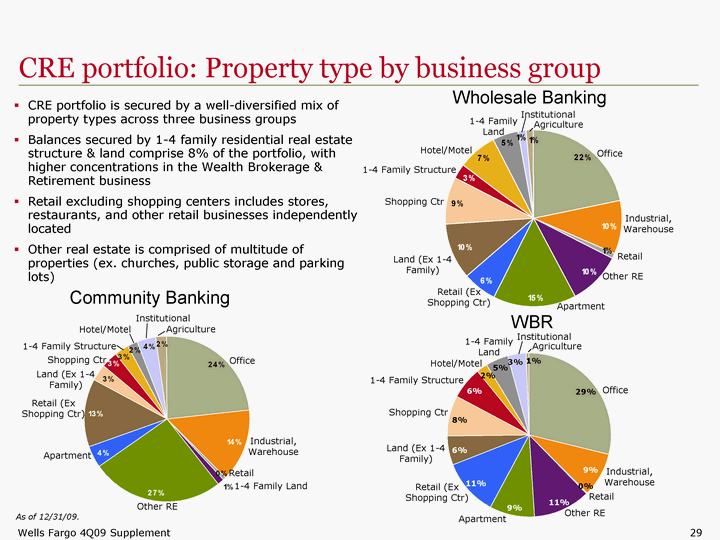
| Wholesale Banking Community Banking WBR CRE portfolio: Property type by business group Office Industrial, Warehouse Other RE Apartment Retail (Ex Shopping Ctr) Land (Ex 1-4 Family) Shopping Ctr 1-4 Family Structure Hotel/Motel 1-4 Family Land Institutional Agriculture Office Industrial, Warehouse Other RE Apartment Retail (Ex Shopping Ctr) Land (Ex 1-4 Family) Shopping Ctr 1-4 Family Structure Hotel/Motel 1-4 Family Land Institutional Agriculture Office Industrial, Warehouse Other RE Apartment Retail (Ex Shopping Ctr) Land (Ex 1-4 Family) Shopping Ctr 1-4 Family Structure Hotel/Motel 1-4 Family Land Institutional Agriculture CRE portfolio is secured by a well-diversified mix of property types across three business groups Balances secured by 1-4 family residential real estate structure & land comprise 8% of the portfolio, with higher concentrations in the Wealth Brokerage & Retirement business Retail excluding shopping centers includes stores, restaurants, and other retail businesses independently located Other real estate is comprised of multitude of properties (ex. churches, public storage and parking lots) Retail Retail Retail As of 12/31/09. |
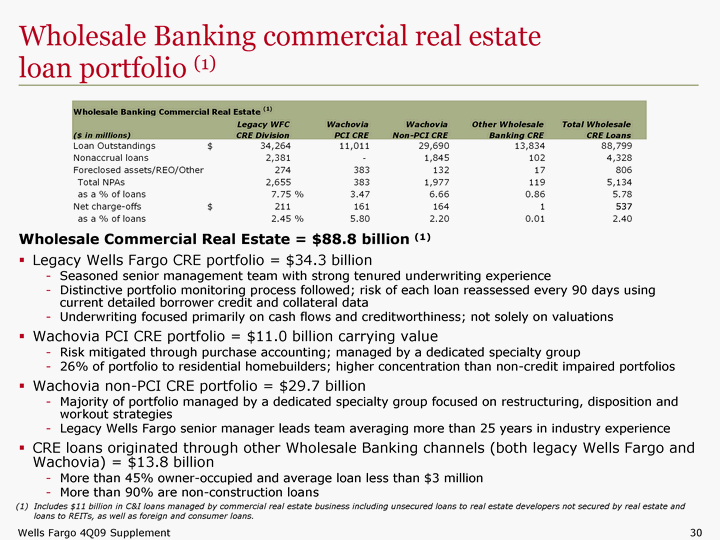
| Wholesale Banking commercial real estate loan portfolio (1) Wholesale Commercial Real Estate = $88.8 billion (1) Legacy Wells Fargo CRE portfolio = $34.3 billion Seasoned senior management team with strong tenured underwriting experience Distinctive portfolio monitoring process followed; risk of each loan reassessed every 90 days using current detailed borrower credit and collateral data Underwriting focused primarily on cash flows and creditworthiness; not solely on valuations Wachovia PCI CRE portfolio = $11.0 billion carrying value Risk mitigated through purchase accounting; managed by a dedicated specialty group 26% of portfolio to residential homebuilders; higher concentration than non-credit impaired portfolios Wachovia non-PCI CRE portfolio = $29.7 billion Majority of portfolio managed by a dedicated specialty group focused on restructuring, disposition and workout strategies Legacy Wells Fargo senior manager leads team averaging more than 25 years in industry experience CRE loans originated through other Wholesale Banking channels (both legacy Wells Fargo and Wachovia) = $13.8 billion More than 45% owner-occupied and average loan less than $3 million More than 90% are non-construction loans Includes $11 billion in C&I loans managed by commercial real estate business including unsecured loans to real estate developers not secured by real estate and loans to REITs, as well as foreign and consumer loans. loans to REITs, as well as foreign and consumer loans. loans to REITs, as well as foreign and consumer loans. |
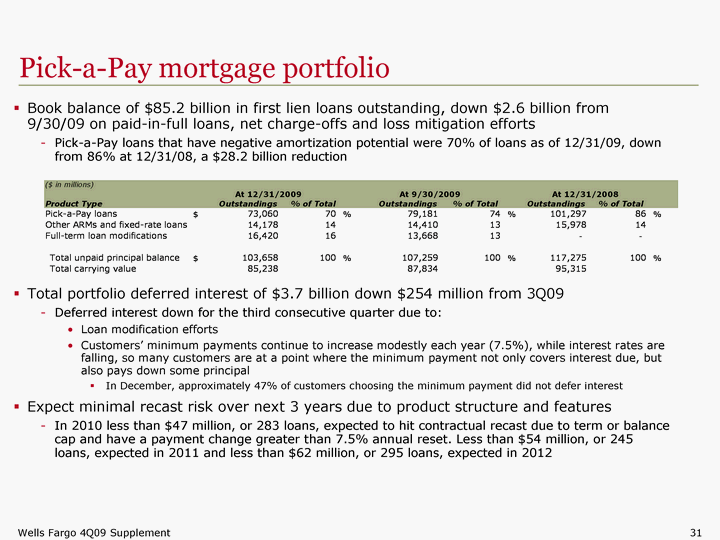
| Pick-a-Pay mortgage portfolio Book balance of $85.2 billion in first lien loans outstanding, down $2.6 billion from 9/30/09 on paid-in-full loans, net charge-offs and loss mitigation efforts Pick-a-Pay loans that have negative amortization potential were 70% of loans as of 12/31/09, down from 86% at 12/31/08, a $28.2 billion reduction Total portfolio deferred interest of $3.7 billion down $254 million from 3Q09 Deferred interest down for the third consecutive quarter due to: Loan modification efforts Customers' minimum payments continue to increase modestly each year (7.5%), while interest rates are falling, so many customers are at a point where the minimum payment not only covers interest due, but also pays down some principal In December, approximately 47% of customers choosing the minimum payment did not defer interest Expect minimal recast risk over next 3 years due to product structure and features In 2010 less than $47 million, or 283 loans, expected to hit contractual recast due to term or balance cap and have a payment change greater than 7.5% annual reset. Less than $54 million, or 245 loans, expected in 2011 and less than $62 million, or 295 loans, expected in 2012 loans, expected in 2011 and less than $62 million, or 295 loans, expected in 2012 loans, expected in 2011 and less than $62 million, or 295 loans, expected in 2012 loans, expected in 2011 and less than $62 million, or 295 loans, expected in 2012 loans, expected in 2011 and less than $62 million, or 295 loans, expected in 2012 loans, expected in 2011 and less than $62 million, or 295 loans, expected in 2012 loans, expected in 2011 and less than $62 million, or 295 loans, expected in 2012 loans, expected in 2011 and less than $62 million, or 295 loans, expected in 2012 loans, expected in 2011 and less than $62 million, or 295 loans, expected in 2012 loans, expected in 2011 and less than $62 million, or 295 loans, expected in 2012 loans, expected in 2011 and less than $62 million, or 295 loans, expected in 2012 loans, expected in 2011 and less than $62 million, or 295 loans, expected in 2012 loans, expected in 2011 and less than $62 million, or 295 loans, expected in 2012 loans, expected in 2011 and less than $62 million, or 295 loans, expected in 2012 loans, expected in 2011 and less than $62 million, or 295 loans, expected in 2012 loans, expected in 2011 and less than $62 million, or 295 loans, expected in 2012 loans, expected in 2011 and less than $62 million, or 295 loans, expected in 2012 loans, expected in 2011 and less than $62 million, or 295 loans, expected in 2012 loans, expected in 2011 and less than $62 million, or 295 loans, expected in 2012 loans, expected in 2011 and less than $62 million, or 295 loans, expected in 2012 loans, expected in 2011 and less than $62 million, or 295 loans, expected in 2012 |
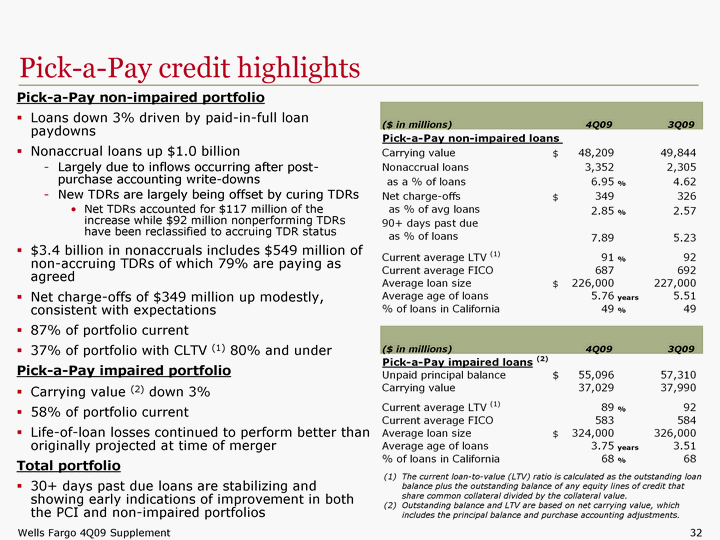
| Pick-a-Pay credit highlights Pick-a-Pay non-impaired portfolio Loans down 3% driven by paid-in-full loan paydowns Nonaccrual loans up $1.0 billion Largely due to inflows occurring after post- purchase accounting write-downs New TDRs are largely being offset by curing TDRs Net TDRs accounted for $117 million of the increase while $92 million nonperforming TDRs have been reclassified to accruing TDR status $3.4 billion in nonaccruals includes $549 million of non-accruing TDRs of which 79% are paying as agreed Net charge-offs of $349 million up modestly, consistent with expectations 87% of portfolio current 37% of portfolio with CLTV (1) 80% and under Pick-a-Pay impaired portfolio Carrying value (2) down 3% 58% of portfolio current Life-of-loan losses continued to perform better than originally projected at time of merger Total portfolio 30+ days past due loans are stabilizing and showing early indications of improvement in both the PCI and non-impaired portfolios The current loan-to-value (LTV) ratio is calculated as the outstanding loan balance plus the outstanding balance of any equity lines of credit that share common collateral divided by the collateral value. Outstanding balance and LTV are based on net carrying value, which includes the principal balance and purchase accounting adjustments. includes the principal balance and purchase accounting adjustments. includes the principal balance and purchase accounting adjustments. includes the principal balance and purchase accounting adjustments. includes the principal balance and purchase accounting adjustments. includes the principal balance and purchase accounting adjustments. |
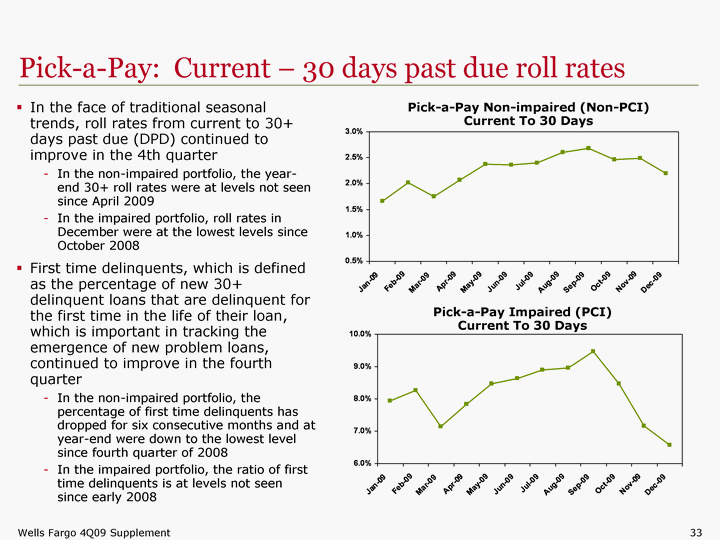
| Pick-a-Pay Non-impaired (Non-PCI) Current To 30 Days 4/7/2007 5/7/2007 6/7/2007 7/7/2007 8/7/2007 9/7/2007 10/7/2007 11/7/2007 12/7/2007 1/8/2008 2/8/2008 3/8/2008 4/8/2008 5/8/2008 6/8/2008 7/8/2008 8/8/2008 9/8/2008 1/1/2009 2/1/2009 3/1/2009 4/1/2009 5/1/2009 6/1/2009 7/1/2009 8/1/2009 9/1/2009 10/1/2009 11/1/2009 12/1/2009 1 0.01 0.0101 0.0117 0.0124 0.0129 0.016 0.0155 0.018 0.0176 0.0192 0.0192 0.0179 0.0204 0.0189 0.0211 0.0243 0.027 0.027 0.0166 0.0202 0.0175 0.0207 0.0238 0.0236 0.024 0.026 0.0268 0.0247 0.0249 0.022 Pick-a-Pay: Current - 30 days past due roll rates 4/7/2007 5/7/2007 6/7/2007 7/7/2007 8/7/2007 9/7/2007 10/7/2007 11/7/2007 12/7/2007 1/8/2008 2/8/2008 3/8/2008 4/8/2008 5/8/2008 6/8/2008 7/8/2008 8/8/2008 9/8/2008 1/1/2009 2/1/2009 3/1/2009 4/1/2009 5/1/2009 6/1/2009 7/1/2009 8/1/2009 9/1/2009 10/1/2009 11/1/2009 12/1/2009 1 0.01 0.0101 0.0117 0.0124 0.0129 0.016 0.0155 0.018 0.0176 0.0192 0.0192 0.0179 0.0204 0.0189 0.0211 0.0243 0.027 0.027 0.0793 0.0827 0.0714 0.0783 0.0847 0.0863 0.089 0.0895 0.0946 0.0847 0.0716 0.0657 Pick-a-Pay Impaired (PCI) Current To 30 Days In the face of traditional seasonal trends, roll rates from current to 30+ days past due (DPD) continued to improve in the 4th quarter In the non-impaired portfolio, the year- end 30+ roll rates were at levels not seen since April 2009 In the impaired portfolio, roll rates in December were at the lowest levels since October 2008 First time delinquents, which is defined as the percentage of new 30+ delinquent loans that are delinquent for the first time in the life of their loan, which is important in tracking the emergence of new problem loans, continued to improve in the fourth quarter In the non-impaired portfolio, the percentage of first time delinquents has dropped for six consecutive months and at year-end were down to the lowest level since fourth quarter of 2008 In the impaired portfolio, the ratio of first time delinquents is at levels not seen since early 2008 |
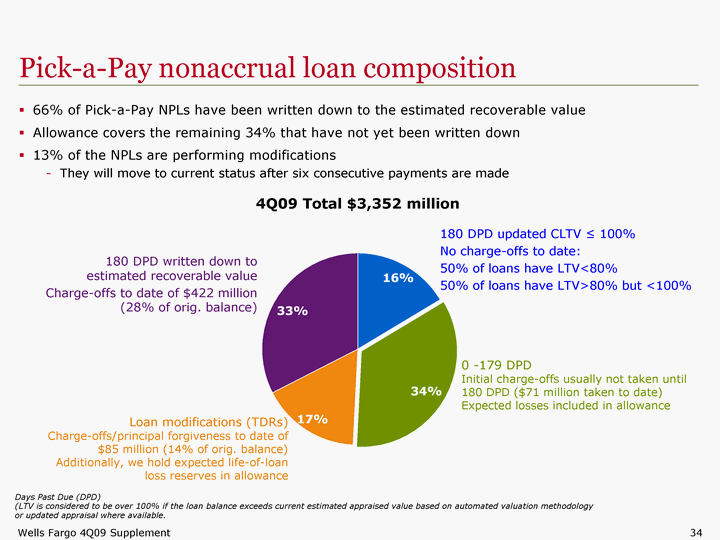
| 66% of Pick-a-Pay NPLs have been written down to the estimated recoverable value Allowance covers the remaining 34% that have not yet been written down 13% of the NPLs are performing modifications They will move to current status after six consecutive payments are made 34 Pick-a-Pay nonaccrual loan composition Days Past Due (DPD) (LTV is considered to be over 100% if the loan balance exceeds current estimated appraised value based on automated valuation methodology or updated appraisal where available. 4Q09 Total $3,352 million 180 DPD written down to estimated recoverable value Charge-offs to date of $422 million (28% of orig. balance) 180 DPD updated CLTV ^ 100% No charge-offs to date: 50% of loans have LTV<80% 50% of loans have LTV>80% but <100% 0 -179 DPD Initial charge-offs usually not taken until 180 DPD ($71 million taken to date) Expected losses included in allowance Loan modifications (TDRs) Charge-offs/principal forgiveness to date of $85 million (14% of orig. balance) Additionally, we hold expected life-of-loan loss reserves in allowance TDRs Current 90-179 Days LTV < 100% LTV > 100% 549 1164 560 1099 |
| Pick-a-Pay loan modifications 4Q09 full-term MAP modifications of over 9,000; over 52,600 in 2009 89% of modifications have been in the PCI portfolio 31% of PCI portfolio has been modified in 2009, up from 22% as of September 30, 2009 Nearly 70,000 modification offers proactively sent to customers by the end of 2009 We have attempted to contact over 95% of customers 90+ days delinquent or in foreclosure Modifications reduced payments for 97% of customers, compared to industry average 80% (1) Modifications have reduced average payments by 25% from the customer's minimum payment option, as we strive to give customers an affordable, sustainable payment. Reductions achieved through: Interest rate reductions Interest rates reduced on average by more than 200 bps on modified loans Payments are generally interest-only initially and migrate to fully amortizing over time, usually 5-7 years Term extensions Principal forgiveness Over $2.6 billion of principal forgiven year-to-date Modifications are re-underwritten, income is documented and negative amortization feature is eliminated Redefault experience has been lower than expected though it remains early Redefault rates of the most seasoned modifications that we have in the program are approximately half the 25- 30% redefault rate of industry option ARM modifications with equal aging (1); outperformance reflects payment reductions and principal forgiveness 4Q09 HAMP rollout Rolled out in late October to Pick-a-Pay customers Over 40,000 Pick-a-Pay customers have called our service center to inquire about HAMP Source: OCC and OTS Mortgage Metrics Report, Third Quarter 2009. |
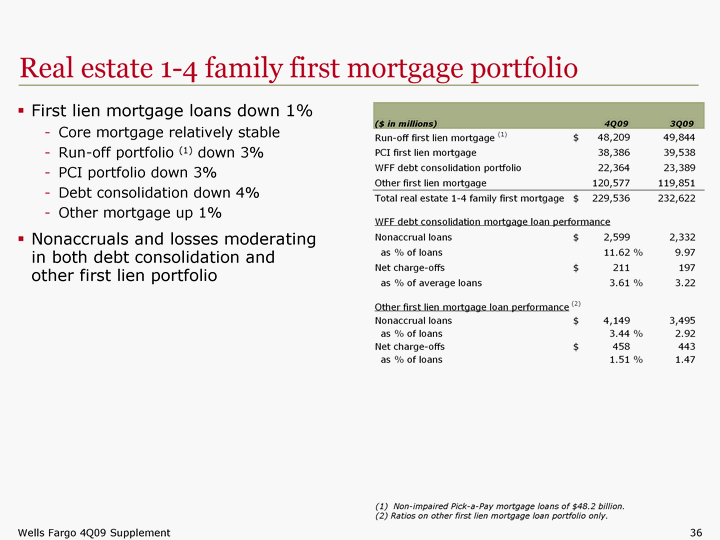
| Real estate 1-4 family first mortgage portfolio First lien mortgage loans down 1% Core mortgage relatively stable Run-off portfolio (1) down 3% PCI portfolio down 3% Debt consolidation down 4% Other mortgage up 1% Nonaccruals and losses moderating in both debt consolidation and other first lien portfolio (1) Non-impaired Pick-a-Pay mortgage loans of $48.2 billion. (2) Ratios on other first lien mortgage loan portfolio only. (2) Ratios on other first lien mortgage loan portfolio only. (2) Ratios on other first lien mortgage loan portfolio only. |
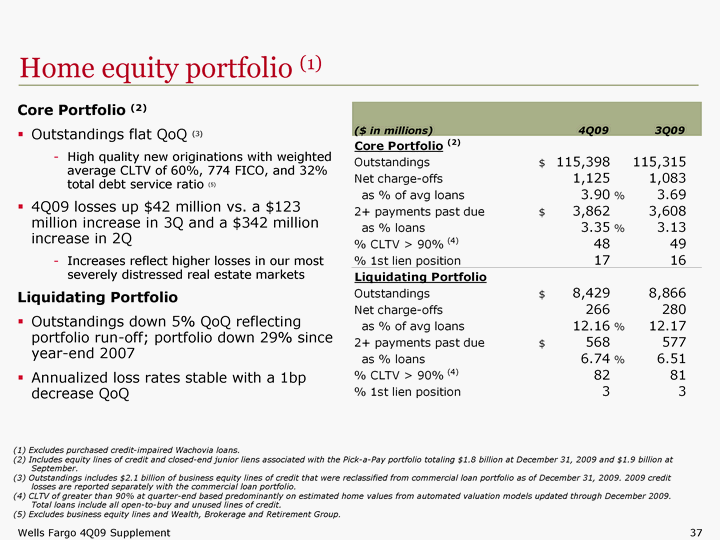
| Home equity portfolio (1) Core Portfolio (2) Outstandings flat QoQ (3) High quality new originations with weighted average CLTV of 60%, 774 FICO, and 32% total debt service ratio (5) 4Q09 losses beginning to stabilize, up a modest $42 million Liquidating Portfolio Outstandings down 5% QoQ reflecting portfolio run-off; portfolio down 29% since year-end 2007 Annualized loss rates stable with a 1bp decrease QoQ Excludes purchased credit-impaired Wachovia loans. (2) Includes equity lines of credit and closed-end junior liens associated with the Pick-a-Pay portfolio totaling $1.8 billion at December 31, 2009 and $1.9 billion at September. (3) Outstandings includes $2.1 billion of business equity lines of credit that were reclassified from commercial loan portfolio as of December 31, 2009. 2009 credit losses are reported separately with the commercial loan portfolio. (4) CLTV of greater than 90% at quarter-end based predominantly on estimated home values from automated valuation models updated through December 2009. Total loans include all open-to-buy and unused lines of credit. (5) Excludes business equity lines and Wealth, Brokerage and Retirement Group. |
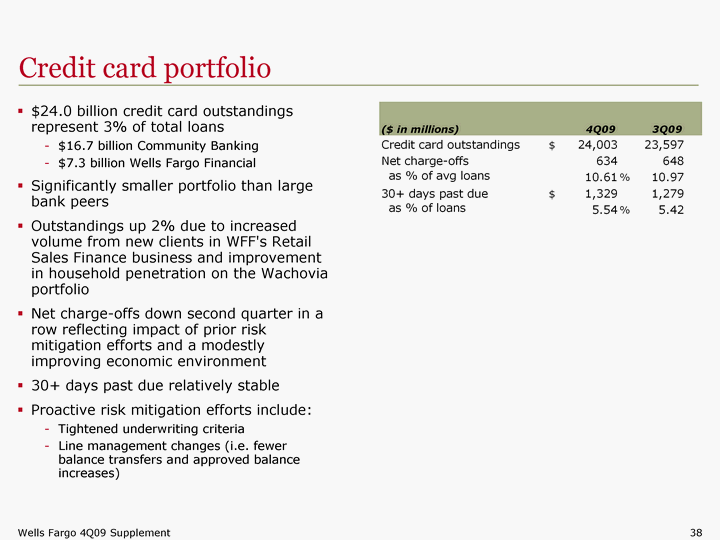
| Credit card portfolio $24.0 billion credit card outstandings represent 3% of total loans $16.7 billion Community Banking $7.3 billion Wells Fargo Financial Significantly smaller portfolio than large bank peers Outstandings up 2% due to increased volume from new clients in WFF's Retail Sales Finance business and improvement in household penetration on the Wachovia portfolio Net charge-offs down second quarter in a row reflecting impact of prior risk mitigation efforts and a modestly improving economic environment 30+ days past due relatively stable Proactive risk mitigation efforts include: Tightened underwriting criteria Line management changes (i.e. fewer balance transfers and approved balance increases) increases) increases) increases) increases) increases) increases) increases) increases) increases) increases) increases) increases) increases) increases) increases) increases) increases) increases) increases) increases) increases) |
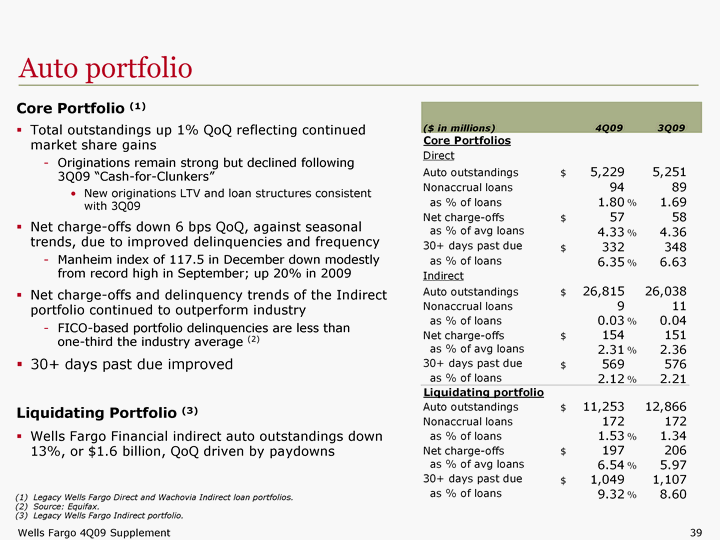
| Auto portfolio Core Portfolio (1) Total outstandings up 1% QoQ reflecting continued market share gains Originations remain strong but declined following 3Q09 "Cash-for-Clunkers" New originations LTV and loan structures consistent with 3Q09 Net charge-offs down 6 bps QoQ, against seasonal trends, due to improved delinquencies and frequency Manheim index of 117.5 in December down modestly from record high in September; up 20% in 2009 Net charge-offs and delinquency trends of the Indirect portfolio continued to outperform industry FICO-based portfolio delinquencies are less than one-third the industry average (2) 30+ days past due improved Liquidating Portfolio (3) Wells Fargo Financial indirect auto outstandings down 13%, or $1.6 billion, QoQ driven by paydowns Legacy Wells Fargo Direct and Wachovia Indirect loan portfolios. Source: Equifax. Legacy Wells Fargo Indirect portfolio. Legacy Wells Fargo Indirect portfolio. Legacy Wells Fargo Indirect portfolio. Legacy Wells Fargo Indirect portfolio. |
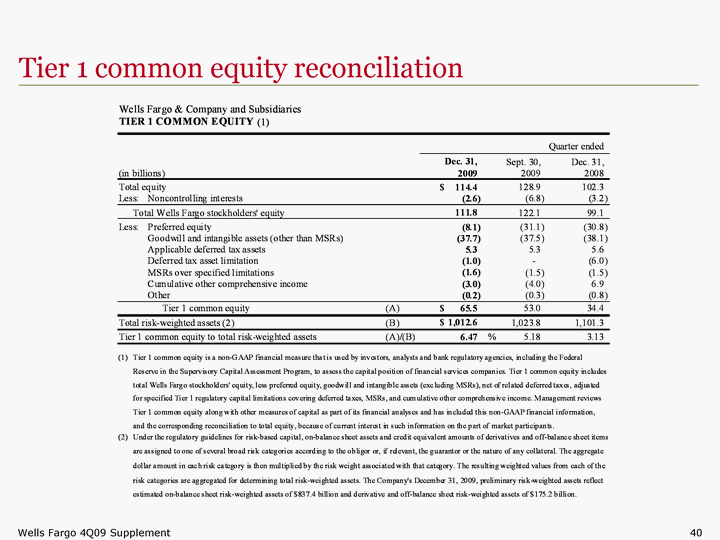
| Tier 1 common equity reconciliation Tier 1 common equity reconciliation |
