Attached files
| file | filename |
|---|---|
| 8-K - STATE STREET CORPORATION 8-K - STATE STREET CORP | a6147497.htm |
| EX-99.1 - EXHIBIT 99.1 - STATE STREET CORP | a6147497ex991.htm |
Exhibit 99.2
Investment Portfolio and Selected Capital Data As of December 31, 2009 January 20, 2010
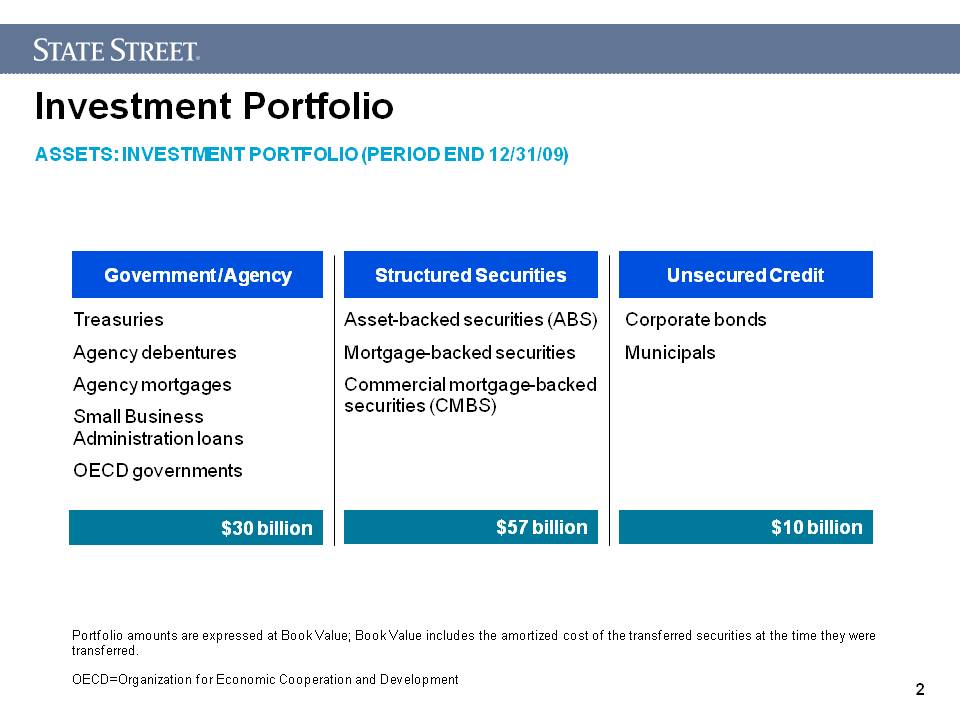
Asset-backed securities (ABS)Mortgage-backed securitiesCommercial mortgage-backed securities (CMBS) $25 billion $57 billion $10 billion Corporate bondsMunicipals TreasuriesAgency debenturesAgency mortgagesSmall Business Administration loansOECD governments Investment Portfolio Government / Agency Structured Securities Unsecured Credit Portfolio amounts are expressed at Book Value; Book Value includes the amortized cost of the transferred securities at the time they were transferred.OECD=Organization for Economic Cooperation and Development ASSETS: INVESTMENT PORTFOLIO (PERIOD END 12/31/09) $30 billio nUS$ in billions AAA AA A BBB <BBB NR Total 12/31/04(2) $35.2 $0.7 $1.2 $0.1 - $0.5 $37.7 93.4% 1.9% 3.3% 0.3% - 1.1% 100.0% 12/31/07 $67.0 $4.9 $2.2 $0.8 - $0.8 $75.7 88.5% 6.5% 2.9% 1.1% - 1.0% 100.0% 12/31/08 $61.6 $8.8 $3.9 $2.9 $0.8 $0.8 $78.8 78.2% 11.1% 4.9% 3.7% 1.1% 1.0% 100.0% 12/31/09 $66.8 $11.3 $6.8 $3.5 $7.5 $1.4 $97.3 68.6% 11.6% 7.0% 3.6% 7.8% 1.4% 100.0%
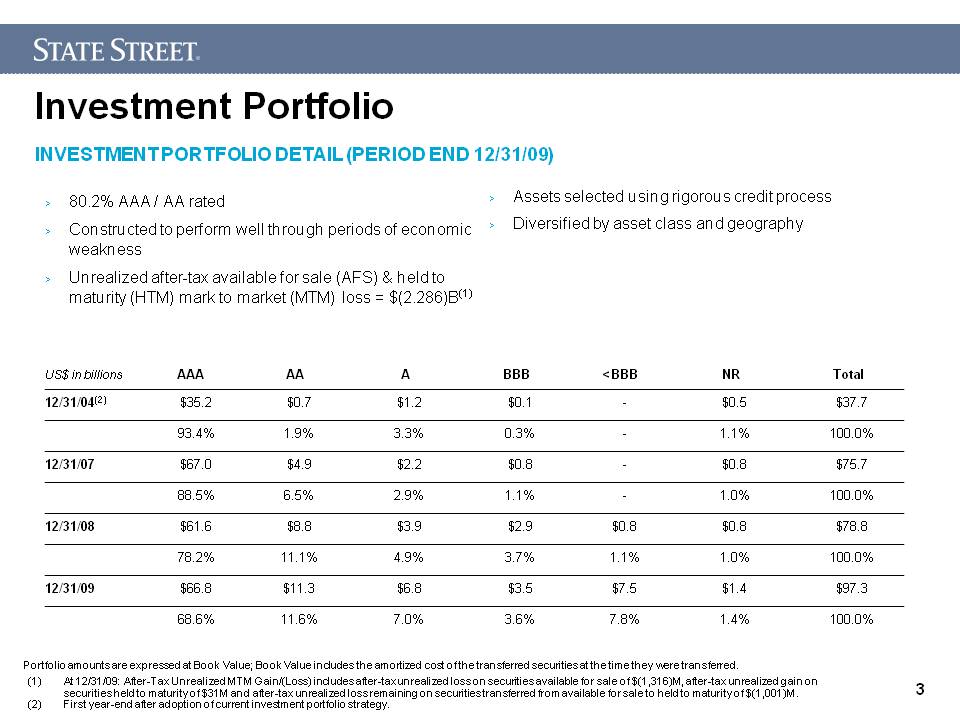
Assets selected using rigorous credit processDiversified by asset class and geography 80.2% AAA / AA ratedConstructed to perform well through periods of economic weaknessUnrealized after-tax available for sale (AFS) & held to maturity (HTM) mark to market (MTM) loss = $(2.286)B(1) INVESTMENT PORTFOLIO DETAIL (PERIOD END 12/31/09) Investment Portfolio Portfolio amounts are expressed at Book Value; Book Value includes the amortized cost of the transferred securities at the time they were transferred. (1) At 12/31/09: After-Tax Unrealized MTM Gain/(Loss) includes after-tax unrealized loss on securities available for sale of $(1,316)M, after-tax unrealized gain on securities held to maturity of $31M and after-tax unrealized loss remaining on securities transferred from available for sale to held to maturity of $(1,001)M.(2) First year-end after adoption of current investment portfolio strategy.US$ in billions AAA AA A BBB <BBB NR Total 12/31/04(2) $35.2 $0.7 $1.2 $0.1 - $0.5 $37.7 93.4% 1.9% 3.3% 0.3% - 1.1% 100.0% 12/31/07 $67.0 $4.9 $2.2 $0.8 - $0.8 $75.7 88.5% 6.5% 2.9% 1.1% - 1.0% 100.0% 12/31/08 $61.6 $8.8 $3.9 $2.9 $0.8 $0.8 $78.8 78.2% 11.1% 4.9% 3.7% 1.1% 1.0% 100.0% 12/31/09 $66.8 $11.3 $6.8 $3.5 $7.5 $1.4 $97.3 68.6% 11.6% 7.0% 3.6% 7.8% 1.4% 100.0%
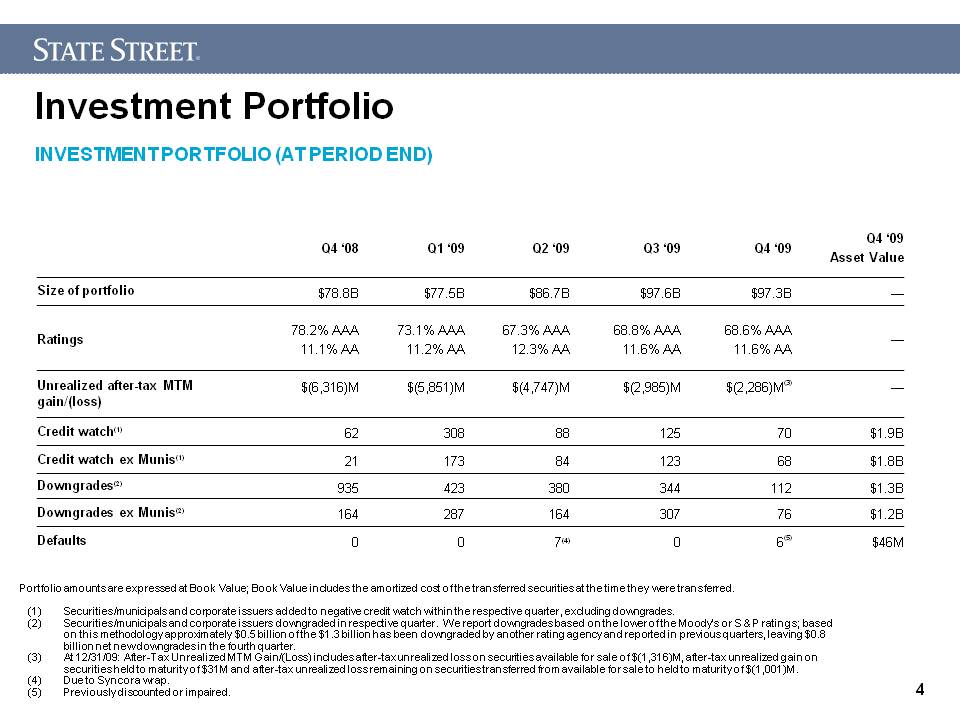
Investment Portfolio (1) Securities/municipals and corporate issuers added to negative credit watch within the respective quarter, excluding downgrades. (2) Securities/municipals and corporate issuers downgraded in respective quarter. We report downgrades based on the lower of the Moody’s or S & P ratings; based on this methodology approximately $0.5 billion of the $1.3 billion has been downgraded by another rating agency and reported in previous quarters, leaving $0.8 billion net new downgrades in the fourth quarter. At 12/31/09: After-Tax Unrealized MTM Gain/(Loss) includes after-tax unrealized loss on securities available for sale of $(1,316)M, after-tax unrealized gain on securities held to maturity of $31M and after-tax unrealized loss remaining on securities transferred from available for sale to held to maturity of $(1,001)M. Due to Syncora wrap. Previously discounted or impaired. INVESTMENT PORTFOLIO (AT PERIOD END) Portfolio amounts are expressed at Book Value; Book Value includes the amortized cost of the transferred securities at the time they were transferred.Q4 ‘08 Q1 ‘09 Q2 ‘09 Q3 ‘09 Q4 ‘09 Q4 ‘09 Asset Value Size of portfolio $78.8B $77.5B $86.7B $97.6B $97.3B — Ratings 78.2% AAA 11.1% AA 73.1% AAA 11.2% AA 67.3% AAA 12.3% AA 68.8% AAA 11.6% AA 68.6% AAA 11.6% AA — Unrealized after-tax MTM gain/(loss) $(6,316)M $(5,851)M $(4,747)M $(2,985)M $(2,286)M(3) — Credit watch(1) 62 308 88 125 70 $1.9B Credit watch ex Munis(1) 21 173 84 123 68 $1.8B Downgrades(2) 935 423 380 344 112 $1.3B Downgrades ex Munis(2) 164 287 164 307 76 $1.2B Defaults 0 0 7(4) 0 6(5) $46M
I
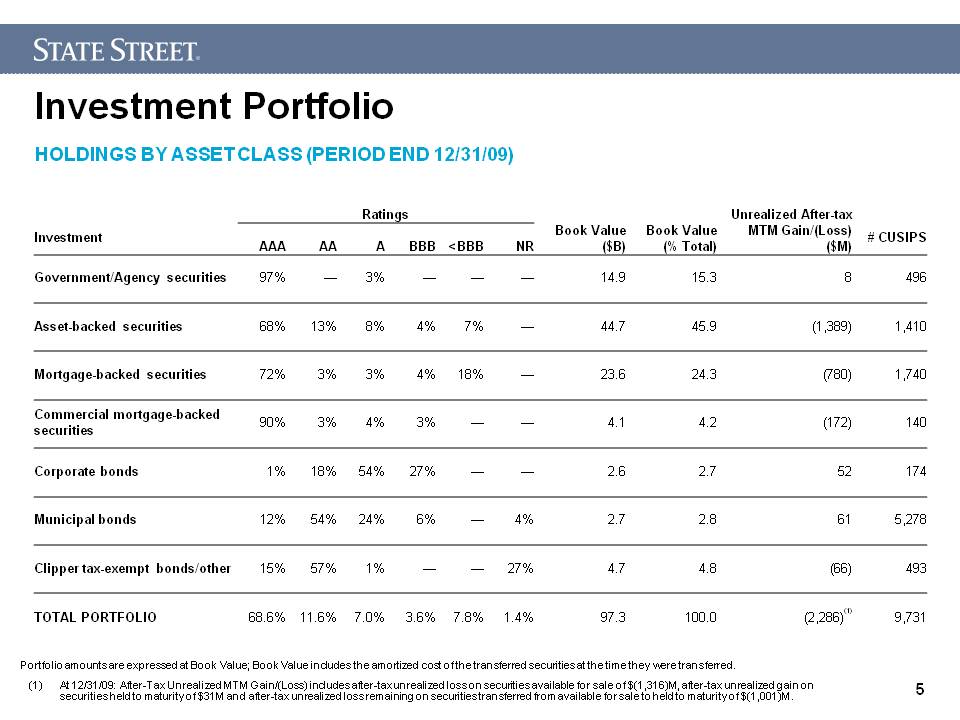
Investment Portfolio HOLDINGS BY ASSET CLASS (PERIOD END 12/31/09) Portfolio amounts are expressed at Book Value; Book Value includes the amortized cost of the transferred securities at the time they were transferred. (1) At 12/31/09: After-Tax Unrealized MTM Gain/(Loss) includes after-tax unrealized loss on securities available for sale of $(1,316)M, after-tax unrealized gain on securities held to maturity of $31M and after-tax unrealized loss remaining on securities transferred from available for sale to held to maturity of $(1,001)M. Ratings Book Value ($B) Book Value (% Total) Unrealized After-tax MTM Gain/(Loss) ($M) Investment AAA AA A BBB <BBB NR # CUSIPS Government/Agency securities 97% — 3% — — — 14.9 15.3 8 496 Asset-backed securities 68% 13% 8% 4% 7% — 44.7 45.9 (1,389) 1,410 Mortgage-backed securities 72% 3% 3% 4% 18% — 23.6 24.3 (780) 1,740 Commercial mortgage-backed securities 90% 3% 4% 3% — — 4.1 4.2 (172) 140 Corporate bonds 1% 18% 54% 27% — — 2.6 2.7 52 174 Municipal bonds 12% 54% 24% 6% — 4% 2.7 2.8 61 5,278 Clipper tax-exempt bonds/other 15% 57% 1% — — 27% 4.7 4.8 (66) 493 TOTAL PORTFOLIO 68.6% 11.6% 7.0% 3.6% 7.8% 1.4% 97.3 100.0 (2,286)(1) 9,731
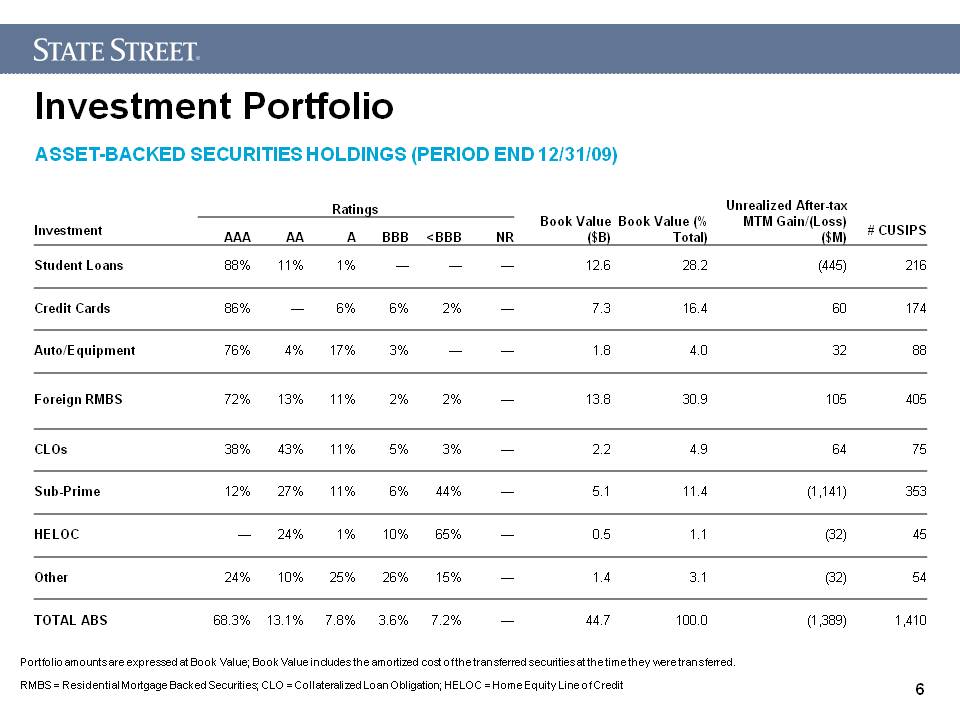
Investment Portfolio ASSET-BACKED SECURITIES HOLDINGS (PERIOD END 12/31/09) Portfolio amounts are expressed at Book Value; Book Value includes the amortized cost of the transferred securities at the time they were transferred. RMBS = Residential Mortgage Backed Securities; CLO = Collateralized Loan Obligation; HELOC = Home Equity Line of Credit Ratings Book Value ($B) Book Value (% Total) Unrealized After-tax MTM Gain/(Loss) ($M) Investment AAA AA A BBB <BBB NR # CUSIPS Student Loans 88% 11% 1% — — — 12.6 28.2 (445) 216 Credit Cards 86% — 6% 6% 2% — 7.3 16.4 60 174 Auto/Equipment 76% 4% 17% 3% — — 1.8 4.0 32 88 Foreign RMBS 72% 13% 11% 2% 2% — 13.8 30.9 105 405 CLOs 38% 43% 11% 5% 3% — 2.2 4.9 64 75 Sub-Prime 12% 27% 11% 6% 44% — 5.1 11.4 (1,141) 353 HELOC — 24% 1% 10% 65% — 0.5 1.1 (32) 45 Other 24% 10% 25% 26% 15% — 1.4 3.1 (32) 54 TOTAL ABS 68.3% 13.1% 7.8% 3.6% 7.2% — 44.7 100.0 (1,389) 1,410
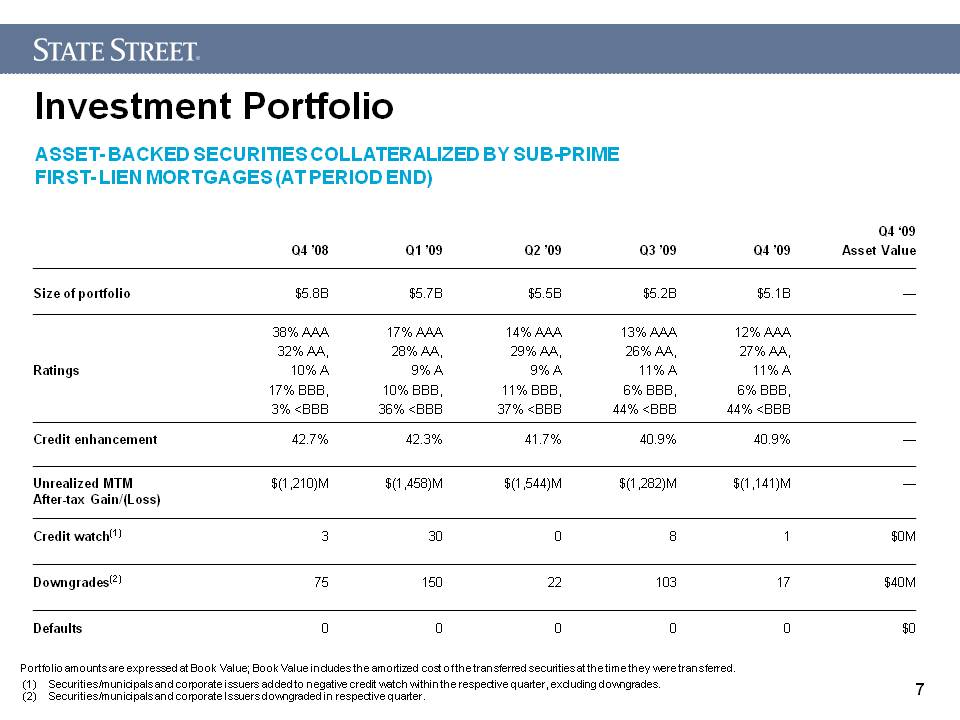
Investment Portfolio ASSET- BACKED SECURITIES COLLATERALIZED BY SUB-PRIME FIRST- LIEN MORTGAGES (AT PERIOD END) (1) Securities/municipals and corporate issuers added to negative credit watch within the respective quarter, excluding downgrades.(2) Securities/municipals and corporate Issuers downgraded in respective quarter. Portfolio amounts are expressed at Book Value; Book Value includes the amortized cost of the transferred securities at the time they were transferred. Q4 ’08 Q1 ’09 Q2 ’09 Q3 ’09 Q4 ’09 Q4 ‘09 Asset Value Size of portfolio $5.8B $5.7B $5.5B $5.2B $5.1B — Ratings 38% AAA 32% AA, 10% A 17% BBB, 3% <BBB 17% AAA 28% AA, 9% A 10% BBB, 36% <BBB 14% AAA 29% AA, 9% A 11% BBB, 37% <BBB 13% AAA 26% AA, 11% A 6% BBB, 44% <BBB 12% AAA 27% AA, 11% A 6% BBB, 44% <BBB Credit enhancement 42.7% 42.3% 41.7% 40.9% 40.9% — Unrealized MTM After-tax Gain/(Loss) $(1,210)M $(1,458)M $(1,544)M $(1,282)M $(1,141)M — Credit watch(1) 3 30 0 8 1 $0M Downgrades(2) 75 150 22 103 17 $40M Defaults 0 0 0 0 0 $0
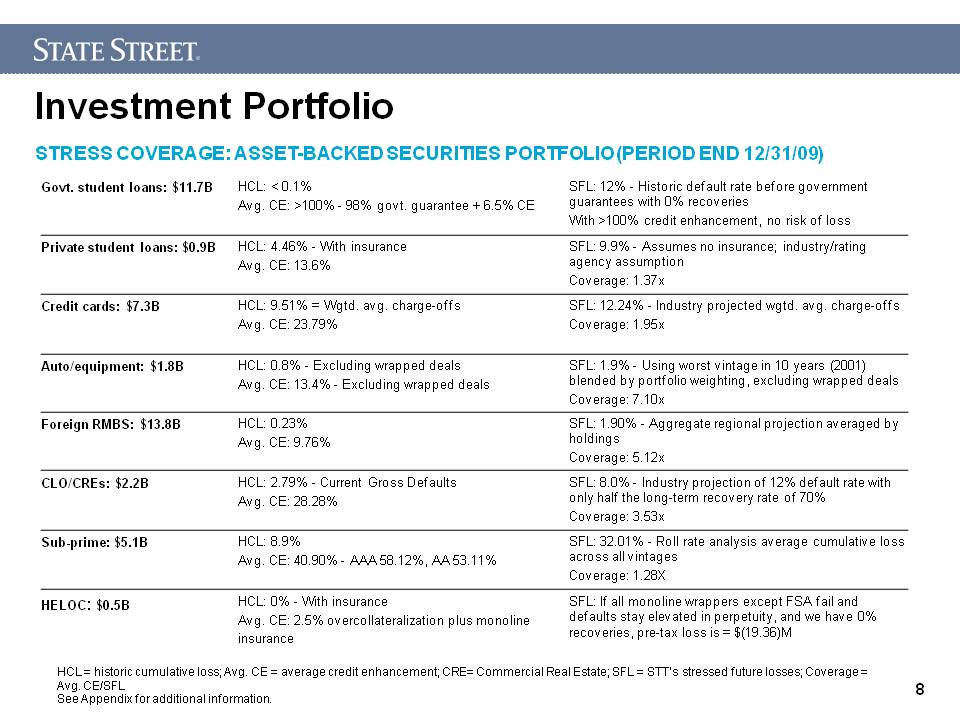
Investment Portfolio HCL = historic cumulative loss; Avg. CE = average credit enhancement; CRE= Commercial Real Estate; SFL = STT’s stressed future losses; Coverage = Avg. CE/SFLSee Appendix for additional information. STRESS COVERAGE: ASSET-BACKED SECURITIES PORTFOLIO (PERIOD END 12/31/09) Govt. student loans: $11.7B HCL: < 0.1% Avg. CE: >100% - 98% govt. guarantee + 6.5% CE SFL: 12% - Historic default rate before government guarantees with 0% recoveries With >100% credit enhancement, no risk of loss Private student loans: $0.9B HCL: 4.46% - With insurance Avg. CE: 13.6% SFL: 9.9% - Assumes no insurance; industry/rating agency assumption Coverage: 1.37x Credit cards: $7.3B HCL: 9.51% = Wgtd. avg. charge-offs Avg. CE: 23.79% SFL: 12.24% - Industry projected wgtd. avg. charge-offs Coverage: 1.95x Auto/equipment: $1.8B HCL: 0.8% - Excluding wrapped deals Avg. CE: 13.4% - Excluding wrapped deals SFL: 1.9% - Using worst vintage in 10 years (2001) blended by portfolio weighting, excluding wrapped deals Coverage: 7.10x Foreign RMBS: $13.8B HCL: 0.23% Avg. CE: 9.76% SFL: 1.90% - Aggregate regional projection averaged by holdings Coverage: 5.12x CLO/CREs: $2.2B HCL: 2.79% - Current Gross Defaults Avg. CE: 28.28% SFL: 8.0% - Industry projection of 12% default rate with only half the long-term recovery rate of 70% Coverage: 3.53x Sub-prime: $5.1B HCL: 8.9% Avg. CE: 40.90% - AAA 58.12%, AA 53.11% SFL: 32.01% - Roll rate analysis average cumulative loss across all vintages Coverage: 1.28X HELOC: $0.5B HCL: 0% - With insurance Avg. CE: 2.5% overcollateralization plus monoline insurance SFL: If all monoline wrappers except FSA fail and defaults stay elevated in perpetuity, and we have 0% recoveries, pre-tax loss is = $(19.36)M
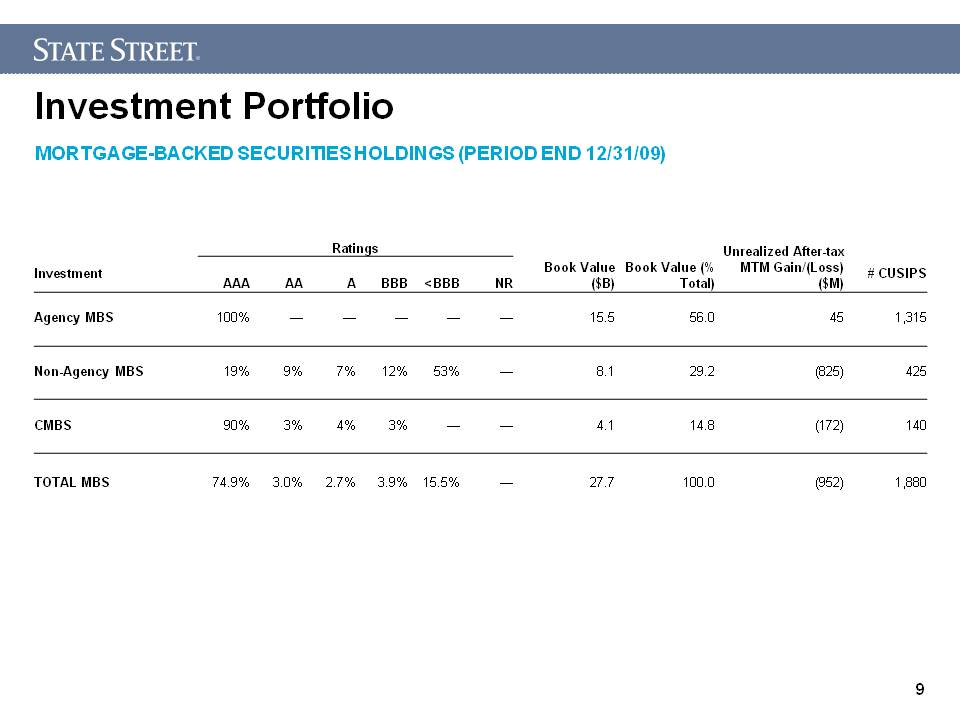
Investment Portfolio MORTGAGE-BACKED SECURITIES HOLDINGS (PERIOD END 12/31/09) Ratings Book Value ($B) Book Value (% Total) Unrealized After-tax MTM Gain/(Loss) ($M) Investment AAA AA A BBB <BBB NR # CUSIPS Agency MBS 100% — — — — — 15.5 56.0 45 1,315 Non-Agency MBS 19% 9% 7% 12% 53% — 8.1 29.2 (825) 425 CMBS 90% 3% 4% 3% — — 4.1 14.8 (172) 140 TOTAL MBS 74.9% 3.0% 2.7% 3.9% 15.5% — 27.7 100.0 (952) 1,880
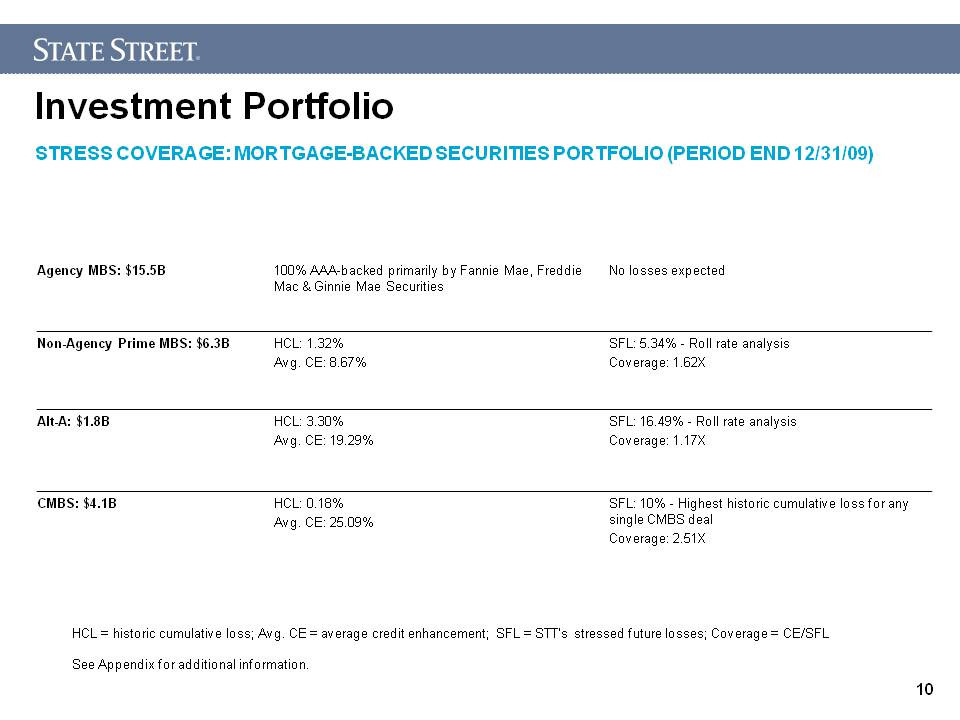
Investment Portfolio STRESS COVERAGE: MORTGAGE-BACKED SECURITIES PORTFOLIO (PERIOD END 12/31/09) HCL = historic cumulative loss; Avg. CE = average credit enhancement; SFL = STT’s stressed future losses; Coverage = CE/SFLSee Appendix for additional information. Agency MBS: $15.5B 100% AAA-backed primarily by Fannie Mae, Freddie Mac & Ginnie Mae Securities No losses expected Non-Agency Prime MBS: $6.3B HCL: 1.32% Avg. CE: 8.67% SFL: 5.34% - Roll rate analysis Coverage: 1.62X Alt-A: $1.8B HCL: 3.30% Avg. CE: 19.29% SFL: 16.49% - Roll rate analysis Coverage: 1.17X CMBS: $4.1B HCL: 0.18% Avg. CE: 25.09% SFL: 10% - Highest historic cumulative loss for any single CMBS deal Coverage: 2.51X
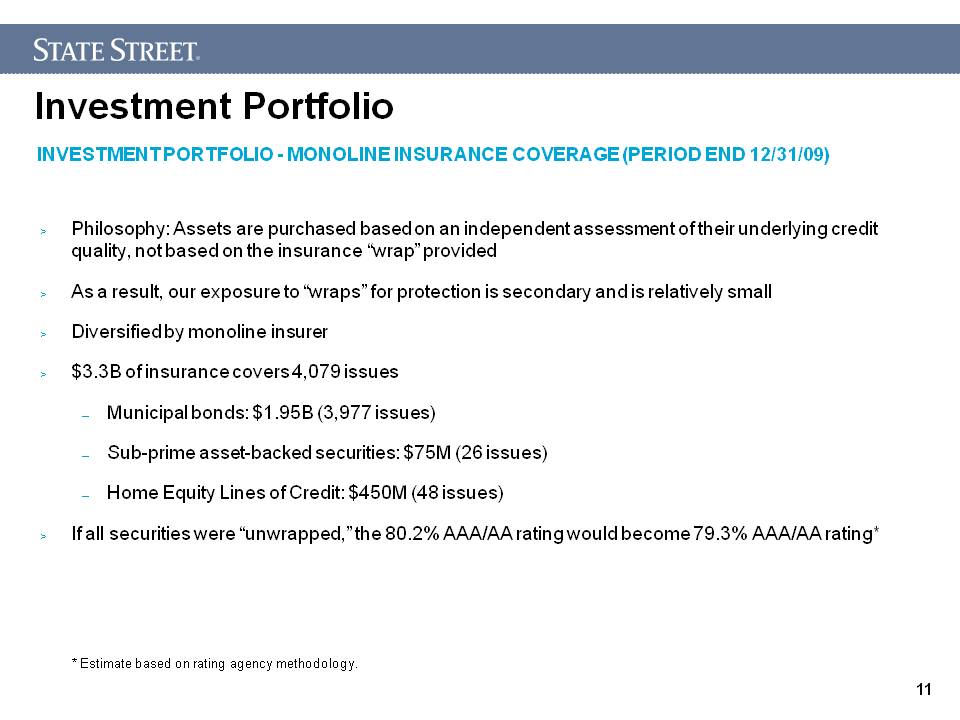
Investment Portfolio Philosophy: Assets are purchased based on an independent assessment of their underlying credit quality, not based on the insurance “wrap” provided As a result, our exposure to “wraps” for protection is secondary and is relatively small Diversified by monoline insurer $3.3B of insurance covers 4,079 issues Municipal bonds: $1.95B (3,977 issues) Sub-prime asset-backed securities: $75M (26 issues) Home Equity Lines of Credit: $450M (48 issues) If all securities were “unwrapped,” the 80.2% AAA/AA rating would become 79.3% AAA/AA rating* INVESTMENT PORTFOLIO - MONOLINE INSURANCE COVERAGE (PERIOD END 12/31/09) * Estimate based on rating agency methodology.
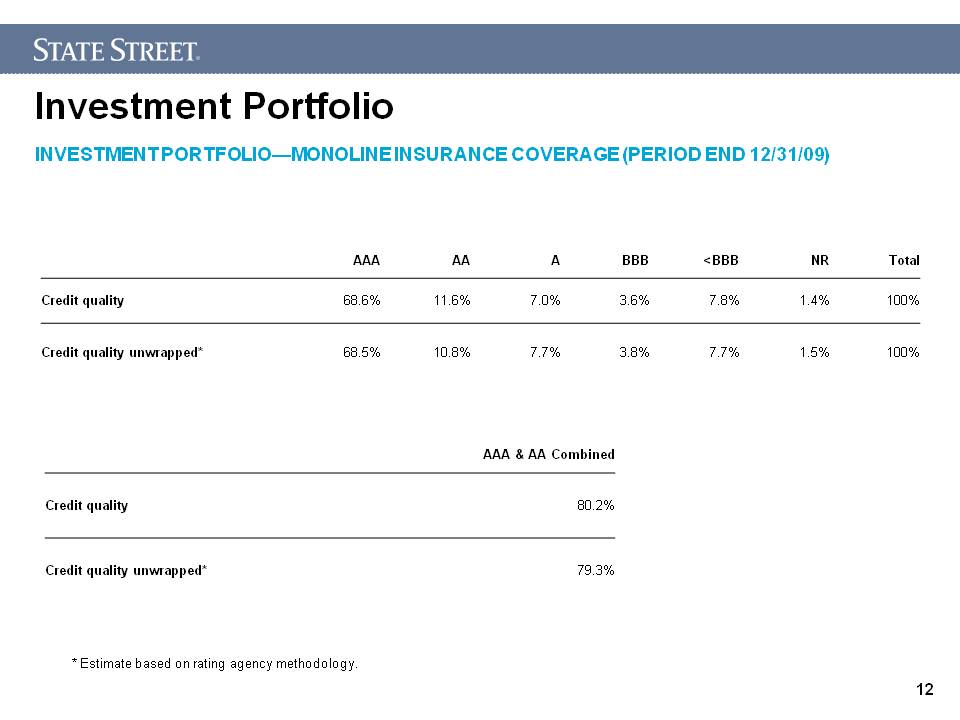
Investment Portfolio INVESTMENT PORTFOLIO—MONOLINE INSURANCE COVERAGE (PERIOD END 12/31/09) AAA AA A BBB <BBB NR Total Credit quality 68.6% 11.6% 7.0% 3.6% 7.8% 1.4% 100% Credit quality unwrapped* 68.5% 10.8% 7.7% 3.8% 7.7% 1.5% 100% AAA & AA Combined Credit quality 80.2% Credit quality unwrapped* 79.3% * Estimate based on rating agency methodology.
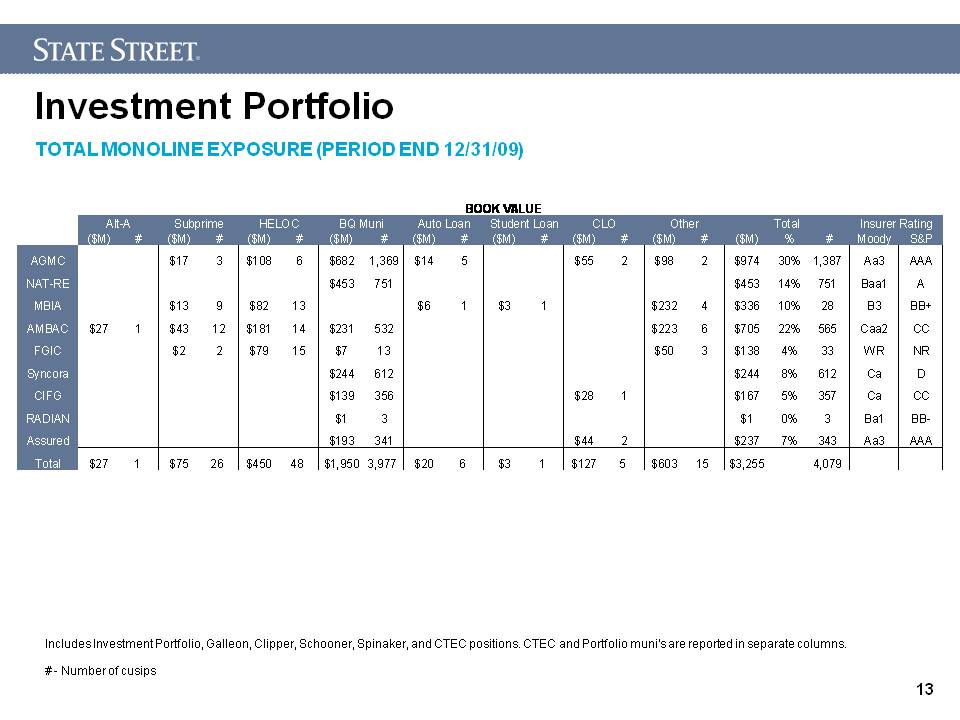
Investment Portfolio TOTAL MONOLINE EXPOSURE (PERIOD END 12/31/09) Includes Investment Portfolio, Galleon, Clipper, Schooner, Spinaker, and CTEC positions. CTEC and Portfolio muni's are reported in separate columns. # - Number of cusips
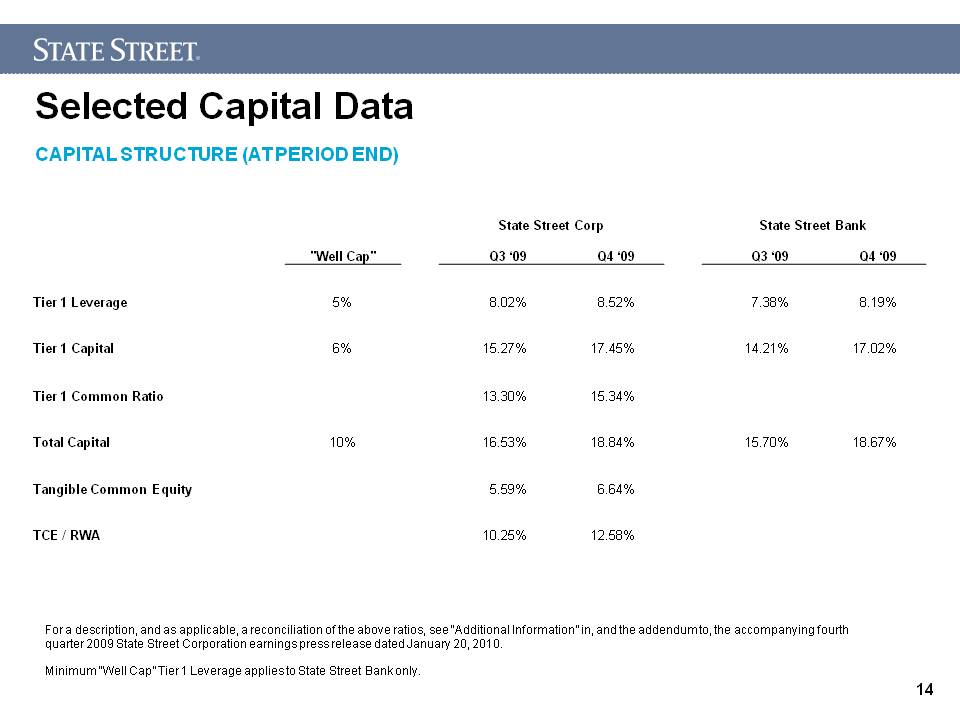
Selected Capital Data CAPITAL STRUCTURE (AT PERIOD END) For a description, and as applicable, a reconciliation of the above ratios, see “Additional Information” in, and the addendum to, the accompanying fourth quarter 2009 State Street Corporation earnings press release dated January 20, 2010.Minimum “Well Cap” Tier 1 Leverage applies to State Street Bank only. State Street Corp State Street Bank "Well Cap" Q3 ‘09 Q4 ‘09 Q3 ‘09 Q4 ‘09 Tier 1 Leverage 5% 8.02% 8.52% 7.38% 8.19% Tier 1 Capital 6% 15.27% 17.45% 14.21% 17.02% Tier 1 Common Ratio 13.30% 15.34% Total Capital 10% 16.53% 18.84% 15.70% 18.67% Tangible Common Equity 5.59% 6.64% TCE / RWA 10.25% 12.58%
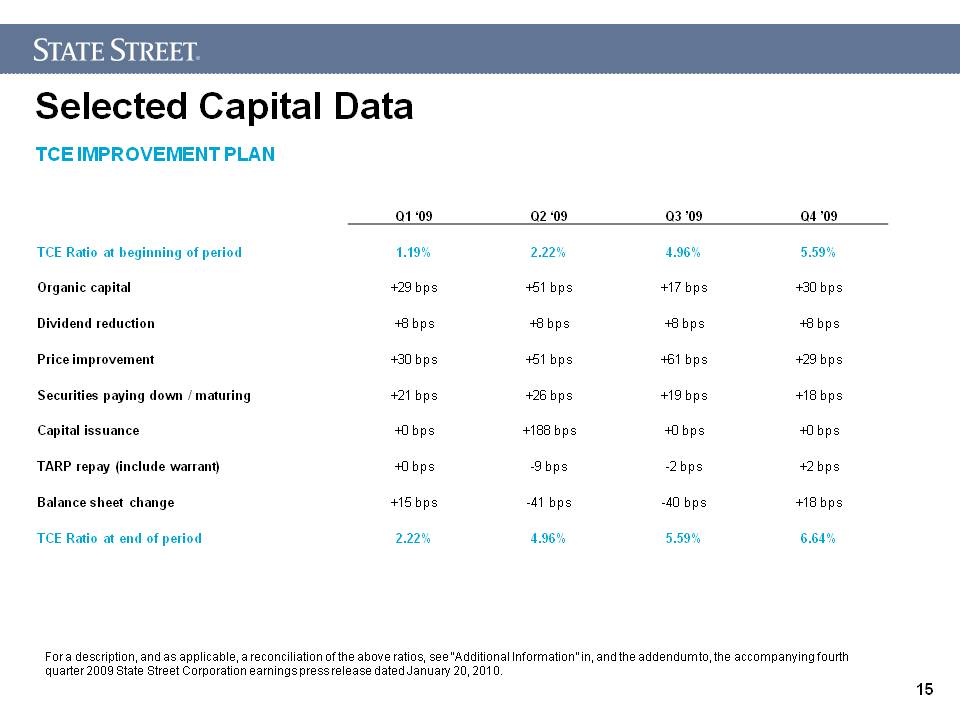
Selected Capital Data TCE IMPROVEMENT PLAN For a description, and as applicable, a reconciliation of the above ratios, see “Additional Information” in, and the addendum to, the accompanying fourth quarter 2009 State Street Corporation earnings press release dated January 20, 2010. Q1 ‘09 Q2 ‘09 Q3 ’09 Q4 ’09 TCE Ratio at beginning of period 1.19% 2.22% 4.96% 5.59% Organic capital +29 bps +51 bps +17 bps +30 bps Dividend reduction +8 bps +8 bps +8 bps +8 bps Price improvement +30 bps +51 bps +61 bps +29 bps Securities paying down / maturing +21 bps +26 bps +19 bps +18 bps Capital issuance +0 bps +188 bps +0 bps +0 bps TARP repay (include warrant) +0 bps -9 bps -2 bps +2 bps Balance sheet change +15 bps -41 bps -40 bps +18 bps TCE Ratio at end of period 2.22% 4.96% 5.59% 6.64%
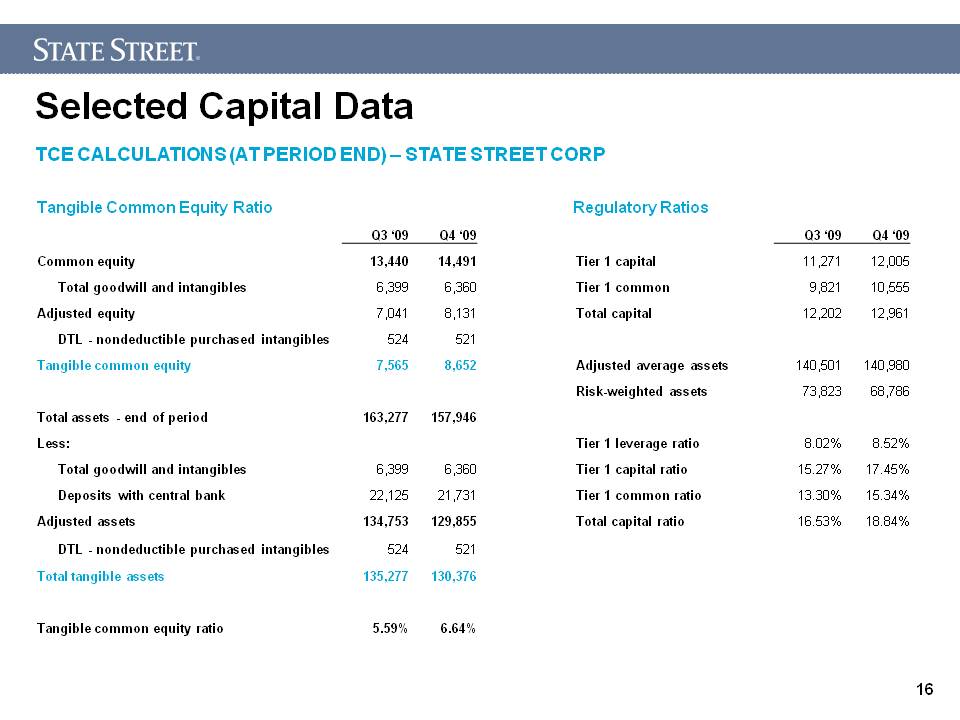
Selected Capital Data TCE CALCULATIONS (AT PERIOD END) – STATE STREET CORP Tangible Common Equity Ratio Regulatory Ratios Q3 ‘09 Q4 ‘09 Q3 ‘09 Q4 ‘09 Common equity 13,440 14,491 Tier 1 capital 11,271 12,005 Total goodwill and intangibles 6,399 6,360 Tier 1 common 9,821 10,555 Adjusted equity 7,041 8,131 Total capital 12,202 12,961 DTL - nondeductible purchased intangibles 524 521 Tangible common equity 7,565 8,652 Adjusted average assets 140,501 140,980 Risk-weighted assets 73,823 68,786 Total assets - end of period 163,277 157,946 Less: Tier 1 leverage ratio 8.02% 8.52% Total goodwill and intangibles 6,399 6,360 Tier 1 capital ratio 15.27% 17.45% Deposits with central bank 22,125 21,731 Tier 1 common ratio 13.30% 15.34% Adjusted assets 134,753 129,855 Total capital ratio 16.53% 18.84% DTL - nondeductible purchased intangibles 524 521 Total tangible assets 135,277 130,376 Tangible common equity ratio 5.59% 6.64%
Investment Portfolio APPENDIX
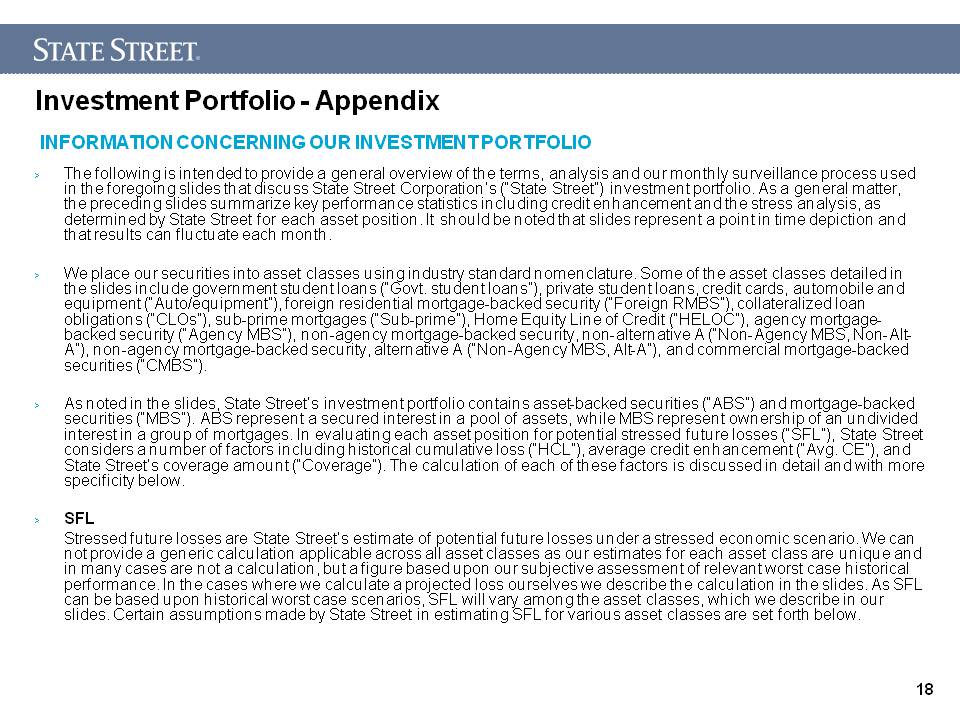
Investment Portfolio - Appendix The following is intended to provide a general overview of the terms, analysis and our monthly surveillance process used in the foregoing slides that discuss State Street Corporation’s (“State Street”) investment portfolio. As a general matter, the preceding slides summarize key performance statistics including credit enhancement and the stress analysis, as determined by State Street for each asset position. It should be noted that slides represent a point in time depiction and that results can fluctuate each month. We place our securities into asset classes using industry standard nomenclature. Some of the asset classes detailed in the slides include government student loans (“Govt. student loans”), private student loans, credit cards, automobile and equipment (“Auto/equipment”), foreign residential mortgage-backed security (“Foreign RMBS”), collateralized loan obligations (“CLOs”), sub-prime mortgages (“Sub-prime”), Home Equity Line of Credit (“HELOC”), agency mortgage-backed security (“Agency MBS”), non-agency mortgage-backed security, non-alternative A (“Non-Agency MBS, Non-Alt-A”), non-agency mortgage-backed security, alternative A (“Non-Agency MBS, Alt-A”), and commercial mortgage-backed securities (“CMBS”). As noted in the slides, State Street’s investment portfolio contains asset-backed securities (“ABS”) and mortgage-backed securities (“MBS”). ABS represent a secured interest in a pool of assets, while MBS represent ownership of an undivided interest in a group of mortgages. In evaluating each asset position for potential stressed future losses (“SFL”), State Street considers a number of factors including historical cumulative loss (“HCL”), average credit enhancement (“Avg. CE”), and State Street’s coverage amount (“Coverage”). The calculation of each of these factors is discussed in detail and with more specificity below. SFL Stressed future losses are State Street’s estimate of potential future losses under a stressed economic scenario. We can not provide a generic calculation applicable across all asset classes as our estimates for each asset class are unique and in many cases are not a calculation, but a figure based upon our subjective assessment of relevant worst case historical performance. In the cases where we calculate a projected loss ourselves we describe the calculation in the slides. As SFL can be based upon historical worst case scenarios, SFL will vary among the asset classes, which we describe in our slides. Certain assumptions made by State Street in estimating SFL for various asset classes are set forth below. INFORMATION CONCERNING OUR INVESTMENT PORTFOLIO
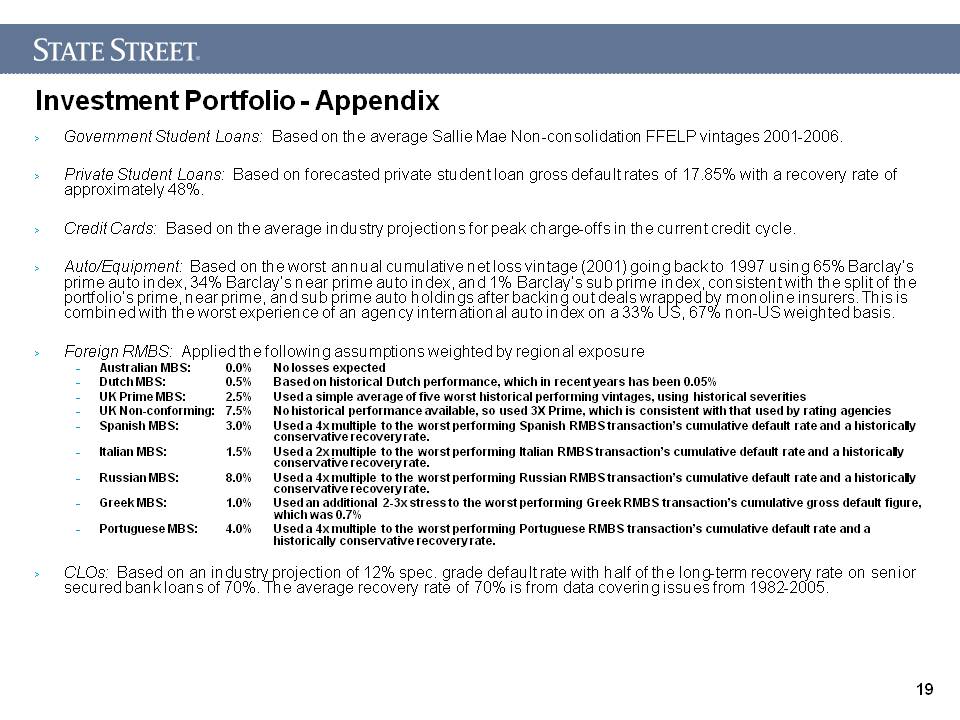
Investment Portfolio - Appendix Government Student Loans: Based on the average Sallie Mae Non-consolidation FFELP vintages 2001-2006. Private Student Loans: Based on forecasted private student loan gross default rates of 17.85% with a recovery rate of approximately 48%. Credit Cards: Based on the average industry projections for peak charge-offs in the current credit cycle. Auto/Equipment: Based on the worst annual cumulative net loss vintage (2001) going back to 1997 using 65% Barclay’s prime auto index, 34% Barclay’s near prime auto index, and 1% Barclay’s sub prime index, consistent with the split of the portfolio’s prime, near prime, and sub prime auto holdings after backing out deals wrapped by monoline insurers. This is combined with the worst experience of an agency international auto index on a 33% US, 67% non-US weighted basis. Foreign RMBS: Applied the following assumptions weighted by regional exposure Australian MBS: 0.0% No losses expected Dutch MBS: 0.5% Based on historical Dutch performance, which in recent years has been 0.05% UK Prime MBS: 2.5% Used a simple average of five worst historical performing vintages, using historical severities UK Non-conforming: 7.5% No historical performance available, so used 3X Prime, which is consistent with that used by rating agencies Spanish MBS: 3.0% Used a 4x multiple to the worst performing Spanish RMBS transaction’s cumulative default rate and a historically conservative recovery rate. Italian MBS: 1.5% Used a 2x multiple to the worst performing Italian RMBS transaction’s cumulative default rate and a historically conservative recovery rate. Russian MBS: 8.0% Used a 4x multiple to the worst performing Russian RMBS transaction’s cumulative default rate and a historically conservative recovery rate. Greek MBS: 1.0% Used an additional 2-3x stress to the worst performing Greek RMBS transaction’s cumulative gross default figure, which was 0.7% Portuguese MBS: 4.0% Used a 4x multiple to the worst performing Portuguese RMBS transaction’s cumulative default rate and a historically conservative recovery rate. CLOs: Based on an industry projection of 12% spec. grade default rate with half of the long-term recovery rate on senior secured bank loans of 70%. The average recovery rate of 70% is from data covering issues from 1982-2005.
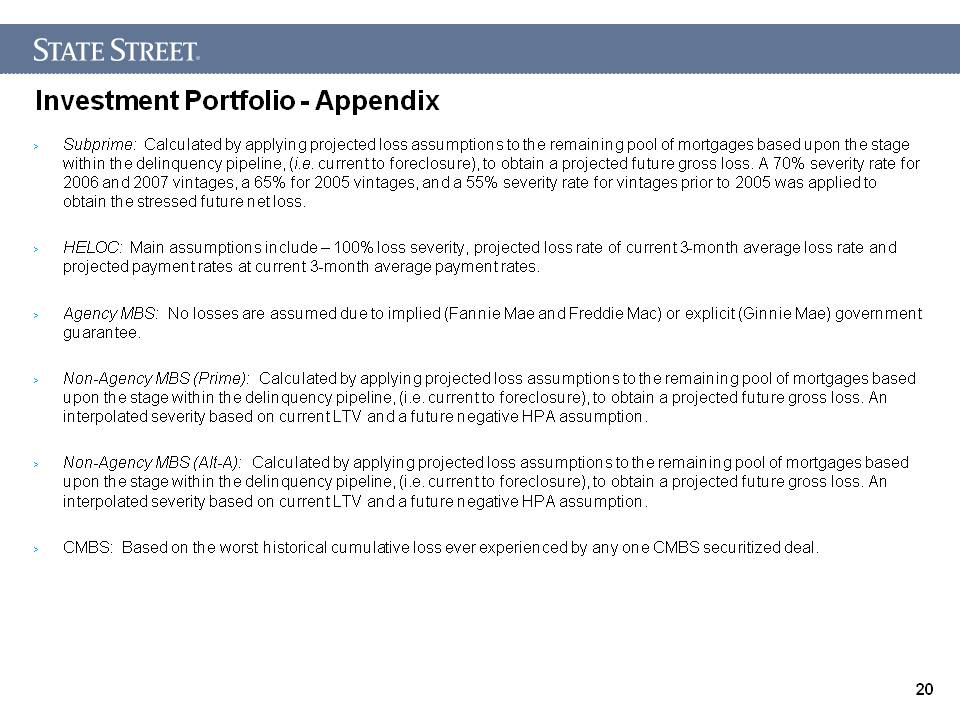
Subprime: Calculated by applying projected loss assumptions to the remaining pool of mortgages based upon the stage within the delinquency pipeline, (i.e. current to foreclosure), to obtain a projected future gross loss. A 70% severity rate for 2006 and 2007 vintages, a 65% for 2005 vintages, and a 55% severity rate for vintages prior to 2005 was applied to obtain the stressed future net loss. HELOC: Main assumptions include – 100% loss severity, projected loss rate of current 3-month average loss rate and projected payment rates at current 3-month average payment rates. Agency MBS: No losses are assumed due to implied (Fannie Mae and Freddie Mac) or explicit (Ginnie Mae) government guarantee. Non-Agency MBS (Prime): Calculated by applying projected loss assumptions to the remaining pool of mortgages based upon the stage within the delinquency pipeline, (i.e. current to foreclosure), to obtain a projected future gross loss. An interpolated severity based on current LTV and a future negative HPA assumption. Non-Agency MBS (Alt-A): Calculated by applying projected loss assumptions to the remaining pool of mortgages based upon the stage within the delinquency pipeline, (i.e. current to foreclosure), to obtain a projected future gross loss. An interpolated severity based on current LTV and a future negative HPA assumption. CMBS: Based on the worst historical cumulative loss ever experienced by any one CMBS securitized deal. Investment Portfolio - Appendix
Investment Portfolio - Appendix HCL Historical cumulative loss is determined by State Street based upon data obtained from third party providers. Avg. CE Credit enhancement is determined by State Street based upon data obtained from third party providers. CE can include excess spread for the most recent year, over-collateralization, cash reserves, and subordination. Coverage Coverage is calculated by dividing CE by SFL, which results in the coverage multiple. Coverage is provided as a measure of excess enhancement above our projected future losses under a stressed economic scenario. As noted above and in the slides, in performing these calculations we collect and use information provided by third party providers. The information we used to create these slides included information from the latest surveillance reports that included data from servicer reports received during the most recent month. Third party sources use assumptions, judgments and estimates in determining data, and different third parties may provide different data. It should be noted that certain securities report on a quarterly vs. monthly basis. For those securities, the most recent available information was used. It should be noted that industry information, rather than portfolio experience was used in certain instances where industry information resulted in a more conservative approach. State Street does not independently verify the data obtained from third party providers that is used in determining and estimating SFL, HCL, Avg. CE and Coverage and the information is subject to the risk of inaccuracy. As noted above and in the slides, State Street’s estimates are based upon various subjective assumptions, and there is no assurance that these assumptions accurately predict maximum potential or likely future losses.