Attached files
| file | filename |
|---|---|
| 8-K - REHABCARE 3Q09 IR PRESENTATION - REHABCARE GROUP INC | eightk3q09presentation.htm |

Investor
Presentation
JP
Morgan Conference
January 13, 2010
January 13, 2010
Exhibit
99
Company
Overview
n Headquartered in
St. Louis, Missouri
n Established in
1982
n Largest contract
manager of
rehabilitation services in hospitals and
long-term care settings, with over
1,280 locations in 41 states
rehabilitation services in hospitals and
long-term care settings, with over
1,280 locations in 41 states
n Completed
acquisition of Triumph
HealthCare, a leading provider of long-
term acute care hospitals (LTACHs),
on Nov. 24, 2009
HealthCare, a leading provider of long-
term acute care hospitals (LTACHs),
on Nov. 24, 2009
n Acquisition makes
RehabCare the
fourth largest post-acute hospital
operator and third largest LTACH
provider in U.S.
fourth largest post-acute hospital
operator and third largest LTACH
provider in U.S.
n YTD 9/30/09 pro
forma revenues of
$943 mm
$943 mm
Hospital
Rehabilitation Services (HRS) Division
Skilled
Nursing Rehabilitation Services (SRS) Division
Hospital
Division
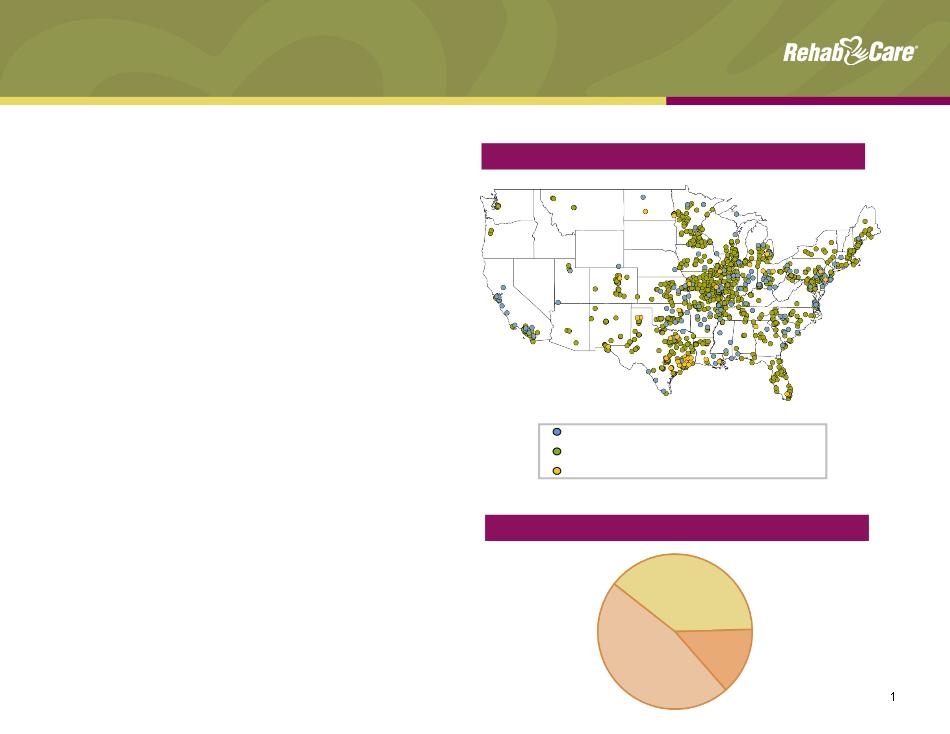
Geographic
Presence
Revenue
Breakdown - YTD pro forma as of 9/30/09
Skilled
Nursing
39%
Nursing
39%
Hospital
Rehab
Services
14%
Services
14%
Hospitals
47%
47%

13%
Patient
Discharge Destination1
LTACH
/ SNF
IRF
No
post-
acute care
acute care
Hospice/Home
Health
65%
Acute
care
hospital
hospital
2
Market
Overview
13%
2 MedPAC
Data Book, June 2009; does not include Home Health or
Medicare Advantage
Medicare Advantage
3 Avalere
Health LLC, April 2009; does not include Home Health or
Medicare Advantage
Medicare Advantage
Medicare
Post-Acute Spending (in billions)
LTACHs
= Long-Term Acute Care Hospitals IRFs
= Inpatient Rehabilitation Facilities SNFs =
Skilled Nursing Facilities
= Inpatient Rehabilitation Facilities SNFs =
Skilled Nursing Facilities
$
n Large,
growing and highly fragmented market
n Positive
demographic trends, with first wave of Baby Boomers entering Medicare in
2011
n Medicare
expenditures for post-acute services (excluding home health) projected to
increase 113% from
2007 to 2021
2007 to 2021
n RehabCare
delivers services across the post-acute continuum of care, providing
the
most appropriate discharge destination for acute patients
most appropriate discharge destination for acute patients
Projected3
Actual2

94
6
5
6
89
82
28
23
19
11
8
8
Hospital
Division
Overview
Overview
Competitive
Landscape
1 See Appendix for
reconciliation to GAAP
2 MedPAC, March 2009
Report to the Congress
3 MedPAC Data Book, June
2009
4 Does not include
additional Triumph facility scheduled to open April 2010
n Triumph HealthCare
was purchased for $558.7 mm, 6.2x LTM
9/30/09 Adjusted EBITDA1
9/30/09 Adjusted EBITDA1
n Triumph is the
third largest LTACH operator in the U.S. by
revenue, operating 21 facilities in 7 states. It is the largest
provider of long-term acute care in Houston and the dominant
provider of LTACH services in 9 of its 13 markets.
revenue, operating 21 facilities in 7 states. It is the largest
provider of long-term acute care in Houston and the dominant
provider of LTACH services in 9 of its 13 markets.
n RehabCare pursues
joint venture hospital partnerships (nine
currently) with market-leading acute care providers and
physician groups, in addition to its wholly owned facilities
currently) with market-leading acute care providers and
physician groups, in addition to its wholly owned facilities
Market
Size2: 219
IRFs
(Freestanding and
HIHs)
Market
Size3: 409
LTACHs
IRFs
LTACHs
100
93
82
34
23
19
16
14
8
6
4
3
Combined
Profile
n 28 long-term acute
care hospitals
(LTACHs), 6 inpatient rehabilitation
facilities (IRFs)
(LTACHs), 6 inpatient rehabilitation
facilities (IRFs)
n 13
states
n 1,838 licensed
beds
n 18,000 annual
patient discharges
4
Source:
Information available from public filings or
from company websites
from company websites
4

4
Triumph
Acquisition
Strategic rationale - operational
Strategic rationale - operational
n Combination
provides immediate economies of scale
n Ability to adopt
Triumph’s operational strengths, which have produced a consistent record
of
strong earnings performance compared to major competitors
strong earnings performance compared to major competitors
n Creates stronger,
more comprehensive continuum of care, better positioning RehabCare for
potential changes in reimbursement (e.g., bundling)
potential changes in reimbursement (e.g., bundling)
n Builds out
RehabCare’s continuum of care in 12 markets where there is overlap with SRS
and
HRS services, creating opportunities for synergies and improved patient flow
HRS services, creating opportunities for synergies and improved patient flow
n New management
structure in the Hospital division
n Brock Hardaway
leads the combined LTACH operations
n Joined Triumph in
2005
n 21 years industry
experience, including operational leadership positions at Select
Medical and Kindred Healthcare
Medical and Kindred Healthcare
n Retained key
Triumph operators
n Additional growth
potential through LTACH and IRF development
opportunities

Admission
Volumes
n Strong admission
volumes
n ADC has grown
consistently since 2005
Commercial
Volume Growth
Non-Medicare Patient
Mix
n Strategic approach
to managed care/commercial
payors has yielded higher volumes, higher rates and a
more diversified referral base
payors has yielded higher volumes, higher rates and a
more diversified referral base
n Strength in
managing length of stay (case
management) has resulted in significant growth in
NRPPD
management) has resulted in significant growth in
NRPPD
Triumph
Operational Strengths
1
1
1
1
1 Through
9/30/09
5
16%
20%
22%
26%
27%

6
n Meaningfully
accretive to 2010 EPS
n Immediately brings
the Hospital division to profitability ($59 mm pro forma Adjusted
EBITDA YTD 9/30/09 versus a loss of $7 mm)1
EBITDA YTD 9/30/09 versus a loss of $7 mm)1
n Strong cash flow
and ability to quickly deleverage
n Cost savings
through senior management and back-office overhead reductions
n More diversified
business lines, reducing reliance on third party contracts for revenue
and
EBITDA streams
EBITDA streams
Triumph
Acquisition
Strategic rationale - financial
Strategic rationale - financial
YTD
9/30/09 “Owned” Revenue vs. “Contract” Revenue
RehabCare
Pro
Forma
1 Adjusted
EBITDA Reconciliation: $66.5 mm (Triumph) - $7.1 mm (Legacy Hospital division) =
$59.4 mm; see Appendix for reconciliation to GAAP

n Division has
struggled to maintain traction while absorbing start-up losses,
infrastructure
investments and the impact of various operational issues across a small base of hospitals
investments and the impact of various operational issues across a small base of hospitals
n Expect total year
2009 operating losses of $25.5 - $26.5 mm (including ≈ $11.0 mm in merger
&
acquisition and integration related costs) and revenue of approximately $154.0 mm for full year
acquisition and integration related costs) and revenue of approximately $154.0 mm for full year
n Expect breakeven
operating earnings run rate by the end of the second quarter of 2010
and
breakeven operating earnings for FY2010
breakeven operating earnings for FY2010
n Final rule for
FY2010 Medicare reimbursement, effective 10/1/09, resulted in a 2.8% rate
increase
for RehabCare IRFs and a 1.4% increase for its legacy LTACHs
for RehabCare IRFs and a 1.4% increase for its legacy LTACHs
Legacy
Hospital Division
Historical performance
Historical performance
Revenue
($ in millions) and Discharges
Operating
Earnings & Start-up Losses ($ in millions)
1Includes a $1.5 million
pretax charge related to the cancellation of a planned
acquisition and development project
acquisition and development project
¹
New
Hospitals: 1 0 1 0 1 1
2Q2008 3Q2008 4Q2008 1Q2009 2Q2009 3Q2009
7

Skilled
Nursing Rehabilitation Services (SRS)
Division overview
Division overview
n Manages rehab
programs for SNFs
n Each
Medicare-certified SNF is required to provide
physical, speech and occupational therapy, but many
lack the know-how and/or scale to effectively manage a
program
physical, speech and occupational therapy, but many
lack the know-how and/or scale to effectively manage a
program
n RehabCare provides
a compelling value proposition to its
SNF partners
SNF partners
n Access to advanced
technology platform
n Broader array of
services
n Better access to
scarce therapist labor pool
Source:
Information available from public filings or from company websites
¹
Source: MedPAC Data Book, June 2009
Competitive
Landscape — # of facilities served
Self-
operated
11,000+
1,098
1,000
700
571
450
400
300
188
Market
Size1:
15,000+
Medicare-certified SNFs
Medicare-certified SNFs
8
Profile
n 1,098 skilled
nursing facility (SNF)
programs in 37 states
programs in 37 states
n 7.9 million annual
patient visits
n Polaris Group -
consulting for long-
term care facilities
term care facilities
n VTA Management
Services - therapy
and nurse staffing for New York
and nurse staffing for New York

n Significant same
store revenue and margin growth since completion of Symphony integration in
2007
n Expect 6.5% - 7.5%
operating earnings margins for the remainder of 2009 and in 2010, driven by
mid
single digit year-over-year same store revenue growth; modest unit growth in 4Q09 and in 2010
single digit year-over-year same store revenue growth; modest unit growth in 4Q09 and in 2010
n SNF final rule for
FY2010 Medicare reimbursement, effective 10/1/09, resulted in a net 1.1%
rate
decrease for RehabCare clients; auto exception process for Part B therapy caps expired 12/31/09,
healthcare reform bills include extension through either 2010 or 2011
decrease for RehabCare clients; auto exception process for Part B therapy caps expired 12/31/09,
healthcare reform bills include extension through either 2010 or 2011
n Focused on
implementing next generation of therapist point-of-care devices and value-added
solutions
for clients through information technology
for clients through information technology
SRS
Division
Performance/outlook
Performance/outlook
YOY
growth: 30.9% 35.5% 49.9% 24.4% 5.6% 6.8% 4.1% 9.2%
Same
store: 9.9% 8.4% 1.0%¹ 7.1%1 12.4% 10.6% 11.8% 10.3%
Revenue
($ in millions)
Note:
Includes Symphony acquisition as of July 1, 2006
1Same store analysis
does not include Symphony
%
Margin: 6.0% 5.5% (0.3%) 1.7% 5.6% 7.8% 5.0% 7.9%
Operating
Earnings ($ in millions)
9

RehabCare,
9.1%
Horizon
Health, 1.9%
Other,
0.9%
Hospital-based:
Self-op,
69.9%
Other,
9.9%
RehabCare,
0.5%
HealthSouth,
7.8%
Source:
Information available from public filings or from
company websites
company websites
1 MedPAC March 2009
Report to the Congress
Horizon
Health
15.6%
15.6%
Other
9.8%
9.8%
RehabCare
74.6%
74.6%
Freestanding
Hospital-Based
3rd Party
3rd Party
HealthSouth
42.9%
42.9%
Other
54%
RehabCare
3.1%
3.1%
18.2%
11.9%
Hospital
Rehabilitation Services (HRS)
Division overview
Division overview
n Manages
hospital-based IRFs and outpatient therapy programs
on a contract basis, providing its partners with:
on a contract basis, providing its partners with:
n Improved clinical
outcomes
n Ability to attract
≈ 30% admissions from external sources
n Broader clinical
programming (brain, stroke, spinal
dysfunction)
dysfunction)
n Better access to
scarce therapist labor pool
n Better compliance
(60% rule, RAC, 3-hour rule)
Market
Size1:
1,202
hospital-based and
freestanding IRFs
hospital-based and
freestanding IRFs
10
Profile
n 154 hospital-based
programs in 32
states
states
n 47,500 inpatient
rehabilitation facility
(IRF) and skilled nursing unit
discharges/year
(IRF) and skilled nursing unit
discharges/year
n 1.2 million annual
outpatient visits

11
HRS
Division
Performance/outlook
Performance/outlook
n Revenue and
earnings declined due to implementation of 75% Rule in 2004; freeze of rule
at
60% in January 2008 gave clear runway for same store growth
60% in January 2008 gave clear runway for same store growth
n Expect 15% - 17%
operating earnings margin, 2 - 4% year-over-year growth in IRF same
store
discharges, lower units in 4Q09 and flat unit growth in 2010
discharges, lower units in 4Q09 and flat unit growth in 2010
n Focused on
enhancing client value through information technology, achieving larger
system
sales and becoming the post-acute solution for providers under bundled payment scenario
sales and becoming the post-acute solution for providers under bundled payment scenario
¹Includes
$1.2 mm pretax charge from a bad debt write-down related to an
outpatient transaction
outpatient transaction
Revenue
($ in millions)
CAGR:
(1.6%)
YOY
growth: 2.6% (0.5%) (5.3%) (8.7%) 0.9% 10.1% (2.7%) 9.2%
IRFs: 113 120 115 107 113 110 110 110
Operating
Earnings ($ in millions)
%
Margin: 17.3% 11.9% 13.2% 14.0% 13.3% 15.8% 13.3% 16.6%

Standalone
and Pro Forma
Historical Key Financials
Historical Key Financials
Pro
Forma
RehabCare
Diluted
Earnings Per Share2
1 See Appendix for
reconciliation to GAAP
2 Represents net
earnings per share from continuing operations, attributable to
RehabCare
Historical
Operating Revenue ($mm)
12
Historical
Adjusted EBITDA1
($MM)
Historical
Adjusted EBITDA Margin (%)
9/30/09

13
Consolidated
Pro Forma
Balance Sheet
Balance Sheet
n Cash flow from
operations improved to $47 mm for YTD Q309 compared to $49 mm for
fiscal year 2008
fiscal year 2008
n Days sales
outstanding improved from 66 days at 12/31/08 to 61 days at 9/30/09
n Expect continued
strong operating cash flow with DSO of approximately 60 - 65 days
Cash
and Cash Equivalents
Total
Assets
Total
Debt1
Stockholders’
Equity2
Noncontrolling
Interests
Percent
of Debt to Total Capital3
Debt
to Annualized Adjusted EBITDA4
($mm)
$ 19.2
1,101.9
456.7
428.2
14.5
51%
2.9x
Pro
Forma
9/30/09
9/30/09
1Includes a $441.0 mm
term loan B, net of $9.0 mm in original issue discount; $11.1 mm in capital
leases and $4.6 mm in mortgage debt
2Includes $140.6 mm
related to a secondary equity offering for 6.2 mm shares of common
stock
3Total capital
represents the sum of debt, stockholders’ equity and noncontrolling
interests
4Represents YTD 9/30/09 Adjusted EBITDA
annualized; see Appendix for reconciliation

Strategic
Direction
n Enhance focus on
clinical outcomes through cutting-edge technology and
commitment to excellence
commitment to excellence
n Expand reach in
post-acute space through both organic growth and
development opportunities in existing businesses
development opportunities in existing businesses
n Leverage unique
continuum model to facilitate opportunities under bundled
payment system
payment system
n Utilize IT to
optimize performance and create distinction in the marketplace
Helping
People Regain Their Lives
14

15
Safe
Harbor
Forward-looking
statements have been provided pursuant to the safe harbor
provisions of the Private Securities Litigation Reform Act of 1995. Such statements
are based on the Company’s current expectations and could be affected by
numerous factors, risks and uncertainties discussed in the Company’s filings with
the Securities and Exchange Commission, including its most recent annual report
on Form 10-K, subsequent quarterly reports on Form 10-Q and current reports on
Form 8-K. Do not rely on forward looking statements as the Company cannot
predict or control many factors that affect its ability to achieve the results estimated.
The Company makes no promise to update any forward looking statements
whether as a result of changes in underlying factors, new information, future events
or otherwise.

Appendix
16

17
Primary
Post-Acute Settings
Overview
Overview
|
|
Long
Term Acute Care Hospitals
|
Skilled
Nursing Facilities
|
Inpatient
Rehab Facilities
|
|
Medicare
Spending 2008 |
$4.5
billion
|
$24.2
billion
(est. $6 billion rehab) |
$5.8
billion
|
|
Patients
Served
2007 |
129,202
Medicare discharges
|
2.5 million
Medicare admissions
|
370,048
Medicare discharges
|
|
Type of
Patient
|
High acuity,
at least 25 days
|
Low to
moderate acuity, may
require some rehab |
High acuity,
requires extensive
rehab (min 3 hrs/day) |
|
Avg. Length
of
Stay |
At least 25
days
|
27
days
|
13.2
days
|
|
Medicare
Reimbursement |
LTACH
PPS - Receive a
single payment
when Medicare beneficiary is discharged for all services rendered |
SNF
PPS - Receive a
per diem
payment under both Medicare Part A and state Medicaid programs |
IRF
PPS- Receive a
single
payment when Medicare beneficiary is discharged for all services rendered |
|
Medicare
Requirements |
• Patients must
have an average length
of stay of >25 days • 25% rule: no
more than 25% of
patients may be referred from a single source (fixed at 50% through 2010) • Moratorium on
new LTACH beds until
2011 |
Medicare
covers up to 100 days
of SNF care following an acute hospital stay of at least 3 days |
60% Rule: 60%
of patients
must satisfy one of 13 defined conditions |
Source:
MedPAC

Standalone
and Pro Forma Historical
Financial Reconciliations
Financial Reconciliations
RehabCare
Adjusted EBITDA
Pro
Forma Adjusted EBITDA
Triumph
LTM1 Adjusted
EBITDA/Purchase Price Multiple
1Last twelve
months
2Subject to adjustment
2Subject to adjustment
Triumph
Adjusted EBITDA
18