Attached files
| file | filename |
|---|---|
| EX-99.1 - EXHIBIT 99.1 - TELEFLEX INC | c94531exv99w1.htm |
| 8-K - FORM 8-K - TELEFLEX INC | c94531e8vk.htm |

| TELEFLEX INCORPORATED 2010 FINANCIAL OUTLOOK Exhibit 99.2 |

| Forward-Looking Statements/Additional Notes This presentation and our discussion contain forward-looking information and statements including, but not limited to, such matters as forecasted 2010 net sales, core revenue growth, operating margins, pension expense, earnings per share excluding special items and cash flow from operations; expected 2010 segment net sales, core revenue growth and operating margins; expected costs and results with respect to our FDA remediation efforts; anticipated R&D investments within our Medical Segment; assumptions with respect to foreign currency, effective tax rate, capital expenditures, depreciation and amortization expense, repayment of debt and weighted average shares; expected integration costs and synergies associated with the Arrow acquisition; market trends, future business and financial performance; and other matters which inherently involve risks and uncertainties which could cause actual results to differ from those projected or implied in the forward-looking statements. These risks and uncertainties are addressed in the Company's SEC filings including its most recent Form 10-K. This presentation includes certain non-GAAP financial measures, which include forecasted 2010 earnings per share excluding special items and estimated historical adjusted cash flow from operations. These non-GAAP measures exclude the impact of restructuring and impairment costs, gain or loss on the sale of assets, tax payments related to gains on sale of businesses, and acquisition integration costs. Reconciliation of these non- GAAP measures to the most comparable GAAP measures is contained within this presentation. Segment operating profit is defined as a segment's revenues reduced by its materials, labor and other product costs along with the segment's selling, engineering and administrative expenses and noncontrolling interest. Unallocated corporate expenses, restructuring costs, gain or loss on the sale of assets, acquisition integration costs, interest income and expense and taxes on income are excluded from the measure. Core revenues and growth exclude the impact of translating the results of international subsidiaries at different currency exchange rates from year to year and the comparable activity of companies acquired or divested within the most recent twelve-month period. The following slides reflect continuing operations. |

| Conference Call Logistics The release, accompanying slides, and replay webcast available online at www.teleflex.com (click on "Investors") Telephone replay available by dialing 888-286-8010 or for international calls, 617- 801-6888, pass code number 69522110 |

| JEFF BLACK Chairman and Chief Executive Officer |

| 2010 Financial Outlook Net sales to exceed $1.92 billion Consolidated core revenue growth of 2% to 3% Minimal full year foreign currency tail-wind Overall operating margins of between 16% to 17% for the year Growth of 50 to 100 bps EPS excluding special items of $4.10 to $4.25 Growth of 14% to 18% Cash flow from continuing operations of $275 to $280 million Growth of 20% to 27% |

| 2010 Medical Segment Outlook Net sales exceeding $1.5 billion Core revenue growth of 3% to 4% Core sales growth driven by: Continued penetration of infection prevention critical care product lines Growth in anesthesia product offerings New product introductions Increased investment in R&D, clinical education, and sales & marketing International markets Rebound in surgical instrument & OEM sales Continued expansion of GPO/IDN relationships Segment operating margins approaching 22% for the year |
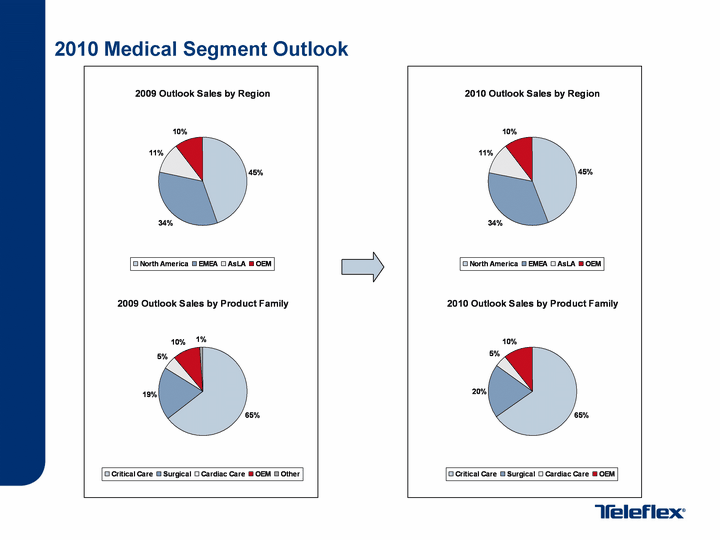
| 2010 Medical Segment Outlook North America EMEA AsLA OEM 646.8 494.6 165.7 149 North America EMEA AsLA OEM 667 515.7 173.4 156.9 Critical Care Surgical Cardiac Care OEM Other 938.9 283.7 70.2 149.3 14.2 Critical Care Surgical Cardiac Care OEM 973.7 298.1 69.9 156.8 |
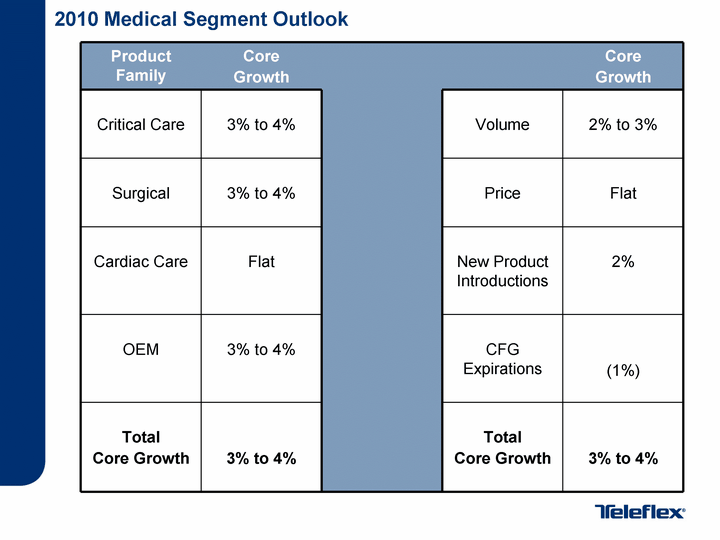
| 2010 Medical Segment Outlook Product Family Core Growth Core Growth Critical Care 3% to 4% Volume 2% to 3% Surgical 3% to 4% Price Flat Cardiac Care Flat New Product Introductions 2% OEM 3% to 4% CFG Expirations (1%) Total Core Growth 3% to 4% Total Core Growth 3% to 4% |

| 2010 Medical Segment Outlook - Research & Development Trend 2007 Actual 2008 Actual 2009 Outlook 2010 Outlook R&D - $ 23.506 42.454 51.955 61.804 R&D - % of Revenue 0.023 0.028 0.036 0.041 Note: excludes $21.5M, ~$4M and ~$2M of FDA remediation expense in '08, '09, '10 respectively |

| 2010 Medical Segment Outlook - New Product Introductions Not dependent on any one single product or procedure Vitality Index ~10% in 2010; up ~ 200 bps over 2009 ~ 60% of new product introductions to occur from higher margin / more clinical vascular access & anesthesia products Continued focus on providing a comprehensive infection prevention solution Anti-microbial PICC launch targeted for mid-year PICC Wand Recently received 510k approval for Teleflex ISIS TM HVT TM endotracheal tube Cuff Pilot Laryngeal Masks ErgoPac CVC kits Crystal Clear Inner Cannulas Note: Vitality index is defined as sales of new products and line extensions introduced over the past three years. |

| 2010 Medical Segment Outlook - Clinical Education Training Vascular Access Anesthesia Respiratory 146 95 1 Largest increases in vascular access focused around PICC care, vessel health and preservation programs Anesthesia training focused around awareness of regional anesthesia product offerings Respiratory training programs launching in 2010 focused around humidification fundamentals Vascular Access Anesthesia Respiratory 225 120 60 |
| 2010 Medical Segment Outlook - FDA Update and Outlook Assumptions At the end of 2009, the FDA began their inspections of the former-Arrow facilities covered under the corporate warning letter Company believes it has put in place the necessary remedial measures to address the concerns raised by the corporate warning letter; nonetheless, the FDA process is continuing Expect FDA inspections to be completed by the end of Q1 2010 2010 Outlook Assumptions: FDA remediation spending down from ~$22 million in 2008 and ~$4 million in 2009 to ~$2 million in 2010 Investment being made back into Research & Development, RA/QA infrastructure, and Sales & Marketing activities 2010 revenue negatively impacted by ~$10 million due to expiration of certain CFG's Outlook assumes FDA restrictions clearance in 2nd half of 2010 |
| 2010 Aerospace Segment Outlook Net sales of $185 - $195 million Core revenue growth of 3% to 4% Increase in wide-body cargo loading system shipments to Boeing & Airbus Reduction in narrow-body volume Repair revenues flat versus 2009 Increase in cargo container volume Low double-digit operating margins for the year Continued expansion of segment operating margins driven by increased volume and manufacturing efficiencies |

| 2010 Commercial Segment Outlook Net sales of $230 - $240 million Core revenue decline of approximately 3% Increase in Marine volume offset by reduction in shipments of modern burner unit to U.S. Military Rigging services sales flat with 2009 Upper single digit operating margins consistent with 2009 levels Full year impact of cost reductions implemented during the course of 2009 and continued Marine sales shift to the aftermarket, offsets decline in higher-margin modern burner unit sales |

| KEVIN GORDON Executive Vice President and Chief Financial Officer |

| $3.90 to $4.00 $3.90 to $4.00 $4.10 to $4.40 Over $2,400 $280 to $290 6.9% 6.9% 5.7% 5.8% Note: 2008 & 2009 Cash Flow from Continuing Operations exclude tax payments of $90.2M & $97.5M, respectively related to gain on sale of businesses 2010 Outlook Financial Goals |

| Pension & OPEB expense declines ~ $2 million versus 2009 Foreign currency tailwind Euro assumed to be at approximately today's rates Annual effective tax rate: 30% Capex: $50 - $55 million Depreciation expense: ~$60 million Amortization expense: ~$45 million Reduced debt balance & low interest rates result in year-on-year decline of full-year interest expense Achieved Arrow aggregate annual pre-tax synergy goals of $70 to $75 million Weighted average shares of 40.25 million 2010 Outlook Assumptions |
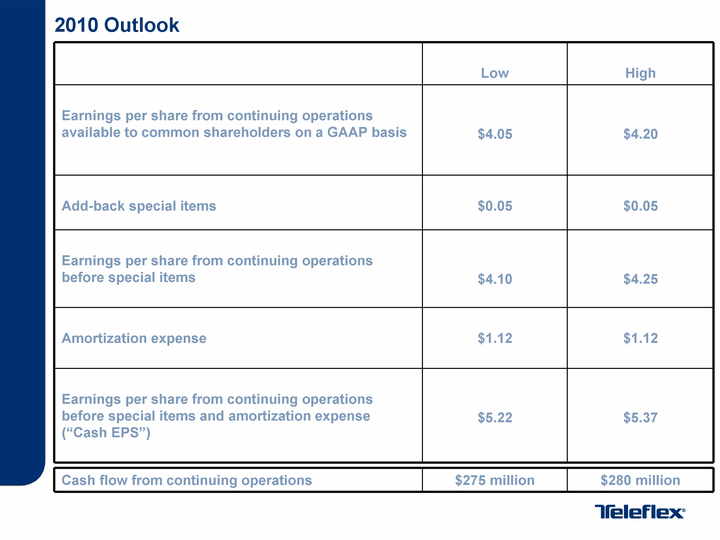
| 2010 Outlook Low High Earnings per share from continuing operations available to common shareholders on a GAAP basis $4.05 $4.20 Add-back special items $0.05 $0.05 Earnings per share from continuing operations before special items $4.10 $4.25 Amortization expense $1.12 $1.12 Earnings per share from continuing operations before special items and amortization expense ("Cash EPS") $5.22 $5.37 Cash flow from continuing operations $275 million $280 million |

| JEFF BLACK Chairman and Chief Executive Officer |

| Summary Medical core revenue growth of 3% to 4% Continued expansion of operating margins EPS excluding special items of $4.10 to $4.25, up 14% to 18% Cash flow from operations of $275 to $280 million, up 20% to 27% Completion of Arrow integration |

| QUESTION & ANSWER |