Attached files
| file | filename |
|---|---|
| EX-99.1 - EX-99.1 - POWERSECURE INTERNATIONAL, INC. | l38428exv99w1.htm |
| 8-K - FORM 8-K - POWERSECURE INTERNATIONAL, INC. | l38428e8vk.htm |
Exhibit 99.2

January 6, 2010

Forward Looking Statements
Safe Harbor
All forward-looking statements made in this presentation are made
under the safe harbor provisions of the Private Securities Litigation
Reform Act of 1995. Forward-looking statements, which are all
statements other than statements of historical facts and include
beliefs, opinions, estimates, and projections about future business
developments and opportunities and financial guidance, are not
guarantees of future performance or events but are subject to risks,
uncertainties and other factors that could cause actual results to
differ materially from those expressed, projected or implied,
including risks and uncertainties set forth in the Company’s SEC
filings, including but not limited to Form 10-K for fiscal year 2008 and
subsequent filings on Form 8-K and 10-Q. Any forward-looking
statements in this presentation speak only as of the date hereof, and
the Company assumes no duty or obligation to update or revise any
forward-looking statements.
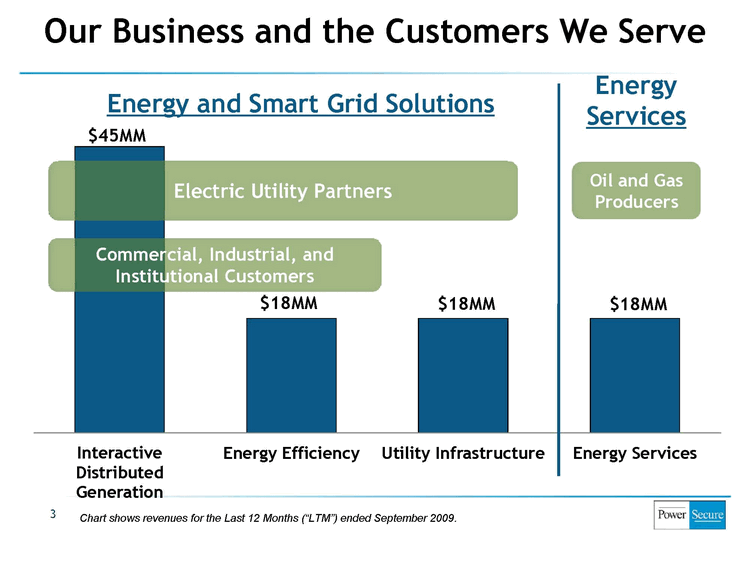
$45MM
$18MM $18MM $18MM
Interactive
Distributed
Generation
Energy Efficiency Utility Infrastructure Energy Services
Commercial, Industrial, and
Institutional Customers
Electric Utility Partners
3
Our Business and the Customers We Serve
Chart shows revenues for the Last 12 Months (“LTM”) ended September 2009.
Oil and Gas
Producers
Energy and Smart Grid Solutions
Energy
Services
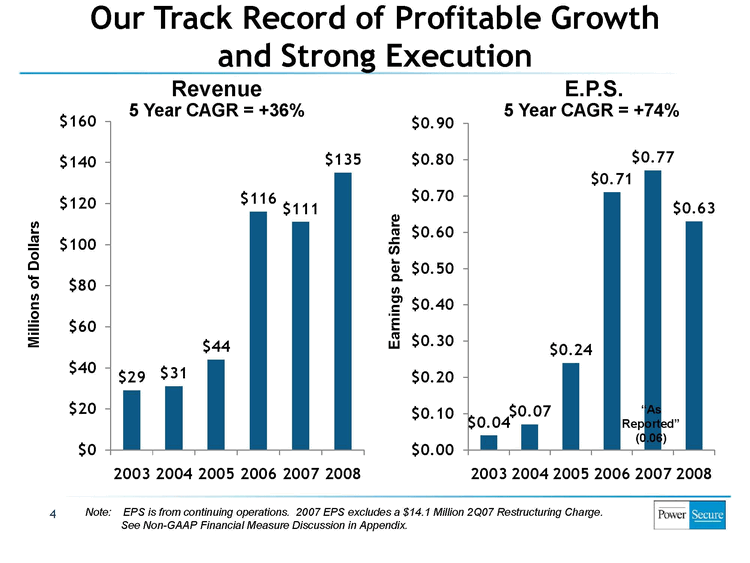
$29 $31
$44
$116
$111
$135
$0
$20
$40
$60
$80
$100
$120
$140
$160
2003 2004 2005 2006 2007 2008
$0.04
$0.07
$0.24
$0.71
$0.77
$0.63
$0.00
$0.10
$0.20
$0.30
$0.40
$0.50
$0.60
$0.70
$0.80
$0.90
2003 2004 2005 2006 2007 2008
Note: EPS is from continuing operations. 2007 EPS excludes a $14.1 Million 2Q07 Restructuring Charge.
See Non-GAAP Financial Measure Discussion in Appendix.
4
Revenue E.P.S.
Millions of Dollars
Earnings per Share
5 Year CAGR = +36% 5 Year CAGR = +74%
Our Track Record of Profitable Growth
and Strong Execution
“As
Reported”
(0.06)
5
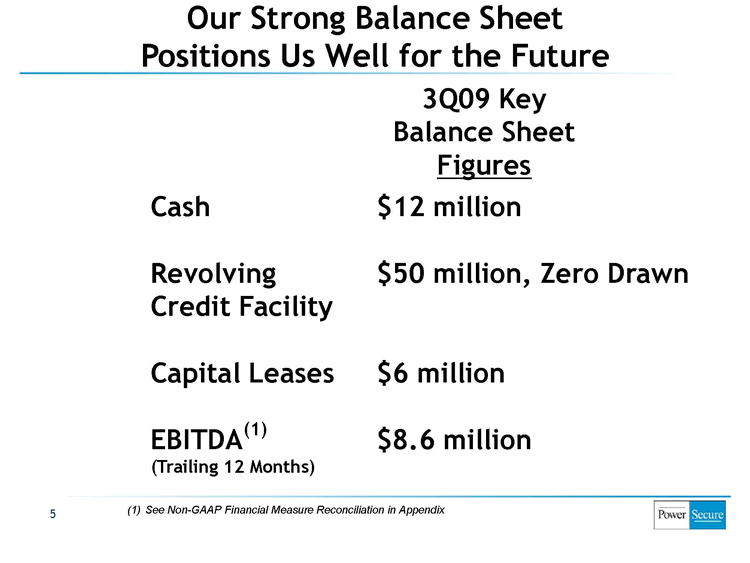
Our Strong Balance Sheet
Positions Us Well for the Future
Cash
Revolving
Credit Facility
Capital Leases
EBITDA(1)
(Trailing 12 Months)
$12 million
$50 million, Zero Drawn
$6 million
$8.6 million
(1) See Non-GAAP Financial Measure Reconciliation in Appendix
3Q09 Key
Balance Sheet
Figures
6
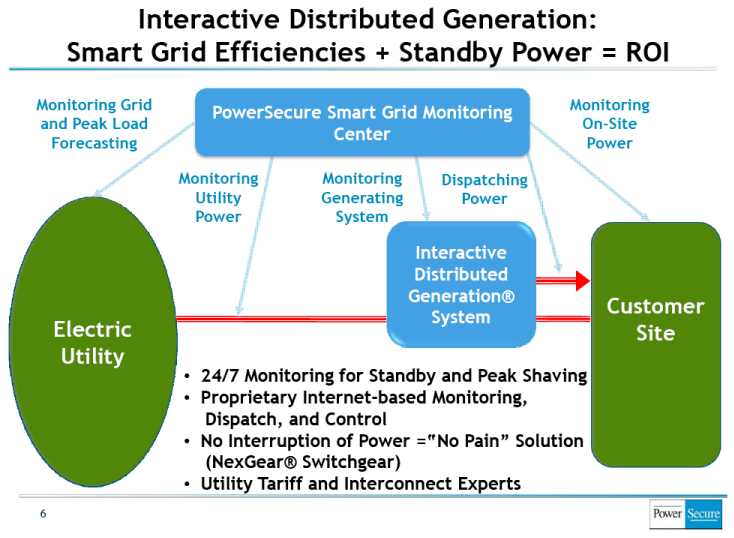
Interactive Distributed Generation:
Smart Grid Efficiencies + Standby Power = ROI
Electric
Utility
Customer
Site
PowerSecure Smart Grid Monitoring
Center
Interactive
Distributed
Generation®
System
Monitoring Grid
and Peak Load
Forecasting
Monitoring
Utility
Power
Monitoring
Generating
System
Dispatching
Power
Monitoring
On-Site
Power
24/7 Monitoring for Standby and Peak Shaving
Proprietary Internet-based Monitoring,
Dispatch, and Control
No Interruption of Power =“No Pain” Solution
(NexGear Switchgear)
Utility Tariff and Interconnect Experts
7
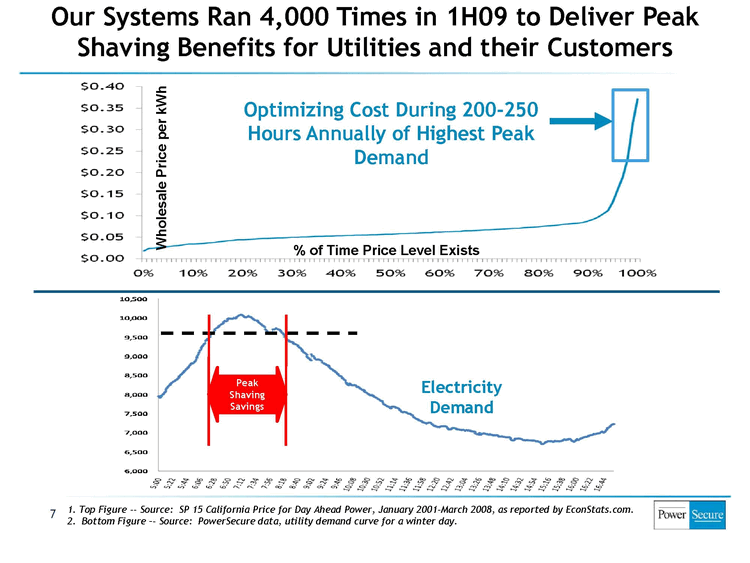
Wholesale Price per kWh
% of Time Price Level Exists
1. Top Figure — Source: SP 15 California Price for Day Ahead Power, January 2001-March 2008, as reported by EconStats.com.
2. Bottom Figure — Source: PowerSecure data, utility demand curve for a winter day.
Our Systems Ran 4,000 Times in 1H09 to Deliver Peak
Shaving Benefits for Utilities and their Customers
Optimizing Cost During 200-250
Hours Annually of Highest Peak
Demand
Peak
Shaving
Savings
Electricity
Demand
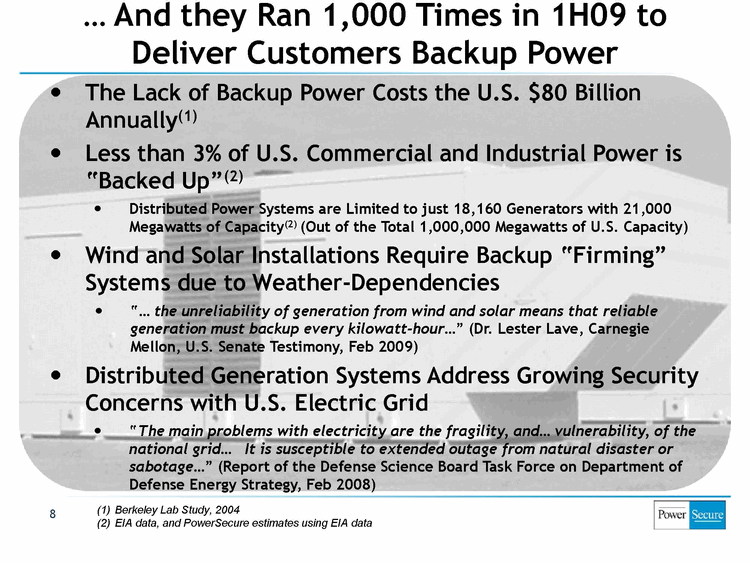
The Lack of Backup Power Costs the U.S. $80 Billion
Annually(1)
Less than 3% of U.S. Commercial and Industrial Power is
“Backed Up”(2)
Distributed Power Systems are Limited to just 18,160 Generators with 21,000
Megawatts of Capacity(2) (Out of the Total 1,000,000 Megawatts of U.S. Capacity)
Wind and Solar Installations Require Backup “Firming”
Systems due to Weather-Dependencies
“the unreliability of generation from wind and solar means that reliable
generation must backup every kilowatt-hour..” (Dr. Lester Lave, Carnegie
Mellon, U.S. Senate Testimony, Feb 2009)
Distributed Generation Systems Address Growing Security
Concerns with U.S. Electric Grid
“The main problems with electricity are the fragility, and... vulnerability, of the
national grid.. It is susceptible to extended outage from natural disaster or
sabotage...” (Report of the Defense Science Board Task Force on Department of
Defense Energy Strategy, Feb 2008)
And they Ran 1,000 Times in 1H09 to
Deliver Customers Backup Power
8 (1) Berkeley Lab Study, 2004
(2) EIA data, and PowerSecure estimates using EIA data
9
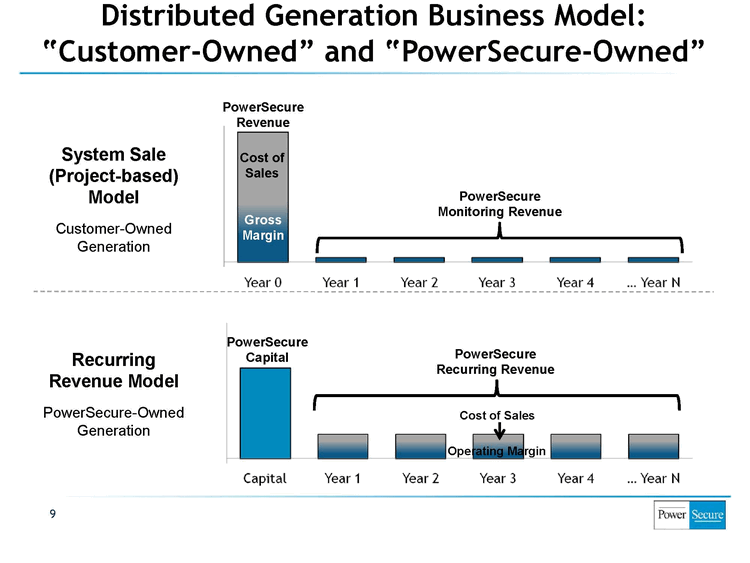
Recurring
Revenue Model
PowerSecure-Owned
Generation
PowerSecure
Monitoring Revenue
Distributed Generation Business Model:
“Customer-Owned” and “PowerSecure-Owned”
System Sale
(Project-based)
Model
Customer-Owned
Generation
PowerSecure
Recurring Revenue
PowerSecure
Revenue
Cost of
Sales
Gross
Margin
PowerSecure
Capital
Cost of Sales
Operating Margin
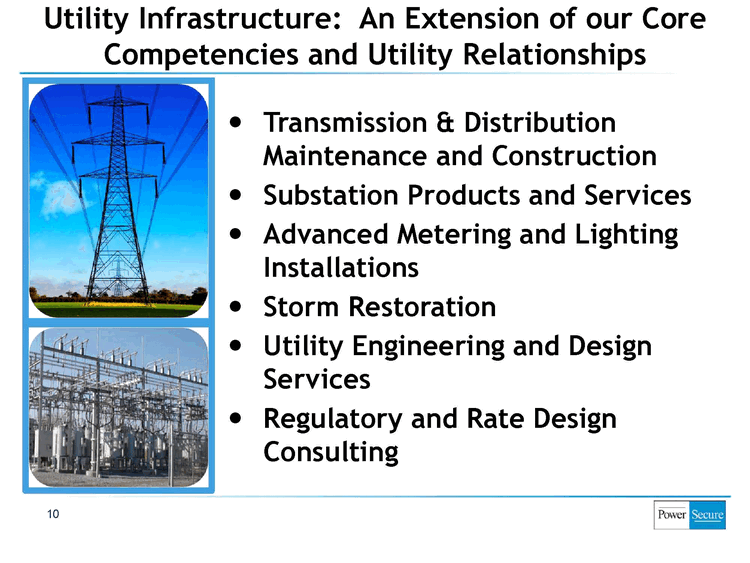
Utility Infrastructure: An Extension of our Core
Competencies and Utility Relationships
10
Transmission & Distribution
Maintenance and Construction
Substation Products and Services
Advanced Metering and Lighting
Installations
Storm Restoration
Utility Engineering and Design
Services
Regulatory and Rate Design
Consulting
Utility Infrastructure:
Business Progression and Growth
11
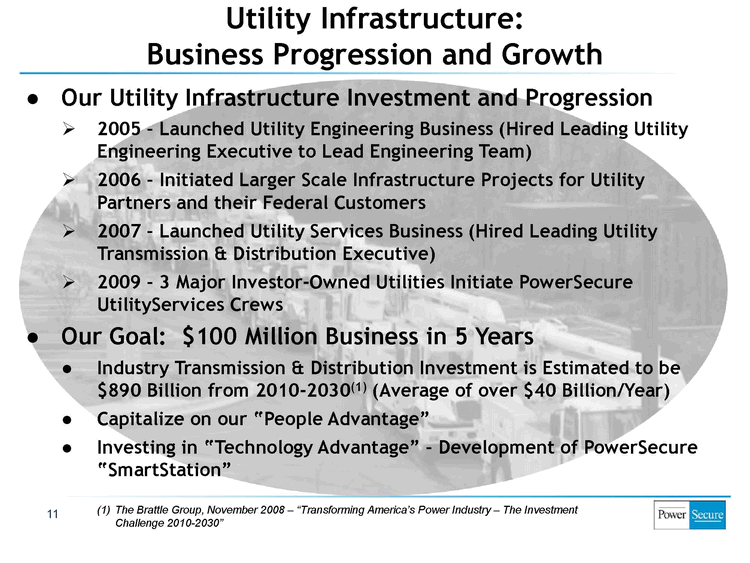
Our Utility Infrastructure Investment and Progression
2005 - Launched Utility Engineering Business (Hired Leading Utility
Engineering Executive to Lead Engineering Team)
2006 - Initiated Larger Scale Infrastructure Projects for Utility
Partners and their Federal Customers
2007 - Launched Utility Services Business (Hired Leading Utility
Transmission & Distribution Executive)
2009 - 3 Major Investor-Owned Utilities Initiate PowerSecure
UtilityServices Crews
Our Goal: $100 Million Business in 5 Years
Industry Transmission & Distribution Investment is Estimated to be
$890 Billion from 2010-2030(1) (Average of over $40 Billion/Year)
Capitalize on our “People Advantage”
Investing in “Technology Advantage” - Development of PowerSecure
“SmartStation”
(1) The Brattle Group, November 2008 - “Transforming America’s Power Industry - The Investment
Challenge 2010-2030”
Energy Efficiency: EfficientLights Extends our
National Account Relationships
12
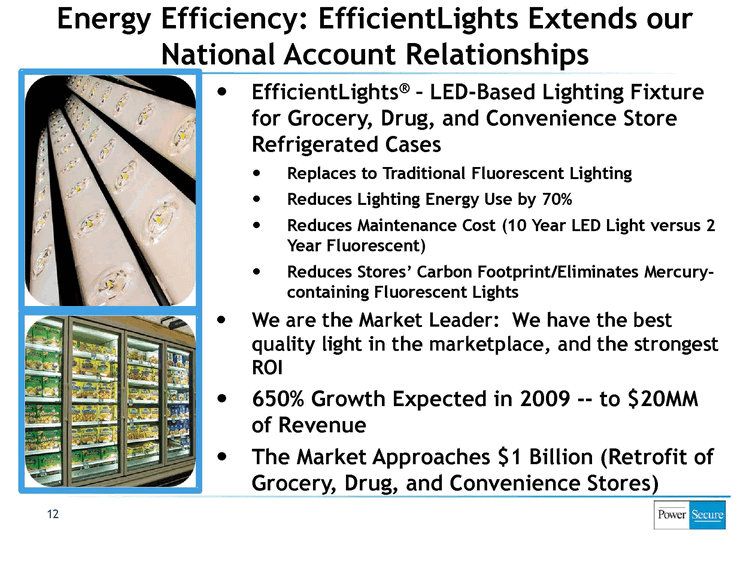
EfficientLights - LED-Based Lighting Fixture
for Grocery, Drug, and Convenience Store
Refrigerated Cases
Replaces to Traditional Fluorescent Lighting
Reduces Lighting Energy Use by 70%
Reduces Maintenance Cost (10 Year LED Light versus 2
Year Fluorescent)
Reduces Stores’ Carbon Footprint/Eliminates Mercurycontaining
Fluorescent Lights
We are the Market Leader: We have the best
quality light in the marketplace, and the strongest
ROI
650% Growth Expected in 2009 -- to $20MM
of Revenue
The Market Approaches $1 Billion (Retrofit of
Grocery, Drug, and Convenience Stores)
EfficientLights:
Business Progression and Growth
13
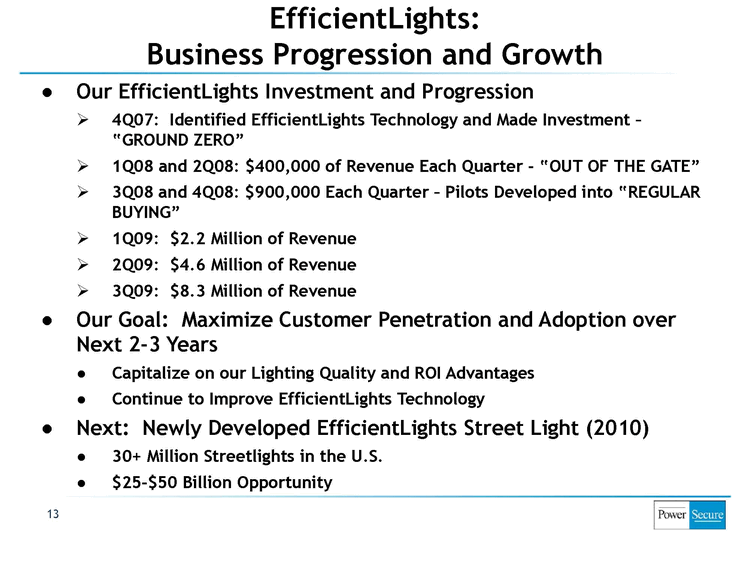
Our EfficientLights Investment and Progression
4Q07: Identified EfficientLights Technology and Made Investment -
“GROUND ZERO”
1Q08 and 2Q08: $400,000 of Revenue Each Quarter - “OUT OF THE GATE”
3Q08 and 4Q08: $900,000 Each Quarter - Pilots Developed into “REGULAR
BUYING”
1Q09: $2.2 Million of Revenue
2Q09: $4.6 Million of Revenue
3Q09: $8.3 Million of Revenue
Our Goal: Maximize Customer Penetration and Adoption over
Next 2-3 Years
Capitalize on our Lighting Quality and ROI Advantages
Continue to Improve EfficientLights Technology
Next: Newly Developed EfficientLights Street Light (2010)
30+ Million Streetlights in the U.S.
$25-$50 Billion Opportunity
14
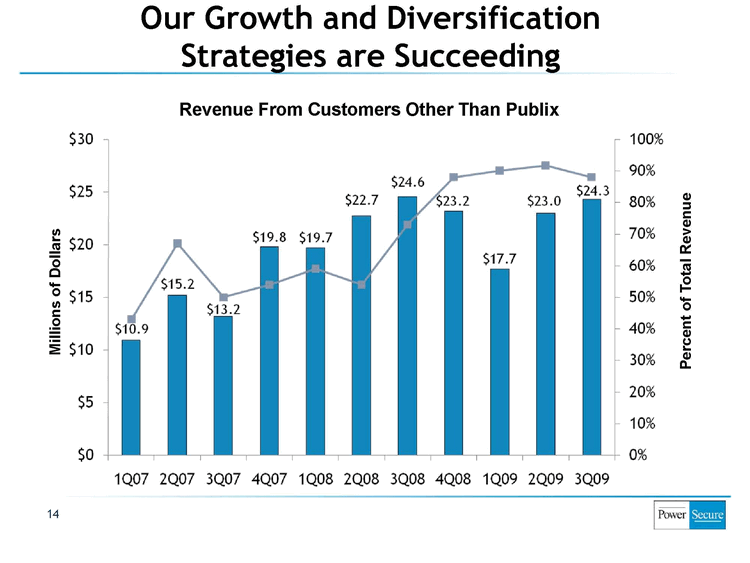
Revenue From Customers Other Than Publix
Millions of Dollars
Our Growth and Diversification
Strategies are Succeeding
Percent of Total Revenue

As Our Energy Solutions Deliver Value to a
Growing List of Utility Partners and Customers
15

NSADAQ: POWR
(919) 556 3056
www.PowerSecure.com
16
Questions?
Appendix
(Non-GAAP Measures)
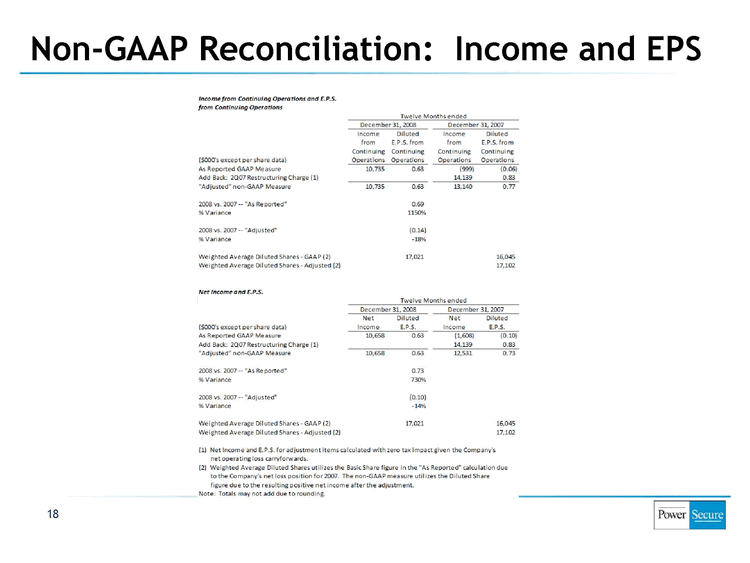
Non-GAAP Reconciliation: Income and EPS
Income from Continuing Operations and E.P.S.
from Continuing Operations
Twelve Months ended
December 31, 2008 December 31, 2007
Income Diluted Income Diluted
from E.P.S. from from E.P.S. from
Continuing Continuing Continuing Continuing
($000's except per share data) Operations Operations Operations Operations
As Reported GAAP Measure 10,735 0.63 (999) (0.0S)
Add Back: 2007 Restructuring Charge (1) 14,139 13,140 0.83
“Adjusted” non-GAAP Measure 10,735 0.63
0.77
2008 vs. 2007 -- "As Re ported" 0.69
% Variance 1150%
200S vs. 2007 -- “Adjusted” (0.14)
% Variance -18%
Weighted Average Diluted Shares -GAAP (2) 17.021 16,045
Weighted Average Diluted Shares -Adjusted (2) 17,102
Not Income and E.P.S.
Twelve Months ended
December 31, 2008 December 31, 2007
Net Diluted Net Diluted
($000's except per share data) Income E.P.S. Income E.P.S.
As Reported GAAP Measure 10,658 0.63 (1,608) (0.10)
Add Back: 2Q07 Restructuring Charge (1) 14,139 12,531 0.83
“Adjusted" non-GAAP Measure 10,058 0.63
0.73
200S vs. 2007 -- “As Re ported” 0 73
% Variance 730%
2008 vs. 2007 - “Adjusted” (0.10)
% Variance -14%
Weighted Average Diluted Shares -GAAP (2) 17,021 16,045
Weighted Average Diluted Shares -Adjusted (2) 17,102
(1) Net lncome and E. P.S.for adjustment items calculated with zero tax impact given the Comany’s net operating loss carryforwards.
(2) Weighted Average Diluted Shares utilizes the Basic Share figure in the “As Reported” calculation due
to the Company's net loss position for 2007. The non-GAAP measure util izes the Diluted Share figure due to
the resulting positive net income after the adjustment.
Note: Totals may not add due to rounding.
18
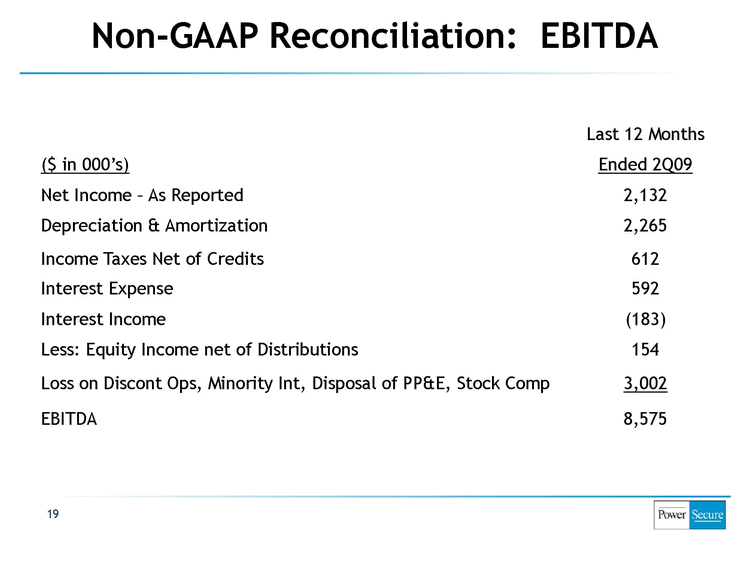
Non-GAAP Reconciliation: EBITDA
19
Last 12 Months
($ in 000’s) Ended 2Q09
Net Income - As Reported 2,132
Depreciation - Amortization 2,265
Income Taxes Net of Credits 612
Interest Expense 592
Interest Income (183)
Less: Equity Income net of Distributions 154
Loss on Discont Ops, Minority Int, Disposal of PP&E, Stock Comp 3,002
EBITDA 8,575
References by the Company to “Adjusted E.P.S.”, and the other “Adjusted” non-GAAP measures of income or loss from continuing
operations, net income, diluted E.P.S. from continuing operations, and diluted E.P.S. in this presentation constitute non-GAAP financial
measures. They refer to the Company's GAAP income or loss from continuing operations, net income, diluted E.P.S. from continuing
operations, and diluted E.P.S., excluding the following items $14.1 million restructuring costs incurred in the Company’s second quarter of
fiscal 2007. The Company believes providing non-GAAP measures which adjust for this item, which are not indicative of the results of the
Company's operations, are useful tools permitting management and the board of directors to measure, monitor and evaluate the Company's
operating performance and to make operating decisions. Non-GAAP Adjusted E.P.S. and the other “Adjusted” non-GAAP measures of income
or loss from continuing operations, net income, diluted E.P.S. from continuing operations, and diluted E.P.S. shown above are also used by
management to assist it in planning and forecasting future operations and making future operating decisions. The Company also believes
these non-GAAP measures provide meaningful information to investors in terms of enhancing their understanding of the Company's core
operating performance and results and allowing investors to more easily compare the Company's financial performance on an operating basis
in different fiscal periods, and also correspond more closely to investors and analyst’s estimates. However, these non-GAAP measures may
not be directly comparable to similarly defined measures as reported by other companies. “Adjusted E.P.S.”, and the other “Adjusted” non-
GAAP measures of income or loss from continuing operations, net income, diluted E.P.S. from continuing operations, and diluted E.P.S.
should be considered only as supplements to, and not as substitutes for or in isolation from, other measures of financial information
prepared in accordance with GAAP, such as GAAP net income, GAAP net income per share, GAAP income from continuing operations, or
GAAP income from continuing operations per share.
References by the Company to trailing 12-month EBITDA is a non-GAAP financial measure computed as income before interest and finance
charges, income taxes (net of tax credits), depreciation and amortization, equity income from minority interest (net of distributions),
interest income, loss on discontinued operations, loss on disposal of PP&E, and stock compensation expense. Management believes that this
EBITDA measure offers a useful tool to measure and monitor the Company's operating performance, and that this is enhanced by eliminating
the 2Q07 restructuring charge which is not indicative of the results of the Company's core operations. Management believes that this
measure provides meaningful information to investors by enhancing their understanding of the Company's core operating performance and
results, and it is also utilized by the Company’s lenders in their assessment of the Company’s performance and covenant compliance. EBITDA
is also used by management to assist in planning and forecasting future operations. However, EBITDA as defined by the Company may not be
directly comparable to similarly defined measures as reported by other companies. This non-GAAP measures should only be considered as
supplements to, and not as substitutes for or in isolation from, other measures of financial information
20
Non GAAP Measures
