Attached files
| file | filename |
|---|---|
| EX-31.1 - ARK RESTAURANTS CORP | c59798_ex31-1.htm |
| EX-32 - ARK RESTAURANTS CORP | c59798_ex32.htm |
| EX-31.2 - ARK RESTAURANTS CORP | c59798_ex31-2.htm |
| EX-23 - ARK RESTAURANTS CORP | c59798_ex23.htm |
| EX-21 - ARK RESTAURANTS CORP | c59798_ex21.htm |
UNITED STATES
SECURITIES AND EXCHANGE
COMMISSION
Washington, D.C. 20549
FORM 10-K
[X] ANNUAL REPORT PURSUANT TO SECTIONS 13 AND 15(d)
OF THE SECURITIES EXCHANGE ACT OF 1934
For the fiscal year ended October 3, 2009
or,
[ ] TRANSITION
REPORT PURSUANT TO SECTIONS 13 AND 15(d)
OF THE SECURITIES EXCHANGE ACT OF 1934
Commission File No. 1-09453
|
|
|
ARK RESTAURANTS CORP. |
|
(Exact Name of Registrant as Specified in Its Charter) |
|
|
|
|
|
New York |
|
13-3156768 |
|
|
||
|
(State or Other Jurisdiction of |
|
(IRS Employer Identification No.) |
|
Incorporation or Organization) |
|
|
|
|
|
|
85 Fifth Avenue, New York, NY |
10003 |
|
(Address of Principal Executive Offices) |
(Zip Code) |
Registrant’s telephone number, including area code: (212) 206-8800
Securities registered pursuant to section 12(b) of the Act:
None
Securities registered pursuant to Section 12(g) of the Act:
|
|
|
|
|
|
|
Title of each class |
|
Name of each exchange on which registered |
||
|
|
||||
|
Common Stock, par value $.01 per share |
|
The NASDAQ Stock Market LLC |
Indicate by check mark if the Registrant is a well-known seasoned issuer, as defined in Rule 405 of the Securities Act. Yes __ No X
Indicate by check mark if the Registrant is not required to file reports pursuant to Section 13 or Section 15(d) of the Act. Yes __ No X
Indicate by check mark whether the Registrant: (1) has filed all reports required to be filed by Section 13 or 15(d) of the Securities Exchange Act of 1934 during the preceding 12 months (or for such shorter period that the registrant was required to file such reports), and (2) has been subject to such filing requirements for the past 90 days. Yes X No __
Indicate by check mark whether the registrant has submitted electronically and posted on its corporate Website, if any, every Interactive Data File required to be submitted and posted pursuant to Rule 405 of Regulations S-T during the preceding 12 months (or for such shorter period that the registrant was required to submit and post such files). Yes __ No __
Indicate by check mark if disclosure of delinquent filers pursuant to Item 405 of Regulation S-K is not contained herein, and will not be contained, to the best of Registrant’s knowledge, in definitive proxy or information statements incorporated by reference in Part III of this Form 10-K or any amendments to this Form 10-K. [ x ]
Indicate by check mark whether the registrant is a large accelerated filer, an accelerated filer, a non-accelerated filer or a smaller reporting company. See definitions of “large accelerated filer,” “accelerated filer” and “smaller reporting company” in Rule 12b-2 of the Exchange Act.
|
|
|
|
Large accelerated filer ____ |
Accelerated filer _____ |
|
Non-accelerated filer ____ (Do not check if a smaller reporting company) |
Smaller Reporting Company X |
Indicate by check mark whether the Registrant is a shell company (as defined in Exchange Act Rule 12b-2). Yes __ No X
As of March 27, 2009, the last business day of the registrant’s most recently completed second fiscal quarter, the aggregate market value of voting and non-voting stock held by non-affiliates of the registrant was $19,244,632.
At December 28, 2009, there were outstanding 3,489,845 shares of the Registrant’s Common Stock, $.01 par value.
DOCUMENTS INCORPORATED BY REFERENCE
(1) In accordance with General Instruction G (3) of Form 10-K certain information required by Part III hereof will either be incorporated into this Form 10-K by reference to the registrant’s definitive proxy statement for the registrant’s 2009 Annual Meeting of Stockholders filed within 120 days of October 3, 2009 or will be included in an amendment to this Form 10-K filed within 120 days of October 3, 2009.
PART I
SPECIAL NOTE REGARDING FORWARD-LOOKING STATEMENTS
On one or more occasions, we may make statements in this Annual Report on Form 10-K regarding our assumptions, projections, expectations, targets, intentions or beliefs about future events. All statements, other than statements of historical facts, included or incorporated by reference herein relating to management’s current expectations of future financial performance, continued growth and changes in economic conditions or capital markets are forward looking statements within the meaning of Section 27A of the Securities Act of 1933 and Section 21E of the Securities Exchange Act of 1934.
Words or phrases such as “anticipates,” “believes,” “estimates,” “expects,” “intends,” “plans,” “predicts,” “projects,” “targets,” “will likely result,” “hopes,” “will continue” or similar expressions identify forward looking statements. Forward-looking statements involve risks and uncertainties which could cause actual results or outcomes to differ materially from those expressed. We caution that while we make such statements in good faith and we believe such statements are based on reasonable assumptions, including without limitation, management’s examination of historical operating trends, data contained in records and other data available from third parties, we cannot assure you that our projections will be achieved. Factors that may cause such differences include: economic conditions generally and in each of the markets in which we are located, the amount of sales contributed by new and existing restaurants, labor costs for our personnel, fluctuations in the cost of food products, adverse weather conditions, changes in consumer preferences and the level of competition from existing or new competitors.
We have attempted to identify, in context, certain of the factors that we believe may cause actual future experience and results to differ materially from our current expectation regarding the relevant matter of subject area. In addition to the items specifically discussed above, our business, results of operations and financial position and your investment in our common stock are subject to the risks and uncertainties described in “Item 1A Risk Factors” of this Annual Report on Form 10-K.
From time to time, oral or written forward-looking statements are also included in our reports on Forms 10-K, 10-Q and 8-K, our Schedule 14A, our press releases and other materials released to the public. Although we believe that at the time made, the expectations reflected in all of these forward-looking statements are and will be reasonable, any or all of the forward-looking statements in this Annual Report on Form 10-K, our reports on Forms 10-Q and 8-K, our Schedule 14A and any other public statements that are made by us may prove to be incorrect. This may occur as a result of inaccurate assumptions or as a consequence of known or unknown risks and uncertainties. Many factors discussed in this Annual Report on Form 10-K, certain of which are beyond our control, will be important in determining our future performance. Consequently, actual results may differ materially from those that might be anticipated from forward-looking statements. In light of these and other uncertainties, you should not regard the inclusion of a forward-looking statement in this Annual Report on Form 10-K or other public communications that we might make as a representation by us that our plans and objectives will be achieved, and you should not place undue reliance on such forward-looking statements.
We undertake no obligation to publicly update or revise any forward-looking statements, whether as a result of new information, future events or otherwise. However, your attention is directed to any further disclosures made on related subjects in our subsequent periodic reports filed with the Securities and Exchange Commission on Forms 10-Q and 8-K and Schedule 14A.
Unless the context requires otherwise, references to “we,” “us,” “our,” “ARKR” and the “Company” refer specifically to Ark Restaurants Corp. and its subsidiaries and predecessor entities.
3
|
|
|
|
Item 1. |
Business |
Overview
We are a New York corporation formed in 1983. As of the fiscal year ended October 3, 2009, we owned and/or operated 20 restaurants and bars, 30 fast food concepts and catering operations through our subsidiaries. Initially our facilities were located only in New York City. As of the fiscal year ended October 3, 2009, seven of our restaurant and bar facilities are located in New York City, four are located in Washington, D.C., five are located in Las Vegas, Nevada, two are located in Atlantic City, New Jersey, one is located at the Foxwoods Resort Casino in Ledyard, Connecticut and one is located in the Faneuil Hall Marketplace in Boston, Massachusetts.
In addition to the shift from a Manhattan-based operation to a multi-city operation, the nature of the facilities operated by us has shifted from smaller, neighborhood restaurants to larger, destination restaurants intended to benefit from high patron traffic attributable to the uniqueness of the restaurant’s location. Most of our restaurants which are in operation and which have been opened in recent years are of the latter description. As of the fiscal year ended October 3, 2009, these include the restaurant operations at the 12 fast food facilities in Tampa, Florida and Hollywood, Florida, respectively (2004); the Gallagher’s Steakhouse and Gallagher’s Burger Bar in the Resorts Atlantic City Hotel and Casino in Atlantic City, New Jersey (2005); The Grill at Two Trees at the Foxwoods Resort Casino in Ledyard, Connecticut (2006); Durgin Park Restaurant and the Black Horse Tavern in the Faneuil Hall Marketplace in Boston, Massachusetts (2007); Yolos, at the Planet Hollywood Resort and Casino (formerly known as the Aladdin Resort and Casino) in Las Vegas, Nevada (2007); and five fast food facilities at MGM Grand Casino at the Foxwoods Resort Casino in Ledyard, Connecticut (2008). Also in 2008, we entered into an agreement to lease space for the restaurant Robert at the Museum of Arts & Design at Columbus Circle in Manhattan.
The names and themes of each of our restaurants are different except for our two America restaurants, two Sequoia restaurants, two Gonzalez y Gonzalez restaurants and two Gallagher’s Steakhouse restaurants. The menus in our restaurants are extensive, offering a wide variety of high quality foods at generally moderate prices. The atmosphere at many of the restaurants is lively and extremely casual. Most of the restaurants have separate bar areas. A majority of our net sales are derived from dinner as opposed to lunch service. Most of the restaurants are open seven days a week and most serve lunch as well as dinner.
While decor differs from restaurant to restaurant, interiors are marked by distinctive architectural and design elements which often incorporate dramatic interior open spaces and extensive glass exteriors. The wall treatments, lighting and decorations are typically vivid, unusual and, in some cases, highly theatrical.
4
The following table sets forth the facilities we lease and operate as of October 3, 2009:
|
|
|
|
|
|
|
|
|
|
|
|
|
|
|
Name |
|
Location |
|
Year |
|
Restaurant Size |
|
Seating |
|
Lease Expiration(3) |
||
|
|
|
|
|
|
|
|
|
|
|
|
|
|
|
Gonzalez y |
|
Broadway |
|
1989 |
|
6,000 |
|
|
250 |
|
|
2009 |
|
|
|
|
|
|
|
|
|
|
|
|
|
|
|
America(5) |
|
Union Station |
|
1989 |
|
10,000 |
|
|
400 |
(50) |
|
2009 |
|
|
|
|
|
|
|
|
|
|
|
|
|
|
|
Center Café(5) |
|
Union Station |
|
1989 |
|
4,000 |
|
|
200 |
|
|
2009 |
|
|
|
|
|
|
|
|
|
|
|
|
|
|
|
Sequoia |
|
Washington Harbour |
|
1990 |
|
26,000 |
|
|
600 |
(400) |
|
2017 |
|
|
|
|
|
|
|
|
|
|
|
|
|
|
|
Sequoia |
|
South Street Seaport |
|
1991 |
|
12,000 |
|
|
300 |
(100) |
|
2010 |
|
|
|
|
|
|
|
|
|
|
|
|
|
|
|
Canyon Road |
|
First Avenue |
|
1984 |
|
2,500 |
|
|
130 |
|
|
2014 |
|
|
|
|
|
|
|
|
|
|
|
|
|
|
|
Bryant Park |
|
Bryant Park |
|
1995 |
|
25,000 |
|
|
180 |
(820) |
|
2025 |
|
|
|
|
|
|
|
|
|
|
|
|
|
|
|
America(7) |
|
New York-New York |
|
1997 |
|
20,000 |
|
|
450 |
|
|
2017 |
|
|
|
|
|
|
|
|
|
|
|
|
|
|
|
Gallagher’s Steakhouse(7) |
|
New York-New York |
|
1997 |
|
5,500 |
|
|
260 |
|
|
2023 |
|
|
|
|
|
|
|
|
|
|
|
|
|
|
|
Gonzalez y Gonzalez(7) |
|
New York-New York |
|
1997 |
|
2,000 |
|
|
120 |
|
|
2017 |
|
|
|
|
|
|
|
|
|
|
|
|
|
|
|
Village Eateries (7)(8) |
|
New York-New York |
|
1997 |
|
6,300 |
|
|
400 |
(*) |
|
2017 |
|
|
|
|
|
|
|
|
|
|
|
|
|
|
|
The Grill Room |
|
World Financial Center |
|
1997 |
|
10,000 |
|
|
250 |
|
|
2011 |
|
|
|
|
|
|
|
|
|
|
|
|
|
|
|
Red |
|
South Street Seaport |
|
1998 |
|
7,000 |
|
|
150 |
(150) |
|
2013 |
5
|
|
|
|
|
|
|
|
|
|
|
|
|
|
|
Name |
|
Location |
|
Year |
|
Restaurant Size |
|
Seating |
|
Lease Expiration(3) |
||
|
|
|
|
|
|
|
|
|
|
|
|
|
|
|
Thunder Grill |
|
Union Station |
|
1999 |
|
10,000 |
|
|
500 |
|
|
2019 |
|
|
|
|
|
|
|
|
|
|
|
|
|
|
|
Venetian Food Court(9) |
|
Venetian Casino Resort |
|
1999 |
|
3,980 |
|
|
300 |
(*) |
|
2014 |
|
|
|
|
|
|
|
|
|
|
|
|
|
|
|
V-Bar |
|
Venetian Casino Resort |
|
2000 |
|
3,000 |
|
|
100 |
|
|
2015 |
|
|
|
|
|
|
|
|
|
|
|
|
|
|
|
Gallagher’s Steakhouse |
|
Resorts Atlantic City |
|
2005 |
|
6,280 |
|
|
196 |
|
|
2020 |
|
|
|
|
|
|
|
|
|
|
|
|
|
|
|
Gallagher’s Burger Bar |
|
Resorts Atlantic City |
|
2005 |
|
2,270 |
|
|
114 |
|
|
2020 |
|
|
|
|
|
|
|
|
|
|
|
|
|
|
|
The Grill at Two Trees |
|
Two Trees Inn |
|
2006 |
|
3,359 |
|
|
101 |
|
|
2026 |
|
|
|
|
|
|
|
|
|
|
|
|
|
|
|
Durgin Park Restaurant and the Black Horse Tavern |
|
Faneuil Hall Marketplace |
|
2007 |
|
7,000 |
|
|
500 |
|
|
2032 |
|
|
|
|
|
|
|
|
|
|
|
|
|
|
|
Yolos |
|
Planet Hollywood |
|
2007 |
|
4,100 |
|
|
206 |
|
|
2027 |
|
|
|
|
|
|
(1) |
Restaurants are, from time to time, renovated, renamed and/or converted from or to managed or owned facilities. “Year Opened” refers to the year in which we, or an affiliated predecessor of us, first opened, acquired or began managing a restaurant at the applicable location, notwithstanding that the restaurant may have been renovated, renamed and/or converted from or to a managed or owned facility since that date. |
|
|
|
|
(2) |
Seating capacity refers to the seating capacity of the indoor part of a restaurant available for dining in all seasons and weather conditions. Outdoor seating capacity, if applicable, is set forth in parentheses and refers to the seating capacity of terraces and sidewalk cafes which are available for dining only in the warm seasons and then only in clement weather. |
|
|
|
|
(3) |
Assumes the exercise of all our available lease renewal options. |
|
|
|
|
(4) |
The lease for this location expires December 31, 2009. It is anticipated that this location will remain open on a month-to-month basis with the consent of the landlord for this facility. |
6
|
|
|
|
(5) |
The leases for these locations expired prior to October 3, 2009 and have been operating on a month-to-month basis with the consent of the landlord for these facilities. |
|
|
|
|
(6) |
The lease governing a substantial portion of the outside seating area of this restaurant expires on April 30, 2012. |
|
|
|
|
(7) |
Includes two five-year renewal options exercisable by us if certain sales goals are achieved during the two year period prior to the exercise of the renewal option. Under the America lease, the sales goal is $6.0 million. Under the Gallagher’s Steakhouse lease the sales goal is $3.0 million. Under the lease for Gonzalez y Gonzalez and the Village Eateries, the combined sales goal is $10.0 million. Each of the restaurants is currently operating at a level in excess of the minimum sales level required to exercise the renewal option for each respective restaurant. |
|
|
|
|
(8) |
We operate eight small food court restaurants in the Village Eateries food court at the New York-New York Hotel & Casino. We also operate that hotel’s room service, banquet facilities and employee cafeteria. |
|
|
|
|
(9) |
We operate three small food court restaurants in a food court at the Venetian Casino Resort. |
|
|
|
|
(*) |
Represents common area seating. |
The following table sets forth the facilities managed by us as of October 3, 2009:
|
|
|
|
|
|
|
|
|
|
|
|
|
|
|
Name |
|
Location |
|
Year |
|
Restaurant Size |
|
Seating |
|
Lease Expiration(3) |
||
|
|
|
|
|
|
|
|
|
|
|
|
|
|
|
El Rio Grande |
|
Third Avenue |
|
1987 |
|
4,000 |
|
|
160 |
|
|
2019 |
|
|
|
|
|
|
|
|
|
|
|
|
|
|
|
Tampa Food |
|
Hard Rock Hotel and |
|
2004 |
|
4,000 |
|
|
250 |
(*) |
|
2029 |
|
|
|
|
|
|
|
|
|
|
|
|
|
|
|
Hollywood |
|
Hard Rock Hotel and |
|
2004 |
|
5,000 |
|
|
250 |
(*) |
|
2029 |
|
|
|
|
|
|
|
|
|
|
|
|
|
|
|
Lucky Seven(6) |
|
Foxwoods Resort |
|
2006 |
|
4,825 |
|
|
4,000 |
(**) |
|
2026 |
|
|
|
|
|
|
|
|
|
|
|
|
|
|
|
MGM Grand |
|
MGM Grand at |
|
2008 |
|
8,300 |
|
|
256 |
(84)(*) |
|
2028 |
|
|
|
|
|
|
(1) |
Restaurants are, from time to time, renovated, renamed and/or converted from or to managed or owned facilities. “Year Opened” refers to the year in which we, or an affiliated predecessor of us, first opened, |
7
|
|
|
|
|
acquired or began managing a restaurant at the applicable location, notwithstanding that the restaurant may have been renovated, renamed and/or converted from or to a managed or owned facility since that date. |
|
|
|
|
(2) |
Seating capacity refers to the seating capacity of the indoor part of a restaurant available for dining in all seasons and weather conditions. Outdoor seating capacity, if applicable, is set forth in parentheses and refers to the seating capacity of terraces and sidewalk cafes which are available for dining only in the warm seasons and then only in clement weather. |
|
|
|
|
(3) |
Assumes the exercise of all our available lease renewal options. |
|
|
|
|
(4) |
Management fees earned are based on a percentage of cash flow of the restaurant. |
|
|
|
|
(5) |
We own a 19% interest in the partnership that owns El Rio Grande. |
|
|
|
|
(6) |
Management fees earned are based on a percentage of gross sales of the restaurant. |
|
|
|
|
(7) |
We own a 67% interest in the partnership that owns the MGM Grand Food Market. |
|
|
|
|
(*) |
Represents common area seating. |
|
|
|
|
(**) |
Represents number of seats in the Bingo Hall. |
Revenues from facilities managed by us are not included in our consolidated sales, with the exception of El Rio Grande and the MGM Grand Food Market which are consolidated and are included in our financial statements.
Restaurant Expansion
During the fiscal year ended October 3, 2009, we began construction of the restaurant Robert at the Museum of Arts & Design at Columbus Circle in Manhattan. This restaurant opened on December 15, 2009. We are the majority owner and managing member of the limited liability company which operates this restaurant.
The opening of a new restaurant is invariably accompanied by substantial pre-opening expenses and early operating losses associated with the training of personnel, excess kitchen costs, costs of supervision and other expenses during the pre-opening period and during a post-opening “shake out” period until operations can be considered to be functioning normally. The amount of such pre-opening expenses and early operating losses can generally be expected to depend upon the size and complexity of the facility being opened. We incurred $15,000 in pre-opening expenses in fiscal 2009, which is the cumulative total pre-opening expenses of this restaurant for the 2009 fiscal year.
Our restaurants generally do not achieve substantial increases in revenue from year to year, which we consider to be typical of the restaurant industry. To achieve significant increases in revenue or to replace revenue of restaurants that lose customer favor or which close because of lease expirations or other reasons, we would have to open additional restaurant facilities or expand existing restaurants. There can be no assurance that a restaurant will be successful after it is opened, particularly since in many instances we do not operate our new restaurants under a trade name currently used by us, thereby requiring new restaurants to establish their own identity.
8
Leases
Apart from these agreements, we are not currently committed to any projects. We may take advantage of opportunities we consider to be favorable, when they occur, depending upon the availability of financing and other factors.
Recent Restaurant Dispositions and Charges
During the first fiscal quarter of 2008, we discontinued the operation of our Columbus Bakery retail and wholesale bakery located in New York City. Columbus Bakery was originally intended to serve as the bakery that would provide all of our New York restaurants with baked goods as well as being a retail bakery operation. As a result of the sale and closure of several of our restaurants in New York City during the last several years, this bakery operation was no longer profitable. During the second fiscal quarter of 2008 we opened, along with certain third party investors, a new concept at this location called “Pinch & S’Mac” which features pizza and macaroni and cheese. We contributed Columbus Bakery’s net fixed assets and cash into this venture and received an ownership interest of 37.5%. These operations are not consolidated in the Company’s financial statements.
Effective June 30, 2008, the lease for our Stage Deli facility at the Forum Shops in Las Vegas, Nevada expired. The landlord for this facility offered to renew the lease at this location prior to its expiration at a significantly increased rent. The Company determined that it would not be able to operate this facility profitably at this location at the rent offered in the landlord’s renewal proposal. As a result, the Company discontinued these operations during the third fiscal quarter of 2008 and took a charge for the impairment of goodwill of $294,000 and a loss on disposal of $19,000. The impairment charge and disposal loss are included in discontinued operations.
Restaurant Management
Each restaurant is managed by its own manager and has its own chef. Food products and other supplies are purchased primarily from various unaffiliated suppliers, in most cases by our headquarters’ personnel. Our Columbus Bakery in Las Vegas supplies bakery products to most of our Las Vegas restaurants in addition to operating a wholesale bakery. Each of our restaurants has two or more assistant managers and sous chefs (assistant chefs). Financial and management control is maintained at the corporate level through the use of automated systems that include centralized accounting and reporting.
Purchasing and Distribution
We strive to obtain quality menu ingredients, raw materials and other supplies and services for our operations from reliable sources at competitive prices. Substantially all menu items are prepared on each restaurant’s premises daily from scratch, using fresh ingredients. Each restaurant’s management determines the quantities of food and supplies required and orders the items from local, regional and national suppliers on terms negotiated by our centralized purchasing staff. Restaurant-level inventories are maintained at a minimum dollar-value level in relation to sales due to the relatively rapid turnover of the perishable produce, poultry, meat, fish and dairy commodities that are used in operations.
We attempt to negotiate short-term and long-term supply agreements depending on market conditions and expected demand. However, we do not contract for long periods of time for our fresh commodities such as produce, poultry, meat, fish and dairy items and, consequently, such commodities can be subject to unforeseen supply and cost fluctuations. Independent foodservice distributors deliver most food and supply items daily to restaurants. The financial impact of such supply agreements would not have a material adverse effect on our financial position.
9
Employees
At December 16, 2009, we employed 1,856 persons (including employees at managed facilities), 1,374 of whom were full-time employees, 482 of whom were part-time employees, 31 of whom were headquarters personnel, 180 of whom were restaurant management personnel, 506 of whom were kitchen personnel and 1,098 of whom were restaurant service personnel. A number of our restaurant service personnel are employed on a part-time basis. Changes in minimum wage levels may affect our labor costs and the restaurant industry generally because a large percentage of restaurant personnel are paid at or slightly above the minimum wage. Our employees are not covered by a collective bargaining agreement.
Government Regulation
We are subject to various federal, state and local laws affecting our business. Each restaurant is subject to licensing and regulation by a number of governmental authorities that may include alcoholic beverage control, health, sanitation, environmental, zoning and public safety agencies in the state or municipality in which the restaurant is located. Difficulties in obtaining or failures to obtain the required licenses or approvals could delay or prevent the development and openings of new restaurants, or could disrupt the operations of existing restaurants.
Alcoholic beverage control regulations require each of our restaurants to apply to a state authority and, in certain locations, county and municipal authorities for licenses and permits to sell alcoholic beverages on the premises. Typically, licenses must be renewed annually and may be subject to penalties, temporary suspension or revocation for cause at any time. Alcoholic beverage control regulations impact many aspects of the daily operations of our restaurants, including the minimum ages of patrons and employees consuming or serving such beverages; employee alcoholic beverages training and certification requirements; hours of operation; advertising; wholesale purchasing and inventory control of such beverages; seating of minors and the service of food within our bar areas; and the storage and dispensing of alcoholic beverages. State and local authorities in many jurisdictions routinely monitor compliance with alcoholic beverage laws. The failure to receive or retain, or a delay in obtaining, a liquor license for a particular restaurant could adversely affect our ability to obtain such licenses in jurisdictions where the failure to receive or retain, or a delay in obtaining, a liquor license occurred.
We are subject to “dram-shop” statutes in most of the states in which we have operations, which generally provide a person injured by an intoxicated person the right to recover damages from an establishment that wrongfully served alcoholic beverages to such person. We carry liquor liability coverage as part of our existing comprehensive general liability insurance. A settlement or judgment against us under a “dram-shop” statute in excess of liability coverage could have a material adverse effect on our operations.
Various federal and state labor laws govern our operations and our relationship with employees, including such matters as minimum wages, breaks, overtime, fringe benefits, safety, working conditions and citizenship requirements. We are also subject to the regulations of the Immigration and Naturalization Service (INS). If our employees do not meet federal citizenship or residency requirements, this could lead to a disruption in our work force. Significant government-imposed increases in minimum wages, paid leaves of absence and mandated health benefits, or increased tax reporting, assessment or payment requirements related to employees who receive gratuities could be detrimental to our profitability.
Our facilities must comply with the applicable requirements of the Americans With Disabilities Act of 1990 (“ADA”) and related state statutes. The ADA prohibits discrimination on the basis of disability with
10
respect to public accommodations and employment. Under the ADA and related state laws, when constructing new restaurants or undertaking significant remodeling of existing restaurants, we must make them more readily accessible to disabled persons.
The New York State Liquor Authority must approve any transaction in which a shareholder of the licensee increases his holdings to 10% or more of the outstanding capital stock of the licensee and any transaction involving 10% or more of the outstanding capital stock of the licensee.
Seasonal Nature Of Business
Our business is highly seasonal. The second quarter of our fiscal year, consisting of the non-holiday portion of the cold weather season in New York and Washington (January, February and March), is the poorest performing quarter. We achieve our best results during the warm weather, attributable to our extensive outdoor dining availability, particularly at Bryant Park in New York and Sequoia in Washington, D.C. (our largest restaurants) and our outdoor cafes. However, even during summer months these facilities can be adversely affected by unusually cool or rainy weather conditions. Our facilities in Las Vegas generally operate on a more consistent basis through the year.
Terrorism and International Unrest
The terrorist attacks on the World Trade Center in New York and the Pentagon in Washington, D.C. on September 11, 2001 had a material adverse effect on our revenues. As a result of the attacks, one of our restaurants, The Grill Room, located at 2 World Financial Center, which is adjacent to the World Trade Center, experienced some damage. The Grill Room was closed from September 11, 2001 and reopened in early December 2002.
Our restaurants in New York, Las Vegas, Washington D.C. and Florida benefit from tourist traffic. Though the Las Vegas market has shown resiliency, the sluggish economy and the lingering effects of September 11, 2001 have had an adverse effect on our restaurants. Recovery depends upon a general improvement in economic conditions and the public’s willingness and inclination to resume vacation and convention travel. Additional acts of terrorism in the United States or substantial international unrest may have a material adverse effect on our business and revenues.
|
|
|
|
Item 1A. |
Risk Factors. |
The following are the most significant risk factors applicable to us:
RISKS RELATED TO OUR BUSINESS
The recent disruptions in the overall economy and the financial markets may adversely impact our business.
The restaurant industry has been affected by current economic factors, including the deterioration of national, regional and local economic conditions, declines in employment levels, and shifts in consumer spending patterns. The recent disruptions in the overall economy and volatility in the financial markets have reduced, and may continue to reduce, consumer confidence in the economy, negatively affecting consumer restaurant spending, which could be harmful to our financial position and results of operations. As a result, decreased cash flow generated from our business may adversely affect our financial position and our ability to fund our operations. In addition, macro economic disruptions, as well as the
11
restructuring of various commercial and investment banking organizations, could adversely affect our ability to access the credit markets. The disruption in the credit markets may also adversely affect the availability of financing for our expansions and operations, and could impact our vendors’ ability to meet supply requirements. There can be no assurance that government responses to the disruptions in the financial markets will restore consumer confidence, stabilize the markets, or increase liquidity and the availability of credit.
Failure of our restaurants to achieve expected results could have a negative impact on our revenues and performance results.
Performance results currently achieved by our restaurants may not be indicative of longer term performance or the potential market acceptance of restaurants in new locations. We cannot be assured that new restaurants that we open will have similar operating results as existing restaurants. New restaurants take several months to reach expected operating levels due to inefficiencies typically associated with new restaurants, including lack of market awareness, inability to hire sufficient staff and other factors. The failure of our existing or new restaurants to perform as predicted could negatively impact our revenues and results of operations.
Our unfamiliarity with new markets may present risks, which could have a material adverse effect on our future growth and profitability.
Due to higher operating costs caused by temporary inefficiencies typically associated with expanding into new regions and opening new restaurants, such as lack of market awareness and acceptance and limited availability of experienced staff, continued expansion may result in an increase in our operating costs. New markets may have different competitive conditions, consumer tastes and discretionary spending patterns than our existing markets, which may cause our restaurants in these new markets to be less successful than our restaurants in our existing markets. We cannot assure you that restaurants in new markets will be successful.
Our ability to open new restaurants efficiently is subject to a number of factors beyond our control, including:
|
|
|
|
|
-- Selection and availability of suitable restaurant sites; |
|
|
|
|
|
-- Negotiation of acceptable lease or purchase terms for such sites; |
|
|
|
|
|
-- Negotiation of reasonable construction contracts and adequate supervision of construction; |
|
|
|
|
|
-- Our ability to secure required governmental permits and approvals for both construction and operation; |
|
|
|
|
|
-- Availability of adequate capital; |
|
|
|
|
|
-- General economic conditions; and |
|
|
|
|
|
-- Adverse weather conditions. |
We may not be successful in addressing these factors, which could adversely affect our ability to open new restaurants on a timely basis, or at all. Delays in opening or failures to open new restaurants could cause our business, results of operations and financial condition to suffer.
Terrorism and war may have material adverse effect on our business.
Terrorist attacks, such as the attacks that occurred in New York and Washington, D.C. on September 11, 2001, and other acts of violence or war in the United States or abroad, may affect the markets in which we operate and our business, results of operations and financial conditions. The potential near-term and long-
12
term effects these events may have on our business operations, our customers, the markets in which we operate and the economy is uncertain. Because the consequences of any terrorist attacks, or any armed conflicts, are unpredictable, we may not be able to foresee events that could have an adverse effect on our markets or our business.
Increases in the minimum wage may have a material adverse effect on our business and financial results.
Many of our employees are subject to various minimum wage requirements. Many of our restaurants are located in states where the minimum wage was recently increased. There likely will be additional increases implemented in jurisdictions in which we operate or seek to operate. These minimum wage increases may have a material adverse effect on our business, financial condition, results of operations or cash flows.
Future changes in financial accounting standards may cause adverse unexpected operating results and affect our reported results of operations.
Changes in accounting standards can have a significant effect on our reported results and may affect our reporting of transactions completed before the change is effective. New pronouncements and varying interpretations of pronouncements have occurred and may occur in the future.
Changes to existing rules or differing interpretations with respect to our current practices may adversely affect our reported financial results.
Rising insurance costs could negatively impact profitability.
The cost of insurance (workers compensation insurance, general liability insurance, property insurance, health insurance and directors and officers liability insurance) has risen significantly over the past few years and is expected to continue to increase. These increases, as well as potential state legislation requirements for employers to provide health insurance to employees, could have a negative impact on our profitability if we are not able to negate the effect of such increases with plan modifications and cost control measures or by continuing to improve our operating efficiencies.
Compliance with existing and new regulations of corporate governance and public disclosure may result in additional expenses.
Compliance with changing laws, regulations and standards relating to corporate governance and public disclosure, including the Sarbanes-Oxley Act of 2002, new SEC regulations and NASDAQ Stock Market rules, has required an increased amount of management attention and external resources. We are committed to maintaining high standards of corporate governance and public disclosure. This investment required to comply with these changing regulations may result in increased general and administrative expenses and a diversion of management time and attention from revenue-generating activities to compliance activities.
Intense competition in the restaurant industry could prevent us from increasing or sustaining our revenues and profitability.
The restaurant industry is intensely competitive with respect to food quality, price-value relationships, ambiance, service and location, and many restaurants compete with us at each of our locations. There are a number of well-established competitors with substantially greater financial, marketing, personnel and
13
other resources than ours, and many of our competitors are well established in the markets where we have restaurants, or in which we intend to locate restaurants. Additionally, other companies may develop restaurants that operate with similar concepts.
Any inability to successfully compete with the other restaurants in our markets will prevent us from increasing or sustaining our revenues and profitability and result in a material adverse effect on our business, financial condition, results of operations or cash flows. We may also need to modify or refine elements of our restaurant system to evolve our concepts in order to compete with popular new restaurant formats or concepts that may develop in the future. We cannot assure you that we will be successful in implementing these modifications or that these modifications will not reduce our profitability.
Our profitability is dependent in large measure on food, beverage and supply costs which are not within our control.
Our profitability is dependent in large measure on our ability to anticipate and react to changes in food, beverage and supply costs. Various factors beyond our control, including climatic changes and government regulations, may affect food and beverage costs. Specifically, our dependence on frequent, timely deliveries of fresh beef, poultry, seafood and produce subjects us to the risks of possible shortages or interruptions in supply caused by adverse weather or other conditions, which could adversely affect the availability and cost of any such items. We cannot assure you that we will be able to anticipate or react to increasing food and supply costs in the future. The failure to react to these increases could materially and adversely affect our business, results of operations and financial condition.
The restaurant industry is affected by changes in consumer preferences and discretionary spending patterns that could result in a reduction in our revenues.
Consumer preferences could be affected by health concerns or by specific events such as the outbreak of or scare caused by “mad cow disease”, the popularity of the Atkins diet and the South Beach diet and changes in consumer preferences, such as “carb consciousness”. If we were to have to modify our restaurants’ menus, we may lose customers who would be less satisfied with a modified menu, and we may not be able to attract a new customer base to generate the necessary revenues to maintain our income from restaurant operations. A change in our menus may also result in us having different competitors. We may not be able to successfully compete against established competitors in the general restaurant market. Our success also depends on various factors affecting discretionary consumer spending, including economic conditions, disposable consumer income, consumer confidence and the United States participation in military activities. Adverse changes in these factors could reduce our customer base and spending patterns, either of which could reduce our revenues and results of operations.
Our geographic concentrations could have a material adverse effect on our business, results of operations and financial condition.
We currently operate in seven regions, New York City, Washington, D.C., Las Vegas, Nevada, Tampa and Hollywood, Florida, Atlantic City, New Jersey, Ledyard, Connecticut, and Boston, Massachusetts and our Las Vegas, Florida, Atlantic City, and Connecticut operations are all located in casinos. As a result, we are particularly susceptible to adverse trends and economic conditions in these markets, including its labor market, and the casino market in general, which could have a negative impact on our profitability as a whole. In addition, given our geographic concentration, negative publicity regarding any of our restaurants could have a material adverse effect on our business, results of operations and financial condition, as could other regional occurrences such as acts of terrorism, local strikes, natural disasters or changes in laws or regulations.
14
Our operating results may fluctuate significantly due to seasonality and other factors beyond our control.
Our business is subject to seasonal fluctuations, which may vary greatly depending upon the region of the United States in which a particular restaurant is located. In addition to seasonality, our quarterly and annual operating results and comparable unit sales may fluctuate significantly as a result of a variety of factors, including:
|
|
|
|
|
-- The amount of sales contributed by new and existing restaurants; |
|
|
|
|
|
-- The timing of new openings; |
|
|
|
|
|
-- Increases in the cost of key food or beverage products; |
|
|
|
|
|
-- Labor costs for our personnel; |
|
|
|
|
|
-- Our ability to achieve and sustain profitability on a quarterly or annual basis; |
|
|
|
|
|
-- Adverse weather; |
|
|
|
|
|
-- Consumer confidence and changes in consumer preferences; |
|
|
|
|
|
-- Health concerns, including adverse publicity concerning food-related illness; |
|
|
|
|
|
-- The level of competition from existing or new competitors; |
|
|
|
|
|
-- Economic conditions generally and in each of the market in which we are located; and |
|
|
|
|
|
-- Acceptance of a new or modified concept in each of the new markets in which we could be located. |
These fluctuations make it difficult for us to predict and address in a timely manner factors that may have a negative impact on our business, results of operations and financial condition.
Any expansion may strain our infrastructure, which could slow restaurant development.
Any expansion may place a strain on our management systems, financial controls, and information systems. To manage growth effectively, we must maintain the high level of quality and service at our existing and future restaurants. We must also continue to enhance our operational, information, financial and management systems and locate, hire, train and retain qualified personnel, particularly restaurant managers. We cannot predict whether we will be able to respond on a timely basis to all of the changing demands that any expansion will impose on management and those systems and controls. If we are not able to effectively manage any one or more of these or other aspects of expansion, our business, results of operations and financial condition could be materially adversely affected.
Our inability to retain key personnel could negatively impact our business.
Our success will continue to be highly dependent on our key operating officers and employees. We must continue to attract, retain and motivate a sufficient number of qualified management and operating personnel, including general managers and chefs. The ability of these key personnel to maintain consistency in the quality and atmosphere of our restaurants is a critical factor in our success. Any failure to do so may harm our reputation and result in a loss of business.
We could face labor shortages, increased labor costs and other adverse effects of varying labor conditions.
The development and success of our restaurants depend, in large part, on the efforts, abilities, experience and reputations of the general managers and chefs at such restaurants. In addition, our success depends in part upon our ability to attract, motivate and retain a sufficient number of qualified employees, including restaurant managers, kitchen staff and wait staff. Qualified individuals needed to fill these positions are in short supply and the inability to recruit and retain such individuals may delay the planned openings of
15
new restaurants or result in high employee turnover in existing restaurants. A significant delay in finding qualified employees or high turnover of existing employees could materially and adversely affect our business, results of operations and financial condition. Also, competition for qualified employees could require us to pay higher wages to attract sufficient qualified employees, which could result in higher, labor costs. In addition, increases in the minimum hourly wage, employment tax rates and levies, related benefits costs, including health insurance, and similar matters over which we have no control may increase our operating costs.
Unanticipated costs or delays in the development or construction of future restaurants could prevent our timely and cost-effective opening of new restaurants.
We depend on contractors and real estate developers to construct our restaurants. Many factors may adversely affect the cost and time associated with the development and construction of our restaurants, including:
|
|
|
|
|
-- Labor disputes; |
|
|
|
|
|
-- Shortages of materials or skilled labor; |
|
|
|
|
|
-- Adverse weather conditions; |
|
|
|
|
|
-- Unforeseen engineering problems; |
|
|
|
|
|
-- Environmental problems; |
|
|
|
|
|
-- Construction or zoning problems; |
|
|
|
|
|
-- Local government regulations; |
|
|
|
|
|
-- Modifications in design; and |
|
|
|
|
|
-- Other unanticipated increases in costs. |
Any of these factors could give rise to delays or cost overruns, which may prevent us from developing additional restaurants within our anticipated budgets or time periods or at all. Any such failure could cause our business, results of operations and financial condition to suffer.
We may not be able to obtain and maintain necessary federal, state and local permits which could delay or prevent the opening of future restaurants.
Our business is subject to extensive federal, state and local government regulations, including regulations relating to:
|
|
|
|
|
-- Alcoholic beverage control; |
|
|
|
|
|
-- The purchase, preparation and sale of food; |
|
|
|
|
|
-- Public health and safety; |
|
|
|
|
|
-- Sanitation, building, zoning and fire codes; and |
|
|
|
|
|
-- Employment and related tax matters. |
All of these regulations impact not only our current operations but also our ability to open future restaurants. We will be required to comply with applicable state and local regulations in new locations into which we expand. Any difficulties, delays or failures in obtaining licenses, permits or approvals in such new locations could delay or prevent the opening of a restaurant in a particular area or reduce operations at an existing location, either of which would materially and adversely affect our business, results of operations and financial condition.
16
The restaurant industry is affected by litigation and publicity concerning food quality, health and other issues, which can cause guests to avoid our restaurants and result in liabilities.
Health concerns, including adverse publicity concerning food-related illness, although not specifically related to our restaurants, could cause guests to avoid our restaurants, which would have a negative impact on our sales. We may also be the subject of complaints or litigation from guests alleging food-related illness, injuries suffered on the premises or other food quality, health or operational concerns. A lawsuit or claim could result in an adverse decision against us that could have a material adverse effect on our business and results of operations. We may also be subject to litigation which, regardless of the outcome, could result in adverse publicity. Adverse publicity resulting from such allegations may materially adversely affect us and our restaurants, regardless of whether such allegations are true or whether we are ultimately held liable. Such litigation, adverse publicity or damages could have a material adverse effect on our competitive position, business, results of operations and financial condition and results of operations.
Many of our operations are located in casinos and much of our success will be dependent on the success of those casinos.
The success of the business of our restaurants located in Las Vegas, Nevada, Atlantic City, New Jersey, Tampa and Hollywood, Florida, and Ledyard, Connecticut will be substantially dependent on the success of the casinos in which the company operates in these locations to attract customers for themselves and for our restaurants. The successful operation of the casinos in these locations is subject to various risks and uncertainties including:
|
|
|
|
|
|
-- |
The risk associated with governmental approvals of gaming; |
|
|
|
|
|
|
-- |
The risk of a change in laws regulating gaming operations; |
|
|
|
|
|
|
-- |
Operating in a limited market; |
|
|
|
|
|
|
-- |
Competitive risks relating to casino operations; and |
|
|
|
|
|
|
-- |
Risks of terrorism and war. |
RISKS RELATED TO OUR COMMON STOCK
The fact that a relatively small number of investors hold our publicly traded common stock could cause our stock price to fluctuate.
The market price of our common stock could fluctuate as a result of sales by our existing stockholders of a large number of shares of our common stock in the market or the perception that such sales could occur. A large number of shares of our common stock is concentrated in the hands of a small number of individual and institutional investors and is thinly traded. An attempt to sell by a large holder could adversely affect the price of our stock.
Ownership of a substantial majority of our outstanding common stock by a limited number of stockholders will limit your ability to influence corporate matters.
A substantial majority of our capital stock is held by a limited number of stockholders. Accordingly, such stockholders will likely have a strong influence on major decisions of corporate policy, and the outcome of any major transaction or other matters submitted to our stockholders or board of directors, including potential mergers or acquisitions, and amendments to our Amended and Restated Certificate of
17
Incorporation. Stockholders other than these principal stockholders are therefore likely to have little influence on decisions regarding such matters.
The price of our common stock may fluctuate significantly.
The price at which our common stock will trade may fluctuate significantly. The stock market has from time to time experienced significant price and volume fluctuations. The trading price of our common stock could be subject to wide fluctuations in response to a number of factors, including:
|
|
|
|
|
-- Fluctuations in quarterly or annual results of operations; |
|
|
|
|
|
-- Changes in published earnings estimates by analysts and whether our actual earnings meet or exceed such estimates; |
|
|
|
|
|
-- Additions or departures of key personnel; and |
|
|
|
|
|
-- Changes in overall stock market conditions, including the stock prices of other restaurant companies. |
In the past, companies that have experienced extreme fluctuations in the market price of their stock have been the subject of securities class action litigation. If we were to be subject to such litigation, it could result in substantial costs and a diversion of our management’s attention and resources, which may have a material adverse effect on our business, results of operations, and financial condition.
|
|
|
|
Item 1B. |
Unresolved Staff Comments. |
Not applicable.
|
|
|
|
Item 2. |
Properties |
Our restaurant facilities and our executive offices are occupied under leases. Most of our restaurant leases provide for the payment of base rents plus real estate taxes, insurance and other expenses and, in certain instances, for the payment of a percentage of our sales at such facility. As of October 3, 2009, these leases (including leases for managed restaurants) have terms (including any available renewal options) expiring as follows:
|
|
|
|
|
Years Lease |
|
Number of |
|
|
|
|
|
2009-2010 |
|
2 |
|
2011-2015 |
|
5 |
|
2016-2020 |
|
8 |
|
2021-2025 |
|
2 |
|
2026-2030 |
|
6 |
|
2031-2035 |
|
1 |
Our executive, administrative and clerical offices are located in approximately 8,500 square feet of office space at 85 Fifth Avenue, New York, New York. Our lease for this office space expires in 2015.
Our lease for office space related to our Washington, D.C. catering operations expires in 2012.
For information concerning our future minimum rental commitments under non-cancelable operating leases, see Note 10 of the Consolidated Financial Statements.
18
See also “Item 1. Business – Overview” for a list of restaurant properties.
|
|
|
|
Item 3. |
Legal Proceedings |
In the ordinary course of our business, we are a party to various lawsuits arising from accidents at our restaurants and workers’ compensation claims, which are generally handled by our insurance carriers.
Our employment of management personnel, waiters, waitresses and kitchen staff at a number of different restaurants has resulted in the institution, from time to time, of litigation alleging violation by us of employment discrimination laws. We do not believe that any of such suits will have a materially adverse effect upon us, our financial condition or operations.
|
|
|
|
Item 4. |
Submission of Matters to a Vote of Security Holders |
There were no matters submitted to a vote of security holders during the fourth quarter.
Executive Officers of the Registrant
The following table sets forth the names and ages of our executive officers and all offices held by each person:
|
|
|
|
|
|
|
|
|
Name |
|
Age |
|
Positions and Offices |
|
|
|
|
|
|
|
|
|
Michael Weinstein |
|
66 |
|
Chairman and
Chief Executive |
|
|
Vincent Pascal |
|
66 |
|
Senior Vice President |
|
|
Robert Towers |
|
62 |
|
President,
Chief Operating Officer |
|
|
Paul Gordon |
|
58 |
|
Senior Vice President |
|
|
Robert Stewart |
|
53 |
|
Chief Financial Officer |
Each of our executive officers serves at the pleasure of the Board of Directors and until his successor is duly elected and qualifies.
Michael Weinstein has been our Chief Executive Officer and a director since our inception in January 1983. During the past five years, Mr. Weinstein has been an officer, director and 25% shareholder of Easy Diners, Inc., RSWB Corp. and BSWR Corp. (since 1998). Mr. Weinstein is the owner of 24% of the membership interests in each of Dockeast, LLC and Dockwest, LLC. These companies operate four restaurants in New York City, and none of these companies is a parent, subsidiary or other affiliate of us. Mr. Weinstein spends substantially all of his business time on Company-related matters.
Vincent Pascal was elected our Vice President, Assistant Secretary and a director in October 1985. Mr. Pascal became a Senior Vice President in 2001.
Robert Towers has been employed by us since November 1983 and was elected Vice President, Treasurer and a director in March 1987. Mr. Towers became an Executive Vice President and Chief Operating Officer in 2001 and was elected President in 2007.
Paul Gordon has been employed by us since 1983 and was elected as a director in November 1996 and a Senior Vice President in 2001. Mr. Gordon is the manager of our Las Vegas operations. Prior to
19
assuming that role in 1996, Mr. Gordon was the manager of our operations in Washington, D.C. since 1989.
Robert Stewart has been employed by us since June 2002 and was elected Chief Financial Officer effective as of June 24, 2002. For the three years prior to joining us, Mr. Stewart was a Chief Financial Officer and Executive Vice President at Fortis Capital Holdings. For eleven years prior to joining Fortis Capital Holdings, Mr. Stewart held senior financial and audit positions in Skandinaviska Enskilda Banken in their New York, London and Stockholm offices.
20
PART II
|
|
|
|
Item 5. |
Market For The Registrant’s Common Equity, Related Stockholder Matters and Issuer |
Market for Our Common Stock
Our Common Stock, $.01 par value, is traded in the over-the-counter market on the Nasdaq National Market under the symbol “ARKR.” The high and low sale prices for our Common Stock from September 29, 2007 through October 3, 2009 are as follows:
|
|
|
|
|
|
|
|
|
|
|
|
|
|
Calendar 2007 |
|
High |
|
Low |
|
||||
|
|
|
|
|
|
|
|
|
|
||
|
|
Fourth Quarter |
|
$ |
37.00 |
|
|
$ |
34.42 |
|
|
|
|
|
|
|
|
|
|
|
|
|
|
|
|
Calendar 2008 |
|
|
|
|
|
|
|
|
|
|
|
|
|
|
|
|
|
|
|
|
|
|
|
First Quarter |
|
|
37.32 |
|
|
|
29.10 |
|
|
|
|
Second Quarter |
|
|
29.00 |
|
|
|
25.13 |
|
|
|
|
Third Quarter |
|
|
26.25 |
|
|
|
18.03 |
|
|
|
|
Fourth Quarter |
|
|
17.03 |
|
|
|
8.35 |
|
|
|
|
|
|
|
|
|
|
|
|
|
|
|
|
Calendar 2009 |
|
|
|
|
|
|
|
|
|
|
|
|
|
|
|
|
|
|
|
|
|
|
|
First Quarter |
|
|
12.20 |
|
|
|
8.91 |
|
|
|
|
Second Quarter |
|
|
14.09 |
|
|
|
9.30 |
|
|
|
|
Third Quarter |
|
|
18.94 |
|
|
|
12.05 |
|
|
Dividend Policy
A quarterly cash dividend in the amount of $0.44 per share was declared on October 12, 2007 and January 11, April 11, July 11 and October 10, 2008. On September 16, 2009, our Board of Directors declared a special cash dividend in the amount of $1.00 per share. On December 1, 2009, our Board of Directors declared a quarterly cash dividend in the amount of $0.25 per share. We intend to continue to pay such quarterly cash dividend for the foreseeable future, however, the payment of future dividends is at the discretion of our Board of Directors and is based on future earnings, cash flow, financial condition, capital requirements, changes in U.S. taxation and other relevant factors.
Issuer Purchases of Equity Securities
The following table sets forth information regarding purchases of our common stock by us and any affiliated purchasers during the three months ended October 3, 2009. Stock repurchases may be made in the open market or in private transactions at times and in amounts that we deem appropriate. However, there is no guarantee as to the exact number of additional shares that may be repurchased, and we may terminate or limit the stock repurchase program at any time prior to its expiration. We will cancel the repurchased shares.
21
|
|
|
|
|
|
|
|
|
|
|
|
Period |
|
(a) Total |
|
(b) |
|
(c) Total Number |
|
(d) Maximum Number |
|
|
Month #1 |
|
|
|
|
|
|
|
|
|
|
June 28, 2009 |
|
|
|
|
|
|
|
|
|
|
through |
|
0 |
|
Not Applicable |
|
0 |
|
393,046 |
|
|
July 28, 2009 |
|
|
|
|
|
|
|
|
|
|
|
|
|
|
|
|
|
|
|
|
|
Month #2 |
|
|
|
|
|
|
|
|
|
|
July 29, 2009 |
|
|
|
|
|
|
|
|
|
|
through |
|
0 |
|
Not Applicable |
|
0 |
|
393,046 |
|
|
August 28, 2009 |
|
|
|
|
|
|
|
|
|
|
|
|
|
|
|
|
|
|
|
|
|
Month #3 |
|
|
|
|
|
|
|
|
|
|
August 29, 2009 |
|
|
|
|
|
|
|
|
|
|
through |
|
0 |
|
Not Applicable |
|
0 |
|
393,046 |
|
|
October 3, 2009 |
|
|
|
|
|
|
|
|
|
|
|
|
|
|
|
|
|
|
|
|
|
Total |
|
0 |
|
Not Applicable |
|
0 |
|
393,046 |
|
(1) On March 25, 2008, our Board of Directors authorized a stock repurchase program under which up to 500,000 shares of our common stock may be acquired in the open market over the two years following such authorization at our discretion. In periods prior to the fourth fiscal quarter of 2009 we purchased an aggregate 106,954 shares of our common stock.
Securities Authorized for Issuance Under Equity Compensation Plans
The following is a summary of the securities issued and authorized for issuance under our 2004 Stock Option Plan at October 3, 2009:
|
|
|
|
|
|
|
|
|
|
|
|
|
|
|
Plan Category |
|
|
(a) Number of |
|
|
(b) Weighted - |
|
|
(c) Number of securities |
|
||
|
Equity compensation plans approved by |
|
|
|
422,100 |
|
|
$22.86 |
|
|
|
400 |
|
|
Equity compensation plans not approved by |
|
|
|
None |
|
|
N/A |
|
|
|
None |
|
|
Total |
|
|
|
422,100 |
|
|
$22.86 |
|
|
|
400 |
|
Of the 422,100 options outstanding on October 3, 2009, 300,500 were held by the Company’s officers and directors.
|
|
|
|
(1) |
The 2004 Stock Option Plan, which was approved by shareholders, is the Company’s only equity compensation plan currently in effect. |
|
|
|
|
(2) |
The Company has no equity compensation plan that was not approved by shareholders. |
22
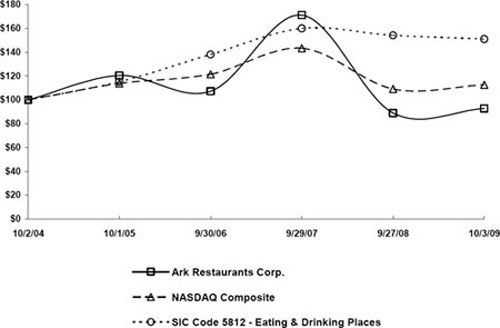
Stock Performance Graph
The graph set forth below compares the yearly percentage change in cumulative total shareholder return on the Company’s Common Stock for the five-year period commencing October 2, 2004 and ending October 3, 2009 against the cumulative total return on the NASDAQ Market Index and a peer group comprised of those public companies whose business activities fall within the same standard industrial classification code as the Company. This graph assumes a $100 investment in the Company’s Common Stock and in each index on October 2, 2004 and that all dividends paid by companies included in each index were reinvested.
COMPARISON OF 5 YEAR CUMULATIVE TOTAL
RETURN*
Among Ark Restaurants Corp., The NASDAQ Composite Index
And SIC Code 5812 - Eating & Drinking Places
|
|
|
|
|
*$100 invested on 10/2/04 in
stock or 9/30/09 in index, including reinvestment of dividends. |
|
|
|
|
|
|
|
|
|
|
|
|
|
|
|
|
|
Cumulative Total Return |
||||||||||
|
|
|
|||||||||||
|
|
|
10/2/04 |
|
10/1/05 |
|
9/30/06 |
|
9/29/07 |
|
9/27/08 |
|
10/3/09 |
|
|
|
|
|
|
|
|
|
|
|
|
|
|
|
Ark Restaurants Corp. |
|
100.00 |
|
120.46 |
|
107.31 |
|
171.06 |
|
89.04 |
|
92.78 |
|
NASDAQ Composite |
|
100.00 |
|
113.78 |
|
121.50 |
|
143.37 |
|
109.15 |
|
112.55 |
|
SIC Code 5812 - Eating & Drinking Places |
|
100.00 |
|
115.24 |
|
138.10 |
|
159.96 |
|
154.17 |
|
151.03 |
23
|
|
|
|
Item 6. |
Selected Consolidated Financial Data |
Not applicable.
|
|
|
|
Item 7. |
Management’s Discussion and Analysis of Financial Condition and Results of Operations |
Accounting period
Our fiscal year ends on the Saturday nearest September 30. We report fiscal years under a 52/53-week format. This reporting method is used by many companies in the hospitality industry and is meant to improve year-to-year comparisons of operating results. Under this method, certain years will contain 53 weeks. The fiscal year ended September 27, 2008 included 52 weeks and the fiscal year ended October 3, 2009 included 53 weeks.
Revenues
Total revenues decreased by 8.3% from fiscal 2008 to fiscal 2009.
Same store sales decreased 10.4%, or $12,148,000, on a Company-wide basis from fiscal 2008 to fiscal 2009. Same store sales in Las Vegas decreased by $4,560,000, or 8.2%, in fiscal 2009 compared to fiscal 2008. Same store sales in Las Vegas were negatively affected by the unwillingness of the public to engage in gaming activities and a decrease in tourism and convention business, all related to the current economic conditions. Same store sales in New York decreased $6,119,000, or 18.3%, during fiscal 2009. Same store sales in New York were particularly negatively affected by unusually inclement weather with large amounts of rain, continuing layoffs and lack of new job creation, especially in the financial sector, a decrease in corporate parties and a decrease in tourism and convention business related to the current economic conditions. Same store sales in Washington D.C. decreased by $191,000, or 1.1%, during fiscal 2009. Although the current economic conditions do not seem to have affected the Washington D.C. region as much as other regions, unusually inclement weather with large amounts of rain, continuing layoffs and lack of new job creation, a decrease in corporate parties and a decrease in tourism and convention business related to the current economic conditions all contributed to a decrease in sales. Same store sales in Atlantic City decreased by $646,000 or 19.6% in fiscal 2009 compared to fiscal 2008. Same store sales in Atlantic City were negatively affected by the unwillingness of the public to engage in gaming activities and a decrease in tourism and convention business related to the current economic conditions as well as the introduction of slot machine parlors in nearby Pennsylvania. Same store sales in Boston decreased $370,000, or 7.9%, during fiscal 2009. Same store sales in Boston were negatively affected by unusually inclement weather with large amounts of rain and the current economic conditions. Same store sales in Connecticut decreased $262,000, or 14.6%, during fiscal 2009. Same store sales in Connecticut were negatively affected by the unwillingness of the public to engage in gaming activities related to the current economic conditions.
Other operating income, which consists of the sale of merchandise at various restaurants, management fee income and door sales was $2,063,000 in fiscal 2009 and $2,456,000 in fiscal 2008. This decrease was mostly attributable to the decrease in sales.
Costs and Expenses
Food and beverage cost of sales as a percentage of total revenue was 25.6% in fiscal 2009 and 26.2% in fiscal 2008.
24
Total costs and expenses decreased by $3,868,000, or 3.3%, from fiscal 2008 to fiscal 2009 primarily due to a decrease in sales.
Payroll expenses as a percentage of total revenues was 32.3% in fiscal 2009 compared to 30.6% in fiscal 2008. Payroll expense was $37,111,000 and $38,325,000 in fiscal 2009 and 2008, respectively. In fiscal 2009, a decrease in sales resulted in an increase in payroll expenses. We continually evaluate our payroll expenses as they relate to sales.
The opening of a new restaurant is invariably accompanied by substantial pre-opening expenses and early operating losses associated with the training of personnel, excess kitchen costs, costs of supervision and other expenses during the pre-opening period and during a post-opening “shake out” period until operations can be considered to be functioning normally. The amount of such pre-opening expenses and early operating losses can generally be expected to depend upon the size and complexity of the facility being opened.
In fiscal 2008, we began operating a Mexican restaurant and lounge, Yolos, at the rethemed Planet Hollywood Casino in Las Vegas, Nevada, and entered into an agreement to lease space for the restaurant, Robert, at the Museum of Arts & Design at Columbus Circle in Manhattan. Robert opened on December 15, 2009. We are the majority owner and managing member of the limited liability company which operates this restaurant. We incurred $15,000 in pre-opening expenses in fiscal 2009, which is the cumulative total pre-opening expenses for Robert for the 2009 fiscal year.
Our restaurants generally do not achieve substantial increases in revenue from year to year, which we consider to be typical of the restaurant industry. To achieve significant increases in revenue or to replace revenue of restaurants that lose customer favor or which close because of lease expirations or other reasons, we would have to open additional restaurant facilities or expand existing restaurants. There can be no assurance that a restaurant will be successful after it is opened, particularly since in many instances we do not operate our new restaurants under a trade name currently used by us, thereby requiring new restaurants to establish their own identity.
General and administrative expenses, as a percentage of total revenue, were 7.7% in fiscal 2009 and 7.2% in fiscal 2008.
We manage:
-- two consolidated facilities we do not own (El Rio Grande and The Food Market at the MGM Grand), and
-- the Tampa and Hollywood Florida food court operations, and
-- in fiscal 2008, Lucky Seven at Foxwoods.
Sales of El Rio Grande were $3,886,000 and $4,312,000 during fiscal 2009 and 2008, respectively. Sales of the The Food Market at the MGM Grand were $2,952,000 during fiscal 2009 and $1,457,000 during the portion of fiscal 2008 in which it was open. Sales of the Tampa and Hollywood Florida food court operations were $14,264,000 during fiscal 2009 and $12,454,000 during fiscal 2008. Sales of Lucky Seven were $2,608,000 during fiscal 2008.
25
Interest expense was $43,000 in fiscal 2009 and $57,000 in fiscal 2008. Interest income was $295,000 in fiscal 2009 and $490,000 in fiscal 2008. Investments are made in government securities and investment quality corporate instruments.
Other income, which generally consists of purchasing service fees, equity in losses of affiliates and other income at various restaurants, was $559,000 and $716,000 for fiscal 2009 and 2008, respectively.
Income Taxes
The provision for income taxes reflects Federal income taxes calculated on a consolidated basis and state and local income taxes calculated by each New York subsidiary on a non-consolidated basis. Most of the restaurants we own or manage are owned or managed by a separate subsidiary.
For state and local income tax purposes, the losses incurred by a subsidiary may only be used to offset that subsidiary’s income, with the exception of the restaurants operating in the District of Columbia. Accordingly, our overall effective tax rate has varied depending on the level of losses incurred at individual subsidiaries.
Our overall effective tax rate in the future will be affected by factors such as the level of losses incurred at our New York facilities, which cannot be consolidated for state and local tax purposes, pre-tax income earned outside of New York City and the utilization of state and local net operating loss carry forwards. Nevada has no state income tax and other states in which we operate have income tax rates substantially lower in comparison to New York. In order to utilize more effectively tax loss carry forwards at restaurants that were unprofitable, we have merged certain profitable subsidiaries with certain loss subsidiaries.
The Revenue Reconciliation Act of 1993 provides tax credits to us for FICA taxes paid on tip income of restaurant service personnel. The net benefit to us was $661,000 in fiscal 2009 and $832,000 in fiscal 2008.
Liquidity and Capital Resources
Our primary source of capital has been cash provided by operations. We have, from time to time, also utilized equipment financing in connection with the construction of a restaurant and seller financing in connection with the acquisition of a restaurant. We utilize capital primarily to fund the cost of developing and opening new restaurants, acquiring existing restaurants owned by others and remodeling existing restaurants we own.
The net cash used in investing activities in fiscal 2009 was $2,567,000. Cash was used for the replacement of fixed assets at existing restaurants and the construction of Robert at the Museum of Arts & Design at Columbus Circle in Manhattan. Cash was also used to purchase investment securities. Cash provided by investing activities was generated from the sale of investment securities.
The net cash used in investing activities in fiscal 2008 was $6,928,000. Cash was used for the replacement of fixed assets at existing restaurants and the construction of Yolos, a Mexican restaurant, at the Planet Hollywood Resort and Casino (formerly known as the Aladdin Resort and Casino) in Las Vegas, Nevada. Cash was also used to purchase investment securities. Cash provided by investing activities was generated from the sale of discontinued operations and the sale of investment securities.
26
The net cash used in financing activities in fiscal 2009 of $2,363,000 and $5,460,000 in fiscal 2008 was principally used for the payment of dividends.
We had a working capital surplus of $5,883,000 at October 3, 2009 as compared to a working capital surplus of $9,144,000 at September 27, 2008.
A quarterly cash dividend in the amount of $0.44 per share was declared on October 12, 2007 and January 11, April 11, July 11 and October 10, 2008. On September 16, 2009, our Board of Directors declared a special cash dividend in the amount of $1.00 per share. On December 1, 2009, our Board of Directors declared a quarterly cash dividend in the amount of $0.25 per share. We intend to continue to pay such quarterly cash dividend for the foreseeable future, however, the payment of future dividends is at the discretion of our Board of Directors and is based on future earnings, cash flow, financial condition, capital requirements, changes in U.S. taxation and other relevant factors.
Restaurant Expansion
During the fiscal year ended October 3, 2009, we began construction of the restaurant Robert at the Museum of Arts & Design at Columbus Circle in Manhattan. This restaurant opened on December 15, 2009. We are the majority owner and managing member of the limited liability company which operates this restaurant.
The opening of a new restaurant is invariably accompanied by substantial pre-opening expenses and early operating losses associated with the training of personnel, excess kitchen costs, costs of supervision and other expenses during the pre-opening period and during a post-opening “shake out” period until operations can be considered to be functioning normally. The amount of such pre-opening expenses and early operating losses can generally be expected to depend upon the size and complexity of the facility being opened. We incurred $15,000 in pre-opening expenses in fiscal 2009, which is the cumulative total pre-opening expenses of this restaurant for the 2009 fiscal year.
Our restaurants generally do not achieve substantial increases in revenue from year to year, which we consider to be typical of the restaurant industry. To achieve significant increases in revenue or to replace revenue of restaurants that lose customer favor or which close because of lease expirations or other reasons, we would have to open additional restaurant facilities or expand existing restaurants. There can be no assurance that a restaurant will be successful after it is opened, particularly since in many instances we do not operate our new restaurants under a trade name currently used by us, thereby requiring new restaurants to establish their own identity.
We are not currently committed to any projects. We may take advantage of opportunities we consider to be favorable, when they occur, depending upon the availability of financing and other factors.
Recent Restaurant Dispositions and Charges
During the first fiscal quarter of 2008, we discontinued the operation of our Columbus Bakery retail and wholesale bakery located in New York City. Columbus Bakery was originally intended to serve as the bakery that would provide all of our New York restaurants with baked goods as well as being a retail bakery operation. As a result of the sale and closure of several of our restaurants in New York City during the last several years, this bakery operation was no longer profitable. During the second fiscal quarter of 2008 we opened, along with certain third party investors, a new concept at this location called “Pinch & S’Mac” which features pizza and macaroni and cheese. We contributed Columbus Bakery’s net fixed
27
assets and cash into this venture and received an ownership interest of 37.5%. These operations are not consolidated in the Company’s financial statements.
Effective June 30, 2008, the lease for our Stage Deli facility at the Forum Shops in Las Vegas, Nevada expired. The landlord for this facility offered to renew the lease at this location prior to its expiration at a significantly increased rent. The Company determined that it would not be able to operate this facility profitably at this location at the rent offered in the landlord’s renewal proposal. As a result, the Company discontinued these operations during the third fiscal quarter of 2008 and took a charge for the impairment of goodwill of $294,000 and a loss on disposal of $19,000. The impairment charge and disposal loss are included in discontinued operations.
Critical Accounting Policies
Our significant accounting policies are more fully described in Note 1 to our consolidated financial statements. While all these significant accounting policies impact our financial condition and results of operations, we view certain of these policies as critical. Policies determined to be critical are those policies that have the most significant impact on our consolidated financial statements and require management to use a greater degree of judgment and estimates. Actual results may differ from those estimates.
We believe that given current facts and circumstances, it is unlikely that applying any other reasonable judgments or estimate methodologies would cause a material effect on our consolidated results of operations, financial position or cash flows for the periods presented in this report.
Below are listed certain policies that management believes are critical:
FASB Accounting Standards Codification
The issuance of FASB Accounting Standards CodificationTM (the “Codification”) on July 1, 2009 (effective for interim or annual reporting periods ending after September 15, 2009), changes the way that U.S. generally accepted accounting principles (“GAAP”) are referenced. Beginning on that date, the Codification officially became the single source of authoritative nongovernmental GAAP; however, SEC registrants must also consider rules, regulations, and interpretive guidance issued by the SEC or its staff. The change affects the way we refer to GAAP in our financial statements and accounting policies. All existing standards that were used to create the Codification became superseded. Instead, references to standards consist solely of the number used in the Codification’s structural organization. For example, it is no longer proper to refer to FASB Statement No. 157, Fair Value Measurement, which is now Codification Topic 820: Fair Value Measurements and Disclosures (“ASC 820”). Consistent with the effective date of the Codification, financial statements for periods ending after September 15, 2009, refers to the Codification structure, not pre-Codification historical GAAP.
Use of Estimates
The preparation of financial statements in conformity with accounting principles generally accepted in the United States of America requires us to make estimates and assumptions that affect the reported amounts of assets and liabilities and disclosure of contingent assets and liabilities at the date of the financial statements and the reported amounts of revenues and expenses during the reporting period. The accounting estimates that require our most difficult and subjective judgments include allowances for potential bad debts on receivables, inventories, the useful lives and recoverability of our assets, such as property and intangibles, fair values of financial instruments and share-based compensation, the realizable
28
value of our tax assets and other matters. Because of the uncertainty in such estimates, actual results may differ from these estimates.
Long-Lived Assets
In accordance with ASC Topic 360: Property, Plant and Equipment (“ASC 360”), long-lived assets, such as property, plant and equipment, and purchased intangibles subject to amortization, are reviewed for impairment whenever events or changes in circumstances indicate that the carrying amount of an asset may not be recoverable. In the evaluation of the fair value and future benefits of long-lived assets, we perform an analysis of the anticipated undiscounted future net cash flows of the related long-lived assets. If the carrying value of the related asset exceeds the undiscounted cash flows, the carrying value is reduced to its fair value. Various factors including estimated future sales growth and estimated profit margins are included in this analysis. We believe at this time that carrying values and useful lives continue to be appropriate. For the years ended October 3, 2009 and September 27, 2008, no impairment charges were deemed necessary.
Leases
We recognize rent expense on a straight-line basis over the expected lease term, including option periods as described below. Within the provisions of certain leases there are escalations in payments over the base lease term, as well as renewal periods. The effects of the escalations have been reflected in rent expense on a straight-line basis over the expected lease term, which includes option periods when it is deemed to be reasonably assured that we would incur an economic penalty for not exercising the option. Percentage rent expense is generally based upon sales levels and is expensed as incurred. Certain leases include both base rent and percentage rent. We record rent expense on these leases based upon reasonably assured sales levels. The consolidated financial statements reflect the same lease terms for amortizing leasehold improvements as were used in calculating straight-line rent expense for each restaurant. Our judgments may produce materially different amounts of amortization and rent expense than would be reported if different lease terms were used.
Deferred Income Tax Valuation Allowance
We provide such allowance due to uncertainty that some of the deferred tax amounts may not be realized. Certain items, such as state and local tax loss carry forwards, are dependent on future earnings or the availability of tax strategies. Future results could require an increase or decrease in the valuation allowance and a resulting adjustment to income in such period.
Goodwill and Trademarks
Goodwill is recorded when the purchase price paid for an acquisition exceeds the estimated fair value of the net identified tangible and intangible assets acquired. Trademarks, which were acquired in connection with the Durgin Park acquisition, are considered to have an indefinite life and are not being amortized. We apply the provisions of ASC Topic 350: Intangibles – Goodwill and Other (“ASC 350”) which requires that goodwill and certain intangible assets be assessed for impairment using fair value measurement techniques. Specifically, goodwill impairment is determined using a two-step process. The first step of the goodwill impairment test is to identify potential impairment by comparing the fair value of the reporting unit (we are being treated as one reporting unit) with its net book value (or carrying amount), including goodwill. If the fair value of the reporting unit exceeds its carrying amount, goodwill of the reporting unit is considered not impaired and the second step of the impairment test is unnecessary.
29
If the carrying amount of the reporting unit exceeds its fair value, the second step of the goodwill impairment test is performed to measure the amount of impairment loss, if any. The second step of the goodwill impairment test compares the implied fair value of the reporting unit’s goodwill with the carrying amount of that goodwill. If the carrying amount of the reporting unit’s goodwill exceeds the implied fair value of that goodwill, an impairment loss is recognized in an amount equal to that excess. The implied fair value of goodwill is determined in the same manner as the amount of goodwill recognized in a business combination. That is, the fair value of the reporting unit is allocated to all of the assets and liabilities of that unit (including any unrecognized intangible assets) as if the reporting unit had been acquired in a business combination and the fair value of the reporting unit was the purchase price paid to acquire the reporting unit. The impairment test for other intangible assets consists of a comparison of the fair value of the intangible asset with its carrying value. If the carrying value of the intangible asset exceeds its fair value, an impairment loss is recognized in an amount equal to that excess.
Determining the fair value of the reporting unit under the first step of the goodwill impairment test and determining the fair value of individual assets and liabilities of the reporting unit (including unrecognized intangible assets) under the second step of the goodwill impairment test is judgmental in nature and often involves the use of significant estimates and assumptions. Similarly, estimates and assumptions are used in determining the fair value of other intangible assets. These estimates and assumptions could have a significant impact on whether or not an impairment charge is recognized and also the magnitude of any such charge. To assist in the process of determining goodwill impairment, we perform internal valuation analyses and considers other market information that is publicly available. Estimates of fair value are primarily determined using discounted cash flows, market comparisons and recent transactions. These approaches use significant estimates and assumptions including projected future cash flows (including timing), a discount rate reflecting the risk inherent in future cash flows, perpetual growth rate, determination of appropriate market comparables and the determination of whether a premium or discount should be applied to comparables. Based on the above policy, no impairment charges were necessary in fiscal 2009 and approximately $294,000 of goodwill impairment expense was recorded during fiscal year 2008 in connection with restaurant dispositions.
Share-Based Compensation
Effective October 2, 2005, we adopted ASC Topic 718: Compensation – Stock Compensation (“ASC 718”) and began expensing the grant-date fair value of employee stock options using the modified prospective transition method. Under the modified prospective transition method, non-cash compensation expense is recognized under the fair value method for the portion of outstanding equity-based awards granted prior to the adoption of ASC 718 for which service has not been rendered, and for any equity-based awards granted or modified after adoption. Accordingly, periods prior to adoption have not been restated. Prior to the adoption of ASC 718, we accounted for equity-based compensation using the intrinsic value method. Accordingly, prior to October 2, 2005, no compensation expense had been recognized for employee stock options, as options granted had an exercise price equal to the market value of the underlying common stock on the date of grant. Upon adoption of ASC 718, we elected to value employee stock options using the Black-Scholes option valuation method that uses assumptions that relate to the expected volatility of our common stock, the expected dividend yield of our stock, the expected life of the options and the risk free interest rate.
We use the alternative transition method for calculating the tax effects of share-based compensation. The alternative transition method includes a simplified method to establish the beginning balance of the additional paid-in capital pool (APIC pool) related to the effects of employee share-based compensation, which is available to absorb tax deficiencies recognized subsequent to the adoption of ASC 718.
30
During fiscal 2009, options to purchase 176,600 shares of common stock were granted at an exercise price of $12.04 per share and are exercisable as to 50% of the shares commencing on the first anniversary of the date of grant and as to an additional 50% commencing on the second anniversary of the date of grant. Such options had an aggregate grant date fair value of approximately $624,000. We did not grant any options during the fiscal year 2008. We generally issue new shares upon the exercise of employee stock options.
The fair value of each of our stock options is estimated on the date of grant using a Black-Scholes option-pricing model that uses assumptions that relate to the expected volatility of our common stock, the expected dividend yield of our stock, the expected life of the options and the risk free interest rate. The assumptions used for the 2009 grant include a risk free interest rate of 3.29%, volatility of 42.7%, a dividend yield of 4.27% and an expected life of 5.75 years.
Recently Adopted and Issued Accounting Standards
See Note 1 to the Consolidated Financial Statements for a description of recent accounting pronouncements, including those adopted in 2009 and the expected dates of adoption and the anticipated impact on the Consolidated Financial Statements.
|
|
|
|
Item 7A. |
Quantitative and Qualitative Disclosures About Market Risk |
|
|
|
|
Not applicable. |
|
|
|
|
|
Item 8. |
Financial Statements and Supplementary Data |
|
|
|
|
Our Consolidated Financial Statements are included in this report immediately following Part IV. |
|
|
|
|
|
Item 9. |
Changes in
and Disagreements With |
|
|
|
|
None. |
|
|
|
|
|
Item 9A(T). |
Controls and Procedures |
|
|
|
|
Evaluation of Disclosure Controls and Procedures. |
|
As of October 3, 2009 (the end of the period covered by this annual report on Form 10-K), management, with participation of our Chief Executive Officer and Chief Financial Officer, has evaluated the effectiveness of our disclosure controls and procedures (as defined in Rule 13a-15(e) and 15d-15(e) under the Securities Exchange Act of 1934). Based on such evaluation, our management, including the Chief Executive Officer and Chief Financial Officer, concluded that, as of the end of such period, our disclosure controls and procedures were not effective due to the material weaknesses discussed below.
Disclosure controls and procedures are controls and other procedures that are designed to ensure that information required to be disclosed in our reports filed or submitted under the Exchange Act are recorded, processed, summarized and reported, within the time periods specified in the SEC’s rules and forms. Disclosure controls and procedures include, without limitation, controls and procedures designed to ensure that information required to be disclosed in our reports filed under the Exchange Act is
31
accumulated and communicated to management, including our Principal Executive Officer and Principal Financial Officer, to allow timely decisions regarding required disclosure.
Management’s Annual Report on Internal Control Over Financial Reporting.
Our management is responsible for establishing and maintaining adequate internal control over financial reporting. Pursuant to the rules and regulations of the Securities and Exchange Commission, internal control over financial reporting is a process designed by, or under the supervision of, our principal executive and principal financial officers, or persons performing similar functions, and effected by our board of directors, management and other personnel, to provide reasonable assurance regarding the reliability of financial reporting and the preparation of financial statements for external purposes in accordance with generally accepted accounting principles and includes those policies and procedures that:
|
|
|
|
• |
Pertain to the maintenance of records that in reasonable detail accurately and fairly reflect the transactions and the dispositions of assets; |
|
|
|
|
• |
Provide reasonable assurance that transactions are recorded as necessary to permit preparation of financial statements in accordance with generally accepted accounting principles, and that receipts and expenditures of the Company are being made only in accordance with appropriate authorizations; and |
|
|
|
|
• |
Provide reasonable assurance regarding prevention or timely detection of unauthorized acquisition, use or disposition of the Company’s assets that could have a material effect on our financial statements. |
Because of its inherent limitations, internal control over financial reporting may not prevent or detect misstatements. Therefore, even those systems determined to be effective can provide only reasonable assurance with respect to financial statement preparation and presentation.
Management has evaluated the effectiveness of its internal control over financial reporting as of October 3, 2009, using the criteria set forth by the Committee of Sponsoring Organizations of the Treadway Commission (COSO) in Internal Control — Integrated Framework. Based on our assessment and those criteria, management concluded that during the period covered by this report, our internal control and procedures over financial reporting were not effective as of October 3, 2009 because there is a material weakness in our internal control over financial reporting. A material weakness is a control deficiency, or a combination of deficiencies in internal control over financial reporting that creates a reasonable possibility that a material misstatement in annual or interim financial statements will not be prevented or detected on a timely basis. Since the assessment of the effectiveness of our internal control over financial reporting did identify a material weakness, management considers its internal control over financial reporting to be ineffective.
Management has concluded that our internal control over financial reporting had the following deficiency:
|
|
|
|
|
|
During the quarter ended October 3, 2009 the Company made advances against salary to its Chief Executive Officer (the “CEO”) totaling approximately $298,000 (of which approximately $252,000 remained outstanding at October 3, 2009 and is included in Employee Receivables). In addition, the |
|
32
|
|
|
|
|
|
Company also loaned $160,000 to the CEO’s former wife (which is included in Related Party receivables at October 3, 2009). The CEO believed the advances and loan were permissible after he consulted with the Company’s General Counsel. In the latter part of November 2009, the Company reviewed these matters with its auditors and informed members of its Compensation and Audit Committees and outside counsel and concluded that the advances and loan may be deemed extensions of credit and violative of the Sarbanes-Oxley Act. The CEO immediately repaid the remaining balance on the advances with interest at 6%. The loan to his former wife was repaid in October before the review had begun. |
|
|
|
|
|
|
|
In connection with the above, the following remediation activities were performed: |
|
|
|
|
|
|
|
• |
The Audit Committee reviewed the Company’s policies and procedures regarding payments to or for senior management. |
|
|
|
|
|
|
• |
The Audit Committee reviewed the Company’s overall internal control procedures. |
|
|
|
|
|
|
• |
The Company adopted changes to existing policies and procedures which require that the Audit Committee’s prior approval be obtained before any extraordinary payments are made to or at the request of management. |
|
|
|
|
|
|
• |
The Audit Committee also directed that management undergo governance training pursuant to a program approved by the Audit Committee. |
Changes in Internal Control Over Financial Reporting
Other than the changes described above, there were no changes in internal control over financial reporting for the quarter ended October 3, 2009 that have materially affected, or are reasonably likely to materially affect, our internal control over financial reporting.
|
|
|
|
Item 9B. |
Other Information |
None.
33
PART III
|
|
|
|
Item 10. |
Directors, Executive Officers and Corporate Governance |
See Part I, Item 4. “Executive Officers of the Registrant.” Other information relating to our directors and executive officers is incorporated by reference to the definitive proxy statement for our 2010 annual meeting of stockholders to be filed with the Securities and Exchange Commission (the “SEC”) pursuant to Regulation 14A no later than 120 days after the end of the fiscal year covered by this form (the “Proxy Statement”). Information relating to compliance with Section 16(a) of the Exchange Act is incorporated by reference to the Proxy Statement.
Code of Ethics.
We have adopted a code of ethics that applies to our principal executive officer, principal financial officer, principal accounting officer or controller, and persons performing similar functions. We will provide any person without charge, upon request, a copy of such code of ethics by mailing the request to us at 85 Fifth Avenue, New York, NY 10003, Attention: Robert Towers.
Audit Committee Financial Expert
Our Board of Directors has determined that Marcia Allen, Director, is our Audit Committee Financial Expert, as defined under Section 407 of the Sarbanes-Oxley Act of 2002 and the rules promulgated by the SEC in furtherance of Section 407. Ms. Allen is independent of management. Other information regarding the Audit Committee is incorporated by reference from the Proxy Statement.
|
|
|
|
Item 11. |
Executive Compensation |
|
|
|
|
The information required by this item is incorporated by reference to the Proxy Statement. |
|
|
|
|
|
Item 12. |
Security Ownership of Certain Beneficial Owners and Management |
|
|
|
|
The information required by this item is incorporated by reference to the Proxy Statement. |
|
|
|
|
|
Item 13. |
Certain Relationships and Related Transactions |
|
|
|
|
The information required by this item is incorporated by reference to the Proxy Statement. |
|
|
|
|
|
Item 14. |
Principal Accountant Fees and Services |
|
|
|
|
The information required by this item is incorporated by reference to the Proxy Statement. |
|
34
PART IV
|
|
|
|
Item 15. |
Exhibits, Financial Statement Schedules, and Reports on Form 8-K |
|
|
|
|
|
|
|
|
|
Page |
|
(a) |
(1) |
Financial Statements: |
|
|
|
|
|
|
|
|
|
F-1 |
|
|
|
|
|
|
|
|
|
Consolidated
Balance Sheets -- |
F-2 |
|
|
|
|
|
|
|
|
Consolidated
Statements of Operations -- years ended |
F-3 |
|
|
|
|
|
|
|
|
Consolidated
Statements of Cash Flows -- |
F-4 |
|
|
|
|
|
|
|
|
F-5 |
|
|
|
|
|
|
|
|
|
F-6 |
|
|
|
|
|
|
|
|
(2) |
Financial Statement Schedules |
|
|
|
|
|
|
|
|
|
None |
|
|
|
|
|
|
|
|
(3) |
Exhibits: |
|
|
|
|
|
|
|
|
3.1 |
Certificate of Incorporation of the Registrant, filed with the Secretary of State of the State of New York on January 4, 1983, incorporated by reference to Exhibit 3.1 to the Registrant’s Annual Report on Form 10-K for the fiscal year ended September 28, 2002 (“2002 10-K”). |
|
|
|
|
|
|
|
|
3.2 |
Certificate of Amendment of the Certificate of Incorporation of the Registrant filed with the Secretary of State of the State of New York on October 11, 1985, incorporated by reference to Exhibit 3.2 to the 2002 10-K. |
|
|
|
|
|
|
|
|
3.3 |
Certificate of Amendment of the Certificate of Incorporation of the Registrant filed with the Secretary of State of the State of New York on July 21, 1988, incorporated by reference to Exhibit 3.3 to the 2002 10-K. |
|
|
|
|
|
|
|
|
3.4 |
Certificate of Amendment of the Certificate of Incorporation of the Registrant filed with the Secretary of State of the State of New York on May 13, 1997, incorporated by reference to Exhibit 3.4 to the 2002 10-K. |
|
|
|
|
|
|
|
|
3.5 |
Certificate of Amendment of the Certificate of Incorporation of the Registrant filed on April 24, 2002 incorporated by reference to Exhibit 3.5 to the Registrant’s Quarterly Report on Form 10-Q for the quarterly period ended March 30, 2002 (the “Second Quarter 2002 Form 10-Q”). |
|
|
|
|
|
|
|
|
3.6 |
By-Laws of the Registrant, incorporated by reference to Exhibit 3.2 to the Registrant’s Registration Statement on Form S-18 filed with the Securities and Exchange Commission on October 17, 1985. |
|
|
|
|
|
|
|
|
10.1 |
Amended and Restated Redemption Agreement dated June 29, 1993 between the Registrant and Michael Weinstein, incorporated by reference to Exhibit 10.1 to the Registrant’s Annual Report on Form 10-K for the fiscal year ended October 2, 1994 (“1994 10-K”). |
|
35
|
|
|
|
|
|
|
10.2 |
Form of Indemnification Agreement entered into between the Registrant and each of Michael Weinstein, Ernest Bogen, Vincent Pascal, Robert Towers, Jay Galin, Robert Stewart, Bruce R. Lewin, Paul Gordon and Donald D. Shack, incorporated by reference to Exhibit 10.2 to the 1994 10-K. |
|
|
|
|
|
|
|
|
10.3 |
Ark Restaurants Corp. Amended Stock Option Plan, incorporated by reference to Exhibit 10.3 to the 1994 10-K. |
|
|
|
|
|
|
|
|
10.4 |
Fourth Amended and Restated Credit Agreement dated as of December 27, 1999 between we and Bank Leumi USA, incorporated by reference to Exhibit 10.4 to the Registrant’s Annual Report on Form 10-K for the fiscal year ended October 2, 1999. |
|
|
|
|
|
|
|
|
10.5 |
Ark Restaurants Corp. 1996 Stock Option Plan, as amended, incorporated by reference to the Registrant’s Definitive Proxy Statement pursuant to Section 14(a) of the Securities Exchange Act of 1934 (Amendment No. 1) filed on March 16, 2001. |
|
|
|
|
|
|
|
|
10.6 |
Lease Agreement dated May 17, 1996 between New York-New York Hotel, LLC, and Las Vegas America Corp., incorporated by reference to Exhibit 10.6 to the Registrant’s Annual Report on Form 10-K for the fiscal year ended October 3, 1998 (the “1998 10-K”). |
|
|
|
|
|
|
|
|
10.7 |
Lease Agreement dated May 17, 1996 between New York-New York Hotel, LLC, and Las Vegas Festival Food Corp., incorporated by reference to Exhibit 10.7 to the 1998 10-K. |
|
|
|
|
|
|
|
|
10.8 |
Lease Agreement dated May 17, 1996 between New York-New York Hotel, LLC, and Las Vegas Steakhouse Corp., incorporated by reference to Exhibit 10.8 to the 1998 10-K. |
|
|
|
|
|
|
|
|
10.9 |
Amendment dated August 21, 2000 to the Fourth Amended and Restated Credit Agreement dated as of December 27, 1999 between we and Bank Leumi USA, incorporated by reference to Exhibit 10.9 to the Registrant’s Annual Report on Form 10-K for the fiscal year ended September 30, 2000 (the “2000 10-K”). |
|
|
|
|
|
|
|
|
10.10 |
Amendment dated November 21, 2000 to the Fourth Amended and Restated Credit Agreement dated as of December 27, 1999 between we and Bank Leumi USA, incorporated by reference to Exhibit 10.10 to the 2000 10-K. |
|
|
|
|
|
|
|
|
10.11 |
Amendment dated November 1, 2001 to the Fourth Amended and Restated Credit Agreement dated as of December 27, 1999 between we and Bank Leumi USA, incorporated by reference to Exhibit 10.11 to the Registrant’s Annual Report on Form 10-K for the fiscal year ended September 29, 2001 (the “2001 10-K”). |
|
|
|
|
|
|
|
|
10.12 |
Amendment dated December 20, 2001 to the Fourth Amended and Restated Credit Agreement dated as of December 27, 1999 between we and Bank Leumi USA, incorporated by reference to Exhibit 10.11 of the 2001 10-K. |
|
|
|
|
|
|
|
|
10.13 |
Amendment dated as of April 23, 2002 to the Fourth Amended and Restated Credit Agreement dated as of December 27, 1999 between we and Bank Leumi USA, incorporated by reference to Exhibit 10.13 of the Second Quarter 2002 Form 10-Q. |
|
36
|
|
|
|
|
|
|
10.14 |
Amendment dated as of January 22, 2002 to the Fourth Amended and Restated Credit Agreement dated as of December 27, 1999 between we and Bank Leumi USA, incorporated by reference to Exhibit 10.14 of the First Quarter 2003 Form 10-Q. |
|
|
|
|
|
|
|
|
10.15 |
Ark Restaurants Corp. 2004 Stock Option Plan, as amended, incorporated by reference to the Registrant’s Definitive Proxy Statement pursuant to Section 14(a) of the Securities Exchange Act of 1934 filed on January 26, 2004. |
|
|
|
|
|
|
|
|
14 |
Code of Ethics, incorporated by reference to Exhibit 14.1 to the Registrant’s Annual Report on Form 10-K for the fiscal year ended September 27, 2003. |
|
|
|
|
|
|
|
|
16 |
Letter from Deloitte & Touche LLP regarding change in certifying accountants, incorporated by reference from the exhibit included with our Current Report on Form 8-K filed with the SEC on January 15, 2004 and our Current Report on Form 8-K/A filed with the SEC on January 16, 2004. |
|
|
|
|
|
|
|
|
*21 |
Subsidiaries of the Registrant. |
|
|
|
|
|
|
|
|
*23 |
Consent of J.H. Cohn LLP. |
|
|
|
|
|
|
|
|
*31.1 |
Certification of Chief Executive Officer. |
|
|
|
|
|
|
|
|
*31.2 |
Certification of Chief Financial Officer. |
|
|
|
|
|
|
|
|
*32 |
Section 1350 Certification |
|
|
|
|
|
|
|
(b) |
Reports |
Report on Form 8-K dated December 18, 2008 |
|
|
|
on |
|
|
|
|
Form |
Report on Form 8-K dated December 22, 2008 |
|
|
|
8-K |
|
|
|
|
|
Report on Form 8-K dated February 9, 2009 |
|
|
|
|
|
|
|
|
|
Report on Form 8-K dated May 11, 2009 |
|
|
|
|
|
|
|
|
|
Report on Form 8-K dated August 7, 2009 |
|
|
|
|
|
|
|
|
|
Report on Form 8-K dated September 16, 2009 |
|
|
|
|
|
|
|
|
|
Report on Form 8-K dated December 1, 2009 |
|
|
|
|
|
|
|
|
|
Report on Form 8-K dated December 9, 2009 |
|
|
|
|
|
|
|
||
|
|
|
|
|
* |
Filed herewith. |
|
37
Report of Independent Registered Public Accounting Firm
To the Board
of Directors and Shareholders
Ark Restaurants Corp.
We have audited the accompanying consolidated balance sheets of Ark Restaurants Corp. and Subsidiaries as of October 3, 2009 and September 27, 2008, and the related consolidated statements of operations, shareholders’ equity and cash flows for each of the two years in the period ended October 3, 2009. These consolidated financial statements are the responsibility of the Company’s management. Our responsibility is to express an opinion on these consolidated financial statements based on our audits.
We conducted our audits in accordance with the standards of the Public Company Accounting Oversight Board (United States). Those standards require that we plan and perform the audit to obtain reasonable assurance about whether the financial statements are free of material misstatement. An audit includes examining, on a test basis, evidence supporting the amounts and disclosures in the financial statements. An audit also includes assessing the accounting principles used and significant estimates made by management, as well as evaluating the overall financial statement presentation. We believe that our audits provide a reasonable basis for our opinion.
In our opinion, the consolidated financial statements referred to above present fairly, in all material respects, the consolidated financial position of Ark Restaurants Corp. and Subsidiaries as of October 3, 2009 and September 27, 2008, and their consolidated results of operations and cash flows for each of the two years in the period ended October 3, 2009, in conformity with accounting principles generally accepted in the United States of America.
/s/ J.H. Cohn LLP
Jericho, New
York
January 4, 2010
F-1
|
|
|
ARK RESTAURANTS CORP. AND SUBSIDIARIES |
|
(In Thousands, Except Per Share Amounts) |
|
|
|
|
|
|
|
|
|
|
|
|
October 3, |
|
September 27, |
|
||
|
|
|
2009 |
|
2008 |
|
||
|
|
|
|
|
||||
|
|
|
|
|
|
|
|
|
|
ASSETS |
|
|
|
|
|
|
|
|
CURRENT ASSETS: |
|
|
|
|
|
|
|
|
Cash and cash equivalents |
|
$ |
5,452 |
|
$ |
2,978 |
|
|
Short-term investments in available-for-sale securities |
|
|
8,139 |
|
|
9,267 |
|
|
Accounts receivable |
|
|
2,031 |
|
|
2,862 |
|
|
Related party receivables, net |
|
|
504 |
|
|
881 |
|
|
Employee receivables |
|
|
584 |
|
|
281 |
|
|
Current portion of long-term receivables |
|
|
129 |
|
|
121 |
|
|
Inventories |
|
|
1,547 |
|
|
1,556 |
|
|
Prepaid expenses and other current assets |
|
|
428 |
|
|
362 |
|
|
|
|
|
|
||||
|
Total current assets |
|
|
18,814 |
|
|
18,308 |
|
|
|
|
|
|
||||
|
LONG-TERM RECEIVABLES, LESS CURRENT PORTION |
|
|
102 |
|
|
231 |
|
|
|
|
|
|
||||
|
FIXED ASSETS - At cost: |
|
|
|
|
|
|
|
|
Leasehold improvements |
|
|
31,655 |
|
|
31,533 |
|
|
Furniture, fixtures and equipment |
|
|
29,459 |
|
|
28,372 |
|
|
Construction in progress |
|
|
2,652 |
|
|
44 |
|
|
|
|
|
|
||||
|
|
|
|
63,766 |
|
|
59,949 |
|
|
Less accumulated depreciation and amortization |
|
|
38,688 |
|
|
35,087 |
|
|
|
|
|
|
||||
|
FIXED ASSETS - Net |
|
|
25,078 |
|
|
24,862 |
|
|
INTANGIBLE ASSETS - Net |
|
|
45 |
|
|
62 |
|
|
GOODWILL |
|
|
4,813 |
|
|
4,813 |
|
|
TRADEMARKS |
|
|
721 |
|
|
721 |
|
|
DEFERRED INCOME TAXES |
|
|
5,216 |
|
|
4,312 |
|
|
OTHER ASSETS |
|
|
547 |
|
|
701 |
|
|
|
|
|
|
||||
|
TOTAL |
|
$ |
55,336 |
|
$ |
54,010 |
|
|
|
|
|
|
||||
|
|
|
|
|
|
|
|
|
|
LIABILITIES AND SHAREHOLDERS’ EQUITY |
|
|
|
|
|
|
|
|
CURRENT LIABILITIES: |
|
|
|
|
|
|
|
|
Accounts payable - trade |
|
$ |
2,541 |
|
$ |
2,834 |
|
|
Accrued expenses and other current liabilities |
|
|
6,036 |
|
|
5,312 |
|
|
Accrued income taxes |
|
|
655 |
|
|
823 |
|
|
Dividend payable |
|
|
3,490 |
|
|
- |
|
|
Current portion of note payable |
|
|
209 |
|
|
195 |
|
|
|
|
|
|
||||
|
Total current liabilities |
|
|
12,931 |
|
|
9,164 |
|
|
OPERATING LEASE DEFERRED CREDIT |
|
|
3,917 |
|
|
3,695 |
|
|
NOTE PAYABLE, LESS CURRENT PORTION |
|
|
302 |
|
|
510 |
|
|
OTHER LIABILITIES |
|
|
84 |
|
|
157 |
|
|
|
|
|
|
||||
|
TOTAL LIABILITIES |
|
|
17,234 |
|
|
13,526 |
|
|
|
|
|
|
||||
|
NON-CONTROLLING INTERESTS |
|
|
2,304 |
|
|
2,681 |
|
|
|
|
|
|
||||
|
COMMITMENTS AND CONTINGENCIES - Note 10 |
|
|
|
|
|
|
|
|
SHAREHOLDERS’ EQUITY: |
|
|
|
|
|
|
|
|
Common stock, par value $.01 per share - authorized, 10,000 shares; issued |
|
|
57 |
|
|
57 |
|
|
Additional paid-in capital |
|
|
22,501 |
|
|
22,068 |
|
|
Accumulated other comprehensive loss |
|
|
(29 |
) |
|
(30 |
) |
|
Retained earnings |
|
|
23,440 |
|
|
25,427 |
|
|
|
|
|
|
||||
|
|
|
|
45,969 |
|
|
47,522 |
|
|
Less stock option receivable |
|
|
(76 |
) |
|
(124 |
) |
|
Less treasury stock, at cost, of 2,177 and 2,135 shares at October 3,
2009 |
|
|
(10,095 |
) |
|
(9,595 |
) |
|
|
|
|
|
||||
|
Total shareholders’ equity |
|
|
35,798 |
|
|
37,803 |
|
|
|
|
|
|
||||
|
TOTAL |
|
$ |
55,336 |
|
$ |
54,010 |
|
|
|
|
|
|
||||
See notes to consolidated financial statements.
F-2
|
|
|
ARK RESTAURANTS CORP. AND SUBSIDIARIES |
|
(In Thousands, Except Per Share Amounts) |
|
|
|
|
|
|
|
|
|
|
|
|
Year Ended |
|
||||
|
|
|
|
|||||
|
|
|
October 3, |
|
September 27, |
|
||
|
|
|
|
|
||||
|
|
|
|
|
|
|
||
|
|
|
|
|
|
|
|
|
|
REVENUES: |
|
|
|
|
|
|
|
|
Food and beverage sales |
|
$ |
112,944 |
|
$ |
122,934 |
|
|
Other income |
|
|
2,063 |
|
|
2,456 |
|
|
|
|
|
|
||||
|
Total revenues |
|
|
115,007 |
|
|
125,390 |
|
|
|
|
|
|
||||
|
|
|
|
|
|
|
|
|
|
COSTS AND EXPENSES: |
|
|
|
|
|
|
|
|
Food and beverage cost of sales |
|
|
29,420 |
|
|
32,807 |
|
|
Payroll expenses |
|
|
37,111 |
|
|
38,325 |
|
|
Occupancy expenses |
|
|
16,649 |
|
|
16,809 |
|
|
Other operating costs and expenses |
|
|
16,102 |
|
|
15,520 |
|
|
General and administrative expenses |
|
|
8,834 |
|
|
9,051 |
|
|
Depreciation and amortization |
|
|
3,619 |
|
|
3,091 |
|
|
|
|
|
|
||||
|
Total costs and expenses |
|
|
111,735 |
|
|
115,603 |
|
|
|
|
|
|
||||
|
OPERATING INCOME |
|
|
3,272 |
|
|
9,787 |
|
|
|
|
|
|
||||
|
OTHER (INCOME) EXPENSE: |
|
|
|
|
|
|
|
|
Interest expense |
|
|
43 |
|
|
57 |
|
|
Interest income |
|
|
(295 |
) |
|
(490 |
) |
|
Other income, net |
|
|
(559 |
) |
|
(716 |
) |
|
|
|
|
|
||||
|
Total other income, net |
|
|
(811 |
) |
|
(1,149 |
) |
|
|
|
|
|
||||
|
Income from continuing operations before provision for income taxes and non-controlling interests |
|
|
4,083 |
|
|
10,936 |
|
|
Provision for income taxes |
|
|
1,240 |
|
|
3,676 |
|
|
(Income) loss attributable to non-controlling interests |
|
|
216 |
|
|
(299 |
) |
|
|
|
|
|
||||
|
INCOME FROM CONTINUING OPERATIONS |
|
|
3,059 |
|
|
6,961 |
|
|
|
|
|
|
||||
|
DISCONTINUED OPERATIONS: |
|
|
|
|
|
|
|
|
Income from operations of discontinued restaurants |
|
|
- |
|
|
26 |
|
|
Provision for income taxes |
|
|
- |
|
|
9 |
|
|
|
|
|
|
||||
|
INCOME FROM DISCONTINUED OPERATIONS |
|
|
- |
|
|
17 |
|
|
|
|
|
|
||||
|
NET INCOME |
|
$ |
3,059 |
|
$ |
6,978 |
|
|
|
|
|
|
||||
|
|
|
|
|
|
|
|
|
|
PER SHARE INFORMATION - BASIC AND DILUTED: |
|
|
|
|
|
|
|
|
Income from continuing operations |
|
$ |
0.88 |
|
$ |
1.94 |
|
|
Discontinued operations |
|
|
- |
|
|
- |
|
|
|
|
|
|
||||
|
BASIC |
|
$ |
0.88 |
|
$ |
1.94 |
|
|
|
|
|
|
||||
|
|
|
|
|
|
|
|
|
|
Income from continuing operations |
|
$ |
0.87 |
|
$ |
1.93 |
|
|
Discontinued operations |
|
|
- |
|
|
- |
|
|
|
|
|
|
||||
|
DILUTED |
|
$ |
0.87 |
|
$ |
1.93 |
|
|
|
|
|
|
||||
|
|
|
|
|
|
|
|
|
|
WEIGHTED AVERAGE NUMBER OF SHARES - BASIC |
|
|
3,494 |
|
|
3,594 |
|
|
|
|
|
|
||||
|
|
|
|
|
|
|
|
|
|
WEIGHTED AVERAGE NUMBER OF SHARES - DILUTED |
|
|
3,506 |
|
|
3,608 |
|
|
|
|
|
|
||||
See notes to consolidated financial statements.
F-3
|
|
|
ARK RESTAURANTS CORP. AND SUBSIDIARIES |
|
|
|
(In Thousands) |
|
|
|
|
|
|
|
|
|
|
|
|
Year Ended |
|
||||
|
|
|
|
|||||
|
|
|
October
3, |
|
September
27, |
|
||
|
|
|
|
|
||||
|
|
|||||||
|
CASH FLOWS FROM OPERATING ACTIVITIES: |
|
|
|
|
|
|
|
|
Net income |
|
$ |
3,059 |
|
$ |
6,978 |
|
|
Adjustments to reconcile net income to net cash provided by operating activities: |
|
|
|
|
|
|
|
|
Deferred income taxes |
|
|
(905 |
) |
|
451 |
|
|
Stock-based compensation |
|
|
433 |
|
|
312 |
|
|
Depreciation and amortization |
|
|
3,619 |
|
|
3,091 |
|
|
Equity in loss of affiliate |
|
|
166 |
|
|
127 |
|
|
Loss on disposal of discontinued operations |
|
|
- |
|
|
19 |
|
|
Impairment loss on goodwill related to discontinued operations |
|
|
- |
|
|
294 |
|
|
Income (loss) attributable to non-controlling interests |
|
|
(216 |
) |
|
299 |
|
|
Operating lease deferred credit |
|
|
222 |
|
|
(76 |
) |
|
Changes in operating assets and liabilities: |
|
|
|
|
|
|
|
|
Accounts receivable |
|
|
831 |
|
|
(205 |
) |
|
Related party receivables |
|
|
377 |
|
|
437 |
|
|
Inventories |
|
|
9 |
|
|
(146 |
) |
|
Prepaid expenses and other current assets |
|
|
(66 |
) |
|
270 |
|
|
Other assets |
|
|
(12 |
) |
|
(512 |
) |
|
Accounts payable - trade |
|
|
(293 |
) |
|
430 |
|
|
Accrued expenses and other current liabilities |
|
|
724 |
|
|
(191 |
) |
|
Accrued income taxes |
|
|
(168 |
) |
|
(312 |
) |
|
|
|
|
|
||||
|
Net cash provided by continuing operating activities |
|
|
7,780 |
|
|
11,266 |
|
|
Net cash provided by (used in) discontinued operating activities |
|
|
(73 |
) |
|
56 |
|
|
|
|
|
|
||||
|
Net cash provided by operating activities |
|
|
7,707 |
|
|
11,322 |
|
|
|
|
|
|
||||
|
|
|
|
|
|
|
|
|
|
CASH FLOWS FROM INVESTING ACTIVITIES: |
|
|
|
|
|
|
|
|
Purchases of fixed assets |
|
|
(3,817 |
) |
|
(8,080 |
) |
|
Proceeds from sale of discontinued operations |
|
|
- |
|
|
1,030 |
|
Loans and advances made to employees |
|
|
(518 |
) |
|
(77 |
) |
|
Payments received on employee receivables |
|
|
215 |
|
|
112 |
|
|
Purchases of investment securities |
|
|
(10,992 |
) |
|
(14,645 |
) |
|
Proceeds from sales of investment securities |
|
|
12,121 |
|
|
14,500 |
|
|
Payments received on long-term receivables |
|
|
121 |
|
|
114 |
|
|
|
|
|
|
||||
|
Net cash used in continuing investing activities |
|
|
(2,870 |
) |
|
(7,046 |
) |
|
Net cash provided by discontinued investing activities |
|
|
- |
|
|
153 |
|
|
|
|
|
|
||||
|
Net cash used in investing activities |
|
|
(2,870 |
) |
|
(6,893 |
) |
|
|
|
|
|
||||
|
|
|
|
|
|
|
|
|
|
CASH FLOWS FROM FINANCING ACTIVITIES: |
|
|
|
|
|
|
|
|
Principal payments on note payable |
|
|
(194 |
) |
|
(180 |
) |
|
Dividends paid |
|
|
(1,556 |
) |
|
(6,331 |
) |
|
Purchase of treasury stock |
|
|
(500 |
) |
|
(1,209 |
) |
|
Payments received on stock option receivable |
|
|
48 |
|
|
42 |
|
|
Capital contributions from non-controlling interests |
|
|
- |
|
|
2,500 |
|
|
Distributions to non-controlling interest |
|
|
(161 |
) |
|
(282 |
) |
|
|
|
|
|
||||
|
Net cash used in financing activities |
|
|
(2,363 |
) |
|
(5,460 |
) |
|
|
|
|
|
||||
|
NET INCREASE (DECREASE) IN CASH AND CASH EQUIVALENTS |
|
|
2,474 |
|
|
(1,031 |
) |
|
CASH AND CASH EQUIVALENTS, Beginning of year |
|
|
2,978 |
|
|
4,009 |
|
|
|
|
|
|
||||
|
CASH AND CASH EQUIVALENTS, End of year |
|
$ |
5,452 |
|
$ |
2,978 |
|
|
|
|
|
|
||||
|
|
|||||||
|
SUPPLEMENTAL DISCLOSURES OF CASH FLOW INFORMATION: |
|
|
|
|
|
|
|
|
Cash paid during the year for: |
|
|
|
|
|
|
|
|
Interest |
|
$ |
43 |
|
$ |
57 |
|
|
|
|
|
|
||||
|
Income taxes |
|
$ |
2,295 |
|
$ |
3,557 |
|
|
|
|
|
|
||||
|
Non-cash investing activity: |
|
|
|
|
|
|
|
|
Investment in unconsolidated affiliates |
|
$ |
- |
|
$ |
298 |
|
|
|
|
|
|
||||
|
Non-cash financing activity: |
|
|
|
|
|
|
|
|
Accrued dividends on common stock |
|
$ |
3,490 |
|
$ |
- |
|
|
|
|
|
|
||||
See notes to consolidated financial statements.
F-4
|
|
|
ARK RESTAURANTS CORP. AND SUBSIDIARIES |
|
CONSOLIDATED STATEMENTS OF SHAREHODLERS’ EQUITY |
|
(In Thousands) |
|
|
|
|
|
|
|
|
|
|
|
|
|
|
|
|
|
|
|
|
|
|
|
|
|
|
|
|
|
|
|
|
|
|
|
Accumulated |
|
|
|
|
|
|
|
Total |
|
|||||||
|
|
|
Common Stock |
|
Additional Paid- |
|
|
Retained |
|
Stock Option |
|
Treasury |
|
|
|||||||||||
|
|
|
|
|
|
|
|
|
|
||||||||||||||||
|
|
|
Shares |
|
Amount |
|
|
|
|
|
|
|
|||||||||||||
|
|
|
|
||||||||||||||||||||||
|
|
|
|
|
|
|
|
|
|
|
|
|
|
|
|
|
|
|
|
|
|
|
|
|
|
|
BALANCE - September 29, 2007 |
|
5,667 |
|
$ |
57 |
|
$ |
21,756 |
|
$ |
49 |
|
$ |
24,780 |
|
$ |
(166 |
) |
$ |
(8,386 |
) |
$ |
38,090 |
|
|
|
|
|
|
|
|
|
|
|
|
|
|
|
|
|
|
|
|
|
|
|
|
|
|
|
|
Stock-based compensation |
|
- |
|
|
- |
|
|
312 |
|
|
- |
|
|
- |
|
|
- |
|
|
- |
|
|
312 |
|
|
Payment of dividends - $1.76 per share |
|
- |
|
|
- |
|
|
- |
|
|
- |
|
|
(6,331 |
) |
|
- |
|
|
- |
|
|
(6,331 |
) |
|
Unrealized loss on available-for-sale securities |
|
- |
|
|
- |
|
|
- |
|
|
(79 |
) |
|
- |
|
|
- |
|
|
- |
|
|
(79 |
) |
|
Repayments on stock option receivable |
|
- |
|
|
- |
|
|
- |
|
|
- |
|
|
- |
|
|
42 |
|
|
- |
|
|
42 |
|
|
Purchases of treasury stock |
|
- |
|
|
- |
|
|
- |
|
|
- |
|
|
- |
|
|
- |
|
|
(1,209 |
) |
|
(1,209 |
) |
|
Net income |
|
- |
|
|
- |
|
|
- |
|
|
- |
|
|
6,978 |
|
|
- |
|
|
- |
|
|
6,978 |
|
|
|
|
|
||||||||||||||||||||||
|
|
|
|
|
|
|
|
|
|
|
|
|
|
|
|
|
|
|
|
|
|
|
|
|
|
|
BALANCE - September 27, 2008 |
|
5,667 |
|
|
57 |
|
|
22,068 |
|
|
(30 |
) |
|
25,427 |
|
|
(124 |
) |
|
(9,595 |
) |
|
37,803 |
|
|
|
|
|
|
|
|
|
|
|
|
|
|
|
|
|
|
|
|
|
|
|
|
|
|
|
|
Stock-based compensation |
|
- |
|
|
- |
|
|
433 |
|
|
- |
|
|
- |
|
|
- |
|
|
- |
|
|
433 |
|
|
Payment of dividends - $1.44 per share |
|
- |
|
|
- |
|
|
- |
|
|
- |
|
|
(5,046 |
) |
|
- |
|
|
- |
|
|
(5,046 |
) |
|
Unrealized gain on available-for-sale securities |
|
- |
|
|
- |
|
|
- |
|
|
1 |
|
|
- |
|
|
- |
|
|
- |
|
|
1 |
|
|
Repayments on stock option receivable |
|
- |
|
|
- |
|
|
- |
|
|
- |
|
|
- |
|
|
48 |
|
|
- |
|
|
48 |
|
|
Purchases of treasury stock |
|
- |
|
|
- |
|
|
- |
|
|
- |
|
|
- |
|
|
- |
|
|
(500 |
) |
|
(500 |
) |
|
Net income |
|
- |
|
|
- |
|
|
- |
|
|
- |
|
|
3,059 |
|
|
- |
|
|
- |
|
|
3,059 |
|
|
|
|
|
||||||||||||||||||||||
|
|
|
|
|
|
|
|
|
|
|
|
|
|
|
|
|
|
|
|
|
|
|
|
|
|
|
BALANCE - October 3, 2009 |
|
5,667 |
|
$ |
57 |
|
$ |
22,501 |
|
$ |
(29 |
) |
$ |
23,440 |
|
$ |
(76 |
) |
$ |
(10,095 |
) |
$ |
35,798 |
|
|
|
|
|
||||||||||||||||||||||
See notes to consolidated financial statements.
F-5
ARK RESTAURANTS CORP. AND SUBSIDIARIES
|
|
|
|
|
|
1. |
BUSINESS AND SUMMARY OF SIGNIFICANT ACCOUNTING POLICIES |
|
|
|
|
|
Ark Restaurants Corp. and Subsidiaries (the “Company”) owns and operates 20 restaurants and bars, 30 fast food concepts and catering operations. Seven restaurants are located in New York City, four are located in Washington, D.C., five are located in Las Vegas, Nevada, two are located in Atlantic City, New Jersey, one is located at the Foxwoods Resort Casino in Ledyard, Connecticut and one is located in Boston, Massachusetts. The Las Vegas operations include three restaurants within the New York-New York Hotel & Casino Resort and operation of the hotel’s room service, banquet facilities, employee dining room and nine food court concepts; one bar within the Venetian Casino Resort as well as three food court concepts; and one restaurant within the Planet Hollywood Resort and Casino. In Atlantic City, New Jersey, the Company operates a restaurant and a bar in the Resorts Atlantic City Hotel and Casino. The operations at the Foxwoods Resort Casino include one fast food concept and six fast food concepts at the MGM Grand Casino. In Boston, Massachusetts, the Company operates a restaurant in the Faneuil Hall Marketplace. The Florida operations under management include five fast food facilities in Tampa, Florida and seven fast food facilities in Hollywood, Florida, each at a Hard Rock Hotel and Casino. |
|
|
|
|
|
Basis of Presentation —The accompanying consolidated financial statements have been prepared pursuant to the rules and regulations of the Securities and Exchange Commission (“SEC”) and accounting principles generally accepted in the United States of America (“GAAP”). The Company’s reporting currency is the United States dollar. |
|
|
|
|
|
FASB Accounting Standards Codification — The issuance by the FASB of the Accounting Standards CodificationTM (the “Codification”) on July 1, 2009 (effective for interim or annual reporting periods ending after September 15, 2009), changes the way that GAAP is referenced. Beginning on that date, the Codification officially became the single source of authoritative nongovernmental GAAP; however, SEC registrants must also consider rules, regulations, and interpretive guidance issued by the SEC or its staff. The change affects the way the Company refers to GAAP in financial statements and in its accounting policies. All existing standards that were used to create the Codification became superseded. Instead, references to standards consist solely of the number used in the Codification’s structural organization. |
|
|
|
|
|
Subsequent Events — In May 2009, the FASB issued ASC Topic 855: Subsequent Events (“ASC855”), which establishes general standards of accounting for and disclosure of events that occur after the balance sheet date but before financial statements are issued. The Company has considered subsequent events for recognition or disclosure through January 4, 2010, the date of this filing, in preparing the consolidated financial statements and notes thereto. |
|
|
|
|
|
Accounting Period — The Company’s fiscal year ends on the Saturday nearest September 30. The fiscal year ended October 3, 2009 included 53 weeks and the fiscal year ended September 27, 2008 included 52 weeks. |
F-6
|
|
|
|
|
Use of Estimates — The preparation of financial statements in conformity with accounting principles generally accepted in the United States of America requires management to make estimates and assumptions that affect the reported amounts of assets and liabilities and disclosure of contingent assets and liabilities at the date of the financial statements and the reported amounts of revenues and expenses during the reporting period. The accounting estimates that require management’s most difficult and subjective judgments include allowances for potential bad debts on receivables, inventories, the useful lives and recoverability of its assets, such as property and intangibles, fair values of financial instruments and share-based compensation, the realizable value of its tax assets and other matters. Because of the uncertainty in such estimates, actual results may differ from these estimates. |
|
|
|
|
|
Principles of Consolidation — The consolidated financial statements include the accounts of Ark Restaurants Corp. and all of its wholly owned subsidiaries, partnerships and other entities in which it has a controlling interest. All significant intercompany balances and transactions have been eliminated in consolidation. |
|
|
|
|
|
Non-Controlling Interests — Non-controlling interests represent capital contributions, income and loss attributable to the shareholders of less than wholly-owned and consolidated partnerships. |
|
|
|
|
|
Fair Value of Financial Instruments — The carrying amount of cash and cash equivalents, investments, receivables, accounts payable, and accrued expenses approximate fair value due to the immediate or short-term maturity of these financial instruments. The fair value of notes payable is determined using current applicable rates for similar instruments as of the balance sheet date and approximates the carrying value of such debt. |
|
|
|
|
|
Reclassifications — Certain reclassifications of prior year balances have been made to conform to the current year presentation. In connection with the planned or actual sale or closure of various restaurants, the operations of these businesses have been presented as discontinued operations in the consolidated financial statements. Accordingly, the Company has reclassified its statements of operations and cash flow data for the prior periods presented. These dispositions are discussed below in “Recent Restaurant Dispositions.” |
|
|
|
|
|
Cash and Cash Equivalents — Cash and cash equivalents, which primarily consist of money market funds, are stated at cost, which approximates fair value. For financial statement presentation purposes, the Company considers all highly liquid investments having original maturities of three months or less to be cash equivalents. Outstanding checks in excess of account balances, typically vendor payments, payroll and other contractual obligations disbursed after the last day of a reporting period are reported as a current liability in the accompanying consolidated balance sheets. |
|
|
|
|
|
Available-For-Sale Securities — Available-for-sale securities consist primarily of United States Treasury Bills and Notes, all of which have a high degree of liquidity and are reported at fair value, with unrealized gains and losses recorded in accumulated other comprehensive income. The cost of investments in available-for-sale securities is determined on a specific identification basis. Realized gains or losses and declines in value judged to be other than temporary, if any, are reported in other income, net. The Company evaluates its investments periodically for possible impairment and reviews factors such as the length of time and extent to which fair value has been below cost basis and the Company’s ability and intent to hold the investment for a period of time which may be sufficient for anticipated recovery in market value. |
|
|
|
|
|
Concentrations of Credit Risk — Financial instruments that potentially subject the Company to concentrations of credit risk consist primarily of cash and cash equivalents. The Company reduces credit risk by placing its cash and cash equivalents with major financial institutions with high credit ratings. At times, such amounts may exceed Federally insured limits. As of October 3, 2009, the Company had cash and cash equivalent balances, primarily consisting of cash deposit accounts, which exceeded the Federal Deposit Insurance Corporation limitation for coverage by approximately $4,500,000. |
|
|
|
|
|
For the year ended October 3, 2009, the Company made purchases from one vendor that accounted for approximately 16% of total purchases. For the year ended September 27, 2008, the Company made purchases from two vendors that accounted for approximately 22% of total purchases. |
|
|
|
|
|
Accounts Receivable — Accounts receivable is primarily composed of normal business receivables such as credit card receivables that are paid off in a short period of time and amounts due from our managed outlets and hotel |
F-7
|
|
|
|
|
charges, and are recorded when the products or services have been delivered. We review the collectability of our receivables on an ongoing basis, and provide for an allowance when we consider the entity unable to meet its obligation. |
|
|
|
|
|
Inventories — Inventories are stated at the lower of cost (first-in, first-out) or market, and consist of food and beverages, merchandise for sale and other supplies. |
|
|
|
|
|
Revenue Recognition — The Company-owned restaurant sales are composed almost entirely of food and beverage sales. The Company records revenue at the time of the purchase of products by customers. |
|
|
|
|
|
Management fees, which are included in Revenues – Other Income, are related to the Company’s managed restaurants that are not consolidated and are based on either gross restaurant sales or cash flow. The Company recognizes management fee income in the period sales are made or cash flow is generated. |
|
|
|
|
|
The Company offers customers the opportunity to purchase gift certificates. At the time of purchase by the customer, the Company records a gift certificate liability for the face value of the certificate purchased. The Company recognizes the revenue and reduces the gift certificate liability when the certificate is redeemed. The Company does not reduce its recorded liability for potential non-use of purchased gift cards. |
|
|
|
|
|
Additionally, the Company presents sales tax on a net basis in its consolidated financial statements. |
|
|
|
|
|
Fixed Assets — Leasehold improvements and furniture, fixtures and equipment are stated at cost. Depreciation of furniture, fixtures and equipment is computed using the straight-line method over the estimated useful lives of the respective assets (three to seven years). Amortization of improvements to leased properties is computed using the straight-line method based upon the initial term of the applicable lease or the estimated useful life of the improvements, whichever is less, and ranges from 5 to 30 years. For leases with renewal periods at the Company’s option, if failure to exercise a renewal option imposes an economic penalty to the Company, management may determine at the inception of the lease that renewal is reasonably assured and include the renewal option period in the determination of appropriate estimated useful lives. |
|
|
|
|
|
The Company includes in construction in progress improvements in restaurants that are under construction. Once the projects have been completed, the Company begins depreciating and amortizing the assets. Start-up costs incurred during the construction period of restaurants, including rental of premises, training and payroll, are expensed as incurred. |
|
|
|
|
|
Intangible Assets — Costs associated with acquiring leases and subleases, principally purchased leasehold rights, have been capitalized and are being amortized on the straight-line method based upon the initial terms of the applicable lease agreements, which range from 9 to 20 years. Covenants not to compete arising from restaurant acquisitions are amortized over the contractual period, typically five years. |
|
|
|
|
|
Amortization expense for intangible assets was $17,000 and $18,000 for fiscal years ended 2009 and 2008, respectively. |
|
|
|
|
|
Long-lived Assets — Long-lived assets, such as property, plant and equipment, and purchased intangibles subject to amortization, are reviewed for impairment whenever events or changes in circumstances indicate that the carrying amount of an asset may not be recoverable. In the evaluation of the fair value and future benefits of long-lived assets, the Company performs an analysis of the anticipated undiscounted future net cash flows of the related long-lived assets. If the carrying value of the related asset exceeds the undiscounted cash flows, the carrying value is reduced to its fair value. Various factors including estimated future sales growth and estimated profit margins are included in this analysis. Management believes at this time that carrying values and useful lives continue to be appropriate. For the years ended October 3, 2009 and September 27, 2008, no impairment charges were deemed necessary. |
F-8
|
|
|
|
|
Goodwill and Trademarks — Goodwill is recorded when the purchase price paid for an acquisition exceeds the estimated fair value of the net identified tangible and intangible assets acquired. Trademarks, which were acquired in connection with the Durgin Park acquisition, are considered to have an indefinite life and are not being amortized. Goodwill and certain intangible assets are assessed for impairment using fair value measurement techniques. Specifically, goodwill impairment is determined using a two-step process. The first step of the goodwill impairment test is to identify potential impairment by comparing the fair value of the reporting unit (the Company is being treated as one reporting unit) with its net book value (or carrying amount), including goodwill. If the fair value of the reporting unit exceeds its carrying amount, goodwill of the reporting unit is considered not impaired and the second step of the impairment test is unnecessary. If the carrying amount of the reporting unit exceeds its fair value, the second step of the goodwill impairment test is performed to measure the amount of impairment loss, if any. The second step of the goodwill impairment test compares the implied fair value of the reporting unit’s goodwill with the carrying amount of that goodwill. If the carrying amount of the reporting unit’s goodwill exceeds the implied fair value of that goodwill, an impairment loss is recognized in an amount equal to that excess. The implied fair value of goodwill is determined in the same manner as the amount of goodwill recognized in a business combination. That is, the fair value of the reporting unit is allocated to all of the assets and liabilities of that unit (including any unrecognized intangible assets) as if the reporting unit had been acquired in a business combination and the fair value of the reporting unit was the purchase price paid to acquire the reporting unit. The impairment test for other intangible assets consists of a comparison of the fair value of the intangible asset with its carrying value. If the carrying value of the intangible asset exceeds its fair value, an impairment loss is recognized in an amount equal to that excess. |
|
|
|
|
|
Determining the fair value of the reporting unit under the first step of the goodwill impairment test and determining the fair value of individual assets and liabilities of the reporting unit (including unrecognized intangible assets) under the second step of the goodwill impairment test is judgmental in nature and often involves the use of significant estimates and assumptions. Similarly, estimates and assumptions are used in determining the fair value of other intangible assets. These estimates and assumptions could have a significant impact on whether or not an impairment charge is recognized and also the magnitude of any such charge. To assist in the process of determining goodwill impairment, the Company performs internal valuation analyses and considers other market information that is publicly available. Estimates of fair value are primarily determined using discounted cash flows, market comparisons and recent transactions. These approaches use significant estimates and assumptions including projected future cash flows (including timing), a discount rate reflecting the risk inherent in future cash flows, perpetual growth rate, determination of appropriate market comparables and the determination of whether a premium or discount should be applied to comparables. Based on the above policy, no impairment charges were necessary in fiscal 2009 and approximately $294,000 of goodwill impairment expense was recorded during fiscal year 2008 in connection with restaurant dispositions. |
|
|
|
|
|
Leases — The Company recognizes rent expense on a straight-line basis over the expected lease term, including option periods as described below. Within the provisions of certain leases there are escalations in payments over the base lease term, as well as renewal periods. The effects of the escalations have been reflected in rent expense on a straight-line basis over the expected lease term, which includes option periods when it is deemed to be reasonably assured that the Company would incur an economic penalty for not exercising the option. Percentage rent expense is generally based upon sales levels and is expensed as incurred. Certain leases include both base rent and percentage rent. The Company records rent expense on these leases based upon reasonably assured sales levels. The consolidated financial statements reflect the same lease terms for amortizing leasehold improvements as were used in calculating straight-line rent expense for each restaurant. The judgments of the Company may produce materially different amounts of amortization and rent expense than would be reported if different lease terms were used. |
|
|
|
|
|
Operating Lease Deferred Credit — Several of the Company’s operating leases contain predetermined increases in the rentals payable during the term of such leases. For these leases, the aggregate rental expense over the lease term is recognized on a straight-line basis over the lease term. The excess of the expense charged to operations in any year and amounts payable under the leases during that year are recorded as deferred credits that reverse over the lease term. |
F-9
|
|
|
|
|
Occupancy Expenses — Occupancy expenses include rent, rent taxes, real estate taxes, insurance and utility costs. |
|
|
|
|
|
Defined Contribution Plans — The Company offers a defined contribution savings plan (the “Plan”) to all of its full-time employees. Eligible employees may contribute pre-tax amounts to the Plan subject to the Internal Revenue Code limitations. Company contributions to the Plan are at the discretion of the Board of Directors. During the years ended October 3, 2009 and September 27, 2008, the Company did not make any contributions to the Plan. |
|
|
|
|
|
Income Taxes — Income taxes are accounted for under the asset and liability method as prescribed by ASC Topic 740: Income Taxes (“ASC 740”). Deferred tax assets and liabilities are recognized for future tax consequences attributable to the temporary differences between the financial statement carrying amounts of assets and liabilities and their respective tax bases and operating loss and tax credit carryforwards. Deferred tax assets and liabilities are measured using enacted tax rates expected to apply in the years in which those temporary differences are expected to be recovered or settled. The effect on deferred tax assets and liabilities of a change in tax rates is recognized in the period that includes the enactment date. Deferred tax assets are reduced by a valuation allowance when, in the opinion of management, it is more likely than not that some portion or all of the deferred tax assets will not be realized. |
|
|
|
|
|
ASC 740 also prescribes a recognition threshold and measurement attribute for the financial statement recognition and measurement of a tax position taken or expected to be taken in a tax return as well as providing guidance on derecognition, classification, interest and penalties, accounting in interim periods, disclosure, and transition. The Company adopted the provisions of ASC 740 relating to uncertain tax positions, during the first fiscal quarter of 2008 and it had no impact on our consolidated financial position, results of operation or cash flows, nor did the Company have any related interest or penalties. As a result of the implementation, the Company recognized no material adjustment to the liability for unrecognized income tax benefits that existed as of September 29, 2007. It is the Company’s policy to recognize interest and penalties related to uncertain tax positions as a component of income tax expense. |
|
|
|
|
|
Non-controlling interests relating to the income or loss of consolidated partnerships includes no provision for income taxes as any tax liability related thereto is the responsibility of the individual minority investors. |
|
|
|
|
|
Income Per Share of Common Stock — Basic net income per share is computed in accordance with ASC Topic 260: Earnings Per Share (“ASC 260”), and is calculated on the basis of the weighted average number of common shares outstanding during each period. Diluted net income per share reflects the additional dilutive effect of potentially dilutive shares (principally those arising from the assumed exercise of stock options). |
|
|
|
|
|
Share-based Compensation — Effective October 2, 2005, the Company adopted ASC Topic 718: Compensation – Stock Compensation (“ASC 718”) and began expensing the grant-date fair value of employee stock options using the modified prospective transition method. Under the modified prospective transition method, non-cash compensation expense is recognized under the fair value method for the portion of outstanding equity-based awards granted prior to the adoption of ASC 718 for which service has not been rendered, and for any equity-based awards granted or modified after adoption. Accordingly, periods prior to adoption have not been restated. Prior to the adoption of ASC 718, the Company accounted for equity-based compensation using the intrinsic value method. Accordingly, prior to October 2, 2005, no compensation expense had been recognized for employee stock options, as options granted had an exercise price equal to the market value of the underlying common stock on the date of grant. Upon adoption of ASC 718, the Company elected to value employee stock options using the Black-Scholes option valuation method that uses assumptions that relate to the expected volatility of the Company’s common stock, the expected dividend yield of our stock, the expected life of the options and the risk free interest rate. |
|
|
|
|
|
The Company uses the alternative transition method for calculating the tax effects of share-based compensation. The alternative transition method includes a simplified method to establish the beginning balance of the additional paid-in capital pool (APIC pool) related to the effects of employee share-based compensation, which is available to absorb tax deficiencies recognized subsequent to the adoption of ASC 718. |
F-10
|
|
|
|
|
During fiscal 2009, options to purchase 176,600 shares of common stock were granted at an exercise price of $12.04 per share and are exercisable as to 50% of the shares commencing on the first anniversary of the date of grant and as to an additional 50% commencing on the second anniversary of the date of grant. Such options had an aggregate grant date fair value of approximately $624,000. The Company did not grant any options during the fiscal year 2008. The Company generally issues new shares upon the exercise of employee stock options. |
|
|
|
|
|
The fair value of each of the Company’s stock options is estimated on the date of grant using a Black-Scholes option-pricing model that uses assumptions that relate to the expected volatility of the Company’s common stock, the expected dividend yield of our stock, the expected life of the options and the risk free interest rate. The assumptions used for the 2009 grant include a risk free interest rate of 3.29%, volatility of 42.7%, a dividend yield of 4.27% and an expected life of 5.75 years. |
|
|
|
|
|
New Accounting Standards Adopted in Fiscal 2009 — In September 2006, the FASB ASC Topic 820: Fair Value Measurements and Disclosures (“ASC 820”), which, among other requirements, defines fair value, establishes a framework for measuring fair value, and expands disclosures about the use of fair value to measure assets and liabilities. ASC 820 prescribes a single definition of fair value as the price that would be received to sell an asset or paid to transfer a liability in an orderly transaction between market participants at the measurement date. For financial instruments and certain nonfinancial assets and liabilities that are recognized or disclosed at fair value on a recurring basis at least annually, ASC 820 is effective beginning the first fiscal year that begins after November 15, 2007, which corresponds to the Company’s 2009 fiscal year. For all other nonfinancial assets and liabilities the effective date of ASC 820 has been delayed to the first fiscal year beginning after November 15, 2008, which corresponds to the Company’s fiscal year beginning October 4, 2009. The Company adopted ASC 820 effective as of the beginning of fiscal 2009, and its application had no impact on the Company’s consolidated financial statements. |
|
|
|
|
|
In February 2007, the FASB issued ASC Topic 825: Financial Instruments (“ASC 825”), which allows companies to elect fair-value measurement when an eligible financial asset or financial liability is initially recognized or when an event, such as a business combination, triggers a new basis of accounting for that financial asset or financial liability. The election must be applied to individual contracts, is irrevocable for every contract chosen to be measured at fair value, and must be applied to an entire contract, not to only specified risks, specific cash flows, or portions of that contract. Changes in the fair value of contracts elected to be measured at fair value are recognized in earnings each reporting period. The Company adopted this accounting pronouncement in fiscal 2009 with no effect on the Company’s consolidated financial statements as the Company did not use the fair-value measurement election for any eligible financial assets or financial liabilities. |
|
|
|
|
|
In March 2008, the FASB issued ASC Topic 815: Derivatives and Hedging (“ASC 815”), which requires enhanced disclosures about an entity’s derivative and hedging activities and thereby improves the transparency of financial reporting. The objective of the guidance is to provide users of financial statements with an enhanced understanding of how and why an entity uses derivative instruments; how derivative instruments and related hedged items are accounted for; and how derivative instruments and related hedged items affect an entity’s financial position, financial performance, and cash flows. The Company adopted this accounting pronouncement in fiscal 2009 and its application had no impact on the Company’s consolidated financial statements. |
|
|
|
|
|
In April 2009 the FASB issued a staff position (“FSP”) requiring disclosures about fair value in interim financial statements as well as in annual financial statements. This FSP applies to all financial instruments within the scope of ASC Topic 825: Financial Instruments (“ASC 825”) and requires all entities to disclose the methods and significant assumptions used to estimate the fair value of financial instruments. The related provisions of ASC 825 are effective for interim and annual periods ending after June 15, 2009 and do not require comparative disclosure for earlier periods presented upon initial adoption. The Company adopted this guidance during the third fiscal quarter of 2009, and its application had no impact on the Company’s consolidated financial statements. |
|
|
|
|
|
In June 2009, the FASB issued ASC Topic 855: Subsequent Events (“ASC 855”) which incorporates the subsequent events guidance contained in the auditing standards literature into authoritative accounting literature. It also requires entities to disclose the date through which they have evaluated subsequent events and whether the date corresponds with the release of their financial statements. ASC 855 is effective for all interim and annual |
F-11
|
|
|
|
|
periods ending after June 15, 2009. The Company adopted this accounting pronouncement in the third quarter of fiscal 2009 (see Note 1 - Subsequent Events). |
|
|
|
|
|
New Accounting Standards Not Yet Adopted — In December 2007, the FASB issued ASC Topic 805: Business Combinations (“ASC 805”), which establishes principles and requirements for the reporting entity in a business combination, including recognition and measurement in the financial statements of the identifiable assets acquired, the liabilities assumed, and any non-controlling interest in the acquiree. This statement also establishes disclosure requirements to enable financial statement users to evaluate the nature and financial effects of the business combination. ASC 805 applies prospectively to business combinations for which the acquisition date is on or after the beginning of the first annual reporting period beginning on or after December 15, 2008. ASC 805 will become effective for our fiscal year beginning October 4, 2009. |
|
|
|
|
|
In December 2007, the FASB issued ASC Topic 810: Consolidation (“ASC 810”), to establish accounting and reporting standards for the non-controlling interest in a subsidiary and for the deconsolidation of a subsidiary. This standard defines a non-controlling interest, previously referred to as minority interest, as the portion of equity in a subsidiary not attributable, directly or indirectly, to a parent. ASC 810 requires, among other items, that a non-controlling interest be included in the consolidated balance sheet within equity separate from the parent’s equity; consolidated net income to be reported at amounts inclusive of both the parent’s and non-controlling interest’s shares and, separately, the amounts of consolidated net income attributable to the parent and non-controlling interest all on the consolidated statement of income; and if a subsidiary is deconsolidated, any retained non-controlling equity investment in the former subsidiary be measured at fair value and a gain or loss be recognized in net income based on such fair value. ASC 810 is effective for fiscal years beginning after December 15, 2008, which corresponds to the Company’s fiscal year beginning October 4, 2009. The Company is currently evaluating the potential impact of adopting ASC 810 on its consolidated financial statements. |
|
|
|
|
|
In April 2008, the FASB issued a staff position (“FSP”) that amends the list of factors an entity should consider in developing renewal or extension assumptions in determining the useful life of recognized intangible assets under ASC 350. The new guidance applies to (1) intangible assets that are acquired individually or with a group of other assets and (2) intangible assets acquired in both business combinations and asset acquisitions. Under this FSP, entities estimating the useful life of a recognized intangible asset must consider their historical experience in renewing or extending similar arrangements or, in the absence of historical experience, must consider assumptions that market participants would use about renewal or extension. This FSP is effective for fiscal years beginning after December 15, 2008, which corresponds to the Company’s fiscal year beginning October 4, 2009. The Company is currently evaluating the impact that the adoption of this FSP may have on its consolidated financial statements and related disclosures. |
|
|
|
|
|
In June 2009, the FASB issued a new accounting pronouncement, SFAS No. 166, “Accounting for Transfers of Financial Assets — an amendment of FASB Statement No. 140” (to be included in ASC Topic 860: Transfers and Servicing, when codified), regarding transfers of financial assets which improves the relevance, representational faithfulness and comparability of the information that a reporting entity provides in its financial reports, including the effects of the transfer on an entity’s financial position, financial performance and cash flows and the transferor’s continuing involvement in transferred financial assets. This pronouncement is effective for the Company’s fiscal year beginning October 3, 2010. The Company is currently evaluating the impact that the adoption of this pronouncement may have on its consolidated financial statements and related disclosures. |
|
|
|
|
|
In June 2009, the FASB issued a new accounting pronouncement, SFAS No. 167, “Amendments to FASB Interpretation No. 46(R)” (to be included in ASC Topic 810: Consolidation, when codified), which amends the consolidation guidance applicable to variable interest entities and is effective as of the beginning of the first annual reporting period that begins after November 15, 2009, which corresponds to the Company’s fiscal year beginning October 3, 2010. The Company is currently evaluating the impact that the adoption of this pronouncement may have on its consolidated financial statements and related disclosures. |
F-12
|
|
|
|
2. |
RECENT RESTAURANT EXPANSION |
|
|
|
|
|
In 2006, the Company entered into an agreement to lease space for a Mexican restaurant, Yolos, at the Planet Hollywood Resort and Casino (formerly known as the Aladdin Resort and Casino) in Las Vegas, Nevada. The obligation to pay rent for Yolos commenced when the restaurant opened for business in January 2008. |
|
|
|
|
|
In June 2007, the Company entered into an agreement to design and lease a food court at the MGM Grand Casino at the Foxwoods Resort Casino which commenced operations during the third fiscal quarter of 2008. A limited liability company has been established to develop, construct, operate and manage the food court. The Company, through a wholly-owned subsidiary, is the managing member of this limited liability company and has an aggregate ownership interest in the food court operations of 67%. Such operations have been consolidated as of and for the fiscal year ended September 27, 2008. |
|
|
|
|
|
In June 2008, the Company signed two successive one-year agreements to use certain deck space adjacent to the Sequoia location in New York City as a Café. |
|
|
|
|
|
In June 2008, the Company entered into an agreement to design and lease a restaurant at The Museum of Arts & Design at Columbus Circle in New York City. The initial term of the lease for this facility will expire on December 31 sixteen years after the date the restaurant first opens for business to the public following its current refurbishment and will have two five-year renewals. This restaurant opened during the first quarter of fiscal 2010. |
|
|
|
|
3. |
RECENT RESTAURANT DISPOSITIONS |
|
|
|
|
|
During the first fiscal quarter of 2008, the Company discontinued the operation of our Columbus Bakery retail and wholesale bakery located in New York City. Columbus Bakery was originally intended to serve as the bakery that would provide all of our New York restaurants with baked goods as well as being a retail bakery operation. As a result of the sale and closure of several of our restaurants in New York City during the last several years, this bakery operation was no longer profitable. During the second fiscal quarter of 2008, the Company opened, along with certain third party investors, a new concept at this location called “Pinch & S’Mac” which features pizza and macaroni and cheese. We contributed Columbus Bakery’s net fixed assets and cash into this venture and received an ownership interest of 37.5%. These operations are not consolidated in the Company’s consolidated financial statements. |
|
|
|
|
|
Effective June 30, 2008, the lease for the Company’s Stage Deli facility at the Forum Shops in Las Vegas, Nevada expired. The landlord for this facility offered to renew the lease at this location prior to its expiration at a significantly increased rent. The Company determined that it would not be able to operate this facility profitably at this location at the rent offered in the landlord’s renewal proposal. As a result, the Company discontinued these operations during the third fiscal quarter of 2008 and took a charge for the impairment of goodwill of $294,000 and recorded a loss on disposal of $19,000. The impairment charge and disposal loss are included in discontinued operations. Operations for the fiscal year ended September 27, 2008 have been reclassified as discontinued operations. |
F-13
|
|
|
|
|
The Company accounts for its closed restaurants in accordance with the provisions of ASC Topic 205: Discontinued Operations (“ASC 205”). Therefore, when the Company makes a decision to close a restaurant, the restaurant’s operations are eliminated from the ongoing operations. Accordingly, the operations of such restaurants, net of applicable income taxes, are presented as discontinued operations and prior period operations of such restaurants, net of applicable income taxes, are reclassified. Discontinued operations consist of the following: |
|
|
|
|
|
|
|
|
|
|
|
Year Ended |
||||
|
|
|
|||||
|
|
|
October 3, |
|
September 27, |
||
|
|
|
|
||||
|
|
|
(In thousands) |
||||
|
|
|
|
||||
|
Revenues |
|
|
$— |
|
|
$3,100 |
|
|
|
|
|
|
|
|
|
Income before income taxes |
|
|
$— |
|
|
$ 26 |
|
|
|
|
|
|
|
|
|
Income from discontinued restaurants, net of taxes |
|
|
$— |
|
|
$ 17 |
|
|
|
|
4. |
INVESTMENT SECURITIES |
|
|
|
|
|
Effective September 28 2008, the Company adopted ASC 820 for assets and liabilities measured at fair value on a recurring basis. ASC 820 accomplishes the following key objectives: |
|
|
|
|
|
|
|
|
• |
Defines fair value as the price that would be received to sell an asset or paid to transfer a liability in an orderly transaction between market participants at the measurement date; |
|
|
|
|
|
|
|
|
• |
Establishes a three-level hierarchy (“Valuation Hierarchy”) for fair value measurements; |
|
|
|
|
|
|
|
|
• |
Requires consideration of the Company’s creditworthiness when valuing liabilities; and |
|
|
|
|
|
|
|
|
• |
Expands disclosures about instruments measured at fair value. |
|
|
|
|
|
|
|
The Valuation Hierarchy is based upon the transparency of inputs to the valuation of an asset or liability as of the measurement date. A financial instrument’s categorization within the Valuation Hierarchy is based upon the lowest level of input that is significant to the fair value measurement. The three levels of the Valuation Hierarchy and the distribution of the Company’s financial assets within it are as follows: |
||
|
|
|
|
|
|
|
|
• |
Level 1 - inputs to the valuation methodology are quoted prices (unadjusted) for identical assets or liabilities in active markets. |
|
|
|
|
|
|
|
|
• |
Level 2 - inputs to the valuation methodology include quoted prices for similar assets and liabilities in active markets, and inputs that are observable for the asset or liability, either directly or indirectly, for substantially the full term of the financial instrument. |
|
|
|
|
|
|
|
|
• |
Level 3 – inputs to the valuation methodology are unobservable and significant to the fair value measurement. |
F-14
|
|
|
|
|
|
|
|
|
|
|
|
|
|
|
|
|
The following available-for-sale securities are re-measured to fair value on a recurring basis and are valued at October 3, 2009, using Level 1 inputs and the market approach as defined by ASC 820: |
||||||||||||
|
|
|
|
|
|
|
|
|
|
|
|
|
|
|
|
|
|
|
Amortized |
|
Gross Unrealized |
|
Gross Unrealized |
|
|
||||
|
|
|
|
Cost |
|
Holding Gains |
|
Holding Losses |
|
Fair Value |
||||
|
|
|
|
|
|
|
||||||||
|
|
|
|
(In thousands) |
||||||||||
|
|
At October 3, 2009 |
|
|
|
|
|
|
|
|
|
|
|
|
|
|
Available-for-sale short-term: |
|
|
|
|
|
|
|
|
|
|
|
|
|
|
Government debt securities |
|
$ |
8,168 |
|
$ |
- |
|
$ |
(29 |
) |
$ |
8,139 |
|
|
|
|
|
|
|
||||||||
|
|
|
|
$ |
8,168 |
|
$ |
- |
|
$ |
(29 |
) |
$ |
8,139 |
|
|
|
|
|
|
|
||||||||
|
|
|
|
|
|
|
|
|
|
|
|
|
|
|
|
|
|
|
Amortized |
|
Gross Unrealized |
|
Gross Unrealized |
|
|
||||
|
|
|
|
Cost |
|
Holding Gains |
|
Holding Losses |
|
Fair Value |
||||
|
|
|
|
|
|
|
||||||||
|
|
|
|
(In thousands) |
||||||||||
|
|
At September 27, 2008 |
|
|
|
|
|
|
|
|
|
|
|
|
|
|
Available-for-sale short-term: |
|
|
|
|
|
|
|
|
|
|
|
|
|
|
Government debt securities |
|
$ |
8,897 |
|
$ |
- |
|
$ |
(30 |
) |
$ |
8,867 |
|
|
Corporate debt securities |
|
|
400 |
|
|
- |
|
|
- |
|
|
400 |
|
|
|
|
|
|
|
||||||||
|
|
|
|
$ |
9,297 |
|
$ |
- |
|
$ |
(30 |
) |
$ |
9,267 |
|
|
|
|
|
|
|
||||||||
|
|
|
|
|
At October 3, 2009, all of the Company’s government debt securities mature within fiscal year 2010. |
|
|
|
|
5. |
LONG-TERM RECEIVABLES |
|
|
|
|
|
In March 2005, the Company sold a restaurant for $1,300,000. Cash of $600,000 was included on the sale. Of the $600,000 cash, $200,000 was paid to the Company as a fee to manage the restaurant for four months prior to closure and the balance was paid directly to the landlord. The remaining $700,000 was received in the form of a note receivable, at an interest rate of 6%, in installments through June 2011. As of October 3, 2009, the Company was due $231,000, of this $102,000 was long-term and $129,000 was current. |
|
|
|
|
|
The carrying value of the Company’s long-term receivables approximates their current aggregate fair value. |
|
|
|
|
6. |
INTANGIBLE ASSETS |
|
|
|
|
|
Intangible assets consist of the following: |
|
|
|
|
|
|
|
|
|
|
|
October 3, |
|
September 27, |
||
|
|
|
2009 |
|
2008 |
||
|
|
|
|
||||
|
|
|
(In thousands) |
||||
|
|
|
|
||||
|
Purchased leasehold rights (a) |
|
$ |
2,343 |
|
$ |
2,343 |
|
Noncompete agreements and other |
|
|
322 |
|
|
322 |
|
|
|
|
||||
|
|
|
|
2,665 |
|
|
2,665 |
|
|
|
|
|
|
|
|
|
Less accumulated amortization |
|
|
2,620 |
|
|
2,603 |
|
|
|
|
||||
|
|
|
|
|
|
|
|
|
Total intangible assets |
|
$ |
45 |
|
$ |
62 |
|
|
|
|
||||
|
|
|
|
|
|
(a) |
Purchased leasehold rights arise from acquiring leases and subleases of various restaurants. |
F-15
|
|
|
|
|
|
|
|
|
7. |
GOODWILL AND TRADEMARKS |
|
|
|
|
|
|
|
Goodwill is the excess of cost over fair market value of tangible and intangible net assets acquired. Goodwill is not presently amortized but tested for impairment annually or when the facts or circumstances indicate a possible impairment of goodwill as a result of a continual decline in performance or as a result of fundamental changes in a market. Trademarks, which have indefinite lives, are not currently amortized and are tested for impairment annually or when facts or circumstances indicate a possible impairment as a result of a continual decline in performance or as a result of fundamental changes in a market. The changes in the carrying amount of goodwill and trademarks for the years ended October 3, 2009 and September 28, 2008 are as follows (in thousands): |
|
|
|
|
|
|
|
|
|
|
|
|
|
|
|
|
Goodwill |
|
Trademarks |
|
Total |
|
|||
|
|
|
|
|
|
||||||
|
|
|
|
|
|
|
|
|
|
|
|
|
Balance as of September 29, 2007 |
|
$ |
5,107 |
|
$ |
721 |
|
$ |
5,828 |
|
|
Acquired during the year |
|
|
- |
|
|
- |
|
|
- |
|
|
Impairment losses |
|
|
(294 |
) |
|
- |
|
|
(294 |
) |
|
|
|
|
|
|
||||||
|
Balance as of September 27, 2008 |
|
|
4,813 |
|
|
721 |
|
|
5,534 |
|
|
Acquired during the year |
|
|
- |
|
|
- |
|
|
- |
|
|
Impairment losses |
|
|
- |
|
|
- |
|
|
- |
|
|
|
|
|
|
|
||||||
|
Balance as of October 3, 2009 |
|
$ |
4,813 |
|
$ |
721 |
|
$ |
5,534 |
|
|
|
|
|
|
|
||||||
|
|
|
|
8. |
OTHER ASSETS |
|
|
|
|
|
Other assets consist of the following: |
|
|
|
|
|
|
|
|
|
|
|
October 3, |
|
September 27, |
||
|
|
|
2009 |
|
2008 |
||
|
|
|
|
||||
|
|
|
(In thousands) |
||||
|
|
|
|
|
|
||
|
Deposits and other |
|
$ |
416 |
|
$ |
403 |
|
Investments in unconsolidated affiliates (a) |
|
|
131 |
|
|
298 |
|
|
|
|
||||
|
|
|
|
|
|
|
|
|
|
|
$ |
547 |
|
$ |
701 |
|
|
|
|
||||
|
|
|
|
|
|
(a) |
During the second fiscal quarter of 2008, we opened, along with certain third party investors, a new concept at our former Columbus Bakery location called “Pinch & S’Mac” which features pizza and macaroni and cheese. We contributed Columbus Bakery’s net fixed assets and cash into this venture and received an ownership interest of 37.5%. These operations are not consolidated in the Company’s consolidated financial statements. Included in Other income, net for fiscal 2009 and 2008 are losses of approximately $166,000 and $127,000, respectively, related to this affiliate. |
F-16
|
|
|
|
|
9. |
ACCRUED EXPENSES AND OTHER CURRENT LIABILITIES |
|
|
|
|
|
|
|
Accrued expenses and other current liabilities consist of the following: |
|
|
|
|
|
|
|
|
|
|
|
|
October 3, |
|
September 27, |
||
|
|
|
2009 |
|
2008 |
||
|
|
|
|
||||
|
|
|
(In thousands) |
||||
|
|
|
|
|
|
||
|
Sales tax payable |
|
$ |
808 |
|
$ |
766 |
|
Accrued wages and payroll related costs |
|
|
1,495 |
|
|
1,623 |
|
Customer advance deposits |
|
|
1,269 |
|
|
1,586 |
|
Accrued and other liabilities |
|
|
2,464 |
|
|
1,337 |
|
|
|
|
||||
|
|
|
|
|
|
|
|
|
|
|
$ |
6,036 |
|
$ |
5,312 |
|
|
|
|
||||
|
|
|
|
10. |
COMMITMENTS AND CONTINGENCIES |
|
|
|
|
|
Leases — The Company leases its restaurants, bar facilities, and administrative headquarters through its subsidiaries under terms expiring at various dates through 2032. Most of the leases provide for the payment of base rents plus real estate taxes, insurance and other expenses and, in certain instances, for the payment of a percentage of the restaurants’ sales in excess of stipulated amounts at such facility. |
|
|
|
|
|
As of October 3, 2009, future minimum lease payments under noncancelable leases are as follows: |
|
|
|
|
|
|
Fiscal Year |
|
Amount |
|
|
|
|
||
|
|
|
(In thousands) |
|
|
|
|
|
|
|
2010 |
|
$ |
7,347 |
|
2011 |
|
|
7,283 |
|
2012 |
|
|
6,515 |
|
2013 |
|
|
6,344 |
|
2014 |
|
|
5,771 |
|
Thereafter |
|
|
22,352 |
|
|
|
||
|
|
|
|
|
|
Total minimum payments |
|
$ |
55,612 |
|
|
|
||
|
|
|
|
|
In connection with certain of the leases included in the table above, the Company obtained and delivered irrevocable letters of credit in the aggregate amount of $1,042,000 as security deposits under such leases. |
|
|
|
|
|
Rent expense was approximately $12,927,000 and $13,235,000 during the fiscal years ended October 3, 2009 and September 27, 2008, respectively. Contingent rentals, included in rent expense, were approximately $3,956,000 and $4,931,000 for the fiscal years ended October 3, 2009 and September 27, 2008, respectively. |
|
|
|
|
|
Legal Proceedings — In the ordinary course of its business, the Company is a party to various lawsuits arising from accidents at its restaurants and worker’s compensation claims, which are generally handled by the Company’s insurance carriers. The employment by the Company of management personnel, waiters, waitresses and kitchen staff at a number of different restaurants has resulted in the institution, from time to time, of litigation alleging violation by the Company of employment discrimination laws. Included in Accrued Expenses and Other Current Liabilities is approximately $600,000 related to the settlement of various claims against the Company. |
F-17
|
|
|
|
11. |
COMMON STOCK REPURCHASE PLAN |
|
|
|
|
|
On March 25, 2008, the Board of Directors authorized a stock repurchase program under which up to 500,000 shares of the Company’s common stock may be acquired in the open market over the two years following such authorization at the Company’s discretion. |
|
|
|
|
|
During the years ended October 3, 2009 and September 27, 2008, the Company purchased an aggregate of 42,000 and 64,954 shares at an average purchase price of 11.90 and $18.61, respectively in the open market pursuant to the stock repurchase program. |
|
|
|
|
12. |
STOCK OPTIONS |
|
|
|
|
|
The Company has options outstanding under two stock option plans, the 1996 Stock Option Plan (the “1996 Plan) and the 2004 Stock Option Plan (the “2004 Plan”). In 2004 the Company terminated the 1996 Plan. This action terminated the 257,000 authorized but unissued options under the 1996 Plan but it did not affect any of the options previously issued under the 1996 Plan. |
|
|
|
|
|
Options granted under the 1996 Plan are exercisable at prices at least equal to the fair market value of such stock on the dates the options were granted. The options expire five years after the date of grant and are generally exercisable as to 25% of the shares commencing on the first anniversary of the date of grant and as to an additional 25% commencing on each of the second, third and fourth anniversaries of the grant date. |
|
|
|
|
|
The 2004 Stock Option Plan, which was approved by shareholders, is the Company’s only equity compensation plan currently in effect. Under the 2004 Stock Option Plan, 450,000 options were authorized for future grant. Options granted under the 2004 Plan are exercisable at prices at least equal to the fair market value of such stock on the dates the options were granted. The options expire ten years after the date of grant. During fiscal 2005, options to purchase 194,000 shares of common stock were granted and are exercisable as to 50% of the shares commencing on the first anniversary of the date of grant and as to an additional 50% commencing on the second anniversary of the date of grant. During fiscal 2007, options to purchase 105,000 shares of common stock were granted and are exercisable as to 25% of the shares commencing on the first anniversary of the date of grant and as to an additional 25% commencing on each of the second, third and fourth anniversaries of the grant date. During fiscal 2009, options to purchase 176,600 shares of common stock were granted and are exercisable as to 50% of the shares commencing on the first anniversary of the date of grant and as to an additional 50% commencing on the second anniversary of the date of grant. The following table summarizes stock option activity under all plans: |
|
|
|
|
|
|
|
|
|
|
|
|
|
|
|
|
|
|
|
|
|
|
|
|
2009 |
|
2008 |
|
||||||||||||||
|
|
|
|
|
||||||||||||||||
|
|
|
|
|
Weighted |
|
Aggregate |
|
|
|
Weighted |
|
Aggregate |
|
||||||
|
|
|
|
|
Average |
|
Intrinsic |
|
|
|
Average |
|
Intrinsic |
|
||||||
|
|
|
|
|
Exercise |
|
Value (in |
|
|
|
Exercise |
|
Value (in |
|
||||||
|
|
|
Shares |
|
Price |
|
thousands) |
|
Shares |
|
Price |
|
thousands) |
|
||||||
|
|
|
|
|
|
|
|
|
||||||||||||
|
|
|
|
|
|
|
|
|
|
|
|
|
|
|
|
|
|
|
|
|
|
Outstanding, beginning of year |
|
|
271,500 |
|
$ |
30.59 |
|
|
|
|
|
271,500 |
|
$ |
30.59 |
|
|
|
|
|
|
|||||||||||||||||||
|
Options: |
|
|
|
|
|
|
|
|
|
|
|
|
|
|
|
|
|
|
|
|
Granted |
|
|
176,600 |
|
$ |
12.04 |
|
|
|
|
|
- |
|
|
- |
|
|
|
|
|
Exercised |
|
|
- |
|
|
- |
|
|
|
|
|
- |
|
|
- |
|
|
|
|
|
Canceled or expired |
|
|
(26,000 |
) |
$ |
30.09 |
|
|
|
|
|
- |
|
|
- |
|
|
|
|
|
|
|
|
|
|
|
|
|
|
|
|
|
|
|
|
|
||||
|
|
|||||||||||||||||||
|
Outstanding, end of year (a) |
|
|
422,100 |
|
$ |
22.86 |
|
$ |
- |
|
|
271,500 |
|
$ |
30.59 |
|
$ |
- |
|
|
|
|
|
|
|
|
|
|
|
|
|
|
||||||||
|
|
|||||||||||||||||||
|
Options exercisable (a) |
|
|
245,500 |
|
$ |
30.61 |
|
$ |
- |
|
|
219,000 |
|
$ |
30.21 |
|
$ |
- |
|
|
|
|
|
|
|
|
|
|
|
|
|
|
|
|
|
|
||||
|
|
|||||||||||||||||||
|
Weighted average remaining contractual life - outstanding |
|
|
7.5 Years |
|
|
|
|
|
|
|
|
7.0 Years |
|
|
|
|
|
|
|
|
|
|||||||||||||||||||
|
Shares available for future grant |
|
|
400 |
|
|
|
|
|
|
|
|
151,000 |
|
|
|
|
|
|
|
|
|
|
|
|
|
(a) |
Options become exercisable at various times expiring through 2016. |
F-18
|
|
|
|
|
The following table summarizes information about stock options outstanding as of October 3, 2009 (shares in thousands): |
|
|
|
|
|
|
|
|
|
|
|
|
|
|
|
|
|
|
|
|
|
|
|
|
Options Outstanding |
|
Options Exercisable |
|
||||||||||||||
|
|
|
|
|
||||||||||||||||
|
|
|
|
|
|
|
Weighted |
|
|
|
|
|
Weighted |
|
||||||
|
|
|
|
|
Weighted |
|
Average |
|
|
|
Weighted |
|
Average |
|
||||||
|
|
|
|
|
Average |
|
Remaining |
|
|
|
Average |
|
Remaining |
|
||||||
|
|
|
Number of |
|
Exercise |
|
contractual |
|
Number of |
|
Exercise |
|
contractual |
|
||||||
|
Range of Exercise Prices |
|
Shares |
|
Price |
|
life (in years) |
|
Shares |
|
Price |
|
life (in years) |
|
||||||
|
|
|
|
|
|
|
|
|||||||||||||
|
|
|
|
|
|
|
|
|
|
|
|
|
|
|
|
|
|
|
|
|
|
$12.04 |
|
|
176,600 |
|
$ |
12.04 |
|
|
9.6 |
|
|
- |
|
$ |
- |
|
|
- |
|
|
$26.60 |
|
|
145,500 |
|
$ |
26.60 |
|
|
7.2 |
|
|
145,500 |
|
$ |
26.60 |
|
|
7.2 |
|
|
$32.15 |
|
|
100,000 |
|
$ |
32.15 |
|
|
5.2 |
|
|
100,000 |
|
$ |
32.15 |
|
|
5.2 |
|
|
|
|
|
|
|
|
|
|
|
|
|
|
|
|
|
|
||||
|
|
|
|
422,100 |
|
$ |
22.86 |
|
|
7.5 |
|
|
245,500 |
|
$ |
30.61 |
|
|
6.0 |
|
|
|
|
|
|
|
|
|
|
|
|
|
|
|
|
|
|
||||
|
|
|
|
|
Compensation cost charged to operations for the fiscal years ended 2009 and 2008 for share-based compensation programs was approximately $433,000 and $312,000, before tax benefits of approximately $132,000 and $108,000, respectively. The compensation cost recognized is classified as a general and administrative expense in the consolidated statements of operations. |
|
|
|
|
|
As of October 3, 2009, there was approximately $725,000 of unrecognized compensation cost related to unvested stock options, which is expected to be recognized over a period of approximately two years. |
|
|
|
|
13. |
MANAGEMENT FEE INCOME |
|
|
|
|
|
The Company provides management services to two fast food courts and one fast food unit it does not consolidate. In accordance with the contractual arrangements, the Company earns management fees based on gross sales or cash flow as defined by the agreements. Management fee income, included in Revenues – Other Income, relating to these services was approximately $1,952,000 and $2,368,000 for the years ended October 3, 2009 and September 27, 2008, respectively. Such amount for the year ended October 3, 2009 included approximately $758,000 for management fees and $1,194,000 for profit distributions. Such amount for the year ended September 27, 2008 included approximately $968,000 for management fees and $1,400,000 for profit distributions. |
|
|
|
|
|
Receivables from managed restaurants, included in Related Party Receivables, were approximately $344,000 and $881,000 at October 3, 2009 and September 27, 2008, respectively. Such amount at October 3, 2009 included approximately $140,000 for management fees and $204,000 for expense advances. Such amount at September 27, 2008 included approximately $881,000 for expense advances. |
|
|
|
|
|
Managed restaurants had sales of approximately $17,815,000 and $16,068,000 during the management periods within the years ended October 3, 2009 and September 27, 2008, which are not included in consolidated net sales of the Company. |
F-19
|
|
|
|
14. |
INCOME TAXES |
|
|
|
|
|
The provision for income taxes attributable to continuing and discontinued operations consists of the following: |
|
|
|
|
|
|
|
|
|
|
|
|
|
|
Year Ended |
|
||||
|
|
|
|
|
|||||
|
|
|
|
October 3, |
|
September 27, |
|
||
|
|
|
|
2009 |
|
2008 |
|
||
|
|
|
|
|
|
||||
|
|
|
|
(In thousands) |
|
||||
|
|
|
|
|
|
|
|
|
|
|
|
Current provision: |
|
|
|
|
|
|
|
|
|
Federal |
|
$ |
1,602 |
|
$ |
2,648 |
|
|
|
State and local |
|
|
543 |
|
|
586 |
|
|
|
|
|
|
|
||||
|
|
|
|
|
2,145 |
|
|
3,234 |
|
|
|
|
|
|
|
||||
|
|
|
|
|
|
|
|
|
|
|
|
Deferred provision (benefit): |
|
|
|
|
|
|
|
|
|
Federal |
|
|
(818 |
) |
|
301 |
|
|
|
State and local |
|
|
(87 |
) |
|
150 |
|
|
|
|
|
|
|
||||
|
|
|
|
|
(905 |
) |
|
451 |
|
|
|
|
|
|
|
||||
|
|
|
|
|
|
|
|
|
|
|
|
|
|
$ |
1,240 |
|
$ |
3,685 |
|
|
|
|
|
|
|
||||
|
|
|
|
|
The effective tax rate differs from the U.S. income tax rate as follows: |
|
|
|
|
|
|
|
|
|
|
|
|
|
|
Years Ended |
|
||||
|
|
|
|
|
|||||
|
|
|
|
October 3, |
|
September 27, |
|
||
|
|
|
|
2009 |
|
2008 |
|
||
|
|
|
|
|
|
||||
|
|
|
|
(In thousands) |
|
||||
|
|
||||||||
|
|
Provision at Federal statutory rate |
|
$ |
1,388 |
|
$ |
3,837 |
|
|
|
||||||||
|
|
State and local income taxes net of |
|
|
256 |
|
|
575 |
|
|
|
||||||||
|
|
Tax credits |
|
|
(436 |
) |
|
(541 |
) |
|
|
||||||||
|
|
State and local net operating loss carryforward |
|
|
(13 |
) |
|
1 |
|
|
|
||||||||
|
|
Income (loss) attributable to non-controlling interests |
|
|
73 |
|
|
(105 |
) |
|
|
||||||||
|
|
Other |
|
|
(28 |
) |
|
(82 |
) |
|
|
|
|
|
|
||||
|
|
||||||||
|
|
|
|
$ |
1,240 |
|
$ |
3,685 |
|
|
|
|
|
|
|
||||
F-20
|
|
|
|
|
Deferred income taxes reflect the net effects of temporary differences between the carrying amounts of assets and liabilities for financial reporting and tax purposes. Significant components of the Company’s deferred tax assets and liabilities are as follows: |
|
|
|
|
|
|
|
|
|
|
|
|
|
October 3, |
|
September 27, |
||||
|
|
|
2009 |
|
2008 |
||||
|
|
|
|
||||||
|
|
|
(In thousands) |
||||||
|
|
|
|
|
|
|
|
|
|
|
Long-term deferred tax assets (liabilities): |
|
|
|
|
|
|
|
|
|
Operating loss carryforwards |
|
$ |
2,088 |
|
|
$ |
2,088 |
|
|
Operating lease deferred credits |
|
|
1,374 |
|
|
|
1,420 |
|
|
Depreciation and amortization |
|
|
748 |
|
|
|
301 |
|
|
Deferred compensation |
|
|
852 |
|
|
|
753 |
|
|
Partnership investments |
|
|
299 |
|
|
|
- |
|
|
Pension withdrawal liability |
|
|
32 |
|
|
|
61 |
|
|
Other |
|
|
91 |
|
|
|
91 |
|
|
|
|
|
||||||
|
Total long-term deferred tax assets |
|
|
5,484 |
|
|
|
4,714 |
|
|
Valuation allowance |
|
|
(240 |
) |
|
|
(253 |
) |
|
|
|
|
||||||
|
Net long-term deferred tax assets |
|
|
5,244 |
|
|
|
4,461 |
|
|
|
|
|
||||||
|
Deferred gains |
|
|
(28 |
) |
|
|
(60 |
) |
|
Partnership investments |
|
|
- |
|
|
|
(89 |
) |
|
|
|
|
||||||
|
Total long-term deferred tax liabilities |
|
|
(28 |
) |
|
|
(149 |
) |
|
|
|
|
||||||
|
|
|
|
|
|
|
|
|
|
|
Total net deferred tax assets |
|
$ |
5,216 |
|
|
$ |
4,312 |
|
|
|
|
|
||||||
|
|
|
|
|
In assessing the realizability of deferred tax assets, Management considers whether it is more likely than not that the deferred tax assets will be realized. The ultimate realization of deferred tax assets is dependent upon the generation of future taxable income. The deferred tax valuation allowance of $240,000 and 253,000 as of October 3, 2009 and September 27, 2008, respectively, was attributable to state and local net operating loss carryforwards. |
|
|
|
|
|
As of October 3, 2009, the Company has approximately of $21,350,000 of state and local net operating loss carryforwards which expire at various times beginning in the year 2015 through 2028. |
|
|
|
|
|
A reconciliation of the beginning and ending amount of unrecognized tax benefits as prescribed by ASC 740, excluding interest and penalties, is as follows: |
|
|
|
|
|
|
|
|
|
|
|
|
|
October 3, |
|
September 27, |
||||
|
|
|
2009 |
|
2008 |
||||
|
|
|
|
||||||
|
|
|
(In thousands) |
||||||
|
Balance at beginning of year |
|
$ |
292 |
|
|
$ |
315 |
|
|
|
|
|
|
|
|
|
|
|
|
Additions based on tax positions taken in current and prior years |
|
|
70 |
|
|
|
- |
|
|
Reductions due to settlements with taxing authorities |
|
|
(153 |
) |
|
|
(23 |
) |
|
Reductions as a result of a lapse of the statute of limitations |
|
|
- |
|
|
|
- |
|
|
|
|
|
||||||
|
|
|
|
|
|
|
|
|
|
|
Balance at end of year |
|
$ |
209 |
|
|
$ |
292 |
|
|
|
|
|
||||||
F-21
|
|
|
|
|
The entire amount of unrecognized tax benefits if recognized would reduce our annual effective tax rate. As of October 3, 2009 and September 27, 2008, the Company accrued approximately $43,000 and $60,000 of interest and penalties, respectively. The Company does not expect its unrecognized tax benefits to change significantly over the next 12 months. Inherent uncertainties exist in estimates of tax contingencies due to changes in tax law, both legislated and concluded through the various jurisdictions’ tax court systems. |
|
|
|
|
|
The Company files in the U.S. and various state and local income tax returns in jurisdictions with varying statutes of limitations. The 2005 through 2008 tax years generally remain subject to examination by Federal and most state and local tax authorities. An audit of the Company’s tax return for the fiscal year ended September 30, 2006 was completed by the Internal Revenue Service during fiscal 2009 without a material adjustment to the Company’s financial position or results of operations. |
|
|
|
|
15. |
OTHER INCOME |
|
|
|
|
|
Other income consists of the following: |
|
|
|
|
|
|
|
|
|
|
|
|
|
Year Ended |
||||||
|
|
|
|||||||
|
|
|
October 3, |
|
September 27, |
||||
|
|
|
2009 |
|
2008 |
||||
|
|
|
|
||||||
|
|
|
(In thousands) |
||||||
|
|
|
|
|
|
|
|
|
|
|
Purchase service fees |
|
$ |
92 |
|
|
$ |
74 |
|
|
Equity in loss of an unconsolidated affiliate |
|
|
(166 |
) |
|
|
(127 |
) |
|
Other |
|
|
633 |
|
|
|
769 |
|
|
|
|
|
||||||
|
|
|
|
|
|
|
|
|
|
|
|
|
$ |
559 |
|
|
$ |
716 |
|
|
|
|
|
||||||
|
|
|
|
16. |
INCOME PER SHARE OF COMMON STOCK |
|
|
|
|
|
A reconciliation of the numerators and denominators of the basic and diluted per share computations for the fiscal years ended October 3, 2009 and September 27, 2008 follows: |
|
|
|
|
|
|
|
|
|
|
|
|
|
|
|
|
|
Net |
|
|
|
|
||||||
|
|
|
Income |
|
Shares |
|
Per-Share |
||||||
|
|
|
(Numerator) |
|
(Denominator) |
|
Amount |
||||||
|
|
|
|
|
|||||||||
|
|
|
(In thousands, except per share amounts) |
||||||||||
|
|
|
|
|
|
|
|
|
|
|
|
|
|
|
Year ended October 3, 2009 |
|
|
|
|
|
|
|
|
|
|
|
|
|
Basic EPS |
|
$ |
3,059 |
|
|
|
3,494 |
|
|
$ |
0.88 |
|
|
Stock options |
|
|
- |
|
|
|
12 |
|
|
|
(0.01 |
) |
|
|
|
|
|
|||||||||
|
|
|
|
|
|
|
|
|
|
|
|
|
|
|
Diluted EPS |
|
$ |
3,059 |
|
|
|
3,506 |
|
|
$ |
0.87 |
|
|
|
|
|
|
|||||||||
|
|
|
|
|
|
|
|
|
|
|
|
|
|
|
Year ended September 27, 2008 |
|
|
|
|
|
|
|
|
|
|
|
|
|
Basic EPS |
|
$ |
6,978 |
|
|
|
3,594 |
|
|
$ |
1.94 |
|
|
Stock options |
|
|
- |
|
|
|
14 |
|
|
|
(0.01 |
) |
|
|
|
|
|
|||||||||
|
|
|
|
|
|
|
|
|
|
|
|
|
|
|
Diluted EPS |
|
$ |
6,978 |
|
|
|
3,608 |
|
|
$ |
1.93 |
|
|
|
|
|
|
|||||||||
|
|
|
|
|
Options to purchase 166,500 and 105,000 shares of common stock at exercises prices of $29.60 and $32.15 per share, respectively, were outstanding during the year ended September 27, 2008 but were not included in the computation of diluted EPS because the options’ exercise price was greater than the average market price of the |
F-22
|
|
|
|
|
common shares. Options to purchase 145,500 and 100,000 shares of common stock at exercise prices of $29.60 and $32.15 per share, respectively, were outstanding during the year ended October 3, 2009 but were not included in the computation of diluted EPS because the options’ exercise price was greater than the average market price of the common shares. |
|
|
|
|
17. |
STOCK OPTION RECEIVABLES |
|
|
|
|
|
Stock option receivables include amounts due from an officer totaling $76,000 and 124,000 at October 3, 2009 and September 27, 2008, respectively. Such amounts which are due from the exercise of stock options in accordance with the Company’s Stock Option Plan are payable on demand with interest (3.25% at October 3, 2009 and 5.0% at September 27, 2008). |
|
|
|
|
18. |
RELATED PARTY TRANSACTIONS |
|
|
|
|
|
During the quarter ended October 3, 2009, the Company made advances against salary to its Chief Executive Officer (the “CEO”) totaling approximately $298,000 (of which approximately $252,000 remained outstanding at October 3, 2009 and is included in Employee Receivables). In addition, the Company also loaned $160,000 to the CEO’s former wife (which is included in Related Party Receivables at October 3, 2009). The CEO believed the advances and loan were permissible after he consulted with the Company’s General Counsel. In the latter part of November 2009, the Company reviewed these matters with its auditors and informed members of its Compensation and Audit Committees and outside counsel and concluded that the advances and loan may be deemed extensions of credit and violative of the Sarbanes-Oxley Act. The CEO immediately repaid the remaining balance on the advances with interest at 6%. The loan to his former wife was repaid in October before the review had begun. |
|
|
|
|
|
Receivables due from officers (other than from the CEO), excluding stock option receivables, totaled $37,000 at October 3, 2009 and September 27, 2008. Other employee loans totaled approximately $295,000 and $244,000 at October 3, 2009 and September 27, 2008, respectively. Such loans bear interest at the minimum statutory rate (0.83% at October 3, 2009 and 2.36% at September 27, 2008). |
|
|
|
|
19. |
SUBSEQUENT EVENTS |
|
|
|
|
|
On December 1, 2009, the Board of Directors declared a quarterly dividend of $0.25 per share on the Company’s common stock to be paid on January 4, 2010 to shareholders of record at the close of business on December 15, 2009. |
******
F-23
Signatures
Pursuant to the requirements of Section 13 or 15(d) of the Securities Exchange Act of 1934, as amended, the Registrant has duly caused this report to be signed on its behalf by the undersigned, thereunto duly authorized.
|
|
|
|
|
|
|
ARK RESTAURANTS CORP. |
|
|
|
|
|
|
|
|
|
|
|
|
|
|
|
|
|
|
|
By: |
/s/Michael Weinstein |
|
|
|
|
|
|
|
|
|
Michael Weinstein |
|
|
|
|
|
|
|
|
|
Chairman of the Board and Chief Executive Officer |
|
|
|
|
|
|
|
Date: January 4, 2010 |
|
|
|
Pursuant to the requirements of the Securities Exchange Act of 1934, as amended, this report has been duly signed by the following persons on behalf of the Registrant and in the capacities and on the dates indicated.
|
|
|
|
|
|
|
|
|
Signature |
|
|
Title |
|
Date |
|
|
|
|
|
|
|||
|
|
|
|
|
|
|
|
|
|
|
|
|
|
|
|
|
|
|
|
|
|
|
|
|
/s/Michael Weinstein |
|
Chairman of the Board |
January 4, 2010 |
|||
|
|
|
|
|
|
||
|
(Michael Weinstein) |
|
and Chief Executive Officer |
|
|
||
|
|
|
|
|
|
|
|
|
/s/Vincent Pascal |
|
Senior Vice President |
January 4, 2010 |
|||
|
|
|
|
|
|
||
|
(Vincent Pascal) |
|
and Director |
|
|
||
|
|
|
|
|
|
|
|
|
/s/Robert Towers |
|
President, Treasurer, Chief |
January 4, 2010 |
|||
|
|
|
|
|
|
||
|
(Robert Towers) |
|
Operating Officer and Director |
|
|
||
|
|
|
|
|
|
|
|
|
/s/Robert Stewart |
|
Chief Financial Officer |
January 4, 2010 |
|||
|
|
|
|
||||
|
(Robert Stewart) |
|
|
|
|
|
|
|
|
|
|
|
|
|
|
|
/s/Marcia Allen |
|
Director |
January 4, 2010 |
|||
|
|
|
|
||||
|
(Marcia Allen) |
|
|
|
|
|
|
|
|
|
|
|
|
|
|
|
/s/Steven Shulman |
|
Director |
January 4, 2010 |
|||
|
|
|
|
||||
|
(Steven Shulman) |
|
|
|
|
|
|
|
|
|
|
|
|
|
|
|
/s/Paul Gordon |
|
Senior Vice President |
January 4, 2010 |
|||
|
|
|
|
|
|
||
|
(Paul Gordon) |
|
and Director |
|
|
||
|
|
|
|
|
|
|
|
|
/s/Bruce R. Lewin |
|
Director |
January 4, 2010 |
|||
|
|
|
|
||||
|
(Bruce R. Lewin) |
|
|
|
|
|
|
|
|
|
|
|
|
|
|
|
/s/Arthur Stainman |
|
Director |
January 4, 2010 |
|||
|
|
|
|
||||
|
(Arthur Stainman) |
|
|
|
|
|
|
|
|
|
|
|
|
|
|
|
/s/ Stephen Novick |
|
Director |
January 4, 2010 |
|||
|
|
|
|
||||
|
(Stephen Novick) |
|
|
|
|
|
|
Exhibits Index
|
|
|
|
|
|
|
3.1 |
|
Certificate of Incorporation of the Registrant, filed with the Secretary of State of the State of New York on January 4, 1983. |
|
|
|
|
|
|
|
3.2 |
|
Certificate of Amendment of the Certificate of Incorporation of the Registrant filed with the Secretary of State of the State of New York on October 11, 1985. |
|
|
|
|
|
|
|
3.3 |
|
Certificate of Amendment of the Certificate of Incorporation of the Registrant filed with the Secretary of State of the State of New York on July 21, 1988. |
|
|
|
|
|
|
|
3.4 |
|
Certificate of Amendment of the Certificate of Incorporation of the Registrant filed with the Secretary of State of the State of New York on May 13, 1997. |
|
|
|
|
|
|
|
3.5 |
|
Certificate of Amendment of the Certificate of Incorporation of the Registrant filed on April 24, 2002 incorporated by reference to Exhibit 3.5 to the Registrant’s Quarterly Report on Form 10-Q for the quarterly period ended March 30, 2002 (the “Second Quarter 2002 Form 10-Q”). |
|
|
|
|
|
|
|
3.6 |
|
By-Laws of the Registrant, incorporated by reference to Exhibit 3.2 to the Registrant’s Registration Statement on Form S-18 filed with the Securities and Exchange Commission on October 17, 1985. |
|
|
|
|
|
|
|
10.1 |
|
Amended and Restated Redemption Agreement dated June 29, 1993 between the Registrant and Michael Weinstein, incorporated by reference to Exhibit 10.1 to the Registrant’s Annual Report on Form 10-K for the fiscal year ended October 2, 1999 (“1994 10-K”). |
|
|
|
|
|
|
|
10.2 |
|
Form of Indemnification Agreement entered into between the Registrant and each of Michael Weinstein, Ernest Bogen, Vincent Pascal, Robert Towers, Jay Galin, Robert Stewart, Bruce R. Lewin, Paul Gordon and Donald D. Shack, incorporated by reference to Exhibit 10.2 to the 1994 10-K. |
|
|
|
|
|
|
|
10.3 |
|
Ark Restaurants Corp. Amended Stock Option Plan, incorporated by reference to Exhibit 10.3 to the 1994 10-K. |
|
|
|
|
|
|
|
10.4 |
|
Fourth Amended and Restated Credit Agreement dated as of December 27, 1999 between we and Bank Leumi USA, incorporated by reference to Exhibit 10.4 to the Registrant’s Annual Report on Form 10-K for the fiscal year ended October 2, 1999. |
|
|
|
|
|
|
|
10.5 |
|
Ark Restaurants Corp. 1996 Stock Option Plan, as amended, incorporated by reference to the Registrant’s Definitive Proxy Statement pursuant to Section 14(a) of the Securities Exchange Act of 1934 (Amendment No. 1) filed on March 16, 2001. |
|
|
|
|
|
|
|
10.6 |
|
Lease Agreement dated May 17, 1996 between New York-New York Hotel, LLC, and Las Vegas America Corp., incorporated by reference to Exhibit 10.6 to the Registrant’s Annual Report on Form 10-K for the fiscal year ended October 3, 1998 (the “1998 10-K”). |
|
|
|
|
|
|
|
10.7 |
|
Lease Agreement dated May 17, 1996 between New York-New York Hotel, LLC, and Las Vegas Festival Food Corp., incorporated by reference to Exhibit 10.7 to the 1998 10-K. |
|
|
|
|
|
|
|
10.8 |
|
Lease Agreement dated May 17, 1996 between New York-New York Hotel, LLC, and Las Vegas Steakhouse Corp., incorporated by reference to Exhibit 10.8 to the 1998 10-K. |
|
|
|
|
|
|
|
10.9 |
|
Amendment dated August 21, 2000 to the Fourth Amended and Restated Credit Agreement dated as of December 27, 1999 between we and Bank Leumi USA, incorporated by reference to Exhibit 10.9 to the Registrant’s Annual Report on Form 10-K for the fiscal year ended September 30, 2000 (the “2000 10-K”). |
|
|
|
|
|
|
|
10.10 |
|
Amendment dated November 21, 2000 to the Fourth Amended and Restated Credit Agreement dated as of December 27, 1999 between we and Bank Leumi USA, incorporated by reference to Exhibit 10.10 to the 2000 10-K. |
|
|
|
|
|
|
|
10.11 |
|
Amendment dated November 1, 2001 to the Fourth Amended and Restated Credit Agreement dated as of December 27, 1999 between we and Bank Leumi USA, incorporated by reference to Exhibit 10.11 to the Registrant’s Annual Report on Form 10-K for the fiscal year ended September 29, 2001 (the “2001 10-K”). |
|
|
|
|
|
|
|
10.12 |
|
Amendment dated December 20, 2001 to the Fourth Amended and Restated Credit Agreement dated as of December 27, 1999 between we and Bank Leumi USA, incorporated by reference to Exhibit 10.11 of the 2001 10-K. |
|
|
|
|
|
|
|
10.13 |
|
Amendment dated as of April 23, 2002 to the Fourth Amended and Restated Credit Agreement dated as of December 27, 1999 between we and Bank Leumi USA, incorporated by reference to Exhibit 10.13 of the Second Quarter 2002 Form 10-Q. |
|
|
|
|
|
|
|
10.14 |
|
Amendment dated as of January 22, 2002 to the Fourth Amended and Restated Credit Agreement dated as of December 27, 1999 between we and Bank Leumi USA, incorporated by reference to Exhibit 10.14 of the First Quarter 2003 Form 10-Q. |
|
|
|
|
|
|
|
10.15 |
|
Ark Restaurants Corp. 2004 Stock Option Plan, as amended, incorporated by reference to the Registrant’s Definitive Proxy Statement pursuant to Section 14(a) of the Securities Exchange Act of 1934 filed on January 26, 2004. |
|
|
|
|
|
|
|
14 |
|
Code of Ethics, incorporated by reference to Exhibit 14.1 to the Registrant’s Annual Report on Form 10-K for the fiscal year ended September 27, 2003. |
|
|
|
|
|
|
|
16 |
|
Letter from Deloitte & Touche LLP regarding change in certifying accountants, incorporated by reference from the exhibit included with our Current Report on Form 8-K filed with the SEC on January 15, 2004 and our Current Report on Form 8-K/A filed with the SEC on January 16, 2004. |
|
|
|
|
|
|
|
*21 |
|
Subsidiaries of the Registrant. |
|
|
|
|
|
|
|
*23 |
|
Consent of J.H. Cohn LLP. |
|
|
|
|
|
|
|
*31.1 |
|
Certification of Chief Executive Officer. |
|
|
|
|
|
|
|
*31.2 |
|
Certification of Chief Financial Officer. |
|
|
|
|
|
|
|
*32 |
|
Section 1350 Certification. |
|
|
|
|
|
* Filed herewith.