Attached files
| file | filename |
|---|---|
| EX-21 - EXHIBIT 21 - KEY TECHNOLOGY INC | ex21.htm |
| EX-32.2 - EXHIBIT 32.2 - KEY TECHNOLOGY INC | ex32_2.htm |
| EX-10.9 - EXHIBIT 10.9 - KEY TECHNOLOGY INC | ex10_9.htm |
| EX-23.1 - EXHIBIT 23.1 - KEY TECHNOLOGY INC | ex23_1.htm |
| EX-31.2 - EXHIBIT 31.2 - KEY TECHNOLOGY INC | ex31_2.htm |
| EX-32.1 - EXHIBIT 32.1 - KEY TECHNOLOGY INC | ex32_1.htm |
| EX-31.1 - EXHIBIT 31.1 - KEY TECHNOLOGY INC | ex31_1.htm |
| EX-10.11 - EXHIBIT 10.11 - KEY TECHNOLOGY INC | ex10_11.htm |
| EX-10.13 - EXHIBIT 10.13 - KEY TECHNOLOGY INC | ex10_13.htm |
| EX-10.12 - EXHIBIT 10.12 - KEY TECHNOLOGY INC | ex10_12.htm |
UNITED
STATES SECURITIES AND EXCHANGE COMMISSION
WASHINGTON,
D.C. 20549
_____________________________________________
FORM
10-K
x
ANNUAL
REPORT PURSUANT TO SECTION 13 OR 15(d) OF THE SECURITIES EXCHANGE ACT OF
1934 FOR THE FISCAL
YEAR ENDED SEPTEMBER 30, 2009
OR
o
TRANSITION
REPORT PURSUANT TO SECTION 13 OR 15(d) OF THE SECURITIES EXCHANGE ACT OF 1934
FOR THE TRANSITION PERIOD FROM ____ TO ____.
Commission
File No. 0-21820
____________________________________________
KEY
TECHNOLOGY, INC.
(Exact
name of registrant as specified in its charter)
|
Oregon
(State
or jurisdiction of incorporation or organization)
|
93-0822509
(I.R.S.
Employer Identification No.)
|
|
150
Avery Street
Walla
Walla, Washington
(Address
of Principal Executive Offices)
|
99362
(Zip
Code)
|
Registrant’s
telephone number, including area code: (509) 529-2161
____________________________________________
Securities
registered pursuant to Section 12(b) of the Act:
|
Title of each class
Common
Stock, no par value
Preferred
Stock Purchase Right
|
Name of each exchange on which
registered
The
NASDAQ Global Market
|
Securities
registered pursuant to Section 12(g) of the Act:
None
Indicate
by check mark if the registrant is a well-known seasoned issuer, as defined in
Rule 405 of the Securities Act. Yes ¨ No ý
Indicate
by check mark if the registrant is not required to file reports pursuant to
Section 13 or Section 15(d) of the Act. Yes ¨ No ý
Indicate
by check mark whether the Registrant (1) has filed all reports required to be
filed by Sections 13 or 15(d) of the Securities Exchange Act of 1934 during the
preceding 12 months (or for such shorter period that the Registrant was required
to file such reports), and (2) has been subject to such filing requirements for
the past 90 days. Yes ý No ¨
Indicate
by check mark whether the registrant has submitted electronically and posted on
its corporate Web site, if any, every Interactive Data File required to be
submitted and posted pursuant to Rule 405 of Regulation S-T (§ 232.405 of this
chapter) during the preceding 12 months (or for such shorter period that the
registrant was required to submit and post such files). Yes ¨ No ¨
Indicate
by check mark if disclosure of delinquent filers pursuant to Item 405 of
Regulation S-K is not contained herein, and will not be contained, to the best
of Registrant's knowledge, in definitive proxy or information statements
incorporated by reference in Part III of this Form 10-K or any amendment to this
Form 10-K. [ ]
Indicate
by check mark whether the registrant is a large accelerated filer, an
accelerated filer, a non-accelerated filer, or a smaller reporting
company. See the definitions of “accelerated filer”, “large
accelerated filer” and “smaller reporting company” in Rule 12b-2 of Exchange
Act. (Check one):
|
Large
accelerated filer ¨
|
Accelerated
filer ¨
|
|
Non-accelerated
filer ý (Do
not check if a smaller reporting company.)
|
Smaller
reporting company ¨
|
Indicated
by check mark whether the registrant is a shell company (as defined in Rule
12b-2 of the Exchange Act). Yes ¨ No ý
The
aggregate market value of the Registrant's common stock held by non-affiliates
on March 31, 2009 (based on the last sale price of such shares) was
approximately $41,890,147.
There
were 5,260,734 shares of the Registrant's common stock outstanding on December
4, 2009.
DOCUMENTS
INCORPORATED BY REFERENCE
Parts of
Registrant's Proxy Statement dated on or about January 4, 2010 prepared in
connection with the Annual Meeting of Shareholders to be held on February 3,
2010 are incorporated by reference into Part III of this Report.
2009
FORM 10-K
TABLE
OF CONTENTS
|
PAGE
|
||
|
1
|
||
|
2
|
||
|
10
|
||
|
15
|
||
|
16
|
||
|
16
|
||
|
16
|
||
|
19
|
||
|
20
|
||
|
31
|
||
|
33
|
||
|
61
|
||
|
61
|
||
|
62
|
||
|
62
|
||
|
62
|
||
|
63
|
||
|
63
|
||
|
64
|
||
|
66
|
||
|
67
|
||
From time
to time, Key Technology, Inc. (“Key” or the “Company”), through its management,
may make forward-looking public statements with respect to the Company
regarding, among other things, expected future revenues or earnings,
projections, plans, future performance, product development and
commercialization, and other estimates relating to the Company’s future
operations. Forward-looking statements may be included in reports
filed under the Securities Exchange Act of 1934, as amended (the “Exchange
Act”), in press releases or in oral statements made with the approval of an
authorized executive officer of Key. The words or phrases “will
likely result,” “are expected to,” “intends,” “is anticipated,” “estimates,”
“believes,” “projects” or similar expressions are intended to identify
“forward-looking statements” within the meaning of Section 21E of the Exchange
Act and Section 27A of the Securities Act of 1933, as amended, as enacted by the
Private Securities Litigation Reform Act of 1995.
Forward-looking
statements are subject to a number of risks and uncertainties. The
Company cautions investors not to place undue reliance on its forward-looking
statements, which speak only as to the date on which they are
made. Key’s actual results may differ materially from those described
in the forward-looking statements as a result of various factors, including
those listed below:
|
·
|
current
worldwide economic conditions may adversely affect the Company’s business
and results of operations, and the business of the Company’s
customers;
|
|
·
|
adverse
economic conditions, particularly in the food processing industry, either
globally or regionally, may adversely affect the Company's
revenues;
|
|
·
|
the
loss of any of the Company’s significant customers could reduce the
Company’s revenues and
profitability;
|
|
·
|
the
Company is subject to pricing pressure from its larger customers which may
reduce the Company’s profitability;
|
|
·
|
the
failure of any of the Company's independent sales representatives to
perform as expected would harm the Company's net
sales;
|
|
·
|
the
Company may make acquisitions that could disrupt the Company’s operations
and harm the Company’s operating
results;
|
|
·
|
issues
arising from the implementation of the Company's enterprise resource
planning (“ERP”) system could affect the Company’s operating results and
ability to manage the Company’s business
effectively;
|
|
·
|
the
Company's international operations subject the Company to a number of
risks that could adversely affect the Company’s revenues, operating
results and growth;
|
|
·
|
competition
and advances in technology may adversely affect sales and
prices;
|
|
·
|
failure
of the Company’s new products to compete successfully in either existing
or new markets;
|
|
·
|
the
Company's inability to retain and recruit experienced personnel may
adversely affect the Company’s business and prospects for
growth;
|
|
·
|
the
loss of members of the Company’s management team could substantially
disrupt the Company’s business
operations;
|
|
·
|
the
inability of the Company to protect the Company’s intellectual property,
especially as the Company expands geographically, may adversely affect the
Company’s competitive advantage;
|
|
·
|
intellectual
property-related litigation expenses and other costs resulting from
infringement claims asserted against the Company by third parties may
adversely affect the Company’s results of operations and the Company’s
customer relations;
|
|
·
|
the
Company's dependence on certain suppliers may leave the Company
temporarily without adequate access to raw materials or
products;
|
|
·
|
the
limited availability and possible cost fluctuations of materials used in
the Company’s products could adversely affect the Company’s gross profits;
and
|
|
·
|
the
price of the Company's common stock may fluctuate significantly and this
may make it difficult for shareholders to resell common stock when they
want or at prices they find
attractive.
|
Given
these uncertainties, readers are cautioned not to place undue reliance on the
forward-looking statements. The Company disclaims any obligation
subsequently to revise or update forward-looking statements to reflect events or
circumstances after the date of such statements or to reflect the occurrence of
anticipated or unanticipated events.
|
ITEM
1.
|
General
The
Company was founded in 1948 as a local producer of vegetable processing
equipment. The Company has evolved into a worldwide supplier of
process automation solutions to the food processing industry and other
industries such as tobacco and pharmaceuticals. The present Company was
incorporated in 1982 as a result of a management buyout of the predecessor
organization.
The
Company and its operating subsidiaries design, manufacture, sell and service
process automation systems that process product streams of discrete pieces to
improve safety and quality. These systems integrate electro-optical
automated inspection and sorting systems with process systems that include
specialized conveying and preparation equipment. The Company provides parts and
service for each of its product lines to customers throughout the
world.
Net sales
for the year ended September 30, 2009 were $105.4 million compared with $134.1
million for fiscal 2008. The Company reported a net loss for fiscal
2009 of $491,000, or $0.10 per diluted share, compared with net earnings of $7.5
million, or $1.35 per diluted share, for fiscal 2008. Export and
international sales for the fiscal years ended September 30, 2009 and 2008
accounted for 43% and 50% of net sales in each such year,
respectively.
Industry
Background
Food
Processing Industry
The
Company’s primary market is the food processing industry where processors strive
to remove foreign material and product defects from the production line to
produce high quality product and assure food safety. Historically,
removing foreign material and defects has been a manual operation in food
processing plants, but the subjective and inconsistent nature of human
inspection results in unpredictable product quality and safety while yield loss
and the high cost of labor negatively affect the food processor’s bottom
line.
The
Company’s strategy is to offer automated inspection systems that reduce reliance
on manual inspection and address the common food processing industry problems
associated with high labor costs, availability of labor, inadequate yields, and
inconsistent product quality and food safety. In highly developed
markets, including those in North America and Western Europe, the substitution
of automated inspection for manual inspection is well underway. Food
processors in these regions typically understand the value of replacing manual
inspection with automated systems and look for systems that will help maximize
yields, product quality, and food safety.
Within
the food processing industry, the greatest opportunities for automated
inspection systems have been in potatoes, vegetables, and fruits where the
frequency and severity of foreign material and defects is highly variable,
depending on the countless factors that affect crops. The Company
believes that many additional applications for its automated inspection systems
exist in other food processing markets and non-food markets.
The
principal potato market served by the Company’s systems is potato strips
(commonly referred to as french fries in the United States). Potato
strips have historically accounted for a very large portion of the frozen potato
products produced in the U.S. and, with the expansion of American-style fast
food chains in other countries, this market is growing
internationally. Recently, domestic investment in new potato strip
processing facilities in North America has flattened, in comparison to
historical levels, but demand remains strong in this region for new systems that
improve yields and enhance product quality and food safety. Although
the Company has successfully been diversifying into other food and non-food
markets in recent years to reduce dependence on this one market, potato strips
remain an important market along with other potato products such as wedges,
curly fries, formed products, and potato chips.
Other
important markets within the food processing industry are fruits and vegetables,
including both fresh-cut produce and processed products that may ultimately be
canned or frozen for institutional and retail customers. Because
foreign material and product defects plague these field-harvested products,
automated sorting enhances the quality and safety of the product while improving
yields and reducing labor costs. The Company’s principal
fruit
and
vegetable markets are fresh, frozen, canned, and dehydrated green beans, corn,
carrots, peas, onions, berries, cranberries, pears, and peaches, as well as
ready-to-eat fresh-cut salads and tree nuts.
The
Company believes that selected areas of the food processing industry will
continue to present opportunities for growth. In general, food
processing companies remain financially viable, but are increasingly coming
under pressure to increase profitability and improve product safety while
maintaining or reducing prices for their own products. By offering
equipment that increases yields, enhances product quality and food safety, and
results in reduced processing costs, the Company believes it is well positioned
to satisfy the needs of the industry, allowing for expanded sales of equipment
to food processing companies in the future. The Company’s customers
did not invest in fiscal 2009 in capital equipment at the same level as in
fiscal 2008, and demand for the Company’s solutions declined mainly due to
global economic conditions.
Seasonal
fluctuations in the potato, fruit, and vegetable processing industries cause the
Company to experience some predictable seasonality of orders and
shipments. Typically, orders and shipments for this industry tend to
be lower during the Company’s first two fiscal quarters of the year than the
second half of the year. Other food markets served by the Company,
such as snack, bakery, dairy, poultry, and seafood products, are less seasonal
in nature, as are the Company’s non-food markets.
Non-food
Industries – Tobacco, Pharmaceuticals and Nutraceuticals
Processors,
manufacturers, and packagers in several non-food industries are interested in
automated inspection systems that reduce costs, increase yields, and improve
product quality and safety. The Company’s primary non-food markets
include the tobacco industry, pharmaceuticals, and nutraceuticals.
In fiscal
2009, the tobacco industry accounted for less than 5% of the Company’s
sales. With systems that remove non-tobacco related material from
primary processing lines and threshing lines, the Company helps tobacco
processors maximize product quality. In 2009, the Company entered
into an Original Equipment Manufacturer (OEM) distribution agreement with Hauni
Maschinenbau AG, a leading supplier of equipment to the tobacco
industry. The agreement gives Hauni exclusive rights to market the
Company’s equipment to tobacco processors worldwide and makes Key Technology the
sole supplier of optical sorting equipment to Hauni for the tobacco
market.
In fiscal
2009, the pharmaceutical and nutraceutical industry, which is served by the
Company’s pharmaceutical product line, SYMETIX®,
represented less than 5% of the Company’s sales. SYMETIX’s continuous
high-volume optical inspection systems for softgels and tablets remove defects
and foreign capsules and tablets from the product stream. These
systems are of interest to brand owners, product manufacturers, and contract
packers looking to assure product quality while reducing labor
costs.
In fiscal
2009, the Company acquired a 15% minority interest in Proditec
SAS. Proditec is a leading manufacturer of automated, solid dose
pharmaceutical inspection systems based on machine vision technology
headquartered in France.
Products
The
following table sets forth sales by product category for the periods indicated
(in thousands):
|
Fiscal
Year Ended September 30,
|
||||||||||||||||||||||||
|
2009
|
2008
|
2007
|
||||||||||||||||||||||
|
Automated
inspection systems
|
$ | 48,188 | 45 | % | $ | 55,968 | 42 | % | $ | 46,858 | 44 | % | ||||||||||||
|
Process
systems
|
36,507 | 35 | % | 56,603 | 42 | % | 40,947 | 38 | % | |||||||||||||||
|
Parts
and
service
|
20,755 | 20 | % | 21,515 | 16 | % | 19,735 | 18 | % | |||||||||||||||
|
Net
sales
|
$ | 105,450 | 100 | % | $ | 134,086 | 100 | % | $ | 107,540 | 100 | % | ||||||||||||
Service
and maintenance contracts are less than 10% of total net sales and are therefore
summarized with parts and service.
The
following table sets forth the percent of total gross margin contributed by each
product category for the periods indicated:
|
Fiscal
Year Ended September 30,
|
||||||||||||
|
2009
|
2008
|
2007
|
||||||||||
|
Automated
inspection
systems
|
44 | % | 45 | % | 51 | % | ||||||
|
Process
systems
|
31 | % | 37 | % | 30 | % | ||||||
|
Parts
and
service
|
25 | % | 18 | % | 19 | % | ||||||
|
Total
gross margin
|
100 | % | 100 | % | 100 | % | ||||||
Automated
Inspection Systems
Automated
inspection systems are used in various applications to detect and remove defects
and foreign material from the product stream. The Company’s product
families within this group include the following: Manta®,
Tegra®
and Optyx®,
which are used in a variety of applications and industries; Tobacco Sorter™ 3
tobacco sorting systems used in tobacco threshing and primary processing;
ADR®
automatic defect removal systems used in the potato strip industry; and
Optyx®SG and
VeriSym® used
in the pharmaceutical and nutraceutical industry.
The
Company’s automated inspection systems incorporate object-based sorting
technology that recognizes color, size, and shape, as well as differences in the
structural properties of the objects and differing levels of fluorescing
material. These capabilities provide solutions to previously
difficult sorting problems, such as differentiation between green beans and
green bean stems. To ease operation, the sorters are equipped with
application-specific software packs, called KeyWare®, which are designed for a
single product category. The systems operate on Key’s advanced G6
electro-optical platform, which features a controller, modular vision engine,
and high-resolution cameras. Modular designs and the use of
industry-wide connectivity standards ease future upgrades to keep the systems up
to date and performing optimally as technology advances. Network
communication software allows the systems to easily interface with plant
networks, extending machine monitoring and communication control capabilities
beyond the plant floor to the control room. FMAlert™, a new feature
for G6 optical sorters that was introduced in 2008, improves tracking and
control of foreign material by capturing and saving a digital image of every
object identified as foreign material.
Nearly
all the Company’s optical inspection systems use proprietary linear array,
charged coupled device (“CCD”) monochromatic, color, or multi-spectral
cameras. Additionally, Manta and Optyx can be equipped with Raptor
Laser Technology or FluoRaptor™, a fluorescence-sensing laser, in combination
with the cameras. The cameras and laser-sensors scan the
product-streams, which move at 5 to 20 feet per second, at the rate of 1,500 to
8,000 times per second and identify foreign material and defects as small as
1/128 of an inch in diameter. Systems with monochromatic cameras
generally are sold at lower price levels and are most effective for product that
has a marked disparity in shade between the defective and the good
product. Systems with color cameras are required when a variety of
defects and product colors occur simultaneously, when the difference in shading
between the defective and the good product is more subtle, and when shape
sorting is required. Multi-spectral systems can utilize infrared or
ultraviolet technologies, individually or in combination with visible light, to
identify defects that are best differentiated from good product outside the
visible light spectrum. Systems with laser technology detect foreign
matter based on differences in the structural properties of the objects,
regardless of color or shape.
Manta. Introduced
in fiscal 2008, Manta 2000 is the Company’s highest capacity optical
sorter. Featuring high-resolution inspection and a 79-inch scan width
within a space-saving footprint, Manta handles up to 60,000 pounds of vegetables
or fruit per hour. In 2009, the Company introduced two new Manta
applications – one for frozen potato products and another for potato chips,
extending the system’s capabilities. Also in 2009, the Company
introduced Manta 1600. With a 60-inch scan width, Manta 1600 handles
up to 33,000 pounds of product per hour to match the requirements of most
processed vegetable, potato, and fruit production lines. With the
highest number of sensors and image processing modules, Manta maintains the high
resolution of the narrow-belt sorters on its higher-capacity
frame. Manta’s design supports on-belt viewing as well as off-belt,
in-air viewing by a combination of color or Vis/IR (visible infrared) cameras
and Raptor or FluoRaptor lasers.
Tegra. Inspecting
product in-air using cameras configured in a tilted-X geometry that look at
oblique angles, Tegra views product from all sides. A unique
metal-mesh catenary C-belt® uses
gravity and centrifugal force – not
friction
– to gently accelerate, stabilize, and launch product into the inspection
zone. Ideal for highly three-dimensional products such as slices,
dices, and larger round objects that may have small defects on one surface,
applications include potato products, green beans, dried beans, corn, carrots,
pears, peaches, and coffee. Tegra is available with a 60-inch wide
platform to sort up to 45,000 pounds of product an hour and a 30-inch wide
platform to sort up to 22,500 pounds of product an hour, depending on the
product.
Optyx. Using a
combination of on-belt and in-air sorting, Optyx is a versatile family of
sorters that can be equipped with cameras or a combination of cameras and
lasers. The lower cost Optyx 3000 series features a 24-inch scan
width to sort up to 18,000 pounds of product an hour, offering the power and
sorting capabilities of a larger sorter in an economical and compact machine
ideal for smaller processors and lower volume processing lines. The
Optyx 6000 series features a 48-inch scan width to sort up to 36,000 pounds of
product an hour. Optyx sorters have gained strong acceptance in
segments of the fruit, vegetable, potato, nut, and snack food markets as well as
the pharmaceutical, nutraceutical, tobacco, and recycled paper and plastic
industries. In 2009, the Company introduced a new Optyx sorter
designed specifically for kettle-style potato chips with a unique camera and
lighting configuration to sense opacity as well as color
differences. Also in 2009, the Company introduced its first optical
sorting system for whole potatoes. Optyx WPS for whole potatoes
achieves a three-way sort using a combination of air ejectors to remove foreign
material and a unique deflector system to separate potatoes for rework from good
potatoes.
Laser-sensing
technology, including the Company’s Raptor Laser and FluoRaptor, a
fluorescence-sensing laser, can be integrated into Manta and Optyx sorters,
along with cameras. Color cameras enable the sorter to analyze size,
shape, and subtle color differences while the lasers detect foreign matter based
on differences in the structural properties of the objects, regardless of color,
size, or shape. Combining color sorting with laser technology
achieves the most complete sort, maximizing the removal of foreign material and
defects. Raptor is ideal for a variety of fresh, frozen, and dried
fruits and vegetables, including frozen potato products, tree nuts, raisins, and
other foods. FluoRaptor inspects product based on differing levels of
chlorophyll and is ideal for a variety of fresh and frozen vegetables and potato
products.
Tobacco Sorter
3. The tobacco industry has special requirements for the
handling and sorting of its products, which vary in size and moisture content
and other properties depending upon the type of tobacco product being produced
and the point of inspection. Key’s Tobacco Sorter 3 (TS3) utilizes a
specially constructed frame, enclosure, and material handling arrangement to
meet the specific requirements of this industry. TS3 recognizes
millions of colors, detecting and removing foreign material, as well as subtle
product defects from strip tobacco and tobacco stem as well as other leafy
product (such as tea). TS3 has been installed in North America, Latin
America, Europe, and Asia.
ADR. Featuring a
belt conveyor, LED light source, Vis/IR cameras, air-actuated knives on a
patented rotary cutter and Iso-Flo®
vibratory conveyor, ADR 5 aligns, singulates, inspects, and trims defects from
peeled and peel-on potato strips and removes the defects from the product
stream. The Company believes its ADR system is the principal defect
removal system used in the potato strip processing industry. ADR 5
combines the wide footprint of ADR III with the high speed accuracy of ADR 4 to
handle as much as 17,000 to 27,000 pounds of product per hour, depending on the
cut size. The system can also cut excessively long strips to control
product length, a function especially valuable for fast-food
products.
VeriSym. In 2009,
the Company’s pharmaceutical product line, SYMETIX, introduced VeriSym, a new
compact, high-volume optical inspection system for verifying over-the-counter
(OTC) and regulated solid dose pharmaceuticals and nutraceuticals. In
half the floor space of other bulk inspection systems with similar throughput
and resolution, VeriSym assures product quality while reducing labor
costs. VeriSym/N for nutraceuticals and VeriSym/P for OTC and
regulated pharmaceuticals use the same software and much of the same hardware as
the Company’s field-proven OptyxSG for pharmaceutical and nutraceutical softgels
and tablets, so the new system is expected to be easy to
validate. VeriSym/P is FDA 21 CFR part 11 compliant with secure and
encrypted logs, secure passcode management, parameter histograms, and guided
changeover.
Upgrades. The Company has a
large installed base of automated inspection systems, which it supports with
upgrades to extend the life of the equipment and enable customers to continue
operating at peak performance as technology advances. Compared to
acquiring new automated inspection systems, upgrades often provide customers
with less capital intensive alternatives. The Company’s systems
operate on the advanced G-6 electro-optical modular platform which features a
controller, vision engine and high resolution cameras. The G-6
platform uses
high
performance, industry-wide connectivity standards such as Camera Link™,
FireWire®, and
Ethernet that ensure forward compatibility, which provides a solid foundation
for future upgrades. Since their introduction, upgrade sales have
been a significant component of automated inspection system
sales. The Company believes that, given the rapid pace of
technological advancements, there will continue to be a significant opportunity
for sales of upgrade product offerings to its customers in the
future.
Process
Systems
Conveying
and processing equipment are utilized worldwide throughout many industries to
move and process product within a production plant. The Company’s
Smart Shaker®
vibratory solutions, which include Iso-Flo® and
Impulse™ branded systems, combine gentle material handling with a wide variety
of processing functions in addition to vibratory conveying. Farmco
rotary grading systems, Turbo-Flo® steam
blanchers, Freshline equipment for fresh-cut produce, and SYMETIX equipment for
pharmaceuticals and nutraceuticals, complete the Company’s conveying and
processing equipment product line. The process systems group includes
standard and custom designed equipment that conveys, transfers, distributes,
aligns, feeds, meters, separates, grades, blanches, cooks, pasteurizes, cools,
cleans, washes, dries, polishes, and packages products.
Iso-Flo Vibratory Conveying
Systems. The Company’s principal specialized conveying system
is its Iso-Flo family of vibratory conveyors. Iso-Flo is a stainless
steel pan conveyor that uses an independent, frame-mounted mechanical drive and
spring arm assemblies that distribute energy equally to all parts of the
conveyor bed in a controlled natural-frequency operation. This action
gently moves product forward while minimizing the vibration being transferred to
the structural support, which reduces the cost of installation and enables the
conveyor to be installed exactly where it is most beneficial. Iso-Flo
systems are used in a variety of processing applications, including potato
products, processed and fresh-cut vegetables and fruits, snack foods, cereals,
cheese, poultry, and seafood. Non-food processing applications
include pharmaceuticals, nutraceuticals, tobacco, pet food, and
plastics. Iso-Flo can be designed to convey, transfer, distribute,
align, feed, meter, separate, grade, deoil, and dewater products, among other
things. In 2008, the Company introduced a new Grape Receiving and
Inspection Platform (GRIP) for wineries, based on its Iso-Flo
shaker. GRIP receives the contents of the fruit bin and meters out an
even flow of grape clusters for inspection.
SmartArm™. In
2009, the Company introduced SmartArm for its Iso-Flo vibratory
conveyors. SmartArm is a new wireless performance monitoring system
for Iso-Flo shakers that measures and reports speed and stroke to provide
real-time analysis of shaker function, line-flow conditions, and
trends. Information can be monitored at-a-glace from any computer
workstation. It empowers the shift from traditional preventative
maintenance to predictive maintenance, which prevents downtime and reduces labor
while improving process efficiencies. SmartArm is available worldwide
as an option on new Iso-Flo conveyors and as an upgrade for the installed
base.
Impulse. Impulse
is a family of vibratory conveyors that features electromagnetic drives and
spring arm assemblies to distribute energy to the conveyor bed, producing a
diagonal, harmonic motion that moves product forward. The
electromagnetic drives start and stop quickly and allow the user to adjusting
the conveying pan amplitude from zero to 100 percent, which make them ideal for
lines that handle a wide variety of products as well as lines that require
precise metering such as product mixing lines, ingredient feeding, and scale
feeding. Additionally, the Impulse conveyor drive systems are
oil-free and provide quiet operation. Initially developed for
packaging applications in snack food, dry ingredient, chemical, and
pharmaceutical manufacturing, Impulse is seeing increased applications in a wide
variety of food and non-food processes.
Farmco Rotary Grading
Systems. The mechanical sizing, sorting, separating, and
grading equipment manufactured at the Company’s Redmond, Oregon facility are
used in many food processing and fresh vegetable packing
operations. These rotary sizing and grading technologies can remove
oversized, undersized, and small irregular-shaped pieces of product from the
line or separate product into predetermined size
categories. Additionally, this equipment can remove field debris,
broken pieces, seeds, juice, fines, and other targeted material. In
2009, the Company introduced an upgrade for its popular Farmco Sliver Sizer
Remover and Farmco Rotary Size Grader. The upgrade features a
food-friendly drive system and lube-free adjusting system made of
corrosion-resistant, long-life polymer components to eliminate rust and the need
for constant oiling, which improves sanitation and equipment reliability while
reducing maintenance.
Preparation
Systems. The Company designs and manufactures preparation
systems to prepare a wide range of food products prior to cooking, freezing,
canning, or other types of processing. Equipment in this group
includes air cleaners, air coolers, vegetable metering and blending systems, and
bulk handling equipment. This equipment represents the Company’s most
mature product line. Sales of these solutions over the years have
formed a customer base for sales of other Company solutions and are also
establishing a new customer base in developing geographic
markets. Preparation system revenues include a variety of third-party
supplied equipment and installation services, which are sold as components of
larger, integrated processing lines, for which the Company has assumed turn-key
sales responsibility. In addition, the process systems group includes
other custom designed conveying and raw food sizing, grading, and preparation
equipment.
Freshline
Equipment. The Freshline equipment is designed for the
fresh-cut produce industry. The Basket Wash and Compact Dryer are
semi-automated systems that are ideal for small to medium volume fresh-cut
processors handling a wide variety of products including leafy salad mix,
shredded and chopped lettuce and cabbage, cut vegetables, herbs, onions,
peppers, and other products. The Flume Wash and Auto Dryers are fully
automated systems that are ideal for large-scale processors. The Auto
Dryer is available in one-, two-, and four-drum configurations. The
AVSealer is a semi-automatic packaging machine that heat seals bags with or
without vacuum and has an optional gas flush cycle to maximize production
flexibility. The Company redesigned four of its Freshline systems
during fiscal 2009 to meet CE-mark and UL-certification requirements and assure
superior performance. With stand-alone washers, dryers, trimmers, and
slicers, as well as medium-volume cells and fully automated high volume lines,
processors of ready-to-eat salads and fresh-cut vegetables can ensure food
safety and quality.
SYMETIX
Equipment. Process automation equipment for solid dose
pharmaceuticals and nutraceuticals from the Company’s pharmaceutical product
line, SYMETIX, are continuous processing systems designed to replace traditional
batch processing systems historically used in this industry. The two
optical inspections systems – OptyxSG and VeriSym – inspect the color, size, and
shape of tablets and softgels and automatically remove defects and foreign
tablets or capsules from the product stream at rates of up to 1,000,000 tablets
or capsules per hour. These inspection systems help product
manufacturers and contract packers assure the quality of their finished
product. The Company offers FDA 21 CFR part 11 compliant inspection
systems for pharmaceuticals and simplified systems for
nutraceuticals. Impulse/P is a high volume size grader for softgels
and tablets designed as an alternative to traditional diverging roller sizers,
which require many moving parts and often take hours to change over and
sanitize. Impulse/P features screens that snap in place over a
sanitary bed, which improves sanitation, eases maintenance, and speeds
changeover. PulseScrubber® is
the industry’s first continuous polishing system for
softgels. Replacing traditional batch polishing systems in use,
PulseScrubber extends SYMETIX’s concept of a Continuous Softgel Finishing Line™
to maximize product quality and reduce labor.
Parts
and Service
The
Company has a large installed base of inspection and processing systems. This
installed base generates potential business for the Company’s parts, service,
and training programs.
The
Company provides spare parts and post-sale field and telephone-based repair
services to support its customers’ routine maintenance requirements and seasonal
equipment startup and winterization processes. The Company considers
its parts and maintenance service sales to be important potential sources of
future revenue growth. The Company continues to realign its service
organization so that field service personnel are geographically located closer
to its customers around the world. The Company typically provides
system installation support services in the sale price of select systems,
principally automated inspection systems.
In 2008,
the Company launched a new Online Training Program, an interactive multimedia
curriculum covering select optical inspection systems and vibratory
conveyors. The flexible, web-based program offers a wide variety of
self-paced training modules designed for operators, maintenance personnel,
sanitation crews, supervisors, and others working with this
equipment. In 2009, the Company added new training modules to expand
the program’s capabilities.
Engineering,
Research and Development
At
September 30, 2009, the Company’s research and development department had
47 employees who conduct new product research and development and
sustaining engineering for released products. The Company’s
technicalstaff includes electronic, optical, mechanical and software
engineers, mathematicians and technical support personnel.
At
September 30, 2009, the Company’s project engineering department had 43
employees engaged in project engineering for custom systems. The
project engineering teams are responsible for engineering and designing the
details of each custom order. A document control team maintains and
controls product documentation and the product modeling database for the
development engineering and project engineering teams, as well as the
manufacturing department.
In fiscal
2009, the Company’s research and development expenses, together with engineering
expenses not applied to the manufacturing costs of products, were approximately
$8.7 million, compared to $8.7 million and $5.5 million in fiscal 2008 and
fiscal 2007, respectively.
Manufacturing
The
Company maintains two domestic manufacturing facilities, one located in Walla
Walla, Washington and one in Redmond, Oregon. The Company also has a
European manufacturing facility located in The Netherlands. The Company’s
current manufacturing facilities and its product design and manufacturing
processes integrate Computer Aided Engineering (CAE), Finite Element Analysis
(FEA), Computer Aided Design (CAD), Computer Aided Manufacturing (CAM) and
Computer Integrated Manufacturing (CIM) technologies. Manufacturing
activities include process engineering; fabrication, welding, finishing, and
assembly of custom designed stainless steel systems; camera and electronics
assembly; subsystem assembly; and system test and integration. The
following table provides a summary of the Company’s manufacturing locations and
manufacturing floor space:
|
Location
|
Manufacturing
Facility
|
Products/Services
Produced
|
|
Walla
Walla, Washington
|
132,000
square feet
|
Automated
Inspection Systems
Process
Systems
Parts
and Service
|
|
Redmond,
Oregon
|
17,000
square feet
|
Process
Systems
Parts
and Service
|
|
Beusichem,
The Netherlands
|
38,000
square feet
|
Process
Systems
Parts
and Service
|
The
Company manufactures certain of its products to Underwriters Laboratories and
United States Department of Agriculture standards. Certain of the
Company’s products also comply with the Canadian Standards Association (CSA),
European CE (Conformité Européene) and Electronic Testing Laboratory (ETL)
safety standards. Certain products for the
pharmaceutical/nutraceutical industry are FDA 21CFR11-compliant and designed
using GAMP4 guidelines. The Company’s domestic facilities were
recertified to the ISO 9001:2000 standard in 2006.
Certain
components and subassemblies included in the Company’s products are obtained
from limited-source or sole-source suppliers. The Company attempts to
ensure that adequate supplies are available to maintain manufacturing
schedules. Although the Company seeks to reduce its dependence on
limited- and sole-source suppliers, the partial or complete loss of certain
sources of supply could have an adverse effect on the Company’s results of
operations and relations with customers. The Company may also use
contract or third-party manufacturers to fulfill customer needs for ancillary
products or equipment that the Company does not manufacture.
Environmental
Compliance
The
Company has not received notice of any material violations of environmental laws
or regulations in on-going operations at any of its manufacturing
locations.
The
Company markets its equipment worldwide both directly and through independent
sales representatives. Sales by independent sales representatives
generally account for between 20% and 30% of the Company's consolidated net
sales. In North America, the Company operates sales offices in Walla
Walla, Washington; Medford, Oregon; Redmond, Oregon; and Santiago de Querétaro,
Mexico. The Company’s subsidiary KeyTechnology B.V. provides
sales and service to European and Middle Eastern and South African
customers. The Company’s subsidiary Key Technology Australia Pty Ltd.
provides sales and service to customers primarily in Australia and New
Zealand. The Company’s subsidiary Productos Key Mexicana S. de R.L.
de C.V. provides sales and service to customers in Mexico, Central and South
America. The Company’s subsidiary Key Technology (Shanghai) Trading
Company Ltd. provides sales and service to customers in greater
China. The Company supplies equipment from both product groups -
automated inspection systems and process systems - to customers in its primary
markets through common sales and distribution channels. In addition,
the Company supplies parts and service through its worldwide service
organization.
Most
exports of products manufactured in the United States for shipment into
international markets, other than Europe, have been denominated in U.S.
dollars. Sales of products manufactured in Europe are generally
denominated in European currencies, most commonly Euros. As the
Company expands its operations in Australia, Latin America and China,
transactions denominated in the local currencies of these countries may
increase. In its export and international sales, the Company is
subject to the risks of conducting business internationally, including
unexpected changes in regulatory requirements; fluctuations in the value of the
U.S. dollar, which could increase or decrease the sales prices in local
currencies of the Company’s products in international markets; tariffs and other
barriers and restrictions; and the requirements of complying with a variety of
international laws. Additional information regarding export and
international sales is set forth in Note 17 to the Company’s Consolidated
Financial Statements for the fiscal year ended September 30, 2009.
During
fiscal 2009 and 2008, sales to our largest customer, McCain Foods, represented
approximately 10%, and 14% of total net sales, respectively. During
fiscal 2009, sales to J. R. Simplot Company were approximately 10% of net
sales. During fiscal 2008, sales to Frito-Lay were approximately 13%
of total net sales. While the Company believes that its relationship
with these customers is satisfactory, the loss of any of these customers could
have a material adverse effect on the Company’s revenues and results of
operations. These customers each represent a group of customers under
common control. Generally, purchasing decisions for these customers
are made at the individual plant level which may diversify the concentration of
risk.
Backlog
The
Company’s backlog as of September 30, 2009 and September 30, 2008 was
approximately $29.7 million and $33.8 million, respectively. The
Company schedules production based on firm customer commitments and forecasted
requirements. The Company includes in backlog only those customer
orders for which it has accepted purchase orders.
Competition
The
markets for automated inspection systems and process systems are highly
competitive. Important competitive factors include price,
performance, reliability, and customer support and service. The
Company believes that it currently competes effectively with respect to these
factors, although there can be no assurance that existing or future competitors
will not introduce comparable or superior products at lower
prices. Certain of the Company’s competitors may have substantially
greater financial, technical, marketing and other resources. Other
companies which sell products in certain of the Company’s markets include Heat
& Control, Inc. and its subsidiaries, BEST N.V., Sortex Ltd., Kiremko B.V.,
and PPM Technologies. The Company has encountered additional smaller
competitors entering its markets, including the introduction of potentially
competing tobacco sorters into the Chinese market manufactured by Chinese
companies. As the Company enters new markets, it expects to encounter
additional new competitors.
Patents
and Trademarks
The
Company currently holds forty United States patents on various features of its
products issued from 1991 through 2009, and twelve other national patents issued
by other countries. The first of these patents expires in calendar 2010,
and the Company believes that expiration will not have a significant effect on
the Company. As of December 4, 2009, eleven other national patent
applications have been filed and are pending in the United States and other
countries. The Company has forty-three registered trademarks and five
pending applications for trademarks.
The
Company also attempts to protect its trade secrets and other proprietary
information through proprietary information agreements and security measures
with employees, consultants and others. The laws of certain countries
in which the Company’s products are or may be manufactured or sold may not
protect the Company’s products and intellectual property rights to the same
extent as the laws of the United States.
Employees
At
September 30, 2009, the Company had 515 full-time employees, including 265 in
manufacturing, 90 in engineering, research and development, 107 in marketing,
sales and service, and 53 in general administration and finance. A
total of 134 employees are located outside the United States. The
Company utilizes temporary contract employees, which improves the Company’s
ability to adjust manpower in response to changing demand for Company
products. Of the total employees at September 30, 2009, 17 were
contract employees. None of the Company’s employees in the United
States are represented by a labor union. The manufacturing employees
located at the Company’s facility in Beusichem, The Netherlands are represented
by the Small Metal Union. The Company has never experienced a work
stoppage, slowdown or strike.
Available
Information
The
Company’s annual and quarterly reports and other filings with the United States
Securities and Exchange Commission (“SEC”) are made available free of charge
through the Investor Relations section of the Company’s website at www.key.net
as soon as reasonably practicable after the Company files such material with the
SEC. The information on or that can be accessed through the Company’s
website is not a part of this Annual Report on Form 10-K.
|
ITEM
1A.
|
In
addition to the other information in this Annual Report on Form 10-K, the
following risk factors should be considered carefully in evaluating the Company
and its business because such factors may have a significant effect on its
operating results and financial condition. As a result of the risk
factors set forth below and the information presented elsewhere in this Annual
Report on Form 10-K, actual results could differ materially from those included
in any forward-looking statements.
Current
worldwide economic conditions may adversely affect the Company’s business and
results of operations, and the business of the Company’s customers.
The
Company’s business may be affected by general economic conditions and
uncertainty that may cause customers to defer or cancel new orders and sales
commitments previously made to us. Recent economic difficulties in
the United States credit markets and certain international markets and the
economic recession have affected most markets in which the Company
operates. The recession or the related economic uncertainty may be
sufficient reason for customers to delay, defer or cancel purchase decisions,
including decisions previously made.
The
recent disruptions in credit and other financial markets and deterioration of
national and global economic conditions, could, among other things:
-
adversely affect the Company’s expansion plans;
-
impair the financial condition of some of the Company’s customers and suppliers, thereby increasing customer bad debts or non-performance by suppliers;
-
negatively affect global demand for the Company’s customers' products, particularly in the food industry, which could result in underutilization of production facilities and a reduction of sales, operating income and cash flows;
-
negatively affect the Company’s customer’s ability to get financing, which could result in a reduction in sales, operating income and cash flows;
-
decrease the value of the Company’s cash investments in marketable securities;
-
make it more difficult or costly for the Company to obtain financing for the Company’s operations or investments;
-
negatively affect the Company’s risk management activities if the Company is required to record losses related to financial instruments or experience counterparty failure;
-
require asset write-downs; or
-
impair the financial viability of the Company’s insurers.
Adverse
economic conditions in the food processing industry, either globally or
regionally, may adversely affect the Company's revenues.
The
markets the Company serves, particularly the food processing industry, are
generally experiencing variable economic conditions. Additionally,
varying consumer demand, product supply, and excess plant capacity, most notably
in the potato market, could result in reduced or deferred capital equipment
purchases for the Company’s product lines. While the Company has
reacted to these developments with applications directed to the growing fresh
vegetable and fruit industries as well as the pharmaceutical and nutraceutical
industries, loss of business, particularly in the potato industry, would have a
negative effect on the Company’s sales and net earnings.
The
loss of any of the Company’s significant customers could reduce the Company’s
revenues and profitability.
The
Company does have significant, strategic customers and the Company anticipates
that its operating results may continue to depend on these customers for the
foreseeable future. The loss of any one of those customers, or a
significant decrease in the volume of products they purchase from the Company,
could adversely affect the Company's revenues and materially adversely affect
its profitability. Any difficulty in collecting outstanding amounts
due from one of those customers may also harm the Company's sales. In
addition, sales to any particular large customer may fluctuate significantly
from quarter to quarter causing fluctuations in the Company’s quarterly
operating results.
The
Company is subject to pricing pressure from its larger customers which may
reduce the Company’s profitability.
The
Company faces significant pricing pressures from its larger
customers. Because of their purchasing volume, the Company’s larger
customers can influence market participants to compete on price
terms. Such customers also use their buying power to negotiate lower
prices. If the Company is not able to offset price reductions
resulting from these pressures by improved operating efficiencies and reduced
expenditures, such price reductions may have an adverse effect on the Company’s
profit margins and net earnings.
The
failure of any of the Company's independent sales representatives to perform as
expected would harm the Company's net sales.
Sales by
independent sales representatives generally account for between 20% and 30% of
the Company's consolidated net sales. If the Company's independent
sales representatives fail to market, promote and sell the Company’s products
adequately, the Company's business will be adversely affected. The
Company's independent sales representatives could reduce or discontinue sales of
its products, or they may not devote the resources necessary to sell the
Company's products in the volumes and within the time frames that the Company
expects, either of which events could adversely affect the Company's revenues
and net earnings.
The
Company may make acquisitions that could disrupt the Company’s operations and
harm the Company’s operating results.
The
Company may in the future make acquisitions of businesses that offer products,
services, or technologies that the Company believes would complement its
business. Acquisitions present significant challenges and risks and
there can be no assurances that the Company will manage acquisitions
successfully. Acquisitions involve numerous risks,
including:
-
significant potential expenditures of cash, stock, and management resources;
-
difficulty achieving the potential financial and strategic benefits of the acquisition;
-
difficulties in integrating acquired operations or products, including the potential loss of key employees from the acquired business;
-
difficulties and costs associated with integrating and evaluating the information systems and internal control systems of the acquired business;
-
impairment of assets related to goodwill resulting from the acquisition, and reduction in the Company’s future operating results from amortization of intangible assets;
-
diversion of management's attention from the Company’s core business, including loss of management focus on marketplace development;
-
potential difficulties in complying with foreign regulatory requirements, including multi-jurisdictional competition rules;
-
adverse effects on existing business relationships with suppliers and customers, including the potential loss of suppliers and customers of the acquired business;
-
assumption of liabilities, known and unknown, related to litigation and other legal process involving the acquired business;
-
entering geographic areas or distribution channels in which the Company has limited or no prior experience; and
-
those risks related to general economic and political conditions.
There can
be no assurance that attractive acquisition opportunities will be available to
us, that we will be able to obtain financing for or otherwise consummate any
acquisition, or that any acquisition that we do consummate will prove to be
successful.
Issues
arising from the implementation of the Company's enterprise resource planning
system could affect the Company’s operating results and ability to manage the
Company’s business effectively.
The
Company has implemented an enterprise resource planning, or ERP, system in the
most recent fiscal year to enhance operating efficiencies and provide more
effective management of the Company's business operations. If the
Company experiences problems with the ERP system, the resulting disruption could
adversely affect the Company's sales, manufacturing processes, results of
operations and financial condition. A new ERP system involves
numerous risks, including:
-
the possibility that the complexities related to switching remaining management information functions to the ERP system will be greater than expected;
-
the possibility that operations could be disrupted if the ERP system does not perform as expected;
-
difficulties integrating the new ERP system with the Company's current operations;
-
potential delays in processing customer orders for shipment of products;
-
diversion of management's attention from normal daily business operations;
-
dependence on an unfamiliar system while the Company continues to train employees on the ERP system;
-
increased operating expenses resulting from training, conversion and transition support activities;
-
disrupt the ability to timely and accurately process and report key components of the Company’s results of operations, financial position and cash flows; and
-
adversely affect its ability to complete the evaluation of its internal controls and attestation activities pursuant to Section 404 of the Sarbanes-Oxley Act of 2002.
The
Company's international operations subject the Company to a number of risks that
could adversely affect the Company’s revenues, operating results and
growth.
The
Company conducts business outside the United States, which subjects it to the
risks inherent in international operations. In fiscal 2009, the
Company's international sales represented approximately 43% of its consolidated
net sales, compared to 50% of its consolidated net sales in fiscal
2008. Risks inherent in international operations include the
following:
- unexpected changes in regulatory requirements;
- scrutiny of foreign tax authorities which could result in significant fines, penalties and additional taxes;
- changes in import or export licensing requirements;
- longer payment cycles;
- transportation delays;
- pricing pressure that the Company may experience internationally;
- economic downturns, civil disturbances or political instability;
- geopolitical turmoil, including terrorism or war;
- currency restrictions and exchange rate fluctuations;
- difficulties and costs of staffing and managing geographically disparate operations;
- changes in labor standards;
- laws and business practices favoring local companies;
- limitations on the Company's ability under local law to protect its intellectual property;
- changes in domestic and foreign tax rates and laws; and
- difficulty in obtaining sales representatives and servicing products in foreign countries.
Competition
and advances in technology may adversely affect sales and prices.
The
markets for the Company’s products are competitive. The Company faces
price sensitivity at the customer level as well as aggressive pricing by its
competitors to stimulate demand, particularly in periods of excess
capacity. Competitors may be able to adapt or develop technologies to
enhance product offerings that directly compete with the Company’s
products. Advances in technology may also remove some barriers to
market entry, enabling additional competitors to enter the Company’s
markets. These competitive factors could force the Company to reduce
prices to remain competitive, and decrease the Company’s profits, having a
material adverse affect on the Company’s business and financial
condition. There can be no assurance that the Company will be able to
continue to compete effectively in the future.
The
Company’s new products may not compete successfully in either existing or new
markets, which would adversely affect sales and operating results.
The
future success and growth of the Company is dependent upon its ability to
develop, market, and sell products and services in certain food processing
markets as well as to introduce new products into other existing and potential
markets. There can be no assurance the Company can successfully
penetrate these potential markets or expand into new international markets with
its current or new and future products. In addition, there are
inherent risks in new markets and technologies including length of time and cost
for development of these markets and technologies, developing technological
ability to address the requirements of new markets, and product reliability
issues with both new technology and adapting products to operate in new or
rugged operating environments at customer sites. Many of the
Company’s competitors manufacture their products in jurisdictions with
substantially lower corporate tax rates than in the United States which
adversely affects the Company’s ability to compete in certain potential
markets.
The
Company's inability to retain and recruit experienced personnel may adversely
affect the Company’s business and prospects for growth.
The
Company's success depends in part on the skills and experience of its key
employees. The loss of services of such employees could adversely
affect the Company's business until suitable replacements can be
found. In addition, the Company's headquarters are located in Walla
Walla, Washington, a small, relatively remote geographic location. As
such, there may be a limited number of individuals locally with the requisite
skill and experience, and the Company has from time-to-time experienced
difficulty recruiting individuals from larger metropolitan areas. Consequently,
the Company may not be able to retain and recruit a sufficient number of
qualified individuals on acceptable terms to maintain its business or achieve
planned growth.
The
loss of members of the Company’s management team could substantially disrupt the
Company’s business operations.
Our
success depends to a significant degree upon the continued individual and
collective contributions of our management team. A limited number of
individuals have primary responsibility for managing our business, including our
relationships with key customers. These individuals are integral to
our success based on their expertise and knowledge of our business and
products. The loss of the services of members of the management team
and other key employees could have a material adverse effect on the
Company.
The
inability to protect the Company’s intellectual property, especially as the
Company expands geographically, may adversely affect the Company's competitive
advantage.
The
Company’s competitive position may be affected by its ability to protect its
proprietary technology. The Company has obtained certain patents and
has filed a number of patent applications. The Company also
anticipates filing applications for protection of its future products and
technology. There can be no assurance that any such patents will
provide meaningful protection for the Company’s product innovations, or that the
issuance of a patent will give the Company any material advantage over its
competition in connection with any of its products. The Company may
experience additional intellectual property risks in international markets where
it may lack patent protection. The patent laws of other countries,
such as China, may differ from those of the U.S. as to the patentability of the
Company’s products and processes. Moreover, the degree of protection
afforded by foreign patents may be different from that of U.S.
patents.
Intellectual
property-related litigation expenses and other costs resulting from infringement
claims asserted against the Company by third parties may adversely affect the
Company’s results of operations and its customer relations.
The
technologies used by the Company may infringe the patents or proprietary
technology of others, and the Company has been required in the past to initiate
litigation to protect its patents. The cost of enforcing the
Company’s patent rights in lawsuits that it may bring against infringers or of
defending itself against infringement charges by other patent holders or other
third parties, including customers, may be high and could have an adverse effect
on the Company’s results of operations and its customer relations.
The
Company's dependence on certain suppliers may leave the Company temporarily
without adequate access to raw materials or products.
The
Company relies on third-party domestic and foreign suppliers for certain raw
materials and component products, particularly in the Company’s automated
inspection equipment product line. Several of these suppliers are the
single source of the raw material or component provided to the
Company. The Company does not have long-term contracts with any
supplier. The Company may be adversely affected in the event that
these suppliers cease operations or if pricing terms become less
favorable. The loss of a key vendor may force the Company to purchase
its necessary raw materials and components in the open market, which may not be
possible or may be at higher prices, until it could secure another
source. There is no assurance that the terms of any subsequent supply
arrangements the Company may enter into would be as favorable as the supply
arrangements the Company currently has in place. If the Company is
unable to replace a key supplier, it may face delays in delivering finished
products, which could have an adverse effect on the Company’s sales and
financial performance.
The
limited availability and possible cost fluctuations of materials used in the
Company's products could adversely affect the Company's gross
margins.
Certain
basic materials, such as stainless steel, are used extensively in the Company’s
product fabrication processes. Such basic materials have in the past
been subject to worldwide shortages or price fluctuations related to the supply
of or demand for raw materials, such as nickel, which are used in their
production by the Company’s suppliers. A significant increase in the
price or decrease in the availability of one or more of these components,
subassemblies or basic materials could adversely affect the Company’s results of
operations.
The
price of the Company's common stock may fluctuate significantly, and this may
make it difficult for shareholders to resell common stock when they want or at
prices they find attractive.
The
Company expects that the price of its common stock could fluctuate as a result
of a variety of factors, many of which are beyond its control. These
factors include:
-
quarterly variations in the Company's operating results;
-
operating results that vary from the expectations of management, securities analysts and investors;
-
significant acquisitions or business combinations, strategic partnerships, joint ventures or capital commitments involving the Company or its competitors;
-
changes in expectations as to the Company's future financial performance;
-
the operating and securities price performance of other companies that investors believe are comparable to the Company;
-
future sales of the Company's equity or equity-related securities;
-
changes in general conditions in the Company's industry and in the economy, the financial markets and the domestic or international political situation; and
-
departures of key personnel.
In
addition, in recent periods the stock market in general has experienced
unprecedented price and volume fluctuations. This volatility has had
a significant effect on the market price of securities issued by many companies
for reasons often unrelated to their operating performance. These
broad market fluctuations may adversely affect the Company's stock price,
regardless of its operating results.
|
ITEM
2.
|
The
Company owns or leases the following properties:
|
Location
|
Purpose
|
Square
Feet
|
Owned
or Leased
|
Lease
Expires
|
Renewal
Period
|
|
Walla
Walla, Washington
|
Corporate
office, manufacturing, research and development, sales and marketing,
administration
|
173,000
|
Owned
|
n/a
|
n/a
|
|
Redmond,
Oregon
|
Manufacturing,
research and development, sales, administration
|
19,000
|
Leased
|
2012
|
2017
|
|
Beusichem,
The Netherlands
|
Manufacturing,
sales and marketing, administration
|
45,000
|
Leased
|
2013
|
Renewable
in 5 year increments
|
|
Beusichem,
The Netherlands
|
Warehouse
|
8,000
|
Leased
|
2012
|
2013
|
The
Company also has leased office space for sales and service and other activities
in Walla Walla, Washington, Dingley, Australia, Shanghai, China, Querétaro,
Mexico and Rotselaar, Belgium.
The
Company considers all of its properties suitable for the purposes for which they
are used.
|
ITEM
3.
|
LEGAL PROCEEDINGS.
|
From
time-to-time, the Company is named as a defendant in legal proceedings arising
out of the normal course of its business. As of December 4, 2009, the
Company was not a party to any material legal proceedings.
|
ITEM
4.
|
SUBMISSION OF MATTERS TO A VOTE OF SECURITY
HOLDERS.
|
None.
|
|
ITEM
5.
|
MARKET FOR REGISTRANT'S COMMON EQUITY, RELATED STOCKHOLDER
MATTERS AND ISSUER PURCHASES OF EQUITY
SECURITIES.
|
Market
Information
Shares of
the Company’s common stock are quoted on The NASDAQ Global Market under the
symbol “KTEC”. The following table shows the high and low sales
prices per share of the Company’s common stock by quarter for the two most
recent fiscal years ending September 30, 2009:
|
Stock
price by quarter
|
High
|
Low
|
||||||
|
Fiscal
year ended September 30, 2009
|
||||||||
|
First
Quarter
|
$ | 24.030 | $ | 9.750 | ||||
|
Second
Quarter
|
$ | 21.000 | $ | 7.100 | ||||
|
Third
Quarter
|
$ | 11.400 | $ | 8.120 | ||||
|
Fourth
Quarter
|
$ | 13.320 | $ | 9.050 | ||||
|
Fiscal
year ended September 30, 2008
|
||||||||
|
First
Quarter
|
$ | 36.250 | $ | 25.000 | ||||
|
Second
Quarter
|
$ | 38.830 | $ | 25.870 | ||||
|
Third
Quarter
|
$ | 39.470 | $ | 27.860 | ||||
|
Fourth
Quarter
|
$ | 35.310 | $ | 21.230 | ||||
The
source of these quotations was the NASDAQ OnlineSM
Internet site.
The
Company had approximately 1,965 beneficial owners of its common stock, of which
226 are of record, as of December 4, 2009.
The
Company has not historically paid dividends on its common or preferred
stock. The Board of Directors presently intends to continue its
policy of retaining earnings for reinvestment in the operations of the
Company.
Issuer Purchases of Equity
Securities
The
following table provides information about purchases made by or on behalf of the
Company during the quarter ended September 30, 2009 of equity securities
registered by the Company under Section 12 of the Securities Exchange Act of
1934.
|
Period
|
Total
Number of Shares Purchased (1)
|
Average
Price Paid per Share (1)
|
Total
Number of Shares Purchased as Part of Publicly Announced Plans or
Programs
|
Maximum
Number of Shares that May Yet Be Purchased Under the Plans or
Programs
|
||||||||||||
|
July
1-31, 2009
|
0 | - | 0 | |||||||||||||
|
August
1-31, 2009
|
0 | - | 0 | |||||||||||||
|
September
1-30, 2009
|
1,906 | $ | 11.25 | 0 | ||||||||||||
|
Total
|
1,906 | $ | 11.25 | 0 | 78,750 | (2) | ||||||||||
|
(1)
|
Consists
only of shares of restricted stock surrendered to satisfy tax withholding
obligations by plan participants under the 2003 Restated Employees’ Stock
Incentive Plan. The shares were subsequently cancelled and
retired.
|
|
|
(2)
|
The
Company initiated a stock repurchase program effective November 27,
2006. The Company was authorized to purchase up to 500,000
shares of its common stock under the program. Pursuant to the
program, the Company repurchased 88,252 shares in fiscal
2007. The Company did not repurchase any shares in fiscal
2008. During the first quarter of fiscal 2009, the Board of
Directors restored the number of shares that may be repurchased to the
original 500,000 share amount, and subsequently increased the number of
shares that may be repurchased under the share repurchase program to
750,000 shares. Pursuant to the program, the Company
repurchased 671,250 shares in the first and second quarters of fiscal
2009. The program does not incorporate a fixed expiration
date.
|
|
|
|
STOCK
PERFORMANCE GRAPH
COMPARISON OF FIVE-YEAR
CUMULATIVE TOTAL RETURN
AMONG KEY
TECHNOLOGY, INC., THE RUSSELL MICROCAP INDEX, AND A PEER GROUP
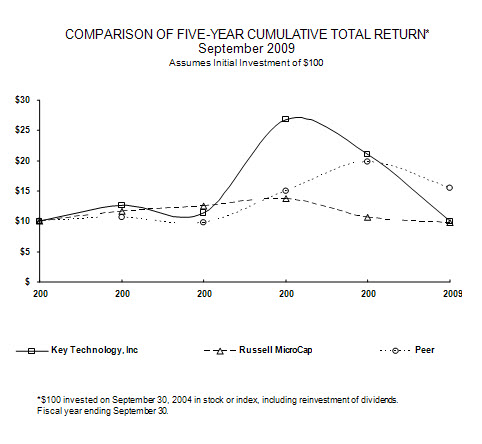
|
TOTAL
RETURN ANALYSIS
|
||||||
|
9/30/2004
|
9/30/2005
|
9/30/2006
|
9/30/2007
|
9/30/2008
|
9/30/2009
|
|
|
Key
Technology
|
$ 100.00
|
$ 126.22
|
$ 113.60
|
$ 267.56
|
$ 210.67
|
$ 100.00
|
|
Russell
Microcap
|
$ 100.00
|
$ 116.99
|
$ 125.21
|
$ 137.33
|
$ 106.42
|
$ 97.98
|
|
Peer
Group *
|
$ 100.00
|
$ 106.39
|
$ 97.82
|
$ 150.23
|
$ 198.72
|
$ 154.88
|
PEER
GROUP: Cognex Corp., Perceptron, Inc., Flir Systems, Inc., Elbit
Vision Systems Ltd., PPT Vision, Inc., Robotic Vision Systems, Inc., John Bean
Technologies Corporation, K-Tron International, Inc.
|
ITEM
6.
|
SELECTED FINANCIAL
DATA.
|
The
selected consolidated financial information set forth below for each of the five
years in the period ended September 30, 2009 has been derived from the audited
consolidated financial statements of the Company. The information
below should be read in conjunction with Management's Discussion and Analysis of
Financial Condition and Results of Operations and the Company’s Consolidated
Financial Statements and Notes thereto as provided in Item 7 and Item 8 of this
Annual Report on Form 10-K, respectively.
|
Fiscal
Year Ended September 30,
|
||||||||||||||||||||
|
2009
|
2008
|
2007
|
2006
|
2005
|
||||||||||||||||
|
(in
thousands, except per share data)
|
||||||||||||||||||||
|
Statement
of Operations Data:
|
||||||||||||||||||||
|
Net
sales
|
$ | 105,405 | $ | 134,086 | $ | 107,540 | $ | 84,840 | $ | 80,322 | ||||||||||
|
Cost
of sales
|
66,427 | 80,893 | 66,099 | 53,041 | 49,145 | |||||||||||||||
|
Gross
profit
|
39,023 | 53,193 | 41,441 | 31,799 | 31,177 | |||||||||||||||
|
Operating
expenses
|
39,609 | 42,952 | 32,839 | 31,743 | 27,193 | |||||||||||||||
|
Gain
(loss) on disposition of assets
|
(352 | ) | 81 | 23 | 109 | 28 | ||||||||||||||
|
Income
(loss) from operations
|
(938 | ) | 10,322 | 8,625 | 165 | 4,012 | ||||||||||||||
|
Other
income (expense)
|
(431 | ) | 666 | 1,961 | (980 | ) | (419 | ) | ||||||||||||
|
Earnings
(loss) from continuing operations before income taxes
|
(1,369 | ) | 10,988 | 10,586 | (815 | ) | 3,593 | |||||||||||||
|
Income
tax (benefit) expense
|
(878 | ) | 3,515 | 3,176 | (22 | ) | 902 | |||||||||||||
|
Net
earnings (loss)
|
(491 | ) | 7,473 | 7,410 | (793 | ) | 2,691 | |||||||||||||
|
Assumed
dividends on mandatorily redeemable preferred stock
|
-- | -- | -- | -- | (33 | ) | ||||||||||||||
|
Net
earnings (loss) available to common shareholders
|
$ | (491 | ) | $ | 7,473 | $ | 7,410 | $ | (793 | ) | $ | 2,658 | ||||||||
|
Earnings
(loss) per share – basic
|
$ | (0.10 | ) | $ | 1.38 | $ | 1.41 | $ | (0.15 | ) | $ | 0.53 | ||||||||
|
– diluted
|
$ | (0.10 | ) | $ | 1.35 | $ | 1.37 | $ | (0.15 | ) | $ | 0.52 | ||||||||
|
Cash
dividends per share
|
$ | -- | $ | -- | $ | -- | $ | -- | $ | -- | ||||||||||
|
Shares
used in per share calculation – basic
|
4,958 | 5,430 | 5,265 | 5,205 | 5,041 | |||||||||||||||
|
–
diluted
|
4,958 | 5,517 | 5,407 | 5,205 | 5,219 | |||||||||||||||
|
Balance
Sheet Data:
|
||||||||||||||||||||
|
Cash
and cash equivalents and short-term investments
|
$ | 18,142 | $ | 36,322 | $ | 27,880 | $ | 15,246 | $ | 13,181 | ||||||||||
|
Working
capital
|
37,033 | 47,531 | 40,946 | 30,057 | 28,164 | |||||||||||||||
|
Property,
plant and equipment, net.
|
16,175 | 8,705 | 4,671 | 4,275 | 4,264 | |||||||||||||||
|
Total
assets
|
80,715 | 89,625 | 75,497 | 57,938 | 57,527 | |||||||||||||||
|
Current
portion of long-term debt
|
319 | -- | -- | 1 | 1,121 | |||||||||||||||
|
Long-term
debt, less current portion
|
5,876 | -- | -- | -- | 1,199 | |||||||||||||||
|
Shareholders'
equity
|
$ | 51,457 | $ | 60,368 | $ | 50,393 | $ | 41,252 | $ | 40,471 | ||||||||||
|
ITEM
7.
|
MANAGEMENT'S DISCUSSION AND ANALYSIS OF FINANCIAL CONDITION
AND RESULTS OF OPERATIONS.
|
Introduction
The
Company and its wholly-owned subsidiaries design, manufacture and sell process
automation systems integrating electro-optical inspection, sorting and process
systems.
The
Company consists of Key Technology, Inc. which directly owns five
subsidiaries: Key Holdings USA LLC; Key Technology Australia Pty
Ltd.; Productos Key Mexicana S. de R. L. de C.V.; Key Technology (Shanghai)
Trading Co., Ltd.; and Key Technology Asia-Pacific Pte. Ltd. Key
Holdings USA LLC owns Suplusco Holdings B.V., its European subsidiary, which
owns Key Technology B.V. The Company manufactures products in Walla
Walla, Washington; Redmond, Oregon; and Beusichem, The Netherlands.
Overview
Sales for
the year ended September 30, 2009 were $105.4 million compared with $134.1
million for fiscal 2008. The Company reported a net loss for fiscal
2009 of $491,000, or $0.10 per diluted share, compared with net earnings of $7.5
million, or $1.35 per diluted share, for fiscal 2008. Net earnings
decreased in fiscal 2009 compared to fiscal 2008 as a result of a 21.4% decrease
in sales volume, reflecting the 25.7% decrease in orders for fiscal 2009, as
well as a decline in gross margins from 39.7% in fiscal 2008 to 37.1% in fiscal
2009. These decreases were partially offset by lower operating
expenses of $39.6 million, or 37.6% of net sales, compared to $43.0 million, or
32% of net sales, for fiscal 2008. Other expenses were $431,000 in
fiscal year 2009 compared to other income of $666,000 in fiscal year 2008,
primarily as a result of lower interest income on lower cash balances, higher
interest expense related to the mortgage on the Company’s headquarters facility,
unfavorable changes in foreign currency exchange rates, and a valuation
impairment charge related to a minority investment in
Proditec. Automated inspection systems sales were down 14%, process
systems sales were down 36%, and parts and service sales decreased 4% from the
prior fiscal year. The primary market forces driving demand for our
products are: the increased concerns about food safety and security, the
inability of food and pharmaceutical processors to obtain cost effective labor,
and the Company’s expansion into international markets. Export and
international sales for the fiscal years ended September 30, 2009, 2008 and 2007
accounted for 43%, 50% and 46% of net sales in each year,
respectively.
The
worldwide economic recession and tightening of credit markets affected the
Company’s fiscal 2009 results. Order and sales volumes for fiscal
2009 were down across most of the Company’s significant geographic markets,
industries and product lines. The decline in consumer spending and
economic uncertainty during the fiscal year resulted in conservative capital
spending throughout our markets as customers evaluated the potential economic
effects on their business. This resulted in customers seeking to
retain cash, price sensitivity, longer or delayed purchasing cycle processes,
and more purchasing decisions being made at corporate levels as compared to
local operating locations. Customers who had relied on credit facilities to
finance capital purchases were often constrained by the lack of readily
available credit. In addition, in response to the resulting excess
capacity, the market saw very aggressive pricing efforts to stimulate demand,
which increased the competitive pricing pressure on the Company.
In 2009,
the Company continued to focus efforts on four major long-term revenue
initiatives:
|
|
·
|
Grow
the Company’s core food processing markets including potatoes, fresh-cut,
and processed fruit and vegetables;
|
|
|
·
|
Expand
and grow its participation in the pharmaceutical and nutraceutical
market;
|
|
|
·
|
Strengthen
and grow the level of international business, including Asia Pacific,
Eastern Europe, Latin America, and South American regions;
and
|
|
|
·
|
Grow
the Company’s aftermarket product
lines.
|
In 2009,
decreased sales in our core food processing businesses, including upgrades,
accounted for a significant portion of the company’s decrease in
revenues. Given the severe economic challenges in fiscal 2009, sales
in potatoes, fresh-cut, processed fruit and vegetables, and pharmaceuticals all
decreased in 2009 compared to fiscal 2008. The pharmaceutical
initiative to develop and grow Key’s business in applications for the
pharmaceutical and nutraceutical market began in the fourth quarter of fiscal
2005. Anticipated penetration into this market will extend and
advance the Company’s existing patented, high-resolution inspection technology
and material handling
platforms. In
fiscal 2009, the Company completed development of its new Verisym sorter which
is designed for high volume softgel and tablet applications. Net
sales for pharmaceutical and nutraceutical products represent less than 5% of
the Company’s sales.
The
Company’s sales and orders in North America, Europe and Latin America all
decreased in fiscal 2009 compared to the prior year. In fiscal 2009,
sales volume in China increased over 130% from fiscal 2008. The Company has
historically been successful in selling tobacco sorters into
China. The Company also experienced certain success in fiscal 2009
with new opportunities in the food processing business in China, and it
continues to develop its marketing and product strategies to be more successful
in the Chinese food processing market. In fiscal 2009, the Company
entered into an original equipment manufacturer agreement with Hauni
Maschinenbau AG which makes Key Technology Hauni’s sole supplier of optical
sorting equipment for the tobacco industry.
The
Company also focused on its aftermarket product lines (which include
parts/service and upgrades) during fiscal 2009. With the introduction
of the G6 family of products in 2005, this enhanced vision engine technology
provided additional product upgrade opportunities. Upgrades are an
important aspect of the aftermarket product lines, and the modular G6 product
family, which provides advanced image processing capability, has been well
received by the Company’s current customers. Aftermarket sales
(including upgrades which are classified in automated inspection systems)
increased slightly in fiscal 2009 to $38.6 million from $38.5 million in fiscal
2008.
In fiscal
2009, the Company released sixteen new products to the market
place. During the fourth quarter, the Company received $8.2 million
in orders under a $20 million agreement with a major vegetable processor, a
significant portion of which was for our new Manta 1600 sorter. This,
and other new orders, supports our belief that our new products create
differentiated value for our customers and should provide future benefits from
our investments.
The
Company’s strategic initiatives for 2010 are to continue to leverage its new
product developments released in fiscal 2009. The focus for the
coming year is to grow sales in the Company’s core markets and geographical
regions, and invest in a market-driven technology road map that provides the new
products required by our customers. In addition, the Company will
focus on four primary industries: potatoes, fresh cut produce, processed fruit
and vegetables, and pharmaceutical/nutraceutical, and focus on specific
developing regions: Asia Pacific, Latin America, South America, Eastern Europe
and the Middle East.
The
Company also plans to continue to make strategic investments in research and
development. Efforts in research and development will continue to
focus on customer solutions, providing new products that meet current needs as
well as anticipated future functionality requirements. In the third
quarter of fiscal 2009, the Company went live with its new global enterprise
resource planning (“ERP”) system. While the majority of the
implementation was done during fiscal 2009, the implementation will continue
through 2010. A significant portion of the ERP implementation costs
have been capitalized. During fiscal 2009, the Company incurred
capital expenditures of approximately $3.1 million associated with the
implementation of the ERP system. Cumulative capital expenditures on
the ERP system are approximately $6.1 million.
Application
of Critical Accounting Policies
The
Company has identified its critical accounting policies, the application of
which may materially affect the financial statements, either because of the
significance of the financial statement item to which they relate, or because
they require management judgment to make estimates and assumptions in measuring,
at a specific point in time, events which will be settled in the
future. The critical accounting policies, judgments and estimates
which management believes have the most significant effect on the financial
statements are set forth below:
|
|
·
|
Revenue
recognition
|
|
|
·
|
Allowances
for doubtful accounts
|
|
|
·
|
Valuation
of inventories
|
|
|
·
|
Long-lived
assets
|
|
|
·
|
Allowances
for warranties
|
|
|
·
|
Accounting
for income taxes
|
Management
has discussed the development, selection and related disclosures of these
critical accounting estimates with the audit committee of the Company’s board of
directors.
Revenue
Recognition. The Company recognizes revenue when persuasive
evidence of an arrangement exists, delivery has occurred or services have been
provided, the sale price is fixed or determinable, and collectability is
reasonably assured. Additionally, the Company sells its goods on
terms which transfer title and risk of loss at a specified location, typically
shipping point, port of loading or port of discharge, depending on the final
destination of the goods. Accordingly, revenue recognition from
product sales occurs when all criteria are met, including transfer of title and
risk of loss, which occurs either upon shipment by the Company or upon receipt
by customers at the location specified in the terms of sale. Sales of
system upgrades are recognized as revenue upon completion of the conversion of
the customer’s existing system when this conversion occurs at the customer
site. Revenue earned from services (maintenance, installation
support, and repairs) is recognized ratably over the contractual period or as
the services are performed. If any contract provides for both
equipment and services (multiple deliverables), the sales price is allocated to
the various elements based on objective evidence of fair value. Each
element is then evaluated for revenue recognition based on the previously
described criteria. The Company’s sales arrangements provide for no
other significant post-shipment obligations. If all conditions of
revenue recognition are not met, the Company defers revenue
recognition. In the event of revenue deferral, the sale value is not
recorded as revenue to the Company, accounts receivable are reduced by any
related amounts owed by the customer, and the cost of the goods or services
deferred is carried in inventory. In addition, the Company
periodically evaluates whether an allowance for sales returns is
necessary. Historically, the Company has experienced few sales
returns. The Company accounts for cash consideration (such as sales
incentives) that are given to customers or resellers as a reduction of revenue
rather than as an operating expense unless an identified benefit is received for
which fair value can be reasonably estimated. The Company believes
that revenue recognition is a “critical accounting estimate” because the
Company’s terms of sale vary significantly, and management exercises judgment in
determining whether to recognize or defer revenue based on those
terms. Such judgments may materially affect net sales for any
period. Management exercises judgment within the parameters of
accounting principles generally accepted in the United States of America (GAAP)
in determining when contractual obligations are met, title and risk of loss are
transferred, the sales price is fixed or determinable and collectability is
reasonably assured. At September 30, 2009, the Company had invoiced
$1.1 million compared to $2.9 million at September 30, 2008 for which the
Company has not recognized revenue.
Allowances for doubtful
accounts. The Company establishes allowances for doubtful
accounts for specifically identified, as well as anticipated, doubtful accounts
based on credit profiles of customers, current economic trends, contractual
terms and conditions, and customers’ historical payment
patterns. Factors that affect collectability of receivables include
general economic or political factors in certain countries that affect the
ability of customers to meet current obligations. The Company
actively manages its credit risk by utilizing an independent credit rating and
reporting service, by requiring certain percentages of down payments, and by
requiring secured forms of payment for customers with uncertain credit profiles
or located in certain countries. Forms of secured payment could
include irrevocable letters of credit, bank guarantees, third-party leasing
arrangements or EX-IM Bank guarantees, each utilizing Uniform Commercial Code
filings, or the like, with governmental entities where possible. The
Company believes that the accounting estimate related to allowances for doubtful
accounts is a “critical accounting estimate” because it requires management
judgment in making assumptions relative to customer or general economic factors
that are outside the Company’s control. As of September 30, 2009, the
balance sheet included allowances for doubtful accounts of
$481,000. Amounts charged to bad debt expense for fiscal 2009 and
2008 were $196,000 and $116,000, respectively. Actual charges to the
allowance for doubtful accounts for fiscal 2009 and 2008 were $37,000 and
$230,000, respectively. If the Company experiences actual bad debt
expense in excess of estimates, or if estimates are adversely adjusted in future
periods, the carrying value of accounts receivable would decrease and charges
for bad debts would increase, resulting in decreased net earnings.
Valuation of
inventories. Inventories are stated at the lower of cost or
market. The Company’s inventory includes purchased raw materials, manufactured
components, purchased components, service and repair parts, work in process,
finished goods and demonstration equipment. Write downs for excess
and obsolete inventories are made after periodic evaluation of historical sales,
current economic trends, forecasted sales, estimated product lifecycles and
estimated inventory levels. The factors that contribute to inventory
valuation risks are the Company’s purchasing practices, electronic component
obsolescence, accuracy of sales and production forecasts, introduction of new
products, product lifecycles and the associated product support. The
Company actively manages its exposure to inventory valuation risks by
maintaining low safety stocks and minimum purchase lots, utilizing just in
time
purchasing
practices, managing product end-of-life issues brought on by aging components or
new product introductions, and by utilizing inventory minimization strategies
such as vendor-managed inventories. The Company believes that the
accounting estimate related to valuation of inventories is a “critical
accounting estimate” because it is susceptible to changes from period-to-period
due to the requirement for management to make estimates relative to each of the
underlying factors ranging from purchasing to sales to production to after-sale
support. At September 30, 2009, cumulative inventory adjustments to
lower of cost or market totaled $2.2 million compared to $1.7 million as of
September 30, 2008. Amounts charged to expense to record inventory at
lower of cost or market for fiscal 2009 and 2008 were $726,000 and $708,000,
respectively. Actual charges to the cumulative inventory adjustments
upon disposition or sale of inventory were $291,000 and $801,000 for fiscal 2009
and 2008, respectively. If actual demand, market conditions or
product lifecycles are adversely different from those estimated by management,
inventory adjustments to lower market values would result in a reduction to the
carrying value of inventory, an increase in inventory write-offs, and a decrease
to gross margins.
Long-lived
assets. The Company regularly reviews all of its long-lived
assets, including property, plant and equipment, investments and amortizable
intangible assets, for impairment whenever events or changes in circumstances
indicate that the carrying value may not be recoverable. If the total
of projected future undiscounted cash flows is less than the carrying amount of
these assets, an impairment loss based on the excess of the carrying amount over
the fair value of the assets is recorded. In addition, goodwill is
reviewed based on its fair value at least annually. As of September
30, 2009, the Company held $21.0 million of property, plant and equipment,
goodwill and other intangible assets, net of depreciation and
amortization. There were no changes in the Company’s long-lived
assets that would result in an adjustment of the carrying value for these assets
except for an impairment charge of $219,000 related to its investment in
Proditec. Estimates of future cash flows arising from the utilization
of these long-lived assets and estimated useful lives associated with the assets
are critical to the assessment of recoverability and fair values. The
Company believes that the accounting estimate related to long-lived assets is a
“critical accounting estimate” because: (1) it is susceptible to
change from period to period due to the requirement for management to make
assumptions about future sales and cost of sales generated throughout the lives
of several product lines over extended periods of time; and (2) the potential
effect that recognizing an impairment could have on the assets reported on the
Company’s balance sheet and the potential material adverse effect on reported
earnings or loss. Changes in these estimates could result in a
determination of asset impairment, which would result in a reduction to the
carrying value and a reduction to net earnings in the affected
period.
Allowances for
warranties. The Company’s products are covered by standard
warranty plans included in the price of the products ranging from 90 days to
five years, depending upon the product and contractual terms of
sale. The Company establishes allowances for warranties for
specifically identified, as well as anticipated, warranty claims based on
contractual terms, product conditions and actual warranty experience by product
line. Company products include both manufactured and purchased
components and, therefore, warranty plans include third-party sourced parts
which may not be covered by the third-party manufacturer’s
warranty. Ultimately, the warranty experience of the Company is
directly attributable to the quality of its products. The Company
actively manages its quality program by using a structured product introduction
plan, process monitoring techniques utilizing statistical process controls,
vendor quality metrics, a quality training curriculum for every employee, and
feedback loops to communicate warranty claims to designers and engineers for
remediation in future production. The Company believes that the
accounting estimate related to allowances for warranties is a “critical
accounting estimate” because: (1) it is susceptible to significant
fluctuation period to period due to the requirement for management to make
assumptions about future warranty claims relative to potential unknown issues
arising in both existing and new products, which assumptions are derived from
historical trends of known or resolved issues; and (2) risks associated with
third-party supplied components being manufactured using processes that the
Company does not control. As of September 30, 2009, the balance sheet
included warranty reserves of $2.1 million, while $4.0 million of warranty
charges were incurred during the fiscal year then ended, compared to warranty
reserves of $1.7 million as of September 30, 2008 and warranty charges of $2.7
million for the fiscal year then ended. If the Company’s actual
warranty costs are higher than estimates, future warranty plan coverages are
different, or estimates are adversely adjusted in future periods, reserves for
warranty expense would need to increase, warranty expense would increase and
gross margins would decrease.
Accounting for income
taxes. The Company’s provision for income taxes and the
determination of the resulting deferred tax assets and liabilities involves a
significant amount of management judgment. The quarterly provision
for income taxes is based partially upon estimates of pre-tax financial
accounting income for the full year and is affected by various differences
between financial accounting income and taxable income. Judgment is
also applied
in
determining whether the deferred tax assets will be realized in full or in
part. In management’s judgment, when it is more likely than not that
all or some portion of specific deferred tax assets, such as foreign tax credit
carryovers, will not be realized, a valuation allowance must be established for
the amount of the deferred tax assets that are determined not to be
realizable. At September 30, 2009, the Company had valuation reserves
of approximately $430,000 for deferred tax assets for capital loss carryforwards
and the valuation of notes receivable related to the sale of the investment in
the InspX joint venture and the valuation impairment of its investment in
Proditec, and offsetting amounts for U.S. and Chinese deferred tax assets and
liabilities, primarily related to net operating loss carry forwards in the
foreign jurisdictions that the Company believe will not be utilized during the
carryforward periods. During fiscal 2009, the Company recorded
$79,000 of valuation reserves related to impairment charges on its investment in
Proditec and reversed $99,000 of valuation reserves upon partial reversal of its
valuation reserve on its note receivable from the sale of its interest in the
InspX joint venture. During fiscal 2008, $60,000 of net valuation
reserves for combined U.S. and Australian deferred taxes were eliminated due to
the final dissolution of the related Australian entity. There were no
other valuation allowances at September 30, 2009 due to anticipated utilization
of all the deferred tax assets as the Company believes it will have sufficient
taxable income to utilize these assets. The Company maintains
reserves for estimated tax exposures in jurisdictions of
operation. These tax jurisdictions include federal, state and various
international tax jurisdictions. Potential income tax exposures
include potential challenges of various tax credits and deductions, and issues
specific to state and local tax jurisdictions. Exposures are
typically settled primarily through audits within these tax jurisdictions, but
can also be affected by changes in applicable tax law or other factors, which
could cause management of the Company to believe a revision of past estimates is
appropriate. During fiscal 2009 and 2008, there were no significant
changes in these estimates. Management believes that an appropriate
liability has been established for estimated exposures; however, actual results
may differ materially from these estimates. The Company believes that
the accounting estimate related to income taxes is a “critical accounting
estimate” because it relies on significant management judgment in making
assumptions relative to temporary and permanent timing differences of tax
effects, estimates of future earnings, prospective application of changing tax
laws in multiple jurisdictions, and the resulting ability to utilize tax assets
at those future dates. If the Company’s operating results were to
fall short of expectations, thereby affecting the likelihood of realizing the
deferred tax assets, judgment would have to be applied to determine the amount
of the valuation allowance required to be included in the financial statements
in any given period. Establishing or increasing a valuation allowance
would reduce the carrying value of the deferred tax asset, increase tax expense
and reduce net earnings.
The
federal Research and Development Credit (“R&D credit”) expired on December
31, 2007. In fiscal 2009, the Emergency Economic Stabilization Act of
2008 was enacted. As part of the legislation, the existing R&D
credit was retroactively renewed and extended to December 31,
2009. Due to this change in tax law, the Company recorded
approximately $160,000 of additional R&D tax credits in fiscal 2009 related
to R&D expenditures incurred during fiscal 2008.
|
Comparison
of Fiscal 2009 to Fiscal 2008
|
||||||||||||||||
|
Fiscal
Year Ended September 30,
|
||||||||||||||||
|
2009
|
2008
|
Change
$
|
Change
%
|
|||||||||||||
|
(in
thousands)
|
||||||||||||||||
|
Statement
of Operations Data
|
||||||||||||||||
|
Net
sales
|
$ | 105,450 | $ | 134,086 | $ | (28,636 | ) | -21.4 | ||||||||
|
Gross
profit
|
39,023 | 53,193 | (14,170 | ) | -26.6 | |||||||||||
|
Research
and development
|
8,681 | 8,744 | (63 | ) | -0.7 | |||||||||||
|
Sales
and marketing
|
18,090 | 21,373 | (3,283 | ) | -15.4 | |||||||||||
|
General
and administrative
|
11,568 | 11,528 | 40 | 0.3 | ||||||||||||
|
Amortization
|
1,270 | 1,307 | (37 | ) | -2.8 | |||||||||||
|
Total
operating expense
|
39,609 | 42,952 | (3,343 | ) | -7.8 | |||||||||||
|
Gain
(loss) on disposition of assets
|
(352 | ) | 81 | (433 | ) | n/m | * | |||||||||
|
Income
(loss) from operations
|
(938 | ) | 10,322 | (11,260 | ) | -109.1 | ||||||||||
|
Other
income (expense)
|
(431 | ) | 666 | (1,097 | ) | -164.7 | ||||||||||
|
Income
tax expense (benefit)
|
(878 | ) | 3,515 | (4,393 | ) | -125.0 | ||||||||||
|
Net
earnings (loss)
|
(491 | ) | 7,473 | (7,964 | ) | -106.6 | ||||||||||
|
Balance
Sheet Data
|
||||||||||||||||
|
Cash
and cash equivalents
|
18,142 | 36,322 | (18,180 | ) | -50.1 | |||||||||||
|
Accounts
receivable
|
12,332 | 13,577 | (1,245 | ) | -9.2 | |||||||||||
|
Inventories
|
22,433 | 21,915 | 518 | 2.4 | ||||||||||||
|
Other
Data (unaudited)
|
||||||||||||||||
|
Orders
for year ended September 30
|
101,754 | 136,874 | (35,120 | ) | -25.7 | |||||||||||
|
Backlog
at fiscal year end
|
29,665 | 33,804 | (4,139 | ) | -12.2 | |||||||||||
|
*
Not meaningful
|
||||||||||||||||
Results
of Operations
Fiscal
2009 compared to Fiscal 2008
Net sales
for the year ended September 30, 2009 were $105.4 million, a 21% decrease from
the $134.1 million reported for fiscal 2008. Sales in the Company’s
automated inspection systems product line decreased by 14% to $48.2 million in
fiscal 2009, accounting for 45% of total revenues, compared to $56.0 million in
fiscal 2008 and 42% of total revenues. Sales decreased from the prior
year in almost all automated inspection product lines except for the new Manta
automated inspection product which was introduced in fiscal 2008 and upgrade
system sales. Process systems sales in fiscal 2009 were $36.5
million, a 36% decrease from the $56.6 million reported for fiscal
2008. Sales of process systems accounted for 35% of total revenues in
fiscal 2009 compared to 42% in fiscal 2008. Shipments of process
systems in fiscal 2009 from United States operating locations decreased nearly
26% and from the Netherlands decreased by nearly 60%. Parts and
service sales decreased from the prior year by $765,000 or 4%, and represented
20% of sales in fiscal 2009, compared to 16% of sales in fiscal
2008.
New
orders decreased 26%, or $35.1 million, to $101.8 million in fiscal 2009 from
the $136.9 million in new orders received in fiscal 2008. Backlog at
September 30, 2009 decreased 12% to $29.7 million compared to the $33.8 million
reported at the end of fiscal 2008. The order mix for the more recent
year changed slightly from fiscal 2008. For fiscal 2009, the
Company’s higher margin automated inspection systems orders decreased by $17.7
million, or 28%, representing 44% of order volume in fiscal 2009 compared to
almost 46% in the prior year. This decrease occurred in almost all
automated product inspection lines, except for the Manta automated inspection
product.
Gross
profits decreased to $39.0 million for fiscal 2009 compared to $53.2 million in
fiscal 2008, or 37.0% and 39.7% of net sales, respectively. The
principle reason for the $14.2 million decrease in gross profit relates to
the
over 21%
decrease in sales volume. The decline in the gross profit percentage
resulted primarily from factory underutilization, decreased volumes and
efficiencies in manufacturing operations and increased warranty and customer
support related costs. Management intends to focus on reducing
warranty and customer support costs in the next fiscal year.
Research
and development spending decreased $63,000 to $8.7 million, or 8.2% of sales, in
fiscal 2009 from $8.7 million and 6.5% of sales in fiscal 2008. The
fiscal 2009 spending relates significantly to the sixteen new product solutions
released during the year, including the new SYMETIX products.
Sales and
marketing spending in fiscal 2009 decreased to $18.1 million, compared to the
$21.4 million spent in fiscal 2008. As a percentage of sales, sales
expense increased 1.3% to 17.2% of sales in fiscal 2009 from the 15.9% of sales
reported in fiscal 2008. The primary reasons for the decrease in
spending were the significantly lower sales volume and a decrease in the mix of
sales through independent sales representatives which incur higher commission
rates.
General
and administrative spending in fiscal 2009 was $11.6 million and 11.0% of sales
for the year, compared to $11.5 million and 8.6% of sales for fiscal
2008. Increases in expenses associated with the ERP project were
almost entirely offset by a reduction in stock compensation expense and
incentive compensation expense, as well as reductions in other administrative
areas.
Other
income and expense was an expense of $431,000 for fiscal 2009 compared to
$666,000 of income for fiscal 2008. Interest income decreased to
$224,000 in fiscal 2009 from the $735,000 reported for fiscal 2008 due to lower
interest rates and lower investment balances. In fiscal 2009, the
Company recognized foreign exchange losses of $362,000, net of the effects of
forward contracts settled during the year, compared with exchange losses of
$157,000 in fiscal 2008. During fiscal 2009, the Company incurred
interest expense of $150,000, net of interest capitalized, primarily related to
the mortgage on its headquarters facility compared to interest expense of $8,000
in fiscal 2008. During fiscal 2009, the company also recorded a
$219,000 valuation impairment charge related to its minority investment in
Proditec, offset by a $275,000 gain related to partial collection of its note
receivable from the fiscal 2007 sale of its interest in the InspX joint
venture.
The
effective tax rate for the Company was a tax benefit rate of 64.1% in fiscal
2009 compared to a tax expense rate of 32% in fiscal 2008. The
effective tax rate for fiscal 2009 was primarily affected by the research and
development (“R&D”) credits recorded in fiscal 2009 including $160,000 of
additional R&D tax credits related to fiscal 2008 recorded due to changes in
tax law during fiscal 2009 to retroactively renew the R&D tax
credit. Other items, such as permanent differences arising from
domestic production deductions, tax exempt interest, and other permanent
differences, caused the effective tax rate to vary from the 34% statutory rate
in both fiscal 2009 and 2008.
Net loss
in fiscal 2009 was $491,000, or $0.10 per diluted share, compared to net
earnings of $7.5 million, or $1.35 per diluted share, in fiscal
2008. The principal reasons for the decrease in earnings for fiscal
2009 compared to fiscal 2008 were decreased sales volumes, lower gross profit
margins, and unfavorable changes in the components of other income and expense,
which were partially offset by decreased operating expenses.
Fiscal
2008 compared to Fiscal 2007
Net sales
for the year ended September 30, 2008 were $134.1 million, a 25% increase over
the $107.5 million reported for fiscal 2007. The Company ended the
year strongly with a record fourth quarter of $40.2 million in sales, a 27%
increase over the corresponding period in fiscal 2007.
Sales in
the Company’s automated inspection systems product line increased by 19% to
$56.0 million in fiscal 2008, accounting for 42% of total revenues, compared to
$46.9 million in fiscal 2007 and 44% of total revenues. The most
significant increase was in upgrade sales which increased $4.3 million or 34% to
$16.9 million. Sales increased over the prior year in almost
all automated inspection product lines including the new Manta automated
inspection product which was introduced in fiscal 2008. Process
systems sales in fiscal 2008 were $56.6 million, a 38% increase over the $40.9
million reported for fiscal 2007. Sales of process systems accounted
for 42% of total revenues in fiscal 2008 compared to 38% in fiscal
2007. Shipments of process systems in fiscal 2008 from United States
operating locations increased nearly 46% and from the Netherlands increased by
nearly 23%. Parts and
service
sales increased from the prior year by $1.8 million or 9%, and represented 16%
of sales in fiscal 2008, compared to 18% of sales in fiscal 2007.
New
orders increased 19%, or $21.6 million, to $136.9 million in fiscal 2008 over
the $115.3 million in orders received in fiscal 2007. Backlog at
September 30, 2008 increased to $33.8 million compared to the $30.9 million
reported at the end of fiscal 2007. The order mix for the more recent
year improved over fiscal 2007. For fiscal 2008, the
Company’s higher margin automated inspection systems orders increased by $14.3
million, or 30%, representing almost 46% of order volume in fiscal 2008 compared
to 42% in the prior year. This increase was due in large part to an
almost 31% increase in upgrade orders.
Gross
profits increased to $53.2 million for fiscal 2008 compared to $41.4 million in
fiscal 2007, or 39.7% and 38.5% of net sales, respectively. The
principle driver for the $11.8 million increase in gross profit relates to the
nearly 25% increase in sales volume. The improvement in the gross
profit percentage relates to the lower other cost of sales relating to improved
manufacturing and overhead variances.
Research
and development spending increased $3.2 million to $8.7 million, or 6.5% of
sales, in fiscal 2008 from $5.5 million and 5.1% of sales in fiscal
2007. The increase was driven largely by increases in the research
and development team, as well as significant investments in research and
development for SYMETIX projects.
Sales and
marketing spending in fiscal 2008 increased to $21.4 million, compared to the
$17.2 million spent in fiscal 2007. As a percentage of sales, sales
expense decreased 0.1% from the 16.0% of sales reported in fiscal 2007 to 15.9%
of sales reported in fiscal 2008. The primary drivers for the
increase in spending were the significantly higher sales volume, continued
investment in the Company’s SYMETIX initiative in the pharmaceutical and
nutraceutical industry, and an increase in the mix of sales through independent
representatives which incur higher commission rates.
General
and administrative spending in fiscal 2008 was $11.5 million and 8.6% of sales
for the year, compared to $8.8 million and 8.2% of sales for fiscal
2007. The increase in fiscal 2008 was due to the investment in the
Company’s new ERP system, increases in incentive and stock compensation, and new
employee salary and relocation expenses.
Other
income and expense was $666,000 of income for fiscal 2008 compared to $2.0
million of income for fiscal 2007. Interest income increased slightly
to $735,000 in fiscal 2008 from the $726,000 reported for fiscal
2007. The Company recognized exchange losses of $157,000 in fiscal
2008 compared with exchange gains of $570,000 in fiscal 2007. During
fiscal 2007, the Company recognized a gain of $750,000 from the sale of its
investment in the InspX joint venture.
The
effective tax rate for the Company was 32.0% in fiscal 2008 compared to 30.0% in
fiscal 2007. The effective tax rate for fiscal 2007 was primarily
affected by the reversal of valuation reserves recorded in fiscal 2006 related
to the Company’s valuation of its investment in the InspX joint
venture. Other items, such as permanent differences arising from
extra-territorial income exclusions, domestic production deductions, research
and development tax credits, tax exempt interest, and other permanent
differences, caused the effective tax rate to vary from the 34% statutory rate
in both fiscal 2008 and 2007.
Net
earnings in fiscal 2008 were $7.5 million, or $1.35 per diluted share, compared
to net earnings of $7.4 million, or $1.37 per diluted share, in fiscal
2007. The principal reasons for the increase in earnings for fiscal
2008 compared to fiscal 2007 were increased sales volumes and improved gross
profit margins which were partially offset by increased operating expenses and
the unfavorable effects of changes in foreign currency exchange
rates. Earnings in fiscal 2007 were favorably impacted by the
$750,000 gain, or $0.14 per share, from the sale of the Company’s 50% interest
in its InspX joint venture.
Liquidity
and Capital Resources
Fiscal
2009
For
fiscal year 2009, net cash decreased by $18.2 million, or over 50%, to $18.1
million on September 30, 2009. The Company used $3.4 million in cash
in operating activities, $3.2 million in financing activities and consumed $11.5
million in investing activities.
The net
cash used in operating activities during fiscal 2009 of $3.4 million included a
net loss for the year of $491,000, non-cash expenses for depreciation and
amortization of $3.1 million and non-cash share based payments of
$907,000. Non-cash working capital at September 30, 2009 increased
from the same time last year, contributing $6.8 million to the cash used in
operating activities. Inventory increased due to strategic
investments in inventory related
to new products. An increase in income tax receivable was offset by a
reduction in trade receivables as a result of lower sales in the fourth quarter
compared to the prior year. In addition, there were decreases in
accounts payable, accrued payroll, customer deposits, and customer support and
warranty accruals.
Cash used
in investing activities totaled $11.5 million during fiscal
2009. During the year, the Company exercised its purchase option
under its existing lease and purchased its headquarters facility in Walla Walla,
Washington for $6.5 million which is expected to result in annual cash flow
savings of approximately $300,000. Other capital expenditures during
fiscal 2009 were approximately $5.0 million, including $3.1 million for the
global ERP implementation project. Cash used for investing activities
in fiscal 2008 was $5.4 million.
Cash used
in financing activities totaled $3.2 million in fiscal 2009. The
Company used $10.0 million in cash for the repurchase of 671,250 shares of the
Company’s stock during fiscal 2009. The Company generated $6.4
million in cash from the proceeds associated with the new mortgage on its
headquarters facility in Walla Walla, Washington which was purchased in fiscal
2009. Financing activities also benefited from the $528,000 of excess
tax benefits from share based payments. At the end of
2009, the Company had long term debt outstanding of $6.2
million. There was no long-term debt outstanding at the end of fiscal
2008.
The
Company’s domestic credit facility provides for a variable-rate revolving credit
line of up to $15 million and a credit sub-facility of $6.0 million for standby
letters of credit. The credit facility matures on September 30,
2011. The credit facility bears interest, at the Company’s option, of
either the bank prime rate or the British Bankers Association LIBOR Rate (“BBA
LIBOR”) plus 1.75% per annum. At September 30, 2009, the interest
rate would have been 2.0% based on the lowest of the available alternative
rates. The credit facility is secured by all U.S. accounts
receivable, inventory and equipment and fixtures. The loan agreement
also provided for a 15-year term loan in the amount of $6.4
million. The term loan provided for a mortgage on the Company’s Avery
Street headquarters’ land and building located in Walla Walla,
Washington. The term loan bears interest at the BBA LIBOR rate plus
1.4% and matures on January 2, 2024. The Company also simultaneously
entered into an interest rate swap agreement with the lender to fix the interest
rate at 4.27%. The credit facilities contain covenants which require
the maintenance of a funded debt to EBITDA ratio, a fixed charge coverage ratio
and minimum working capital levels. The loan agreement permits
capital expenditures up to a certain level, and contains customary default and
acceleration provisions. The credit facilities also restrict
acquisitions, incurrence of additional indebtedness and lease expenditures above
certain levels without the prior consent of the lender. At September
30, 2009, the Company had no borrowings outstanding under the credit facility
and $150,000 in standby letters of credit. At September 30, 2009, the
Company was in compliance with its loan covenants. At September 30,
2008, the Company had no borrowings under its previous domestic credit facility
and $380,000 in standby letters of credit.
The
Company’s credit accommodation with a commercial bank in the Netherlands
provides a credit facility for its European subsidiary. This credit
accommodation totals $3.7 million and includes an operating line of the
lesser of $2.2 million or the available borrowing base, which is based on
varying percentages of eligible accounts receivable and inventories, and a bank
guarantee facility of $1.5 million. The operating line and bank
guarantee facility are secured by all of the subsidiary’s personal
property. The credit facility bears interest at the bank’s prime
rate, with a minimum of 3.00%, plus 1.75%. At September 30, 2009, the
interest rate was 6.60%. At September 30, 2009, the Company had no
borrowings under this facility and had received bank guarantees of $2.5 million
under the bank guarantee facility. The credit facility allows
overages on the bank guarantee facility. Any overages reduce the
available borrowings under the operating line. At September 30, 2008,
the Company had no borrowings under this facility and had received bank
guarantees of $1.2 million under the bank guarantee facility.
The
Company anticipates that ongoing cash flows from operations and borrowing
capacity under currently available operating credit lines will be sufficient to
fund the Company’s operating needs for the foreseeable future. Cash
used in operating activities was $3.4 million in fiscal 2009, and cash provided
by operating activities was $13.1 million and $12.4 million in fiscal years 2008
and 2007, respectively. The Company anticipates that its cash needs
will continue to be met from cash from operations as it embarks on its
initiatives to grow the pharmaceutical, nutraceutical and aftermarket
businesses, and expand its operations in international locations. The
Company had no material commitments for capital expenditures at September 30,
2009.
Prior
Years - Fiscal 2008 and 2007
For
fiscal year 2008, net cash increased by $8.4 million, or over 30%, to $36.3
million on September 30, 2008. The Company generated $13.1 million in
cash from operating activities, generated $938,000 from financing activities and
consumed $5.4 million in investing activities.
The net
cash provided by operating activities during fiscal 2008 of $13.1 million
included net earnings for the year of $7.5 million, non-cash expenses for
depreciation and amortization of $2.8 million and non-cash share based payments
and deferred income tax benefits of $1.5 million and $549,000,
respectively. Non-cash working capital at September 30, 2008 declined
from the same time last year, contributing $2.7 million to the cash provided by
operating activities. Inventory increased due to strategic
investments in inventory related to new products and increased business activity
at the end of fiscal 2008. These increases were more than offset by
increases in accounts payable, customer deposits, customer support and warranty
accruals, income taxes payable, as well as higher yearly incentive
accruals. Despite the increase in sales during fiscal 2008, the
Company’s ending accounts receivable balance did not change significantly
compared to the prior fiscal year.
Cash used
in investing activities totaled $5.4 million during fiscal
2008. Capital expenditures during fiscal 2008 were approximately $5.5
million for the fiscal year, including $2.3 million for the global ERP
implementation project and $750,000 for an equipment purchase. Cash
used for investing activities in fiscal 2007 was $749,000.
Cash
generated from financing activities totaled $938,000 in fiscal
2008. $687,000 of cash was generated from the issuance of common
stock related to option exercises. Financing activities also
benefited from the $251,000 excess tax benefit from share based
payments. During the prior fiscal year, the Company repurchased
88,252 shares of its common stock using $1.3 million of cash. At the
end of both fiscal 2007 and 2008, the Company had no long term debt
outstanding.
For
fiscal year 2007, net cash increased by $12.6 million, or nearly 83%, to $27.9
million on September 30, 2007. The Company generated $12.4 million in
cash from operating activities and generated $575,000 from financing activities
and consumed $749,000 in investing activities.
The net
cash provided by operating activities during fiscal 2007 of $12.4 million
included net earnings for the year of $7.4 million, non-cash expenses for
depreciation and amortization of $2.6 million and non-cash share based payments
and deferred income taxes of $987,000 and $721,000, respectively. Net
earnings also included the $750,000 gain on the sale of InspX. This
gain is not included in the cash provided by operations. Non-cash
working capital at September 30, 2007 declined from the same time last year,
contributing $1.7 million to the cash provided by operating
activities. Increased business activity at the end of and during the
fourth quarter of fiscal 2007 versus 2006, reflected by the record year-end
backlog and the record fourth quarter revenues, resulted in increased inventory
and receivables. These increases were more than offset by increases
in accounts payable, customer deposits, customer support and warranty accruals,
as well as higher yearly incentive accruals.
Cash used
in investing activities totaled $749,000 during fiscal 2007. Capital
expenditures during fiscal 2007 were approximately $1.6 million for the fiscal
year, including $706,000 for software purchased for the global ERP
implementation project. These expenditures were partially offset by
$750,000 of proceeds from the sale of InspX and $64,000 in proceeds from the
sale of property.
Cash
generated from financing activities totaled $575,000 in fiscal
2007. The Company initiated a stock repurchase program in fiscal 2007
and repurchased 88,252 shares of stock during the fiscal year using $1.3 million
of cash. These applications of cash were more than offset by the $1.6
million generated from the issuance of
common
stock related to option exercises. Financing activities also
benefited by the $320,000 excess tax benefit from share based
payments. At the end of fiscal 2007, the Company had no long term
debt outstanding.
Contractual
Obligations
The
Company’s continuing contractual obligations and commercial commitments existing
on September 30, 2009 are as follows:
|
Payments
due by period (in thousands)
|
||||||||||||||||||||
|
Contractual
Obligations (1)
|
Total
|
Less
than 1 year
|
1 –
3 years
|
4 –
5 years
|
After
5 years
|
|||||||||||||||
|
Long-term
debt
|
$ | 6,195 | $ | 319 | $ | 678 | $ | 744 | $ | 4,454 | ||||||||||
|
Operating
leases
|
1,849 | 607 | 1,070 | 172 | - | |||||||||||||||
|
Purchase
obligations
|
779 | 779 | - | - | - | |||||||||||||||
|
Total
contractual cash obligations
|
$ | 8,823 | $ | 1,705 | $ | 1,748 | $ | 916 | $ | 4,454 | ||||||||||
(1) The
Company also has $113,000 of contractual obligations related to uncertain tax
positions for which the timing and amount of payment cannot be reasonably
estimated due to the nature of the uncertainties and the unpredictability of
jurisdictional examinations in relation to the statute of
limitations.
At
September 30, 2009, the Company had standby letters of credit totaling $2.6
million, which includes secured bank guarantees under the Company’s credit
facility in Europe and domestic letters of credit securing certain
self-insurance contracts. If the Company fails to meet its
contractual obligations, these bank guarantees and letters of credit may become
liabilities of the Company. The Company has no off-balance sheet
arrangements or transactions, or arrangements or relationships with “special
purpose entities.”
Recently Issued Accounting
Standards
Recently
Adopted Accounting Pronouncements
The
Financial Accounting Standards Board’s (“FASB”) Accounting Standard Codification
(“ASC”) became effective during the fourth quarter of 2009. This codification
brings all authoritative generally accepted accounting principles (“GAAP”) that
have been issued by a standard setter into one place. The
codification retains existing GAAP without changing it.
In fiscal
2009, accounting standard updates to ASC topic 820, “Fair Value Measurements and
Disclosures” (“ASC 820”) became effective for the Company. ASC 820
defines fair value, establishes a framework and gives guidance regarding the
methods used for measuring fair value and expands disclosures about fair value
measurements. This topic does not require any new fair value
measurements, but provides guidance on how to measure fair value by providing a
fair value hierarchy used to classify the source of the
information. ASC 820 also gives entities the option to measure
eligible financial assets and financial liabilities at fair value on an
instrument by instrument basis, that are otherwise not permitted to be accounted
for at fair value under other accounting guidance. The election to
use the fair value option is available when an entity first recognizes a
financial asset or financial liability. Subsequent changes in fair value must be
recorded in earnings. The Company adopted these updates to ASC 820
for financial assets and liabilities in fiscal 2009 and did not elect the fair
value option. Adoption of ASC 820 had no material effect on the
Company’s financial statements.
In fiscal
2009, accounting standard updates to ASC topic 815, “Derivatives and Hedging”
(“ASC 815”) became effective for the Company which required enhanced disclosure
requirements regarding derivative instruments and hedging
activities. The Company adopted these updates to ASC 815 in fiscal
2009. The adoption of the updates did not have an effect on the
Company’s financial statements as it only required additional
disclosure.
In fiscal
2009, accounting standard updates to ASC topic 855, “Subsequent Events” (“ASC
855”) became effective for the Company. ASC 855 establishes general
standards of accounting for and disclosure of events that occur after the
balance sheet date but before financial statements are issued or are available
to be issued. The Company adopted ASC 855 in fiscal
2009. The adoption of ASC 855 did not have an effect on the Company’s
financial statements as it only required additional
disclosures.
Recent
Accounting Pronouncements Not Yet Adopted
In
February 2008, the Financial Accounting Standards Board (“FASB”) delayed the
effective date of fair value measurements for one year for certain nonfinancial
assets and nonfinancial liabilities, excluding those that are recognized or
disclosed in financial statements at fair value on a recurring basis (that is,
at least annually). For purposes of applying these provisions,
nonfinancial assets and nonfinancial liabilities include all assets and
liabilities other than those meeting the definition of a financial asset or a
financial liability. These provisions became effective for fiscal
years beginning after November 15, 2008, and interim periods within those fiscal
years. The Company currently does not believe the adoption of these
provisions will have a significant effect on its financial
statements.
In June
2008, the FASB issued update pronouncements related to determining whether
instruments granted in share-based payment transactions are participating
securities. These updated pronouncements provide that unvested
share-based payment awards that contain nonforfeitable rights to dividends
(whether paid or unpaid) are participating securities and shall be included in
the computation of earnings per share (EPS) under the two-class
method. This pronouncement is effective for financial statements
issued for fiscal years beginning after December 15, 2008. All prior
period EPS data will be required to be adjusted to conform to the provisions of
this pronouncement and early application is prohibited. The Company
does have participating securities as described under this pronouncement and
believes that the adoption of these provisions will not have a material impact
on its EPS calculations.
In
December 2007, FASB issued updated pronouncements related to accounting for
collaborative arrangements. The guidance defines collaborative
arrangements and establishes presentation and disclosure requirements for
transactions within a collaborative arrangement (both with third parties and
between participants in the arrangement). These updated
pronouncements are effective for fiscal years, and interim periods within those
fiscal years, beginning after December 15, 2008. These provisions
require retrospective application to all collaborative arrangements existing as
of the effective date, unless retrospective application is
impracticable. The impracticability evaluation and exception should
be performed on an arrangement-by-arrangement basis. The Company
currently does not believe that the adoption of these provisions will have a
significant effect on its financial statements.
In
December 2007, the FASB issued updated pronouncements related to business
combinations and noncontrolling interests in consolidated financial
statements. These pronouncements require the acquiring entity in a
business combination to recognize the assets acquired and liabilities assumed at
fair value on the date of acquisition. Further, these pronouncements also change
the accounting for acquired in-process research and development assets,
contingent consideration, partial acquisitions and transaction
costs. Under the new pronouncements, all entities are required to
report noncontrolling (minority) interests in subsidiaries as equity in the
consolidated financial statements. In addition, transactions between an entity
and noncontrolling interests will be treated as equity
transactions. These pronouncements will become effective for fiscal
years beginning after December 15, 2008 and early adoption is
prohibited. The Company does not expect the adoption of these
pronouncements to have a significant effect on its financial statements but they
will affect the Company for any acquisitions made subsequent to the end of
fiscal 2009.
In
September 2009, the FASB issued Accounting Standard Update (“ASU”) 2009-13,
“Revenue Arrangements with Multiple Deliverables” and ASU 2009-14, “Certain
Revenue Arrangements That Include Software.” These ASU’s revise and
clarify accounting for arrangements with multiple deliverables, including how to
separate deliverables into units of accounting determining the allocation of
revenue to the units of accounting and the application of these provisions to
tangible products containing software components. There are also
expanded disclosures for significant judgments made in the application of these
standards, if material. These pronouncements are effective for fiscal
years beginning after June 15, 2010 and earlier application is
permitted. The Company does not expect that adoption of these
pronouncements to have a significant effect on its financial
statements.
|
ITEM
7A.
|
QUANTITATIVE AND QUALITATIVE DISCLOSURES ABOUT
MARKET RISK.
|
The
Company has assessed its exposure to market risks for its financial instruments
and has determined that its exposures to such risks are generally limited to
those affected by the value of the U.S. Dollar compared to the Euro and to a
lesser extent the Australian Dollar, Mexican Peso and Chinese
Renminbi.
The terms
of sales to European customers are typically denominated in
Euros. The Company expects that its standard terms of sale to
international customers, other than those in Europe, will continue to be
denominated in U.S. dollars, although as the Company expands its operations in
Australia, Latin America and China, transactions denominated
in the local currencies of these countries may increase. For sales
transactions between international customers, and the Company’s domestic
operations, which are denominated in currencies other than U.S. dollars, the
Company assesses its currency exchange risk and may enter into forward contracts
to minimize such risk. At September 30, 2009, the Company held a
30-day forward contract for €6.0 million. As of September 30, 2009,
management estimates that a 10% change in foreign exchange rates would affect
net earnings before taxes by approximately $298,000 on an annual basis as a
result of converted cash, accounts receivable, loans to foreign subsidiaries,
and sales or other contracts denominated in foreign currencies.
As of
September 30, 2009, the Euro gained a net of 4% in value against the U.S. dollar
compared to its value at September 30, 2008. During the twelve-month
period ended September 30, 2009, changes in the value of the Euro against the
U.S. dollar ranged between a 10% loss and a 4% gain as compared to the value at
September 30, 2008. The strengthening of the Euro was predominately
in the latter half of fiscal 2009, as at February 28, 2009, the Euro had lost
10% in value as compared to the value at September 30, 2008, but ended the
fiscal year at a 4% net gain in value. Other foreign currencies
showed varied changes in value against the U.S. dollar during fiscal 2009,
particularly, the Mexican peso which lost 19% in value against the US dollar
compared to its value at September 30, 2008 after ranging as high as a 28% loss
during the period. The Australian dollar also had fluctuations of
between a 12% gain and a 20% loss compared to its value at September 30,
2008. The effect of these fluctuations on the operations and
financial results of the Company were:
|
·
|
Translation
adjustments of ($24,000), net of income tax, were recognized as a
component of comprehensive income as a result of converting the Euro
denominated balance sheets of Key Technology B.V. and Suplusco Holding
B.V. into U.S. dollars, and to a lesser extent, the Australian dollar
balance sheets of Key Technology Australia Pty Ltd., the RMB balance sheet
of Key Technology (Shanghai) Trading Co., Ltd., the Singapore dollar
balance sheet of Key Technology Asia-Pacific Pte. Ltd., and the Peso
balance sheet of Productos Key
Mexicana.
|
|
·
|
Foreign
exchange losses of $362,000, net of the effects of forward contracts
settled during the year, were recognized in the other income and expense
section of the consolidated statement of operations as a result of
conversion of Euro and other foreign currency denominated receivables,
intercompany loans, and cash carried on the balance sheet of the U.S.
operations, as well as the result of the conversion of other
non-functional currency receivables, payables and cash carried on the
balance sheets of the European, Australian, Chinese, Singapore and Mexican
operations.
|
Compared
to historical exchange rates, the U.S. dollar is still in a relatively weak
position on the world markets. A relatively weaker U.S. dollar makes
the Company’s U.S.-manufactured goods relatively less expensive to international
customers when denominated in U.S. dollars or potentially more profitable to the
Company when denominated in a foreign currency. On the other hand,
materials or components imported into the U.S. may be more
expensive. A relatively weaker U.S. dollar on the world markets,
especially as measured against the Euro, may favorably affect the Company’s
market and economic outlook for international sales. Conversely, when
the dollar strengthens on the world markets, the Company’s market and economic
outlook for international sales could be negatively affected as export sales to
international customers become relatively more expensive. The
Company’s Netherlands-based subsidiary transacts business primarily in Euros and
does not have significant exports to the U.S, but does import a significant
portion of its products from its U.S.-based parent company.
Under the
Company’s current credit facilities, the Company may borrow at either the
lender’s prime rate or at BBA LIBOR plus 175 basis points on its domestic credit
facility and at the lenders prime rate plus 175 basis points on its European
credit facility. At September 30, 2009, the Company had no borrowings
under these arrangements. During the year ended September 30, 2009,
interest rates applicable to these variable rate credit facilities ranged from
1.31% to 8.15%. At September 30, 2009, the rate was 2.0% on its
domestic credit facility and 6.60% on its European credit facility based on the
lowest of the available alternative rates. The Company’s mortgage
bears interest at the BBA LIBOR plus 140 basis points, but the Company
simultaneously entered into an interest rate swap agreement with the lender to
fix the interest rate a 4.27%. As of September 30, 2009, management
estimates that a 100 basis point change in these interest rates would not affect
net income before taxes because the Company had no
borrowings
outstanding under its variable interest rate credit facilities and the interest
rate swap effectively converts its variable rate mortgage to a fixed rate
mortgage.
|
ITEM
8.
|
FINANCIAL STATEMENTS AND SUPPLEMENTARY
DATA.
|
|
Title
|
Page
|
|
Report
of Independent Registered Public Accounting Firm
|
36
|
|
Consolidated
Balance Sheets at September 30, 2009 and 2008
|
37
|
|
Consolidated
Statements of Operations for the three years ended September 30,
2009
|
39
|
|
Consolidated
Statements of Shareholders' Equity for the three years ended September 30,
2009
|
40
|
|
Consolidated
Statements of Cash Flows for the three years ended September 30,
2009
|
41
|
|
Notes
to Consolidated Financial Statements
|
43
|
|
Supplementary
Data
|
63
|
Board of
Directors and Shareholders of Key Technology, Inc.
We have
audited the accompanying consolidated balance sheets of Key Technology, Inc., an
Oregon corporation, (the “Company”) as of September 30, 2009 and 2008,
and the related consolidated statements of operations, shareholders’ equity, and
cash flows for each of the three years in the period ended
September 30, 2009. These financial statements are the
responsibility of the Company’s management. Our responsibility is to
express an opinion on these financial statements based on our
audits.
We
conducted our audits in accordance with the standards of the Public Company
Accounting Oversight Board (United States). Those standards require
that we plan and perform the audit to obtain reasonable assurance about whether
the financial statements are free of material misstatement. The
Company is not required to have, nor were we engaged to perform an audit of its
internal control over financial reporting. Our audit included consideration of
internal control over financial reporting as a basis for designing audit
procedures that are appropriate in the circumstances, but not for the purpose of
expressing an opinion on the effectiveness of the Company’s internal control
over financial reporting. Accordingly, we express no such opinion. An audit also
includes examining, on a test basis, evidence supporting the amounts and
disclosures in the financial statements, assessing the accounting principles
used and significant estimates made by management, as well as evaluating the
overall financial statement presentation. We believe that our audits provide a
reasonable basis for our opinion.
In our
opinion, the consolidated financial statements referred to above present fairly,
in all material respects, the financial position of Key Technology, Inc. as of
September 30, 2009 and 2008, and the results of its operations and its
cash flows for each of the three years in the period ended
September 30, 2009 in conformity with accounting principles generally
accepted in the United States of America.
/s/ GRANT
THORNTON LLP
Seattle,
Washington
December
11, 2009
|
KEY
TECHNOLOGY, INC. AND SUBSIDIARIES
|
||||||||
|
CONSOLIDATED
BALANCE SHEETS
|
||||||||
|
SEPTEMBER
30, 2009 AND 2008
|
||||||||
|
(In
thousands)
|
||||||||
|
2009
|
2008
|
|||||||
|
ASSETS
|
||||||||
|
CURRENT
ASSETS:
|
||||||||
|
Cash
and cash equivalents
|
$ | 18,142 | $ | 36,322 | ||||
|
Trade
accounts receivable, net of allowance for doubtful accounts of $481 and
$308, respectively
|
12,332 | 13,577 | ||||||
|
Inventories
|
22,433 | 21,915 | ||||||
|
Deferred
income taxes
|
3,464 | 2,340 | ||||||
|
Prepaid
expenses and other assets
|
3,179 | 1,873 | ||||||
|
Total
current assets
|
59,550 | 76,027 | ||||||
|
PROPERTY,
PLANT AND EQUIPMENT, Net
|
16,175 | 8,705 | ||||||
|
DEFERRED
INCOME TAXES
|
38 | 101 | ||||||
|
INTANGIBLES,
Net
|
996 | 2,266 | ||||||
|
INVESTMENT
IN PRODITEC
|
1,272 | - | ||||||
|
GOODWILL,
Net
|
2,524 | 2,524 | ||||||
|
OTHER
ASSETS
|
160 | 2 | ||||||
|
TOTAL
|
$ | 80,715 | $ | 89,625 | ||||
|
See
notes to consolidated financial statements.
|
(Continued)
|
|||||||
35
|
KEY
TECHNOLOGY, INC. AND SUBSIDIARIES
|
||||||||
|
CONSOLIDATED
BALANCE SHEETS
|
||||||||
|
SEPTEMBER
30, 2009 AND 2008
|
||||||||
|
(In
thousands, except shares)
|
||||||||
|
2009
|
2008
|
|||||||
|
LIABILITIES
AND SHAREHOLDERS’ EQUITY
|
||||||||
|
CURRENT
LIABILITIES:
|
||||||||
|
Accounts
payable
|
$ | 4,641 | $ | 7,556 | ||||
|
Accrued
payroll liabilities and commissions
|
5,209 | 7,558 | ||||||
|
Customers’
deposits
|
7,801 | 8,035 | ||||||
|
Accrued
customer support and warranty costs
|
2,559 | 2,545 | ||||||
|
Income
tax payable
|
25 | 417 | ||||||
|
Current
portion of long-term debt
|
319 | - | ||||||
|
Customer
purchase plans
|
925 | 1,443 | ||||||
|
Other
accrued liabilities
|
1,038 | 942 | ||||||
|
Total
current liabilities
|
22,517 | 28,496 | ||||||
|
LONG-TERM
DEBT
|
5,876 | - | ||||||
|
DEFERRED
INCOME TAXES
|
588 | - | ||||||
|
LONG-TERM
DEFERRED RENT
|
- | 605 | ||||||
|
OTHER
LONG TERM LIABILITIES
|
277 | 156 | ||||||
|
COMMITMENTS
AND CONTINGENCIES
|
- | - | ||||||
|
SHAREHOLDERS’
EQUITY:
|
||||||||
|
Preferred
stock-no par value; 5,000,000 shares authorized; none issued
and outstanding
|
- | - | ||||||
|
Common
stock-no par value; 45,000,000 shares authorized; 4,998,834 and 5,629,566
issued and outstanding at September 30, 2009 and 2008,
respectively
|
18,378 | 19,489 | ||||||
|
Retained
earnings
|
32,539 | 40,381 | ||||||
|
Accumulated
other comprehensive income
|
540 | 498 | ||||||
|
Total
shareholders’ equity
|
51,457 | 60,368 | ||||||
|
TOTAL
|
$ | 80,715 | $ | 89,625 | ||||
|
See
notes to consolidated financial statements.
|
(Concluded)
|
|||||||
|
KEY
TECHNOLOGY, INC. AND SUBSIDIARIES
|
||||||||||||
|
CONSOLIDATED
STATEMENTS OF OPERATIONS
|
||||||||||||
|
THREE
YEARS ENDED SEPTEMBER 30, 2009
|
||||||||||||
|
(In
thousands, except per share data)
|
||||||||||||
|
2009
|
2008
|
2007
|
||||||||||
|
NET
SALES
|
$ | 105,450 | $ | 134,086 | $ | 107,540 | ||||||
|
COST
OF SALES
|
66,427 | 80,893 | 66,099 | |||||||||
|
Gross
profit
|
39,023 | 53,193 | 41,441 | |||||||||
|
OPERATING
EXPENSES:
|
||||||||||||
|
Sales
and marketing
|
18,090 | 21,373 | 17,191 | |||||||||
|
Research
and development
|
8,681 | 8,744 | 5,520 | |||||||||
|
General
and administrative
|
11,568 | 11,528 | 8,821 | |||||||||
|
Amortization
of intangibles
|
1,270 | 1,307 | 1,307 | |||||||||
|
Total
operating expenses
|
39,609 | 42,952 | 32,839 | |||||||||
|
GAIN
(LOSS) ON DISPOSITION OF ASSETS
|
(352 | ) | 81 | 23 | ||||||||
|
INCOME
(LOSS) FROM OPERATIONS
|
(938 | ) | 10,322 | 8,625 | ||||||||
|
OTHER
INCOME (EXPENSE):
|
||||||||||||
|
Royalty
income
|
20 | 38 | 31 | |||||||||
|
Interest
income
|
224 | 735 | 726 | |||||||||
|
Interest
expense
|
(150 | ) | (8 | ) | (12 | ) | ||||||
|
Gain
on sale of joint venture
|
275 | - | 750 | |||||||||
|
Impairment
charge on investment in Proditec
|
(219 | ) | - | - | ||||||||
|
Foreign
exchange gain (loss)
|
(362 | ) | (157 | ) | 570 | |||||||
|
Other,
net
|
(219 | ) | 58 | (104 | ) | |||||||
|
Total
other income (expense)—net
|
(431 | ) | 666 | 1,961 | ||||||||
|
Earnings
(loss) before income taxes
|
(1,369 | ) | 10,988 | 10,586 | ||||||||
|
Income
tax expense (benefit)
|
(878 | ) | 3,515 | 3,176 | ||||||||
|
Net
earnings (loss)
|
$ | (491 | ) | $ | 7,473 | $ | 7,410 | |||||
|
EARNINGS
(LOSS) PER SHARE—Basic
|
$ | (0.10 | ) | $ | 1.38 | $ | 1.41 | |||||
|
EARNINGS
(LOSS) PER SHARE—Diluted
|
$ | (0.10 | ) | $ | 1.35 | $ | 1.37 | |||||
|
SHARES
USED IN PER SHARE CALCULATION—Basic
|
4,958 | 5,430 | 5,265 | |||||||||
|
SHARES
USED IN PER SHARE CALCULATION—Diluted
|
4,958 | 5,517 | 5,407 | |||||||||
|
See
notes to consolidated financial statements.
|
||||||||||||
|
KEY
TECHNOLOGY, INC. AND SUBSIDIARIES
|
||||||||||||||||||||
|
CONSOLIDATED
STATEMENTS OF SHAREHOLDERS’ EQUITY
|
||||||||||||||||||||
|
THREE
YEARS ENDED SEPTEMBER 30, 2009
|
||||||||||||||||||||
|
(Dollars
in thousands)
|
||||||||||||||||||||
|
Common
Stock
|
||||||||||||||||||||
|
Shares
|
Amount
|
Retained
Earnings
|
Accumulated
Other Comprehensive Income (Loss)
|
Total
|
||||||||||||||||
|
Balance
at September 30, 2006
|
5,385,688 | $ | 14,698 | $ | 26,311 | $ | 243 | $ | 41,252 | |||||||||||
|
Components
of comprehensive income:
|
||||||||||||||||||||
|
Net
earnings
|
- | - | 7,410 | - | 7,410 | |||||||||||||||
|
Comprehensive
income—foreign currency translation adjustment, net of tax of
$228
|
- | - | - | 443 | 443 | |||||||||||||||
|
Less:
Reclassification to net earnings (net of tax benefit of
$29)
|
- | - | - | (57 | ) | (57 | ) | |||||||||||||
|
Total
comprehensive income
|
7,796 | |||||||||||||||||||
|
Tax
benefits from share-based payments
|
- | 58 | - | - | 58 | |||||||||||||||
|
Share
based payments
|
- | 1,031 | - | - | 1,031 | |||||||||||||||
|
Issuance
of stock upon exercise of stock options
|
174,184 | 1,495 | - | - | 1,495 | |||||||||||||||
|
Issuance
of stock for Employee Stock Purchase Plan
|
4,176 | 64 | - | - | 64 | |||||||||||||||
|
Stock
buyback
|
(88,252 | ) | (241 | ) | (1,062 | ) | - | (1,303 | ) | |||||||||||
|
Stock
grants - employment-based
|
70,736 | - | - | - | - | |||||||||||||||
|
Stock
forfeitures and retirements
|
(37,874 | ) | - | - | - | |||||||||||||||
|
Balance
at September 30, 2007
|
5,508,658 | $ | 17,105 | $ | 32,659 | $ | 629 | $ | 50,393 | |||||||||||
|
Cumulative
effect of adoption of new accounting principle
|
- | - | 249 | - | 249 | |||||||||||||||
|
Components
of comprehensive income:
|
||||||||||||||||||||
|
Net
earnings
|
- | - | 7,473 | - | 7,473 | |||||||||||||||
|
Comprehensive
income—foreign currency translation adjustment, net of tax benefit of
$67
|
- | - | - | (131 | ) | (131 | ) | |||||||||||||
|
Total
comprehensive income
|
7,342 | |||||||||||||||||||
|
Tax
benefits from share-based payments
|
- | 999 | - | - | 999 | |||||||||||||||
|
Share
based payments
|
- | 1,491 | - | - | 1,491 | |||||||||||||||
|
Issuance
of stock upon exercise of stock options
|
56,238 | 595 | - | - | 595 | |||||||||||||||
|
Issuance
of stock for Employee Stock Purchase Plan
|
3,757 | 92 | - | - | 92 | |||||||||||||||
|
Stock
grants - performance-based
|
26,603 | - | - | - | - | |||||||||||||||
|
Stock
grants - employment-based
|
65,238 | - | - | - | - | |||||||||||||||
|
Restricted
stock surrendered in payment of taxes
|
(23,834 | ) | (793 | ) | - | - | (793 | ) | ||||||||||||
|
Stock
forfeitures and retirements
|
(7,094 | ) | - | - | - | - | ||||||||||||||
|
Balance
at September 30, 2008
|
5,629,566 | $ | 19,489 | $ | 40,381 | $ | 498 | $ | 60,368 | |||||||||||
|
Components
of comprehensive income (loss):
|
||||||||||||||||||||
|
Net
loss
|
- | - | (491 | ) | - | (491 | ) | |||||||||||||
|
Comprehensive
income—foreign currency translation adjustment, net of tax benefit of
$13
|
- | - | - | (24 | ) | (24 | ) | |||||||||||||
|
Unrealized
changes in value of derivatives, net of tax expense of $34
|
66 | 66 | ||||||||||||||||||
|
Total
comprehensive income (loss)
|
(449 | ) | ||||||||||||||||||
|
Tax
benefits from share-based payments
|
- | 528 | - | - | 528 | |||||||||||||||
|
Share
based payments
|
- | 906 | - | - | 906 | |||||||||||||||
|
Issuance
of stock upon exercise of stock options
|
11,769 | 41 | - | - | 41 | |||||||||||||||
|
Issuance
of stock for Employee Stock Purchase Plan
|
10,900 | 104 | - | - | 104 | |||||||||||||||
|
Stock
buyback
|
(671,250 | ) | (2,618 | ) | (7,351 | ) | (9,969 | ) | ||||||||||||
|
Stock
grants - performance-based
|
55,831 | - | - | - | - | |||||||||||||||
|
Stock
grants - employment-based
|
10,801 | - | - | - | - | |||||||||||||||
|
Restricted
stock surrendered in payment of taxes
|
(5,495 | ) | (72 | ) | - | - | (72 | ) | ||||||||||||
|
Stock
forfeitures and retirements
|
(43,288 | ) | - | - | - | - | ||||||||||||||
|
Balance
at September 30, 2009
|
4,998,834 | $ | 18,378 | $ | 32,539 | $ | 540 | $ | 51,457 | |||||||||||
See notes to consolidated
financial statements.
|
KEY
TECHNOLOGY, INC. AND SUBSIDIARIES
|
||||||||||||
|
CONSOLIDATED
STATEMENTS OF CASH FLOWS
|
||||||||||||
|
THREE
YEARS ENDED SEPTEMBER 30, 2009
|
||||||||||||
|
(In
thousands)
|
||||||||||||
|
2009
|
2008
|
2007
|
||||||||||
|
CASH
FLOWS FROM OPERATING ACTIVITIES:
|
||||||||||||
|
Net
earnings (loss)
|
$ | (491 | ) | $ | 7,473 | $ | 7,410 | |||||
|
Adjustments
to reconcile net earnings (loss) to net cash
|
||||||||||||
|
provided
by operating activities:
|
||||||||||||
|
Gain
on sale of investment in joint venture
|
(275 | ) | - | (750 | ) | |||||||
|
Impairment
charge for investment in Proditec
|
219 | - | - | |||||||||
|
(Gain)
loss on disposition of assets
|
352 | (81 | ) | (23 | ) | |||||||
|
Foreign
currency exchange (gain) loss
|
362 | 157 | (570 | ) | ||||||||
|
Depreciation
and amortization
|
3,108 | 2,771 | 2,596 | |||||||||
|
Share
based payments
|
907 | 1,540 | 987 | |||||||||
|
Excess
tax benefit from share based payments
|
(528 | ) | (999 | ) | (320 | ) | ||||||
|
Deferred
income taxes
|
(478 | ) | (549 | ) | 721 | |||||||
|
Deferred
rent
|
(19 | ) | 4 | (57 | ) | |||||||
|
Bad
debt expense
|
196 | 116 | 16 | |||||||||
|
Changes
in assets and liabilities:
|
||||||||||||
|
Trade
accounts receivable
|
802 | 190 | (3,283 | ) | ||||||||
|
Inventories
|
(515 | ) | (3,279 | ) | (1,929 | ) | ||||||
|
Prepaid
expenses and other current assets
|
134 | 14 | 129 | |||||||||
|
Income
taxes receivable
|
(1,156 | ) | 74 | 225 | ||||||||
|
Accounts
payable
|
(2,883 | ) | 1,869 | 1,592 | ||||||||
|
Accrued
payroll liabilities and commissions
|
(2,431 | ) | 875 | 2,106 | ||||||||
|
Accrued
customer support and warranty costs
|
21 | 642 | 733 | |||||||||
|
Income
taxes payable
|
221 | 1,262 | 194 | |||||||||
|
Other
accrued liabilities
|
(536 | ) | 886 | 247 | ||||||||
|
Customers’
deposits
|
(376 | ) | 145 | 2,348 | ||||||||
|
Other
|
(51 | ) | 28 | - | ||||||||
|
Cash
provided by (used for) operating activities
|
(3,417 | ) | 13,138 | 12,372 | ||||||||
|
CASH
FLOWS FROM INVESTING ACTIVITIES:
|
||||||||||||
|
Proceeds
from sale of property
|
1,429 | 96 | 64 | |||||||||
|
Purchases
of property, plant, and equipment
|
(11,462 | ) | (5,509 | ) | (1,563 | ) | ||||||
|
Investment
in Proditec
|
(1,491 | ) | - | - | ||||||||
|
Sale
of investment in joint venture
|
- | - | 750 | |||||||||
|
Cash
used in investing activities
|
(11,524 | ) | (5,413 | ) | (749 | ) | ||||||
|
See
notes to consolidated financial statements.
|
(Continued)
|
|||||||||||
|
KEY
TECHNOLOGY, INC. AND SUBSIDIARIES
|
||||||||||||
|
CONSOLIDATED
STATEMENTS OF CASH FLOWS
|
||||||||||||
|
THREE
YEARS ENDED SEPTEMBER 30, 2009
|
||||||||||||
|
(In
thousands)
|
||||||||||||
|
|
||||||||||||
|
2009
|
2008
|
2007
|
||||||||||
|
CASH
FLOWS FROM FINANCING ACTIVITIES:
|
||||||||||||
|
Proceeds
from issuance of long-term debt
|
$ | 6,400 | $ | - | $ | - | ||||||
|
Payments
on long-term debt
|
(205 | ) | - | (1 | ) | |||||||
|
Proceeds
from issuance of common stock
|
145 | 687 | 1,559 | |||||||||
|
Stock
buyback
|
(9,969 | ) | - | (1,303 | ) | |||||||
|
Excess
tax benefits from share based payments
|
528 | 999 | 320 | |||||||||
|
Exchange
of shares for statutory withholding
|
(118 | ) | (748 | ) | - | |||||||
|
Cash
provided by (used in) financing activities
|
(3,219 | ) | 938 | 575 | ||||||||
|
EFFECT
OF EXCHANGE RATE CHANGES ON CASH
|
(20 | ) | (221 | ) | 436 | |||||||
|
NET
INCREASE (DECREASE) IN CASH AND CASH EQUIVALENTS
|
(18,180 | ) | 8,442 | 12,634 | ||||||||
|
CASH
AND CASH EQUIVALENTS, BEGINNING OF YEAR
|
36,322 | 27,880 | 15,246 | |||||||||
|
CASH
AND CASH EQUIVALENTS, END OF YEAR
|
$ | 18,142 | $ | 36,322 | $ | 27,880 | ||||||
|
SUPPLEMENTAL
DISCLOSURES OF CASH FLOW
|
||||||||||||
|
INFORMATION:
|
||||||||||||
|
Cash
paid during the year for interest
|
$ | 197 | $ | 3 | $ | 12 | ||||||
|
Cash
paid during the year for income taxes
|
502 | 2,702 | 2,018 | |||||||||
|
Exchange
of shares for statutory withholding
|
- | 45 | - | |||||||||
|
See
notes to consolidated financial statements.
|
(Concluded)
|
|||||||||||
KEY
TECHNOLOGY, INC. AND SUBSIDIARIES
NOTES
TO CONSOLIDATED FINANCIAL STATEMENTS
THREE
YEARS ENDED SEPTEMBER 30, 2009
|
1.
|
THE COMPANY AND SUMMARY OF SIGNIFICANT ACCOUNTING
POLICIES
|
Key
Technology, Inc. and its wholly-owned subsidiaries (the “Company”) design,
manufacture, and sell process automation systems, integrating electro-optical
inspection and sorting, specialized conveying and product preparation
equipment. The consolidated financial statements include the accounts
of Key Technology, Inc. and its wholly-owned subsidiaries: Key
Technology Holdings USA LLC; Productos Key Mexicana S. de R. L. de C.V.; Key
Technology (Shanghai) Trading Co. Ltd.; Key Technology Asia-Pacific Pte. Ltd.;
and Key Technology Australia Pty Ltd. Suplusco Holding B.V. is a
wholly-owned European subsidiary of Key Technology Holdings USA LLC that
includes the accounts of Key Technology B.V. All significant
intercompany accounts and transactions have been eliminated.
Revenue
Recognition—The Company recognizes revenue when persuasive evidence of an
arrangement exists, delivery has occurred or services have been provided, the
sale price is fixed or determinable, and collectability is reasonably
assured. Additionally, the Company sells its goods on terms which
transfer title and risk of loss at a specified location, typically shipping
point, port of loading or port of discharge, depending on the final destination
of the goods. Accordingly, revenue recognition from product sales
occurs when all factors are met, including transfer of title and risk of loss,
which occurs either upon shipment by the Company or upon receipt by customers at
the location specified in the terms of sale. Sales of system upgrades
are recognized as revenue upon completion of the conversion of the customer’s
existing system when this conversion occurs at the customer
site. Revenue earned from services (maintenance, installation
support, and repairs) is recognized ratably over the contractual period or as
the services are performed. If any contract provides for both
equipment and services (multiple deliverables), the sales price is allocated to
the various elements based on objective evidence of fair value. Each
element is then evaluated for revenue recognition based on the previously
described criteria. The Company’s sales arrangements provide for no
other significant post-shipment obligations. If all conditions of
revenue recognition are not met, the Company defers revenue
recognition. In the event of revenue deferral, the sale value is not
recorded as revenue to the Company, accounts receivable are reduced by any
related amounts owed by the customer, and the cost of the goods or services
deferred is carried in inventory. In addition, the Company
periodically evaluates whether an allowance for sales returns is
necessary. Historically, the Company has experienced few sales
returns. If the Company believes there are potential sales returns,
the Company would provide any necessary provision against sales. The
Company accounts for cash consideration (such as sales incentives) that are
given to customers or resellers as a reduction of revenue rather than as an
operating expense unless an identified benefit is received for which fair value
can be reasonably estimated. Upon receipt of an order, the Company
generally receives a deposit which is recorded as customers’
deposits. The Company makes periodic evaluations of the
creditworthiness of its customers and generally does not require
collateral. An allowance for credit losses is provided based upon
historical experience and anticipated losses. The Company records
revenues net of any taxes, such as sales tax, which are passed through to the
customer.
Cash and
Cash
Equivalents—The Company considers all highly liquid investments with
original maturities of 90 days or less at date of acquisition to be cash
equivalents. Accounts at each institution regularly exceed Federal
Deposit Insurance Corporation insurance coverage. The Company has not
experienced any losses in such accounts and believes it is not exposed to
significant credit risk on cash and cash equivalents.
Inventories
are stated at the lower of cost (first-in, first-out method) or
market.
Property, Plant
and Equipment are recorded at cost and depreciated over estimated useful
lives on the straight-line basis, and depreciation commences at the time assets
are placed in service. Leasehold improvements are amortized over the
lesser of useful life or the term of the applicable lease using the
straight-line method. The range of useful lives for fixed assets is
as follows:
|
Years
|
|
|
Buildings
and improvements
|
7
to 40
|
|
Manufacturing
equipment
|
3
to 10
|
|
Office
equipment, furniture and fixtures
|
3
to 7
|
|
Computer
equipment and software
|
3
to 7
|
Goodwill and
Other Intangibles—Goodwill is not amortized, but an assessment of
potential goodwill impairment is performed by the Company on an annual basis in
its fourth fiscal quarter, or sooner, if necessary. The Company’s
annual assessment determined that there has been no impairment of
goodwill.
Other
intangibles, which consist of patents, developed technologies, trademarks and
trade names, and customer related intangible assets, are amortized over the
estimated useful lives of the related assets, which are 10 years for the
majority of the assets. Management periodically evaluates the
recoverability of other intangibles based upon current and anticipated results
of operations and undiscounted future cash flows. Amortization of
other intangibles was $1,270,000, $1,307,000 and $1,307,000 for the years ended
September 30, 2009, 2008, and 2007, respectively (see
Note 2).
Accrued
Customer Support and
Warranty Costs—The Company provides customer support services consisting
of start-up assistance and evaluation and training to its
customers. The Company also provides a warranty on its products
ranging from ninety days to five years following the date of
shipment. Management establishes allowances for customer support and
warranty costs based upon the types of products shipped, customer support and
product warranty experience. The provision of customer support and
warranty costs is charged to cost of sales at the point of sale, and it is
periodically assessed for adequacy based on changes in these
factors.
A
reconciliation of the changes in the Company’s allowances for warranties is as
follows (in thousands):
|
2009
|
2008
|
|||||||
|
Beginning
balance
|
$ | 1,704 | $ | 1,433 | ||||
|
Warranty
costs incurred
|
(3,982 | ) | (2,660 | ) | ||||
|
Warranty
expense accrued
|
4,388 | 2,929 | ||||||
|
Translation
adjustments
|
12 | 2 | ||||||
|
Ending
balance
|
$ | 2,122 | $ | 1,704 | ||||
Deferred Income
Taxes—Deferred income taxes are provided for the effects of temporary
differences arising from differences in the reporting of revenues and expenses
for financial statement and for income tax purposes under the asset and
liability method using currently enacted tax rates.
Research and
Development—Expenditures for research and development are expensed when
incurred.
Foreign Currency
Translation—Assets and liabilities denominated in a foreign currency are
translated to U.S. dollars at the exchange rate on the balance sheet
date. Translation adjustments are shown as part of accumulated other
comprehensive income (loss). Revenues, costs, and expenses are
translated using an average rate. Realized and unrealized foreign
currency transaction gains and losses are included in the consolidated statement
of operations.
Impairment of
Long-Lived Assets—The Company regularly reviews
all of its long-lived assets, including property, plant and equipment, and
amortizable intangible assets, for impairment whenever events or changes in
circumstances indicate that the carrying value may not be
recoverable. If the total of future undiscounted cash flows is less
than the carrying amount of these assets, an impairment loss, if any, based on
the excess of the carrying amount over the fair value of the assets, is
recorded. In addition, goodwill is reviewed based on its implied fair
value at least annually.
Estimates—The
preparation of financial statements in conformity with accounting principles
generally accepted in the United States of America requires management to make
estimates and assumptions that affect
the
reported amounts of assets and liabilities and disclosure of contingent assets
and liabilities at the date of the financial statements and reported amounts of
revenues and expenses during the reporting period. Actual results
could differ from those estimates.
Subsequent
Events—The Company has evaluated subsequent events through December 11,
2009, the date the financial statements were issued.
Termination
Costs—During fiscal 2009, the Company announced workforce
reductions. As a result, the Company expects to incur approximately
$1.7 million in costs related to the reduction in force. Of this
amount, approximately $1.6 million relates to one-time termination benefits and
$100,000 is for employee relocation costs and other related
costs. Approximately $1.4 million and $300,000 of these costs were
expensed as operating expenses and cost of goods sold, respectively, in fiscal
2009. At September 30, 2009, approximately $1.0 million remained
accrued as liabilities for amounts expensed in fiscal 2009 that were not paid as
of September 30, 2009. The Company expects that approximately
one-half of these amounts will be paid in the first quarter of fiscal 2010 and
the remainder will be paid at later dates.
Financial
Instruments—The carrying value of the Company’s cash and cash
equivalents, accounts and notes receivable, accounts payable, accrued payroll
liabilities and commissions, accrued customer support and warranty costs, and
other accrued liabilities approximates their estimated fair values due to the
short maturities of those instruments.
Derivative
Financial Instruments—The Company recognizes all derivatives on the
balance sheet at fair value. The Company enters into such instruments
only with financial institutions of good standing, and the total credit exposure
related to non-performance by those institutions is not material to the
operations of the Company.
Capitalized
Interest—In fiscal 2009, the Company incurred $222,000 of interest
expense of which $72,000 was capitalized to Property, Plant and Equipment
related to self-constructed assets for the Company’s use.
Earnings Per
Share—Basic earnings (loss) per share (“EPS”) is computed by dividing net
earnings (loss) available to common shareholders by the weighted average number
of shares outstanding for the period. Diluted EPS is computed by
dividing net earnings (loss) available to common shareholders by the weighted
average common stock and common stock equivalent shares outstanding during each
period using the treasury stock method for employee stock option plans and
service-based stock awards. The calculation of the basic and diluted
EPS from continuing operations is as follows (in thousands except per share
data):
|
For
the year ended September 30, 2009
|
||||||||||||
|
Earnings
|
Shares
|
Per-Share
Amount
|
||||||||||
|
Basic
EPS:
|
||||||||||||
|
Net
earnings (loss) available to common shareholders
|
$ | (491 | ) | 4,958 | $ | (0.10 | ) | |||||
|
Effect
of dilutive securities:
|
||||||||||||
|
Common
stock options
|
- | |||||||||||
|
Common
stock awards
|
- | |||||||||||
|
Diluted
EPS:
|
||||||||||||
|
Net
earnings (loss) available to common shareholders plus assumed
conversions
|
$ | (491 | ) | 4,958 | $ | (0.10 | ) | |||||
|
For
the year ended September 30, 2008
|
||||||||||||
|
Earnings
|
Shares
|
Per-Share
Amount
|
||||||||||
|
Basic
EPS:
|
||||||||||||
|
Net
earnings available to common shareholders
|
$ | 7,473 | 5,430 | $ | 1.38 | |||||||
|
Effect
of dilutive securities:
|
||||||||||||
|
Common
stock options
|
- | 51 | ||||||||||
|
Common
stock awards
|
- | 36 | ||||||||||
|
Diluted
EPS:
|
||||||||||||
|
Net
earnings available to common shareholders plus assumed
conversions
|
$ | 7,473 | 5,517 | $ | 1.35 | |||||||
|
For
the year ended September 30, 2007
|
||||||||||||
|
Earnings
|
Shares
|
Per-Share
Amount
|
||||||||||
|
Basic
EPS:
|
||||||||||||
|
Net
earnings available to common shareholders
|
$ | 7,410 | 5,265 | $ | 1.41 | |||||||
|
Effect
of dilutive securities:
|
||||||||||||
|
Common
stock options
|
- | 97 | ||||||||||
|
Common
stock awards
|
- | 45 | ||||||||||
|
Diluted
EPS:
|
||||||||||||
|
Net
earnings available to common shareholders plus assumed
conversions
|
$ | 7,410 | 5,407 | $ | 1.37 | |||||||
The
weighted average number of diluted shares does not include potential common
shares which are anti-dilutive, nor does it include performance-based restricted
stock awards if the performance measurement has not been met. The
following potential common shares were not included in the calculation of
diluted EPS as they were anti-dilutive:
|
For
the year ended September 30,
|
||||||||||||
|
2009
|
2008
|
2007
|
||||||||||
|
Common
shares from:
|
||||||||||||
|
Assumed
exercise of stock options
|
55,000 | - | - | |||||||||
|
Assumed
exercise of:
|
||||||||||||
|
- employment
based stock grants
|
121,170 | 2,650 | - | |||||||||
|
- performance
based stock grants
|
21,103 | 24,607 | - | |||||||||
The
options expire on dates beginning in February 2010 through February
2015. The restrictions on stock grants may lapse between October 2009
and December 2011.
Comprehensive
Income (loss)—Comprehensive income (loss) includes foreign currency
translation adjustments resulting from the translation of assets and liabilities
of foreign subsidiaries and unrealized gains and losses related to changes in
value of an interest rate swap agreement, a derivative instrument designated as
a cash flow hedge.
The
components of accumulated comprehensive income (loss) were as follows (in
thousands):
|
For
the year ended September 30,
|
||||||||||||
|
2009
|
2008
|
2007
|
||||||||||
|
Foreign
currency translation adjustments
|
$ | 474 | $ | 498 | $ | 629 | ||||||
|
Net
unrealized changes in value of derivatives
|
66 | - | - | |||||||||
| $ | 540 | $ | 498 | $ | 629 | |||||||
Share-Based
Compensation—The Company measures the cost of share-based payments based
on the grant-date fair value of the award. The cost is recognized as
expense over the requisite service period required in exchange for the
award. No compensation cost is recognized for awards where the
requisite service period is not completed.
Accounting for
Income Taxes—The Company adopted the updated authoritative provisions
related to accounting for uncertainty in income taxes on October 1,
2007. As required by these provisions, the Company recognizes the
financial statement benefit of a tax position only after determining that the
relevant tax authority would more likely than not sustain the position following
an audit. For tax positions meeting the more-likely-than-not threshold, the
amount recognized in the financial statements is the largest benefit that has a
greater than 50 percent likelihood of being realized upon ultimate settlement
with the relevant tax authority. At the adoption date, the Company applied these
provisions to all tax positions for which the statute of limitations remained
open. As a result of the adoption of these accounting principles, the
Company recognized a decrease of approximately $250,000 in the liability for
unrecognized tax benefits, which was accounted for as an increase to the October
1, 2007 balance of retained earnings.
Recently Adopted
Accounting Pronouncements—The Financial Accounting Standards Board’s
(“FASB”) Accounting Standard Codification (“ASC”) became effective during the
fourth quarter of 2009. This codification brings all authoritative generally
accepted accounting principles (“GAAP”) that have been issued by a standard
setter into one place. The codification retains existing GAAP without
changing it.
In fiscal
2009, accounting standard updates to ASC topic 820, “Fair Value Measurements and
Disclosures” (“ASC 820”) became effective for the Company. ASC 820
defines fair value, establishes a framework and gives guidance regarding the
methods used for measuring fair value and expands disclosures about fair value
measurements. This topic does not require any new fair value
measurements, but provides guidance on how to measure fair value by providing a
fair value hierarchy used to classify the source of the
information. ASC 820 also gives entities the option to measure
eligible financial assets and financial liabilities at fair value on an
instrument by instrument basis, that are otherwise not permitted to be accounted
for at fair value under other accounting guidance. The election to
use the fair value option is available when an entity first recognizes a
financial asset or financial liability. Subsequent changes in fair value must be
recorded in earnings. The Company adopted these updates to ASC 820
for financial assets and liabilities in fiscal 2009 and did not elect the fair
value option. Adoption of ASC 820 had no material effect on the
Company’s financial statements.
In fiscal
2009, accounting standard updates to ASC topic 815, “Derivatives and Hedging”
(“ASC 815”) became effective for the Company which required enhanced disclosure
requirements regarding derivative instruments and hedging
activities. The Company adopted these updates to ASC 815 in fiscal
2009. The adoption of the updates did not have an effect on the
Company’s financial statements as it only required additional
disclosure.
In fiscal
2009, accounting standard updates to ASC topic 855, “Subsequent Events” (“ASC
855”) became effective for the Company. ASC 855 establishes general
standards of accounting for and disclosure of events that occur after the
balance sheet date but before financial statements are issued or are available
to be issued. The Company adopted ASC 855 in fiscal
2009. The adoption of ASC 855 did not have an effect on the Company’s
financial statements as it only required additional disclosures.
Recent Accounting
Pronouncements Not Yet Adopted—In February 2008, the Financial Accounting
Standards Board (“FASB”) delayed the effective date of fair value measurements
for one year for certain nonfinancial assets and nonfinancial liabilities,
excluding those that are recognized or disclosed in financial
statements
at fair value on a recurring basis (that is, at least annually). For
purposes of applying these provisions, nonfinancial assets and nonfinancial
liabilities include all assets and liabilities other than those meeting the
definition of a financial asset or a financial liability. These
provisions became effective for fiscal years beginning after November 15, 2008,
and interim periods within those fiscal years. The Company currently
does not believe the adoption of these provisions will have a significant effect
on its financial statements.
In June
2008, the FASB issued update pronouncements related to determining whether
instruments granted in share-based payment transactions are participating
securities. These updated pronouncements provide that unvested
share-based payment awards that contain nonforfeitable rights to dividends
(whether paid or unpaid) are participating securities and shall be included in
the computation of earnings per share (EPS) under the two-class
method. This pronouncement is effective for financial statements
issued for fiscal years beginning after December 15, 2008. All prior
period EPS data will be required to be adjusted to conform to the provisions of
this pronouncement and early application is prohibited. The Company
does have participating securities as described under this pronouncement and
believes that the adoption of these provisions will not have a material impact
on its EPS calculations.
In
December 2007, FASB issued updated pronouncements related to accounting for
collaborative arrangements. The guidance defines collaborative
arrangements and establishes presentation and disclosure requirements for
transactions within a collaborative arrangement (both with third parties and
between participants in the arrangement). These updated
pronouncements are effective for fiscal years, and interim periods within those
fiscal years, beginning after December 15, 2008. These provisions
require retrospective application to all collaborative arrangements existing as
of the effective date, unless retrospective application is
impracticable. The impracticability evaluation and exception should
be performed on an arrangement-by-arrangement basis. The Company
currently does not believe that the adoption of these provisions will have a
significant effect on its financial statements.
In
December 2007, the FASB issued updated pronouncements related to business
combinations and noncontrolling interests in consolidated financial
statements. These pronouncements require the acquiring entity in a
business combination to recognize the assets acquired and liabilities assumed at
fair value on the date of acquisition. Further, these pronouncements also change
the accounting for acquired in-process research and development assets,
contingent consideration, partial acquisitions and transaction
costs. Under the new pronouncements, all entities are required to
report noncontrolling (minority) interests in subsidiaries as equity in the
consolidated financial statements. In addition, transactions between an entity
and noncontrolling interests will be treated as equity
transactions. These pronouncements will become effective for fiscal
years beginning after December 15, 2008 and early adoption is
prohibited. The Company does not expect the adoption of these
pronouncements to have a significant effect on its financial statements but they
will affect the Company for any acquisitions made subsequent to the end of
fiscal 2009.
In
September 2009, the FASB issued Accounting Standard Update (“ASU”) 2009-13,
“Revenue Arrangements with Multiple Deliverables” and ASU 2009-14, “Certain
Revenue Arrangements That Include Software.” These ASU’s revise and
clarify accounting for arrangements with multiple deliverables, including how to
separate deliverables into units of accounting determining the allocation of
revenue to the units of accounting and the application of these provisions to
tangible products containing software components. There are also
expanded disclosures for significant judgments made in the application of these
standards, if material. These pronouncements are effective for fiscal
years beginning after June 15, 2010 and earlier application is
permitted. The Company does not expect that adoption of these
pronouncements to have a significant effect on its financial
statements.
2.
GOODWILL AND OTHER INTANGIBLE ASSETS
As of
September 30, 2009, the Company had the following intangible assets (in
thousands):
|
Cost
|
Net
Book Value
|
|||||||
|
Patents
and developed technologies
|
$ | 11,085 | $ | 801 | ||||
|
Purchased
trademarks and trade names
|
1,700 | 127 | ||||||
|
Customer
related intangibles
|
900 | 68 | ||||||
| $ | 13,685 | $ | 996 | |||||
The
significant majority of these assets are being amortized over 10
years. Amortization expense for the next five fiscal years is
expected to be approximately:
|
Year
Ended September 30,
|
(In
thousands)
|
|||
|
2010
|
$ | 930 | ||
|
2011
|
15 | |||
|
2012
|
15 | |||
|
2013
|
15 | |||
|
2014
|
15 | |||
|
Thereafter
|
6 | |||
|
Total
|
$ | 996 | ||
As of
September 30, 2009, the Company had $2.5 million of goodwill which is
not being amortized. There was no change to goodwill during the
fiscal years ended September 30, 2009 and 2008.
|
3.
|
TRADE ACCOUNTS RECEIVABLE
|
Trade
accounts receivable consist of the following (in thousands):
|
September
30,
|
||||||||
|
2009
|
2008
|
|||||||
|
Trade
accounts receivable
|
$ | 12,813 | $ | 13,885 | ||||
|
Allowance
for doubtful accounts
|
(481 | ) | (308 | ) | ||||
|
Total
trade accounts receivable, net
|
$ | 12,332 | $ | 13,577 | ||||
Amounts
charged to bad debt expense for fiscal 2009, 2008, and 2007 were $196,000,
$116,000, and $16,000, respectively. Actual charges to the allowance
for doubtful accounts for fiscal 2009, 2008, and 2007 were $37,000, $230,000,
and $98,000, respectively.
|
4.
|
INVENTORIES
|
Inventories
consist of the following (in thousands):
|
September
30,
|
||||||||
|
2009
|
2008
|
|||||||
|
Purchased
components and raw materials
|
$ | 9,985 | $ | 8,671 | ||||
|
Sub-assemblies
|
2,500 | 1,385 | ||||||
|
Work-in-process
|
3,660 | 5,215 | ||||||
|
Finished
goods
|
6,288 | 6,644 | ||||||
|
Total
inventories
|
$ | 22,433 | $ | 21,915 | ||||
At September 30, 2009 and 2008, respectively, cumulative inventory adjustments
to lower of cost or market totaled $2.2 million and $1.7
million. Amounts charged to expense to record inventory at lower of
cost or
market
were $726,000 for fiscal 2009, $708,000 for fiscal 2008, and $386,000 for fiscal
2007. Actual charges to the cumulative inventory adjustments upon
disposition or sale of inventory were $291,000, $801,000 and $903,000 for fiscal
2009, 2008, and 2007, respectively.
|
5.
|
PROPERTY, PLANT AND EQUIPMENT
|
Property,
plant and equipment consist of the following (in thousands):
|
September
30,
|
||||||||
|
2009
|
2008
|
|||||||
|
Land
and land improvements
|
$ | 2,391 | $ | 303 | ||||
|
Buildings
and improvements
|
5,819 | 3,390 | ||||||
|
Manufacturing
equipment
|
11,036 | 11,843 | ||||||
|
Computer
equipment and software
|
13,399 | 6,854 | ||||||
|
Office
equipment, furniture and fixtures
|
1,704 | 1,648 | ||||||
|
Construction
in progress
|
373 | 3,085 | ||||||
| 34,722 | 27,123 | |||||||
|
Accumulated
depreciation
|
(18,547 | ) | (18,418 | ) | ||||
|
Total
property, plant and equipment, net
|
$ | 16,175 | $ | 8,705 | ||||
Depreciation
expense was $1.8 million, $1.5 million and $1.3 million for fiscal 2009, 2008
and 2007, respectively.
During
fiscal 2009, the Company exercised its purchase option for its Walla Walla
facility and grounds. The purchase price was approximately $6.5
million. Approximately $600,000 in deferred rent was offset against
the purchase price as required by applicable accounting
standards. The Company has allocated approximately $1.7 million of
the net purchase price to land and approximately $800,000 to land improvements
and other separate components of the facility and grounds. Also in
fiscal 2009, the Company sold its facility and grounds in the
Netherlands. The gross selling price of approximately $1.5 million,
which included transfer taxes payable. The net proceeds to the
Company were approximately $1.4 million. The sales agreement also
provided for a 33 month leaseback of a portion of the facility, with a monthly
renewal option, for approximately $6,700 per month. As a result of
the sale and leaseback, approximately $8,000 of the gain from the sale was
recognized upon the sale of the building, and the remaining $211,000 gain was
deferred and will be amortized as an offset to rent expense over the leaseback
period. At September 30, 2009, the remaining unamortized deferred
gain was $192,000.
In fiscal
2009, the Company completed the development of a new enterprise resource
planning (“ERP”) system. Total capital expenditures related to the
new ERP system were approximately $6.1 million including computer hardware and
approximately $72,000 of capitalized interest.
|
|
6.
|
SALE OF INTEREST IN JOINT VENTURE
|
The
Company reached an agreement with its joint venture partner in December 2006
pursuant to which the Company sold its interest in InspX to the InspX joint
venture. Under the agreement, InspX redeemed the Company’s 50%
interest in the joint venture in exchange for $1,500,000 plus a contingent
payment. The $1,500,000 portion of the sale price consists
of $750,000 in cash that was paid to the Company in December 2006 and
a $750,000 term note payable on September 30, 2009 bearing interest at 5% per
annum payable quarterly until the note is paid in full. The note was
amended in fiscal 2009 to reschedule the payments over an eight-month period
ending May 31, 2010. The note is unsecured and, due to uncertainty
related to the ultimate collectability of the note, the Company established an
allowance in fiscal 2007 for the doubtful note receivable for the full amount of
the note. The contingent portion of the sale price consisted of an
additional $500,000, which was payable if specified events occurred by December
31, 2008. These contingent events did not occur and, as a result, no
contingent payment was due to the Company. There had been no value
recorded related to the contingent amount. The cash payment received
with respect to the Company’s sale of its interest in the InspX joint venture
added approximately $750,000 of pre- and after-tax income to the Company’s net
earnings in fiscal 2007.
Subsequent
to the end of the fiscal year, the Company received $275,000 in payments on its
note receivable. These payments have been recorded in fiscal 2009 as
gains from the sale of the joint venture.
|
7.
|
INVESTMENT IN PRODITEC
|
In fiscal
2009, the Company completed an agreement to acquire a minority interest in
Proditec SAS, a French manufacturer of automated, solid dose pharmaceutical
inspection systems. The Company acquired a 15% minority interest for
€870,000, or approximately $1.2 million. The Company also acquired an
exclusive option through October 5, 2009 to purchase the remaining 85%
interest. The Company’s investment in Proditec, including acquisition
costs, was approximately $1.5 million. This investment is being
accounted for under the cost method of accounting with approximately $54,000 of
the purchase price assigned as the fair value of the option.
In fiscal
2009, the Company elected not to exercise its option to purchase the remaining
85% interest in Proditec. The purchase agreement provided that if the
option was not exercised, through March 31, 2010, the Company may request that
Proditec use all best efforts to purchase or cause to be purchased for cash its
15% minority interest at a price equal to its original purchase price, and
Proditec may purchase from, the Company the 15% minority interest at the same
price. Subsequent to that date, the Company receives certain tag
along rights related to any other capital changes at Proditec and may sell its
shares to any third party subject to Proditec’s by-laws and right of pre-emption
by Proditec. The Company determined that, as a result of these
contractual provisions, its investment is other than temporarily impaired and
recorded a valuation charge of $219,000 to reduce its investment from cost to
its estimated fair value.
|
8.
|
FINANCING AGREEMENTS
|
The
Company’s domestic credit facility provides a revolving line of credit facility
to the Company in the maximum principal amount of $15,000,000 and a credit
sub-facility of up to $6,000,000 for standby letters of credit. The
revolving line of credit facility matures on September 30, 2011. The
credit facility bears interest, at the Company’s option, of either the lender’s
prime rate or the British Bankers Association LIBOR Rate (“BBA LIBOR”) plus
1.75% per annum. At September 30, 2009, the interest rate would have
been 2.0% based on the lowest of the available alternative rates. The
revolving line of credit is secured by all U.S. accounts receivable, inventory,
equipment, and fixtures. At September 30, 2009, the Company had no
outstanding borrowings under the revolving line of credit facility and $150,000
in standby letters of credit. At September 30, 2008, the Company had
no borrowings under its previous domestic credit facility and $380,000 in
standby letters of credit.
The loan
agreement also provided for a 15-year term loan in the amount of $6.4
million. The term loan provides for a mortgage on the Company’s Avery
Street headquarters’ land and building located in Walla Walla,
Washington. The term loan bears interest at the BBA LIBOR rate plus
1.4% and matures on January 2, 2024. The Company has also
simultaneously entered into an interest rate swap agreement with the lender to
fix the interest rate at 4.27%.
The
credit facilities contain covenants which require the maintenance of a funded
debt to EBITDA ratio, a fixed charge coverage ratio and minimum working capital
levels. The loan agreement permits capital expenditures up to a
certain level, and contains customary default and acceleration
provisions. The credit facilities also restrict acquisitions,
incurrence of additional indebtedness and lease expenditures above certain
levels without the prior consent of the lender. At September 30,
2009, the Company was in compliance with its loan covenants.
Principal
payments on long-term debt are as follows:
|
Year
Ended September 30,
|
(In
thousands)
|
|||
|
2010
|
$ | 319 | ||
|
2011
|
333 | |||
|
2012
|
345 | |||
|
2013
|
364 | |||
|
2014
|
380 | |||
|
Thereafter
|
4,454 | |||
|
Total
|
$ | 6,195 | ||
Based on
the borrowing rates currently available to the Company for loans with similar
terms and maturities, the fair value of long-term debt at September 30, 2009
approximates its carrying value.
The
Company’s credit accommodation with a commercial bank in The Netherlands
provides a credit facility for its European subsidiary. This credit
accommodation totals $3.7 million and includes an operating line of the
lesser of $2.2 million or the available borrowing base, which is based on
varying percentages of eligible accounts receivable and inventories, and a bank
guarantee facility of $1.5 million. The operating line and bank
guarantee facility are secured by all of the subsidiary’s personal
property. The credit facility bears interest at the bank’s prime
rate, with a minimum of 3.00%, plus 1.75%. At September 30, 2009, the
interest rate was 6.60%. At September 30, 2009, the Company had no
borrowings under this facility and had received bank guarantees of $2.5 million
under the bank guarantee facility. At September 30, 2008, the Company
had no borrowings under this facility and had received bank guarantees of $1.2
million under the bank guarantee facility. The credit facility allows
overages on the bank guarantee facility. Any overages reduce the
available borrowings from the operating line.
|
|
9.
|
DERIVATIVE INSTRUMENTS
|
The
Company entered into an interest rate swap arrangement during fiscal
2009. The Company also entered into and settled certain foreign
currency derivative contracts during fiscal 2009.
The
Company uses derivative instruments as risk management tools but does not use
derivative instruments for trading or speculative
purposes. Derivatives used for interest rate swap hedging purposes
are designated and effective as a cash flow hedge of the identified risk
exposure related to the Company’s variable rate mortgage at the inception of the
contract. A hedge is deemed effective if changes in the fair value of
the derivative contract are highly correlated with changes in the underlying
hedged item at inception of the hedge and over the life of the hedge
contract. To the extent the interest rate swap is effective, changes
in the fair value will be recognized in Other Comprehensive Income over the term
of the derivative contract. To the extent the interest rate swap is
not effective, changes in the fair value will be recognized in
earnings.
At
September 30, 2009, the Company had an interest rate swap of $6.2 million that
effectively fixes the interest rate on its LIBOR-based variable rate mortgage at
4.27%. At September 30, 2009, the fair value of the swap agreement
recorded as an asset in Other long-term assets on the Condensed Consolidated
Balance Sheet was $99,000. There were no gains or losses recognized
in net income related to the swap agreement during the fiscal year ended
September 30, 2009, as the interest rate swap was highly effective as a cash
flow hedge. Consequently, at September 30, 2009, the $99,000 gain was
recorded as part of Other Comprehensive Income in the equity section of the
Company’s Condensed Consolidated Balance Sheet. During fiscal 2009,
the Company recorded $118,000 as interest expense related to the interest rate
swap. Based on current market conditions, the Company expects to
record interest expense in Other income (expense) on the Company’s Condensed
Consolidated Statement of Operations to reflect actual interest payments and
settlements on the interest rate swap in the next 12 months. The
interest rate swap matures in January 2024.
At
September 30, 2009, the Company had a one-month undesignated forward exchange
contract for €6.0 million. Forward exchange contracts are used to
manage the Company’s foreign currency exchange risk related to its ongoing
operations. Net foreign currency losses of $395,000 were recorded for
forward
exchange
contracts in the year ended September 30, 2009 in Other income (expense) on the
Company’s Condensed Consolidated Statement of Operations. At
September 30, 2009, the Company had liabilities of $82,000 under these forward
contracts in Other accrued liabilities on the Company’s Condensed Consolidated
Balance Sheet. At September 30, 2008, the Company had assets of
$33,000 for forward contracts in other current assets on the Company’s
Consolidated Balance Sheet
|
|
10.
|
FAIR VALUE MEASUREMENTS
|
The
Company adopted the updated pronouncements of the FASB related to fair value
measurements as of October 1, 2008. Fair value is defined as the
exchange price that would be received for an asset or paid to transfer a
liability (an exit price) in the principal or most advantageous market for the
asset or liability in an orderly transaction between market
participants. Fair value is based upon a hierarchy of the
observability of inputs in valuation techniques. Observable inputs
(highest level) reflect market data obtained from independent sources, while
unobservable inputs (lowest level) reflect internally developed market
assumptions. Fair value measurements are classified under the
following hierarchy:
|
|
·
|
Level
1 – Quoted prices for identical instruments in active
markets.
|
|
|
·
|
Level
2 – Quoted prices for similar instruments in active markets; quoted prices
for identical or similar instruments in markets that are not active; and
model-derived valuations in which all significant inputs or significant
value-drivers are observable in active
markets.
|
|
|
·
|
Level
3 – Model-derived valuations in which one or more significant inputs or
significant value-drivers are
unobservable.
|
When
available, the Company uses quoted market prices to determine fair value and
classifies such measurements within Level 1. In some cases where
market prices are not available, the Company makes use of observable market
based inputs to calculate fair value, in which case the measurements are
classified within Level 2. If quoted or observable market processes
are not available, fair value is based upon internally developed models that
use, where possible, current market-based parameters such as interest rates,
yield curves and currency rates. These measurements are classified
within Level 3.
Fair
value measurements are classified according to the lowest level input or
value-driver that is significant to the valuation. A measurement may
therefore be classified within Level 3 even though there may be significant
inputs that are readily observable.
Money Market
Funds
The
Company has measured its money market funds based on quoted prices in active
markets of identical assets.
Derivative financial
instruments
The fair
value of interest rate swap derivatives is primarily based on pricing
models. These models use discounted cash flows that utilize the
appropriate market-based forward swap curves. The fair value of
foreign currency forward contracts is based on the differential between contract
price and the market-based forward rate.
The
following table presents the Company’s assets and liabilities that are measured
and recorded at fair value on a recurring basis consistent with the fair value
hierarchy provisions.
|
Fair Value Measurements at September 30,
2009,
(in thousands)
|
||||||||||||||||
|
Description
|
Level 1
|
Level 2
|
Level 3
|
Total Assets/
Liabilities at
Fair Value
|
||||||||||||
|
Money
market funds
|
$ | 10,934 | $ | - | $ | - | $ | 10,934 | ||||||||
|
Derivatives:
|
||||||||||||||||
|
Interest
rate swap
|
- | 99 | - | 99 | ||||||||||||
|
Forward
exchange contracts
|
- | 0 | - | 0 | ||||||||||||
At
September 30, 2009, the Company had long-term debt of approximately $6.2 million
which is classified within Level 3. The fair value of the debt
approximated its carrying value based on the borrowing rates currently available
to the Company for loans with similar terms and maturities.
Fair
value estimates are made at a specific point in time based on relevant market
information and information about the financial instrument. These
estimates are subjective in nature and involve uncertainties and matters of
significant judgment and, therefore, cannot be determined with
precision. Forward exchange contracts had a fair value of zero at the
reporting date, as these contracts were entered into as of that
date. Changes in assumptions could significantly affect these
estimates.
|
|
11.
|
LEASES
|
The
Company has a leased operating facility in Oregon the lease on which expires in
2012, with a five-year renewal option. The Company has leased an
operating facility in The Netherlands under a lease that expires in 2013, with
successive five-year renewal options. The Company also has a leased
warehouse facility in the Netherlands which expires in 2012 with a one-year
renewal option. In fiscal 2009, the Company exercised its purchase
option for its previously leased Walla Walla facility and
grounds. The Company also has leased office space for sales and
service and other activities in Australia, Mexico, Belgium and China, and other
leased facilities in Walla Walla.
Rental
expense is recognized on a straight-line basis over the term of the
lease. Rental expense for the Company’s operating leases referred to
above was $661,000 for the year ended September 30, 2009, $1,520,000 for the
year ended September 30, 2008, and $1,431,000 for the year ended September 30,
2007.
The
following is a schedule of future minimum rental required under operating leases
and future rental expense (in thousands):
|
Year
Ending September 30,
|
Rental
Payments
|
Rental
Expense
|
||||||
|
2010
|
$ | 607 | $ | 530 | ||||
|
2011
|
587 | 510 | ||||||
|
2012
|
483 | 445 | ||||||
|
2013
|
172 | 172 | ||||||
|
2014
|
0 | 0 | ||||||
|
Thereafter
|
0 | 0 | ||||||
|
Total
|
$ | 1,849 | $ | 1,657 | ||||
|
|
12.
|
CONTRACTUAL GUARANTEES AND
INDEMNITIES
|
Intellectual property and general contractual indemnities
The
Company, in the normal course of business, provides specific, limited
indemnification to its customers for liability and damages related to
intellectual property rights. In addition, the Company may enter into
contracts with customers where it has agreed to indemnify the customer for
personal injury or property damage caused
by the
Company’s products and services. Indemnification is typically limited to
replacement of the items or the actual price of the products and
services. The Company maintains product liability insurance as well
as errors
and omissions insurance, which may provide a source of recovery in the event of
an indemnification claim, but does not maintain insurance coverage for claims
related to intellectual property rights.
Historically,
any amounts payable under these indemnifications have not had a material effect
on the Company’s business, financial condition, results of operations, or cash
flows. The Company has not recorded any provision for future obligations under
these indemnifications. If the Company determines it is probable that
a loss has occurred under these indemnifications, then any such reasonably
estimable loss would be recognized.
Director and officer indemnities
The
Company has entered into indemnification agreements with its directors and
certain executive officers which require the Company to indemnify such
individuals against certain expenses, judgments and fines in third-party and
derivative proceedings. The Company may recover some of the expenses
and liabilities that arise in connection with such indemnifications under the
terms of its directors’ and officers’ insurance policies. The Company
has not recorded any provision for future obligations under these
indemnification agreements.
Bank guarantees and letters of credit
At
September 30, 2009, the Company had standby letters of credit totaling $2.6
million, which includes secured bank guarantees under the Company’s credit
facility in Europe and letters of credit securing certain self-insurance
contracts. If the Company fails to meet its contractual obligations,
these bank guarantees and letters of credit may become liabilities of the
Company. This amount is comprised of approximately $2.5 million of
outstanding performance guarantees secured by bank guarantees under the
Company’s European subsidiaries credit facility in Europe and a standby letter
of credit for $150,000 securing certain self-insurance contracts related to
workers compensation. Bank guarantees arise when the European
subsidiary collects customer deposits prior to order fulfillment. The
customer deposits received are recorded as current liabilities on the Company’s
balance sheet. The bank guarantees repayment of the customer deposit
in the event an order is not completed. The bank guarantee is
canceled upon shipment and transfer of title. These bank guarantees
arise in the normal course of the Company’s European business and are not deemed
to expose the Company to any significant risks since they are satisfied as part
of the design and manufacturing process.
At
September 30, 2009, the Company had remaining contractual obligations to
purchase certain materials and supplies aggregating $779,000. As of
September 30, 2009, the Company had purchased $425,000 of materials under these
contracts. The Company anticipates that it will purchase the
remaining $779,000 of material and supplies under these obligations within the
next twelve months. During fiscal 2009, the Company recorded losses
of $17,000 related to these contracts.
|
13.
|
INCOME
TAXES
|
The
provision for income taxes from continuing operations consists of the following
(in thousands):
|
Year
Ended September 30,
|
||||||||||||
|
2009
|
2008
|
2007
|
||||||||||
|
Current:
|
||||||||||||
|
Federal
|
$ | (583 | ) | $ | 2,519 | $ | 2,253 | |||||
|
Foreign
|
(171 | ) | 434 | 187 | ||||||||
|
State
|
(12 | ) | 212 | 210 | ||||||||
| (766 | ) | 3,165 | 2,650 | |||||||||
|
Deferred:
|
||||||||||||
|
Federal
|
576 | 110 | 1,041 | |||||||||
|
Foreign
|
(657 | ) | 280 | (281 | ) | |||||||
|
State
|
(10 | ) | 20 | 37 | ||||||||
| (91 | ) | 410 | 797 | |||||||||
|
Valuation
reserves:
|
||||||||||||
|
Federal
|
(157 | ) | 304 | (529 | ) | |||||||
|
Foreign
|
138 | (364 | ) | 281 | ||||||||
|
State
|
(2 | ) | - | (23 | ) | |||||||
| (21 | ) | (60 | ) | (271 | ) | |||||||
|
Total
income tax expense (benefit)
|
$ | (878 | ) | $ | 3,515 | $ | 3,176 | |||||
The
Company accounts for its deferred tax assets and liabilities, including excess
tax benefits of share-based payments, based on the tax ordering of deductions to
be used on its tax returns. The tax effects of temporary differences
that give rise to significant portions of deferred tax assets and deferred tax
liabilities are as follows (in thousands):
|
September
30,
|
||||||||
|
2009
|
2008
|
|||||||
|
Deferred
tax asset:
|
||||||||
|
Reserves
and accruals
|
$ | 3,020 | $ | 2,769 | ||||
|
Tax
benefits of share-based payments
|
731 | 731 | ||||||
|
Translation
adjustment to equity
|
(244 | ) | (257 | ) | ||||
|
Unrealized
changes in value of derivatives to equity
|
(34 | ) | - | |||||
|
Deferred
tax liability:
|
||||||||
|
Accumulated
depreciation
|
(38 | ) | 106 | |||||
|
Intangible
assets
|
(521 | ) | (908 | ) | ||||
|
Net
deferred tax asset
|
$ | 2,914 | $ | 2,441 | ||||
|
Net
deferred tax:
|
||||||||
|
Current
asset
|
$ | 3,464 | $ | 2,340 | ||||
|
Long-term
asset
|
38 | 101 | ||||||
|
Long-term
liability
|
(588 | ) | - | |||||
|
Net
deferred tax asset
|
$ | 2,914 | $ | 2,441 | ||||
At
September 30, 2009, the Company had valuation reserves of approximately $430,000
for deferred tax assets for capital loss carry forwards and the valuation
reserve for notes receivable related to the sale of the investment in the InspX
joint venture, the valuation impairment of its investment in Proditec and
offsetting amounts for U.S. and Chinese deferred tax assets and liabilities,
primarily related to net operating loss carry forwards in the foreign
jurisdictions that the Company believes will not be utilized during the
carryforward period. During fiscal 2009, the Company recorded $79,000
of valuation reserves related to impairment charges on its investment in
Proditec and reversed $99,000 of valuation reserves upon partial reversal of its
valuation reserve on its note receivable from the sale of its interest in the
InspX joint venture. There were no other valuation allowances at
September 30, 2009 due to anticipated utilization of all the deferred tax assets
as the Company believes it will have sufficient taxable income to utilize these
assets.
During
fiscal 2008, $60,000 of net valuation reserves for combined U.S. and Australian
deferred taxes were eliminated due to the final dissolution of the related
Australian entity. During fiscal 2007, the Company recorded $281,000
of valuation reserves for deferred tax assets related to Australian and Chinese
net operating losses which were offset by an equal amount of U.S. deferred tax
liabilities related to these operating losses. The Company believes
these amounts will not be realized due to the closure of operations in Australia
and the likelihood of the Company’s ability to fully utilize net operating
losses in China during the carryforward period. The Company also
reversed valuation reserves of a net $271,000 for deferred tax assets related to
the Company’s valuation of its investment in the InspX joint venture and the
subsequent sale of its investment in the first quarter of fiscal
2007.
Income
tax expense (benefit) is computed at rates different than statutory
rates. The reconciliation between effective and statutory rates is as
follows:
|
Year
Ended September 30,
|
||||||||||||
|
2009
|
2008
|
2007
|
||||||||||
|
Statutory
rates
|
(34.0 | )% | 34.0 | % | 34.0 | % | ||||||
|
Increase
(reduction) in income taxes resulting from:
|
||||||||||||
|
Extraterratorial
income exclusion
|
- | - | (0.2 | ) | ||||||||
|
Domestic
production deduction
|
- | (1.7 | ) | (0.8 | ) | |||||||
|
Research
and development credit
|
(16.9 | ) | (0.2 | ) | (0.7 | ) | ||||||
|
Changes
in tax law, R&D credit
|
(11.7 | ) | - | - | ||||||||
|
State
income taxes, net of federal benefit
|
(1.3 | ) | 1.4 | 1.4 | ||||||||
|
Tax
exempt interest
|
(3.7 | ) | (1.9 | ) | (2.1 | ) | ||||||
|
Valuation
reserve - InspX
|
(6.8 | ) | - | (2.4 | ) | |||||||
|
Valuation
reserve - Proditec
|
5.4 | - | - | |||||||||
|
Meals
and entertainment deduction limitation
|
4.7 | 0.8 | 0.6 | |||||||||
|
Non-deductible
stock compensation
|
(0.4 | ) | 0.1 | 0.3 | ||||||||
|
Other
permanent differences
|
0.6 | (0.5 | ) | 0.1 | ||||||||
|
Income
tax combined effective rate
|
(64.1 | )% | 32.0 | % | 30.2 | % | ||||||
The
federal Research and Development Credit (“R&D credit”) expired on December
31, 2007. In fiscal 2009, the Emergency Economic Stabilization Act of
2008 was enacted. As part of the legislation, the existing R&D
credit was retroactively renewed and extended to December 31,
2009. Due to this change in tax law, the Company recorded
approximately $160,000 of additional R&D tax credits in fiscal 2009 related
to R&D expenditures incurred during fiscal 2008.
On
October 1, 2007, the Company adopted the updated provisions related to the
accounting for uncertainty in income taxes. Differences between the
amount recognized in the consolidated financial statements prior to the adoption
of these updated standards and the amounts reported as a result of adoption have
been accounted for as a cumulative effect adjustment recorded to the October 1,
2007 retained earnings balance. The adoption of these updated
standards increased the October 1, 2007 balance of retained earnings by
$250,000. In addition, the Company reclassified tax reserves for
which a cash tax payment is not expected in the next twelve months from current
to non-current liabilities.
A
reconciliation of the beginning and ending amount of unrecognized tax benefits
is as follows (in thousands):
|
Balance
at October 1, 2008
|
$ | 110,000 | ||
|
Additions
based on tax positions related to the current period
|
3,000 | |||
|
Additions
for tax positions of prior period
|
- | |||
|
Reductions
for tax positions of prior periods
|
- | |||
|
Settlements
|
- | |||
|
Balance
at September 30, 2009
|
$ | 113,000 |
As of
September 30, 2009, the amount of unrecognized tax benefits, which if recognized
would favorably affect the company’s effective tax rate, is
$113,000.
The
Company is subject to income taxes in the U.S. federal jurisdiction and various
state and foreign jurisdictions. Tax regulations within each
jurisdiction are subject to the interpretation of the related tax laws and
regulations and require significant judgment to apply. With few
exceptions, the Company is no longer subject to U.S. federal, state and local,
or non-U.S. income tax examinations by tax authorities for the years before
2004.
The
Company is not currently under examination by any U.S. federal or state
jurisdictions, or foreign jurisdictions, and there are no expected material
changes in the unrecognized tax benefit liability within the next twelve
months. While it is often difficult to predict the final outcome or
the timing of resolution of any particular uncertain tax positions, the Company
believes its liabilities for income taxes represent the most probable
outcome. The Company adjusts these liabilities in light of changing
facts and circumstances.
The
Company recognizes interest accrued related to unrecognized tax benefits in
interest expense and penalties in other income and expense for all periods
presented. The Company had accrued approximately $37,000 for the
payment of interest and penalties at October 1, 2007. As of September
30, 2009 and 2008, the Company had accrued $50,000 and $46,000, respectively,
for possible interest and penalties.
|
14.
|
SHARE-BASED
COMPENSATION PLANS
|
At
September 30, 2009, the Company had two share-based compensation plans, which
are shareholder-approved, as described below. The Company issues new
shares of common stock for exercises and awards under these plans and
non-employee awards.
Share-based
compensation costs charged against income are as follows:
|
Fiscal
year ended September 30, 2009
|
Fiscal
year ended September 30, 2008
|
Fiscal
year ended September 30, 2007
|
||||||||||
|
Cost
of goods sold
|
$ | 90 | $ | 214 | $ | 197 | ||||||
|
Operating
expenses
|
817 | 1,326 | 790 | |||||||||
|
Total
share-based compensation expense
|
907 | 1,540 | 987 | |||||||||
|
Income
tax benefit
|
320 | 548 | 326 | |||||||||
Approximately
$5,000 of share-based compensation expense remained capitalized in inventory as
of September 30, 2009 and September 30, 2008, and $54,000 as of September 30,
2007.
Share-based
compensation expense for fiscal 2009 was reduced by approximately $251,000 due
to changes in estimates on performance-based stock awards granted in previous
fiscal years as the Company estimated that it had become less than probable that
the related performance goals would be achieved.
As of
September 30, 2009, the total unrecognized compensation cost related to these
plans was $1.8 million and was comprised of: $1.0 million related to
service-based stock awards that is expected to be recognized over a
weighted-average period of 0.91 years and $734,000 related to performance-based
stock awards. No compensation costs are expected to be recognized
over the 1.2-year remaining life of the performance-based stock awards as it is
less than probable that the related performance goals will be
achieved.
Employees’ Stock Incentive
Plan—Under the 2003 Restated Employees’ Stock Incentive Plan (the
“Incentive Plan”), eligible employees may receive either incentive stock options
or non-qualified stock options and such options may be exercised only after an
employee has remained in continuous employment for one year after the date of
grant. Thereafter, the options become exercisable as stipulated by
the individual option agreements, generally 25% per year on the anniversary date
of the grant for incentive stock options and 100% on the one year anniversary
for non-qualified stock options. The contractual term for these
options varies from 5-10 years. The option exercise price is the fair
market value of the underlying stock at the date of grant. In
addition, under the Incentive Plan, eligible employees may be granted restricted
stock awards which vest either on employment-based or performance-based
measures. At September 30, 2009, the total number of shares reserved
for issuance under the Incentive Plan was 582,083, of which 384,810 were
available for grant. The fair value of each option award is estimated
on the date of grant using a
Black-Scholes
option valuation model. Expected volatilities are based on historical
volatility of the Company’s stock, and other factors. The Company
uses historical data to estimate option exercise and employee termination within
the valuation model: separate groups of employees that have similar
historical exercise behavior are considered separately for valuation
purposes. The expected term of options granted is derived from the
output of the option valuation model and represents the period of time that
options granted are expected to be outstanding. The risk-free rate
for periods within the contractual life of the option is based on the U.S.
Treasury Note five-year rate in effect at the time of grant. There
were no options granted in fiscal 2009, 2008 or 2007.
Incentive Stock Options
A summary
of option activity under the Incentive Plan as of September 30, 2009 and the
year then ended is presented below:
|
Options
|
Number of Shares
|
Weighted-Average Exercise
Price
|
Weighted-Average Remaining Contractual
Term
|
Aggregate Intrinsic Value
($000)
|
||||||||||||
|
Outstanding
at October 1, 2008
|
80,000 | $ | 8.64 | - | - | |||||||||||
|
Granted
|
- | - | - | - | ||||||||||||
|
Exercised
|
(25,000 | ) | $ | 8.65 | - | - | ||||||||||
|
Forfeited
or expired
|
- | - | - | - | ||||||||||||
|
Outstanding
at September 30, 2009
|
55,000 | $ | 8.64 | 3.41 | $ | 187 | ||||||||||
|
Exercisable
at September 30, 2009
|
55,000 | $ | 8.64 | 3.41 | $ | 187 | ||||||||||
The total
intrinsic value of options exercised during the years ended September 30, 2009,
2008 and 2007 was $138,000, $1.3 million and $1.6 million,
respectively. No shares vested in fiscal 2009. The fair
value of shares vested during fiscal 2008 and 2007 was $16,000 and $562,000,
respectively.
As of
September 30, 2009, there was no unrecognized compensation cost related to stock
options granted under the Incentive Plan.
Service-Based Stock
Awards—Under the Incentive Plan, the Company may award service-based
stock grants to selected executives and other key employees whose vesting is
contingent upon meeting the required service period,
generally two or three years, and in the case of certain executives, ratably
over a three-year period, or in the case of members of the Board of Directors,
one year. The fair value of these grants is based on the closing fair
market value at the grant date. The restrictions on the grants lapse
at the end of the required service period. Stock compensation expense
is recognized based on the grant date fair value of the stock over the vesting
period.
The
summary of activity for service-based stock awards as of September 30, 2009, and
changes during the year then ended, is presented below:
|
Service-Based Stock Awards
|
Number of Shares
|
Weighted-Average Grant Date Fair Value per
Share
|
||||||
|
Non-vested
balance at October 1, 2008
|
114,741 | $ | 24.51 | |||||
|
Granted
|
55,831 | $ | 13.32 | |||||
|
Vested
|
(31,220 | ) | $ | 25.64 | ||||
|
Forfeited
|
(18,182 | ) | $ | 16.49 | ||||
|
Non-vested
balance at September 30, 2009
|
121,170 | $ | 20.27 | |||||
The
number of shares granted in fiscal 2009 that vest in one year was 25,530; 16,500
vest in ratable increments over two years; 10,801 vest in ratable annual
increments over three years; and 3,000 vest in three years. The total
fair value of shares vested in fiscal 2009, 2008, and 2007 was $351,000, $1.3
million, and $828,000, respectively. As of September 30, 2009, there
was $1.0 million of total unrecognized compensation cost related to
service-based stock awards that is expected to be recognized over a
weighted-average period of 0.91 years. In fiscal 2008, the Company
granted 63,238 shares of service-based awards with a weighted average grant date
fair value of $33.62. In fiscal 2007, the Company granted 70,736
shares of service-based awards with a weighted average grant date fair value of
$14.92.
Employee Performance-Based
Stock Awards—In fiscal 2009, the Company awarded shares of
performance-based stock grants to the Company’s Chief Executive Officer, the
lapse of restrictions on which is contingent on achievement of performance
objectives as determined by the Compensation Committee of the Board of Directors
over a three-year period ending September 30, 2011. This award was
subsequently cancelled in fiscal 2009. In fiscal 2008, the Company
awarded shares of performance-based stock grants to selected executives, the
lapse of restrictions on which is contingent on achievement of performance
objectives, as determined by the Compensation Committee of the Board of
Directors, over a three-year period ending September 30, 2010. In
fiscal 2007, the Company did not award any performance-based
stock. Recipients of performance-based stock awards must also
continue to be employed by the Company into the month of December following the
end of the three-year period for the restrictions on the awards to
lapse.
Compensation
expense is recognized over the period the employee performs related services
based on the estimated number of shares expected to vest at the grant date fair
value and if it is probable that the performance goal will be
achieved. If the performance goals are not met or the service period
is not fulfilled, no compensation cost is recognized and any recognized
compensation cost will be reversed.
A summary
of the activity for performance-based stock awards as of September 30, 2009, and
changes during the year then ended, is presented below:
|
Performance-Based Stock
Awards
|
Number of Shares
|
Weighted-Average Grant Date Fair Value per
Share
|
||||||
|
Non-vested
balance at October 1, 2008
|
35,408 | $ | 28.13 | |||||
|
Granted
|
10,801 | $ | 17.31 | |||||
|
Vested
|
- | - | ||||||
|
Forfeited
|
(25,106 | ) | $ | 17.87 | ||||
|
Non-vested
balance at September 30, 2009
|
21,103 | $ | 34.79 | |||||
The total
fair value of shares that vested in fiscal 2009, 2008 and 2007 was $0, $1.1
million and $0, respectively. As of September 30, 2009, there was
$734,000 of total unrecognized compensation cost related to performance-based
stock awards. No compensation cost is expected to be recognized over
the 1.2 year
remaining
life as it is less than probable the related performance goals will be
achieved. In fiscal 2008, the Company granted 26,603 shares of
performance-based awards with a grant date fair value of $34.78. In
fiscal 2007, there were no awards of performance-based shares.
Employee Stock
Purchase Plan—Most employees are eligible to participate in the Company’s
Employee Stock Purchase Plan (the “Purchase Plan”). Shares are not
available to employees who already own 5% or more of the Company’s
stock. Employees can withhold, by payroll deductions, up to 5% of
their regular compensation to purchase shares at a purchase price of 85% of the
fair market value of the common stock on the purchase date. There
were 500,000 shares reserved for purchase under the Purchase Plan of which
389,056 remained available at September 30, 2009.
During
the years ended September 30, 2009, September 30, 2008 and September 30, 2007,
the Company issued 10,900, 3,757 and 4,176 shares, respectively, under the
Purchase Plan and recorded compensation cost based on the 15% discount from
market price paid by the employees.
Non-Employee
Service-Based Stock Awards—The Company may award shares of service-based
stock grants to non-employees. The value of these awards is amortized
to expense over the vesting period with final valuation measured on the vesting
date. At September 30, 2009, there were no shares outstanding and
there were no awards during fiscal 2009. There were 2,000 shares
granted to non-employees during fiscal 2008 on which the restrictions lapsed
during fiscal 2008. The weighted-average fair value of these shares
was $33.40 at the grant date, and at the vesting dates the aggregate intrinsic
value of these shares was $67,000. In fiscal 2007, restrictions
lapsed on 2,000 shares granted to non-employees in previous
years. The weighted average fair value of these shares was $13.79 at
the grant date and at the vesting date the aggregate intrinsic value of these
shares was $33,000.
Cash
received from option exercises and employee stock purchase plan purchases was
$145,000, $687,000 and $1.6 million for the years ended September 30, 2009, 2008
and 2007, respectively. The tax benefit to be realized for the tax
deductions from option exercises under the share-based payment arrangements was
$206,000, $1.7 million and $613,000 for the years ended September 30, 2009, 2008
and 2007, respectively.
|
|
15.
|
STOCK
REPURCHASE PROGRAM
|
The
Company initiated a stock repurchase program effective November 27, 2006 to
repurchase up to 500,000 shares of its common stock. The Company
intends to retire the shares upon repurchase. In fiscal 2007, the
Company repurchased and retired 88,252 shares of common stock at an average
purchase price of $14.77 per share. There were no repurchases during
fiscal 2008. In fiscal 2009, the Board of Directors restored the
number of shares that may be repurchased to the original 500,000 share amount,
and subsequently increased the number of shares that may be repurchased under
the share repurchase program to 750,000 shares. In fiscal 2009, the
Company purchased and retired 671,250 shares at an average price of $14.84 per
share. Included in these amounts was the repurchase of 23,325 shares
of its Common Stock from Michael L. Shannon, an independent director of the
Company. The shares were purchased at an average price of $15.01 per
share based on the daily closing price of the Company’s Common Stock on The
NASDAQ Global Market less $0.03 per share. The total purchase price
paid to Mr. Shannon was approximately $350,000. The purchase
transactions were previously approved by the Nominating and Corporate Governance
Committee and the Company’s
Board of Directors. The aggregate purchase price of the shares
repurchased under the program has been reflected as a reduction in shareholders’
equity.
|
|
16.
|
EMPLOYEE
BENEFIT PLANS
|
The
Company has a 401(k) profit sharing plan which covers substantially all
employees. The Company matches 50% of employee contributions for a
maximum match of 4% in fiscal 2009 and 2008 and 3% in fiscal 2007 of each
participating employee’s compensation. The matching contributions
were temporarily suspended in March 2009. The Company contributed
$473,000, $754,000 and $470,000 in matching funds to the plan for the years
ended September 30, 2009, 2008 and 2007, respectively.
The
401(k) plan also permits the Company to make discretionary profit sharing
contributions to all employees. Discretionary profit sharing
contributions are determined annually by the Board of
Directors.
Profit
sharing plan expense was $0, $527,000 and $443,000 for the years ended
September 30, 2009, 2008, and 2007, respectively.
|
|
17.
|
SEGMENT
INFORMATION
|
The
Company’s business units serve customers in its primary market—the food
processing and agricultural products industry—through common sales and
distribution channels. Therefore, the Company reports on one
segment. The following table summarizes information about products
and services (in thousands).
|
Year
Ended September 30,
|
||||||||||||
|
2009
|
2008
|
2007
|
||||||||||
|
Net
sales by product category:
|
||||||||||||
|
Automated
inspection systems
|
$ | 48,188 | $ | 55,968 | $ | 46,858 | ||||||
|
Process
systems
|
36,507 | 56,603 | 40,947 | |||||||||
|
Parts
and service
|
20,755 | 21,515 | 19,735 | |||||||||
|
Total
net sales by product category
|
$ | 105,450 | $ | 134,086 | $ | 107,540 | ||||||
Net sales
for service were less than 10% of total net sales for the years ended
September 30, 2009, 2008 and 2007, respectively, and are therefore
summarized with parts and service. Upgrades of automated inspection
systems are included with automated inspection systems.
The
following table summarizes information about geographic areas:
|
Year
Ended September 30,
|
||||||||||||
|
2009
|
2008
|
2007
|
||||||||||
|
Net
sales:
|
||||||||||||
|
Domestic
|
$ | 59,922 | $ | 66,731 | $ | 58,351 | ||||||
|
International
|
45,528 | 67,355 | 49,189 | |||||||||
|
Total
net sales
|
$ | 105,450 | $ | 134,086 | $ | 107,540 | ||||||
|
Long-lived
assets:
|
||||||||||||
|
Domestic
|
$ | 18,467 | $ | 11,196 | $ | 8,286 | ||||||
|
International
|
2,502 | 2,301 | 2,484 | |||||||||
|
Total
long-lived assets
|
$ | 20,969 | $ | 13,497 | $ | 10,770 | ||||||
There
were two customers that individually accounted for 10% of net sales during
fiscal 2009. There were two customers that accounted for 14% and 13%,
respectively, of net sales during fiscal 2008. There was no customer
that accounted for greater than 10% of net sales during fiscal
2007. No single country outside the United States accounted for more
than 10% of net sales in 2009, 2008 or 2007. Location of the customer
is the basis for the categorization of net sales.
* * * * *
*
SUPPLEMENTARY
DATA
QUARTERLY FINANCIAL INFORMATION
(Unaudited)
The
following is a summary of operating results by quarter for the years ended
September 30, 2009 and 2008 (in thousands, except per share
data):
|
2009
Quarter Ended
|
December
31
|
March
31
|
June
30
|
September
30
|
Total
|
|||||||||||||||
|
Net
sales
|
$ | 27,375 | $ | 23,250 | $ | 26,209 | $ | 28,616 | $ | 105,450 | ||||||||||
|
Gross
profit
|
11,316 | 8,132 | 9,600 | 9,976 | 39,023 | |||||||||||||||
|
Net
earnings (loss)
|
569 | (1,469 | ) | 455 | (45 | ) | (491 | ) | ||||||||||||
|
Net
earnings (loss) per share—basic
|
$ | 0.11 | $ | (0.30 | ) | $ | 0.09 | $ | (0.01 | ) | $ | (0.10 | ) | |||||||
|
Net
earnings (loss) per share—diluted
|
$ | 0.11 | $ | (0.30 | ) | $ | 0.09 | $ | (0.01 | ) | $ | (0.10 | ) | |||||||
|
2008
Quarter Ended
|
December
31
|
March
31
|
June
30
|
September
30
|
Total
|
|||||||||||||||
|
Net
sales
|
$ | 28,943 | $ | 29,110 | $ | 35,831 | $ | 40,202 | $ | 134,086 | ||||||||||
|
Gross
profit
|
11,467 | 11,297 | 15,036 | 15,392 | 53,193 | |||||||||||||||
|
Net
earnings
|
1,090 | 1,193 | 2,963 | 2,227 | 7,473 | |||||||||||||||
|
Net
earnings per share—basic
|
$ | 0.20 | $ | 0.22 | $ | 0.54 | $ | 0.41 | $ | 1.38 | ||||||||||
|
Net
earnings per share—diluted
|
$ | 0.20 | $ | 0.22 | $ | 0.53 | $ | 0.40 | $ | 1.35 | ||||||||||
Note: Annual
totals may not agree to the summarization of quarterly information due to
insignificant rounding and the required calculation conventions.
* * * * *
*
|
ITEM
9.
|
CHANGES IN AND DISAGREEMENTS WITH ACCOUNTANTS ON
ACCOUNTING AND FINANCIAL
DISCLOSURE.
|
None.
|
ITEM
9A.
|
CONTROLS AND
PROCEDURES.
|
Evaluation
of Disclosure Controls and Procedures
The
Company’s management, with the participation of its Chief Executive Officer and
Chief Financial Officer, conducted an evaluation of the effectiveness of the
design and operation of the Company’s disclosure controls and procedures, as
required by Exchange Act Rule 13a-15. Based on that evaluation, the
Chief Executive Officer and Chief Financial Officer have concluded that, as of
the end of the period covered by this report, the Company’s disclosure controls
and procedures were effective to ensure that information required to be
disclosed by the Company in the reports that it files or submits under the
Exchange Act is recorded, processed, summarized and reported within the time
periods specified by the SEC’s rules and forms and such information is
accumulated and communicated to management as appropriate to allow timely
decisions regarding required disclosures.
Management’s
Report on Internal Control over Financial Reporting
The
Company’s management is responsible for establishing and maintaining adequate
internal control over financial reporting. The Company’s internal
control over financial reporting is a process designed under the supervision of
its Chief Executive Officer and Chief Financial Officer to provide reasonable
assurance regarding the reliability of financial reporting and the preparation
of the Company’s financial statements for external reporting in accordance with
accounting principles generally accepted in the United States of
America. Management evaluates the effectiveness of the Company’s
internal control over financial reporting using the criteria set forth by the
Committee
of Sponsoring Organizations of the Treadway Commission (COSO) in “Internal
Control – Integrated Framework.” Management, under the supervision
and with the participation of the Company’s Chief Executive Officer and Chief
Financial Officer, assessed the effectiveness of the design and operation of the
Company’s internal control over financial reporting as of September 30, 2009 and
concluded that the Company’s disclosure controls and
procedures
were effective to ensure that information required to be disclosed by the
Company in the reports that it files or submits under the Exchange Act is
recorded, processed, summarized and reported within the time periods specified
by the SEC’s rules and forms and such information is accumulated and
communicated to management as appropriate to allow timely decisions regarding
required disclosures.
This
annual report does not include an attestation report of the Company’s registered
public accounting firm regarding internal control over financial
reporting. Management’s report was not subject to attestation by the
Company’s registered public accounting firm pursuant to temporary rules of the
Securities and Exchange Commission that permit the Company to provide only
management’s report in this annual report.
Changes
in Internal Controls
There
were no changes in the Company’s internal control over financial reporting
identified in connection with the evaluation referred to above that occurred
during the fourth quarter of the fiscal year ended September 30, 2009 that have
materially affected, or are reasonably likely to materially affect, the
registrant’s internal control over financial reporting. During the
fourth quarter of fiscal 2009, the Company continued to improve and enhance its
system of internal control over financial reporting related to the
implementation of its new enterprise resource planning (“ERP”) system in the
third quarter of fiscal 2009.
Limitations
on the Effectiveness of Controls
The
Company believes that a control system, no matter how well designed and
operated, cannot provide absolute assurance that the objectives of the control
system are met, and no evaluation of controls can provide absolute assurance
that all controls issues and instances of fraud, if any, within a company have
been detected. The Company’s disclosure controls and procedures are
designed to provide reasonable assurance of achieving their objectives, and the
Company’s Chief Executive Officer and Chief Financial Officer have concluded
that such controls and procedures are effective at the “reasonable assurance”
level.
|
ITEM
10.
|
DIRECTORS, EXECUTIVE OFFICERS AND CORPORATE
GOVERNACE.
|
There is
hereby incorporated by reference the information under the captions “Election of
Directors,” “Section 16(a) Beneficial Ownership Reporting Compliance” and
“Report of the Audit Committee of the Board of Directors” in the Company’s
definitive Proxy Statement to be filed pursuant to Regulation 14A, which Proxy
Statement is expected to be filed with the Securities and Exchange Commission
within 120 days after the end of Registrant's fiscal year ended September 30,
2009.
|
ITEM
11.
|
EXECUTIVE
COMPENSATION.
|
There is
hereby incorporated by reference the information under the captions “Executive
Compensation,” “Compensation Discussion and Analysis” and
“Compensation and Management Development Committee Report” in the Company’s
definitive Proxy Statement to be filed pursuant to Regulation 14A, which Proxy
Statement is expected to be filed with the Securities and Exchange Commission
within 120 days after the end of Registrant's fiscal year ended September 30,
2009.
|
ITEM
12.
|
SECURITY OWNERSHIP OF CERTAIN BENEFICIAL OWNERS AND
MANAGEMENT AND RELATED STOCKHOLDER
MATTERS.
|
There is
hereby incorporated by reference the information under the caption “Principal
Shareholders” in the Company’s definitive Proxy Statement to be filed pursuant
to Regulation 14A, which Proxy Statement is expected to be filed with the
Securities and Exchange Commission within 120 days after the end of Registrant's
fiscal year ended September 30, 2009.
The
following table provides information as of September 30, 2009 with respect to
the shares of the Company’s Common Stock that may be issued under the Company’s
existing equity compensation plans.
| A | B | C | ||||||||||
|
Plan
Category
|
Number
of Securities to be Issued upon Exercise of Outstanding
Options
|
Weighted
Average Exercise Price of Outstanding Options
|
Number
of Securities Remaining Available for Future Issuance Under Equity
Compensation Plans (Excluding Securities Reflected in Column
A)
|
|||||||||
|
Equity
Compensation Plans Approved by Shareholders
|
||||||||||||
|
2003
Restated Employees’ Stock Incentive Plan
|
55,000 | $ | 8.64 | 384,810 | (1) | |||||||
|
Restated
1996 Employee Stock Purchase Plan
|
- | - | 389,056 | |||||||||
|
Equity
Compensation Plans Not Approved by Shareholders
|
- | - | - | |||||||||
|
Total
|
55,000 | $ | 8.64 | 773,866 | ||||||||
|
|
(1)
|
The
number of securities remaining may be used for issuance of either options
or restricted stock.
|
|
ITEM
13.
|
CERTAIN RELATIONSHIPS AND RELATED TRANSACTIONS, AND
DIRECTOR INDEPENDENCE.
|
On
December 1 and December 2, 2008, the Company purchased 23,325 shares of its
common stock from Michael L. Shannon, an independent director of the
Company. The shares were purchased under of the Company’s current
stock repurchase plan at a price of $14.45 per share on December 1, and $15.43
per share on December 2, the closing price of the Company’s common stock on each
day, respectively, on The NASDAQ Global Market, less $0.03 per
share. The total purchase price paid to Mr. Shannon was approximately
$350,000. Prior to the sale, Mr. Shannon advised the Company that the
transaction was involuntary under the terms of certain financings related to Mr.
Shannon's real estate investment activities. The purchase
transactions were previously approved by the Nominating and Corporate Governance
Committee and the Company’s Board of Directors.
There is
hereby incorporated by reference the information under the caption “Election of
Directors” in the Company’s definitive Proxy Statement to be filed pursuant to
Regulation 14A, which Proxy Statement is expected to be filed with the
Securities and Exchange Commission within 120 days after the end of Registrant's
fiscal year ended September 30, 2009.
|
ITEM
14.
|
PRINCIPAL ACCOUNTANT FEES AND
SERVICES.
|
There is
hereby incorporated by reference the information under the caption “Audit
Committee Report and Other Related Matters” in the Company’s definitive Proxy
Statement to be filed pursuant to Regulation 14A, which Proxy Statement is
expected to be filed with the Securities and Exchange Commission within 120 days
after the end of Registrant's fiscal year ended September 30, 2009.
|
ITEM
15.
|
EXHIBITS AND FINANCIAL STATEMENT
SCHEDULES.
|
PAGE
|
(a)
|
The
following documents are filed as part of this
report:
|
1. Financial
Statements:
|
Reference
is made to Part II, Item 8, for a listing of required financial statements
filed with this report
|
35
|
2. Financial
Statement Schedules:
|
|
Financial
statement schedules are omitted because they are not applicable or the
required information is included in the accompanying consolidated
financial statements or notes
thereto.
|
3. Exhibits:
(3) Articles
of Incorporation and Bylaws
|
|
(3.1)
|
Restated
Articles of Incorporation of Key Technology, Inc. (as of May 6, 2008)
(filed as Exhibit 3.1 to the Form 10-Q filed with the Securities and
Exchange Commission on May 9, 2008 and incorporated herein by
reference)
|
|
|
(3.2)
|
Registrant’s
Amended and Restated Bylaws (as amended through May 7, 2008) (filed as
Exhibit 3.2 to the Form 10-K filed with the Securities and Exchange
Commission on December 12, 2008 and incorporated herein by
reference)
|
(4) Instruments
defining the rights of security holders, including indentures
|
|
(4.1)
|
Registrant’s
Second Amended and Restated Rights Agreement, dated as of November 13,
2007, between the Registrant and American Stock Transfer & Trust
Company (filed as Exhibit 10.1 to the Form 8-K filed with the Securities
and Exchange Commission on November 19, 2007 and incorporated herein by
reference)
|
(10) Material
contracts
|
|
(10.1)
|
Credit
Agreement dated August 8, 2002 between Suplusco Holding B.V., Key
Technology B.V. and ABN AMRO Bank N.V. (filed as Exhibit 10.22 to the Form
10-Q filed with the Securities and Exchange Commission on February 14,
2003 and incorporated herein by
reference)
|
|
|
(10.2)*
|
Form
of Restricted Stock Bonus Agreement (Continued Employment Vesting) (filed
as Exhibit 10.1 to the Form 8-K filed with the Securities and Exchange
Commission on September 12, 2005 and incorporated herein by
reference)
|
|
|
(10.3)*
|
Form
of Restricted Stock Bonus Agreement (Performance Vesting) (filed as
Exhibit 10.2 to the Form 8-K filed with the Securities and Exchange
Commission on September 12, 2005 and incorporated herein by
reference)
|
|
|
(10.4)*
|
Form
of Restricted Stock Agreement (filed as Exhibit 10.2 to the Form 8-K filed
with the Securities and Exchange Commission on February 14, 2006 and
incorporated herein by reference)
|
|
|
(10.5)*
|
Restated
1996 Employee Stock Purchase Plan (including Amendment No. 1) (filed as
Exhibit 10.1 to the Form 10-Q filed with the Securities and Exchange
Commission on May 12, 2006 and incorporated herein by
reference)
|
|
|
(10.6)
|
Employment
Agreement effective September 25, 2006 between Registrant and David M.
Camp (filed as Exhibit 10.1 to the Form 8-K filed with the
Securities
|
|
|
and
Exchange Commission on September 26, 2006 and incorporated herein by
reference)
|
|
|
(10.7)*
|
2003
Restated Employees’ Stock Incentive Plan (as approved by the shareholders
of the Company on February 6, 2008) (filed as Exhibit 10.1 to the Form 8-K
filed with the Securities and Exchange Commission on April 28, 2008 and
incorporated herein by reference)
|
|
|
(10.8)
|
Loan
Agreement dated December 10, 2008 between Registrant and Bank of America,
N.A. (filed as Exhibit 10.1 to the Form 8-K filed with the Securities and
Exchange Commission on December 22, 2008 and incorporated herein by
reference)
|
|
|
(10.9)
|
Amendment
No. 1 to Loan Agreement dated February 16, 2009 between Registrant and
Bank of America, N.A.
|
|
|
(10.10)
|
Amendment
No. 2 to Loan Agreement dated September 30, 2009 between Registrant and
Bank of America, N.A. (filed as Exhibit 10.1 to the Form 8-K filed with
the Securities and Exchange Commission on October 9, 2009
and incorporated herein by
reference)
|
|
|
(10.11)*
|
Form
of Restricted Stock Bonus Agreement (Continued Employment
Vesting)
|
|
|
(10.12)*
|
Form
of Restricted Stock Bonus Agreement (Performance
Vesting)
|
|
|
(10.13)*
|
Form
of Restricted Stock Bonus Agreement (Three-Year Performance
Vesting)
|
|
|
(14)
|
Registrant’s
amended Code of Business Conduct and Ethics, dated November 19, 2008
(filed as Exhibit 14.1 to the Form 8-K filed with the Securities and
Exchange Commission on November 21, 2008 and incorporated herein by
reference)
|
|
|
(21)
|
List
of Subsidiaries
|
|
|
(23.1)
|
Consent
of Independent Registered Public Accounting
Firm
|
|
|
(31.1)
|
Certification
pursuant to Section 302 of the Sarbanes-Oxley Act of
2002
|
|
|
(31.2)
|
Certification
pursuant to Section 302 of the Sarbanes-Oxley Act of
2002
|
|
|
(32.1)
|
Certification
pursuant to 18 U.S.C. Section 1350 as adopted pursuant to Section 906 of
the Sarbanes-Oxley Act of 2002
|
|
|
(32.2)
|
Certification
pursuant to 18 U.S.C. Section 1350 as adopted pursuant to Section 906 of
the Sarbanes-Oxley Act of 2002
|
*
Management contract or compensatory plan or arrangement.
Pursuant
to the requirements of Section 13 or 15(d) of the Securities Exchange Act of
1934, the Registrant has duly caused this report to be signed on its behalf by
the undersigned, thereunto duly authorized.
KEY
TECHNOLOGY, INC.
|
By:
|
/s/ David
M. Camp
|
|||
|
David
M. Camp
|
||||
|
President
and Chief Executive Officer
|
|
By:
|
/s/ John
J. Ehren
|
|||
|
John
J. Ehren
|
||||
|
Senior
Vice President and Chief Financial Officer
(Principal
Financial Officer)
|
|
By:
|
/s/ James
R. Brausen
|
|||
|
James
R. Brausen
|
||||
|
Corporate
Controller
(Principal
Accounting Officer)
|
December
11, 2009
Pursuant
to the requirements of the Securities Exchange Act of 1934, this report has been
signed by the following persons on behalf of the Registrant and in the
capacities and on the dates indicated.
|
/s/ Charles
H. Stonecipher
|
December
11, 2009
|
|
|
Charles
H. Stonecipher, Chairman
|
||
|
/s/ John
E. Pelo
|
December
11, 2009
|
|
|
John
E. Pelo, Director
|
||
|
/s/ Richard
Lawrence
|
December
11, 2009
|
|
|
Richard
Lawrence, Director
|
||
|
/s/ Michael
L. Shannon
|
December
11, 2009
|
|
|
Michael
L. Shannon, Director
|
||
|
/s/ Donald
A. Washburn
|
December
11, 2009
|
|
|
Donald
A. Washburn, Director
|
||
|
/s/ David
M. Camp
|
December
11, 2009
|
|
|
David
M. Camp, Director, President and Chief Executive Officer
|
KEY
TECHNOLOGY, INC.
FORM
10-K
EXHIBIT
INDEX
NUMBER
|
10.9
|
Amendment
No. 1 to Loan Agreement dated February 16, 2009 between Registrant and
Bank of America, N.A.
|
|
10.11
|
Form
of Restricted Stock Bonus Agreement (Continued Employment
Vesting)
|
|
10.12
|
Form
of Restricted Stock Bonus Agreement (Performance
Vesting)
|
|
10.13
|
Form
of Restricted Stock Bonus Agreement (Three-Year Performance
Vesting)
|
|
21
|
List
of Subsidiaries
|
|
23.1
|
Consent
of Independent Registered Public Accounting Firm
|
|
31.1
|
Certification
pursuant to Section 302 of the Sarbanes-Oxley Act of
2002
|
|
31.2
|
Certification
pursuant to Section 302 of the Sarbanes-Oxley Act of
2002
|
|
32.1
|
Certification
pursuant to 18 U.S. C. Section 1350 as adopted pursuant to Section 906 of
the Sarbanes-Oxley Act of 2002
|
|
32.2
|
Certification
pursuant to 18 U.S. C. Section 1350 as adopted pursuant to Section 906 of
the Sarbanes-Oxley Act of 2002
|