Attached files
| file | filename |
|---|---|
| 8-K - 8-K - STR HOLDINGS, INC. | a09-35111_18k.htm |
|
|
Macquarie Wind & Solar: Getting Connected Conference December 10, 2009 |
|
|
This presentation contains forward-looking statements. These statements relate to future events or to future financial performance and involve known and unknown risks, uncertainties, and other factors that may cause our actual results, levels of activity, performance, or achievements to be materially different from any future results, levels of activity, performance, or achievements expressed or implied by these forward-looking statements. In some cases, you can identify forward-looking statements by the use of words such as “may,” “could,” “expect,” “intend,” “plan,” “seek,” “anticipate,” “believe,” “estimate,” “predict,” “potential,” or “continue” or the negative of these terms or other comparable terminology. You should not place undue reliance on forward-looking statements because they involve known and unknown risks, uncertainties and other factors that are, in some cases, beyond our control and that could materially affect actual results, levels of activity, performance, or achievements. Other factors that could materially affect actual results, levels of activity, performance or achievements can be found in STR Holdings’ filings with the U.S. Securities and Exchange Commission, which are available on the SEC website. If any of these risks or uncertainties materialize, or if our underlying assumptions prove to be incorrect, actual results may vary significantly from what we projected. Any forward-looking statement you see or hear during this presentation reflects our current views with respect to future events and is subject to these and other risks, uncertainties, and assumptions relating to our operations, results of operations, growth strategy, and liquidity. We assume no obligation to publicly update or revise these forward-looking statements for any reason, whether as a result of new information, future events, or otherwise. |
|
|
STR: Global Leader in Solar Leading supplier of encapsulant to the industry for both Crystalline and Thin Film Track record of near 100% customer retention Recognized for technology and innovation First to develop EVA Solar Encapsulant Flight to quality favors STR worldwide 2006 – 2008 revenue growth 101% CAGR Global manufacturing footprint Experienced management team |
|
|
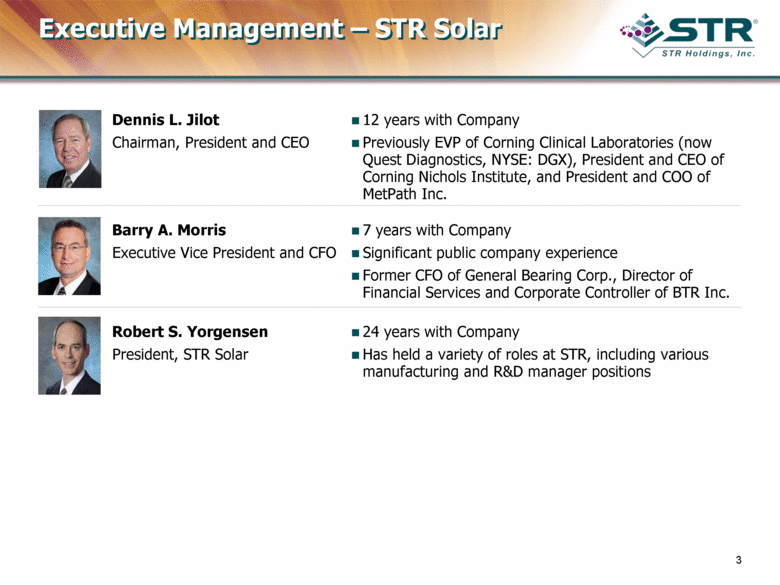
Executive Management – STR Solar Robert S. Yorgensen President, STR Solar 24 years with Company Has held a variety of roles at STR, including various manufacturing and R&D manager positions Barry A. Morris Executive Vice President and CFO 7 years with Company Significant public company experience Former CFO of General Bearing Corp., Director of Financial Services and Corporate Controller of BTR Inc. Dennis L. Jilot Chairman, President and CEO 12 years with Company Previously EVP of Corning Clinical Laboratories (now Quest Diagnostics, NYSE: DGX), President and CEO of Corning Nichols Institute, and President and COO of MetPath Inc. |
|
|
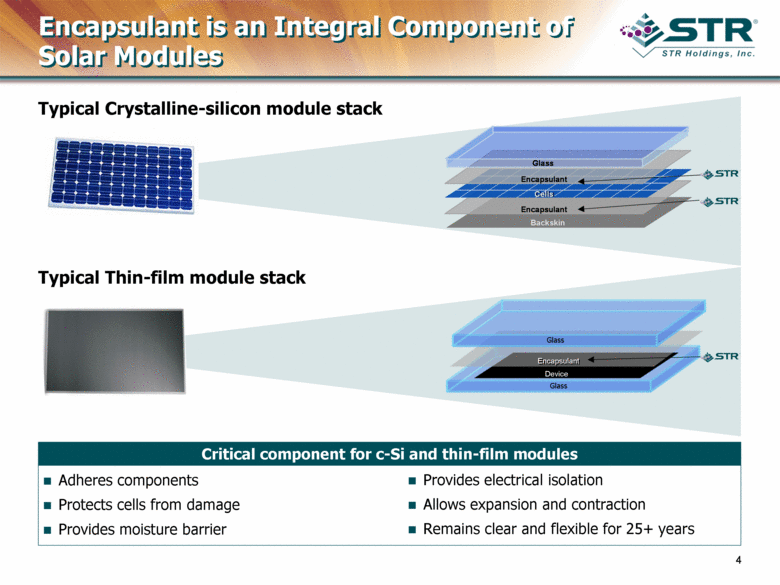
Encapsulant is an Integral Component of Solar Modules Glass Encapsulant Glass Provides electrical isolation Allows expansion and contraction Remains clear and flexible for 25+ years Critical component for c-Si and thin-film modules Adheres components Protects cells from damage Provides moisture barrier Typical Crystalline-silicon module stack Typical Thin-film module stack Device Backskin Encapsulant Encapsulant Cells Glass |
|
|
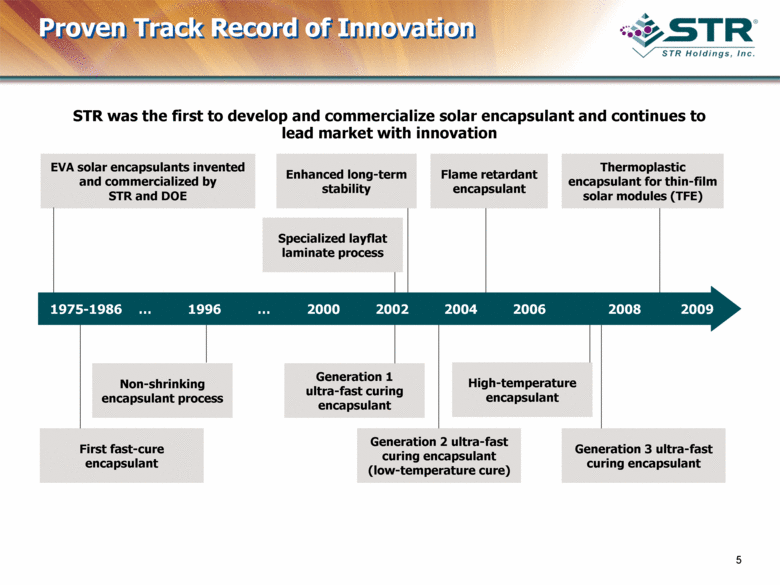
Proven Track Record of Innovation STR was the first to develop and commercialize solar encapsulant and continues to lead market with innovation Non-shrinking encapsulant process Enhanced long-term stability Specialized layflat laminate process Generation 2 ultra-fast curing encapsulant (low-temperature cure) Flame retardant encapsulant High-temperature encapsulant Thermoplastic encapsulant for thin-film solar modules (TFE) Generation 3 ultra-fast curing encapsulant EVA solar encapsulants invented and commercialized by STR and DOE 1975-1986 1996 2000 2002 2004 2006 2008 Generation 1 ultra-fast curing encapsulant 2009 First fast-cure encapsulant |
|
|
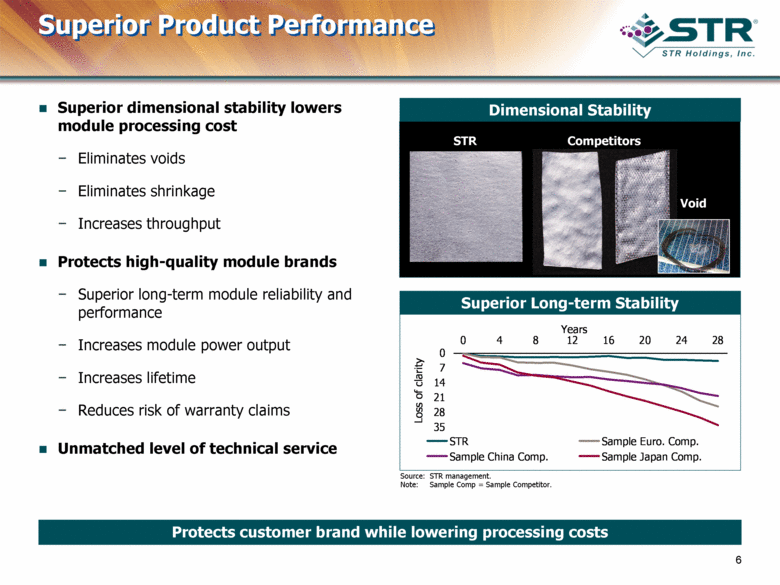
Dimensional Stability Superior Product Performance Superior dimensional stability lowers module processing cost Eliminates voids Eliminates shrinkage Increases throughput Protects high-quality module brands Superior long-term module reliability and performance Increases module power output Increases lifetime Reduces risk of warranty claims Unmatched level of technical service Protects customer brand while lowering processing costs Source: STR management. Note: Sample Comp = Sample Competitor. Superior Long-term Stability STR Competitors Void 0 7 14 21 28 35 0 4 8 12 16 20 24 28 Years Loss of clarity STR Sample Euro. Comp. Sample China Comp. Sample Japan Comp. |
|
|
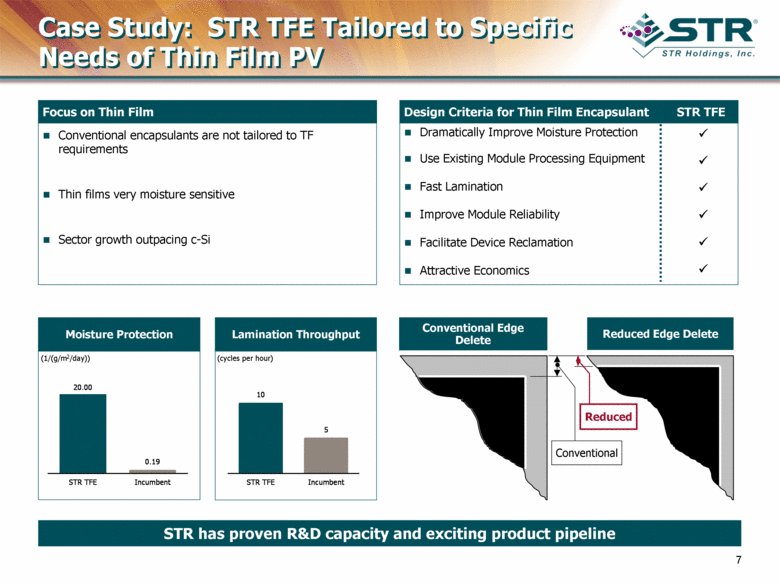
Case Study: STR TFE Tailored to Specific Needs of Thin Film PV Focus on Thin Film Conventional encapsulants are not tailored to TF requirements Thin films very moisture sensitive Sector growth outpacing c-Si STR has proven R&D capacity and exciting product pipeline Moisture Protection (1/(g/m2/day)) Lamination Throughput (cycles per hour) Reduced Conventional Conventional Edge Delete Reduced Edge Delete Design Criteria for Thin Film Encapsulant STR TFE Dramatically Improve Moisture Protection Use Existing Module Processing Equipment Fast Lamination Improve Module Reliability Facilitate Device Reclamation Attractive Economics 0.19 20.00 STR TFE Incumbent 5 10 STR TFE Incumbent |
|
|
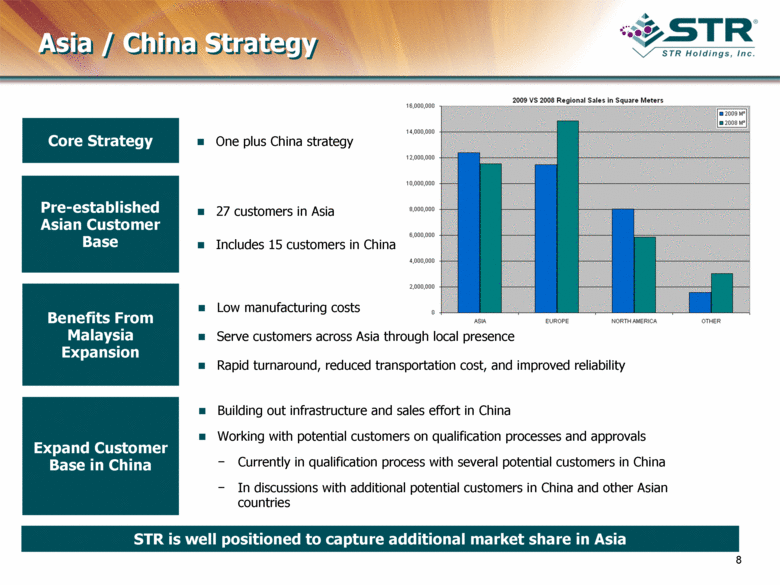
Asia / China Strategy STR is well positioned to capture additional market share in Asia One plus China strategy Building out infrastructure and sales effort in China Working with potential customers on qualification processes and approvals Currently in qualification process with several potential customers in China In discussions with additional potential customers in China and other Asian countries Core Strategy Expand Customer Base in China Benefits From Malaysia Expansion Low manufacturing costs Serve customers across Asia through local presence Rapid turnaround, reduced transportation cost, and improved reliability Pre-established Asian Customer Base 27 customers in Asia Includes 15 customers in China |
|
|
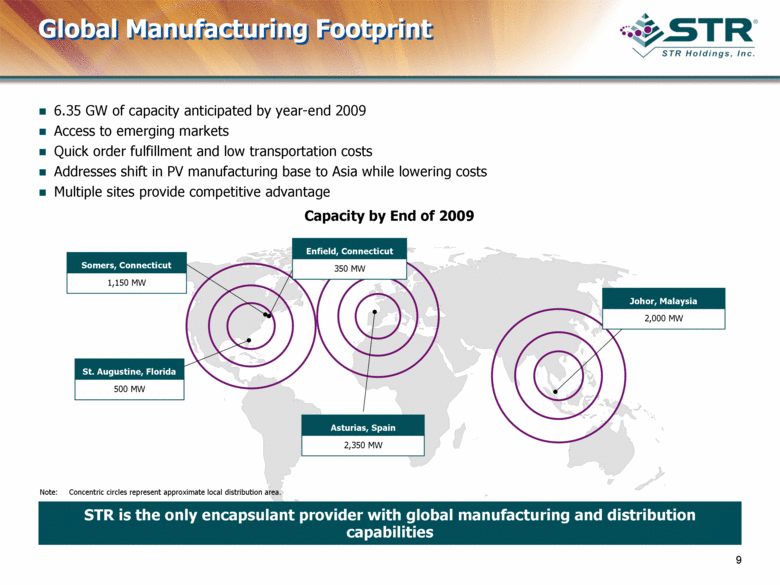
Global Manufacturing Footprint 2,350 MW Asturias, Spain 2,000 MW Johor, Malaysia 500 MW St. Augustine, Florida 350 MW Enfield, Connecticut 1,150 MW Somers, Connecticut Note: Concentric circles represent approximate local distribution area. 6.35 GW of capacity anticipated by year-end 2009 Access to emerging markets Quick order fulfillment and low transportation costs Addresses shift in PV manufacturing base to Asia while lowering costs Multiple sites provide competitive advantage STR is the only encapsulant provider with global manufacturing and distribution capabilities Capacity by End of 2009 |
|
|
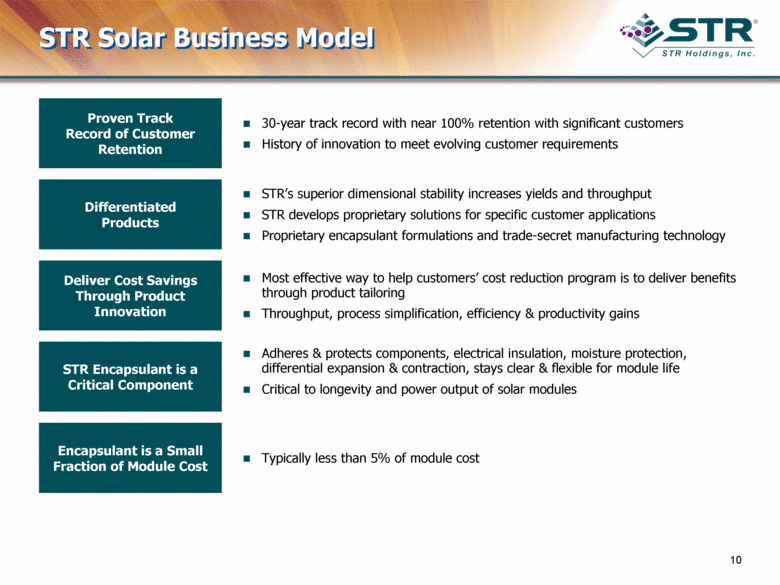
STR Solar Business Model Adheres & protects components, electrical insulation, moisture protection, differential expansion & contraction, stays clear & flexible for module life Critical to longevity and power output of solar modules STR Encapsulant is a Critical Component Encapsulant is a Small Fraction of Module Cost Typically less than 5% of module cost Deliver Cost Savings Through Product Innovation Most effective way to help customers’ cost reduction program is to deliver benefits through product tailoring Throughput, process simplification, efficiency & productivity gains Proven Track Record of Customer Retention 30-year track record with near 100% retention with significant customers History of innovation to meet evolving customer requirements Differentiated Products STR’s superior dimensional stability increases yields and throughput STR develops proprietary solutions for specific customer applications Proprietary encapsulant formulations and trade-secret manufacturing technology |
|
|
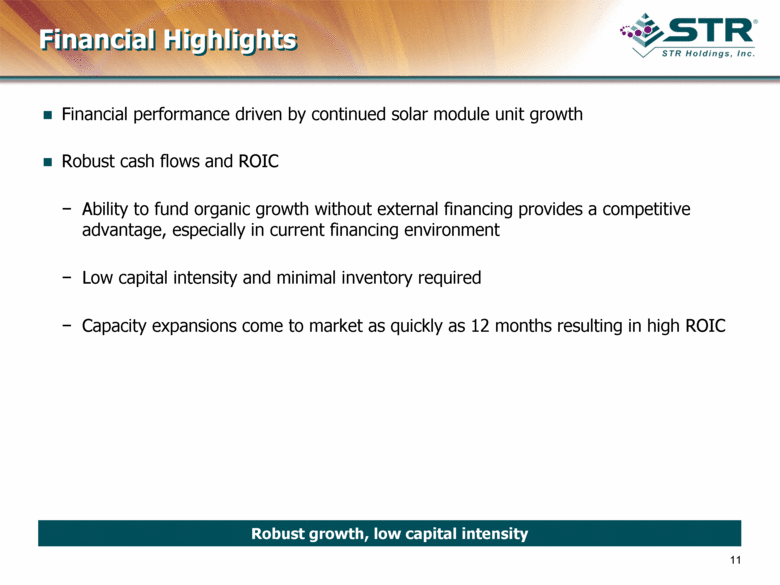
Financial Highlights Financial performance driven by continued solar module unit growth Robust cash flows and ROIC Ability to fund organic growth without external financing provides a competitive advantage, especially in current financing environment Low capital intensity and minimal inventory required Capacity expansions come to market as quickly as 12 months resulting in high ROIC Robust growth, low capital intensity |
|
|
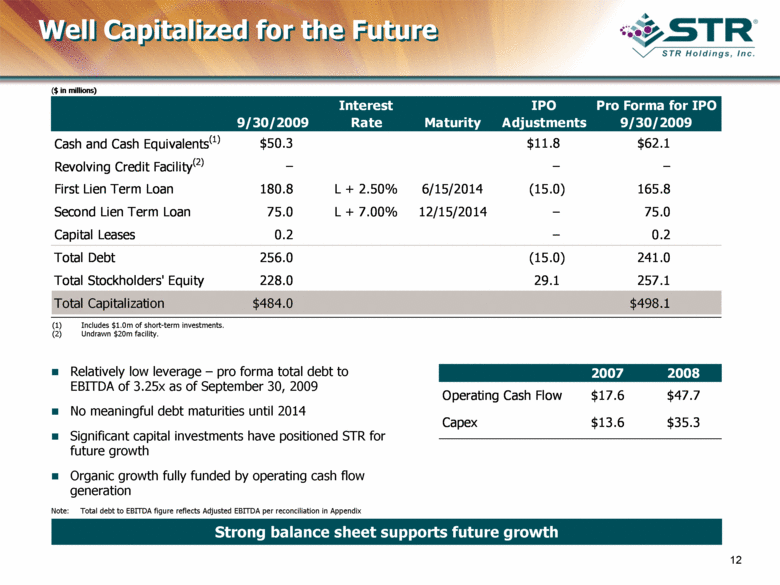
Well Capitalized for the Future (1) Includes $1.0m of short-term investments. (2) Undrawn $20m facility. Relatively low leverage – pro forma total debt to EBITDA of 3.25x as of September 30, 2009 No meaningful debt maturities until 2014 Significant capital investments have positioned STR for future growth Organic growth fully funded by operating cash flow generation ($ in millions) Strong balance sheet supports future growth Note: Total debt to EBITDA figure reflects Adjusted EBITDA per reconciliation in Appendix Interest IPO Pro Forma for IPO 9/30/2009 Rate Maturity Adjustments 9/30/2009 Cash and Cash Equivalents (1) $50.3 $11.8 $62.1 Revolving Credit Facility (2) – – – First Lien Term Loan 180.8 L + 2.50% 6/15/2014 (15.0) 165.8 Second Lien Term Loan 75.0 L + 7.00% 12/15/2014 – 75.0 Capital Leases 0.2 – 0.2 Total Debt 256.0 (15.0) 241.0 Total Stockholders' Equity 228.0 29.1 257.1 Total Capitalization $484.0 $498.1 2007 2008 Operating Cash Flow $17.6 $47.7 Capex $13.6 $35.3 |
|
|
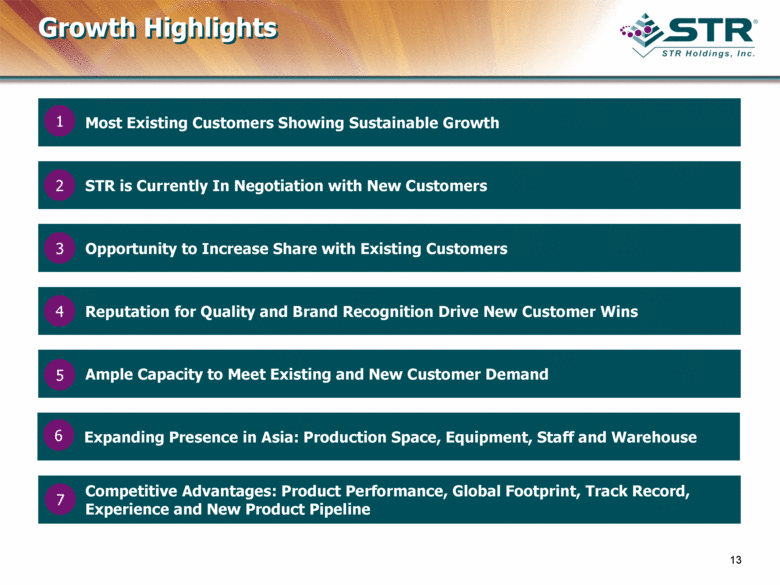
Growth Highlights Most Existing Customers Showing Sustainable Growth 1 Reputation for Quality and Brand Recognition Drive New Customer Wins 4 STR is Currently In Negotiation with New Customers 2 Ample Capacity to Meet Existing and New Customer Demand 5 Opportunity to Increase Share with Existing Customers 3 Expanding Presence in Asia: Production Space, Equipment, Staff and Warehouse 6 Competitive Advantages: Product Performance, Global Footprint, Track Record, Experience and New Product Pipeline 7 |
|
|
Appendix |
|
|
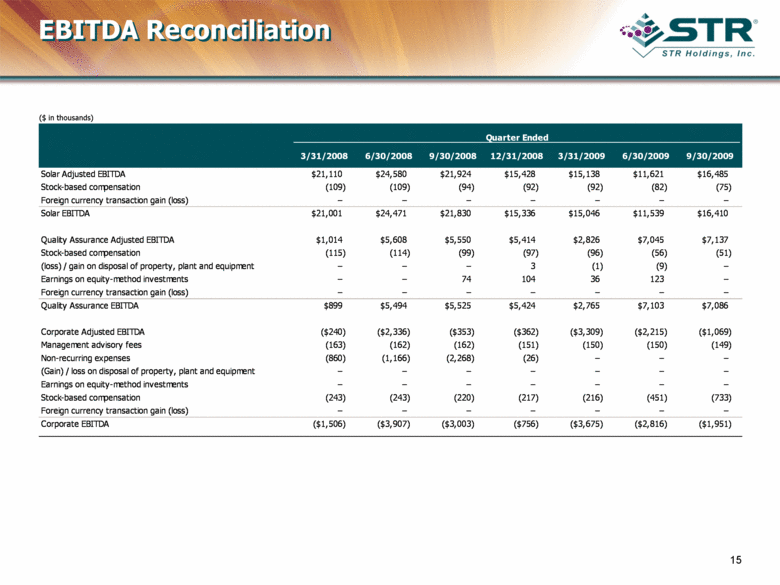
EBITDA Reconciliation ($ in thousands) Quarter Ended 3/31/2008 6/30/2008 9/30/2008 12/31/2008 3/31/2009 6/30/2009 9/30/2009 Solar Adjusted EBITDA $21,110 $24,580 $21,924 $15,428 $15,138 $11,621 $16,485 Stock-based compensation (109) (109) (94) (92) (92) (82) (75) Foreign currency transaction gain (loss) – – – – – – – Solar EBITDA $21,001 $24,471 $21,830 $15,336 $15,046 $11,539 $16,410 Quality Assurance Adjusted EBITDA $1,014 $5,608 $5,550 $5,414 $2,826 $7,045 $7,137 Stock-based compensation (115) (114) (99) (97) (96) (56) (51) (loss) / gain on disposal of property, plant and equipment – – – 3 (1) (9) – Earnings on equity-method investments – – 74 104 36 123 – Foreign currency transaction gain (loss) – – – – – – – Quality Assurance EBITDA $899 $5,494 $5,525 $5,424 $2,765 $7,103 $7,086 Corporate Adjusted EBITDA ($240) ($2,336) ($353) ($362) ($3,309) ($2,215) ($1,069) Management advisory fees (163) (162) (162) (151) (150) (150) (149) Non-recurring expenses (860) (1,166) (2,268) (26) – – – (Gain) / loss on disposal of property, plant and equipment – – – – – – – Earnings on equity-method investments – – – – – – – Stock-based compensation (243) (243) (220) (217) (216) (451) (733) Foreign currency transaction gain (loss) – – – – – – – Corporate EBITDA ($1,506) ($3,907) ($3,003) ($756) ($3,675) ($2,816) ($1,951) |

