Attached files
| file | filename |
|---|---|
| EX-12 - EX-12 - STR HOLDINGS, INC. | a2202541zex-12.htm |
| EX-21 - EX-21 - STR HOLDINGS, INC. | a2202541zex-21.htm |
| EX-23 - EX-23 - STR HOLDINGS, INC. | a2202541zex-23.htm |
| EX-32.1 - EX-32.1 - STR HOLDINGS, INC. | a2202541zex-32_1.htm |
| EX-31.2 - EX-31.2 - STR HOLDINGS, INC. | a2202541zex-31_2.htm |
| EX-32.2 - EX-32.2 - STR HOLDINGS, INC. | a2202541zex-32_2.htm |
| EX-31.1 - EX-31.1 - STR HOLDINGS, INC. | a2202541zex-31_1.htm |
| EX-10.29 - EX-10.29 - STR HOLDINGS, INC. | a2202541zex-10_29.htm |
Use these links to rapidly review the document
TABLE OF CONTENTS
PART IV
UNITED STATES
SECURITIES AND EXCHANGE COMMISSION
Washington, D.C. 20549
FORM 10-K
ý |
ANNUAL REPORT PURSUANT TO SECTION 13 OR 15(d) OF THE SECURITIES EXCHANGE ACT OF 1934 |
|
For the fiscal year ended December 31, 2010 |
||
OR |
||
o |
TRANSITION REPORT PURSUANT TO SECTION 13 OR 15(d) OF THE SECURITIES EXCHANGE ACT OF 1934 |
|
For the transition period from to . |
||
Commission file number 001-34529

STR Holdings, Inc.
(Exact name of registrant as specified in its charter)
| Delaware (State or other jurisdiction of incorporation or organization) |
27-1023344 (I.R.S. Employer Identification No.) |
|
1699 King Street, Enfield, Connecticut (Address of principal executive offices) |
06082 (Zip code) |
Registrant's telephone number, including area code: (860) 758-7300
Securities registered pursuant to Section 12(b) of the Act:
| Title of each class | Name of each exchange on which registered | |
|---|---|---|
| Common Stock $0.01 par value per share | New York Stock Exchange |
Securities Registered Pursuant to Section 12(g) of the Act: None
Indicate by check mark if the registrant is a well-known seasoned issuer, as defined in Rule 405 of the Securities Act. YES ý NO o
Indicate by check mark if the registrant is not required to file reports pursuant to Section 13 or Section 15(d) of the Act. YES o NO ý
Indicate by check mark whether the registrant (1) has filed all reports required to be filed by Section 13 or 15(d) of the Securities Exchange Act of 1934 during the preceding 12 months (or for such shorter period that the registrant was required to file such reports), and (2) has been subject to such filing requirements for the past 90 days. YES ý NO o
Indicate by check mark whether the registrant has submitted electronically and posted on its corporate Web site, if any, every Interactive Data File required to be submitted and posted pursuant to Rule 405 of Regulation S-T (§232.405 of this chapter) during the preceding 12 months (or for such shorter period that the registrant was required to submit and post such files). YES o NO o
Indicate by check mark if disclosure of delinquent filers pursuant to Item 405 of Regulation S-K (§229.405 of this chapter) is not contained herein, and will not be contained, to the best of registrant's knowledge, in definitive proxy or information statements incorporated by reference in Part III of this Form 10-K or any amendment to this Form 10-K. ý
Indicate by check mark whether the registrant is a large accelerated filer, an accelerated filer, a non-accelerated filer, or a smaller reporting company. See the definitions of "large accelerated filer," "accelerated filer" and "smaller reporting company" in Rule 12b-2 of the Exchange Act.
| Large accelerated filer o | Accelerated filer ý | Non-accelerated filer o (Do not check if a smaller reporting company) |
Smaller reporting company o |
Indicate by check mark whether the registrant is a shell company (as defined in Rule 12b-2 of the Act). YES o NO ý
The aggregate market value of the registrant's voting and non-voting common equity held by non-affiliates of the registrant as of June 30, 2010 was $518,939,408 based on the price of the last reported sale on the New York Stock Exchange on that date.
On March 7, 2011, the registrant had 41,507,247 outstanding shares of Common Stock, $0.01 par value per share.
DOCUMENTS INCORPORATED BY REFERENCE:
Portions of the registrant's Proxy Statement for the 2011 Annual Meeting of Stockholders, which will be filed by the registrant on or prior to 120 days following the end of the registrant's fiscal year ended December 31, 2010, are incorporated by reference into Part III of this Annual Report on Form 10-K.
Overview
STR Holdings, Inc. and its subsidiaries ("we", "us","our" or the "Company") conduct business in two segments.
We are a leading global provider of encapsulants to the solar module industry. The encapsulant is a critical component used in solar modules. We were the first to develop the original ethylene-vinyl-acetate ("EVA") encapsulants used in commercial solar module manufacturing in the 1970s in conjunction with the Jet Propulsion Laboratory of the California Institute of Technology under a NASA contract for the U.S. Energy Research and Development Administration, which later became known as the U.S. Department of Energy. We supply encapsulants to many of the major solar module manufacturers and believe we were the primary supplier of encapsulants to the majority of our top 10 customers in 2010. We believe this is due to our superior product performance, global manufacturing base, customer service and technical support. Our encapsulants are used in both crystalline silicon and thin-film solar modules.
Our Quality Assurance business is a leader in the consumer products quality assurance market. We believe our Quality Assurance business represents the only global testing services provider exclusively focused on the consumer products market. Our Quality Assurance business provides inspection, testing, auditing and consulting services that enable retailers and manufacturers to determine whether products and facilities meet applicable safety, regulatory, quality, performance, social and ethical standards.
Solar Energy Overview
Solar energy has emerged as one of the most rapidly growing renewable energy sources. A number of different technologies have been developed to harness solar energy. The most prevalent technology is the use of inter-connected photovoltaic ("PV") cells to generate electricity directly from sunlight. Solar energy has many advantages over other existing renewable energy sources and traditional non-renewable energy sources relative to environmental impact, delivery risk, distributed nature of generation and matching of peak generation with demand.
PV systems have been used to produce electricity for several decades. However, technological advances during the past decade and rising costs of electricity, combined with the recognition of the advantages of solar power as a renewable energy source and the availability of government subsidies and incentives for solar power, have led to solar power becoming one of the fastest growing renewable energy technologies.
According to Solarbuzz, an independent solar energy research firm, solar power industry revenues were approximately $82 billion in 2010 up from approximately $4 billion in 2003.
One of the key drivers of the growing demand for solar power is government incentive programs for the development of solar energy, which make solar energy more cost competitive. In recent years, the largest growth in the demand for solar energy has been in the European Union where government incentives are typically in the form of feed-in tariffs in which utility companies are legally obligated to purchase electricity from renewable energy sources at a guaranteed rate that is higher than the standard grid electricity price. However, some European countries are gradually reducing these incentives. For example, in 2008, Spain enacted new legislation that capped the incentive rate at 500 megawatts and Germany had an out of cycle reduction mainly in response to the reduced cost of solar panels and internal rate of returns in excess of what is required to stimulate growth. Germany and Italy enacted additional reductions that took place in the second half of 2010. In 2011, Germany also enacted further legislation to accelerate the annual year-end feed-in-tariff reduction to July 1, 2011
3
for roof-top systems and September 1, 2011 for ground-mount projects. In the United States, government incentive programs are generally in the form of tax credits, loan guarantees and grants. Also, many states, including California, have enacted renewable portfolio standards that require utilities to increase their production of renewable energy sources including solar PV. The United States, China and a number of other countries have recently enacted new legislation supporting solar energy. Government incentive programs have developed in response to the increasing scarcity and rising prices of conventional energy sources, the desire for energy security/energy independence to counter perceived geopolitical supply risks surrounding fossil fuels, increasing concerns about environmental pollution and global warming from fossil fuels and the consequent tightening of emission controls and changing consumer preferences toward renewable energy sources.
Despite the favorable conditions for the adoption of solar electricity generation, solar energy continues to represent only a very small fraction of the world's energy output.
Solar Energy Systems
Solar electricity is primarily generated by PV systems that are comprised of solar modules, mounting structures and electrical components. PV systems are either grid-connected or off-grid. Grid-connected systems are connected to the electricity transmission and distribution grid and feed solar electricity into the end-user's electrical system and/or the grid. Such systems are commonly mounted on the rooftops of buildings, integrated into building facades or installed on the ground using support structures and range in size from 2-3 kilowatts to multiple megawatts. Off-grid PV systems are typically much smaller and are frequently used in remote areas where they may be the only source of electricity for the end-user.
Solar Modules
PV cells are semiconductor devices that act as converters, taking sunlight and converting it directly into electricity by a process known as the photovoltaic effect. A solar module is an assembly of PV cells that are electrically inter-connected, laminated and framed in a durable and weatherproof package.
There are two primary commercialized categories of solar cells: crystalline silicon and thin-film. PV devices can be manufactured using different semiconductor materials, including mono- and poly-crystalline silicon for silicon cells, and amorphous silicon, gallium arsenide, copper indium gallium selenide and cadmium telluride for thin-film cells. In 2010, approximately 86% of PV cell production used crystalline silicon-based technology. However, due to lower production costs, it is expected that thin-film modules will account for an increasing percentage of PV cell production. Solarbuzz forecasts that the thin-film share will increase from approximately 14% in 2010 to roughly 24% of total PV cell production by 2015 in its "Green World Scenario," which we believe represents the most appropriate of three forecast scenarios published by Solarbuzz because it balances further growth resulting from increased development of governmental incentive programs with measured growth in industry production capacity.
Encapsulants
Regardless of the technology used to create solar energy from a PV system, the core component of the solar cell is the semiconductor circuit. To protect and preserve the embedded semiconductor circuit, solar module manufacturers typically use an encapsulant. Encapsulants are critical to the proper functioning of solar modules, as they protect cells from the elements, bond the multiple layers of a module together, and provide electrical insulation. Encapsulants must incorporate high optical transparency, stability at high temperatures and high levels of ultraviolet radiation, good adhesion to different module materials, adequate mechanical compliance to accommodate stresses induced by differences in thermal expansion coefficients between glass and cells, and good dielectric properties
4
(electrical insulation). Even slight deteriorations of any of these properties of the encapsulant over time could significantly impair the electrical output of the solar module, which is of critical importance in the solar industry where solar module manufacturers typically provide 20-to 25-year warranties for their products.
Over the years, various encapsulant materials have been used in solar modules, including EVA, polyvinyl butyral ("PVB") and poly dimethyl siloxane or silicone. We use EVA to make all of our encapsulant products. EVA is modified with additives to increase stability and make the encapsulant suitable for use in long-term outdoor applications, such as solar modules.
During the solar module assembly process, the encapsulation process is typically accomplished by vacuum lamination, wherein a "pre-lam" stack (as depicted in the diagram below) is fashioned into a singular part comprising multiple layers. Thin sheets of EVA are inserted between the PV cells and typically the top and rear surfaces. Heating the "sandwich" then causes the EVA melt and then to cure, or crosslink, thus bonding the module into one piece. This step occurs towards the end of the manufacturing process and is critical to the entire solar module as there is only one opportunity to laminate correctly.
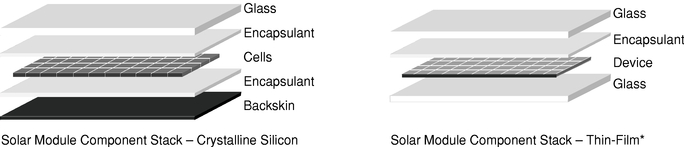
- *
- Thin-film graphic is not representative of all thin-film modules, which can vary significantly in structure.
Shrinkage or inadequate adhesion can occur during the manufacturing process and may result in voids or holes in the encapsulant, during module lamination, which are considered defects and cause for rejection of the entire panel. Due to direct exposure to the elements, the encapsulant is susceptible to several performance failures that can jeopardize the integrity and performance of the entire solar module and lead to significant warranty costs for solar module manufacturers. The most significant failures include:
- •
- Browning—the propensity of an encapsulant to "brown" after long-term exposure to ultraviolet
("UV") light leading to a permanent loss of transparency. As the encapsulant loses its transparency, the entire solar module loses its ability to convert sunlight into electricity.
- •
- Module delamination—the loss of adhesion between the encapsulant and other module layers. Delamination in the field can occur in cases where the encapsulant was improperly cured or where incompatibilities between the encapsulant and other module components exist. Most of the delamination observed in the field has occurred at the interface between the encapsulant and the front surface of the solar cells in the module. Delamination is more frequent and more severe in hot and humid climates, sometimes occurring after less than five years of exposure. Delamination first causes a performance loss due to optical de-coupling of the encapsulant from the cells. Of greater concern from a module lifetime perspective is the likelihood that the void resulting from the delamination will provide a preferential location for moisture accumulation, greatly increasing the possibility of corrosion failures in metallic contacts.
Despite the critical nature of encapsulant to solar cell applications, the encapsulant represents a small percentage of the overall manufacturing cost of the total solar module.
5
We typically sell our encapsulants in square meters. However, because the solar industry's standard measurement for production volume and capacity is in watts, megawatts ("MW") or gigawatts ("GW"), we convert our capacity and production volume from square meters to approximate MW depending on the applicable conversion efficiencies that are specific to our customers and whether the module is thin-film or crystalline silicon. The conversion ranges from a rate of 10,100 to 15,500 square meters of encapsulant per MW. This rate is based on our calculations using publicly available information, our industry experience and assumptions that our management believes to be appropriate and reasonable. Certain production capacity and market metrics included in this Annual Report on Form 10-K are based on these calculations. Our calculations may not be accurate, and we may change the methodology of our calculations in the future as new information becomes available. In that case, period to period comparisons of such metrics may not be meaningful.
Financial Information About Our Segments and Geographic Areas
Financial information about our segments and geographic areas is included in Item 7, Management's Discussion and Analysis of Financial Condition and Results of Operations, and Note 17, Reportable Segments and Geographical Information, of the Notes to Consolidated Financial Statements, included in Item 8, Financial Statements and Supplementary Data, of this Annual Report on Form 10-K.
Our Solar Business
We are a leading global provider of encapsulants to the solar module industry. The encapsulant is a critical component used in solar modules. We were the first to develop the original EVA encapsulants used in commercial solar module manufacturing in the 1970s in conjunction with the Jet Propulsion Laboratory of the California Institute of Technology under a NASA contract for the U.S. Energy Research and Development Administration, which later became known as the U.S. Department of Energy. We have no ongoing relationships with any of these agencies. We have sold our EVA encapsulants commercially since the late 1970s. We have continually improved our encapsulants and we have developed many significant solar encapsulant innovations since we first commercialized our encapsulants, including encapsulants that maintain their dimensional stability and ultra-fast curing formulations. Our encapsulants are used in both of the prevailing solar panel technologies, crystalline silicon and thin-film, and are valued by our customers because they maintain their size and shape throughout the solar module manufacturing process, have fast curing times and have demonstrated long-term stability. These attributes are critical to solar module manufacturers, which typically provide 20- to 25-year warranties of the performance of their solar modules and continually seek to maximize manufacturing yield and optimize efficiency. Despite the critical nature of encapsulant to solar cell applications, the encapsulant represents a small percentage of the overall manufacturing cost of the total solar module.
Our PhotoCap® products consist primarily of EVA, which is modified with additives and put through our proprietary manufacturing process to increase product stability and make the encapsulant suitable for use in extreme, long-term outdoor applications. The inclusion of specific additives results in a limited shelf life before our encapsulants must be integrated into a solar module, making long-term stocking impractical. Encapsulants are generally made-to-order to customer specifications for use in their solar module manufacturing process.
Our Competitive Strengths
We believe that our Solar business possesses a number of key competitive strengths, including:
- •
- Primary Supplier to Leading Module Manufacturers. Since our encapsulants are designed into our customers' manufacturing process, offer long-term stability and substantial manufacturing
6
- •
- Superior Product
Technology. Our encapsulants play a critical role in permanently bonding and protecting sensitive solar module components while helping
to maintain solar module performance for extended periods under extreme environmental conditions. Our products, some of which have been in the field for over 30 years, are designed to provide
superior long-term clarity, which is critical to helping our customers meet their advertised and guaranteed performance levels throughout the solar module life. Our encapsulants are
manufactured to be non-shrinking so that they maintain their size and shape throughout the solar module manufacturing process, thereby reducing manufacturing defects. In addition to
providing dimensional stability, our highly engineered ultra-fast curing encapsulants provide for more rapid and efficient solar module manufacturing, enabling our customers to achieve
higher throughput rates and reduce their production costs. We believe our customers recognize the value of our products because they are able to avoid manufacturing defects on the factory floor and
the warranty costs associated with quality issues in installed panels and our products assist them in achieving high throughput and yield in their manufacturing processes.
- •
- History of
Innovation. We have a long history of innovation. We, in conjunction with the predecessor to the U.S. Department of Energy, utilized our
experience and technical expertise in the field of plastics to invent the original EVA encapsulant formulations used in commercial solar module manufacturing. In addition, we have developed many
significant encapsulant innovations since we first introduced our encapsulants commercially in the late 1970s. Our key innovations include:
- •
- non-shrinking encapsulants that provide superior dimensional stability;
- •
- ultra-fast curing encapsulants;
- •
- lay-flat laminates that increase production efficiency for solar module manufacturers;
- •
- flame-retardant encapsulants; and
- •
- enhanced long-term encapsulant clarity and stability.
- •
- Global Manufacturing and Distribution Base. We have invested heavily in developing our global production and distribution capacity through the acquisition and construction of new plants, by increasing the number of our production lines and by upgrading our manufacturing equipment to meet our customers' needs. We currently have five operational manufacturing plants located in the United States, Spain and Malaysia, with total annual global capacity of approximately 7.5 GW as of December 31, 2010. We believe we are the only encapsulant provider with manufacturing and distribution capabilities in North America, Europe and Asia, which provides
efficiencies, and are a small part of the overall cost of the solar module, we believe our customers will continue to be reluctant to switch to other encapsulant suppliers. We believe we were the primary encapsulant supplier to the majority of our top 10 customers in 2010, which include many of the fastest growing solar module manufacturers worldwide. As our customers look to secure materials or access to our production capacity to support their module production, we have recently entered into, or are in negotiations to enter into, contracts that may include periods of exclusivity and/or minimum purchase requirements. Although such contracts provide for the sale of encapsulants at lower prices than our shorter-term arrangements, they will provide greater predictability of demand. As of December 31, 2010, we had contracts with six of our top ten customers. We supply encapsulants to both crystalline silicon and thin-film solar module manufacturers. We believe we are well positioned to grow with the leading solar module manufacturers in the rapidly expanding solar module industry. We believe that our customers select our encapsulants because of their high quality and superior performance, our ability to meet their delivery requirements and our customer service and technical support.
7
- •
- Technical and Management Expertise. Our senior management team includes seasoned veterans with diverse business experiences who provide a broad range of perspectives and have enabled us to proactively manage our rapid organic growth, including the substantial expansion of our manufacturing operations. Our Vice President and STR Solar's President, Robert S. Yorgensen, has been with us for 25 years. During his tenure, Mr. Yorgensen has played a critical role in the technical development of our encapsulant products and has overseen the development of our major encapsulant innovations. Our senior management team, engineers and plant managers are also critical to the success of our product development efforts and maintaining the high quality of our products and our superior customer service.
us with a significant competitive advantage. Our multiple locations allow us to better meet the delivery requirements of our customers and to reduce shipping costs. In addition, our multiple locations provide us with additional manufacturing space to allow us to increase capacity to meet evolving customer needs, reduce risks relating to any production disruptions at a single facility and provide superior customer service in the local language and in the local time zone.
Our Growth Strategy
Our objective is to enhance our position as a leading global provider of encapsulants to solar module manufacturers. Our strategies to meet that objective are:
- •
- Leverage Global Infrastructure. Our manufacturing facilities are designed to provide the ability to expand our capacity to meet customer demand. To meet anticipated future growth in demand in the solar module market and increase our market share, we plan to continue to increase capacity by adding new production lines at our existing facilities and opening new facilities. In 2010, through the addition of new production lines and engineering and manufacturing process improvements that increased the capacity of our existing production lines by approximately 20%, our total global capacity increased to approximately 7.5 GW as of December 31, 2010. At the end of 2008, we completed the construction of a new manufacturing facility in Malaysia, which had initially been designed for up to 2.0 GW. The Malaysian facility currently has 2.4 GW of production capacity. We have also ordered an additional 1.2 GW of annual production capacity that is expected to become operational in the third quarter of 2011 in Malaysia. In addition, we are in the process of increasing the size of our Malaysia facility by the end of the first quarter of 2011 to provide for total capacity of up to approximately 5.0 GW. We believe that our Malaysian plant has enhanced our competitive position in various Asian markets by allowing us to take advantage of shorter shipping times and lower logistics costs.
In December 2010, we acquired a 275,000 square foot manufacturing facility in East Windsor, Connecticut. This facility will provide us needed space for capacity to meet future demand and enable us to consolidate our Connecticut-based Solar operations. We expect the transition of manufacturing operations to occur during 2011. In addition, we have ordered an additional 1.2 GW of production capacity to be installed in the East Windsor facility during the third quarter of 2011.
We expect our global production capacity to increase to approximately 11.0 GW by the end of 2011. An increase in capacity allows us to produce and sell more encapsulants and should permit us to decrease our manufacturing costs per unit by leveraging our global management, manufacturing and distribution base. It normally takes about one year for one of our production lines to become operational. As such, our 2012 expansion plans will require capital outlays in 2011, which we believe we have sufficient liquidity to fund.
8
- •
- Continue Product Innovation. Throughout the history of our Solar business, we have continued to innovate our encapsulant technologies. We intend to leverage our technical experience and the expertise derived from our greater than 30 years of innovation to continue to develop new products and technologies to meet evolving customer needs and to maintain and enhance our competitive position. For example, we began commercialization during 2010 of our new "Generation 3" fast-cure formulation that can double laminator throughput. We believe this innovative product provides a strong value proposition to our customers by increasing their manufacturing throughput, improving yields and reducing their overall cost of manufacturing. Also during 2010, we hired a Chief Technology Officer to oversee our Solar business's research and development and technical service functions with the intent of accelerating our development of next generation encapsulant technology and creating a pipeline of innovative products.
- •
- Asia Growth Strategy. Our strategy for growing our Asia business is called 1 + China Growth Strategy. Our plant in Malaysia represented the beginning stage of the execution of this strategy utilizing Malaysia as a conduit to Asia. We provide encapsulants to many of the leading solar module manufacturers worldwide and intend to continue to seek new customer relationships. During 2009, global solar demand shifted as module manufacturers located in Asia, particularly in China, obtained market share from European competitors. Also, many Asian governments announced solar incentive programs in 2009 to increase the demand for solar energy in their respective countries, such as the Golden Sun and Building Integrated Photovoltaic Programs in China. Based on these two emerging market patterns that continued in 2010, we are actively seeking to increase our market share in the Asia-Pacific region.
During 2011, we plan to increase our investments in research and development, including the addition of technical personnel and research scientists. Our East Windsor, Connecticut facility will house a 20,000 square foot, state-of-the art research and development laboratory. Overall, we expect our 2011 research and development capital investment to increase by approximately $2.0 million to $3.0 million.
- •
- Further Reduce Manufacturing Costs. We continuously seek to improve our competitive position by reducing our manufacturing costs, and we have identified a number of cost reduction opportunities. For example, we have made modifications to our production process to achieve a 20% increase in throughput with minimal additional capital investment. This improvement will
We are focused on increasing our participation in the Asian market through our Malaysian facility. The strategic location of this plant also serves as an advantageous gateway to other parts of Asia besides China, including South Korea, Japan, India and Taiwan. We have also expanded our local sales team, obtained local market intelligence and seeded the Asian market with our product. Also, many of the Asia module manufacturers have announced expansion plans with the proposed construction of plants in North America. We believe we will also obtain market share with these customers as they penetrate North America due to our strong U.S. manufacturing base.
We have begun product qualification with many of these potential customers, which is a process that can take over a year, and anticipate adding some of them as customers during 2011.
We promoted Bernardo E. Alvarez to the position of Director of Business Development—STR Solar for the People's Republic of China. Mr. Alvarez previously served as General Manager of our Asturias, Spain facility, since its inception in 2002 and was instrumental in its start-up, development and expansion.
We are evaluating the establishment of production capability in China that may include the construction of a plant. If we elect to construct a manufacturing facility, we anticipate that our additional capital outlays in 2011 and 2012 could range from $20 million to $25 million.
9
generate additional fixed cost absorption once that level of capacity is utilized. We are also in the process of developing an encapsulant that eliminates the use of a paper liner, which represents the second largest material-related cost of our encapsulants. During 2010, we experienced significant raw material cost inflation, primarily related to EVA resin which accounts for approximately 50% to 55% of our cost of sales. We expect this inflationary trend to continue. As such, we continually try to identify and qualify additional suppliers to improve our negotiating position and lower our raw material costs. Looking forward, we expect to continue to reduce our cost structure via improved fixed cost absorption associated with the leverage of future sales volume growth, optimize our global manufacturing and distribution footprint to reduce delivery and other logistical costs, reduce scrap rates and improve raw material utilization.
Our Solar Products
We have 12 commercial encapsulant formulations. We develop our formulations internally and work in conjunction with our customers to meet their varying requirements and draw on our considerable accumulated experience. Our encapsulant formulations offer a range of properties and processing attributes, including various curing times and temperatures that align with the requirements of our customers' lamination processes and module constructions. Our formulations can be used in both crystalline silicon and thin-film modules.
Our Solar Markets and Customers
Our customers are solar module manufacturers located in the United States, Europe and Asia. Our largest customers include manufacturers of both crystalline silicon and thin-film modules and include many of the world's largest solar module manufacturers. In 2010, we believe we were the primary supplier of encapsulants to the majority of our top 10 customers. First Solar, Inc. ("First Solar") and Suntech Power Holdings Co. Ltd. ("Suntech"), each of which accounted for more than 10% of our Solar net sales, together accounted for 27.8% of our Solar net sales for the year ended December 31, 2010. Sales to First Solar accounted for 27.1% and 19.1% of our Solar net sales in the years 2009 and 2008, respectively. Our top five customers in our Solar segment accounted for approximately 43.2%, 55.0% and 47.0% of our Solar net sales in 2010, 2009 and 2008, respectively.
We typically sell our encapsulants on a purchase order basis or through one year supply contracts that specify prices and delivery parameters, but can be canceled or postponed prior to production. In the past couple of years, we have been executing on a strategy of entering into formal contractual relationships. These contracts provide for better operational and capital efficiency as well as improved manufacturing visibility, allowing us to better serve the needs of our growing customers. We currently have contracts with six of our largest customers. In addition, we provide technical support to our customers and work with our customers when they are qualifying solar modules that utilize our products, which can take from two months to over a year. Historically, our sales strategy has focused on developing long-term relationships with solar module manufacturers and working with them during their product development efforts. We intend to expand our marketing and sales efforts by increasing the resources in our global sales organization. We also plan to use independent sales consultants in relation to our Asian growth strategy.
Our Solar Operations
Facilities and Equipment
We currently have five operational production facilities that are located in Enfield, Connecticut; Somers, Connecticut; St. Augustine, Florida; Asturias, Spain; and Johor, Malaysia. In December 2010, we acquired a 275,000 square foot manufacturing facility in East Windsor, Connecticut. This facility will
10
provide us needed space for capacity to meet future demand and enable us to consolidate our Connecticut-based Solar operations. We expect the build-out of the facility and transition of manufacturing operations to occur during 2011.
We currently have worldwide total annual production capacity of 7.5 GW. We expect our global production capacity to increase to approximately 11.0 GW by the end of 2011. We convert our capacity and production volume from square meters to MW depending on the applicable conversion efficiencies that are specific to our customers and whether the module is thin-film or crystalline silicon. The conversion ranges from a rate of 10,100 to 15,500 square meters of encapsulant per MW. This rate is based on our calculations using publicly available information, our industry experience and assumptions that our management believes to be appropriate and reasonable.
Our production lines incorporate our proprietary technology and processes. We rely on third-party equipment manufacturers to produce our manufacturing lines to our specifications, which we then further customize in-house. The majority of our production lines are interchangeable by having the capability to produce our 12 EVA formulations and can be used in any of our facilities. As such, this provides us with flexibility in meeting shifting trends in global module demand.
Encapsulant Production Process
Our production process typically begins by mixing EVA pellets with several additives to give the encapsulant its desired properties. The mixture is then melted, homogenized, pressurized and forced through a die to create an "EVA curtain," forming a continuous encapsulant sheet. The sheet then progresses to downstream equipment in a proprietary process, is wound into rolls with paper liner, slit to the desired width and packaged for shipment to customers.
Our manufacturing quality program is ISO 9000 certified. We have a high level of automation at each of our facilities that includes real-time computerized monitoring of the process. Such automation provides consistency across our facilities so that with few exceptions, we can typically manufacture customer orders at any of our locations. In addition, our inventory monitoring system allows us to efficiently plan our production schedule by location.
We test our products in real-time and at a high frequency after production. Each of our manufacturing facilities possesses a quality department that follow our global quality assurance program and has a mandate to discard products that do not meet required standards.
Raw and Other Materials
Resin and paper liner are the two primary materials used in our process, with resin accounting for more than half of our direct manufacturing costs. A number of additives as well as packaging materials represent the remainder of our raw material costs.
We have multiple qualified vendors for resin. We typically carry a 6 week supply of resin to provide protection against supply interruptions resulting from inclement weather, natural disasters and strikes as well as to provide an economic hedge against short-term price inflation. The stock is distributed among our production facilities and warehouses so that a disruptive event in one location would not affect our ability to continue production. We have qualified resin suppliers local to each of our manufacturing facilities and continue to pursue qualification of additional local resin suppliers.
We have multiple qualified suppliers of paper liner. Our primary paper suppliers are located in the United States and Europe, and we purchase paper based on pricing and required lead times. Our main U.S. paper supplier has an Asian distribution network, and we are working to identify local paper suppliers in Asia.
11
Seasonal Trends
Our Solar business could be adversely affected by seasonal trends due to economic incentives, weather patterns and other items. See "Item 1A—Risk Factors."
Our Solar Competition
We compete with a number of encapsulant manufacturers, including Bridgestone Corporation, Solutia Solar GmbH, Hangzhou First PV Material Co., Ltd. and Mitsui Chemicals Group, Inc. We also face limited competition from suppliers of non-EVA encapsulants including Dow Corning Corporation, Dai Nippon Printing Co., Ltd. and E.I. Du Pont De Nemours and Company ("Dupont"). Over the years, various encapsulant materials have been used in solar modules, including PVB and silicone. Some of our competitors are large, global companies with substantial financial, manufacturing and logistics resources and strong customer relationships. Also, low-cost solar module manufacturers are emerging in Asia, primarily in China, which compete with our customers. As the China solar market matures, we expect additional encapsulant providers from China and the greater Asian markets to compete with us. We compete on the basis of several factors, including:
- •
- product performance, including quality and superior technology;
- •
- product innovations in response to customer requirements;
- •
- customer service and technical support;
- •
- delivery timing and logistics;
- •
- production capacity; and
- •
- price.
We believe our relations with the leading solar module manufacturers, the proven performance of our products, our history of innovation, our global manufacturing base, our technical knowledge and management expertise provide us with significant competitive advantages.
Qualification and Certification
Design certification programs for solar modules measure the performance of solar modules under simulated environmental conditions. In certifying their solar modules, our customers must test any solar module with the encapsulant utilized in their product. The certification and qualification tests related to any solar modules are defined in the following standards: IEC 61215 (crystalline silicon), IEC 61646 (thin-film), UL 1703 and IEEE 1262.
A successful qualification test program typically means that the tested models/types of solar modules have been subjected to and passed the minimum requirements of the relevant test standards. Qualification or certification does not guarantee any performance but is designed to provide reasonable assurance that the solar modules of the tested model or type will perform reliably under field conditions.
Under guidelines developed by the IEC/TC82/WG2 committee in 2000, modifications to the encapsulation system for solar modules can require retesting of the solar module. Such guidelines call for various retesting if there is any change in the chemistry of the encapsulant used in the solar module.
Our Quality Assurance Business
We have offered quality assurance services since 1973. Since forming our Quality Assurance business, we have expanded our service offerings and have increased the scale of the business to meet
12
the growing worldwide needs of the consumer products industry. Our Quality Assurance business is a leader in the consumer products quality assurance market, and we believe our Quality Assurance business is the only global testing services provider exclusively focused on the consumer products market. We provide inspection, testing, auditing and consulting services that enable retailers and manufacturers to determine whether products and facilities meet applicable safety, regulatory, quality, performance, social and ethical standards.
Our consumer products Quality Assurance business includes corporate social responsibility auditing, laboratory testing, inspections and associated consultancy services. The primary markets for these services include clients in diverse industries such as electronics, footwear and leather goods, hard goods, textiles, toys and toy premiums, over-the-counter pharmaceuticals, nutritional supplements, food, household chemicals and health and beauty aids. We also provide laboratory and non-laboratory technical services required to bring engineered plastic materials and products to the marketplace. In addition, we work with brand owners and retailers to ensure that their supply chain partners comply with applicable local legal requirements, worker welfare and health and safety standards, as well as corporate codes of conduct.
Because our Quality Assurance business serves a diverse and global client base, we strive to operate where our clients operate. Our Quality Assurance business has an extensive network of 17 laboratories, 80 inspection and audit offices and 22 sales offices in over 40 countries. With an experienced team of over 950 scientists, technicians, engineers, auditors, trainers and inspectors, our Quality Assurance business enables retailers to effectively manage their quality control systems and helps promote the introduction of safe and high-quality products to the marketplace. We sell our quality assurance services through our direct sales force and marketing efforts. We are required to work with a partner in certain countries either because of local laws and regulations or because such arrangements are customary to doing business in such countries. Also, we may enter into strategic alliances with other quality assurance providers in order to meet client demands in countries where it may not be practicable for us to operate on a stand-alone basis.
Growth in the global consumer products testing industry is driven by factors such as increasing globalization of consumer products manufacturing in developing countries, the movement towards shorter product life-cycles and mass customization, as well as increasing regulatory oversight and requirements. The primary clients for consumer product quality assurance services are large North American and European retailers that manage global supply chains of manufacturers, vendors and importers. In particular, retailers, importers and manufacturers that choose to outsource production to developing countries rely on quality assurance services to evaluate product quality and standards.
Quality Assurance Competition
Our consumer product testing and quality assurance services compete with:
- •
- captive services—in-house quality assurance programs maintained and operated by retailers
themselves;
- •
- global competitors—including Bureau Veritas Group, Intertek Group plc and SGS SA, who compete
with us in the majority of our service offerings and industries, all three of which are larger and have greater geographic coverage than us;
- •
- local competitors—smaller, local competition is generally highly specialized and effective in situations in
which a client's needs are limited to the few services that these competitors offer; and
- •
- non-profit competitors—non-profit certification companies and standards-setting institutes that are usually more focused on safety and social issues but are increasingly offering product testing services.
13
The development of a technical reputation, the depth of industry knowledge and internationally recognized accreditations are the primary barriers to entry. The key competitive factors include the level of technical and industry knowledge, pricing, geographic footprint, level of client service, timeliness, accuracy, marketing, breadth of service offering, level of consultation and information usefulness and technical excellence in a given product category.
Quality Assurance Data Management System
Through a host of web-based tools presently in use and in development, we provide real-time vendor monitoring, on-demand report generation, quality trending and defect analysis. These features allow clients to view the performance of particular vendors and place some vendors on reduced inspection programs, which in turn reduces costs. Furthermore, this information provides quality managers with an opportunity to demonstrate the cost of quality and the effectiveness of their program. We plan to enhance these tools to allow clients to place orders, pay invoices and view an even greater amount of information via the Internet.
Quality Assurance Accreditations
Our Quality Assurance business's reputation for quality is demonstrated by our more than 50 internationally recognized accreditations and memberships, which require us to meet and maintain varying standards and requirements. Each quality assurance location is required to maintain a quality management system and is expected to continue to add industry-specific technical proficiency accreditations. Our Quality Assurance business is accredited for social compliance auditing by the Fair Labor Association, Social Accountability International ("SA 8000"), Worldwide Responsible Apparel Production, The International Council of Toy Industries and is a signatory of the United Nations Global Compact and a member of Business For Social Responsibility. In addition, we were the first foreign company to receive the Commodity Inspection and Quarantine ("CIQ") accreditation from the Chinese government, a requirement for all inspection companies conducting operations in China.
We also actively participate in quality assurance industry trade organizations, including the Ethical Trading Initiative, Business Social Compliance Initiative and Initiative Clause Sociale.
14
Key Global Accreditations and Memberships
Accreditations
• Underwriters Laboratories Inc. (UL) (Certified Agent Program (CAP) Engineering and Administrative Agency, Approved Data Acceptance Program (DAP) Agency) |
• American National Standards Institute (ANSI)—ISO/IEC Guide 65 Accredited as a Product Certification Body for SQF Code 2000 Food Safety Certifications |
|
• International Organization for Standardization (ISO) 17025 Accreditation |
• United Kingdom Accreditation Scheme (UKAS) (Accredited Laboratory) |
|
• Cashmere and Camel Hair Manufacturers Institute (CCMI) |
• Worldwide Responsible Accredited Production (WRAP) Accredited Monitor |
|
• Hong Kong Accreditation Service (HKAS) (Accredited Laboratory) |
• United Kingdom Accreditation Service (UKAS) (Notified Body) |
|
• China National Accreditation Service for Conformity Assessment (CNAS) |
• ISO 17025 Accreditation in U.K., Switzerland and Turkey |
|
• ANSI/ASQ National Accreditation Board (ANAB)—ISO/IEC 17021:2006 Accredited as a Management System Certification Body |
• Laboratory Accreditation, Correlation, Evaluation (LACE) Textile Laboratory Accreditation Scheme (Accredited Laboratory) |
|
• Social Accountability Accreditation Service (SAAS)—ISO/IEC 17021:2006 and SAAS Procedure 200 Accredited certification body |
• Responsible Jewellery Council (RJC) Accredited Third Party Conformity Assessment Bodies (CAB) |
|
• International Council of Toy Industries (ICTI): Accredited Audit Company |
• U.S. Consumer Products Safety Commission (CPSC) (Accredited Testing Laboratory) |
|
• Turkish Accreditation Agency (TURKAK) (Accredited Laboratory) |
• Swiss Accreditation Scheme (SAS) (Accredited Laboratory) |
|
• SQF Certification Body License issued by SQF (Safe Quality Food) to provide ANSI ISO/IEC Guide 65 SQF Code 2000 Certifications |
• Taiwan Accreditation Foundation (TAF) |
Memberships
• British Standards Institute (BSI) |
• Occupational Safety & Health Council (OSHC) |
|
• American Association of Textile Chemists and Colorists (AATCC) |
• American Society for Testing And Materials (ASTM) |
|
• Hong Kong Apparel Society Limited (HKAS) |
• Federation of Hong Kong Industries (FHKI) |
|
• The Business and Institutional Furniture Manufacturers Association (BIFMA) International |
• American Apparel & Footwear Association (AAFA) |
Quality Assurance Clients
Our Quality Assurance business has established relationships with many global retailers and manufacturers of consumer products, which we believe is the result of our relationship-based sales approach. We have a broad client base, serving over 5,000 clients in 2010, with our top five clients accounting for approximately 16.1%, 22.1% and 18.0% of our Quality Assurance net sales in the years
15
ended December 31, 2010, 2009 and 2008, respectively. The average length of our relationship with our top 10 clients in 2010 was approximately 12 years.
Employees
As of December 31, 2010, we employed approximately 2,200 people on a full or part-time basis. We maintain a non-unionized workforce, with the exception of some employees in our Solar manufacturing facility in Spain where unions are required and our Quality Assurance facilities in mainland China, where union representation is more typical. We have not experienced any significant work stoppages during the past five years.
Executive Officers
The following table sets forth the names and ages, as of December 31, 2010, of our executive officers. The descriptions below include each such person's service as a board member or an executive officer of STR Holdings, Inc. and our predecessor.
Name
|
Age | Position | |||
|---|---|---|---|---|---|
| Dennis L. Jilot | 63 | Chairman, President and Chief Executive Officer | |||
| Barry A. Morris | 56 | Executive Vice President and Chief Financial Officer | |||
| Robert S. Yorgensen | 47 | Vice President and President, STR Solar | |||
| Alan N. Forman | 50 | Vice President and General Counsel | |||
| Mark A. Duffy | 48 | Former Vice President and President, STR Quality Assurance | |||
Dennis L. Jilot. Dennis L. Jilot has been our President and Chief Executive Officer and a director since 1997 and has been our Chairman since 2002. Prior to joining us, Mr. Jilot was Executive Vice President of Corning Clinical Laboratories, President and Chief Executive Officer of Corning Nichols Institute and President and Chief Operating Officer of MetPath Incorporated. Mr. Jilot holds a B.S. from the University of Wisconsin at Stevens Point and completed the Executive M.B.A. program at the University of Virginia Darden School of Business.
Barry A. Morris. Barry A. Morris joined us as our Vice President and Chief Financial Officer in 2002 and became our Executive Vice President in September 2008. Prior to joining us, Mr. Morris was Chief Financial Officer of General Bearing Corporation as well as Director of Financial Services and Corporate Controller for BTR Inc. He holds a B.S. from American International College and an M.B.A. from the University of Connecticut.
Robert S. Yorgensen. Robert S. Yorgensen became our Vice President in November 2008 and has been the President of STR Solar since 1997. Mr. Yorgensen has been employed by us for 25 years. Mr. Yorgensen has held a variety of positions with us, including Extruded Products Manager and Senior Technical Specialist of Materials RD&E and Specialty Manufacturing, Technical Specialist of Materials RD&E and Specialty Manufacturing and Project Leader of Development Engineering and Specialty Manufacturing. He holds a Bachelor of Technology, Mechanical Engineering from the University of Connecticut and an A.S. from Hartford State Technical College.
Alan N. Forman. Alan N. Forman became our Vice President and General Counsel in May 2010. Mr. Forman is responsible for all legal affairs of the Company. Prior to joining us, Mr. Forman was a partner at Brown Rudnick LLP and a member of their CleanTech team. Mr. Forman brings extensive executive experience in corporate and securities law including intellectual property, licensing agreements, financing transactions, corporate governance and mergers and acquisitions. Mr. Forman holds a B.A. from Emory University in Economics and a J.D. from George Washington Law School.
16
Mark A. Duffy. Mark A. Duffy was our Vice President and President of STR Quality Assurance from August 2009 until December 31, 2010, the effective date of his resignation. Mr. Duffy has 25 years of experience in a wide range of consumer products and food ingredients businesses. Most recently, Mr. Duffy spent seven years as President for Griffith Laboratories USA. Prior to that, he was the Vice President of Sales, North America for the Johnson Wax Professional, a division of SC Johnson. Previously, Mr. Duffy was Director of Sales for Food Service for the Quaker Oats Company, a subsidiary of PepsiCo. He also held several sales and marketing positions of increasing responsibility in the Food Service Division of Nestle USA. He holds a B.S. from Boston College.
Each executive officer holds office for a term of one year and until his or her successor is duly elected and qualified, in accordance with our bylaws. We have initiated an outside search firm to aid in finding our successor for President of STR Quality Assurance. Currently, Mr. Jilot is directly overseeing STR Quality Assurance.
Intellectual Property
Our intellectual property consists of 12 encapsulant formulations, as well as several processes and sub-processes, a service mark on our corporate logo and our trademarks "STR®" and "PhotoCap®." As appropriate, we require employees, suppliers and customers to execute confidentiality agreements.
We own a number of trademarks, service marks, trade secrets and other intellectual property rights that relate to our products and services. We typically rely on trade secrets, rather than patents, to protect our proprietary processes, methods, documentation and other technology, including our encapsulant formulations, as well as certain other business information. Patent protection requires a costly and uncertain federal registration process that would place our confidential information in the public domain. However, we do hold a provisional global patent and we have filed a patent application with respect to one of our solar products in development due to the specific nature of the product. Typically, we utilize trade secrets to protect the formulations and processes we use to manufacture our products, including our encapsulants, and also to safeguard our proprietary formulations and methods. We believe we can effectively protect our trade secrets indefinitely through use of confidentiality agreements and other security measures. While we enter into confidentiality agreements with our employees and third parties to protect our intellectual property rights, such confidentiality provisions related to our trade secrets could be breached and may not provide meaningful protection for our trade secrets. Also, others may independently develop technologies or products that are similar or identical to ours. In such case, our trade secrets would not prevent third parties from competing with us. See "Item 3. Legal Proceedings—Galica /JPS."
Environmental Regulation
We are subject to a variety of environmental, health and safety, pollution-control laws and regulations in the jurisdictions in which we operate. The costs of compliance with these laws and regulations are not material and we do not believe the costs of compliance with these laws and regulations will be material. We use, generate and discharge hazardous substances, chemicals and wastes at some of our facilities in connection with our product development, testing and manufacturing activities. Any failure by us to control the use of, to remediate the presence of or to restrict adequately the discharge of such substances, chemicals or wastes could subject us to potentially significant liabilities, clean-up costs, monetary damages and fines or suspensions in our business operations. In addition, some of our facilities are located on properties with a history of use involving hazardous substances, chemicals and wastes and may be contaminated. For example, during 2010, we performed a Phase II environmental site assessment at our 10 Water Street, Enfield, Connecticut location. During our investigation, the site was found to contain a presence of volatile organic compounds. We have been in contact with the Department of Environmental Protection and we engaged a license contractor to remediate this situation. The estimated cost we expect to pay to remediate the current
17
contamination is approximately $0.1 million. Although we do not currently anticipate any material liabilities in connection with such contamination, we may be required to make expenditures for environmental remediation in the future.
Available Information
Information regarding us, including corporate governance policies, ethics policies and charters for the committees of the board of directors can be found on our internet website at http://www.strholdings.com and copies of these documents are available to stockholders, without charge, upon request to Investor Relations, STR Holdings, Inc., 1699 King Street, Enfield, CT 06082. The information contained in our website is not intended to be incorporated into this Form 10-K. In addition, our annual reports on Form 10-K, quarterly reports on Form 10-Q, current reports on Form 8-K and amendments to those reports filed or furnished pursuant to Section 13(a) or 15(d) of the Securities Exchange Act of 1934 are made available free of charge on our internet website on the same day that we electronically file such material with, or furnish it to, the Securities and Exchange Commission (the "SEC"). Information filed with the SEC may be read or copied at the SEC's Public Reference Room at 100 F Street, N.E., Washington, D.C. 20549. Information on operation of the Public Reference Room may be obtained by calling the SEC at 1-800-SEC-0330. These filings are also available to the public from commercial document retrieval services and at the internet website maintained by the SEC at http://www.sec.gov that contains reports, proxy and information statements, and other information regarding issuers that file electronically with the SEC.
An investment in our common stock involves a high degree of risk. You should carefully consider the following risks, as well as the other information in this Annual Report on Form 10-K, before making an investment in our Company. If any of the following risks actually occurs, our business, results of operations or financial condition may be adversely affected. In such an event, the trading price of our common stock could decline and you could lose part or all of your investment.
Risks Related to Our Solar Business
Our Solar gross margins and profitability may be adversely affected by rising commodity costs.
We are dependent on certain raw and other materials, particularly resin and paper, for the manufacture of our encapsulants. During 2010, we experienced significant raw material inflation, primarily of EVA resin which comprises approximately 50% to 55% of our cost of encapsulant sales. EVA resin cannot be hedged in the commodity markets. In addition, the cost of equipment used to manufacture our encapsulants is affected by steel prices. The prices for resin, paper and steel have been volatile over the past few years and could increase. If the prices for the commodities and equipment we use in our Solar business increase, our gross margins and results of operations may be adversely affected.
Our dependence on a limited number of third-party suppliers for raw materials for our encapsulants and other significant materials used in our process could prevent us from timely delivering encapsulants to our customers in the required quantities, which could result in order cancellations and decreased revenues.
We purchase resin and paper liner, the two main components used in our manufacturing process, from a limited number of third-party suppliers. If we fail to develop or maintain our relationships with these suppliers or our other suppliers, or if the suppliers' facilities are affected by events beyond our control, we may be unable to manufacture our encapsulants or our encapsulants may be available only for customers in lesser quantities, at a higher cost or after a long delay. We may be unable to pass along any price increases relating to materials costs to our customers, in which case our gross margins
18
could be adversely affected. In addition, we do not maintain long-term supply contracts with our suppliers. Our inventory of raw materials for our encapsulants, including back-up supplies of resin, may not be sufficient in the event of a supply disruption. In 2005, we encountered a supply disruption when one of our resin suppliers had its facilities damaged by a hurricane, and another supplier had a reactor fire at the same time. This forced us to use our back-up supplies of resin. The failure of a supplier to supply materials and components, or a supplier's failure to supply materials that meet our quality, quantity and cost requirements in a timely manner, could impair our ability to manufacture our products to specifications, particularly if we are unable to obtain these materials and components from alternative sources on a timely basis or on commercially reasonable terms. If we are forced to change suppliers, our customers may require us to undertake testing to ensure that our encapsulants meet the customer's specifications.
If demand for solar energy in general and solar modules in particular does not continue to develop or takes longer to develop than we anticipate, sales in our Solar business may not grow or may decline, which would negatively affect our financial condition and results of operations.
We expect that a significant amount of the growth in our overall business will come from the sale of encapsulants by our Solar business. Because our encapsulants are used in the production of solar modules, our financial condition and results of operations and future growth are tied to a significant extent to the overall demand for solar energy and solar modules. The solar energy market is at a relatively early stage of development and the extent to which solar modules will be widely adopted is uncertain. Many factors may affect the viability and widespread adoption of solar energy technology and demand for solar modules, and in turn, our encapsulants, including:
- •
- cost-effectiveness of solar modules compared to conventional and non-solar renewable energy
sources and products;
- •
- performance and reliability of solar modules compared to conventional and non-solar renewable energy sources
and products;
- •
- availability and amount of government subsidies and incentives to support the development and deployment of solar energy
technology;
- •
- rate of adoption of solar energy and other renewable energy generation technologies, such as wind, geothermal and biomass;
- •
- seasonal fluctuations related to economic incentives and weather patterns;
- •
- fluctuations in economic and market conditions that affect the viability of conventional and non-solar
renewable energy sources, such as increases or decreases in the prices of fossil fuels and corn or other biomass materials;
- •
- changes in global economic conditions including increases in interest rates and the availability of financing and
investment capital that is required to fund solar projects. Any volatility or disruption in the economic environment or the credit markets similar to what was experienced during 2009 may slow the
growth of the solar industry, may cause our customers to experience a reduction in demand for their products and related financial difficulties and may adversely impact our Solar business;
- •
- fluctuations in capital expenditures by end users of solar modules, which tend to decrease when the overall economy slows
down;
- •
- the extent to which the electric power and broader energy industries are deregulated to permit broader adoption of solar electricity generation; and
19
- •
- the cost and availability of polysilicon and other key raw materials for the production of solar modules.
For example, in 2009, we experienced a decline in our Solar business mainly due to decreased global demand for solar energy as a result of legislative changes, such as the cap in feed-in tariffs in Spain implemented in 2008, the global recession and the worldwide credit crisis.
If demand for solar energy and solar modules fails to develop sufficiently, demand for our customers' products as well as demand for our encapsulants will decrease, and we may not be able to grow our business or Solar net sales and our financial condition and results of operations will be harmed.
A significant reduction or elimination of government subsidies and economic incentives or a change in government policies that promote the use of solar energy could have a material adverse effect on our business and prospects.
Demand for our encapsulants depends on the continued adoption of solar energy and the resultant demand for solar modules. Demand for our products depends, in large part, on government incentives aimed to promote greater use of solar energy. In many countries in which solar modules are sold, solar energy would not be commercially viable without government incentives. This is because the cost of generating electricity from solar energy currently exceeds, and we believe will continue to exceed for the foreseeable future, the costs of generating electricity from conventional energy sources.
The scope of government incentives for solar energy depends, to a large extent, on political and policy developments relating to environmental and energy concerns in a given country that are subject to change, which could lead to a significant reduction in, or a discontinuation of, the support for renewable energy in such country. Federal, state and local governmental bodies in many of the target markets for our Solar business, including Germany, Italy, Spain, the United States, France, Japan and South Korea, have provided subsidies and economic incentives in the form of feed-in tariffs, rebates, tax credits and other incentives to end users, distributors, system integrators and manufacturers of solar energy products to promote the use of solar energy and to reduce dependency on other forms of energy. These government economic incentives could be reduced or eliminated earlier than anticipated. For example, in Germany, which is currently the largest solar PV end-user market, the government enacted legislation that reduced feed-in tariffs beginning June 30, 2010. In early 2011, the German government enacted further legislation to accelerate the annual year-end feed-in-tariff reduction to July 1, 2011 for roof-top systems and September 1, 2011 for ground-mount projects. As such, this announcement may result in the pull-in of demand from solar module manufacturers due to increased end-user demand being driven by the incentive to purchase a solar system prior to the enactment of the decreased feed-in tariff incentives. As such, we may see atypical Solar sales during the first half of 2011 that might not occur during the second half of 2011. If solar module demand in Germany continues to grow at a rate that the German government believes is excessive, it may consider capping the amount of PV installations that may qualify for the feed-in-tariff incentives. Also, in September 2008, the Spanish parliament adopted new legislation that decreased the feed-in tariff for solar energy by approximately 27% and capped its subsidized PV installations at 500 MW for 2009. This event drove an over-supply of solar module inventory in the supply chain during the first half of 2009 and was one of the main drivers behind our sales volume decline in 2009 compared to 2008.
More recently, Italy has emerged as a significant solar market. The same risks identified for the German market now exist for the Italian market. Also, many European governments are currently experiencing sovereign debt issues. As such, a risk exists that some of these governments may reduce current subsidies provided for PV installations in conjunction with overall lower fiscal policy spending.
Moreover, electric utility companies, or generators of electricity from fossil fuels or other renewable energy sources, could also lobby for changes in the relevant legislation in their markets to protect their revenue streams. Reduced growth in or the reduction, elimination or expiration of government subsidies and economic incentives for solar energy, especially those in our target markets, could cause our Solar net sales to decline and harm our business.
20
Our Solar business is dependent on a limited number of customers, which may cause significant fluctuations or result in declines in our Solar net sales.
The solar module industry is relatively concentrated, and we expect this concentration to increase. As a result, we sell substantially all of our encapsulants to a limited number of solar module manufacturers. We expect that our results of operations will, for the foreseeable future, continue to depend on the sale of encapsulants to a relatively small number of customers. Sales to First Solar and Suntech, each of which accounted for more than 10% of our Solar net sales, together accounted for 27.8% of our Solar net sales for the year ended December 31, 2010. Sales to First Solar accounted for 27.1% and 19.1% of our Solar net sales in the years 2009 and 2008, respectively. In addition, the top five customers in our Solar segment accounted for approximately 43.2%, 55.0% and 47.0% of our Solar net sales in 2010, 2009 and 2008, respectively. Furthermore, participants in the solar industry, including our customers, are experiencing pressure to reduce their costs. Because we are part of the overall supply chain to our customers, any cost pressures experienced by them may affect our business and results of operations. Our customers may not continue to generate significant Solar net sales for us. Conversely, we may be unable to meet the production demands of our customers or maintain these customer relationships. Also, new entrants into the solar module manufacturing industry, primarily from China, could negatively impact the demand for, and pricing of, our customers' products, which could reduce the demand for our encapsulants. Over the last couple of years, we believe our European customers have lost market share to low-cost module manufacturers, primarily from China, that continue to penetrate the European solar market. If we are not able to supply encapsulants to these new entrants in the future, we could lose market share and also face competition from new encapsulant manufacturers.
In addition, a significant portion of our outstanding accounts receivable is derived from sales to a limited number of customers. The accounts receivable from our top five Solar customers with the largest receivable balances represented 33.8% and 38.7% of our accounts receivable balance as of December 31, 2010 and December 31, 2009, respectively. Moreover, many solar companies are facing and may continue to face significant liquidity and capital expenditure requirements, and as a result, our customers may have trouble making payments owed to us, which could affect our business, financial condition and results of operations. Any one of the following events may cause material fluctuations or declines in our Solar net sales and have a material adverse effect on our business, financial condition and results of operations:
- •
- reduction, postponement or cancellation of orders from one or more of our significant customers;
- •
- reduction in the price one or more significant solar customers are willing to pay for our encapsulants;
- •
- selection by one or more solar customers of products competitive with our encapsulants;
- •
- loss of one or more significant solar customers and failure to obtain additional or replacement customers; and
- •
- failure of any of our significant solar customers to make timely payment for products.
Our Solar business's growth is dependent upon the growth of our key Solar customers and our ability to keep pace with our customers' growth.
In addition to relying on a small number of customers, we believe we were the primary supplier to the majority of our top 10 Solar customers in 2010. The future growth and success in our Solar business depends on the ability of such customers to grow their businesses and our ability to meet any such growth, principally through the addition of manufacturing capacity. If our Solar customers do not increase production of solar modules, there will be no corresponding increase in encapsulant orders. Alternatively, in the event such customers grow their businesses, we may not be able to meet their increased demands, which would require such customers to find alternative sources for encapsulants. In
21
addition, it is possible that customers for whom we are the exclusive supplier of encapsulants will seek to qualify and establish a secondary supplier of encapsulants, which would reduce our share with such customers and could increase that customer's pricing leverage. If our Solar customers do not grow their businesses or they find alternative sources for encapsulants to meet their demands, it could limit our ability to grow our business and increase our Solar net sales.
Technological changes in the solar energy industry or our failure to develop and introduce or integrate new technologies could render our encapsulants uncompetitive or obsolete, which would adversely affect our business.
The solar energy market is very competitive, rapidly evolving and is characterized by continually changing technology requiring continuous improvements in solar modules to increase efficiency and power output and improve aesthetics. This requires us and our customers to continuously invest significant financial resources to develop new solar module technology and enhance existing solar modules to keep pace with evolving industry standards and changing customer requirements and to compete effectively in the future. Our failure to further refine our encapsulant technology and develop and introduce new or enhanced encapsulants or other products, or our competitors' development of products and technologies that perform better or are more cost effective than our products, could cause our encapsulants to become uncompetitive or obsolete, which would adversely affect our business, financial condition and results of operations. Product development activities are inherently uncertain, and we could encounter difficulties and increased costs in commercializing new technologies. As a result, our product development expenditures in our Solar business may not produce corresponding benefits.
Moreover, we produce a component utilized in the manufacturing of solar modules. New solar technologies may emerge or existing technologies may gain market share that do not require encapsulants as we produce them, or at all. Also, manufacturing methods may emerge that could be more advanced or efficient than our current manufacturing capability. Such changes could result in decreased demand for our encapsulants or render them obsolete, which would adversely affect our business, financial condition and results of operations.
We typically rely upon trade secrets and contractual restrictions, and not patents, to protect our proprietary rights. Failure to protect our intellectual property rights may undermine our competitive position and protecting our rights or defending against third-party allegations of infringement may be costly.
Protection of proprietary processes, methods, documentation and other technology is critical to our business. Failure to protect, monitor and control the use of our existing intellectual property rights could cause us to lose our competitive advantage and incur significant expenses. We typically rely on trade secrets, trademarks, copyrights and contractual restrictions to protect our intellectual property rights and currently only hold one patent related to our Solar business. However, the measures we take to protect our trade secrets and other intellectual property rights may be insufficient. While we enter into confidentiality agreements with our Solar employees and third parties to protect our intellectual property rights, such confidentiality provisions related to our trade secrets could be breached and may not provide meaningful protection for our trade secrets. Also, others may independently develop technologies or products that are similar or identical to ours. In such case, our trade secrets would not prevent third parties from competing with us.
Third parties or employees may infringe or misappropriate our proprietary technologies or other intellectual property rights, which could harm our business and operating results. Policing unauthorized use of intellectual property rights can be difficult and expensive, and adequate remedies may not be available.
As previously disclosed, in October 2007, we filed a complaint against James P. Galica ("Galica") and JPS Elastomerics Corp. ("JPS") in the Massachusetts Superior Court in Hampshire County (the "Court"). We alleged that the defendants misappropriated trade secrets and violated the Massachusetts
22
Unfair and Deceptive Trade Practices Act as well as breaches of contract, the implied covenant of good faith and fair dealing, and fiduciary duty against Galica (the "State Court Action"). The Court determined that JPS and Galica had violated the Massachusetts Unfair and Deceptive Trade Practices Act, finding that the technology for our polymeric sheeting product is a trade secret and that JPS and Galica had misappropriated our trade secrets. On January 27, 2011, the Court awarded us the right to recover from the defendants (i) actual monetary damages of $1.1 million, (ii) punitive damages of $2.2 million, (iii) reasonable attorneys fees of $3.9 million, (iv) reasonable costs of $1.1 million, and (v) 12% interest on each of the monetary awards from the date of the judgment (except for the actual monetary damages which accrues interest from October 2, 2007, the date the complaint was entered). In addition, the Court imposed a five year production injunction against producing low shrink EVA encapsulant, and a permanent use injunction against the defendants using our trade secrets. On January 28, 2011, the defendants filed a motion seeking to stay certain elements of the injunction which was denied by the Court on February 8, 2011. The defendants filed a motion appealing the Court's denial of its motion as well as a notice of appeal with respect to the Court's order in favor of us. On February 28, 2011, the Massachusetts Appeals Court denied JPS's appeal of the lower court's denial of the request for a stay. On March 4, 2011, the defendants filed a petition to stay or modify the injunction pending appeal with the Massachusetts Supreme Judicial Court as well as an emergency motion for an immediate stay pending full briefing and hearing of the petition. The Supreme Judicial Court denied the defendants' emergency motion on March 7, 2011. To date, the Supreme Judicial Court has not taken action on the defendants' petition.
On September 17, 2010, JPS filed an amended complaint against our wholly-owned subsidiary, Specialized Technology Resources, Inc. ("STR"), in the U.S. District Court for the District of Massachusetts. The amended complaint alleged various antitrust and unfair competition claims and that the State Court Action (described above) was sham litigation initiated by STR in an attempt to monopolize the domestic and international market for low-shrink EVA encapsulants. JPS also alleged other schemes to monopolize and unfair competition in violation of federal and state laws. JPS sought $60.0 million in compensatory damages, treble damages, a permanent injunction against STR for various activities, reimbursement of legal fees for the State Court Action as well as for this matter, and disgorgement of proceeds obtained by STR from allegedly anti-competitive and tortious acts. On October 13, 2010, we filed a motion to dismiss the amended complaint, and on January 5, 2011 the Court held a hearing on STR's motion to dismiss. At the hearing, the Court ruled in favor of STR and dismissed the case. On January 14, 2011, the Court issued its written opinion dismissing the case and on January 24, 2011 STR filed a motion for Rule 11 sanctions against the defendants and their counsel. On February 10, 2011, JPS filed a notice of appeal with the Appellate Court. The First Circuit Court of Appeals has scheduled a settlement conference and set a briefing schedule in this matter. The settlement conference is set for April 14, 2011. JPS' brief is due on April 18, 2011 and STR's brief will be due thirty days after JPS serves its brief. We intend to continue to vigorously defend this action which we consider meritless and to pursue our motion for Rule 11 sanctions against JPS and its counsel.
We face competition in our Solar business from other companies producing encapsulants for solar modules.
The market for encapsulants is highly competitive and continually evolving. We compete with a number of encapsulant manufacturers, some of which are large, global companies with substantial financial, manufacturing and logistics resources and strong customer relationships. If we fail to attract and retain customers for our current and future products, we will be unable to increase our revenues and market share. Our primary encapsulant competitors include Bridgestone Corporation, Hangzhou First PV Material Co., Ltd., Solutia Solar GmbH and Mitsui Chemicals Group, Inc. We also face limited competition from suppliers of non-EVA encapsulants including Dow Corning Corporation, Dai Nippon Printing Co., Ltd. and DuPont. We also expect to compete with new entrants to the encapsulant market, including those that may offer more advanced technological solutions, possess advanced or more efficient manufacturing capabilities or that have greater financial resources than we
23
do. Further, as the China solar market matures, we expect additional encapsulant providers from China and the greater Asian markets will compete with us. Our competitors may develop and produce or may be currently producing encapsulants that offer advantages over our products. A widespread adoption of any of these technologies could result in a rapid decline in our position in the encapsulant market and our revenues and adversely affect our margins.
Our failure to build and operate new manufacturing facilities and increase production capacity at our existing facilities to meet our customers' requirements could harm our business and damage our customer relationships in the event demand for encapsulants increases. Conversely, expanding our production in times of overcapacity could have an adverse impact on our results of operations.
Prior to the fourth quarter of 2008, our manufacturing facilities generally operated at full production capacity, which constrained our ability to meet increased demand from our customers and to obtain additional customers. The future success of our Solar business depends, in part, on our ability to increase production capacity to satisfy any increased demand from our customers. We may be unable to expand our Solar business, satisfy customer requirements, maintain our competitive position and improve profitability if we are unable to build and operate new manufacturing facilities and increase production capacity at our existing facilities to meet any increased demand for our Solar products. For example, if there are delays in our East Windsor, Connecticut facility becoming operational and achieving target yields and output, we will not meet our target for adding capacity, which would limit our ability to increase encapsulant sales and result in lower than expected Solar net sales and higher than expected costs and expenses. Moreover, we may experience delays in receiving equipment and be unable to meet any increases in customer demand. Failure to satisfy customer demand may result in a loss of market share to competitors and may damage our relationships with key customers.
In addition, due to the lead time required to produce the equipment used in our encapsulant manufacturing process, it normally takes about one year to obtain new machines after they are ordered. Accordingly, we are required to order production equipment well in advance of expanding our facilities or opening new facilities and in advance of accepting additional customer orders. If such facilities are not expanded or completed on a timely basis or if anticipated customer orders do not materialize, we may not be able to generate sufficient Solar net sales to offset the costs of new production equipment, which could have an adverse impact on our results of operations. Furthermore, we rely on longer-term forecasts from our Solar customers to plan our capital expenditures. If these forecasts prove to be inaccurate, either we may have spent too much on capacity growth, which could require us to consolidate facilities, in which case our financial results would be adversely affected, or we may have spent too little on capital expenditures, in which case we may be unable to satisfy customer demand, which could adversely affect our business. Furthermore, our ability to establish and operate new manufacturing facilities and expand production capacity is subject to significant risks and uncertainties, including:
- •
- restrictions in the agreements governing our indebtedness that restrict the amount of capital that can be spent on
manufacturing facilities;
- •
- inability to raise additional funds or generate sufficient cash flow from operations to purchase raw material inventory
and equipment or to build additional manufacturing facilities;
- •
- delays and cost overruns as a result of a number of factors, many of which are beyond our control, such as increases in
raw material prices and long lead times or delays with equipment vendors;
- •
- delays or denials of required approvals by relevant government authorities;
- •
- diversion of significant management attention and other resources;
- •
- inability to hire qualified personnel; and
- •
- failure to execute our expansion plan effectively.
24
If we are unable to establish or successfully operate additional manufacturing facilities or to increase production capacity at our existing facilities, as a result of the risks described above or otherwise, we may not be able to expand our business as planned and our Solar net sales may be lower than expected. Alternatively, if we build additional manufacturing facilities or increase production capacity at our existing facilities, we may not be able to generate sufficient customer demand for our encapsulants to support the increased production levels, which would adversely affect our business and operating margins.
Our Solar business is exposed to risks related to running our facilities at full production capacity from time to time that could result in decreased Solar net sales and affect our ability to grow our business in future periods.
Prior to the fourth quarter of 2008, our manufacturing facilities generally operated at full production capacity. If any of our current or future production lines or equipment were to experience any problems or downtime, such as in 2005 when one of our plants was without electricity for five days following a hurricane, we may not be able to shift production to new lines and may not be able to meet our production targets, which would result in decreased Solar net sales and adversely affect our customer relationships. It would also limit our ability to obtain new customers. As a result, our per-unit manufacturing costs would increase, we would be unable to increase sales as planned and our earnings would likely be negatively impacted. In addition, when our encapsulant production lines are running at full capacity, they are generally used solely to meet current customers' orders. As such, there is very limited production line availability to test new technologies or further refine existing technologies that are important for keeping pace with evolving industry standards and changing customer requirements and competing effectively in the future. Limitations in our ability to test new products or enhancements to our existing products could cause our encapsulants to become uncompetitive or obsolete, which would adversely affect our business.
We may be subject to claims that we have infringed, misappropriated or otherwise violated the patent or other intellectual property rights of a third party. The outcome of any such claims is uncertain and any unfavorable result could adversely affect our business, financial condition and results of operations.
We may be subject to claims by third parties that we have infringed, misappropriated or otherwise violated their intellectual property rights. These claims may be costly to defend, and we ultimately may not be successful. An adverse determination in any such litigation could subject us to significant liability to third parties (potentially including treble damages), require us to seek licenses from third parties (which may not be available on reasonable terms, or at all), make substantial one-time or ongoing royalty payments, redesign our products or subject us to temporary or permanent injunctions prohibiting the manufacture and sale of our products, the use of our technologies or the conduct of our business. Protracted litigation could also result in our customers or potential customers deferring or limiting their purchase or use of our products until resolution of such litigation. In addition, we may have no insurance coverage in connection with such litigation and may have to bear all costs arising from any such litigation to the extent we are unable to recover them from other parties. Any of these outcomes could have a material adverse effect on our business, financial condition and results of operations.
We generally operate on a purchase order basis with our Solar customers, and their ability to cancel, reduce, or postpone orders could reduce our Solar net sales and increase our costs.
Sales to our Solar customers are typically made through non-exclusive, short-term purchase order arrangements that specify prices and delivery parameters. The timing of placing these orders and the amounts of these orders are at our customers' discretion. Customers may cancel, reduce or postpone purchase orders with us prior to production on relatively short notice. If customers cancel, reduce or postpone existing orders or fail to make anticipated orders, it could result in the delay or loss of anticipated sales, which could lead to excess inventory and unabsorbed overhead costs. Because our
25
encapsulants have a limited shelf life from the time they are produced until they are incorporated into a solar module, we may be required to sell any excess inventory at a reduced price, or we may not be able to sell it at all and incur an inventory write-off, which could reduce our Solar net sales and increase our costs. During the first half of 2009, we experienced postponements and cancellations in orders and, as a result, incurred approximately $1.0 million of finished goods inventory write-offs.
We may be unable to manage the expansion of our Solar operations effectively.
We expect to expand our existing facilities and add new facilities to meet future demand for encapsulants. We are currently expanding our Malaysia facility to double the size of our existing production and warehouse space for a capacity of up to 5.0 GW and also have on order an additional 1.2 GW of production capacity that is expected to be installed during the third quarter of 2011. In December 2010, we acquired a 275,000 square foot manufacturing facility in East Windsor, Connecticut. This facility will provide us needed space for capacity to meet future demand and enable us to consolidate our Connecticut-based Solar operations. We expect the transition of manufacturing operations to occur during 2011. We also have on order an additional 1.2 GW of production capacity that is expected to be installed in the East Windsor facility during the third quarter of 2011. To manage the potential growth of our operations, we will be required to improve operational and financial systems, procedures and controls, increase manufacturing capacity and output and expand, train and manage our growing employee base. Furthermore, management will be required to maintain and expand our relationships with our customers, suppliers and other third parties. Our Solar business's current and planned operations, personnel, systems, internal procedures and controls may not be adequate to support our future growth. If we are unable to manage the growth of our Solar business effectively, we may not be able to take advantage of market opportunities, execute our business strategies or respond to competitive pressures.
As a supplier to solar module manufacturers, disruptions in any other component of the supply chain to solar module manufacturers may adversely affect our customers and consequently limit the growth of our business and revenue.
We supply a component to solar module manufacturers. As such, if there are disruptions in any other area of the supply chain for solar module manufacturers, it could affect the overall demand for our encapsulants. For example, the increased demand for polysilicon due to the rapid growth of the solar energy and computer industries and the significant lead time required for building additional capacity for polysilicon production led to an industry-wide shortage of polysilicon from 2005 through 2008, which is an essential raw material in the production of most of the solar modules produced by many of our customers. This and other disruptions to the supply chain may force our customers to reduce production, which in turn would decrease customer demand for our encapsulants and could adversely affect our Solar net sales. In addition, reduced orders for our encapsulants could result in underutilization of our production facilities and cause an increase of our marginal production cost. During the first half of 2009, we experienced postponements and cancellations in orders and, as a result, incurred approximately $1.0 million of finished goods inventory write-offs.
The sales cycle for our encapsulants can be lengthy, which could result in uncertainty and delays in generating Solar net sales.
The integration and testing of our encapsulants with prospective customers' solar modules or enhancements to existing customers' solar modules requires a substantial amount of time and resources. A Solar customer may need up to one year and in some cases even longer, to test, evaluate and adopt our encapsulants and qualify a new solar module, before ordering our encapsulants. Our Solar customers then need additional time to begin volume production of solar modules that incorporate our encapsulants. As a result, the complete sales cycle for our Solar business can be lengthy. We may experience a significant delay between the time we increase our expenditures for product development,
26
sales and marketing efforts and inventory for our Solar business and the time we generate Solar net sales, if any, from these expenditures.
Our Solar business could be adversely affected by seasonal trends and construction cycles.
We may be subject to industry-specific seasonal fluctuations in the future, particularly in climates that experience colder weather during the winter months, such as Germany. There are various reasons for seasonality fluctuations, mostly related to economic incentives and weather patterns. Prior to 2010, the construction of solar energy systems in Germany was concentrated in the second half of the calendar year, largely due to the annual reduction of the applicable minimum feed-in tariff. In early 2011, the German government enacted further legislation to accelerate the annual year-end feed-in-tariff reduction to July 1, 2011 for roof-top systems and September 1, 2011 for ground-mount projects. This announcement may result in the pull-in of demand from solar module manufacturers due to increased end-user demand being driven by the incentive to purchase a solar system prior to the enactment of the decreased feed-in tariff incentives. As such, we may see atypical Solar sales during the first half of 2011 that may not occur during the second half of 2011. In the United States, solar module customers will sometimes make purchasing decisions towards the end of the year in order to take advantage of tax credits or for budgetary reasons. In addition, construction levels are typically slower in colder months. Accordingly, our business and results of operations could be affected by seasonal fluctuations in the future.
Problems with product quality or product performance, including defects, could result in a decrease in customers and Solar net sales, unexpected expenses and loss of market share.
Our encapsulants are complex and must meet stringent quality requirements. Products as complex as our encapsulants may contain undetected defects, especially when first introduced. For example, our encapsulants may contain defects that are not detected until after they are shipped or are installed because we cannot test for all possible scenarios. These defects could cause us to incur significant costs, including costs to service or replace products, divert the attention of our engineering personnel from product development efforts and significantly affect our customer relationships and business reputation. If we deliver products with defects, or if there is a perception that our products contain errors or defects, our credibility and the market acceptance and sales of our encapsulants could materially decline. In addition, we could be subject to product liability claims and could experience increased costs and expenses related to significant product liability claims or other legal judgments against us, or a widespread product recall by us or a solar module manufacturer. For example, during the second half of 2008, we recorded an accrual of $5.6 million relating to specific product performance matters, which amount represents management's best estimate of the costs to repair or replace such product. The majority of this accrual relates to a quality claim by one of our customers in connection with a non-encapsulant product that we purchased from a vendor in 2005 and 2006 and resold. We stopped selling this product in 2006 and are currently attempting to resolve this matter. We may increase our accruals in future periods or incur charges in excess of that amount, which would result in increased expenses in future periods that adversely affect our results of operations.
The manufacturing process for our encapsulants is highly complex. Minor deviations in the manufacturing process can cause substantial decreases in yield and, in some cases, cause production to be suspended. We have from time to time experienced lower than anticipated manufacturing yields. This typically occurs during the production of new encapsulants or the installation and start-up of new process technologies or equipment. For example, during the third quarter of 2010, we experienced production inefficiencies and scrap associated with ramping newly installed production capacity at our Malaysia facility that negatively impacted our financial results. As we expand our production capacity, we may experience lower yields initially as is typical with any new equipment or process. If we do not achieve planned yields, our costs of sales could increase, and product availability would decrease resulting in lower Solar net sales than expected.
27
Changes to existing regulations and capacity in the utility sector and the solar energy industry may present technical, regulatory and economic barriers to the purchase and use of solar modules, which in turn may significantly reduce demand for our products.
The market for power generation products is heavily influenced by government regulations and policies concerning the electric utility industry, as well as the internal policies of electric utility companies. These regulations and policies often relate to electricity pricing and technical interconnection of end user-owned power generation. In a number of countries, these regulations and policies are being modified and may continue to be modified. End users' purchases of alternative energy sources, including solar modules, could be deterred by these regulations and policies. For example, utility companies sometimes charge fees to larger, industrial customers for disconnecting from the electricity transmission grid or relying on the electricity transmission grid for back-up purposes. Such fees could increase the costs of using solar modules, which may lead to reduced demand for solar modules and, in turn, our encapsulants.
We anticipate that solar modules and their installation will continue to be subject to oversight and regulation in accordance with national and local ordinances relating to building codes, safety, environmental protection, utility interconnection and metering and related matters in various countries. Any new government regulations or utility policies pertaining to solar modules may result in significant additional expenses to our Solar customers, and their distributors and end users, which could cause a significant reduction in demand for solar modules and, in turn, our encapsulants.
The adoption of solar energy in most parts of the world will be dependent on the capacity of applicable electricity transmission grids to distribute the increased volume of electricity to end-users. The lack of available capacity on the transmission grid could substantially impact the adoption of solar energy which could cause a significant reduction in demand for solar modules and, in turn, our encapsulants.
Risks Related to Our Quality Assurance Business
The quality assurance testing markets are highly competitive, and many of the companies with which we compete have substantially greater resources and geographical presence than us.
The quality assurance industry is highly competitive, and our Quality Assurance business competes in the United States and internationally with many well-established quality assurance and certification companies on the basis of technical and industry knowledge, pricing, geographic proximity, client service, timeliness, accuracy, marketing, breadth of service offering, level of consultation and actionable information and technical excellence in a given product category. Our global competitors operate in multiple geographic areas while other competitors operate locally. In addition, we compete with non-profit certification companies and in-house quality assurance programs maintained and operated by manufacturers and retailers themselves. The ability to increase or maintain our Quality Assurance net sales or gross margins in the global market or in various local markets may be limited as a result of actions by competitors.
Our competitors may be able to provide clients with different or greater capabilities or benefits than we can provide in areas such as geographical presence, technical qualifications, price and the availability of human resources. The inability of our Quality Assurance business to compete effectively with respect to any of these or other factors could have a material adverse effect on our business, financial condition or results of operations. In order to remain competitive in the quality assurance testing industry, we must also keep pace with changing technologies and client preferences. If we are unable to expand our geographic presence and testing capacity, maintain or enter into strategic partnerships or differentiate our services from those of our competitors, our Quality Assurance business may not be able to obtain new clients or it may lose existing clients. Competitors may in the future adopt aggressive pricing policies and diversify their service offerings. In addition, new competitors or alliances among competitors may emerge and compete more effectively than our Quality Assurance
28
business can. There is also a trend towards consolidation in certain markets that our Quality Assurance business serves, which may result in the emergence of new or larger competitors. If we cannot offer prices, services or a quality of service at least comparable to those offered by our competitors, we could lose market share or our profitability may be affected. These competitive pressures could materially and adversely affect our business, financial condition and results of operations.
Damage to the professional reputation of our Quality Assurance business would adversely affect our Quality Assurance net sales and the growth prospects of our Quality Assurance business.
Our Quality Assurance business depends on longstanding relationships with our clients, including leading global retailers and consumer product manufacturers, for a significant portion of our Quality Assurance net sales. Product liability claims, poor performance, lax standards, violations of laws or regulations, employee misconduct, information security breaches or other action affecting our Quality Assurance business could damage our reputation. Providing quality assurance services for products for human use or consumption involves inherent legal and reputational risks and our success depends on the ability of our Quality Assurance business to maintain service quality for our existing clients. Service quality issues, real or alleged, or allegations of product defects, contamination, tampering, misbranding, spoliation, or other adulteration, even when false or unfounded, could tarnish the image of our Quality Assurance business and may cause our clients to choose other quality assurance providers. We also provide our clients with limited indemnities for our failure to meet applicable standards. Quality assurance testing protocols only identify known risks, and we have cleared products in the past that later were determined to present a previously unknown risk. No testing protocol can discern unknown risks but we may nevertheless be held liable for those risks. A significant product liability or other legal judgment against our Quality Assurance business, or a widespread product recall of a tested product, may adversely affect our profitability. Moreover, even if a product liability or consumer fraud claim is unsuccessful, has no merit or is not pursued, the negative publicity surrounding assertions against products or processes that our Quality Assurance business tested could adversely affect our reputation, which in turn could lead to a loss of existing clients or make it more difficult to attract new clients. If our Quality Assurance business's reputation is damaged, our net sales and growth prospects could be adversely affected.
Failure to maintain professional accreditations and memberships may affect our Quality Assurance business's ability to compete or generate net sales.
Our Quality Assurance clients rely on our numerous professional accreditations and memberships, including ISO 9000, ISO 17025, SA 8000 and Underwriters Laboratories, to ensure continued compliance with their quality assurance and social audit standards. Certain accreditations are granted for limited periods of time and are subject to periodic renewal. Any failure to meet our ongoing professional responsibilities could lead us to lose, either temporarily or on a permanent basis, one or more of such accreditations or memberships. In addition, a public authority or professional organization that has granted one or more accreditations or memberships to us could decide to unilaterally withdraw such accreditations and memberships. If our accreditations and memberships with these or other professional organizations are suspended or revoked, our clients may decrease the amount of business that they do with our Quality Assurance business, or stop doing business with us altogether, which would negatively affect our business, financial condition and results of operations.
Our Quality Assurance business's growth depends on our ability to expand our operations and capacity and manage such expansion effectively.
In order to maintain our current clients and grow our Quality Assurance business, we must be able to meet increasing client demand, which requires additional space, equipment and human resources. The future success of our Quality Assurance business depends on our ability to increase our service capacity, and if we are unable to expand our operations, obtain testing equipment and hire additional qualified personnel, we may be unable to expand our Quality Assurance business and satisfy client
29
demands. The testing equipment our Quality Assurance business uses is highly customized and is built to order, which results in significant lead times. Therefore, it can take several months to obtain, install and calibrate new equipment once ordered, and we must have the facilities available to accommodate it. Building a new testing facility can take up to one year.
Additional expansion in existing or new markets could strain these resources and increase capital needs, and our personnel, systems, procedures, controls and existing space may not be adequate to support further expansion. Additionally, international growth in our Quality Assurance business may be limited by the fact that in some countries we are required to operate with a local strategic partner. Finding these partners may be difficult or impossible, and our arrangements with them may negatively affect our Quality Assurance net sales.
Moreover, we have a limited number of laboratories in which to process engagements and a limited number of trained personnel to conduct inspections and audits. When these laboratories or our personnel resources are at capacity, we cannot accept more engagements. Our Quality Assurance clients may require capacity and resources greater than that which we can provide. If we cannot process engagements in the time our clients require due to capacity or other resource constraints, we may lose clients or experience a decline in engagements.
On the other hand, if we expand our capacity or direct labor force too quickly, we may experience lower profitability if the anticipated level of sales volume does not occur. For example, we expanded our direct labor force during the end of 2009 to ensure we had proper resources to support anticipated higher sales volume for 2010 that did not materialize. Due to certain clients reducing the scope of services procured from us, we were required to initiate a cost reduction plan to better align our labor cost with actual net sales. As such, our 2010 Quality Assurance business's profitability was lower than in 2009.
Our Quality Assurance business may lose money or experience reduced margins if we do not adequately estimate the cost of our Quality Assurance engagements.
We perform the majority of our Quality Assurance engagements on a fixed-price basis. Fixed-price contracts require us to price our contracts by predicting expenditures in advance. In addition, some engagements obligate our Quality Assurance business to provide ongoing and other supporting or ancillary services on a fixed-price basis or with limitations on our ability to increase prices. When making proposals for engagements on a fixed-price basis, we rely on our estimates of costs and timing for completing the projects. These estimates reflect management's best judgment regarding our Quality Assurance business's capability to complete the task efficiently. Any increased or unexpected costs or unanticipated delays in connection with the performance of fixed-price contracts, including delays caused by factors outside our control, such as increased energy and labor costs, could result in losses or reduced margins. Unexpected costs and unanticipated delays may cause our Quality Assurance business to incur losses or reduced margins on fixed-price contracts. In addition, some of our Quality Assurance engagements are on a time-and-material basis. While these types of contracts are generally subject to less uncertainty than fixed-price contracts, to the extent that actual labor and other costs are higher than the contract rates, these contracts may be less profitable or unprofitable.
30
Our failure to establish and maintain partnerships and other strategic alliances with other quality assurance providers may delay the expansion or provision of our services, harm our reputation and cause us to lose clients or prevent us from growing our Quality Assurance business.
Our Quality Assurance business serves a diverse and global client base, which requires us to operate where such clients operate. We are required to work with a partner in certain countries either because of local laws and regulations or because such arrangements are customary to doing business in such countries. Also, we enter into and will continue to enter into strategic alliances with other quality assurance service providers in order to meet client demands in countries in which it may not be practicable for us to operate on a stand-alone basis. We do not generally have long-term contracts with our strategic partners, so they may cease doing business with us on relatively short or no notice. Yet if performance issues arise with respect to a strategic partner's services, such issues could damage our Quality Assurance business's reputation and exclusivity arrangements with such partners could prevent us from engaging in new strategic alliances for certain testing and inspection services in particular markets. In addition, we have also entered into joint venture agreements that restrict our ability to enter into certain product testing markets in specified geographic markets, either with another strategic partner or on our own. If we are unable to establish or maintain relationships with strategic partners, if such partners damage our reputation or if contract arrangements with such partners prevent us from entering certain testing markets, we could lose quality assurance clients or may not be able to expand our Quality Assurance business, either of which could have an adverse effect on our results of operations.
Our Quality Assurance business's failure to develop and protect its proprietary systems of design reviews and research processes could negatively affect its business and future growth.
Our Quality Assurance business does not rely on any patents and relies primarily on trade secrets, trademarks, copyrights and other contractual restrictions to protect our intellectual property. In addition to breaching confidentiality agreements, former employees and others may obtain knowledge of our Quality Assurance business's trade secrets through independent development or other legal means. Policing unauthorized use of proprietary technology can be difficult and expensive, and adequate remedies may not be available in the event of unauthorized use or disclosure of trade secrets. Any lawsuits to protect our Quality Assurance business's intellectual property may be costly and may divert management attention and other resources away from our business, and any such litigation may not be resolved in our favor. An adverse determination in any such litigation will impair our Quality Assurance business's intellectual property rights and may harm our business, prospects and competitive position. In addition, we have no insurance coverage against such litigation costs and have to bear all costs arising from such litigation to the extent we are unable to recover them from other parties.
Our Quality Assurance business may be subject to professional liability claims and may not have adequate insurance coverage.
Quality assurance testing protocols are only designed to identify known risks. In the past, our Quality Assurance business has cleared products that only later were determined to present a previously unknown risk. Testing protocols cannot discern unknown risks, for which we nevertheless may be held liable. Also, there may be a significant delay between the provision of services and the making of a related claim. While we maintain insurance for our Quality Assurance business to protect against losses from professional liability claims, such insurance may not be available, is subject to deductibles and may not be adequate to cover all the costs and expenses related to a significant professional liability or other legal judgment against us, which could adversely affect the results of operations of our Quality Assurance business.
In addition, the insurance market could evolve in a manner unfavorable to us, resulting in increased premiums or making it impossible or much more expensive to obtain adequate insurance
31
coverage. These factors could result in a substantial increase in our insurance costs, cause us to operate without insurance or cause us to withdraw from certain markets, which could have a significant adverse effect on our Quality Assurance business and related results of operations.
Changes in regulations applicable to our Quality Assurance business could have a significant effect on our business, financial condition, results of operations or future growth.
Our Quality Assurance business conducts operations in a heavily regulated environment, with regulations differing, sometimes substantially, from one country to another. Regulations applicable to our Quality Assurance business may change either favorably or unfavorably for us. The strengthening or enforcement of regulations, while in some cases creating new business opportunities, may also create operating conditions that increase our operating costs, limit our business areas or more generally slow the development of our Quality Assurance business. In extreme cases, such changes in the regulatory environment could lead us to exit certain markets where we consider the regulation to be overly burdensome. In general, rapid and/or important changes in regulations could have a significant adverse effect on our business, financial condition, results of operations or future growth.
Risks Related to Our Businesses
The global credit markets and overall worldwide economic conditions may have significant effects on our business, financial condition and results of operations.
Significant reductions in available capital and liquidity, substantial reductions and/or fluctuations in equity and currency values and a worldwide recession may materially adversely affect both our Solar and Quality Assurance businesses. Factors such as lack of consumer spending, business investment and government spending, the volatility and weakness of the capital markets, and inflation all affect the business and economic environment and, ultimately, the amount and profitability of our business. In an economic downturn like the one experienced in 2009, which was characterized by higher unemployment, lower family income, lower corporate earnings, lower business investment and lower consumer spending, the demand for our products and services may be adversely affected. Continued market disruptions and broader economic downturns may affect our and our customers' access to capital, lead to lower demand for our products and services, increase our exposure to losses from bad debts or result in our customers ceasing operations, any of which could materially adversely affect our business, financial condition and results of operations.
In recent years, the credit markets have experienced unprecedented levels of volatility and disruption. In many cases, the markets still have limited credit capacity for certain issuers, and lenders have requested more restrictive terms. The market for new debt financing is extremely limited and in some cases not available at all. If credit markets become disrupted or volatile, we may not be able to refinance our existing debt, draw upon our revolving credit facility or incur additional debt, which may require us to seek other funding sources to meet our liquidity needs or to fund planned expansion. As such, we may not be able to obtain debt or other financing on reasonable terms, or at all. Furthermore, the tightening of credit in financial markets may delay or prevent our customers from securing funding adequate to operate their businesses and purchase our products and services and could lead to an increase in our bad debt levels.
Our future success depends on our ability to retain our key employees.
We are dependent on the services of Dennis L. Jilot, our Chairman, President and Chief Executive Officer, Barry A. Morris, our Executive Vice President and Chief Financial Officer, Robert S. Yorgensen, our Vice President and President of STR Solar, Alan N. Forman, our Vice President and General Counsel and other members of our senior management team. The loss of any member of our senior management team could have a material adverse effect on us. Members of our senior
32
management team may terminate their employment with us upon little or no notice. There is a risk that we will not be able to retain or replace these key employees.
If we are unable to attract, train and retain technical personnel, our businesses may be materially and adversely affected.
Our future success depends, to a significant extent, on our ability to attract, train and retain qualified technical personnel. There is substantial competition for qualified technical personnel for both our Solar and Quality Assurance businesses, and we may be unable to attract or retain our technical personnel. If we are unable to attract and retain qualified employees, our businesses may be materially and adversely affected.
Our substantial international operations subject us to a number of risks.
We operate in 36 countries worldwide, we have encapsulant manufacturing facilities operating in Spain and Malaysia, and our Quality Assurance business annually conducts audits or inspections in over 40 countries. Of our total net sales, 57.2%, 44.2% and 49.3% were generated from outside the United States in the years ended December 31, 2010, 2009 and 2008, respectively, and we expect that our international operations will continue to grow. As such, our international operations are subject to a number of risks that could have a material adverse effect on our business, financial condition, results of operations or cash flow, including:
- •
- difficulty in enforcing agreements in foreign legal systems;
- •
- foreign countries may impose additional withholding taxes or otherwise tax our foreign income, impose tariffs or adopt
other restrictions on foreign trade and investment, including currency exchange controls;
- •
- potentially adverse tax consequences;
- •
- fluctuations in exchange rates may affect product demand and may adversely affect our profitability in U.S. dollars;
- •
- potential noncompliance with a wide variety of laws and regulations, including the U.S. Foreign Corrupt Practices Act of
1977 ("FCPA"), the Office of Foreign Assets Control and similar non-U.S. laws and regulations;
- •
- inability to obtain, maintain or enforce intellectual property rights;
- •
- labor strikes, especially those affecting transportation and shipping;
- •
- risk of nationalization of private enterprises;
- •
- changes in general economic and political conditions in the countries in which we operate, including changes in the
government incentives our Solar module manufacturing customers and their customers are relying on;
- •
- unexpected adverse changes in foreign laws or regulatory requirements, including those with respect to local content
rules, environmental protection, export duties and quotas;
- •
- disruptions in our business operations or damage to strategic assets that may not be recoverable from applicable insurance
policies caused by potential unfavorable weather patterns in certain locations of the world including, but not limited to, earthquakes, typhoons and hurricanes;
- •
- difficulty with staffing and managing widespread operations; and
- •
- difficulty of and costs relating to compliance with the different commercial and legal requirements of the international markets in which we operate.
33
In late 2008, in the course of routine monitoring of our internal control, we discovered payments made and expenses incurred in our international Quality Assurance operations in India and China that may have been in violation of the FCPA as well as local law, which resulted in personnel changes and our adoption of enhanced FCPA-related policies, procedures, training and controls. It is possible that despite these efforts, additional FCPA or anti-corruption issues may arise in the future. We also self-reported the existence of these payments to the U.S. Department of Justice in 2009, which has not taken any action with respect to the reported matters. Any actions by this or any other governmental agencies, or any failure by us to comply with the FCPA or other anti-corruption laws, could have a material adverse effect on our business, financial condition, results of operations or cash flow.
Fluctuations in exchange rates could have an adverse effect on our results of operations, even if our underlying business results improve or remain steady.
Our reporting currency is the U.S. dollar, and we are exposed to foreign exchange rate risk because a significant portion of our net sales and costs are currently denominated in a number of foreign currencies, primarily Euros, Hong Kong dollars, Chinese renminbi and British pounds sterling, which we convert to U.S. dollars for financial reporting purposes. We do not engage in any hedging activities with respect to currency fluctuations. Changes in exchange rates on the translation of the earnings in foreign currencies into U.S. dollars are directly reflected in our financial results. As such, to the extent the value of the U.S. dollar increases against these foreign currencies, it will negatively impact our net sales, even if our results of operations have improved or remained steady. While the currency of our net sales and costs are generally matched, to the extent our costs and net sales are not denominated in the same currency for a particular location, we could experience further exposure to foreign currency fluctuations. We cannot predict the impact of future exchange rate fluctuations on our results of operations and may incur net foreign currency losses in the future.
Our indebtedness could adversely affect our financial health, harm our ability to react to changes to our business and prevent us from fulfilling our obligations under our indebtedness.
We have a significant amount of indebtedness. As of December 31, 2010, we had total indebtedness of approximately $238.5 million. Based on that level of indebtedness and interest rates applicable at December 31, 2010, our annual interest expense would have been $10.0 million. Although we believe that our current cash flows will be sufficient to cover our annual interest expense, any increase in the amount of our indebtedness or any decline in the amount of cash available to make interest payments could require us to divert funds identified for other purposes for debt service and impair our liquidity position.
Our indebtedness could also have other significant consequences. For example, it could:
- •
- increase our vulnerability to general economic downturns and adverse competitive and industry conditions;
- •
- require us to dedicate a substantial portion, if not all, of our cash flow from operations to payments on our
indebtedness, thereby reducing the availability of our cash flow to fund working capital, capital expenditures and other general corporate expenditures;
- •
- limit our flexibility in planning for, or reacting to, changes in our businesses and the industries in which we operate,
including our ability to build new facilities or acquire new equipment;
- •
- place us at a competitive disadvantage compared to competitors that have less debt;
- •
- limit our ability to raise additional financing on satisfactory terms or at all; and
34
- •
- adversely impact our ability to comply with the financial and other restrictive covenants in the agreements governing our credit facilities, which could result in an event of default under such agreements.
Increases in interest rates could increase interest payable under our variable rate indebtedness.
We are subject to interest rate risk in connection with our variable rate indebtedness. Interest rate changes could increase the amount of our interest payments and thus negatively impact our future earnings and cash flows. We currently estimate that our annual interest expense on our floating rate indebtedness would increase by approximately $2.4 million, for each increase in interest rates of 1%. If we do not have sufficient earnings, we may be required to refinance all or part of our existing debt, sell assets, borrow more money or sell more securities, none of which we can guarantee we will be able to do. Due to our interest rate swap expiring on September 30, 2010, we do not have any of our variable interest rate debt hedged. We do not plan to hedge our variable interest rate debt in the near term.
Despite current indebtedness levels, we and our subsidiaries may still be able to incur substantially more debt. This could further exacerbate the risks associated with our substantial leverage.
We and our subsidiaries may be able to incur substantial additional indebtedness in the future. Although the agreements governing our credit facilities contain restrictions on the incurrence of additional indebtedness, these restrictions are subject to a number of qualifications and exceptions, and the indebtedness incurred in compliance with these restrictions could be substantial. For example, we had $20.0 million of borrowings available under our revolving credit facility as of December 31, 2010. If we incur additional debt above the levels currently in effect, the risks associated with our substantial leverage would increase.
To service our indebtedness, we will require a significant amount of cash. Our ability to generate cash depends on many factors beyond our control.
Our ability to make payments on and to refinance our indebtedness and to fund our operations will depend on our ability to generate cash in the future, which, to a certain extent, is subject to general economic, financial, competitive, legislative, regulatory and other factors that are beyond our control. Specific events that might adversely affect our cash flow include the loss of a key customer or declines in orders for our products or decreased use of our services. Accordingly, we may not be able to generate cash to service our indebtedness, which could lead to a default under our credit agreements and adversely affect our financial condition.
We are a holding company with no business operations of our own and depend on our subsidiaries for cash.
We are a holding company with no significant business operations of our own. Our operations are conducted through our subsidiaries. Dividends from, and cash generated by, our subsidiaries are our principal sources of cash to repay indebtedness, fund operations and pay dividends, if any, which such payment is restricted under the terms of our credit facilities. Accordingly, our ability to repay our indebtedness, fund operations and pay any dividends to our stockholders is dependent on the earnings and the distributions of funds from our subsidiaries. The agreements governing our credit facilities significantly restrict our subsidiaries from paying dividends and otherwise transferring cash or other assets to us. In addition, our subsidiaries are permitted under the agreements governing our credit facilities to incur additional indebtedness that may severely restrict or prohibit the making of distributions, the payment of dividends or the making of loans by our subsidiaries to us.
35
Restrictive covenants in the agreements governing our credit facilities may restrict our ability to pursue our business strategies.
The agreements governing our credit facilities contain a number of restrictive covenants that impose significant operating and financial restrictions on us and may limit our ability to pursue our business strategies or undertake actions that may be in our best interests. Our credit facilities include covenants restricting, among other things, our ability to:
- •
- incur or guarantee additional debt;
- •
- incur liens;
- •
- make loans and investments and complete acquisitions;
- •
- make capital expenditures;
- •
- declare or pay dividends, redeem or repurchase common stock, or make certain other restricted payments;
- •
- complete mergers, consolidations and dissolutions;
- •
- modify or prepay our second lien credit facility or other material subordinated indebtedness;
- •
- issue redeemable, convertible or exchangeable equity securities;
- •
- sell assets and engage in sale-leaseback transactions;
- •
- enter into transactions with affiliates; and
- •
- alter the nature of our business.
Compliance with environmental and health and safety regulations can be expensive, and noncompliance with these regulations may result in adverse publicity, potentially significant liabilities and monetary damages and fines.
We are required to comply with federal, state, local and foreign laws and regulations regarding protection of the environment and health and safety. If more stringent laws and regulations are adopted in the future, the costs of compliance with these new laws and regulations could be substantial. If we do not comply with such present or future laws and regulations or related permits, we may be required to pay substantial fines, suspend production or cease operations. We use, generate and discharge hazardous substances, chemicals and wastes in our product development, testing and manufacturing activities. In addition, some of our facilities are located on properties with a history of use involving hazardous substances, chemicals and wastes and may be contaminated. For example, during 2010, we performed a Phase II environmental site assessment at our 10 Water Street, Enfield, Connecticut location. During our investigation, the site was found to contain a presence of volatile organic compounds. Any failure by us to control the use of, to remediate the presence of, or to restrict adequately the discharge of, such substances, chemicals or wastes could subject us to potentially significant liabilities, clean-up costs, monetary damages, fines or suspensions in our business operations. See "Item 1—Business—Environmental Regulation."
We may undertake acquisitions, investments, joint ventures or other strategic alliances, which may have a material adverse effect on our ability to manage our business, and such undertakings may be unsuccessful.
Acquisitions, joint ventures and strategic alliances may expose us to new operational, regulatory, market and geographic risks as well as risks associated with additional capital requirements.
These risks include:
- •
- our inability to integrate new operations, personnel, products, services and technologies;
36
- •
- unforeseen or hidden liabilities, including exposure to lawsuits associated with newly acquired companies;
- •
- the diversion of resources from our existing businesses;
- •
- disagreement with joint venture or strategic alliance partners;
- •
- contravention of regulations governing cross-border investment;
- •
- failure to comply with laws and regulations, as well as industry or technical standards of the overseas markets into which
we expand;
- •
- our inability to generate sufficient net sales to offset the costs and expenses of acquisitions, strategic investments,
joint venture or other strategic alliances;
- •
- potential loss of, or harm to, employees or customer relationships;
- •
- diversion of our management's time; and
- •
- disagreements as to whether opportunities belong to us or the joint venture.
Any of these events could disrupt our ability to manage our business, which in turn could have a material adverse effect on our financial condition and results of operations. Such risks could also result in our failure to derive the intended benefits of the acquisitions, strategic investments, joint ventures or strategic alliances, and we may be unable to recover our investment in such initiatives.
Risks Related to Owning Our Common Stock
As a public company, we are subject to additional financial and other reporting and corporate governance requirements that may be difficult for us to satisfy.
We have historically operated our business as a private company. Since the completion of our IPO, we are now required to file with the SEC annual and quarterly information and other reports that are specified in Section 13 of the Securities Exchange Act of 1934, as amended, or the Exchange Act. We are required to ensure that we have the ability to prepare financial statements that are fully compliant with all SEC reporting requirements on a timely basis. We are also subject to other reporting and corporate governance requirements, including the requirements of the New York Stock Exchange ("NYSE"), and certain provisions of the Sarbanes-Oxley Act of 2002 and the regulations promulgated thereunder, which impose significant compliance obligations upon us.
Beginning in 2011, we will be considered an accelerated filer and our timing to file SEC financial statements will be shortened. In particular, our Quarterly Report on Form 10-Q will be due within 40 days following the end of each fiscal quarter compared to within 45 days in 2010. We will also be required to comply with the SEC requirement to file our financial statements in extensible business reporting language ("XBRL") which is a computer language for electronic communication of business and financial data. We may not be successful in implementing these requirements and implementing them could adversely affect our business or operating results. In addition, if we fail to implement the requirements with respect to our internal accounting and audit functions, our ability to report our operating results on a timely and accurate basis could be impaired.
We have implemented the standards required by Section 404 of the Sarbanes-Oxley Act of 2002 ("Section 404"), and failure to maintain effective internal control over financial reporting in accordance with Section 404 could have a material adverse effect on us.
We have documented and tested our internal control procedures to satisfy the requirements of Section 404, which requires an annual management assessment of the effectiveness of our internal control over financial reporting. If, as a public company, we are not able to maintain adequate
37
compliance with the requirements of Section 404 in future years, our independent registered public accounting firm may not be able to attest to the effectiveness of our internal control over financial reporting. If we are unable to maintain adequate internal control over financial reporting, we may be unable to report our financial information on a timely basis, may suffer adverse regulatory consequences or violations of applicable stock exchange listing rules and may breach the covenants under our credit facilities. There could also be a negative reaction in the financial markets due to a loss of investor confidence in us and the reliability of our financial statements.
Insiders have substantial control over us, which could limit your ability to influence the outcome of key transactions, including a change of control.
Our principal stockholders, directors and executive officers and entities affiliated with them owned approximately 33% of the outstanding shares of our common stock at December 31, 2010. As a result, these stockholders, if acting together, would be able to influence or control matters requiring approval by our stockholders, including the election of directors and the approval of mergers or other extraordinary transactions. They may also have interests that differ from yours and may vote in a way with which you disagree and which may be adverse to your interests. In addition, we have elected to opt out of Section 203 of the Delaware General Corporation Law, which prohibits a publicly-held Delaware corporation from engaging in a "business combination" with an "interested stockholder," and we will be able to enter into such transactions with our principal stockholders. The concentration of ownership may have the effect of delaying, preventing or deterring a change of control of our Company, could deprive our stockholders of an opportunity to receive a premium for their common stock as part of a sale of our Company and might ultimately affect the market price of our common stock.
We expect that our stock price may continue to fluctuate significantly, which could cause the value of your investment to decline, and you may not be able to resell your shares at or above the applicable purchase price.
Securities markets worldwide have experienced, and are likely to continue to experience, significant price and volume fluctuations. This market volatility, as well as general economic, market or political conditions, could reduce the market price of our common stock regardless of our operating performance. The trading price of our common stock is likely to continue to be volatile and subject to wide price fluctuations in response to various factors, including:
- •
- market conditions in the broader stock market;
- •
- actual or anticipated fluctuations in our financial and operating results;
- •
- introduction of new products or services by us or our competitors;
- •
- issuance of new or changed securities analysts' reports or recommendations;
- •
- investor perceptions of us and the solar energy industry or quality assurance industry;
- •
- sales, or anticipated sales, of large blocks of our stock;
- •
- additions or departures of key personnel;
- •
- regulatory or political developments;
- •
- litigation and governmental investigations; and
- •
- changing economic conditions.
These and other factors may cause the market price and demand for our common stock to fluctuate substantially, which may limit or prevent investors from readily selling their shares of common stock and may otherwise negatively affect the liquidity of our common stock. In addition, in the past,
38
when the market price of a stock has been volatile, holders of that stock have sometimes instituted securities class action litigation against the company that issued the stock. If any of our stockholders brought a lawsuit against us, we could incur substantial costs defending the lawsuit. Such a lawsuit could also divert the time and attention of our management from our business, which could significantly harm our profitability and reputation.
If a substantial number of shares are sold in a short period of time, the market price of our common stock could decline.
If our stockholders sell substantial amounts of our common stock in the public market, the market price of our common stock could decrease significantly. The perception in the public market that such stockholders might sell shares of common stock could also depress the market price of our common stock. As of March 7, 2011, we had 41,507,247 shares of our common stock outstanding, some of which is subject to vesting. Our directors, executive officers and affiliates hold 13,764,764 of these shares. Subject to Rule 144 holding periods and vesting, these shares are eligible for sale in the public market. A decline in the price of shares of our common stock might impede our ability to raise capital through the issuance of additional shares of our common stock or other equity securities.
If securities or industry analysts do not publish research or reports about our business, if they adversely change their recommendations regarding our stock or if our results of operations do not meet their expectations, our stock price and trading volume could decline.
The trading market for our common stock will be influenced by the research and reports that industry or securities analysts publish about us or our business. If one or more of these analysts cease coverage of our Company or fail to publish reports on us regularly, we could lose visibility in the financial markets, which in turn could cause our stock price or trading volume to decline. Moreover, if one or more of the analysts who cover us downgrade our stock, or if our results of operations do not meet their expectations, our stock price could decline.
Some provisions of Delaware law and our certificate of incorporation and bylaws may deter third parties from acquiring us and diminish the value of our common stock.
Our certificate of incorporation and bylaws provide for, among other things:
- •
- restrictions on the ability of our stockholders to call a special meeting and the business that can be conducted at such
meeting;
- •
- restrictions on the ability of our stockholders to remove a director or fill a vacancy on the board of directors;
- •
- our ability to issue preferred stock with terms that the board of directors may determine, without stockholder approval;
- •
- the absence of cumulative voting in the election of directors;
- •
- a prohibition of action by written consent of stockholders unless such action is recommended by all directors then in
office; and
- •
- advance notice requirements for stockholder proposals and nominations.
These provisions in our certificate of incorporation and bylaws may discourage, delay or prevent a transaction involving a change of control of our Company that is in the best interest of our minority stockholders. Even in the absence of a takeover attempt, the existence of these provisions may adversely affect the prevailing market price of our common stock if they are viewed as discouraging future takeover attempts.
39
We do not anticipate paying any cash dividends for the foreseeable future.
We currently intend to retain our future earnings, if any, for the foreseeable future, to repay indebtedness and to fund the development and growth of our business. We do not intend to pay any dividends to holders of our common stock and the agreements governing our credit facilities restrict our payment of dividends. As a result, capital appreciation in the price of our common stock, if any, will be your only source of gain on an investment in our common stock.
Our certificate of incorporation contains a provision renouncing our interest and expectancy in certain corporate opportunities.
Our certificate of incorporation provides for the allocation of certain corporate opportunities between us and DLJ Merchant Banking Partners IV, L.P. and its affiliated investment funds, or DLJMB. Under these provisions, neither DLJMB, its affiliates and subsidiaries, nor any of their officers, directors, agents, stockholders, members or partners will have any duty to refrain from engaging, directly or indirectly, in the same business activities or similar business activities or lines of business in which we operate. For instance, a director of our Company who also serves as a director, officer or employee of DLJMB or any of its subsidiaries or affiliates may pursue certain acquisition or other opportunities that may be complementary to our business and, as a result, such acquisition or other opportunities may not be available to us. These potential conflicts of interest could have a material adverse effect on our business, financial condition, results of operations or prospects if attractive corporate opportunities are allocated by DLJMB to itself or its subsidiaries or affiliates instead of to us.
ITEM 1B. Unresolved Staff Comments
None.
Our principal executive offices are located at 1699 King Street, Enfield, Connecticut 06082. As of December 31, 2010, our Solar business had five production facilities that are currently operational and one newly acquired facility that is being prepared for operations, and our Quality Assurance business operated a network of 17 laboratories, 80 inspection and audit offices and 22 sales offices in over 40 countries.
40
The following tables summarize information regarding our significant owned and leased properties as of December 31, 2010:
Location
|
Square Feet | Owned/Leased | |||
|---|---|---|---|---|---|
Corporate |
|||||
Enfield, Connecticut |
12,500 | Leased | |||
Solar |
|||||
East Windsor, Connecticut |
275,000 | Owned | |||
Asturias, Spain |
105,000 | Owned | |||
Johor, Malaysia |
80,000 | Owned | |||
Somers, Connecticut |
42,000 | Leased | |||
St. Augustine, Florida |
23,500 | Leased | |||
Enfield, Connecticut* |
18,000 | Owned | |||
Quality Assurance |
|||||
Shenzhen, China |
75,000 | Leased | |||
Hong Kong, China |
61,000 | Leased | |||
Enfield, Connecticut* |
51,500 | Owned | |||
Shanghai, China |
45,000 | Leased | |||
Canton, Massachusetts |
44,000 | Leased | |||
Reading, United Kingdom |
30,000 | Leased | |||
Taipei, Taiwan |
18,000 | Leased | |||
Haryana, India |
16,500 | Leased | |||
Steinach, Switzerland |
16,000 | Leased | |||
Nottingham, United Kingdom |
12,000 | Leased | |||
Istanbul, Turkey |
10,000 | Leased | |||
Los Angeles, California |
6,000 | Leased | |||
Stroudsburg, Pennsylvania |
3,500 | Leased | |||
Ho Chi Min City, Vietnam |
1,000 | Leased | |||
Etonhouse, Singapore |
1,000 | Leased | |||
- *
- Co-located.
From time to time, we evaluate our production and service needs and may close or consolidate existing facilities or open new facilities.
From time to time, we are and have been a party to litigation that arises in the ordinary course of our business. We have no material litigation pending at this time other than as set forth below.
Galica/JPS
As previously disclosed, in October 2007, we filed a complaint against James P. Galica ("Galica") and JPS Elastomerics Corp. ("JPS") in the Massachusetts Superior Court in Hampshire County (the "Court"). We alleged that the defendants misappropriated trade secrets and violated the Massachusetts Unfair and Deceptive Trade Practices Act as well as breaches of contract, the implied covenant of good faith and fair dealing, and fiduciary duty against Galica (the "State Court Action"). The Court determined that JPS and Galica had violated the Massachusetts Unfair and Deceptive Trade Practices Act, finding that the technology for our polymeric sheeting product is a trade secret and that JPS and Galica had misappropriated our trade secrets. On January 27, 2011, the Court awarded us the right to recover from the defendants (i) actual monetary damages of $1.1 million, (ii) punitive damages of
41
$2.2 million, (iii) reasonable attorneys fees of $3.9 million, (iv) reasonable costs of $1.1 million, and (v) 12% interest on each of the monetary awards from the date of the judgment (except for the actual monetary damages which accrues interest from October 2, 2007, the date the complaint was entered). In addition, the Court imposed a five year production injunction against producing low shrink EVA encapsulant, and a permanent use injunction against the defendants using our trade secrets. On January 28, 2011, the defendants filed a motion seeking to stay certain elements of the injunction which was denied by the Court on February 8, 2011. The defendants filed a motion appealing the Court's denial of its motion as well as a notice of appeal with respect to the Court's order in favor of us. On February 28, 2011, the Massachusetts Appeals Court denied JPS's appeal of the lower court's denial of the request for a stay. On March 4, 2011, the defendants filed a petition to stay or modify the injunction pending appeal with the Massachusetts Supreme Judicial Court as well as an emergency motion for an immediate stay pending full briefing and hearing of the petition. The Supreme Judicial Court denied the defendants' emergency motion on March 7, 2011. To date, the Supreme Judicial Court has not taken action on the defendants' petition.
On September 17, 2010, JPS filed an amended complaint against our wholly-owned subsidiary, Specialized Technology Resources, Inc. ("STR"), in the U.S. District Court for the District of Massachusetts. The amended complaint alleged various antitrust and unfair competition claims and that the State Court Action (described above) was sham litigation initiated by STR in an attempt to monopolize the domestic and international market for low-shrink EVA encapsulants. JPS also alleged other schemes to monopolize and unfair competition in violation of federal and state laws. JPS sought $60.0 million in compensatory damages, treble damages, a permanent injunction against STR for various activities, reimbursement of legal fees for the State Court Action as well as for this matter, and disgorgement of proceeds obtained by STR from allegedly anti-competitive and tortious acts. On October 13, 2010, we filed a motion to dismiss the amended complaint, and on January 5, 2011 the Court held a hearing on STR's motion to dismiss. At the hearing, the Court ruled in favor of STR and dismissed the case. On January 14, 2011, the Court issued its written opinion dismissing the case and on January 24, 2011 STR filed a motion for Rule 11 sanctions against the defendants and their counsel. On February 10, 2011, JPS filed a notice of appeal with the Appellate Court. The First Circuit Court of Appeals has scheduled a settlement conference and set a briefing schedule in this matter. The settlement conference is set for April 14, 2011. JPS' brief is due on April 18, 2011 and STR's brief will be due thirty days after JPS serves its brief. We intend to continue to vigorously defend this action which we consider meritless and to pursue our motion for Rule 11 sanctions against JPS and its counsel.
We do not intend to record any gain related to the state court judgment until the settlement cash proceeds are received by us.
ITEM 4. (Removed and Reserved)
42
ITEM 5. Market for Registrant's Common Equity, Related Stockholder Matters and Issuer Purchases of Equity Securities
Our common stock began trading on the NYSE on November 6, 2009 under the symbol "STRI." Prior to this, there was no public market for our common stock. At March 7, 2011, there were approximately 2,500 holders of record of our common stock.
The table below sets forth the high and low sales prices per share of our common stock reported on the NYSE since our IPO for the periods indicated.
| |
Common Stock Price Range |
|||||||
|---|---|---|---|---|---|---|---|---|
| |
High | Low | ||||||
Fiscal 2010 |
||||||||
1st Quarter |
$ | 25.20 | $ | 15.06 | ||||
2nd Quarter |
23.98 | 17.80 | ||||||
3rd Quarter |
27.66 | 18.11 | ||||||
4th Quarter |
28.16 | 17.56 | ||||||
| |
Common Stock Price Range |
|||||||
|---|---|---|---|---|---|---|---|---|
| |
High | Low | ||||||
Fiscal 2009 |
||||||||
1st Quarter |
$ | N/A | $ | N/A | ||||
2nd Quarter |
N/A | N/A | ||||||
3rd Quarter |
N/A | N/A | ||||||
4th Quarter |
16.56 | 9.50 | ||||||
At December 31, 2010, there were 41,458,478 shares issued and outstanding. Our authorized number of shares of common stock is 200,000,000 shares. The closing sale price per share of our common stock on March 7, 2011 was $16.24.
Dividend Program
We have not declared or paid cash dividends on our common stock during the two most recent fiscal years. We do not anticipate paying any cash dividends on our common stock for the foreseeable future and are currently restricted from doing so under the terms of our credit facilities. We intend to retain all available funds and any future earnings to fund the development and growth of our business and to reduce debt.
Any future determination to pay dividends will be at the discretion of our board of directors and will take into account:
- •
- restrictions in our credit facilities;
- •
- general economic and business conditions;
- •
- our financial condition and results of operations;
- •
- our capital requirements and the capital requirements of our subsidiaries;
- •
- the ability of our operating subsidiaries to pay dividends and make distributions to us; and
- •
- such other factors as our board of directors may deem relevant.
43
Issuer Purchases of Equity Securities
Our Board of Directors has not established a share repurchase program for our common stock. Share repurchases of our common stock are currently restricted under the terms of our credit facilities. We have no plans to repurchase shares for the foreseeable future other than what is potentially allowed under our Agreements upon the termination of an employee who exercises options for which we could repurchase up to $2 million in any fiscal year. Accordingly, as of December 31, 2010, no shares have been repurchased.
Sales of Unregistered Securities
We did not sell unregistered securities during 2010.
ITEM 6. Selected Financial Data
The following table sets forth our selected historical consolidated financial data for the periods and as of the dates indicated. The balance sheet data as of December 31, 2010, 2009, 2008, 2007 and 2006 and the statement of operations and other data for each of (i) the years ended December 31, 2010, 2009 and 2008, (ii) the period from June 15 to December 31, 2007, (iii) the period from January 1 to June 14, 2007 and (iv) the year ended December 31, 2006 are derived from our Consolidated Financial Statements. All amounts are stated in thousands except per share / unit amounts unless otherwise noted.
The basic and diluted net income per share and weighted-average shares outstanding data in the selected historical consolidated financial data table presented below give effect to our corporate reorganization, as described under "Item 7—Management's Discussion and Analysis of Financial Condition and Results of Operations—Overview."
On June 15, 2007, DLJMB and its co-investors, together with members of our board of directors, our executive officers and other members of management, through STR Holdings LLC, acquired Specialized Technology Resources, Inc. All periods prior to June 15, 2007 are referred to as "Predecessor," and all periods including and after such date are referred to as "Successor." The consolidated financial statements for all Successor periods are not comparable to those of the Predecessor periods.
The results indicated below and elsewhere in this Annual Report are not necessarily indicative of our future performance. You should read this information together with "Item 7—Management's
44
Discussion and Analysis of Financial Condition and Results of Operations" and our consolidated financial statements and related notes included in Item 8 of this Annual Report.
| |
Successor | Predecessor | ||||||||||||||||||
|---|---|---|---|---|---|---|---|---|---|---|---|---|---|---|---|---|---|---|---|---|
| |
Year Ended December 31, 2010 |
Year Ended December 31, 2009 |
Year Ended December 31, 2008 |
Period from June 15 to December 31, 2007 |
Period from January 1 to June 14, 2007 |
Year Ended December 31, 2006 |
||||||||||||||
Statement of Operations: |
||||||||||||||||||||
Net sales |
$ | 371,829 | $ | 264,945 | $ | 288,578 | $ | 109,284 | $ | 64,760 | $ | 130,607 | ||||||||
Operating income |
85,700 | 48,102 | 70,567 | 24,634 | 7,522 | 29,657 | ||||||||||||||
Net income |
$ | 49,311 | $ | 22,989 | $ | 28,105 | $ | 4,111 | $ | 732 | $ | 15,294 | ||||||||
Net income per share/unit data: |
||||||||||||||||||||
Basic |
$ | 1.22 | $ | 0.63 | $ | 0.78 | $ | 0.11 | $ | 0.08 | $ | 1.81 | ||||||||
Diluted |
$ | 1.17 | $ | 0.61 | $ | 0.75 | $ | 0.11 | $ | 0.08 | $ | 1.68 | ||||||||
Weighted-average shares/units outstanding: |
||||||||||||||||||||
Basic |
40,302,509 | 36,638,402 | 36,083,982 | 35,846,880 | 8,632,893 | 8,439,658 | ||||||||||||||
Diluted |
42,126,502 | 37,514,790 | 37,411,765 | 36,636,433 | 9,134,536 | 9,122,840 | ||||||||||||||
Amortization of intangibles |
$ | 11,503 | $ | 11,503 | $ | 11,503 | $ | 6,231 | $ | 50 | $ | 109 | ||||||||
Capital expenditures |
$ | 19,426 | $ | 17,833 | $ | 35,288 | $ | 10,064 | $ | 3,510 | $ | 2,604 | ||||||||
Cash and short-term investments |
$ | 106,630 | $ | 70,150 | $ | 27,868 | $ | 21,180 | $ | — | $ | 17,939 | ||||||||
Total assets |
$ | 702,846 | $ | 640,620 | $ | 620,922 | $ | 575,157 | $ | — | $ | 77,640 | ||||||||
Total debt |
$ | 238,525 | $ | 240,506 | $ | 257,521 | $ | 259,526 | $ | — | $ | 68,101 | ||||||||
Contingently redeemable units |
$ | — | $ | — | $ | 2,930 | $ | 1,463 | $ | — | $ | — | ||||||||
Total stockholders'/ unitholders' equity (deficit) |
$ | 328,040 | $ | 271,270 | $ | 211,967 | $ | 185,382 | $ | — | $ | (9,397 | ) | |||||||
ITEM 7. Management's Discussion and Analysis of Financial Condition and Results of Operations
The following discussion and analysis of the financial condition and results of our operations should be read together with "Item 6—Selected Financial Data" and our Consolidated Financial Statements and the related Notes included in Item 8 of this Annual Report. This discussion contains forward-looking statements, based on current expectations and related to future events and our future financial performance, that involve risks and uncertainties. Our actual results may differ materially from those anticipated in these forward-looking statements as a result of many factors, including those set forth under "Item 1A—Risk Factors" in this Annual Report. All amounts in thousands except share/unit amounts or unless otherwise noted.
Overview
We were founded in 1944 as a plastics research and development company and evolved into two core businesses: Solar encapsulant manufacturing and Quality Assurance services. We launched our Quality Assurance business in 1973 and we commenced sales of our Solar encapsulant products in the late 1970s.
45
We are a leading global provider of encapsulants to the solar module industry. The encapsulant is a critical component used in solar modules. Our PhotoCap® products consist primarily of ethylene-vinyl-acetate, or EVA, which is modified with additives and put through our proprietary manufacturing process to increase product stability and make the encapsulant suitable for use in extreme, long-term outdoor applications. We supply encapsulants to many of the major solar module manufacturers worldwide and believe we were the primary supplier of encapsulants to the majority of our top 10 customers in 2010. We believe this is due to our superior product performance, global manufacturing base, customer customer service and technical support. Our encapsulants are used in both crystalline silicon and thin-film solar modules. Our Solar segment net sales have increased from $9.9 million in 2003 to $259.2 million in 2010, representing a compound annual growth rate ("CAGR") of 59.4%.
Our Quality Assurance business is a leader in the consumer products quality assurance market. We believe our Quality Assurance business represents the only global testing services provider exclusively focused on the consumer products market. Our Quality Assurance business provides inspection, testing, auditing and consulting services that enable retailers and manufacturers to determine whether products and facilities meet applicable safety, regulatory, quality, performance, social and ethical standards. Our Quality Assurance net sales have increased from $66.5 million in 2003 to $112.6 million in 2010, representing a CAGR of 7.8%.
On June 15, 2007, DLJ Merchant Banking Partners IV, L.P. and affiliated investment funds ("DLJMB"), and its co-investors, together with members of our board of directors, our executive officers and other members of management, acquired 100% of the voting equity interests in our wholly-owned subsidiary, Specialized Technology Resources, Inc., for $365.6 million, including transaction costs. In connection with the acquisition:
- •
- DLJMB and its co-investors contributed $145.7 million in cash for approximately 81.6% of the voting
equity interests in STR Holdings LLC;
- •
- Dennis L. Jilot, our Chairman, President and Chief Executive Officer, Barry A. Morris, our Executive Vice President and
Chief Financial Officer, and Robert S. Yorgensen, our Vice President and President of STR Solar, exchanged a portion of their existing equity investments in Specialized Technology
Resources, Inc., valued at approximately $11.5 million, for approximately 6.4% of the voting equity interests in STR Holdings LLC;
- •
- other stockholders of Specialized Technology Resources, Inc., including some current and former employees and
former directors, exchanged a portion of their existing equity investments in Specialized Technology Resources, Inc., valued at approximately $21.5 million, for approximately 12.0% of
the voting equity interests in STR Holdings LLC;
- •
- Specialized Technology Resources, Inc., as borrower, and STR Holdings LLC, as a guarantor, entered into a
first lien credit facility providing for a fully drawn $185.0 million term loan facility and an undrawn $20.0 million revolving credit facility and a second lien credit facility
providing for a fully drawn $75.0 million term loan facility, in each case, with Credit Suisse, as administrative agent and collateral agent; and
- •
- with the cash contributed from DLJMB and certain of its co-investors and the borrowings under our first lien and second lien credit facilities, STR Holdings LLC (i) purchased the remaining shares of stock in Specialized Technology Resources, Inc., for $324.7 million, (ii) repaid $61.7 million of debt held by Specialized Technology Resources, Inc., (iii) settled Specialized Technology Resources, Inc. stock options for $1.5 million, (iv) paid financing costs of $7.9 million and transaction costs of $4.4 million; and (v) retained the remaining $5.5 million in proceeds for working capital purposes.
We refer to the foregoing transactions collectively as the "DLJ Transactions."
46
Prior to November 5, 2009, we conducted our business through STR Holdings LLC and its subsidiaries. STR Holdings (New) LLC ("NewCo"), a Delaware limited liability company, was formed on September 30, 2009 as an indirect subsidiary of STR Holdings LLC and held no material assets and did not engage in any operations.
Pursuant to the corporate reorganization on November 5, 2009, STR Holdings LLC liquidated. A subsidiary of NewCo merged with and into Specialized Technologies Resources, Inc. ("STRI") and, as a result, STRI became a wholly-owned subsidiary of NewCo. The unitholders of STR Holdings LLC became unitholders of NewCo. On November 6, 2009, NewCo converted from a limited liability company into a Delaware 'C' corporation, named STR Holdings, Inc., and the outstanding units of NewCo converted into a single class of common stock of STR Holdings, Inc. pursuant to the terms of the LLC agreement.
On November 12, 2009, we closed our IPO of 12,300,000 shares of common stock at an offering price of $10 per share, of which 3,300,000 shares were sold by us and 9,000,000 shares were sold by selling stockholders, resulting in net proceeds to us of approximately $25.0 million after deducting underwriting discounts, commissions and other offering costs of approximately $7.8 million. Effective with the conversion of NewCo into STR Holdings, Inc., our outstanding units were automatically converted into shares of common stock and restricted common stock. In connection with our IPO, we repaid $15.0 million of borrowings under our first lien credit facility, and also paid $2.6 million to terminate an advisory services and monitoring agreement we entered into in connection with the DLJ Transactions.
Under the STR Holdings LLC Agreement, STR Holdings LLC's Class A, B, C, D, E and F units were subject to a priority distribution of shares of common stock in the event of an IPO. In connection with the IPO, the priority distribution of shares was based on our equity value as represented by the IPO price. For the units issued in connection with the DLJ Transactions, the shares of common stock were distributed as follows: (i) first, the Class A unitholders received an aggregate amount of common stock equal in value to their aggregate capital contributions; and (ii) second, a pro rata distribution was made with respect to the Class A, B, C, D and F units until the Class A unitholders received an aggregate amount of common stock equal in value to 2.5 times their aggregate capital contributions; and (iii) finally, a pro rata distribution was made of the remaining shares to each Class A, B, C, D, E and F unitholder based upon the number of units held by each unitholder. Class C and D incentive units that were issued in 2008 did not convert nor did any of the Class E incentive units that were issued as a result of not meeting the required aggregate value distribution thresholds.
The following table presents the number of shares of common stock and unvested restricted common stock issued for the respective units upon conversion. The number of shares of common stock and unvested restricted common stock issued was based upon the vesting provisions of the outstanding units and reflect the units vested and unvested at the date of conversion:
Class of Units
|
Shares of Common Stock |
Shares of Unvested Restricted Common Stock |
Total Shares of Common Stock |
||||||||
|---|---|---|---|---|---|---|---|---|---|---|---|
A units |
35,352,504 | 397,491 | 35,749,995 | ||||||||
B units |
195,053 | — | 195,053 | ||||||||
C units |
542,685 | 553,588 | 1,096,273 | ||||||||
D units |
176,211 | 217,884 | 394,095 | ||||||||
E units |
— | — | — | ||||||||
F units |
478,578 | 95,716 | 574,294 | ||||||||
Total |
36,745,031 | 1,264,679 | 38,009,710 | ||||||||
47
On December 7, 2009, we closed the partial exercise of the over-allotment option granted by the selling stockholders given in connection with the IPO which resulted in a total purchase of 1,695,000 shares at the IPO price of $10 per share. We did not receive any of the proceeds from the sale of the shares as a result of the exercise of the over-allotment option.
On April 21, 2010, we closed our secondary offering of 8,050,000 shares of our common stock on behalf of certain stockholders at $18.75 per share. The total offering size reflected the underwriters' exercise of their option to purchase an additional 1,050,000 shares from the selling stockholders to cover over-allotments. We did not receive any proceeds from the offering.
Business Segments, Components of Net Sales and Expenses and Anticipated Trends
We operate in two business segments: Solar and Quality Assurance.
Net Sales—Solar
Our Solar net sales are primarily derived from the sale of encapsulants to both crystalline silicon and thin-film solar module manufacturers. We expect that our results of operations, for the foreseeable future, will depend primarily on the sale of encapsulants to a relatively small number of our existing customers. Sales to First Solar and Suntech, each of which accounted for more than 10% of our Solar net sales, together accounted for 27.8% of our Solar net sales for the year ended December 31, 2010. Sales to First Solar accounted for 27.1% and 19.1% of our Solar net sales in the years ended December 31, 2009 and 2008, respectively. The top five customers in our Solar segment accounted for approximately 43.2%, 55.0% and 47.0% of our Solar net sales in the years ended December 31, 2010, 2009 and 2008, respectively. We are actively trying to penetrate a number of Tier 1 Chinese module manufacturers to increase our market share, and we expect that a larger proportion of our future Solar net sales to come from the Asia-Pacific region.
Net sales to our Solar customers have been typically made through non-exclusive, short-term purchase order arrangements that specify prices and delivery parameters but do not obligate the customer to purchase any minimum amounts. As our customers look to secure materials or access to our production capacity to support their module production, we have recently entered into, renewed or are in negotiations to enter into, contracts that may include periods of exclusivity and/or minimum purchase requirements. Although such contracts provide for the sale of encapsulants at lower prices than our shorter-term arrangements, they will provide greater predictability of demand. As of December 31, 2010, we had contracts with six of our top ten customers.
Our Solar net sales are significantly driven by end user demand for solar modules. As more solar modules are sold, there is greater demand from module manufacturers for our encapsulants. The solar power industry is impacted by a variety of factors, including government subsidies and incentives, worldwide economic conditions, environmental concerns, energy costs, the availability of polysilicon and other factors. A key demand driver for solar module growth in the future will be the ability of solar module manufacturers to reduce their cost structure. During 2010, overall solar industry demand increased and drove capacity expansion in the solar module supply chain. Increased competition from low cost countries, particularly China, and continued vertical integration of many manufacturers in the solar supply chain contributed to the increase in capacity. These events caused many module manufacturers to significantly reduce the average selling price of their modules. From an industry standpoint, the reduction in module selling prices has improved rates of return on solar investments for the end-user and is a long-term industry trend that we believe will help to bring solar energy closer to grid-parity and will drive increased demand for our encapsulants.
48
Demand for our encapsulants also depends, in large part, on government incentives aimed to promote greater use of solar energy. The type of government incentives vary from country to country and can change rapidly. For example, in Germany, which is currently the largest solar PV end-user market, the government enacted legislation that reduced feed-in tariffs beginning June 30, 2010. This event and the potential for further reductions drove significant end user demand for solar modules in 2010 which positively impacted our 2010 Solar net sales. In early 2011, the German government enacted further legislation to accelerate the annual year-end feed-in-tariff reduction to July 1, 2011 for roof-top systems and September 1, 2011 for ground-mount projects. As such, this announcement may result in the pull-in of demand from solar module manufacturers due to increased end-user demand being driven by the incentive to purchase a solar system prior to the enactment of the decreased feed-in tariff incentives. As such, we may see atypical Solar sales during the first half of 2011 that might not occur during the second half of 2011. If solar module demand in Germany continues to grow at a rate that the German government believes is excessive, the amount of PV installations that may qualify for feed-in-tariff incentives could be capped which would negatively impact our Solar net sales as overall solar module growth in the world's largest PV market would be limited. More recently, Italy has emerged as a significant solar market. The same risks identified for the German market now exist for the Italian market. Also, many European governments are currently experiencing sovereign debt issues. As such, a risk exists that some of these governments may reduce current subsidies provided for PV installations in conjunction with overall lower fiscal policy spending.
Even though we may see flat or reduced solar module demand in the European Union in the next few years compared to the growth experienced in 2010, we expect a sharp increase in demand for solar energy in the United States as a result of the American Recovery and Reinvestment Act passed in February 2009, which provides financial incentives for the development of renewable energy, as well as other renewable energy legislative initiatives. Also, many states, including California, have enacted renewable portfolio standards that require utilities to increase their production of energy from renewable energy sources including solar PV. China, India, Taiwan, Japan and other countries have also announced significant plans to increase their use of renewable energy, including solar.
Our Solar net sales are also affected by our ability to meet customer demand, both in terms of encapsulant production and timing of delivery. We have five operational encapsulant manufacturing facilities located in the United States, Spain and Malaysia with such capacity approximately split equally among the three continents. Our expansion strategy, guided by our customers' forecasts of their demand for our products and independent research on solar energy, is to meet our customers' anticipated growing demands and serve the markets in which they operate by adding production capacity as our customers, and the market for our products generally grow. We are in the process of increasing the size of our Malaysian facility's existing production and warehouse space by the end of the first quarter of 2011 to provide for total capacity of up to approximately 5.0 GW. In December 2010, we also acquired a 275,000 square foot manufacturing facility in East Windsor, Connecticut. This facility will provide us needed space for capacity to meet future demand and enable us to consolidate our Connecticut-based Solar operations. We expect the transition of manufacturing operations to occur during 2011. In addition, we have ordered approximately 3.5 GW of production capacity to be installed in our facilities by the end of 2011. As such, we expect to increase our global production capacity from 7.5 GW as of December 31, 2010 to approximately 11.0 GW by December 31, 2011.
Pricing of our encapsulants is impacted by the competition faced by our customers, and the quality and performance of our encapsulant formulations, including their impact on improving our customers' manufacturing yields, their history in the field, our ability to meet our customers' delivery requirements, overall supply and demand levels in the industry and our customer service and technical support. For 2010, we experienced a price decline of approximately 17% from the prior year that was mainly driven by price concessions exchanged for increased volumes associated with entering into formal contracts with some of our largest customers and customer mix. Encapsulant pricing has been more resilient than
49
other areas of the solar supply chain. We attribute this to several factors. Namely, our product is differentiated in terms of quality. These differences, which include greater dimensional stability, faster curing times and superior long-term stability, can have a substantial impact on factory yields and lifetime module output. With our encapsulant typically representing less than five percent of the cost of a module, our product continues to present a compelling internal rate of return. However, we do expect pricing pressure to continue throughout the industry and while we expect to be affected to a lesser degree than many other parts of the supply chain, we will not be immune.
Net Sales—Quality Assurance
We generate net sales in our Quality Assurance segment primarily by providing inspection, testing and audit services to our clients. We enter into contracts on a fixed price, time and material, or a cost-plus fixed fee basis. We also provide services on a non-contract basis pursuant to a fixed price list.
We have a broad client base, serving over 5,000 clients in 2010, with our top five clients accounting for approximately 16.1%, 22.1% and 18.0% of our Quality Assurance net sales in the years ended December 31, 2010, 2009 and 2008, respectively. Our Quality Assurance business operates a network of 17 laboratories, 80 inspection and audit offices and 22 sales offices in over 40 countries. In addition, because our Quality Assurance business serves a diverse and global client base, we strive to operate where such clients operate and where the products they purchase are manufactured. We are required to work with a partner in certain countries either because of local laws and regulations or because such arrangements are customary to doing business in such countries. Also, we may enter into strategic alliances with other quality assurance providers in order to meet client demands in countries where it may not be practicable for us to operate on a stand-alone basis.
Net sales in our Quality Assurance segment are typically lower in the first quarter of the year and peak in the second or third quarter of the year, in part due to the impact of holiday seasons on consumer products businesses. Pricing of our Quality Assurance services is based on pricing in the quality assurance industry, which is generally highly competitive.
During 2010, our Quality Assurance segment's net sales were negatively impacted by a reduction in services procured from us by certain clients in North America and Europe as well as overall softness in the consumer product quality assurance industry as retailers continued to reduce discretionary spending as the result of the uncertain economic environment. However, we expect future net sales to increase as worldwide economic conditions improve and as a result of the following favorable quality assurance industry trends:
- •
- Manufacturers and consumer products companies are increasingly seeking to determine whether the products designed or
manufactured by them or on their behalf meet applicable safety, regulatory, quality, performance, social and ethical standards;
- •
- Consumer products manufacturing occurs on a global basis, and many manufacturers operate in multiple countries on multiple
continents. In addition, many retailers, importers and manufacturers are outsourcing production to developing countries. Accordingly, retailers, importers and manufacturers are seeking quality
assurance providers with testing capabilities for their specific products in the countries where their products are being manufactured;
- •
- Product commercialization cycles continue to be shortened driving the need for increased quality assurance services as new
products are launched; and
- •
- Major product recalls have occurred that gathered significant adverse publicity and resulted in brand damage.
50
Cost of Sales—Solar
In our Solar segment, we manufacture all of the products that we sell. Our cost of sales in our Solar segment consists of our costs associated with raw materials and other components, direct labor, manufacturing overhead, salaries, other personnel-related expenses, write-off of excess or obsolete inventory, quality control, freight, insurance, disposition of defective product, depreciation of fixed assets and amortization of intangibles as a result of the DLJ Transactions. Approximately 75% of our Solar segment's cost of sales is variable in nature, 15% is step-variable and primarily relates to labor and utilities cost and is fixed in the short-term and the remaining 10% is fixed. Resin constitutes the majority of our raw materials and components costs at approximately 50% to 55% of our cost of sales, and paper liner is the second largest cost. The price and availability of resin and paper liner are subject to market conditions affecting supply and demand, have been volatile and cannot be hedged in the commodity markets.
Overall, we expect our Solar cost of sales, as a percentage of Solar net sales, to increase over the next several years due to (i) reduced pricing in response to lower overall solar module industry pricing driven by increased competition faced by our customers and reduced average selling price related to volume discounts and (ii) increased commodity costs, partially offset by (i) more efficient absorption of fixed costs driven by economies of scale, (ii) production efficiencies and (iii) continued cost reduction efforts.
Cost of Sales—Quality Assurance
In our Quality Assurance segment, we conduct our testing primarily at our facilities and incur travel expense when performing inspections and audits. Our cost of sales in our Quality Assurance segment consists primarily of our costs associated with direct labor, operational overhead, laboratory supplies, salaries and other personnel-related expenses, travel expenses, insurance, depreciation of fixed assets and amortization of intangibles. Labor and benefits represented our largest cost of Quality Assurance sales in the years 2010, 2009 and 2008 at 31.6%, 29.2% and 30.8% of Quality Assurance net sales, respectively. Our Quality Assurance segment is more fixed cost intensive than our Solar segment. As such, a reduction in sales volume, as we experienced in 2010, can have a negative impact to our financial results due to lower absorption of fixed costs. Although we expect our Quality Assurance cost of sales to increase as we expand our operations, we believe our Quality Assurance cost of sales as a percentage of Quality Assurance net sales will be positively affected by our focus to better optimize direct labor costs with sales volumes and leveraging of fixed costs.
Gross Profit
Gross profit is affected by numerous factors, including our average selling prices, fluctuations in foreign exchange rates, seasonality, our manufacturing costs and the effective utilization of our facilities. Another factor impacting gross profit is the time required for new production facilities and the expansion of existing facilities to reach full production capacity. As a result, gross profit varies from quarter to quarter and year to year. Also, our consolidated gross profit is impacted by the mix of our segment net sales since net sales in our Solar segment provide higher gross margins as a percentage of net sales than our Quality Assurance segment.
Selling, General and Administrative Expenses
Our selling expenses consist primarily of salaries, travel, commissions and other personnel-related expenses for employees engaged in sales, marketing and support of our products and services, trade shows and promotions. General and administrative expenses consist mainly of outside professional fees and expenses for our executive, finance, administrative, information technology, legal and human resource functions.
51
Research and development expense is also recorded in selling, general and administrative expenses. We incurred $1.8 million, $0.7 million and $0.4 million, respectively of research and development expense in 2010, 2009 and 2008, respectively. We have a long history of innovation dating back to our establishment in 1944 as a plastic and polymer research and development firm. As our operations have expanded from solely providing research and development activities into the manufacturing of solar encapsulants and providing quality assurance services, we have created a separate research and development function for employees and costs that are fully dedicated to research and development activities. Due to our legacy of innovation, other employees spend some of their time related to research and development activities. However, we do not allocate such costs or allocate overhead to research and development. Accordingly, such amounts are recorded in selling, general and administrative expenses as incurred.
Our selling, general and administrative expenses have increased in absolute terms over the past three years primarily as a result of increased headcount resulting from the strengthening of our management and corporate infrastructure, particularly in our finance and information technology departments, and increasing research and development, marketing, legal costs and stock-based compensation expense.
We expect our selling and marketing expenses and research and development expense to increase in absolute terms as we expand these functions. However, we do not expect them to increase as a percentage of total net sales.
Provision for Bad Debt Expense
We reserve for estimated losses that may result from the inability of our customers to make required payments. We review the collectability of our receivables on an ongoing basis and reserve for uncollectible accounts after reasonable collection efforts have been made and collection is deemed doubtful.
Earnings on Equity-Method Investments
We own 50% of the shares of CTC-Asia, Ltd., a joint venture with Le Centre Technique Cuir Chaussure Maroquinerie ("CTC"), which operates a laboratory in Hong Kong primarily involved in the testing of leather products. At December 31, 2010 and December 31, 2009, our investment in CTC-Asia, Ltd. was $1.0 million and $0.9 million, respectively, and classified as Other long-term assets in the Consolidated Balance Sheets.
Interest Income
Interest income is comprised of interest income earned on our cash and cash equivalents and short-term investments.
Interest Expense
Interest expense consists primarily of interest on borrowings under our credit facilities entered into in connection with the DLJ Transactions.
On October 5, 2009, we entered into an amendment to the first lien credit agreement and an amendment to the second lien credit agreement. The amendments for both credit agreements permitted us to enter into certain corporate reorganization transactions, including replacing STR Holdings LLC with STR Holdings (New) LLC as a guarantor under each credit agreement. The amendments and the repayment of $15.0 million of borrowings under our first lien credit facility with the proceeds from the IPO resulted in deferred financing costs of $1.1 million, which are being amortized to interest expense over the remaining term of the credit agreements.
52
Other Income (Expense) Items
Other income (expense) includes foreign currency transaction gains and losses and unrealized gains and losses on our interest rate swap. We were required under the terms of both our first lien and second lien credit facilities to fix our interest costs on at least 50% of the principal amount of our funded indebtedness within three months of entering into the credit facility for a minimum of three years. To manage our interest rate exposure and fulfill the requirements under our credit facilities, effective September 13, 2007, we entered into a $200.0 million notional principal amount interest rate swap agreement with Credit Suisse International that effectively converted a portion of our debt under our credit facilities from a floating interest rate to a fixed interest rate. The notional principal amount decreased to $130.0 million on October 1, 2008 and remained at that amount until the agreement expired on September 30, 2010. Under the interest rate swap agreement, we paid interest at 4.622% and received the floating three-month LIBOR rate from Credit Suisse International on the notional principal amount. Unrealized gains and losses on this interest rate swap represented the change in the fair value of the interest rate swap based on the floating interest rate and an assessment of counterparty credit risk. Our interest rate swap expired on September 30, 2010. We have not hedged any of our variable interest rate debt since the interest rate swap expired and do not plan to in the near term.
Income Taxes
Income tax expense is comprised of federal, state, local and foreign taxes based on income in multiple jurisdictions and changes in uncertain tax positions. We expect our effective tax rate to trend lower over time as we benefit from our ten year tax holiday in Malaysia.
Critical Accounting Policies
Our discussion and analysis of our consolidated financial position and results of operations are based upon our consolidated financial statements, which have been prepared in accordance with accounting principles generally accepted in the United States of America. The preparation of these financial statements requires us to make estimates and judgments that affect the reported amounts of assets, liabilities, net sales and expenses, and related disclosure of contingent assets and liabilities. On an ongoing basis, we evaluate our estimates including those related to bad debts, valuation of inventory, long-lived intangible and tangible assets, goodwill, product performance matters, income taxes and stock-based compensation. We base our estimates on historical experience and on various other assumptions that we believe to be reasonable under the circumstances. Actual results may differ from these estimates under different assumptions or conditions.
The accounting policies we believe to be most critical to understanding our financial results and condition and that require complex and subjective management judgments are discussed below.
Revenue Recognition and Accounts Receivable
We recognize revenue when evidence of an arrangement exists, delivery of the product or service has occurred and title and risk of loss have passed to the customer, the sales price is fixed or determinable and collectability of the resulting receivable is reasonably assured.
Our Solar business recognizes revenue from the manufacture and sale of its products either at the time of shipping or at the time the product is received at the customer's port or dock, depending upon terms of the sale.
Our Quality Assurance business performs testing, quality assurance and compliance consulting on a fixed-price, time and material, or a cost plus fixed-fee basis. The majority of our Quality Assurance
53
contracts provide one service deliverable to the client, and revenue is recognized upon completion of such service when a report is provided to the client.
A limited number of Quality Assurance contracts include the performance of multiple service offerings in an integrated package and are more long-term in nature. The amount of revenue recognized for these contracts amounted to approximately $2.9 million, $3.7 million and $5.0 million in the years ended December 31, 2010, December 31, 2009 and December 31, 2008, respectively. These contracts are accounted for under Accounting Standards Codification ("ASC") 605—Revenue Recognition. ASC 605 requires contract consideration in which multiple service offerings are provided under a single contract to be allocated to each specific service offering based on each portion of the contract's respective fair value in proportion to the contract's total fair value. We have determined that each deliverable under these contracts is a separate unit of accounting that possesses fair value that is represented by price lists and historical billing practices. We recognize revenue on each contract deliverable when the services have been completed and communicated to our client. Contractual termination provisions exist by which either party may cancel the contract with written notice. Upon notice, we are contractually entitled to receive compensation for all services performed up to and through the termination period.
Billing for these contracts occurs on a pre-determined schedule or at the end of the contractual term. Unbilled receivables represent revenue that has been recognized but not billed, while deferred revenues represent cash received from clients in excess of revenues recognized on contracts as the report has not been delivered.
Allowance for Doubtful Accounts
We maintain an allowance for doubtful accounts for estimated losses resulting from the inability of our customers to make required payments. We review the collectability of our receivables on an ongoing basis and write off accounts receivable after reasonable collection efforts have been made and collection is deemed questionable or the debt uncollectible.
Inventory Valuation
Our primary raw materials consist of resin, paper, packaging material and chemicals/additives. We typically maintain a 6 week stock of raw material inventory to ensure we can meet demand for our products and to help mitigate short-term commodity cost inflation.
Our finished goods inventories are made-to-order and possess a shelf life of six to nine months from the date of manufacture. Cost is determined on a first-in, first-out basis and includes both the costs of acquisition and the costs of manufacturing. These costs include direct material, direct labor and fixed and variable indirect manufacturing costs, including depreciation and intangible asset amortization.
We write inventory down to net realizable value when it is probable that our inventory carrying cost is not fully recoverable through sale or other disposition. Our write down considers overall market conditions, customer inventory levels, legal or contractual provisions and age of the finished goods inventories.
Prior to 2009, obsolescence was not a significant factor in the valuation of inventory. Due to the recessionary economic environment during the early part of 2009, some customers canceled or delayed the delivery of orders after the product was manufactured but not yet shipped. As such, $1.0 million of inventory write downs were recorded during the first half of the year ended December 31, 2009.
54
Intangible Assets
We account for business acquisitions using the purchase method of accounting and record definite-lived intangible assets separately from goodwill. Intangible assets are recorded at their estimated fair value based at the date of acquisition.
Our intangible assets include our customer relationships, trademarks, proprietary technology and accreditations as a result of the DLJ Transactions.
Our customer relationships consist of the value associated with existing contractual arrangements as well as expected value to be derived from future contract renewals of our Solar and Quality Assurance customers. We determined their value using the income approach. Their useful life was determined by consideration of a number of factors, including our longstanding customer base and historical attrition rates.
Our trademarks represent the value of our STR® and Photocap® trademarks. We determined their value using the "relief-from-royalty" method. The useful life of trademarks was determined by consideration of a number of factors, including elapsed time and anticipated future cash flows.
Our proprietary technology represents the value of our Solar manufacturing processes. We determined its value using the "relief-from-royalty" method. The useful life of proprietary technology was determined by consideration of a number of factors, including elapsed time, prior innovations and potential future technological changes.
Our accreditations represent the value of our Quality Assurance business's technical skills and ability to provide worldwide product testing, inspection and audits under applicable standards. We determined their value using the cost approach. The useful life for accreditations was determined by consideration of a number of factors, including the duration such accreditations were expected to be in effect and anticipated future cash flows.
Determining the fair value and useful lives of our intangible assets requires management's judgment and involves the use of significant estimates and assumptions, including assumptions with respect to future cash flows, discount rates, asset lives and market royalty rates, among other items. While we believe our estimates are reasonable, different assumptions regarding items such as future cash flows and volatility in the markets we serve could affect our evaluations and result in a future impairment charge to the carrying amount of our intangible assets.
In accordance with ASC 350—Intangibles—Goodwill and Other, we assess the impairment of our definite-lived intangible assets whenever changes in events or circumstances indicate that the carrying value of such assets may not be recoverable. During each reporting period, we assess if the following factors are present, which would cause an impairment review: a significant or prolonged decrease in sales that are generated under our trademarks and accreditations; loss of a significant customer or reduction in our customers' demand for our products driven by competition they encounter; a significant adverse change in the extent to or manner in which we use our accreditations, trademarks or proprietary technology; such assets becoming obsolete due to new technology or manufacturing processes entering the markets or an adverse change in legal factors, such as the change in feed-in tariff policy implemented by the Spanish government in 2008 or any potential plans to divest or dispose of such intangible assets, or certain Quality Assurance customers reducing the scope of services procured from us. We have assessed these factors during 2010 and concluded that no impairment indicators exist that would require an impairment valuation assessment. However, if we experience significant future reductions in our Quality Assurance net sales or a significant reduction of existing government incentives in the solar industry that are not offset by potential increases in solar programs in other countries, certain of our intangible assets may be subject to future potential impairment.
55
Long-Lived Assets
In accordance with ASC 360—Property, Plant, and Equipment, we evaluate the carrying value of our long-lived assets, including property, plant and equipment, for impairment when events or changes in circumstances indicate the carrying value of an asset may not be recoverable. If a long-lived asset is found to be impaired, the amount recognized for impairment is based on the difference between the carrying value and the asset's fair value. Fair value is estimated based upon discounted future cash flows or other reasonable estimates of fair market value.
Goodwill
Goodwill represents the excess of the purchase price consideration over the estimated fair value for the individual assets acquired and liabilities assumed. As a result of the DLJ Transactions, we allocated the goodwill to each of our reportable segments, Solar and Quality Assurance, which are our reporting units, based on the acquired net assets and on management's expectations regarding the extent to which each segment would benefit from the synergies of the acquired business. Our two reportable segments were determined to be our reporting units because they are two distinct operating segments, each of which is managed by its own president. Additionally, our board of directors and chief executive officer review financial information and allocate resources at the level of our reporting segments. We do not amortize goodwill, but instead test goodwill for impairment in accordance with the two-step method described in ASC 350. We perform our annual impairment review of goodwill on October 1, and also perform a review if at any time facts and circumstances warrant. In assessing if there is impairment to goodwill, we first determine the fair value of our two reporting units. We substantially passed the first step of the two-step impairment testing method on October 1, 2010. At that time, step one of the impairment analysis described in ASC 350 resulted in approximately $87.0 million of excess fair value over the carrying value. The excess of fair value over carrying value was approximately $39.3 million, or 11.3%, and $47.7 million, or 24.4%, for our Solar and Quality Assurance segments, respectively. If the fair value of either of our two segments were to be less than its carrying value, we would allocate the current fair value of the segment to the assets and liabilities of the segment to estimate the segment's goodwill. If such implied goodwill was less than the carrying value of such goodwill, we would record an impairment charge for the amount of such difference.
The estimate of fair value of each reporting unit was derived from the income approach that estimates the fair value of each of the reporting units using a discounted cash flow method. The estimates of future cash flows used were consistent with the objective of measuring fair value and incorporate assumptions that marketplace participants would use in their estimates of fair value, such as growth rates, discount rates and capital structure. In order to derive the fair value of each of the reporting units using the discounted cash flow method, the discount rate for each reporting unit was calculated. A discount rate is generally used in asset valuation as the rate at which a series of future cash flows or earnings is reduced to present value. In the goodwill impairment calculation, we based our assumption of a discount rate on the use of a weighted-average cost of capital method. In calculating the weighted-average cost of capital for each reporting unit, we believe income risk is best determined by comparing it to the risk levels of guideline companies that operate in either of our business segments. Using these guideline companies, we calculated a weighted-average cost of capital based on inputs that marketplace participants would use to discount their projected cash flow for each reporting unit. To ensure the assumptions we used in our estimate of our reporting units' fair value were reasonable, we reconciled the calculated fair values to the market capitalization of our common stock as of October 1, 2010 which was approximately $863.0 million.
Product Performance Accrual
We typically do not provide contractual warranties on our products. However, on limited occasions, we incur costs to service our products in connection with specific product performance matters.
56
Anticipated future costs for product performance matters are recorded as part of cost of sales and accrued liabilities for specific product performance matters when it is probable that a liability has been incurred and the amount of the liability can be reasonably estimated. During the second half of 2008, we recorded an accrual of $5.6 million relating to specific product performance matters, which amount represents management's best estimate of the costs to repair or replace such product. The majority of this accrual relates to a quality claim by one of our customers in connection with a non-encapsulant product that we purchased from a vendor in 2005 and 2006 and resold. We stopped selling this product in 2006 and are currently attempting to resolve this matter.
Income Taxes
We operate in multiple taxing jurisdictions and are subject to the jurisdiction of a number of U.S. and non-U.S. tax authorities and to tax agreements and treaties among those authorities. Operations in these jurisdictions are taxed on various bases, including income before taxes as calculated in accordance with jurisdictional regulations.
We account for income taxes using the asset and liability method in accordance with ASC 740—Income Taxes. Under this method, we recognize deferred tax assets and liabilities for the future tax consequences attributable to differences between the financial statement carrying amounts of existing assets and liabilities and their respective tax bases, and for operating loss and tax credit carryforwards. We estimate our deferred tax assets and liabilities using the enacted tax laws expected to apply to taxable income in the years in which those temporary differences are expected to be recovered or settled, and will recognize the effect of a change in tax laws on deferred tax assets and liabilities in the results of our operations during the period that includes the enactment date. We record a valuation allowance to reduce our deferred tax assets if we determine that it is more likely than not that some or all of the deferred tax assets will not be realized.
ASC 740 also addresses the accounting for uncertainty in income taxes recognized in a company's financial statements and how companies should recognize, measure, present and disclose uncertain tax positions that have been or are expected to be taken. Tax benefits related to uncertain tax positions taken or expected to be taken on a tax return are recorded when such benefits meet a more likely than not threshold. Otherwise, these tax benefits are recorded when a tax position has been effectively settled, which means that the appropriate taxing authority has completed its examination even though the statute of limitations remains open, or the statute of limitation expires. Interest and penalties related to uncertain tax positions are recognized as part of our provision for income taxes and are accrued beginning in the period that such interest and penalties would be applicable under relevant tax law until such time that the related tax benefits are recognized. We are currently under applicable tax authority audits for 2007 and 2008 in the United States and 2006, 2007 and 2008 in Spain.
Stock-Based Compensation
ASC 718—Compensation—Stock Compensation, addresses accounting for share-based awards, including stock options, with compensation expense measured using fair value and recorded over the requisite service or performance period of the award.
The fair value of stock options issued during the year ended December 31, 2010 and in November 2009 upon the closing of our IPO was determined using the Black-Scholes option pricing model. Our assumptions about stock-price volatility have been based exclusively on the implied volatilities of other publicly traded options to buy stock with contractual terms closest to the expected term of options granted to our employees. The expected term represents the estimated time until employee exercise considering vesting schedules and using the Hull-White model. The risk-free interest rate for periods within the contractual life of the award is based on the U.S. Treasury 10 year zero-coupon strip yield in
57
effect at the time of grant. The expected dividend yield was based on the assumption that no dividends are expected to be paid in the foreseeable future.
| |
Year Ended December 31, 2010 |
Year Ended December 31, 2009 |
|||
|---|---|---|---|---|---|
Volatility |
57.90 | % | 61.61 | % | |
Risk-free interest rates |
2.38 | % | 1.96 | % | |
Expected term |
4.9 to 5.0 Years | 2.7 to 4.9 Years | |||
Dividend yield |
0.00 | % | 0.00 | % | |
Weighted-average grant-date fair value |
$11.06 | $4.59 |
In 2008, we had previously issued restricted incentive units for purposes of equity compensation to members of management, employees and directors. Some of these units were subsequently converted into shares of either common or restricted common stock based on the amounts vested at the time of our IPO.
The fair value of each incentive unit granted during the year ended December 31, 2008 was determined on the respective date of the grant using a Black-Scholes option-pricing model that used the assumptions noted in the following table, along with the associated weighted-average fair values. The expected volatility was based on a peer group of companies. The risk-free rate was based on the U.S. Treasury yield curve in effect at the time of grant for periods corresponding with the expected life of the incentive units. The expected term represented the estimated time until a liquidity event. The expected dividend yield was based on the assumption that no dividends were expected to be distributed in the near future.
| |
Year Ended December 31, 2008 |
|||
|---|---|---|---|---|
Volatility |
60.00 | % | ||
Risk-free interest rate |
1.71 | % | ||
Expected term |
2.2 Years | |||
Dividend yield |
0.00 | % | ||
Weighted-average grant-date fair value: |
||||
Service-based |
$7.26 | |||
Performance-based |
$8.16 | |||
58
Consolidated Results of Operations
The following tables set forth our consolidated results of operations in dollars and as a percentage of total net sales, or in the case of segment cost of sales, the percentage of Solar net sales and Quality Assurance net sales, as applicable, for the fiscal years ended December 31, 2010, 2009 and 2008.
| |
Year Ended December 31, 2010 |
Year Ended December 31, 2009 |
Year Ended December 31, 2008 |
||||||||
|---|---|---|---|---|---|---|---|---|---|---|---|
| |
(dollars in thousands) |
||||||||||
Statement of Operations Data: |
|||||||||||
Net sales—Solar |
$ | 259,200 | $ | 149,521 | $ | 182,311 | |||||
Net sales—Quality Assurance |
112,629 | 115,424 | 106,267 | ||||||||
Total net sales |
371,829 | 264,945 | 288,578 | ||||||||
Cost of sales—Solar |
151,824 | 91,213 | 103,717 | ||||||||
Cost of sales—Quality Assurance |
75,934 | 75,759 | 70,930 | ||||||||
Total cost of sales |
227,758 | 166,972 | 174,647 | ||||||||
Gross profit |
144,071 | 97,973 | 113,931 | ||||||||
Selling, general and administrative expenses |
58,045 | 48,785 | 41,592 | ||||||||
Provision for bad debt expense |
494 | 1,403 | 1,950 | ||||||||
Earnings on equity-method investments |
(168 | ) | (317 | ) | (178 | ) | |||||
Operating income |
85,700 | 48,102 | 70,567 | ||||||||
Interest income |
111 | 136 | 249 | ||||||||
Interest expense |
(15,784 | ) | (17,068 | ) | (20,809 | ) | |||||
Foreign currency transaction loss |
(208 | ) | (134 | ) | (1,007 | ) | |||||
Unrealized gain (loss) on interest rate swap |
4,018 | 1,995 | (3,025 | ) | |||||||
Income before income tax expense |
73,837 | 33,031 | 45,975 | ||||||||
Income tax expense |
24,526 | 10,042 | 17,870 | ||||||||
Net income |
$ | 49,311 | $ | 22,989 | $ | 28,105 | |||||
59
| |
Year Ended December 31, 2010 |
Year Ended December 31, 2009 |
Year Ended December 31, 2008 |
||||||||
|---|---|---|---|---|---|---|---|---|---|---|---|
Statement of Operations Data: |
|||||||||||
Net sales—Solar |
69.7 | % | 56.4 | % | 63.2 | % | |||||
Net sales—Quality Assurance |
30.3 | % | 43.6 | % | 36.8 | % | |||||
Total net sales |
100.0 | % | 100.0 | % | 100.0 | % | |||||
Cost of sales—Solar |
58.6 | % | 61.0 | % | 56.9 | % | |||||
Cost of sales—Quality Assurance |
67.4 | % | 65.6 | % | 66.8 | % | |||||
Total cost of sales |
61.3 | % | 63.0 | % | 60.5 | % | |||||
Gross profit |
38.7 | % | 37.0 | % | 39.5 | % | |||||
Selling, general and administrative expenses |
15.6 | % | 18.4 | % | 14.4 | % | |||||
Provision for bad debt expense |
0.1 | % | 0.5 | % | 0.7 | % | |||||
Earnings on equity-method investments |
0.0 | % | 0.1 | % | 0.1 | % | |||||
Operating income |
23.0 | % | 18.2 | % | 24.5 | % | |||||
Interest income |
0.0 | % | 0.1 | % | 0.1 | % | |||||
Interest expense |
(4.2 | )% | (6.4 | )% | (7.2 | )% | |||||
Foreign currency transaction loss |
(0.1 | )% | (0.1 | )% | (0.3 | )% | |||||
Unrealized gain (loss) on interest rate swap |
1.1 | % | 0.8 | % | (1.0 | )% | |||||
Income before income tax expense |
19.9 | % | 12.5 | % | 15.9 | % | |||||
Income tax expense |
6.6 | % | 3.8 | % | 6.2 | % | |||||
Net income |
13.3 | % | 8.7 | % | 9.7 | % | |||||
Non-GAAP Earnings Per Share
To supplement our consolidated financial statements, we use a non-GAAP financial measure called non-GAAP net earnings per share ("EPS"). Non-GAAP EPS is defined for the periods presented in the following table. It should be noted that diluted weighted-average common shares outstanding are determined on a GAAP basis and the resulting share count is used for computing both GAAP and non-GAAP diluted EPS. All amounts are stated in thousands except per share amounts unless otherwise noted.
Management believes that non-GAAP EPS provides meaningful supplemental information regarding our performance by excluding certain expenses that may not be indicative of the core business operating results and may help in comparing current-period results with those of prior periods as well as with our peers. Non-GAAP EPS is one of the main metrics used by management and our Board of Directors to plan and measure our operating performance. In addition, through 2010, non-GAAP EPS was the only metric used to determine annual bonus compensation for our Chairman, President and Chief Executive Officer and Executive Vice President and Chief Financial Officer, and was also used in conjunction with segment Adjusted EBITDA to determine annual bonus compensation for our segment presidents under our management incentive plan.
Although we use non-GAAP EPS as a measure to assess the operating performance of our business, non-GAAP EPS has significant limitations as an analytical tool because it excludes certain material costs. Because non-GAAP EPS does not account for these expenses, its utility as a measure of our operating performance has material limitations. The omission of the substantial amortization expense associated with our intangible assets and deferred financing costs and stock-based compensation expense further limits the usefulness of this measure. Non-GAAP EPS also adjusts for the related tax effects of the adjustments and the payment of taxes is also a necessary element of our operations. Because of these limitations, management does not view non-GAAP EPS in isolation and
60
also uses other measures, such as Adjusted EBITDA, net income, net sales, gross margin and operating income, to measure operating performance.
| |
Year Ended December 31, 2010 (unaudited) |
Year Ended December 31, 2009 (unaudited) |
Year Ended December 31, 2008 (unaudited) |
|||||||
|---|---|---|---|---|---|---|---|---|---|---|
Net income |
$ | 49,311 | $ | 22,989 | $ | 28,105 | ||||
Adjustments to net income: |
||||||||||
Amortization of intangibles |
11,503 | 11,503 | 11,503 | |||||||
Amortization of deferred financing costs |
1,327 | 1,522 | 1,150 | |||||||
Stock-based compensation expense |
7,851 | 7,308 | 1,752 | |||||||
Termination of monitoring agreement |
— | 2,622 | — | |||||||
Secondary offering expense |
534 | — | — | |||||||
Tax effect of adjustments |
(6,400 | ) | (7,674 | ) | (4,655 | ) | ||||
Non-GAAP net income |
$ | 64,126 | $ | 38,270 | $ | 37,855 | ||||
Diluted shares outstanding |
42,126,502 | 37,514,790 | 37,411,765 | |||||||
Diluted net earnings per share |
$ |
1.17 |
$ |
0.61 |
$ |
0.75 |
||||
Diluted non-GAAP net earnings per share |
$ | 1.52 | $ | 1.02 | $ | 1.01 | ||||
Year Ended December 31, 2010 Compared to Year Ended December 31, 2009
The following tables set forth our consolidated results of operations in dollars and as a percentage of total net sales for the fiscal years ended December 31, 2010 and 2009.
Net Sales
| |
Years Ended December 31, | |||||||||||||||||||
|---|---|---|---|---|---|---|---|---|---|---|---|---|---|---|---|---|---|---|---|---|
| |
2010 | 2009 | |
|
||||||||||||||||
| |
Change | |||||||||||||||||||
| |
|
% of Total Net Sales |
|
% of Total Net Sales |
||||||||||||||||
| |
Amount | Amount | Amount | % | ||||||||||||||||
Net sales—Solar |
$ | 259,200 | 69.7 | % | $ | 149,521 | 56.4 | % | $ | 109,679 | 73.4 | % | ||||||||
Net sales—Quality Assurance |
$ | 112,629 | 30.3 | % | $ | 115,424 | 43.6 | % | $ | (2,795 | ) | (2.4 | )% | |||||||
Total net sales |
$ | 371,829 | 100.0 | % | $ | 264,945 | 100.0 | % | $ | 106,884 | 40.3 | % | ||||||||
Our consolidated net sales increased as a result of an increase in our Solar net sales, offset to a limited extent by a decrease in net sales in our Quality Assurance business as more fully described below.
Net Sales—Solar
Volume increased by approximately 109% mainly due to an industry wide improvement in the solar marketplace that increased demand for our encapsulants and our continued growth with Asian module manufacturers. Our 2009 results were negatively impacted by the Spanish government change in its feed-in tariff policy that occurred in 2008. This change resulted in reduced end user solar module demand that created excess module inventory in the supply chain. Additionally, there was a lack of available financing for solar projects due to global banking conditions. During the latter part of 2009
61
and through the year ended December 31, 2010, overall solar industry conditions improved and we have increased our net sales to Asian module manufacturers. Demand in 2010 also benefited from increased orders ahead of changes to feed-in tariffs in Germany that occurred at the end of June 2010. The German market continued to be strong during the second half of 2010 after the feed-in tariffs were changed and the European market was also strengthened by strong demand in Italy. This has led to an increase in solar module sales and increased demand for our encapsulants. The volume increase was partially offset by an average sales price decline of approximately 17%. The price decline was primarily driven by contracts entered into in the first half of 2010 with our largest customers where we obtained increased volume in exchange for a lower price. Also, the Euro declined approximately 5% which reduced the translation of our Europe net sales.
Net Sales—Quality Assurance
The net sales decline for the year ended December 31, 2010 was driven by a reduction in services procured from us by certain clients in North America and Europe as well as overall softness in the consumer product quality assurance industry as retailers continued to reduce discretionary spending as a result of the uncertain economic environment that existed for the majority of 2010.
Cost of Sales
| |
Years Ended December 31, | |||||||||||||||||||
|---|---|---|---|---|---|---|---|---|---|---|---|---|---|---|---|---|---|---|---|---|
| |
2010 | 2009 | |
|
||||||||||||||||
| |
Change | |||||||||||||||||||
| |
|
% of Total Net Sales |
|
% of Total Net Sales |
||||||||||||||||
| |
Amount | Amount | Amount | % | ||||||||||||||||
Cost of sales—Solar |
$ | 151,824 | 40.8 | % | $ | 91,213 | 34.4 | % | $ | 60,611 | 66.4 | % | ||||||||
Cost of sales—Quality Assurance |
$ | 75,934 | 20.4 | % | $ | 75,759 | 28.6 | % | $ | 175 | 0.2 | % | ||||||||
Total cost of sales |
$ | 227,758 | 61.3 | % | $ | 166,972 | 63.0 | % | $ | 60,786 | 36.4 | % | ||||||||
Cost of sales increased primarily due to increased raw material and direct labor costs associated with the increase in our Solar net sales as discussed above.
Cost of Sales—Solar
The increase in our Solar segment's cost of sales was mainly due to increased variable costs associated with the 109% increase in sales volume, raw material inflation of $6.8 million and higher labor and benefits of $2.9 million. The expansion of our Malaysia facility, which became operational in August 2009, resulted in an incremental cost of $22.2 million for the year ended December 31, 2010 compared with the same period in 2009.
Non-cash intangible asset amortization expense of $8.4 million was included in cost of sales for each of the years ended December 31, 2010 and 2009.
Cost of Sales—Quality Assurance
The increase in our Quality Assurance's cost of sales was mainly due to higher labor costs to support increased sales volume that did not materialize during 2010. However, the increased direct labor costs were partially mitigated by cost reductions initiated throughout 2010. Additionally, depreciation expense increased by approximately $0.8 million in 2010, mainly due to information technology systems being placed in service during 2010.
Non-cash intangible asset amortization expense of $3.1 million was included in cost of sales for each of the years ended December 31, 2010 and 2009.
62
Gross Profit
| |
Years Ended December 31, | ||||||||||||||||||
|---|---|---|---|---|---|---|---|---|---|---|---|---|---|---|---|---|---|---|---|
| |
2010 | 2009 | |
|
|||||||||||||||
| |
Change | ||||||||||||||||||
| |
|
% of Total Net Sales |
|
% of Total Net Sales |
|||||||||||||||
| |
Amount | Amount | Amount | % | |||||||||||||||
Gross profit |
$ | 144,071 | 38.7 | % | $ | 97,973 | 37.0 | % | $ | 46,098 | 47.1 | % | |||||||
Gross profit increased primarily due to the net sales increase in our Solar segment. Gross profit increased as a percentage of net sales primarily due to a higher mix of net sales in our higher margin Solar segment which accounted for 69.7% and 56.4% of our consolidated net sales for the years ended December 31, 2010 and 2009, respectively. Also, our Solar segment experienced increased operating leverage of fixed costs associated with our volume increase, partially offset by lower pricing, negative foreign exchange from our European operation and increased raw material costs. Also, our Quality Assurance segment was negatively impacted by higher labor costs and depreciation expense as well as lower fixed cost absorption driven by the decline in net sales.
Non-cash intangible asset amortization expense of $11.5 million reduced gross profit for each of the years ended December 31, 2010 and 2009.
Selling, General and Administrative Expenses ("SG&A")
| |
Years Ended December 31, | ||||||||||||||||||
|---|---|---|---|---|---|---|---|---|---|---|---|---|---|---|---|---|---|---|---|
| |
2010 | 2009 | |
|
|||||||||||||||
| |
Change | ||||||||||||||||||
| |
|
% of Total Net Sales |
|
% of Total Net Sales |
|||||||||||||||
| |
Amount | Amount | Amount | % | |||||||||||||||
SG&A |
$ | 58,045 | 15.6 | % | $ | 48,785 | 18.4 | % | $ | 9,260 | 19.0 | % | |||||||
Salaries and benefits increased $8.7 million for the year ended December 31, 2010 due to increased headcount in our sales, information technology and finance functions necessary to support our anticipated growth and operations as a public company. The increase in information technology costs was partially the result of a portion of such expense being capitalized in the prior year when the projects were in the development phase. We incurred $1.1 million of increased research and development expense as we continue to develop a pipeline of innovative products. We incurred $2.0 million of higher professional fees relating to increased legal costs associated with our continued litigation with JPS Elastomerics Corporation ("JPS") and accounting fees associated with Sarbanes-Oxley compliance. Non-cash stock-based compensation expense increased by approximately $0.5 million, mainly due to the issuance of stock options, which have accelerated vesting clauses, in connection with our initial public offering ("IPO") that occurred in November 2009. At the IPO date, we issued stock options for incentive units that only partially converted or did not convert to common shares. These stock options began vesting on January 31, 2010. Additional awards of options and stock were also granted through the year ended December 31, 2010. We project that, based on current stock options issued and outstanding, our stock-based compensation expense will be approximately $5.0 million for the year ending December 31, 2011. We incurred incremental expenses of $0.5 million in 2010 associated with the secondary offering by certain selling stockholders. These increases were partially offset by the elimination of DLJ management advisory fees of $3.2 million that were paid in the prior year pursuant to the DLJ acquisition agreements.
63
Provision for Bad Debt Expense ("Bad debt")
| |
Years Ended December 31, | ||||||||||||||||||
|---|---|---|---|---|---|---|---|---|---|---|---|---|---|---|---|---|---|---|---|
| |
2010 | 2009 | |
|
|||||||||||||||
| |
Change | ||||||||||||||||||
| |
|
% of Total Net Sales |
|
% of Total Net Sales |
|||||||||||||||
| |
Amount | Amount | Amount | % | |||||||||||||||
Bad debt |
$ | 494 | 0.1 | % | $ | 1,403 | 0.5 | % | $ | (909 | ) | (64.8 | )% | ||||||
Bad debt expense decreased as a result of improved worldwide economic conditions. Also, we increased resources and improved accounts receivable processes in certain locations which have improved our cash collections.
Interest Expense
| |
Years Ended December 31, | ||||||||||||||||||
|---|---|---|---|---|---|---|---|---|---|---|---|---|---|---|---|---|---|---|---|
| |
2010 | 2009 | |
|
|||||||||||||||
| |
Change | ||||||||||||||||||
| |
|
% of Total Net Sales |
|
% of Total Net Sales |
|||||||||||||||
| |
Amount | Amount | Amount | % | |||||||||||||||
Interest expense |
$ | 15,784 | 4.2 | % | $ | 17,068 | 6.4 | % | $ | (1,284 | ) | (7.5 | )% | ||||||
The decrease in the period was primarily the result of lower debt levels driven by the $15.0 million repayment made in November 2009 in conjunction with our IPO and $0.2 million of lower amortization of deferred financing costs. Also, interest rates on our variable rate debt were slightly lower in 2010 compared to 2009 and were partially offset by lower proceeds received from our interest rate swap.
Other Income Items
| |
Years Ended December 31, | ||||||||||||||||||
|---|---|---|---|---|---|---|---|---|---|---|---|---|---|---|---|---|---|---|---|
| |
2010 | 2009 | |
|
|||||||||||||||
| |
Change | ||||||||||||||||||
| |
|
% of Total Net Sales |
|
% of Total Net Sales |
|||||||||||||||
| |
Amount | Amount | Amount | % | |||||||||||||||
Other income |
$ | 3,921 | 1.1 | % | $ | 1,997 | 0.8 | % | $ | 1,924 | 96.3 | % | |||||||
During the year ended December 31, 2010, we recognized a $4.0 million unrealized gain on our interest rate swap entered into during 2007 as a requirement under our credit facilities compared to a $2.0 million unrealized gain in the corresponding 2009 period. Foreign currency transaction losses increased $0.1 million during the year ended December 31, 2010 to a loss of $0.2 million from a loss of $0.1 million during the year ended December 31, 2009.
Income Taxes
| |
Years Ended December 31, | ||||||||||||||||||
|---|---|---|---|---|---|---|---|---|---|---|---|---|---|---|---|---|---|---|---|
| |
2010 | 2009 | |
|
|||||||||||||||
| |
Change | ||||||||||||||||||
| |
|
% of Total Net Sales |
|
% of Total Net Sales |
|||||||||||||||
| |
Amount | Amount | Amount | % | |||||||||||||||
Income taxes |
$ | 24,526 | 6.6 | % | $ | 10,042 | 3.8 | % | $ | 14,484 | 144.2 | % | |||||||
Our effective income tax rate for the year ended December 31, 2010 was 33.2%, compared to the U.S. federal statutory tax rate of 35.0%. For the year ended December 31, 2010, we benefited from a change in estimate from an income-based to capital-based deferred tax liability estimate for the State of Connecticut that provided a 1% positive impact. Also, we benefited from a higher mix of our domestic
64
taxable income being eligible for the United States Tax Code Section 199 Domestic Manufacturing Deduction due to increased transfer pricing payments received from certain subsidiaries. Our effective tax rate was 30.4%, for the year ended December 31, 2009. The lower 2009 effective tax rate benefited from income tax refunds received on prior year amended returns of approximately $1.0 million and reductions of deferred tax liabilities.
Net Income
| |
Years Ended December 31, | ||||||||||||||||||
|---|---|---|---|---|---|---|---|---|---|---|---|---|---|---|---|---|---|---|---|
| |
2010 | 2009 | |
|
|||||||||||||||
| |
Change | ||||||||||||||||||
| |
|
% of Total Net Sales |
|
% of Total Net Sales |
|||||||||||||||
| |
Amount | Amount | Amount | % | |||||||||||||||
Net income |
$ | 49,311 | 13.3 | % | $ | 22,989 | 8.7 | % | $ | 26,322 | 114.5 | % | |||||||
Net income increased due to higher Solar Adjusted EBITDA as discussed below, our gain on our interest rate swap and lower bad debt expense that more than offset the Quality Assurance Adjusted EBITDA decline discussed below and our higher effective tax rate.
Segment Results of Operations
We report our business in two segments: Solar and Quality Assurance. The accounting policies of the segments are the same as those described in the footnotes to the accompanying Consolidated Financial Statements included in Item 8 of this Annual Report. We measure segment performance based on total revenues and Adjusted EBITDA. See Note 17—Reportable Segments and Geographical Information located in the Notes to the Consolidated Financial Statements for a definition of Adjusted EBITDA and further information. Revenues for each of our segments are described in further detail above. Corporate overhead, which is not allocated to our segments and therefore is not incorporated in the presentation below, includes expenses associated with corporate headquarters, the executive management team and certain centralized functions that benefit us but are not attributable to the segments such as finance and certain legal costs. The discussion that follows is a summary analysis of total revenues and the primary changes in Adjusted EBITDA by segment for the year ended December 31, 2010 compared to the year ended December 31, 2009.
Solar
| |
Years Ended December 31, | ||||||||||||
|---|---|---|---|---|---|---|---|---|---|---|---|---|---|
| |
2010 | 2009 | Change | ||||||||||
| |
Amount | Amount | Amount | % | |||||||||
Net sales |
$ | 259,200 | $ | 149,521 | $ | 109,679 | 73.4 | % | |||||
Adjusted EBITDA |
$ | 114,197 | $ | 67,253 | $ | 46,944 | 69.8 | % | |||||
Adjusted EBITDA as % of segment net sales |
44.1 | % | 45.0 | % | |||||||||
Adjusted EBITDA as percentage of net sales for this business segment decreased for the year ended December 31, 2010 compared to 2009 primarily as a result of reduced average selling prices, raw material price inflation of $6.8 million, $2.9 million of increased labor and benefits and $1.7 million of higher professional fees relating to increased legal costs associated with continued litigation with JPS offset in part by improved operating leverage as a result of increased Solar net sales and reduced scrap.
65
Quality Assurance
| |
Years Ended December 31, | ||||||||||||
|---|---|---|---|---|---|---|---|---|---|---|---|---|---|
| |
2010 | 2009 | Change | ||||||||||
| |
Amount | Amount | Amount | % | |||||||||
Net sales |
$ | 112,629 | $ | 115,424 | $ | (2,795 | ) | (2.4 | )% | ||||
Adjusted EBITDA |
$ | 15,022 | $ | 22,857 | $ | (7,835 | ) | (34.3 | )% | ||||
Adjusted EBITDA as % of segment net sales |
13.3 | % | 19.8 | % | |||||||||
Adjusted EBITDA as a percentage of net sales for this business segment decreased for the year ended December 31, 2010 compared to 2009 primarily due to the lower sales volume and higher cost of sales as discussed above. Also, SG&A expenses increased due to $3.0 million of increased labor and benefits expense for the year ended December 31, 2010, compared to 2009, primarily related to headcount added in 2009 to support the full year 2009 sales increase of 8.6% which did not occur in 2010 and increased labor associated with information technology systems. These costs for the recently implemented systems were capitalized in 2009 and 2008 corresponding periods as the projects were in the development phase.
During the year ended December 31, 2010, we recorded $0.2 million of expense in cost of sales for severance benefits related to the termination of approximately 100 employees in our Quality Assurance segment. The cost reduction plan was initiated to reduce the Quality Assurance segment's cost structure as a result of lower than anticipated forecasted revenue for 2010.
We obtained pre-tax savings associated with the employee terminations of $1.1 million in 2010.
Changes in the cost reduction accrual for the year ended December 31, 2010 were as follows:
| |
December 31, 2010 |
|||
|---|---|---|---|---|
Balance at December 31, 2009 |
$ | — | ||
Additions |
219 | |||
Adjustments |
(16 | ) | ||
Cash utilization |
(203 | ) | ||
Balance at December 31, 2010 |
$ | — | ||
Year Ended December 31, 2009 Compared to Year Ended December 31, 2008
Net Sales
| |
Years Ended December 31, | |||||||||||||||||||
|---|---|---|---|---|---|---|---|---|---|---|---|---|---|---|---|---|---|---|---|---|
| |
2009 | 2008 | |
|
||||||||||||||||
| |
Change | |||||||||||||||||||
| |
|
% of Total Net Sales |
|
% of Total Net Sales |
||||||||||||||||
| |
Amount | Amount | Amount | % | ||||||||||||||||
Net sales—Solar |
$ | 149,521 | 56.4 | % | $ | 182,311 | 63.2 | % | $ | (32,790 | ) | (18.0 | )% | |||||||
Net sales—Quality Assurance |
$ | 115,424 | 43.6 | % | $ | 106,267 | 36.8 | % | $ | 9,157 | 8.6 | % | ||||||||
Total net sales |
$ | 264,945 | 100 | % | $ | 288,578 | 100 | % | $ | (23,633 | ) | (8.2 | )% | |||||||
Net sales decreased $23.6 million, or 8.2%, to $264.9 million for the year ended December 31, 2009 from $288.6 million in 2008 as a result of a decrease in our Solar net sales, partially offset by increased net sales in our Quality Assurance business.
66
Net Sales—Solar
Net sales in our Solar segment decreased $32.8 million, or 18.0%, to $149.5 million for the year ended December 31, 2009 from $182.3 million in 2008. Volume decreased 10% as our European operations were negatively impacted by the change in Spanish feed-in tariff policy in late 2008. Also, the negative global economic and lending environment limited the amount of financing available to fund major projects, which further reduced the number of end market installations and solar module demand during much of 2009. Pricing decreased 7% due to overall industry competition and in conjunction with the signing of contracts with five of our customers. The weakening of the Euro against the U.S. dollar negatively impacted our 2009 net sales in Solar by 1%.
Although 2009 net sales in our Solar segment have decreased compared to 2008 net sales on a year over year basis, fourth quarter 2009 net sales increased by $15.0 million or 42% on a sequential basis from third quarter 2009 net sales of $35.3 million. The majority of such increase was volume driven by improved user demand for solar modules primarily due to increased sales in Germany and Italy. The increased demand in these countries was due to proposed changes in feed-in tariffs anticipated for the second half of 2010. End users increased their purchase of solar panels prior to the anticipated reductions of feed-in tariffs that reduce the return on their investment. This led to an increase in solar module sales and increased demand for our encapsulants.
Our European net sales decreased in 2009 by $32.1 million, or 36%, from the corresponding 2008 period and amounted to $57.1 million in 2009. Sales in Europe were negatively impacted by foreign currency translation fluctuations, as the Euro weakened versus the U.S. dollar by approximately 5% in 2009 compared to its value in 2008. Our European Solar business was also negatively impacted by industry-wide decreased demand in Germany and Spain in the first six months of 2009. During the latter part of 2008, the Spanish government changed its feed-in tariff policy, capping its subsidized PV installations at 500 MW for 2009. Also, our European customers have lost market share to low-cost module manufacturers, primarily from China, that continue to penetrate the European solar market. These events caused our European net sales in 2009 to be negatively impacted by a 30% reduction in volume, reduced pricing of 4% and a 2% unfavorable foreign currency impact.
Our U.S. Solar business generated net sales of $85.8 million, representing a decrease of $7.4 million, or 8%, during 2009 compared to 2008. Of this decrease, $6.6 million of these sales were generated by our Malaysian plant which became operational in the third quarter of 2009. Overall, U.S. Solar sales volumes increased 1% after the impact of transferring customer orders to our Malaysian plant and were offset by a negative price impact of 9%. We entered into contracts with five of our largest customers and sales were negatively impacted by lower unit pricing in these contracts.
Net Sales—Quality Assurance
Net sales in our Quality Assurance segment increased $9.2 million, or 8.6%, to $115.4 million for the year ended December 31, 2009 from $106.3 million in 2008, primarily as a result of increased volume in the United States and Asia, partially offset by a decline in Europe. U.S. Quality Assurance sales growth was driven by our social responsibility auditing business as well as increased testing of private label products, as retailers are ensuring their products possess the same or higher level of quality as premium brands. In addition, toy-related testing increased as new U.S. safety regulations became effective in February 2009. Net sales in Asia also increased due to a higher level of testing performed for toy manufacturers that distribute their products in the United States to comply with the new U.S. safety regulations.
67
Cost of Sales
| |
Years Ended December 31, | |||||||||||||||||||
|---|---|---|---|---|---|---|---|---|---|---|---|---|---|---|---|---|---|---|---|---|
| |
2009 | 2008 | |
|
||||||||||||||||
| |
Change | |||||||||||||||||||
| |
|
% of Total Net Sales |
|
% of Total Net Sales |
||||||||||||||||
| |
Amount | Amount | Amount | % | ||||||||||||||||
Cost of sales—Solar |
$ | 91,213 | 34.4 | % | $ | 103,717 | 35.9 | % | $ | (12,504 | ) | (12.1 | )% | |||||||
Cost of sales—Quality Assurance |
$ | 75,759 | 28.6 | % | $ | 70,930 | 24.6 | % | $ | 4,829 | 6.8 | % | ||||||||
Total cost of sales |
$ | 166,972 | 63.0 | % | $ | 174,647 | 60.5 | % | $ | (7,675 | ) | (4.4 | )% | |||||||
Cost of sales decreased $7.6 million, or 4.4%, to $167.0 million for the year ended December 31, 2009 from $174.6 million in 2008 mainly as a result of the decrease in our Solar net sales as noted above, partially offset by increased net sales in our Quality Assurance business. Our Solar segment accounted for 54.6% of our total cost of sales for the year ended December 31, 2009 compared to 59.4% for our total cost of sales for the year ended December 31, 2008.
Cost of Sales—Solar
Cost of sales in our Solar segment decreased $12.5 million, or 12.1%, to $91.2 million for the year ended December 31, 2009 from $103.7 million in 2008. The decrease in our Solar segment's cost of sales was mainly due to reduced European sales volume, lower raw material costs and improved product performance matter expense of $5.0 million. These drivers were partially offset by $1.2 million of increased depreciation expense, $0.9 million of incremental operating costs associated with our recently opened Malaysian facility which did not occur in 2008, $1.0 million of finished goods inventory write-offs that occurred in the second quarter of 2009 and $2.3 million of increased labor and benefit costs to support our manufacturing infrastructure.
Non-cash intangible asset amortization expense of $8.4 million was included in cost of sales for the years ended December 31, 2009 and 2008, respectively.
Cost of Sales—Quality Assurance
Cost of sales in our Quality Assurance segment increased $4.8 million, or 6.8%, to $75.8 million for the year ended December 31, 2009 from $70.9 million in 2008. The increase in our Quality Assurance's cost of sales was due to $0.9 million for increased depreciation expense, $0.4 million for increased rent expense, $0.3 million for laboratory supplies and $2.9 million for increased direct costs and labor expense mainly due to increased sales volume growth.
Non-cash intangible asset amortization expense of $3.1 million was included in cost of sales for the years ended December 31, 2009 and 2008, respectively.
Gross Profit
| |
Years Ended December 31, | ||||||||||||||||||
|---|---|---|---|---|---|---|---|---|---|---|---|---|---|---|---|---|---|---|---|
| |
2009 | 2008 | |
|
|||||||||||||||
| |
Change | ||||||||||||||||||
| |
|
% of Total Net Sales |
|
% of Total Net Sales |
|||||||||||||||
| |
Amount | Amount | Amount | % | |||||||||||||||
Gross profit |
$ | 97,973 | 37.0 | % | $ | 113,931 | 39.5 | % | $ | (15,958 | ) | (14.0 | )% | ||||||
Gross profit decreased $15.9 million, or 14.0%, to $98.0 million for the year ended December 31, 2009 from $113.9 million for the year ended December 31, 2008 primarily due to the net sales decline
68
in our Solar segment. As a percentage of net sales, gross profit decreased 250 basis points from 39.5% for the year ended December 31, 2008 to 37.0% for the year ended December 31, 2009.
For the year ended December 31, 2009, gross profit decreased as a percentage of net sales primarily due to lower pricing and a reduction in operating leverage of fixed costs associated with our Solar sales volume decline. Also, we generated a lower mix of net sales in our higher margin Solar business, which accounted for 56.4% and 63.2% of our consolidated net sales for the years ended December 31, 2009 and 2008, respectively. We also incurred $1.0 million of inventory write-offs in our Solar segment during the second quarter of 2009. These negative impacts to the 2009 gross margin percentage more than offset $5.0 million of lower product performance matter expense and a 110 basis point gross margin expansion for the year ended December 31, 2009 in our Quality Assurance business resulting from improved labor cost efficiency based on better operating leverage associated with the net sales growth and efforts to streamline our Quality Assurance testing processes and improve turn-around time.
Non-cash intangible asset amortization expense of $11.5 million reduced gross profit for the years ended December 31, 2009 and 2008, respectively.
Selling, General and Administrative Expenses
| |
Years Ended December 31, | ||||||||||||||||||
|---|---|---|---|---|---|---|---|---|---|---|---|---|---|---|---|---|---|---|---|
| |
2009 | 2008 | |
|
|||||||||||||||
| |
Change | ||||||||||||||||||
| |
|
% of Total Net Sales |
|
% of Total Net Sales |
|||||||||||||||
| |
Amount | Amount | Amount | % | |||||||||||||||
SG&A |
$ | 48,785 | 18.4 | % | $ | 41,592 | 14.4 | % | $ | 7,193 | 17.3 | % | |||||||
SG&A increased 17.3% for the year ended December 31, 2009 compared to the corresponding period in the prior year. Non-cash stock-based compensation expense increased by approximately $5.1 million, mainly due to the issuance of stock options in connection with our IPO. At the IPO date, we issued stock options for incentive units that only partially converted or did not convert to common shares. The options have accelerated vesting clauses that took effect January 31, 2010.
Due to the IPO, $2.6 million was paid in conjunction with the termination of pre-IPO monitoring agreements. Salaries and benefits increased $2.9 million in 2009 due to increased headcount in our sales, information technology and finance functions necessary to support our anticipated growth and becoming a public company. The increase was partially offset by lower professional fees of $4.0 million compared to the same period in 2008 due to the non-recurrence of legal fees associated with protecting our proprietary technology and re-audits of our financial statements incurred in preparation for the filing of our initial Form S-1 with the SEC made during 2008.
Provision for Bad Debt Expense
| |
Years Ended December 31, | ||||||||||||||||||
|---|---|---|---|---|---|---|---|---|---|---|---|---|---|---|---|---|---|---|---|
| |
2009 | 2008 | |
|
|||||||||||||||
| |
Change | ||||||||||||||||||
| |
|
% of Total Net Sales |
|
% of Total Net Sales |
|||||||||||||||
| |
Amount | Amount | Amount | % | |||||||||||||||
Bad debt |
$ | 1,403 | 0.5 | % | $ | 1,950 | 0.7 | % | $ | (547 | ) | (28.1 | )% | ||||||
Bad debt decreased $0.5 million, or 28.1%, to $1.4 million for the year ended December 31, 2009 from $2.0 million for 2008. This reduction is primarily the result of the avoidance of a $1.0 million increase in 2008 that did not occur again in 2009.
69
Interest Expense
| |
Years Ended December 31, | ||||||||||||||||||
|---|---|---|---|---|---|---|---|---|---|---|---|---|---|---|---|---|---|---|---|
| |
2009 | 2008 | |
|
|||||||||||||||
| |
Change | ||||||||||||||||||
| |
|
% of Total Net Sales |
|
% of Total Net Sales |
|||||||||||||||
| |
Amount | Amount | Amount | % | |||||||||||||||
Interest expense |
$ | 17,068 | 6.4 | % | $ | 20,809 | 7.2 | % | $ | (3,741 | ) | (18.0 | )% | ||||||
Interest expense decreased $3.7 million, or 18.0%, to $17.1 million for the year ended December 31, 2009 from $20.8 million for the year ended December 31, 2008. This reduction was primarily the result of decreases in applicable interest rates on our variable rate debt.
Other Income (Expense) Items
| |
Years Ended December 31, | ||||||||||||||||||
|---|---|---|---|---|---|---|---|---|---|---|---|---|---|---|---|---|---|---|---|
| |
2009 | 2008 | |
|
|||||||||||||||
| |
Change | ||||||||||||||||||
| |
|
% of Total Net Sales |
|
% of Total Net Sales |
|||||||||||||||
| |
Amount | Amount | Amount | % | |||||||||||||||
Other income (expense) |
$ | 1,997 | 0.8 | % | $ | (3,783 | ) | (1.3 | )% | $ | 5,780 | 152.8 | % | ||||||
During the year ended December 31, 2009, we incurred a $2.0 million unrealized gain on our interest rate swap entered into during 2007 as a requirement under our credit facilities compared to a $3.0 million loss in the corresponding 2008 period. Foreign currency transaction losses decreased $0.9 million during the year ended December 31, 2009 to a loss of $0.1 million from a loss of $1.0 million during the year ended December 31, 2008.
Income Taxes
| |
Years Ended December 31, | ||||||||||||||||||
|---|---|---|---|---|---|---|---|---|---|---|---|---|---|---|---|---|---|---|---|
| |
2009 | 2008 | |
|
|||||||||||||||
| |
Change | ||||||||||||||||||
| |
|
% of Total Net Sales |
|
% of Total Net Sales |
|||||||||||||||
| |
Amount | Amount | Amount | % | |||||||||||||||
Income taxes |
$ | 10,042 | 3.8 | % | $ | 17,870 | 6.2 | % | $ | (7,828 | ) | (43.8 | )% | ||||||
Income tax expense decreased $7.8 million to $10.0 million for the year ended December 31, 2009 from $17.9 million in 2008. Our effective tax rate for the year ended December 31, 2009 was 30.4% compared to the federal statutory rate of 35% and our effective tax rate for the year ended December 31, 2008 of 38.9%. The lower 2009 effective tax rate benefited from income tax refunds received on prior year amended returns of approximately $1.0 million and reductions to deferred tax liabilities.
Net Income
| |
Years Ended December 31, | ||||||||||||||||||
|---|---|---|---|---|---|---|---|---|---|---|---|---|---|---|---|---|---|---|---|
| |
2009 | 2008 | |
|
|||||||||||||||
| |
Change | ||||||||||||||||||
| |
|
% of Total Net Sales |
|
% of Total Net Sales |
|||||||||||||||
| |
Amount | Amount | Amount | % | |||||||||||||||
Net income |
$ | 22,989 | 8.7 | % | $ | 28,105 | 9.7 | % | $ | (5,116 | ) | (18.2 | )% | ||||||
Net income decreased $5.1 million to $23.0 million for the year ended December 31, 2009 from net income of $28.1 million in 2008 primarily due to the reduction in net sales, increased inventory
70
write-offs and depreciation expense and overall increase in SG&A expense. These items were partially offset by decreased interest expense on our variable rate debt, gain on our interest rate swap, lower product performance matter expense and our lower 2009 effective tax rate.
Segment Results of Operations
The discussion that follows is a summary analysis of total revenues and the primary changes in Adjusted EBITDA by segment for the year ended December 31, 2009 compared to the year ended December 31, 2008.
Solar
| |
Years Ended December 31, | ||||||||||||
|---|---|---|---|---|---|---|---|---|---|---|---|---|---|
| |
2009 | 2008 | Change | ||||||||||
| |
Amount | Amount | Amount | % | |||||||||
Net sales |
$ | 149,521 | $ | 182,311 | $ | (32,790 | ) | (18.0 | )% | ||||
Adjusted EBITDA |
$ | 67,253 | $ | 83,042 | $ | (15,789 | ) | (19.0 | )% | ||||
Adjusted EBITDA as % of segment net sales |
45.0 | % | 45.6 | % | |||||||||
Adjusted EBITDA as percentage of net sales for this business segment decreased for the year ended December 31, 2009 compared to 2008 due to lower gross margins driven by the reduction in net sales, lower absorption of fixed costs and $1.0 million of inventory write-offs that more than offset $5.0 million of lower product performance matter expense. Partially offsetting the negative impact of lower gross margins was a reduction to SG&A expenses of $0.6 million based on $3.1 million of lower professional fees related to legal costs, partially offset by increased staffing and infrastructure expense.
Quality Assurance
| |
Years Ended December 31, | ||||||||||||
|---|---|---|---|---|---|---|---|---|---|---|---|---|---|
| |
2009 | 2008 | Change | ||||||||||
| |
Amount | Amount | Amount | % | |||||||||
Net sales |
$ | 115,424 | $ | 106,267 | $ | 9,157 | 8.6 | % | |||||
Adjusted EBITDA |
$ | 22,857 | $ | 17,586 | $ | 5,271 | 30.0 | % | |||||
Adjusted EBITDA as % of segment net sales |
19.8 | % | 16.6 | % | |||||||||
Adjusted EBITDA as a percentage of net sales for this business segment increased for the year ended December 31, 2009 compared to 2008 due to higher gross margins driven by the increase in sales volume. SG&A expenses increased by $3.0 million primarily driven by $0.5 million of professional fees and $2.2 million of labor and benefits expense primarily due to increased sales and information technology staff.
71
Quarterly Consolidated Results of Operations
The following tables set forth our consolidated results of operations, other data and Adjusted EBITDA on a quarterly basis for the year ended December 31, 2010 and the year ended December 31, 2009.
| |
Year Ended December 31, 2010 | ||||||||||||||
|---|---|---|---|---|---|---|---|---|---|---|---|---|---|---|---|
| |
First Quarter |
Second Quarter |
Third Quarter |
Fourth Quarter |
|||||||||||
| |
(Unaudited) |
||||||||||||||
| |
(dollars in thousands) |
||||||||||||||
Statement of Operations Data: |
|||||||||||||||
Net sales—Solar |
$ | 54,811 | $ | 66,997 | $ | 68,285 | $ | 69,107 | |||||||
Net sales—Quality Assurance |
24,962 | 29,657 | 29,491 | 28,519 | |||||||||||
Total net sales |
79,773 | 96,654 | 97,776 | 97,626 | |||||||||||
Cost of sales—Solar |
31,454 | 38,306 | 40,831 | 41,233 | |||||||||||
Cost of sales—Quality Assurance |
18,228 | 18,988 | 19,292 | 19,426 | |||||||||||
Total cost of sales |
49,682 | 57,294 | 60,123 | 60,659 | |||||||||||
Gross profit |
30,091 | 39,360 | 37,653 | 36,967 | |||||||||||
Selling, general and administrative expenses |
15,969 | 13,096 | 14,423 | 14,557 | |||||||||||
Provision for bad debt expense |
109 | 634 | 157 | (406 | ) | ||||||||||
Earnings on equity-method investments |
(19 | ) | (54 | ) | (30 | ) | (65 | ) | |||||||
Operating income |
14,032 | 25,684 | 23,103 | 22,881 | |||||||||||
Interest income |
28 | 36 | 26 | 21 | |||||||||||
Interest expense |
(4,231 | ) | (4,411 | ) | (4,228 | ) | (2,914 | ) | |||||||
Foreign currency transaction (loss) gain |
(43 | ) | 373 | (841 | ) | 303 | |||||||||
Unrealized gain on interest rate swap |
1,216 | 1,446 | 1,356 | — | |||||||||||
Income before income tax expense |
11,002 | 23,128 | 19,416 | 20,291 | |||||||||||
Income tax expense |
3,242 | 8,102 | 6,095 | 7,087 | |||||||||||
Net income |
$ | 7,760 | $ | 15,026 | $ | 13,321 | $ | 13,204 | |||||||
Other Data: |
|||||||||||||||
Amortization of intangibles—Solar |
$ | 2,108 | $ | 2,108 | $ | 2,108 | $ | 2,108 | |||||||
Amortization of intangibles—Quality Assurance |
768 | 768 | 768 | 767 | |||||||||||
Total amortization of intangibles |
$ | 2,876 | $ | 2,876 | $ | 2,876 | $ | 2,875 | |||||||
Stock-based compensation—Solar |
$ | 924 | $ | 266 | $ | 266 | $ | 266 | |||||||
Stock-based compensation—Quality Assurance |
581 | 239 | 264 | 173 | |||||||||||
Stock-based compensation—Corporate |
2,286 | 878 | 847 | 861 | |||||||||||
Total stock-based compensation |
$ | 3,791 | $ | 1,383 | $ | 1,377 | $ | 1,300 | |||||||
Adjusted EBITDA:(1) |
|||||||||||||||
Adjusted EBITDA—Solar |
$ | 24,891 | $ | 31,207 | $ | 28,190 | $ | 29,909 | |||||||
Adjusted EBITDA—Quality Assurance |
1,638 | 4,539 | 5,061 | 3,784 | |||||||||||
Adjusted EBITDA—Corporate |
(2,818 | ) | (1,732 | ) | (3,009 | ) | (2,713 | ) | |||||||
Total Adjusted EBITDA |
23,711 | 34,014 | 30,242 | 30,980 | |||||||||||
Depreciation and amortization |
(5,758 | ) | (6,276 | ) | (6,634 | ) | (6,554 | ) | |||||||
Interest income |
28 | 36 | 26 | 21 | |||||||||||
Interest expense |
(4,231 | ) | (4,411 | ) | (4,228 | ) | (2,914 | ) | |||||||
Income tax expense |
(3,242 | ) | (8,102 | ) | (6,095 | ) | (7,087 | ) | |||||||
Unrealized gain on interest rate swap |
1,216 | 1,446 | 1,356 | — | |||||||||||
Secondary offering expense |
(193 | ) | (341 | ) | — | — | |||||||||
Stock-based compensation |
(3,791 | ) | (1,383 | ) | (1,377 | ) | (1,300 | ) | |||||||
Gain (loss) on disposal of property, plant and equipment |
1 | (11 | ) | 1 | (7 | ) | |||||||||
Earnings on equity-method investments |
19 | 54 | 30 | 65 | |||||||||||
Net income |
$ | 7,760 | $ | 15,026 | $ | 13,321 | $ | 13,204 | |||||||
72
| |
Year Ended December 31, 2009 | ||||||||||||||
|---|---|---|---|---|---|---|---|---|---|---|---|---|---|---|---|
| |
First Quarter |
Second Quarter |
Third Quarter |
Fourth Quarter |
|||||||||||
| |
(Unaudited) |
||||||||||||||
| |
(dollars in thousands) |
||||||||||||||
Statement of Operations Data: |
|||||||||||||||
Net sales—Solar |
$ | 34,187 | $ | 29,643 | $ | 35,362 | $ | 50,329 | |||||||
Net sales—Quality Assurance |
23,928 | 29,920 | 31,956 | 29,620 | |||||||||||
Total net sales |
58,115 | 59,563 | 67,318 | 79,949 | |||||||||||
Cost of sales—Solar |
20,794 | 20,273 | 21,837 | 28,309 | |||||||||||
Cost of sales—Quality Assurance |
17,199 | 18,905 | 20,155 | 19,500 | |||||||||||
Total cost of sales |
37,993 | 39,178 | 41,992 | 47,809 | |||||||||||
Gross profit |
20,122 | 20,385 | 25,326 | 32,140 | |||||||||||
Selling, general and administrative expenses |
10,888 | 9,533 | 9,566 | 18,798 | |||||||||||
Provision for bad debt expense |
400 | 952 | 20 | 31 | |||||||||||
Earnings on equity-method investments |
(36 | ) | (123 | ) | (68 | ) | (90 | ) | |||||||
Operating income |
8,870 | 10,023 | 15,808 | 13,401 | |||||||||||
Interest income |
14 | 56 | 46 | 20 | |||||||||||
Interest expense |
(4,059 | ) | (4,209 | ) | (4,195 | ) | (4,605 | ) | |||||||
Foreign currency transaction (loss) gain |
(360 | ) | (83 | ) | (133 | ) | 442 | ||||||||
Unrealized gain on interest rate swap |
569 | 18 | 316 | 1,092 | |||||||||||
Income before income tax expense |
5,034 | 5,805 | 11,842 | 10,350 | |||||||||||
Income tax expense |
1,921 | 2,675 | 3,955 | 1,491 | |||||||||||
Net income |
$ | 3,113 | $ | 3,130 | $ | 7,887 | $ | 8,859 | |||||||
Other Data: |
|||||||||||||||
Amortization of intangibles—Solar |
$ | 2,108 | $ | 2,108 | $ | 2,108 | $ | 2,108 | |||||||
Amortization of intangibles—Quality Assurance |
768 | 768 | 767 | 768 | |||||||||||
Total amortization of intangibles |
$ | 2,876 | $ | 2,876 | $ | 2,875 | $ | 2,876 | |||||||
Stock-based compensation—Solar |
$ | 92 | $ | 82 | $ | 75 | $ | 1,427 | |||||||
Stock-based compensation—Quality Assurance |
96 | 56 | 51 | 809 | |||||||||||
Stock-based compensation—Corporate |
216 | 451 | 733 | 3,220 | |||||||||||
Total stock-based compensation |
$ | 404 | $ | 589 | $ | 859 | $ | 5,456 | |||||||
Adjusted EBITDA:(1) |
|||||||||||||||
Adjusted EBITDA—Solar |
$ | 15,138 | $ | 11,621 | $ | 16,485 | $ | 24,009 | |||||||
Adjusted EBITDA—Quality Assurance |
2,826 | 7,045 | 7,137 | 5,849 | |||||||||||
Adjusted EBITDA—Corporate |
(3,309 | ) | (2,215 | ) | (1,069 | ) | (1,886 | ) | |||||||
Total Adjusted EBITDA |
14,655 | 16,451 | 22,553 | 27,972 | |||||||||||
Depreciation and amortization |
(5,626 | ) | (5,886 | ) | (5,938 | ) | (5,931 | ) | |||||||
Interest income |
14 | 56 | 46 | 20 | |||||||||||
Interest expense |
(4,059 | ) | (4,209 | ) | (4,195 | ) | (4,605 | ) | |||||||
Income tax expense |
(1,921 | ) | (2,675 | ) | (3,955 | ) | (1,491 | ) | |||||||
Management advisory fees |
(150 | ) | (150 | ) | (149 | ) | (2,775 | ) | |||||||
Unrealized gain on interest rate swap |
569 | 18 | 316 | 1,092 | |||||||||||
Stock-based compensation |
(404 | ) | (589 | ) | (859 | ) | (5,456 | ) | |||||||
Loss on disposal of property, plant and equipment |
(1 | ) | (9 | ) | — | (57 | ) | ||||||||
Earnings on equity-method investments |
36 | 123 | 68 | 90 | |||||||||||
Net income |
$ | 3,113 | $ | 3,130 | $ | 7,887 | $ | 8,859 | |||||||
- (1)
- We
define Adjusted EBITDA as net income before interest income and expense, income tax expense, depreciation expense, intangible asset amortization,
stock-based compensation expense, transaction fees, equity earnings on investments and certain non-recurring income and expenses from the results of operations.
We present Adjusted EBITDA because it is the main metric used by our management and our board of directors to plan and measure our Segments' operating performance. Our management believes that Adjusted
73
EBITDA is useful to investors because Adjusted EBITDA is frequently used by securities analysts, investors and other interested parties in their evaluation of the operating performance of companies in industries similar to ours. We also believe Adjusted EBITDA is useful to our management and investors as a measure of comparative operating performance from period to period. The DLJ Transactions had a significant impact on our capital structure and resulted in accounting charges that make period to period comparisons of our core operations difficult and resulted in expenses that may not be indicative of our future operating performance. For example, as a result of the DLJ Transactions, we incurred significant non-cash amortization charges and increased interest expense. Adjusted EBITDA removes the impact of changes to our capital structure (primarily interest expense) and asset base (primarily depreciation and amortization resulting from the DLJ Transactions). By reporting Adjusted EBITDA, we provide a basis for comparison of our business operations between current, past and future periods. In addition, measures similar to Adjusted EBITDA are one of the metrics utilized to measure performance based bonuses paid to our Segment Presidents and certain managers and are used to determine compliance with financial covenants under our credit facilities.
Adjusted EBITDA, however, does not represent and should not be considered as an alternative to net income or cash flow from operations, as determined in accordance with generally accepted accounting principles, and our calculations thereof may not be comparable to similarly entitled measures reported by other companies. Although we use Adjusted EBITDA as a measure to assess the operating performance of our business, Adjusted EBITDA has significant limitations as an analytical tool because it excludes certain material costs. For example, it does not include interest expense, which has been a necessary element of our costs. Because we use capital assets, depreciation expense is a necessary element of our costs and ability to generate revenue. In addition, the omission of the substantial amortization expense associated with our intangible assets further limits the usefulness of this measure. Adjusted EBITDA also does not include the payment of taxes, which is also a necessary element of our operations. Because Adjusted EBITDA does not account for these expenses, its utility as a measure of our operating performance has material limitations. Because of these limitations management does not view Adjusted EBITDA in isolation and also uses other measures, such as net income, net sales, gross margin and operating income, to measure operating performance.
Financial Condition, Liquidity and Capital Resources
We have financed our operations primarily through cash provided by operations. From 2003 through 2010, net cash provided by operating activities has been sufficient to fund our working capital needs and capital expenditures. As of December 31, 2010, our principal sources of liquidity consisted of $106.6 million of cash and $20.0 million of availability under the $20.0 million revolving portion of our first lien credit facilities. Our total indebtedness was $238.5 million as of December 31, 2010.
Our principal needs for liquidity have been, and for the foreseeable future will continue to be, for capital expenditures, debt service and working capital. The main portion of our capital expenditures has been and is expected to continue to be for expansion. Working capital requirements have increased as a result of our overall growth and the need to fund higher accounts receivable and raw materials inventory. We believe that our cash flow from operations, available cash and cash equivalents and available borrowings under the revolving portion of our credit facilities will be sufficient to meet our liquidity needs, including for capital expenditures, through at least the next 12 months. We anticipate that to the extent that we require additional liquidity, it will be funded through borrowings under our credit facilities, the incurrence of other indebtedness, additional equity issuances or a combination of these potential sources of liquidity.
If we decide to pursue one or more strategic acquisitions, we may incur additional debt, if permitted under our existing credit facilities, or sell additional equity to raise any needed capital. Due to the current historically low interest rate environment, we are assessing the potential to refinance our debt to lower our overall interest expense.
Cash Flows
Cash Flow from Operating Activities
Net cash provided by operating activities was $58.7 million for the year ended December 31, 2010 compared to $47.9 million for the year ended December 31, 2009. Due to the strength of our Solar
74
segment, cash earnings increased by approximately $24.1 million for the year ended December 31, 2010 compared to the same period in 2009. This was mostly offset by increased working capital, primarily relating to increases in accounts receivable and raw materials inventory. The increase in working capital reflects the investment required to support our planned growth, increased inventory safety stock associated with our continued capacity ramp up as well as to help mitigate short-term raw material inflation, timing related to our strong net sales growth in 2010 and payment terms customary in certain foreign locations.
Net cash provided by operating activities was $47.9 million for the year ended December 31, 2009. Cash provided by operating activities was attributable to $23.0 million in net income, and non-cash expenses, including $23.4 million of depreciation and amortization, and $7.3 million of stock-based compensation.
Net cash provided by operating activities was $47.7 million for the year ended December 31, 2008. Cash provided by operating activities was attributable to $28.1 million in net income, and non-cash expenses, including $21.2 million of depreciation and amortization, $1.8 million of stock-based compensation and the $3.0 million unrealized loss on our interest rate swap transaction.
Cash Flow from Investing Activities
Net cash used for investing activities was $19.1 million for the year ended December 31, 2010 and primarily related to $19.4 million of capital expenditures. We also purchased the remaining 49% interest of STR Registrar, which was previously consolidated for $0.6 million, net of cash acquired. These were partially offset by the maturity of a money market account for which we sold for its face value of $1.0 million.
For our Solar segment, we had capital expenditures of $15.5 million for the year ended December 31, 2010. Our Solar capital expenditures for this period consisted primarily of equipment costs associated with the addition of new production lines, construction costs for our Malaysia facility expansion and initial costs relating to our recently acquired East Windsor, Connecticut facility.
For our Quality Assurance segment, we had capital expenditures of $3.4 million for the year ended December 31, 2010. Our Quality Assurance capital expenditures for this period consisted primarily of costs associated with equipment purchases for the enhancement of our information systems.
We expect 2011 consolidated capital expenditures to be approximately $61.0 million, of which Solar capital expenditures will represent approximately $50.0 million, Quality Assurance capital expenditures will represent approximately $10.5 million and corporate capital expenditures will represent approximately $0.5 million.
Net cash used for investing activities was $18.8 million for the year ended December 31, 2009. We reduced our capital expenditure activity from the prior year due to the negative economic conditions and having sufficient capacity for business levels. We purchased a certificate of deposit in the amount of $1.0 million with a greater than 90 day maturity, which matured in 2010.
Net cash used for investing activities for the year ended December 31, 2008 was $35.3 million for capital expenditures which consisted of construction costs for our Malaysia facility, addition of new production lines, information technology costs and laboratory expenses in China.
We use an alternative non-GAAP measure of liquidity called free cash flow. We define free cash flow as cash provided by operating activities less capital expenditures. Free cash flow was $39.3 million, $30.0 million and $12.4 million in the years ended December 31, 2010, 2009 and 2008, respectively. We believe free cash flow is an important measure of our overall liquidity and our ability to fund future growth and provide a return to stockholders. Free cash flow does not reflect, among other things, mandatory debt service, other borrowing activity, discretionary dividends on our common stock and acquisitions.
75
We consider free cash flow to be a liquidity measure that provides useful information to management and investors about the amount of cash generated by the business that, after the acquisition of property and equipment, including information technology infrastructure and land and buildings, can be used for strategic opportunities, including investing in our business, making strategic acquisitions, and strengthening the balance sheet.
Analysis of free cash flow also facilitates management's comparisons of our operating results to competitors' operating results. A limitation of using free cash flow versus the GAAP measure of cash provided by operating activities as a means for evaluating our business is that free cash flow does not represent the total increase or decrease in the cash balance from operations for the period because it excludes cash used for capital expenditures during the period. Our management compensates for this limitation by providing information about our capital expenditures on the face of the cash flow statement and in the above discussion. We have computed free cash flow using the same consistent method from quarter to quarter and year to year.
| |
Year Ended December 31, 2010 (unaudited) |
Year Ended December 31, 2009 (unaudited) |
Year Ended December 31, 2008 (unaudited) |
|||||||
|---|---|---|---|---|---|---|---|---|---|---|
Cash provided by operating activities |
$ | 58,741 | $ | 47,858 | $ | 47,667 | ||||
Less: capital expenditures |
(19,426 | ) | (17,833 | ) | (35,288 | ) | ||||
Free cash flow |
$ | 39,315 | $ | 30,025 | $ | 12,379 | ||||
We also use this non-GAAP financial measure for financial and operational decision making and as a means to evaluate period-to-period comparisons.
Cash Flow from Financing Activities
Net cash used in financing activities was $2.4 million for the year ended December 31, 2010 primarily for the payment of IPO issuance costs of $1.5 million and $1.9 million for debt repayments partially offset by $1.1 million of the proceeds from the exercise of stock options and related tax benefits received from the disqualifying dispositions of certain of those option exercises.
Net cash provided by financing activities was $11.4 million for the year ended December 31, 2009 resulting from IPO net proceeds of $30.9 million offset by debt repayments of $17.0 million during 2009, including our debt agreement mandatory pre-payment on the IPO date. Also, cash payments of $1.1 million and $1.3 million were incurred in connection with our IPO and amendment of our debt agreements, respectively.
Net cash used in financing activities was $5.3 million for the year ended December 31, 2008 primarily for payment of equity issuance costs of $3.3 million and $2.0 million for debt repayments.
Credit Facilities
In connection with the DLJ Transactions, we entered into a first lien credit facility and a second lien credit facility on June 15, 2007, which we refer to collectively as our "credit facilities", in each case with Credit Suisse, as administrative agent and collateral agent. The first lien credit facility consists of a $185.0 million term loan facility, which matures on June 15, 2014, and a $20.0 million revolving credit facility, none of which was outstanding at December 31, 2010, which matures on June 15, 2012. The second lien credit facility consists of a $75.0 million term loan facility, which matures on December 15, 2014. The revolving credit facility includes a sublimit of $15.0 million for letters of credit.
The obligations under each credit facility are unconditional and are guaranteed by us and substantially all of our existing and subsequently acquired or organized domestic subsidiaries. The first
76
lien credit facility and related guarantees are secured on a first-priority basis, and the second lien credit facility and related guarantees are secured on a second-priority basis, in each case, by security interests (subject to liens permitted under the credit agreements governing the credit facilities) in substantially all tangible and intangible assets owned by us, the obligors under the credit facilities, and each of our other domestic subsidiaries, subject to certain exceptions, including limiting pledges of voting stock of foreign subsidiaries to 66% of such voting stock.
Borrowings under the first lien credit facility bear interest at a rate equal to (1) in the case of term loans, at our option (i) the greater of (a) the rate of interest per annum determined by Credit Suisse, from time to time, as its prime rate in effect at its principal office in the City of New York, and (b) the federal funds rate plus 0.50% per annum (the "base rate"), and in each case plus 1.50% per annum or (ii) the LIBO plus 2.50% and (2) in the case of the revolving loans, at our option (subject to certain exceptions) (i) the base rate plus 1.50% when our total leverage ratio (as defined in the first lien credit facility) is greater than or equal to 5.25 to 1.00 ("leverage level 1"), the base rate plus 1.25% when our total leverage ratio is greater than or equal to 4.50 to 1.00 but less than 5.25 to 1.00 ("leverage level 2") and the base rate plus 1.00% when our total leverage ratio is less than 4.50 to 1.00 ("leverage level 3") or (ii) the LIBO plus 2.50% in the case of leverage level 1, 2.25% in the case of leverage level 2 and 2.00% in the case of leverage level 3. Borrowings under the second lien credit facility bear interest at a rate equal to, at our option (i) the base rate plus 6.00% or (ii) the LIBO plus 7.00%. For the first five years of the second lien credit facility, we have the option to pay interest in cash or in kind, by increasing the outstanding principal amount of the loans by the amount of accrued interest. Interest paid in kind on the second lien credit facility will be at the rate of interest applicable to such loan described above plus an additional 1.50% per annum. If we default on the payment of any principal, interest, or any other amounts due under the credit facilities, we will be obligated to pay default interest. The default interest rate on principal payments will equal the interest rate applicable to such loan plus 2.00% per annum, and the default interest rate on all other payments will equal the interest rate applicable to base rate loans plus 2.00% per annum.
As of December 31, 2010 and December 31, 2009, the weighted-average interest rate under our credit facilities was 4.18% and 4.14%, respectively, before the effect of our interest rate swap which expired on September 30, 2010. At the rate in effect on December 31, 2010 and assuming an outstanding balance of $238.5 million as of December 31, 2010, our annual debt service obligations would be $11.9 million, consisting of $10.0 million of interest and $1.9 million of scheduled principal payments. No mandatory principal payment is required until June 30, 2011 due to the $15.0 million payment made in conjunction with the Company's initial public offering in November 2009. See "—Contractual Obligations and Other Commitments" below for the effects of the principal prepayment made in November 2009.
In addition to paying interest on outstanding principal under the credit facilities, we are required to pay a commitment fee at a rate equal to 0.50% per annum on the daily unused commitments available to be drawn under the revolving portion of the first lien credit facility. We are also required to pay letter of credit fees, with respect to each letter of credit issued, at a rate per annum equal to the applicable LIBO margin for revolving credit loans on the average daily amount of undrawn letters of credit plus the aggregate amount of all letter of credit disbursements that have not been repaid by us. We are also required to pay fronting fees, with respect to each letter of credit issued, at a rate specified by the issuer of the letters of credit and to pay Credit Suisse certain administrative fees from time to time, in its role as administrative agent. The term loans under the first lien credit facilities amortize in quarterly installments of 0.25% of the principal amount. Under certain circumstances, we may be required to reimburse the lenders under our credit facilities for certain increased fees and expenses caused by a change of law.
We are generally required to prepay term loan borrowings under the credit facilities with (1) 100% of the net cash proceeds we receive from non-ordinary course asset sales or as a result of a casualty or
77
condemnation, (2) 100% of the net cash proceeds we receive from the issuance of debt obligations other than debt obligations permitted under the credit agreements, (3) 50% of the net cash proceeds of a public offering of equity and (4) 50% (or, if our leverage ratio is less than 5.25 to 1.00 but greater than or equal to 4.50 to 1.00, 25%) of excess cash flow (as defined in the credit agreements). Under the credit facilities, we are not required to prepay borrowings with excess cash flow if our leverage ratio is less than 4.50 to 1.00. Subject to a limited exception, all mandatory prepayments will first be applied to the first lien credit facility until all first lien obligations are paid in full and then to the second lien facility.
The first lien credit facility requires us to maintain certain financial ratios, including a maximum first lien debt ratio (based upon the ratio of indebtedness under the first lien credit facility to consolidated EBITDA, as defined in the first lien credit facility), a maximum total leverage ratio (based upon the ratio of total indebtedness, net of unrestricted cash and cash equivalents, to consolidated EBITDA) and a minimum interest coverage ratio (based upon the ratio of consolidated EBITDA to consolidated interest expense), which are tested quarterly. Based on the formulas set forth in the first lien credit agreement, as of December 31, 2010, we were required to maintain a maximum first lien debt ratio of 4.00 to 1.00, a maximum total leverage ratio of 6.00 to 1.00 and a minimum interest coverage ratio of 1.80 to 1.00. The second lien credit facility requires us to maintain a maximum total leverage ratio tested quarterly. Based on the formulas set forth in the second lien credit agreement, as of December 31, 2010, we were required to maintain a maximum total leverage ratio of 6.25 to 1.00. As of December 31, 2010, our first lien debt ratio was 0.46 to 1.00, our total leverage ratio was 1.07 to 1.00 and our interest coverage ratio was 8.49 to 1.00.
The financial ratios required under the first and second lien facilities become more restrictive over time. Based on the formulas set forth in the first lien credit agreement, as of March 31, 2011 and March 31, 2012, we are required to maintain a maximum first lien debt ratio of 3.00 to 1.00, a maximum total leverage ratio of 5.00 to 1.00 and a minimum interest coverage ratio of 2.00 to 1.00. Based on the formulas set forth in the second lien credit agreement, as of March 31, 2011 and March 31, 2012, we are required to maintain a maximum total leverage ratio of 5.25 to 1.00.
The credit agreements also contain a number of affirmative and restrictive covenants including limitations on mergers, consolidations and dissolutions; sales of assets; sale-leaseback transactions; investments and acquisitions; indebtedness; liens; affiliate transactions; the nature of our business; a prohibition on dividends and restrictions on other restricted payments; modifications or prepayments of our second lien credit facility or other material subordinated indebtedness; and issuing redeemable, convertible or exchangeable equity securities. Under the credit agreements, we are permitted maximum annual capital expenditures of $12.0 million in the fiscal year ending December 31, 2007, with such limit increasing by $1.0 million to $2.0 million for each fiscal year thereafter. Capital expenditure limits in any fiscal year may be increased by 40.0% of the excess of consolidated EBITDA for such fiscal year over baseline EBITDA for that year, which is defined as $55.0 million for the fiscal year ending December 31, 2010 and increasing by $5.0 million per year thereafter. The capital expenditure limitations are subject to a two-year carry-forward of the unused amount from the previous fiscal year which is approximately $36.5 million for the year beginning January 1, 2011. The amount of capital expenditure permitted under our credit agreements will allow us to execute our anticipated 2011 capital investment plan.
The credit agreements contain events of default that are customary for similar facilities and transactions, including a cross-default provision with respect to other material indebtedness (which, with respect to the first lien credit agreement, would include the second lien credit agreement and with respect to the second lien credit agreement, would include the first lien credit agreement) and an event of default that would be triggered by a change of control, as defined in the credit agreements. As of December 31, 2010, we were in compliance with all of our covenants and other obligations under the credit agreements.
78
On October 5, 2009, we entered into an amendment to the first lien credit agreement and an amendment to the second lien credit agreement. The amendments for both credit agreements permitted us to enter into certain corporate reorganization transactions, including replacing STR Holdings LLC with STR Holdings (New) LLC as a guarantor under each credit agreement. STR Holdings, Inc. became a guarantor under each credit agreement as corporate successor to STR Holdings (New) LLC on November 6, 2009.
We were required under the terms of both our first lien and second lien credit facilities to fix our interest costs on at least 50% of the principal amount of our funded indebtedness within three months of entering into the credit facility for a minimum of three years. To manage our interest rate exposure and fulfill the requirements under our credit facilities, effective September 13, 2007, we entered into a $200.0 million notional principal amount interest rate swap agreement with Credit Suisse International that effectively converted a portion of our debt under our credit facilities from a floating interest rate to a fixed interest rate. The notional principal amount decreased to $130.0 million on October 1, 2008 and remained at that amount until the agreement expired on September 30, 2010. Under the interest rate swap agreement, we paid interest at 4.622% and received the floating three-month LIBOR rate from Credit Suisse International on the notional principal amount. As of December 31, 2010, none of our variable interest rate debt has been hedged and we do not plan to hedge any portion of our debt in the near term.
In addition, one of our foreign subsidiaries maintains a line of credit facility in the amount of $0.5 million (0.5 million Swiss francs) bearing an interest rate of approximately 4.25% as of December 31, 2010 and December 31, 2009. The purpose of the credit facility is to provide funding for the subsidiary's working capital as deemed necessary during the normal course of business. The facility was not utilized as of December 31, 2010 and December 31, 2009.
Contractual Obligations and Other Commitments
As of December 31, 2010, our contractual obligations and other commitments were as follows:
| |
Payments Due by Period | ||||||||||||||||
|---|---|---|---|---|---|---|---|---|---|---|---|---|---|---|---|---|---|
| |
Total | 2011 | 2012 - 2013 | 2014 - 2015 | Thereafter | ||||||||||||
| |
(dollars in thousands) |
||||||||||||||||
Long-term debt obligations(a) |
$ | 238,525 | $ | 1,850 | $ | 3,700 | $ | 232,975 | $ | — | |||||||
Interest costs(b) |
34,509 | 9,959 | 19,686 | 4,864 | — | ||||||||||||
Operating lease obligations |
9,789 | 3,274 | 3,756 | 1,144 | 1,615 | ||||||||||||
Other contractual obligations(c) |
— | — | — | — | — | ||||||||||||
Total |
$ | 282,823 | $ | 15,083 | $ | 27,142 | $ | 238,983 | $ | 1,615 | |||||||
- (a)
- Represents
principal payments only. No mandatory payment is required until June 30, 2011 due to the $15.0 million payment made in conjunction
with the IPO. However, we plan to continue to make such debt payments based on the original required maturity schedule.
- (b)
- Represents
estimated interest costs in such period based on interest rates for our outstanding long-term debt in effect as of
December 31, 2010.
- (c)
- Other contractual obligations exclude our ASC 740 liabilities for unrecognized tax benefits. See Note 12 to our Consolidated Financial Statements included in Item 8 in this Annual Report.
Off-Balance Sheet Arrangements
We have no off-balance sheet financing arrangements.
79
Effects of Inflation
Inflation generally affects us by increasing costs of raw materials, labor and equipment. In 2010, the price of our raw materials increased and negatively impacted our cost of sales by approximately $6.8 million.
Recently Issued Accounting Standards
In October 2009, the FASB issued Accounting Standards Update No. 2009-13, Revenue Recognition (Topic 605): Multiple-Deliverable Revenue Arrangements. ASC 605-25 addresses the accounting for these arrangements and enables vendors to account for product and services (deliverables) separately rather than as a combined unit. The amendment will significantly improve the reporting of these transactions to more closely resemble their underlying economics, eliminate the residual method of allocation and improve financial reporting with greater transparency of how a vendor allocates revenue in its arrangements. The amendment in this update will be effective prospectively for revenue arrangements entered into or materially modified in fiscal years beginning on or after June 15, 2010. Early adoption is permitted. The standard will not have an impact on our consolidated financial statements.
Forward-Looking Statements
This Annual Report contains forward-looking statements within the meaning of the Private Securities Litigation Reform Act of 1995. Such statements are subject to inherent risks and uncertainties. These forward-looking statements present our current expectations and projections relating to our financial condition, results of operations, plans, objectives, future performance and business and are based on assumptions that we have made in light of our industry experience and perceptions of historical trends, current conditions, expected future developments and other factors management believes are appropriate under the circumstances. However, these forward-looking statements are not guarantees of future performance or financial or operating results. In addition to the risks and uncertainties discussed in this Annual Report, we face risks and uncertainties that include, but are not limited to, the following: (i) rising commodity costs, such as resin or paper used in our encapsulants, and our ability to successfully manage any increases in these commodity costs; (ii) our dependence on a limited number of third party suppliers for raw materials for our encapsulants and materials used in our processes; (iii) demand for solar energy in general and solar modules in particular; (iv) the timing and effects of the implementation of recently announced government incentives and policies for renewable energy, primarily in China and the United States; (v) the effects of the announced reductions to solar incentives in Germany and Italy; (vi) customer concentration in our Solar business and our relationships with key customers; (vii) our ability to protect our intellectual property; (viii) pricing pressures and other competitive factors; (ix) operating new manufacturing facilities and increasing production capacity at existing facilities; (x) our reliance on vendors and potential supply chain disruptions, including those resulting from bankruptcy filings by customers or vendors; (xi) potential product performance matters, product liability or professional liability claims and our ability to manage them; (xii) loss of professional accreditations and memberships; (xiii) the extent and duration of the current downturn in the global economy, including the timing of expected economic recovery in the United States and abroad and the continuing effects of the ongoing recession on sales; (xiv) the impact negative credit markets may have on us or our customers or suppliers; (xv) the impact of changes in foreign currency exchange rates on financial results, and the geographic distribution of revenues and earnings; (xvi) maintaining sufficient liquidity in order to fund future profitable growth and long term vitality; (xvii) the extent to which we may be required to write-off accounts receivable or inventory; (xviii) outcomes of litigation and regulatory actions; and (xix) the other risks and uncertainties described under "Item 1A—Risk Factors" and "Item 7—Management's Discussion and Analysis of Financial Condition and Results of Operations" and in subsequent periodic
80
reports on Forms 10-K, 10-Q and 8-K. You are urged to carefully review and consider the disclosure found in our filings which are available on http://www.sec.gov or http://www.strholdings.com. Should one or more of these risks or uncertainties materialize, or should any of these assumptions prove to be incorrect, actual results may vary materially from those projected in these forward-looking statements. We undertake no obligation to publicly update any forward-looking statement contained in this Annual Report, whether as a result of new information, future developments or otherwise, except as may be required by law.
ITEM 7A. Quantitative and Qualitative Disclosures About Market Risk
Foreign Exchange Risk
We have foreign currency exposure related to our operations outside of the United States. This foreign currency exposure arises primarily from the translation or re-measurement of our foreign subsidiaries' financial statements into U.S. dollars. Fluctuations in the rate of exchange between the U.S. dollar and foreign currencies could adversely affect our consolidated results of operations. For the years ended December 31, 2010, 2009 and 2008, approximately $170.4 million, or 45.8%, $117.2 million, or 44.2% and $142.2 million, or 49.3%, respectively, of our net sales were denominated in foreign currencies. We expect that the percentage of our net sales denominated in foreign currencies will increase in the foreseeable future as we expand our international operations. Selling, marketing and administrative costs related to these foreign currency net sales are largely denominated in the same respective currency, thereby partially offsetting our foreign exchange risk exposure. However, for net sales not denominated in U.S. dollars, if there is an increase in the rate at which a foreign currency is exchanged for U.S. dollars, it will require more of the foreign currency to equal a specified amount of U.S. dollars than before the rate increase. In such cases and if we price our products in the foreign currency, we will receive less in U.S. dollars than we did before the rate increase went into effect. If we price our products or services in U.S. dollars and competitors price their products in local currency, an increase in the relative strength of the U.S. dollar could result in our price not being competitive in a market where business is transacted in the local currency.
In addition, our assets and liabilities of foreign operations are recorded in foreign currencies and translated into U.S. dollars. If the U.S. dollar increases in value against these foreign currencies, the value in U.S. dollars of the assets and liabilities recorded in these foreign currencies will decrease. Conversely, if the U.S. dollar decreases in value against these foreign currencies, the value in U.S. dollars of the assets and liabilities originally recorded in these foreign currencies will increase. Thus, increases and decreases in the value of the U.S. dollar relative to these foreign currencies have a direct impact on the value in U.S. dollars of our foreign currency denominated assets and liabilities, even if the value of these items has not changed in their original currency.
We do not engage in any hedging activities related to this exchange rate risk. As such, a 10% change in the U.S. dollar exchange rates in effect as of December 31, 2010 would have caused a change in consolidated net assets of approximately $11.7 million and a change in net sales of approximately $17.0 million.
Interest Rate Risk
We are exposed to interest rate risk in connection with our first lien term loan facility, our second lien term loan facility and any borrowings under our revolving credit facility. Our first lien and second lien facilities bear interest at floating rates based on the LIBO or the greater of the prime rate or the federal funds rate plus an applicable borrowing margin. Borrowings under our revolving credit facility bear interest at floating rates based on the LIBO or a base rate plus an applicable borrowing margin. For variable rate debt, interest rate changes generally do not affect the fair value of the debt instrument, but do impact future earnings and cash flows, assuming other factors are held constant.
81
To manage our interest rate exposure and fulfill requirements under our credit facilities, effective September 13, 2007, we entered into an interest rate swap with Credit Suisse International that effectively converted a portion of our debt under our credit facilities from a floating interest rate to a fixed interest rate. Prior to the expiration of our interest rate swap agreement on September 30, 2010, our interest rate swap agreement was for a $130.0 million notional principal amount and had a fair value of a liability of $0 and $4.0 million as of December 31, 2010 and 2009, respectively. Such amount was reduced from the December 31, 2007 notional amount of $200.0 million on October 1, 2008. Based on the amount outstanding under our first lien and second lien facilities at December 31, 2010, a change of one percentage point in the applicable interest rate, would cause an increase or decrease in interest expense of approximately $2.4 million on an annual basis. As of December 31, 2010, none of our variable interest rate debt has been hedged and we do not plan to hedge any portion of our debt in the near term. For further information on the interest rate swap agreement, see—"Components of Net Sales and Expenses—Other Income (Expense) Items" above and Note 8 to our Consolidated Financial Statements included in Item 8 in this Annual Report.
Raw Material Price Risk
The major raw material that we purchase for production of our encapsulants for our Solar segment is resin, and paper liner is the second largest raw material cost. The price and availability of these materials are subject to market conditions affecting supply and demand. In particular, the price of many of our raw materials can be impacted by fluctuations in petrochemical, pulp prices and supply and demand dynamics in other industries. In 2010, the price of our raw materials, primarily resin, has increased and negatively impacted our cost of sales by approximately $6.8 million. Additionally, our distribution costs can be impacted by fluctuations in diesel prices. We currently do not have a hedging program in place to manage fluctuations in raw material prices. However, we try to mitigate raw material inflation by holding inventory safety stock, taking advantage of early payment discounts, adding inflation escalation price clauses in customer contracts and ensuring we have multiple sourcing alternatives for each of our raw materials. Increases in raw material prices could have a material adverse effect on our gross margins and results of operations, particularly in circumstances where we have entered into fixed price contracts with our Solar customers.
82
ITEM 8. Financial Statements and Supplementary Data
Report of Independent Registered Public Accounting Firm
To the Board of Directors and Stockholders of STR Holdings, Inc.:
In our opinion, the accompanying consolidated balance sheets and the related consolidated statements of operations and comprehensive income, of changes in stockholders'/unitholders' equity, and of cash flows present fairly, in all material respects, the financial position of STR Holdings, Inc. and its subsidiaries at December 31, 2010 and 2009, and the results of their operations and their cash flows for each of the three years in the period ended December 31, 2010 in conformity with accounting principles generally accepted in the United States of America. In addition, in our opinion, the financial statement schedule listed in the index appearing under Item 15(a)(2) presents fairly, in all material respects, the information set forth therein when read in conjunction with the related consolidated financial statements. Also in our opinion, the Company maintained, in all material respects, effective internal control over financial reporting as of December 31, 2010, based on criteria established in Internal Control—Integrated Framework issued by the Committee of Sponsoring Organizations of the Treadway Commission (COSO). The Company's management is responsible for these financial statements and financial statement schedule, for maintaining effective internal control over financial reporting and for its assessment of the effectiveness of internal control over financial reporting, included in the Report of Management on Internal Control over Financial Reporting appearing under Item 9A. Our responsibility is to express opinions on these financial statements, on the financial statement schedule, and on the Company's internal control over financial reporting based on our audit (which was an integrated audit in 2010). We conducted our audits in accordance with the standards of the Public Company Accounting Oversight Board (United States). Those standards require that we plan and perform the audits to obtain reasonable assurance about whether the financial statements are free of material misstatement and whether effective internal control over financial reporting was maintained in all material respects. Our audits of the financial statements included examining, on a test basis, evidence supporting the amounts and disclosures in the financial statements, assessing the accounting principles used and significant estimates made by management, and evaluating the overall financial statement presentation. Our audit of internal control over financial reporting included obtaining an understanding of internal control over financial reporting, assessing the risk that a material weakness exists, and testing and evaluating the design and operating effectiveness of internal control based on the assessed risk. Our audits also included performing such other procedures as we considered necessary in the circumstances. We believe that our audits provide a reasonable basis for our opinions.
A company's internal control over financial reporting is a process designed to provide reasonable assurance regarding the reliability of financial reporting and the preparation of financial statements for external purposes in accordance with generally accepted accounting principles. A company's internal control over financial reporting includes those policies and procedures that (i) pertain to the maintenance of records that, in reasonable detail, accurately and fairly reflect the transactions and dispositions of the assets of the company; (ii) provide reasonable assurance that transactions are recorded as necessary to permit preparation of financial statements in accordance with generally accepted accounting principles, and that receipts and expenditures of the company are being made only in accordance with authorizations of management and directors of the company; and (iii) provide reasonable assurance regarding prevention or timely detection of unauthorized acquisition, use, or disposition of the company's assets that could have a material effect on the financial statements.
Because of its inherent limitations, internal control over financial reporting may not prevent or detect misstatements. Also, projections of any evaluation of effectiveness to future periods are subject to the risk that controls may become inadequate because of changes in conditions, or that the degree of compliance with the policies or procedures may deteriorate.
/s/ PricewaterhouseCoopers LLP
Hartford,
Connecticut
March 11, 2011
83
STR Holdings, Inc. and Subsidiaries
CONSOLIDATED BALANCE SHEETS
All amounts in thousands except share and per share amounts
| |
December 31, 2010 |
December 31, 2009 |
|||||||
|---|---|---|---|---|---|---|---|---|---|
ASSETS |
|||||||||
CURRENT ASSETS |
|||||||||
Cash and cash equivalents |
$ | 106,630 | $ | 69,149 | |||||
Short-term investments |
— | 1,001 | |||||||
Accounts receivable, trade, less allowances for doubtful accounts of $1,343 and $2,468 in 2010 and 2009, respectively |
43,308 | 33,744 | |||||||
Unbilled receivables |
2,444 | 2,462 | |||||||
Inventories |
31,452 | 12,267 | |||||||
Prepaid expenses |
1,708 | 1,717 | |||||||
Deferred tax assets |
3,207 | 2,987 | |||||||
Other current assets |
6,780 | 1,796 | |||||||
Total current assets |
195,529 | 125,123 | |||||||
Property, plant and equipment, net |
73,259 | 68,895 | |||||||
Intangible assets, net |
204,660 | 216,163 | |||||||
Goodwill |
223,359 | 223,359 | |||||||
Deferred financing costs |
4,470 | 5,797 | |||||||
Other long-term assets |
1,569 | 1,283 | |||||||
Total assets |
$ | 702,846 | $ | 640,620 | |||||
LIABILITIES AND STOCKHOLDERS' EQUITY |
|||||||||
CURRENT LIABILITIES |
|||||||||
Current portion of long-term debt |
$ | 1,850 | $ | 1,981 | |||||
Book overdraft |
— | 685 | |||||||
Interest rate swap liability |
— | 4,018 | |||||||
Accounts payable |
20,371 | 10,404 | |||||||
Deferred revenue |
5,604 | 4,630 | |||||||
Accrued liabilities |
15,398 | 14,680 | |||||||
Income taxes payable |
8,242 | 3,587 | |||||||
Total current liabilities |
51,465 | 39,985 | |||||||
Long-term debt, less current portion |
236,675 | 238,525 | |||||||
Deferred tax liabilities |
84,353 | 87,722 | |||||||
Other long-term liabilities |
2,313 | 3,118 | |||||||
Total liabilities |
374,806 | 369,350 | |||||||
COMMITMENTS AND CONTINGENCIES (Note 15) |
|||||||||
Stockholders' equity |
|||||||||
Preferred stock, $0.01 par value, 20,000,000 shares authorized; no shares issued and outstanding |
— | — | |||||||
Common stock, $0.01 par value, 200,000,000 shares authorized; 41,458,478 and 41,349,710 issued and outstanding in 2010 and 2009, respectively |
407 | 402 | |||||||
Additional paid-in capital |
222,784 | 214,954 | |||||||
Retained earnings |
104,516 | 55,205 | |||||||
Accumulated other comprehensive income, net |
333 | 709 | |||||||
Total stockholders' equity |
328,040 | 271,270 | |||||||
Total liabilities and stockholders' equity |
$ | 702,846 | $ | 640,620 | |||||
See accompanying notes to these consolidated financial statements.
84
STR Holdings, Inc. and Subsidiaries
CONSOLIDATED STATEMENTS OF OPERATIONS AND COMPREHENSIVE INCOME
All amounts in thousands except share and per
share amounts
| |
Year Ended December 31, 2010 |
Year Ended December 31, 2009 |
Year Ended December 31, 2008 |
|||||||||
|---|---|---|---|---|---|---|---|---|---|---|---|---|
Net sales—Solar |
$ | 259,200 | $ | 149,521 | $ | 182,311 | ||||||
Net sales—Quality Assurance |
112,629 | 115,424 | 106,267 | |||||||||
Total net sales |
371,829 | 264,945 | 288,578 | |||||||||
Cost of sales—Solar |
151,824 | 91,213 | 103,717 | |||||||||
Cost of sales—Quality Assurance |
75,934 | 75,759 | 70,930 | |||||||||
Total cost of sales |
227,758 | 166,972 | 174,647 | |||||||||
Gross profit |
144,071 | 97,973 | 113,931 | |||||||||
Selling, general and administrative expenses |
58,045 | 48,785 | 41,592 | |||||||||
Provision for bad debt expense |
494 | 1,403 | 1,950 | |||||||||
Earnings on equity-method investments |
(168 | ) | (317 | ) | (178 | ) | ||||||
Operating income |
85,700 | 48,102 | 70,567 | |||||||||
Interest income |
111 | 136 | 249 | |||||||||
Interest expense |
(15,784 | ) | (17,068 | ) | (20,809 | ) | ||||||
Foreign currency transaction loss |
(208 | ) | (134 | ) | (1,007 | ) | ||||||
Unrealized gain (loss) on interest rate swap |
4,018 | 1,995 | (3,025 | ) | ||||||||
Income before income tax expense |
73,837 | 33,031 | 45,975 | |||||||||
Income tax expense |
24,526 | 10,042 | 17,870 | |||||||||
Net income |
$ | 49,311 | $ | 22,989 | $ | 28,105 | ||||||
Other comprehensive (loss) income: |
||||||||||||
Foreign currency translation (net of tax effect of $191, $572, and $972, respectively) |
(376 | ) | 1,063 | (1,805 | ) | |||||||
Other comprehensive (loss) income |
(376 | ) | 1,063 | (1,805 | ) | |||||||
Comprehensive income |
$ | 48,935 | $ | 24,052 | $ | 26,300 | ||||||
Net income per share (Note 3): |
||||||||||||
Basic |
$ | 1.22 | $ | 0.63 | $ | 0.78 | ||||||
Diluted |
$ | 1.17 | $ | 0.61 | $ | 0.75 | ||||||
Weighted-average shares outstanding (Note 3): |
||||||||||||
Basic |
40,302,509 | 36,638,402 | 36,083,982 | |||||||||
Diluted |
42,126,502 | 37,514,790 | 37,411,765 | |||||||||
See accompanying notes to these consolidated financial statements.
85
STR Holdings, Inc. and Subsidiaries
CONSOLIDATED STATEMENTS OF CHANGES IN STOCKHOLDERS' / UNITHOLDERS' EQUITY
All amounts in thousands except share / unit and per share / unit amounts
| |
Units Class A |
Units Class F |
|
|
|
|
|
|
|||||||||||||||||||||||
|---|---|---|---|---|---|---|---|---|---|---|---|---|---|---|---|---|---|---|---|---|---|---|---|---|---|---|---|---|---|---|---|
| |
Common Stock | |
Accumulated Other Comprehensive Income (Loss) |
|
Total Stockholders' / Unitholders' Equity |
||||||||||||||||||||||||||
| |
Additional Paid-In Capital |
Retained Earnings |
|||||||||||||||||||||||||||||
| |
Issued | Amount | Issued | Amount | Issued | Amount | |||||||||||||||||||||||||
Balance at January 1, 2008 |
17,865 | $ | 178,649 | 294 | $ | 1,171 | — | $ | — | $ | — | $ | 1,451 | $ | 4,111 | $ | 185,382 | ||||||||||||||
Stock-based compensation |
— | — | 98 | 285 | — | — | — | — | — | 285 | |||||||||||||||||||||
Net income |
— | — | — | — | — | — | — | — | 28,105 | 28,105 | |||||||||||||||||||||
Foreign currency translation |
— | — | — | — | — | — | — | (1,805 | ) | — | (1,805 | ) | |||||||||||||||||||
Balance at December 31, 2008 |
17,865 | $ | 178,649 | 392 | $ | 1,456 | — | $ | — | $ | — | $ | (354 | ) | $ | 32,216 | $ | 211,967 | |||||||||||||
Stock-based compensation pre IPO |
— | $ | — | 98 | $ | 238 | — | $ | — | $ | — | $ | — | $ | — | $ | 238 | ||||||||||||||
Conversion of membership units into common shares |
(17,865 | ) | (178,649 | ) | (490 | ) | (1,694 | ) | 36,745,031 | 367 | 182,906 | — | — | 2,930 | |||||||||||||||||
Issuance of common stock pursuant to IPO, net of offering costs |
— | — | — | — | 3,300,000 | 33 | 24,980 | — | — | 25,013 | |||||||||||||||||||||
Stock-based compensation |
— | — | — | — | 121,366 | 2 | 7,068 | — | — | 7,070 | |||||||||||||||||||||
Net income |
— | — | — | — | — | — | — | — | 22,989 | 22,989 | |||||||||||||||||||||
Foreign currency translation |
— | — | — | — | — | — | — | 1,063 | — | 1,063 | |||||||||||||||||||||
Balance at December 31, 2009 |
— | $ | — | — | $ | — | 40,166,397 | $ | 402 | $ | 214,954 | $ | 709 | $ | 55,205 | $ | 271,270 | ||||||||||||||
Offering costs from IPO |
— | $ | — | — | $ | — | — | $ | — | $ | (467 | ) | $ | — | $ | — | $ | (467 | ) | ||||||||||||
Proceeds from exercise of stock options |
— | — | — | — | 93,554 | 1 | 949 | — | — | 950 | |||||||||||||||||||||
Purchase of minority interest of STR Registrar |
— | — | — | — | — | — | (641 | ) | — | — | (641 | ) | |||||||||||||||||||
Option exercise recognized tax benefit |
— | — | — | — | — | — | 142 | — | — | 142 | |||||||||||||||||||||
Stock-based compensation |
— | — | — | — | 470,802 | 4 | 7,847 | — | — | 7,851 | |||||||||||||||||||||
Net income |
— | — | — | — | — | — | — | — | 49,311 | 49,311 | |||||||||||||||||||||
Foreign currency translation |
— | — | — | — | — | — | — | (376 | ) | — | (376 | ) | |||||||||||||||||||
Balance at December 31, 2010 |
— | $ | — | — | $ | — | 40,730,753 | $ | 407 | $ | 222,784 | $ | 333 | $ | 104,516 | $ | 328,040 | ||||||||||||||
See accompanying notes to these consolidated financial statements.
86
STR Holdings, Inc. and Subsidiaries
CONSOLIDATED STATEMENTS OF CASH FLOWS
All amounts in thousands
| |
Year Ended December 31, 2010 |
Year Ended December 31, 2009 |
Year Ended December 31, 2008 |
|||||||||
|---|---|---|---|---|---|---|---|---|---|---|---|---|
OPERATING ACTIVITIES |
||||||||||||
Net income |
$ | 49,311 | $ | 22,989 | $ | 28,105 | ||||||
Adjustments to reconcile net income to net cash provided by operating activities: |
||||||||||||
Depreciation |
13,719 | 11,878 | 9,745 | |||||||||
Amortization of intangibles |
11,503 | 11,503 | 11,503 | |||||||||
Amortization of deferred financing costs |
1,327 | 1,522 | 1,150 | |||||||||
Stock-based compensation expense |
7,851 | 7,308 | 1,752 | |||||||||
Unrealized (gain) loss on interest rate swap |
(4,018 | ) | (1,995 | ) | 3,025 | |||||||
Earnings on equity investments |
(168 | ) | (317 | ) | (178 | ) | ||||||
Loss (gain) on disposal of property, plant and equipment |
16 | 67 | (3 | ) | ||||||||
Provision for bad debt expense |
494 | 1,403 | 1,950 | |||||||||
Deferred income tax benefit |
(3,396 | ) | (1,773 | ) | (4,392 | ) | ||||||
Changes in operating assets and liabilities: |
||||||||||||
Accounts receivable |
(9,406 | ) | 1,710 | (10,517 | ) | |||||||
Inventories |
(19,437 | ) | 6,607 | (11,917 | ) | |||||||
Other current assets |
(5,720 | ) | (1,071 | ) | (72 | ) | ||||||
Accounts payable |
9,640 | (3,240 | ) | 6,181 | ||||||||
Accrued liabilities |
1,757 | (890 | ) | 7,044 | ||||||||
Income taxes payable |
4,797 | (6,847 | ) | 3,543 | ||||||||
Other, net |
471 | (996 | ) | 748 | ||||||||
Net cash provided by operating activities |
58,741 | 47,858 | 47,667 | |||||||||
INVESTING ACTIVITIES |
||||||||||||
Purchase of minority interest of STR Registrar |
(645 | ) | — | — | ||||||||
Capital expenditures |
(19,426 | ) | (17,833 | ) | (35,288 | ) | ||||||
Purchase of investments |
— | (1,001 | ) | — | ||||||||
Proceeds from sale of investments |
1,002 | — | — | |||||||||
Proceeds from sale of fixed assets |
18 | — | — | |||||||||
Net cash used in investing activities |
(19,051 | ) | (18,834 | ) | (35,288 | ) | ||||||
FINANCING ACTIVITIES |
||||||||||||
Long-term debt repayments |
(1,850 | ) | (16,850 | ) | (1,850 | ) | ||||||
Principal payments on capital lease obligations |
(131 | ) | (165 | ) | (155 | ) | ||||||
Proceeds from exercise of stock options |
950 | — | — | |||||||||
Option exercise recognized tax benefit |
142 | — | — | |||||||||
Proceeds received from issuance of common stock pursuant to IPO, net of offering costs |
— | 30,855 | — | |||||||||
Other issuance costs |
(1,535 | ) | (2,458 | ) | (3,266 | ) | ||||||
Net cash (used in) provided by financing activities |
(2,424 | ) | 11,382 | (5,271 | ) | |||||||
Effect of exchange rate changes on cash |
215 | 875 | (420 | ) | ||||||||
Net increase in cash and cash equivalents |
37,481 | 41,281 | 6,688 | |||||||||
Cash and cash equivalents, Beginning of period |
69,149 | 27,868 | 21,180 | |||||||||
Cash and cash equivalents, End of period |
$ | 106,630 | $ | 69,149 | $ | 27,868 | ||||||
SUPPLEMENTAL DISCLOSURE OF CASH FLOW INFORMATION |
||||||||||||
Cash paid during the period for: |
||||||||||||
Interest |
$ | 14,359 | $ | 15,820 | $ | 19,792 | ||||||
Income taxes |
$ | 20,974 | $ | 15,647 | $ | 19,495 | ||||||
NON-CASH INVESTING AND FINANCING ACTIVITIES |
||||||||||||
Conversion of contingently redeemable units to common stock |
$ | — | $ | 2,930 | $ | — | ||||||
See accompanying notes to these consolidated financial statements.
87
STR Holdings, Inc. and Subsidiaries
NOTES TO CONSOLIDATED FINANCIAL STATEMENTS
(All amounts in thousands except per share / unit amounts unless
otherwise noted)
NOTE 1—BASIS OF PRESENTATION AND NATURE OF OPERATIONS
Basis of Presentation
These consolidated financial statements reflect the financial statements of STR Holdings, Inc. ("Holdings") or (the "Company") and its subsidiaries on a consolidated basis. The consolidated financial statements for the years ended December 31, 2010, 2009 and 2008, represent the new basis of accounting for STR Holdings, Inc. and its subsidiaries that reflect the June 15, 2007 DLJ Transactions discussed below.
The accompanying consolidated financial statements and the related information contained within the notes to the consolidated financial statements have been prepared in accordance with accounting principles generally accepted in the United States of America ("GAAP") and applicable rules and regulations of the Securities and Exchange Commission ("SEC") for financial information and annual reports on the Form 10-K.
Certain prior periods' disclosures have been reclassified to conform to the current period's presentation.
Nature of Operations
STRI was incorporated in 1944 as a plastics and industrial materials research and development company. The Company operates in two business segments: Solar and Quality Assurance ("QA").
Solar designs, develops and manufactures encapsulants that protect the embedded semiconductor circuits of solar panels for sale to solar module manufacturers worldwide.
QA provides inspection, testing and audit services that enable retailers and manufacturers to determine whether products meet applicable safety, regulatory, quality, performance, social and ethical standards.
On June 15, 2007, DLJ Merchant Banking Partners IV, L.P. and affiliated investment funds, or ("DLJMB"), and its co-investors, together with members of STR Holdings, Inc.'s board of directors, its executive officers and other members of management, acquired 100% of the voting equity interests in the Company's wholly-owned subsidiary, Specialized Technology Resources, Inc. for $365.6 million, including transaction costs (the "Acquisition"). They acquired Specialized Technology Resources, Inc. for investment purposes.
In connection with the Acquisition:
- •
- DLJMB and its co-investors contributed $145.7 million in cash for approximately 81.6% of the voting
equity interests in STR Holdings LLC;
- •
- Dennis L. Jilot, the Company's Chairman, President and Chief Executive Officer, Barry A. Morris, the Company's Executive Vice President and Chief Financial Officer, and Robert S. Yorgensen, the Company's Vice President and President of STR Solar, exchanged a portion of their existing equity investments in Specialized Technology Resources, Inc., valued at approximately $11.5 million, for approximately 6.4% of the voting equity interests in STR Holdings LLC;
88
STR Holdings, Inc. and Subsidiaries
NOTES TO CONSOLIDATED FINANCIAL STATEMENTS (Continued)
(All amounts in thousands except per share / unit amounts unless otherwise noted)
NOTE 1—BASIS OF PRESENTATION AND NATURE OF OPERATIONS (Continued)
- •
- other stockholders of Specialized Technology Resources, Inc., including some current and former employees and
former directors, exchanged a portion of their existing equity investments in Specialized Technology Resources, Inc., valued at approximately $21.5 million, for approximately 12.0% of
the voting equity interests in STR Holdings LLC;
- •
- Specialized Technology Resources, Inc., as borrower, and STR Holdings LLC, as a guarantor, entered
into a first lien credit facility providing for a fully drawn $185.0 million term loan facility and an undrawn $20.0 million revolving credit facility and a second lien credit facility
providing for a fully drawn $75.0 million term loan facility, in each case, with Credit Suisse, as administrative agent and collateral agent; and
- •
- with the cash contributed from DLJMB and its co-investors and the borrowings under the Company's first lien and second lien credit facilities, STR Holdings LLC (i) purchased the remaining shares of stock in Specialized Technology Resources, Inc. for $324.7 million, (ii) repaid $61.7 million of debt held by Specialized Technology Resources, Inc., (iii) settled Specialized Technology Resources, Inc. stock options for $1.5 million, (iv) paid financing costs of $7.9 million and transaction costs of $4.4 million, and (v) retained the remaining $5.5 million in proceeds for working capital purposes.
The Company refers to the foregoing transactions collectively as the "DLJ Transactions".
Prior to November 5, 2009 the Company conducted its business through STR Holdings LLC and its subsidiaries. STR Holdings (New) LLC ("NewCo"), a Delaware limited liability company, was formed on September 30, 2009 as an indirect subsidiary of STR Holdings LLC and held no material assets and did not engage in any operations.
Pursuant to the corporate reorganization on November 5, 2009, STR Holdings LLC liquidated. A subsidiary of NewCo merged with and into Specialized Technology Resources, Inc. and its subsidiaries ("STRI") and, as a result, STRI became a wholly-owned subsidiary of NewCo. The unitholders of STR Holdings LLC became unitholders of NewCo. NewCo converted from a limited liability company into a Delaware 'C' corporation, named STR Holdings, Inc., and the outstanding units of NewCo converted into a single class of common stock of STR Holdings, Inc.
On November 12, 2009, the Company closed its initial public offering ("IPO") of 12,300,000 shares of common stock at an offering price of $10 per share, of which 3,300,000 shares were sold by the Company and 9,000,000 shares were sold by selling stockholders. The Company raised approximately $25.0 million in net proceeds after deducting underwriting discounts, commissions and other offering costs of approximately $7.8 million. Effective with the conversion of NewCo into STR Holdings, Inc., the outstanding units were automatically converted into shares of common stock and restricted common stock.
On December 7, 2009, the Company closed the partial exercise of the over-allotment option granted by the selling stockholders given in connection with the IPO which resulted in a total purchase of 1,695,000 shares at the IPO price of $10 per share. The Company did not receive any of the proceeds from the sale of the shares as a result of the exercise of the over-allotment option.
On April 21, 2010, the Company closed its secondary offering of 8,050,000 shares of its common stock on behalf of certain stockholders at $18.75 per share. The total offering size reflected the
89
STR Holdings, Inc. and Subsidiaries
NOTES TO CONSOLIDATED FINANCIAL STATEMENTS (Continued)
(All amounts in thousands except per share / unit amounts unless otherwise noted)
NOTE 1—BASIS OF PRESENTATION AND NATURE OF OPERATIONS (Continued)
underwriters' exercise of their option to purchase an additional 1,050,000 shares from the selling stockholders to cover over-allotments. The Company did not receive any proceeds from the offering.
NOTE 2—SUMMARY OF SIGNIFICANT ACCOUNTING POLICIES
A summary of the Company's significant accounting policies is as follows:
Basis of Accounting. The consolidated financial statements are prepared in accordance with accounting principles generally accepted in the United States of America.
Principles of Consolidation. The consolidated financial statements include the accounts of the Company and its wholly-owned and majority-owned subsidiaries. Intercompany transactions and account balances have been eliminated. The Company accounts for its 50% owned investments on an equity basis (See Note 6).
Use of Estimates. The preparation of consolidated financial statements in conformity with accounting principles generally accepted in the United States of America requires the Company to make estimates and assumptions that affect the amounts reported in the consolidated financial statements and the accompanying notes. The Company's significant estimates include its revenue recognition, allowance for doubtful accounts receivable, inventory valuation, the recorded amounts and amortization periods of its intangible assets, valuation of goodwill, product performance accrual, income taxes payable and deferred income taxes, its assessment of uncertain tax positions and its valuation of stock-based compensation costs. Actual results could differ materially from these estimates.
Fair Value Estimates. The Company adopted ASC 820-10—Fair Value Measurements, in the first quarter of 2008. As of December 31, 2010, the Company did not have any non-recurring measurements of nonfinancial assets and nonfinancial liabilities. ASC 820-10 defines fair value as the price that would be received to sell an asset or paid to transfer a liability in an orderly transaction between market participants at the measurement date. ASC 820-10 classifies the inputs used to measure fair value into the following hierarchy:
| Level 1: | Unadjusted quoted prices in active markets for identical assets or liabilities | |
Level 2: |
Unadjusted quoted prices in active markets for similar assets or liabilities, or unadjusted quoted prices for identical or similar assets or liabilities in markets that are not active, or inputs other than quoted prices that are observable for the asset or liability |
|
Level 3: |
Unobservable inputs for the asset or liability |
Refer to Note 14 for financial assets and liabilities that are reported at fair values and measured on a recurring basis. The carrying values for cash, accounts receivable, accounts payable, accrued liabilities and other current assets and liabilities approximate their fair values due to their short maturities.
Foreign Currency Translation and Transactions. The Company's international operations use the local currency as their functional currency other than our Malaysian subsidiary whose functional currency is the U.S. Dollar. Assets and liabilities of international operations are translated at
90
STR Holdings, Inc. and Subsidiaries
NOTES TO CONSOLIDATED FINANCIAL STATEMENTS (Continued)
(All amounts in thousands except per share / unit amounts unless otherwise noted)
NOTE 2—SUMMARY OF SIGNIFICANT ACCOUNTING POLICIES (Continued)
period-end rates of exchange; revenues and expenses are translated at average rates of exchange. The resulting translation gains or losses are reflected in accumulated other comprehensive income. Gains or losses resulting from foreign currency transactions are included in net income.
Cash and Cash Equivalent and Short-Term Investments. All highly-liquid investments with a maturity of three months or less at the date of purchase are considered to be cash equivalents. Instruments with a maturity of greater than three months are classified as short-term investments. Short-term investments of $1.0 million as of December 31, 2009 was comprised of a money market account with a maturity of greater than three months.
Recognition of Revenue and Accounts Receivable. The Company recognizes revenue when evidence of an arrangement exists, delivery of the product or service has occurred and title and risk of loss have passed to the customer, the sales price is fixed or determinable, and collectability of the resulting receivable is reasonably assured.
Solar recognizes revenue from the manufacture and sale of its products either at the time of shipping or at the time the product is received at the customer's port or dock, depending upon terms of the sale.
QA performs testing, quality assurance and compliance consulting on a fixed-price, time and material, or a cost plus fixed-fee basis. The majority of the Company's QA contracts provide one service deliverable to the client, and revenue is recognized upon completion of such service when a report is provided to the client.
A limited number of QA contracts include the performance of multiple service offerings in an integrated package and are more long-term in nature. The amount of revenue recognized for these contracts amounted to $2.9 million, $3.7 million and $5.0 million for the years ended December 31, 2010, 2009 and 2008, respectively. These contracts are accounted for under ASC 605—Revenue Recognition. ASC 605 requires contract consideration in which multiple service offerings are provided under a single contract to be allocated to each specific service offering based on each portion of the contract's respective fair value in proportion to the contract's total fair value. The Company has determined that each deliverable under these contracts is a separate unit of accounting that possesses fair value that is represented by price lists and historical billing practices. The Company recognizes revenue on each contract deliverable when the services have been completed and communicated to our client. Contractual termination provisions exist by which either party may cancel the contract with written notice. Upon notice, the Company is contractually entitled to receive compensation for all services performed up to and through the termination period.
Billing for these contracts occurs on a pre-determined schedule or at the end of the contractual term. Unbilled receivables represent revenue that has been recognized but not billed, while deferred revenue represents cash received from clients in excess of revenues recognized on contracts as the report has not been delivered.
Allowance for Doubtful Accounts. The Company maintains an allowance for doubtful accounts for estimated losses resulting from the inability of its customers to make required payments. The Company reviews the collectability of its receivables on an ongoing basis and writes off accounts receivable after reasonable collection efforts have been made and collection is deemed questionable or uncollectible.
91
STR Holdings, Inc. and Subsidiaries
NOTES TO CONSOLIDATED FINANCIAL STATEMENTS (Continued)
(All amounts in thousands except per share / unit amounts unless otherwise noted)
NOTE 2—SUMMARY OF SIGNIFICANT ACCOUNTING POLICIES (Continued)
Inventories. The Company's inventories are stated at the lower of cost or market. The Company's primary raw materials consist of resin, paper, packaging material and chemicals/additives. The Company's finished goods inventories are made-to-order and possess a shelf life of six to nine months from the date of manufacture. Cost is determined on a first-in, first-out basis and includes both the costs of acquisition and the costs of manufacturing. These costs include direct material, direct labor and fixed and variable indirect manufacturing costs, including depreciation expense and amortization of intangible assets.
The Company will write down inventory to its net realizable value when it is probable that its inventory carrying cost is not fully recoverable through sale or other disposition. The Company's write down considers overall market conditions, customer inventory levels, legal or contractual provisions and age of the inventories.
Prior to 2009, obsolescence was not a significant factor in the valuation of inventory. Due to the recessionary economic environment that existed during the first six months of 2009, some customers canceled or delayed the delivery of orders after the product was manufactured but not yet shipped. As such, $1.0 million of inventory write downs were recorded during the first half of the year ended December 31, 2009 with such amounts being fully utilized as of December 31, 2009.
Property, Plant and Equipment. Property, plant and equipment are recorded at cost and include expenditures for items that increase the useful lives of existing equipment. Maintenance and repairs are expensed as incurred. The property, plant and equipment accounts are relieved at cost, less related accumulated depreciation, when properties are disposed of or otherwise retired. Gains and losses from disposal of property, plant and equipment are included in net income.
The Company incurs costs related to the development of computer software for internal use. These costs are accounted for under ASC 350-40—Intangibles—Goodwill and Other—Internal—Use Software. The Company capitalizes external direct costs of materials and services, internal payroll and payroll-related costs for employees who spend direct time working on the computer software project and a portion of interest cost incurred while developing the internal use computer software. Training costs are expensed as incurred. Accordingly, the Company capitalized $6.7 million, $2.1 million and $0 for the years ended December 31, 2010, 2009 and 2008, respectively.
Goodwill. Goodwill represents the excess of the purchase price consideration over the estimated fair value assigned to the individual assets acquired and liabilities assumed. The Company does not amortize goodwill, but instead tests goodwill for impairment in accordance with the two-step method described in ASC 350—Intangibles—Goodwill and Other. The Company performs its annual impairment review of goodwill on October 1 and will also perform a review if at any time facts and circumstances warrant. In assessing if there is an impairment of goodwill, the Company first determines the fair value of its two reporting units, which are also its reportable segments, Solar and QA. If the fair value of either of its two segments, were to be less than its carrying value, the Company would allocate the current fair value of the segment to the assets and liabilities of the segment to estimate the segment's goodwill. If such implied goodwill was less than the carrying value of such goodwill, the Company would record an impairment charge for the amount of such difference. The Company completed its required annual impairment testing in the fourth quarter of each of 2010, 2009 and 2008, which resulted in no impairments to the Company's goodwill.
92
STR Holdings, Inc. and Subsidiaries
NOTES TO CONSOLIDATED FINANCIAL STATEMENTS (Continued)
(All amounts in thousands except per share / unit amounts unless otherwise noted)
NOTE 2—SUMMARY OF SIGNIFICANT ACCOUNTING POLICIES (Continued)
Intangible Assets. The Company accounts for business acquisitions using the purchase method of accounting and records definite-lived intangible assets separately from goodwill. Intangible assets are recorded at their estimated fair value at the date of acquisition (See Note 7).
The Company's intangible assets include its customer relationships, trademarks, proprietary technology and accreditations and resulted from the DLJ Transactions that occurred in June of 2007.
The Company's customer relationships consist of the value associated with existing contractual arrangements as well as expected value to be derived from future contract renewals of its Solar and QA customers. The Company determined their value using the income approach. Their useful life was determined by consideration of a number of factors, including the Company's long standing customer base and attrition rates.
The Company's trademarks represent the value of its STR® and Photocap® trademarks. The Company determined their value using the "relief-from-royalty" method. The useful life of trademarks was determined by consideration of a number of factors, including elapsed time and anticipated future cash flows.
The Company's proprietary technology represents the value of its Solar manufacturing processes. The Company determined its value using the "relief-from-royalty" method. The useful life of proprietary technology was determined by consideration of a number of factors, including elapsed time, prior innovations and potential future technological changes.
The Company's accreditations represent the value of QA's technical skills and ability to provide worldwide product testing, inspection and audits under applicable standards. The Company determined their value based on the cost approach. The useful life for accreditations was determined by consideration of a number of factors, including the duration such accreditations will be in effect and anticipated future cash flows.
Long-lived Assets. In accordance with ASC 360—Property, Plant, and Equipment, the Company reviews the carrying value of its long-lived assets, including property, plant and equipment, for impairment when events or changes in circumstances indicate the carrying value of an asset may not be recoverable. If a long-lived asset is found to be impaired, the amount recognized for impairment is equal to the difference between the carrying value and the asset's fair value. Fair value is estimated based upon discounted future cash flows or other reasonable estimates of fair market value. The Company had no impairments of its long-lived assets in each of 2010, 2009 and 2008.
Asset Retirement Obligations. The Company accounts for asset retirement obligations in accordance with ASC 410—Asset Retirement and Environmental Obligations, which requires a company to recognize a liability for the fair value of obligations to retire tangible long-lived assets when there is a contractual obligation to incur such costs. The Company has recorded its asset retirement obligations relating to the cost of removing improvements from lease facilities at the end of the lease terms. The Company's conditional asset retirement obligations are not material.
Deferred Financing Costs. The Company capitalizes debt issuance costs and amortizes the costs as a component of interest expense over the term of the related debt facility. Amortization of deferred
93
STR Holdings, Inc. and Subsidiaries
NOTES TO CONSOLIDATED FINANCIAL STATEMENTS (Continued)
(All amounts in thousands except per share / unit amounts unless otherwise noted)
NOTE 2—SUMMARY OF SIGNIFICANT ACCOUNTING POLICIES (Continued)
financing costs was $1,327, $1,522 and $1,150 for the years ended December 31, 2010, 2009 and 2008, respectively.
Leases. The Company leases certain facilities and equipment used in its operations. The Company accounts for its leases under the provisions of ASC 840—Leases, which requires that leases be evaluated and classified as operating or capital leases for financial reporting purposes. Assets held under capital leases are included in property, plant and equipment, net. Operating lease expense is recorded on a straight-line basis over the lease term.
Income Taxes. The Company accounts for income taxes using the asset and liability method in accordance with ASC 740—Income Taxes. Under this method, the Company recognizes deferred tax assets and liabilities for the future tax consequences attributable to differences between the financial statement carrying amounts of existing assets and liabilities and their respective tax bases, and for operating loss and tax credit carryforwards. The Company estimates its deferred tax assets and liabilities using the enacted tax laws expected to apply to taxable income in the years in which those temporary differences are expected to be recovered or settled, and will recognize the effect of a change in tax laws on deferred tax assets and liabilities in the results of its operations during the period that includes the enactment date. The Company records a valuation allowance to reduce its deferred tax assets if it determines that it is more likely than not that some or all of the deferred tax assets will not be realized.
The Company operates in multiple taxing jurisdictions and is subject to the jurisdiction of a number of U.S. and non-U.S. tax authorities and to tax agreements and treaties among those authorities. Operations in these jurisdictions are taxed on various bases in accordance with jurisdictional regulations.
Tax benefits related to uncertain tax positions taken or expected to be taken on a tax return are recorded when such benefits meet a more likely than not threshold. Otherwise, these tax benefits are recorded when a tax position has been effectively settled, which means that the appropriate taxing authority has completed their examination even though the statute of limitations remains open, or the statute of limitation expires. Interest and penalties related to uncertain tax positions are recognized as part of the Company's provision for income taxes and are accrued beginning in the period that such interest and penalties would be applicable under relevant tax law until such time that the related tax benefits are recognized (See Note 12).
Product Performance Accrual. The Company typically does not provide contractual warranties on its products. However, on limited occasions, the Company incurs costs to service its products in connection with specific product performance matters. Anticipated future costs are recorded as part of cost of sales and accrued liabilities for specific product performance matters when it is probable that a liability has been incurred and the amount of the liability can be reasonably estimated. During the second half of 2008, the Company recorded an accrual of $5.6 million relating to specific product performance matters, which amount represents management's best estimate of the costs to repair or replace such product. The majority of this accrual relates to a quality claim by one of the Company's customers in connection with a non-encapsulant product that the Company purchased from a vendor in 2005 and 2006 and resold. The Company stopped selling this product in 2006 and is currently attempting to resolve this matter.
94
STR Holdings, Inc. and Subsidiaries
NOTES TO CONSOLIDATED FINANCIAL STATEMENTS (Continued)
(All amounts in thousands except per share / unit amounts unless otherwise noted)
NOTE 2—SUMMARY OF SIGNIFICANT ACCOUNTING POLICIES (Continued)
Cost of Sales—Solar. The Company includes the cost of inventory sold and related costs for the distribution of its product in cost of sales. These costs include raw materials and other components, direct labor, product performance matters, manufacturing overhead, salaries, other personnel-related expenses, write-off of excess or obsolete inventory, quality control, freight, insurance, depreciation and amortization of intangibles. Shipping and handling costs are classified as a component of cost of sales. Customer payments for shipping and handling costs are recorded as a component of net sales.
Cost of Sales—Quality Assurance. Included in the cost of sales are direct labor, operational overhead, laboratory supplies, salaries and other personnel-related expenses, travel expenses, insurance, depreciation and amortization of intangibles.
Selling, General and Administrative Expenses. Selling, general and administrative expenses consist primarily of salaries, travel, commissions and other personnel-related expenses for employees engaged in sales, marketing and support of the Company's products and services, trade shows and promotions. General and administrative expenses consist of outside professional fees and expenses for the Company's executive, finance, administrative, information technology, compliance and human resource functions.
Research and development expense is also recorded in selling, general and administrative expenses. The Company has a long history of innovation dating back to its establishment in 1944 as a plastic and polymer research and development firm. As the Company's operations have expanded from solely providing research and development activities into the manufacturing of solar encapsulants and providing quality assurance services, it has created a separate research and development function for employees and costs that are fully dedicated to research and development activities. The Company incurred $1.8 million, $0.7 million and $0.4 million, respectively of research and development expense in 2010, 2009 and 2008, respectively.
Due to the Company's legacy of innovation, other employees spend some of their time related to research and development activities. However, the Company does not allocate such costs or allocate overhead to research and development. Accordingly, such amounts are recorded in selling, general and administrative expenses as incurred.
Stock-Based Compensation. In accordance with ASC 718—Compensation—Stock Compensation, the Company recognizes the grant date fair value of stock-based awards as compensation expense over the vesting period of the awards (See Note 11).
Earnings Per Share. The Company computes net income per share in accordance with ASC 260—Earnings Per Share. Under the provisions of ASC 260, basic net income per share is computed by dividing the net income available to common stockholders by the weighted-average common shares outstanding during the period. Diluted net income per common share adjusts basic net income per common share for the effects of stock options and restricted stock awards only in periods in which such effect is dilutive. ASC 260 also requires the Company to present basic and diluted earnings per share information separately for each class of equity instruments that participate in any income distribution with primary equity instruments (See Note 3).
95
STR Holdings, Inc. and Subsidiaries
NOTES TO CONSOLIDATED FINANCIAL STATEMENTS (Continued)
(All amounts in thousands except per share / unit amounts unless otherwise noted)
NOTE 2—SUMMARY OF SIGNIFICANT ACCOUNTING POLICIES (Continued)
Comprehensive Income. Comprehensive income consists of net income and the effects on the consolidated financial statements of translating the financial statements of the Company's international subsidiaries. Comprehensive income is presented in the consolidated statements of operations and comprehensive income. The Company's accumulated other comprehensive income is presented as a component of equity in its consolidated balance sheets and consists of the cumulative amount of the Company's foreign currency translation adjustments, net of tax impact.
Recent Accounting Pronouncements:
In October 2009, the FASB issued Accounting Standards Update ("ASU") No. 2009-13, Revenue Recognition (Topic 605): Multiple-Deliverable Revenue Arrangements. ASC 605-25 addresses the accounting for these arrangements and enables vendors to account for product and services (deliverables) separately rather than as a combined unit. The amendments will significantly improve the reporting of these transactions to more closely resemble their underlying economics, eliminate the residual method of allocation and improve financial reporting with greater transparency of how a vendor allocates revenue in its arrangements. The amendments in this update will be effective prospectively for revenue arrangements entered into or materially modified in fiscal years beginning on or after June 15, 2010. Early adoption is permitted. The standard will not have an impact on the Company's consolidated financial statements.
NOTE 3—EARNINGS PER SHARE
In connection with the Company's IPO, existing holders of Class A, B, C, D, E and F units were issued shares of common stock in exchange for their units. Shares of common stock were issued for vested units and restricted common stock for unvested units based upon the equity value of the Company on the IPO date, in accordance with the STR Holdings LLC agreement relating to priority distribution of units for shares.
The impact of this issuance has been applied on a retrospective basis to determine earnings per share for 2009 and 2008. The number of common shares reflected in the calculation is the total number of shares (vested and unvested) issued to the Company's unitholders based upon their units held on the IPO date. The vesting provisions of the units have been applied to the total common shares issued to determine basic earnings per share (based upon vested common shares equivalent to vested units) and diluted earnings per share (based upon the treasury stock method for unvested restricted common shares equivalent to unvested units).
96
STR Holdings, Inc. and Subsidiaries
NOTES TO CONSOLIDATED FINANCIAL STATEMENTS (Continued)
(All amounts in thousands except per share / unit amounts unless otherwise noted)
NOTE 3—EARNINGS PER SHARE (Continued)
The calculation of basic and diluted earnings per share for the periods presented is as follows:
| |
Year Ended December 31, 2010 |
Year Ended December 31, 2009 |
Year Ended December 31, 2008 |
|||||||||
|---|---|---|---|---|---|---|---|---|---|---|---|---|
Basic and diluted earnings per share |
||||||||||||
Numerator: |
||||||||||||
Net income |
$ | 49,311 | $ | 22,989 | $ | 28,105 | ||||||
Denominator: |
||||||||||||
Weighted-average shares outstanding |
40,302,509 | 36,638,402 | 36,083,982 | |||||||||
Add: dilutive effect of stock options |
1,069,873 | — | — | |||||||||
Add: dilutive effect of restricted common stock units |
754,120 | 876,388 | 1,327,783 | |||||||||
Weighted-average shares outstanding with dilution |
42,126,502 | 37,514,790 | 37,411,765 | |||||||||
Basic earnings per share |
$ | 1.22 | $ | 0.63 | $ | 0.78 | ||||||
Diluted earnings per share |
$ | 1.17 | $ | 0.61 | $ | 0.75 | ||||||
193,236 and 3,495,685 stock options outstanding were not included in the computation of diluted weighted-average shares outstanding for the years ended December 31, 2010 and December 31, 2009, respectively, because the effect would be anti-dilutive. There were no stock options outstanding for the year ended December 31, 2008.
NOTE 4—INVENTORIES
Inventories consist of the following:
| |
December 31, 2010 |
December 31, 2009 |
|||||
|---|---|---|---|---|---|---|---|
Finished goods |
$ | 4,338 | $ | 2,547 | |||
Raw materials |
27,114 | 9,720 | |||||
|
$ | 31,452 | $ | 12,267 | |||
97
STR Holdings, Inc. and Subsidiaries
NOTES TO CONSOLIDATED FINANCIAL STATEMENTS (Continued)
(All amounts in thousands except per share / unit amounts unless otherwise noted)
NOTE 5—PROPERTY, PLANT AND EQUIPMENT
Property, plant and equipment consist of the following:
| |
Estimated Useful Lives |
December 31, 2010 |
December 31, 2009 |
|||||||
|---|---|---|---|---|---|---|---|---|---|---|
Land |
$ | 4,619 | $ | 4,589 | ||||||
Buildings and improvements |
15 - 40 | 17,569 | 20,766 | |||||||
Machinery and equipment |
5 - 8 | 57,570 | 45,175 | |||||||
Furniture, fixtures and computer equipment |
3 - 5 | 17,029 | 8,242 | |||||||
Automobiles |
5 - 7 | 342 | 342 | |||||||
|
97,129 | 79,114 | ||||||||
Less: accumulated depreciation |
(33,372 | ) | (21,525 | ) | ||||||
|
63,757 | 57,589 | ||||||||
Construction in progress |
9,502 | 11,306 | ||||||||
Property, plant and equipment, net |
$ | 73,259 | $ | 68,895 | ||||||
Depreciation expense was $13,719, $11,878 and $9,745 for the years ended December 31, 2010, December 31, 2009 and December 31, 2008, respectively.
NOTE 6—INVESTMENTS
Equity Method Investments
The following is a summary of the Company's equity method investments all of which relate to the QA segment. The carrying value of all investments accounted for using the equity method is equal to the underlying equity in the net assets of the particular investment at the balance sheet date, unless the Company's share of operating losses has reduced the carrying value of the investment to zero, in which case the investment is carried at zero. There is no readily determinable market value for the Company's equity method investments.
The Company owns 50% of the shares of CTC-Asia, Ltd., a joint venture with Le Centre Technique Cuir Chaussure Maroquinerie ("CTC"), which operates a laboratory in Hong Kong primarily involved in the testing of leather products. At December 31, 2010 and December 31, 2009, the Company's investment in CTC-Asia, Ltd. was $1,034 and $866, respectively, and classified as Other long-term assets in the consolidated balance sheets.
Specialised Technology Resources (UK) Limited ("STR-UK") owns 50% of the shares of STR (France) SAS ("STR France"). STR France, a joint venture with CTC, is incorporated in France for the purpose of carrying out studies, analyses, inspections and other provisions of services related to the manufacture and marketing of nonfood consumer products, primarily leather goods. At December 31, 2010 and December 31, 2009, the Company's investment in STR France was zero as STR-UK's proportionate share of the losses of STR France exceeded the amount invested.
98
STR Holdings, Inc. and Subsidiaries
NOTES TO CONSOLIDATED FINANCIAL STATEMENTS (Continued)
(All amounts in thousands except per share / unit amounts unless otherwise noted)
NOTE 7—INTANGIBLE ASSETS AND GOODWILL
The Company has recorded the estimated fair values of intangible assets acquired in connection with the Acquisition. The amounts recorded, estimated lives, and amortization methods are as follows:
| |
December 31, 2010 | December 31, 2009 | |
|||||||||||||||||
|---|---|---|---|---|---|---|---|---|---|---|---|---|---|---|---|---|---|---|---|---|
| |
Gross Carrying Amount |
Accumulated Amortization |
Net | Gross Carrying Amount |
Accumulated Amortization |
Net | Useful Lives |
|||||||||||||
Customer relationships |
$ | 102,700 | $ | 18,186 | $ | 84,514 | $ | 102,700 | $ | 13,051 | $ | 89,649 | 20 years | |||||||
Trademarks |
65,800 | 7,768 | 58,032 | 65,800 | 5,575 | 60,225 | 30 years | |||||||||||||
Proprietary technology |
70,300 | 12,449 | 57,851 | 70,300 | 8,934 | 61,366 | 20 years | |||||||||||||
Accreditations |
6,600 | 2,337 | 4,263 | 6,600 | 1,677 | 4,923 | 10 years | |||||||||||||
|
$ | 245,400 | $ | 40,740 | $ | 204,660 | $ | 245,400 | $ | 29,237 | $ | 216,163 | ||||||||
The Company amortizes its intangible assets utilizing the straight line method as this method approximates the economic benefit derived from these assets. Amortization expense of such assets was $11,503 for each of the years ended December 31, 2010, 2009 and 2008.
Estimated future amortization expense at December 31, 2010 is as follows:
2011 |
$ | 11,503 | ||
2012 |
11,503 | |||
2013 |
11,503 | |||
2014 |
11,503 | |||
2015 |
11,503 | |||
Thereafter |
147,145 | |||
|
$ | 204,660 | ||
Goodwill was $223,359 at December 31, 2010 and December 31, 2009. Goodwill was allocated to the Solar and QA segments as follows:
| |
Solar | Quality Assurance |
Consolidated | |||||||
|---|---|---|---|---|---|---|---|---|---|---|
Balance at December 31, 2010 and December 31, 2009 |
$ | 146,472 | $ | 76,887 | $ | 223,359 | ||||
Goodwill is not deductible for tax purposes.
99
STR Holdings, Inc. and Subsidiaries
NOTES TO CONSOLIDATED FINANCIAL STATEMENTS (Continued)
(All amounts in thousands except per share / unit amounts unless otherwise noted)
NOTE 8—DEBT
The Company's long-term debt consists of the following:
| |
December 31, 2010 |
December 31, 2009 |
|||||
|---|---|---|---|---|---|---|---|
First Lien term loan |
$ | 163,525 | $ | 165,375 | |||
Second Lien term loan |
75,000 | 75,000 | |||||
Capital leases (Note 9) |
— | 131 | |||||
|
$ | 238,525 | $ | 240,506 | |||
Less: |
|||||||
Current portion of long-term debt |
(1,850 | ) | (1,981 | ) | |||
Total long-term debt, less current portion |
$ | 236,675 | $ | 238,525 | |||
In connection with the DLJ Transactions, the Company entered into two credit agreements (collectively the "Agreements") with Credit Suisse as administrative and collateral agent. The First Lien Credit Agreement ("First Lien") consists of a $185,000 term loan and a $20,000 revolving credit facility, which includes a sublimit for issuance of letters of credit up to $15,000. The Second Lien Credit Agreement ("Second Lien") consists of a $75,000 term loan. Under the First Lien, the Company also has the ability to request Credit Suisse to extend the credit under another term loan facility from time to time in the amount of $10,000. The Company incurred $7,967 of costs relating to these financings that were deferred and are being amortized utilizing the straight line method over the remaining life of the loans.
The Company incurred an additional $1,125 of costs relating to the Company entering into an amendment to the First Lien Agreement and the Second Lien Agreement on October 5, 2009. The amendments for both Agreements permitted the Company to enter into certain corporate reorganization transactions to facilitate the IPO, including replacing STR Holdings LLC with STR Holdings (New) LLC as a guarantor under each Agreement. This amount that was deferred is also being amortized utilizing the straight line method over the remaining life of the loans.
Subsequent to the closing of the Company's IPO, per the terms of the Company's First Lien Agreement, the Company paid down $15,000 of its debt related to this facility and as result of the prepayment, the Company wrote off deferred financing costs of approximately $342.
Borrowings under the Agreements are collateralized by substantially all of the Company's current and future acquired assets (as defined in the Agreements). The Company and its domestic subsidiaries are guarantors of the obligations. The Agreements contain customary covenants, including, among other things, limits on the Company's and its subsidiaries' ability to incur additional indebtedness, incur liens, prepay subordinated debt, make loans and certain investments, merge or consolidate, sell assets, restrict repurchases of common stock and restrict the payment of dividends. The Company is required to maintain financial covenants with respect to capital expenditures, an interest coverage ratio, a debt ratio and a maximum total leverage ratio.
100
STR Holdings, Inc. and Subsidiaries
NOTES TO CONSOLIDATED FINANCIAL STATEMENTS (Continued)
(All amounts in thousands except per share / unit amounts unless otherwise noted)
NOTE 8—DEBT (Continued)
First Lien
Borrowings under both the First Lien term loan and the First Lien revolving credit, at the Company's option, are comprised entirely of Alternate Base Rate ("ABR") or Eurodollar loans. The ABR loans bear interest at a rate equal to an applicable percentage rate plus a base rate of the greater of (1) the lender's prime rate or (2) the federal funds rate plus one half of 1%. Eurodollar loans bear interest at an applicable percentage rate plus a London Interbank Offered Rate Reserve Adjusted ("LIBO") rate as determined by the lenders. The initial applicable percentage for borrowings under the term loan facility and the revolving credit facility was 1.5% with respect to ABR borrowings and 2.5% with respect to Eurodollar loans. The weighted-average interest rate for 2010 was 2.77% and was 2.76% as of December 31, 2010. The weighted-average interest rate for 2009 was 2.85% and was 2.73% as of December 31, 2009.
The applicable percentage for revolving credit facility borrowings may be reduced, subject to the Company attaining certain leverage ratios. Changes in the applicable percentage will be determined by the administrative agent on an annual basis. In the event of default, the interest rate increases by 200 basis points. There is a commitment fee of 0.5% on the unused portion of the revolving loan facility. The revolving credit facility of $20 million was not used as of December 31, 2010 and December 31, 2009.
The Company is required to prepay outstanding First Lien term loans, subject to certain exceptions and conditions, with excess cash flow, or in the event of certain asset sales and a public offering of equity securities. Prior to the IPO, the Company was required to make minimum repayments on the First Lien term loan in quarterly principal amounts of $463. However, no mandatory payment is required until June 30, 2011 due to the $15,000 payment made in conjunction with the IPO. Interest payments are due, depending on the type of loan, either monthly or quarterly. Optional prepayments may be made at any time without premium or penalty and in a minimum amount of $1,000. The First Lien term loan matures on June 15, 2014 and the revolving credit facility expires on June 15, 2012.
Second Lien
Borrowings under the Second Lien term loan, at the Company's option, are comprised entirely of ABR or Eurodollar loans. The ABR loans bear interest at an applicable percentage rate plus a rate equal to a base rate of the greater of (1) the lender's prime rate or (2) the federal funds rate plus one half of 1%. Eurodollar loans bear interest at an applicable percentage rate plus a LIBO rate as determined by the lenders. The initial applicable percentage was 6.0% with respect to base rate borrowings and 7.0% with respect to LIBO borrowings. In the event of default, the interest rate increases by 200 basis points. The Company also has the option to pay interest entirely in cash or by increasing the outstanding principal amount. However, if interest is not paid in cash, the interest rate is increased by an additional 1.5% per annum. Interest payments are made either monthly or quarterly. The weighted-average interest rate for 2010 was 7.27% and was 7.26% as of December 31, 2010. The weighted-average interest rate for 2009 was 7.35% and was 7.23% as of December 31, 2009.
The Second Lien term loan matures on December 15, 2014. A lump sum principal loan repayment is due on the maturity date only after all outstanding First Lien borrowings are repaid in full.
As of December 31, 2010, the Company was in compliance with all of its covenants and other obligations under the credit Agreements.
101
STR Holdings, Inc. and Subsidiaries
NOTES TO CONSOLIDATED FINANCIAL STATEMENTS (Continued)
(All amounts in thousands except per share / unit amounts unless otherwise noted)
NOTE 8—DEBT (Continued)
Interest Rate Swap
Effective September 13, 2007, the Company entered into an interest rate swap contract for $200,000 notional principal amount of its variable rate debt. The notional principal amount decreased to $130,000 on October 1, 2008 and the contract expired on September 30, 2010. The Company was required under the terms of both First Lien and Second Lien Agreement to fix its interest costs on at least 50% of its funded indebtedness for a minimum of three years to economically hedge against a potential rise in interest rates. The interest rate swap was not designated by the Company as a cash flow hedge under ASC 815-10—Accounting for Derivative Instruments and Hedging Activities, as amended. As a result, changes in the fair value of the swap were recorded in the statement of operations. The fair value of the swap was a liability of $0 and $4,018 at December 31, 2010 and 2009, respectively. The resulting change in fair value has been recorded in the respective consolidated balance sheets and in the consolidated statements of operations and comprehensive income.
Other Debt
One of the Company's foreign subsidiaries maintains a line of credit in the amount of (CHF500) bearing an interest rate of approximately 4.25% as of December 31, 2010 and December 31, 2009. The purpose of the credit facility is to provide funding for the subsidiary's working capital as deemed necessary during the normal course of business. The facility was not used as of December 31, 2010 and December 31, 2009.
Principal repayments of long-term debt as of December 31, 2010 are as follows:
2011 |
$ | 1,850 | ||
2012 |
1,850 | |||
2013 |
1,850 | |||
2014 |
232,975 | |||
Total |
$ | 238,525 | ||
No mandatory payment is required until June 30, 2011 due to the $15.0 million payment made in conjunction with the IPO. However, the Company plans to continue to make such debt payments based on the original required maturity schedule as shown above.
The fair value of the Company's debt was approximately $220,400 and $208,700, determined by its mid-market bid/ask price as of December 31, 2010 and December 31, 2009, respectively.
102
STR Holdings, Inc. and Subsidiaries
NOTES TO CONSOLIDATED FINANCIAL STATEMENTS (Continued)
(All amounts in thousands except per share / unit amounts unless otherwise noted)
NOTE 9—LEASES
The Company leased certain machinery and equipment under capital leases which expired during 2010. Capital lease assets and related accumulated depreciation, which were recorded as part of property, plant and equipment, are as follows:
| |
December 31, 2010 |
December 31, 2009 |
|||||
|---|---|---|---|---|---|---|---|
Capital lease assets |
$ | 556 | $ | 556 | |||
Accumulated depreciation |
(556 | ) | (267 | ) | |||
Net capital lease assets |
$ | — | $ | 289 | |||
Depreciation expense on capital lease assets was $289 for the year ended December 31, 2010 and $105 for each of the years ended December 31, 2009 and December 31, 2008.
The Company leases various production and QA laboratories and office space under non-cancelable operating leases. The leases require the Company to pay property taxes, common area maintenance and certain other costs in addition to base rent. The Company also leases vehicles and office equipment under operating leases. Future minimum payments under all non-cancelable operating leases were as follows as of December 31, 2010:
2011 |
$ | 3,274 | ||
2012 |
2,237 | |||
2013 |
1,519 | |||
2014 |
618 | |||
2015 |
526 | |||
Thereafter |
1,615 | |||
|
$ | 9,789 | ||
Rental expense on office space and equipment operating leases was $5,128, $4,933 and $4,220 for the years ended December 31, 2010, December 31, 2009 and December 31, 2008, respectively.
NOTE 10—STOCKHOLDERS' / UNITHOLDERS' EQUITY
Preferred Stock
The Company's Board of Directors has authorized 20,000,000 shares of preferred stock, $0.01 par value, issuable in series. At December 31, 2010, there were no shares issued or outstanding.
Common Stock
The Company's Board of Directors has authorized 200,000,000 shares of common stock, $0.01 par value. At December 31, 2010 there were 41,458,478 shares of issued and outstanding common stock. Each share of common stock is entitled to one vote per share. Included in the 41,458,478 shares are 40,730,753 vested common shares and 727,725 restricted unvested common shares.
103
STR Holdings, Inc. and Subsidiaries
NOTES TO CONSOLIDATED FINANCIAL STATEMENTS (Continued)
(All amounts in thousands except per share / unit amounts unless otherwise noted)
NOTE 10—STOCKHOLDERS' / UNITHOLDERS' EQUITY (Continued)
Prior LLC Units
Prior to the Company's IPO, the equity structure consisted of LLC member units:
The Company had authorized a total of 17,864,924 Class A units, 199,766 Class B units, 1,487,750 Class C units, 530,016 Class D units, 530,016 Class E units, and 588,171 Class F units.
The Class A, B, C, D, E and F units were subject to a priority distribution in the event of a distribution, conversion to shares of common stock upon an IPO, liquidation, partial liquidation, or dissolution of STR Holdings (New) LLC in three steps: first, 100% to all Class A units until each such unitholder had received an aggregate amount equal to their capital contributions; second, pro rata to each Class A, B, C, D and F unit until each Class A unit had received 2.5 times its capital contributions; third, pro rata to each Class A, B, C, D, E and F unit based upon units held by each unitholder. Such distribution or liquidation may have been in the form of cash, securities or other consideration. Dividends, if any, on unvested units were subject to deferral and paid only upon vesting. Unvested units vested immediately upon a change of control.
Each Class A unit had voting rights. The Class B, C, D, E and F units had no voting rights.
Under certain circumstances, certain unitholders had the option to sell their units back to the Company at fair value. In addition, the Company had the right to repurchase vested units from a terminated employee at the greater of fair value, as determined by the Board of Managers, and the original purchase price paid to the Company if terminated without cause, or at the original purchase price paid to the Company, if terminated for cause. These contingent rights did not meet the criteria for the units to be "liability" classified under ASC 718-10 or as liabilities under ASC 480-10—Accounting for Certain Financial Instruments with Characteristics of Both Liabilities and Equity. However, they met the definition of redeemable equity securities to be classified as temporary equity in accordance with Rule 5-02.27 of SEC Regulation S-X.
In connection with the Company's IPO, all units were converted into shares of common stock.
The following table presents the number of shares of common stock and unvested restricted common stock issued for the respective units upon conversion. The number of shares of common stock and unvested restricted common stock issued was based upon the vesting provisions of the outstanding units and reflect the units vested and unvested at the date of conversion:
Class of Units
|
Shares of Common Stock |
Shares of Unvested Restricted Common Stock |
Total Shares of Common Stock |
||||||||
|---|---|---|---|---|---|---|---|---|---|---|---|
A units |
35,352,504 | 397,491 | 35,749,995 | ||||||||
B units |
195,053 | — | 195,053 | ||||||||
C units |
542,685 | 553,588 | 1,096,273 | ||||||||
D units |
176,211 | 217,884 | 394,095 | ||||||||
E units |
— | — | — | ||||||||
F units |
478,578 | 95,716 | 574,294 | ||||||||
Total |
36,745,031 | 1,264,679 | 38,009,710 | ||||||||
104
STR Holdings, Inc. and Subsidiaries
NOTES TO CONSOLIDATED FINANCIAL STATEMENTS (Continued)
(All amounts in thousands except per share / unit amounts unless otherwise noted)
NOTE 11—STOCK-BASED COMPENSATION
On November 6, 2009, the Company's Board of Directors approved the Company's 2009 Equity Incentive Plan (the "2009 Plan") which became effective on the same day. A total of 4,750,000 shares of common stock, subject to increase on an annual basis, are reserved for issuance under the 2009 Plan. The 2009 Plan is administered by the Board of Directors or any committee designated by the Board of Directors, which has the authority to designate participants and determine the number and type of awards to be granted, the time at which awards are exercisable, the method of payment and any other terms or conditions of the awards. The 2009 Plan provides for the grant of stock options, including incentive stock options and nonqualified stock options, collectively, "options," stock appreciation rights, shares of restricted stock, or "restricted stock," rights to dividend equivalents and other stock-based awards, collectively, the "awards." The Board of Directors or the committee will, with regard to each award, determine the terms and conditions of the award, including the number of shares subject to the award, the vesting terms of the award, and the purchase price for the award. Awards may be made in assumption of or in substitution for outstanding awards previously granted by the Company or its affiliates, or a company acquired by the Company or with which it combines. Options outstanding generally vest monthly over a four-year period and expire ten years from the date of grant.
During the fourth quarter of 2010, the Company issued 6,996 restricted stock awards of the Company's common stock at a fair value of $25.73 per award to certain members of the Company's Board of Directors under the 2009 Plan.
During the third quarter of 2010, the Company issued 71,000 options to purchase shares of the Company's common stock at an exercise price of $18.80 to various employees and issued 8,218 restricted stock awards of the Company's common stock at a fair value of $24.34 per award to certain members of the Company's Board of Directors under the 2009 Plan.
During the second quarter of 2010, the Company issued 185,000 options to purchase shares of the Company's common stock at exercise prices ranging from $22.60 to $23.06 to certain employees under the 2009 Plan.
On November 6, 2009, the Company issued 3,495,685 options to purchase shares of the Company's common stock at exercise prices ranging from $10.00 to $21.50 to certain employees and directors under the 2009 Plan. There were also 40,000 restricted shares issued on the same date to certain members of the Company's Board of Directors.
On November 30, 2010, the President of QA resigned effective December 31, 2010. As a result, the Company cancelled all 338,776 of the former President of QA's unvested options as of December 31, 2010. There were 1,281,877 shares available for grant under the 2009 Plan as of December 31, 2010.
105
STR Holdings, Inc. and Subsidiaries
NOTES TO CONSOLIDATED FINANCIAL STATEMENTS (Continued)
(All amounts in thousands except per share / unit amounts unless otherwise noted)
NOTE 11—STOCK-BASED COMPENSATION (Continued)
In connection with the 256,000 options granted during the year ended December 31, 2010, there are varying service terms. Following is a summary of the characteristics of each of these options:
| Shares | Service Condition | ||
|---|---|---|---|
| 60,000 | Vests ratably in 48 equal monthly installments as of the last day of each month beginning May 31, 2010. | ||
| 125,000 | Vests ratably in 48 equal monthly installments as of the last day of each month beginning June 30, 2010. | ||
| 71,000 | Vests ratably in 16 equal quarterly installments as of the last day of each calendar quarter beginning September 30, 2010. | ||
| 256,000 | |||
The fair value of the stock options issued were determined using the Black-Scholes option pricing model. The Company's assumptions about stock-price volatility have been based exclusively on the implied volatilities of other publicly traded options to buy stock with contractual terms closest to the expected life of options granted to the Company's employees. The expected term represents the estimated time until employee exercise is estimated to occur taking into account vesting schedules and using the Hull-White model. The risk-free interest rate for periods within the contractual life of the award is based on the U.S. Treasury 10 year zero-coupon strip yield in effect at the time of grant. The expected dividend yield was based on the assumption that no dividends are expected to be distributed in the near future.
The following table presents the assumptions used to estimate the fair values of the stock options granted during the periods presented below:
| |
2010 | 2009 | ||
|---|---|---|---|---|
Risk-free interest rate |
2.38% | 1.96% | ||
Expected volatility |
57.9% | 61.6% | ||
Expected life (in years) |
4.9 to 5.0 | 2.7 to 4.9 | ||
Dividend yield |
— | — | ||
Weighted-average estimated fair value of options granted during the period |
$11.06 | $4.59 |
106
STR Holdings, Inc. and Subsidiaries
NOTES TO CONSOLIDATED FINANCIAL STATEMENTS (Continued)
(All amounts in thousands except per share / unit amounts unless otherwise noted)
NOTE 11—STOCK-BASED COMPENSATION (Continued)
The following table summarizes the stock option activity under the Company's 2009 Plan from the date of the Company's IPO through the year ended December 31, 2010:
| |
Options Outstanding | |||||||||||||||||
|---|---|---|---|---|---|---|---|---|---|---|---|---|---|---|---|---|---|---|
| |
Number of Shares |
Weighted- Average Exercise Price |
Weighted- Average Remaining Contractual Term (in years) |
Weighted- Average Grant-Date Fair Value |
Aggregate Intrinsic Value(1) |
|||||||||||||
Balance at November 6, 2009 |
— | $ | — | |||||||||||||||
Options granted |
3,495,685 | 10.65 | ||||||||||||||||
Exercised |
— | — | ||||||||||||||||
Canceled/forfeited |
— | — | ||||||||||||||||
Balance at December 31, 2009 |
3,495,685 | $ | 10.65 | $ | 4.59 | $ | 32,685 | |||||||||||
Options granted |
256,000 | 21.77 | ||||||||||||||||
Exercised |
(93,554 | ) | 10.16 | $ | 921 | |||||||||||||
Canceled/forfeited |
(338,776 | ) | 10.00 | |||||||||||||||
Balance at December 31, 2010 |
3,319,355 | $ | 11.59 | 8.76 | $ | 5.02 | $ | 27,916 | ||||||||||
Vested and exercisable as of December 31, 2010 |
2,249,379 | $ | 10.87 | 8.67 | $ | 4.57 | $ | 20,537 | ||||||||||
Vested and exercisable as of December 31, 2010 and expected to vest thereafter |
3,319,355 | $ | 11.59 | 8.76 | $ | 5.02 | $ | 27,916 | ||||||||||
- (1)
- The aggregate intrinsic value is calculated as the difference between the exercise price of the underlying awards and the closing stock price of $20.00 of the Company's common stock on December 31, 2010.
During 2010, the total intrinsic value of options exercised (i.e., the difference between the market price on the date of exercise and the price paid by the employee to exercise the options) was $862. There were no option exercises during 2009.
As of December 31, 2010, there was $6,002 of unrecognized compensation cost related to outstanding stock option awards. This amount is expected to be recognized over a weighted-average remaining vesting period of 2.7 years. To the extent the actual forfeiture rate is different from what the Company has anticipated, stock-based compensation related to these awards will be different from its expectations. The Company received proceeds of $950 related to the exercise of stock options for the year ended December 31, 2010.
107
STR Holdings, Inc. and Subsidiaries
NOTES TO CONSOLIDATED FINANCIAL STATEMENTS (Continued)
(All amounts in thousands except per share / unit amounts unless otherwise noted)
NOTE 11—STOCK-BASED COMPENSATION (Continued)
The following table summarizes the restricted shares activity from the date of the Company's IPO through the year ended December 31, 2010:
| |
Unvested Restricted Shares |
|||||||
|---|---|---|---|---|---|---|---|---|
| |
Number of Shares |
Weighted-Average Grant-Date Fair Value |
||||||
Unvested at November 6, 2009 |
1,264,679 | $ | 10.00 | |||||
Granted |
40,000 | 10.00 | ||||||
Vested |
(121,366 | ) | 10.00 | |||||
Canceled |
— | |||||||
Unvested at December 31, 2009 |
1,183,313 | $ | 10.00 | |||||
Granted |
15,214 | 24.98 | ||||||
Vested |
(470,802 | ) | 10.00 | |||||
Canceled |
— | |||||||
Unvested at December 31, 2010 |
727,725 | $ | 10.32 | |||||
Expected to vest after December 31, 2010 |
727,725 | $ | 10.32 | |||||
As of December 31, 2010, there was $4,314 of unrecognized compensation cost related to unvested restricted shares. This amount is expected to be recognized over a weighted-average remaining vesting period of 2.5 years. To the extent the actual forfeiture rate is different from what the Company has anticipated, stock-based compensation related to these awards will be different from its expectations.
Stock-based compensation expense was included in the following consolidated statement of operations and comprehensive income categories:
| |
Years Ended December 31, | |||||||||
|---|---|---|---|---|---|---|---|---|---|---|
| |
2010 | 2009 | 2008 | |||||||
Selling, general and administrative expense |
$ | 7,851 | $ | 7,308 | $ | 1,752 | ||||
Total recognized tax benefit |
$ | 313 | $ | — | $ | — | ||||
LLC Units Prior to Initial Public Offering
In connection with and subsequent to the DLJ Transactions, Class B, Class C, Class D, Class E and Class F incentive units were issued to employees and certain non-employee investors, each class of
108
STR Holdings, Inc. and Subsidiaries
NOTES TO CONSOLIDATED FINANCIAL STATEMENTS (Continued)
(All amounts in thousands except per share / unit amounts unless otherwise noted)
NOTE 11—STOCK-BASED COMPENSATION (Continued)
which had varying service and/or performance conditions. The following is a summary of the characteristics of each class of units:
Unit
|
Service/Performance Condition | |
|---|---|---|
| Class B | Vested immediately upon issuance. | |
Class C |
Vested ratably at month end in 1/60th installments beginning the month following the date of issuance. |
|
Class D |
Vested ratably in 1/5th annual installments beginning with the year ending on December 31, 2007 if the equity value performance target, as provided in the LLC agreement, was achieved. Equity value performance targets were based on a multiple of management's projections of consolidated EBITDA for such fiscal year, less estimated net indebtedness. Performance targets were met if the Company's actual equity valuation is 85% or greater of the target equity value. |
|
Class E |
Vested ratably at month end in 1/60th installments beginning the month following the date of issuance. |
|
Class F |
Vested 50% immediately upon issuance and the remaining 50% vests one-third each year on the first, second and third anniversary of issuance. |
During the year ended December 31, 2008, 11,666 Class C, 4,167 Class D, and 4,167 Class E units were awarded.
Valuation Assumptions: The fair value of the units granted in 2008 was determined contemporaneously with the grant. In order to determine the fair value of the 2008 grants, the Company determined the enterprise value of the Company based on the discounted cash flow and the prior transaction methods. The discounted cash flow method determined the present value of the Company's projected future free cash flow. The prior transaction method utilized the value at the time of the DLJ Transactions and applied implied multiples to various financial metrics, including revenue, earnings before interest and taxes and Adjusted EBITDA and applied the multiples to the Company's results of operations for the more recent periods. The equity value was calculated based on a weighted-average of the enterprise values ascribed by each method minus the total amount of debt on the relevant date. The Company then applied a Black-Scholes option-pricing model that used the assumptions noted in the following table, along with the associated weighted-average fair values attributable to each class of incentive units. Historical data was used to estimate pre-vesting forfeitures. To the extent actual results of forfeitures differed from the estimates, such amounts were recorded as an adjustment in the period the estimates were revised. The expected volatilities were based on a peer group of companies, as the Company was a non-public entity at the time of the valuation. The risk-free rate was based on the U.S. Treasury yield curve in effect at the time of grant for periods corresponding with the expected term of the units. The expected term represented the estimated time until a liquidity event.
109
STR Holdings, Inc. and Subsidiaries
NOTES TO CONSOLIDATED FINANCIAL STATEMENTS (Continued)
(All amounts in thousands except per share / unit amounts unless otherwise noted)
NOTE 11—STOCK-BASED COMPENSATION (Continued)
The most likely liquidity event was an IPO in which units would be exchanged for restricted stock. The expected dividend yield was based on the assumption that no dividends were expected to be distributed in the near future.
| |
March 2008 | ||
|---|---|---|---|
Volatility |
60.0% | ||
Risk-free interest rates |
1.71% | ||
Expected term |
2.2 Years | ||
Dividend yield |
0.00% | ||
Weighted-average grant-date fair value: |
|||
Service-based |
$7.26 | ||
Performance-based |
$8.16 | ||
There was no contractual term or expiration date for the Class B, C, D, E and F units that were issued.
A summary of unit activity for the year ended December 31, 2008 and the period from January 1, 2009 through November 6, 2009 is presented below:
Service-Based Awards
| |
Class B Units |
Class C Units |
Class E Units |
Class F Units |
Total Units |
Weighted- Average Grant-Date Fair Value |
|||||||||||||
|---|---|---|---|---|---|---|---|---|---|---|---|---|---|---|---|---|---|---|---|
Unvested as of January 1, 2008 |
— | 1,150,248 | 409,619 | 294,085 | 1,853,952 | $ | 2.76 | ||||||||||||
Granted |
— | 11,666 | 4,167 | — | 15,833 | $ | 7.26 | ||||||||||||
Vested |
— | (255,143 | ) | (90,867 | ) | (98,029 | ) | (444,039 | ) | $ | 2.81 | ||||||||
Forfeited |
— | — | — | — | — | ||||||||||||||
Unvested as of December 31, 2008 |
— | 906,771 | 322,919 | 196,056 | 1,425,746 | $ | 2.80 | ||||||||||||
Granted |
— | — | — | — | — | ||||||||||||||
Vested |
— | (187,612 | ) | (66,775 | ) | (98,028 | ) | (352,415 | ) | $ | 2.86 | ||||||||
Forfeited |
— | (144,239 | ) | (51,515 | ) | — | (195,754 | ) | $ | 2.67 | |||||||||
Unvested as of November 6, 2009 |
— | 574,920 | 204,629 | 98,028 | 877,577 | $ | 2.79 | ||||||||||||
110
STR Holdings, Inc. and Subsidiaries
NOTES TO CONSOLIDATED FINANCIAL STATEMENTS (Continued)
(All amounts in thousands except per share / unit amounts unless otherwise noted)
NOTE 11—STOCK-BASED COMPENSATION (Continued)
Performance-Based Awards
| |
Class D Units | Weighted-Average Grant-Date Fair Value | |||||
|---|---|---|---|---|---|---|---|
Unvested as of December 31, 2007 |
360,950 | $ | 3.22 | ||||
Granted |
4,167 | $ | 8.16 | ||||
Vested |
(91,076 | ) | $ | 3.27 | |||
Forfeited |
— | ||||||
Unvested as of December 31, 2008 |
274,041 | $ | 3.28 | ||||
Granted |
— | ||||||
Vested |
— | ||||||
Forfeited |
(47,552 | ) | $ | 3.22 | |||
Unvested as of November 6, 2009 |
226,489 | $ | 3.29 | ||||
NOTE 12—INCOME TAXES
Income before income tax expense is as follows:
| |
Year Ended December 31, 2010 |
Year Ended December 31, 2009 |
Year Ended December 31, 2008 |
||||||||
|---|---|---|---|---|---|---|---|---|---|---|---|
Domestic |
$ | 44,383 | $ | 12,126 | $ | 11,444 | |||||
Foreign |
29,454 | 20,905 | 34,531 | ||||||||
Total |
$ | 73,837 | $ | 33,031 | $ | 45,975 | |||||
The provision for income taxes (benefit) consists of the following components:
| |
Year Ended December 31, 2010 |
Year Ended December 31, 2009 |
Year Ended December 31, 2008 |
|||||||||
|---|---|---|---|---|---|---|---|---|---|---|---|---|
Current tax expense |
||||||||||||
U.S. federal |
$ | 14,539 | $ | 4,338 | $ | 10,515 | ||||||
Foreign |
12,024 | 6,916 | 10,895 | |||||||||
State and local |
1,359 | 560 | 852 | |||||||||
Total current tax expense |
27,922 | 11,814 | 22,262 | |||||||||
Deferred (benefit) tax expense: |
||||||||||||
U.S. federal |
(1,623 | ) | (1,308 | ) | (6,562 | ) | ||||||
Foreign |
(938 | ) | 406 | 376 | ||||||||
State and local |
(835 | ) | (870 | ) | 1,794 | |||||||
Total deferred tax benefit |
(3,396 | ) | (1,772 | ) | (4,392 | ) | ||||||
Total income tax expense |
$ | 24,526 | $ | 10,042 | $ | 17,870 | ||||||
111
STR Holdings, Inc. and Subsidiaries
NOTES TO CONSOLIDATED FINANCIAL STATEMENTS (Continued)
(All amounts in thousands except per share / unit amounts unless otherwise noted)
NOTE 12—INCOME TAXES (Continued)
Tax benefits of $142, $0 and $0 for the years ended December 31, 2010, 2009 and 2008, respectively, associated with the exercise of stock options were recorded to additional paid-in capital. Tax benefits associated with the "Windfall" for stock options exercised are determined on a "with and without" basis.
A deferred tax benefit of $191, a tax expense of $572 and a tax benefit of $972 relating to the cumulative translation adjustment of the Company's foreign subsidiaries financial statements is recorded in other comprehensive income for the years ended December 31, 2010, 2009 and 2008, respectively.
During the years ended December 31, 2010 and 2009, the Company recorded adjustments to income tax and deferred income taxes related to a change in state taxable income apportionment percents. Amounts recorded in 2010 and 2009 were to recognize a state deferred income tax benefit of $691 and $745, respectively.
During the year ended December 31, 2008, the Company recorded adjustments to income tax expense and deferred income taxes related to the DLJ Transactions. Amounts recorded in 2008 were to recognize an income tax expense and deferred tax liability of $1,880 for Connecticut state income taxes and an income tax benefit and deferred tax asset of $735 for deferred compensation.
Following is a reconciliation of the Company's effective income tax rate to the United States federal statutory tax rate:
| |
Year Ended December 31, 2010 |
Year Ended December 31, 2009 |
Year Ended December 31, 2008 |
|||||||
|---|---|---|---|---|---|---|---|---|---|---|
Expected tax at U.S. statutory income tax rate |
35.0 | % | 35.0 | % | 35.0 | % | ||||
U.S. state and local income taxes—net of federal income tax effect |
0.1 | % | (1.5 | )% | 3.7 | % | ||||
Foreign rate differential |
(4.7 | )% | (5.0 | )% | (5.7 | )% | ||||
Foreign unremitted earnings |
4.0 | % | 5.0 | % | 5.7 | % | ||||
Non-deductible fees and expenses |
1.4 | % | 2.1 | % | 2.3 | % | ||||
Unrecognized tax benefits |
0.4 | % | (1.5 | )% | 1.1 | % | ||||
Other |
(3.0 | )% | (3.7 | )% | (3.2 | )% | ||||
Effective tax rate |
33.2 | % | 30.4 | % | 38.9 | % | ||||
112
STR Holdings, Inc. and Subsidiaries
NOTES TO CONSOLIDATED FINANCIAL STATEMENTS (Continued)
(All amounts in thousands except per share / unit amounts unless otherwise noted)
NOTE 12—INCOME TAXES (Continued)
The effect of temporary differences is included in deferred tax accounts as follows:
| |
December 31, 2010 | December 31, 2009 | |||||||||
|---|---|---|---|---|---|---|---|---|---|---|---|
Deferred tax assets: |
|||||||||||
Current deferred tax assets: |
|||||||||||
Accrued bonuses |
$ | 817 | $ | 315 | |||||||
Accrued vacation |
29 | 41 | |||||||||
Bad debt reserves |
214 | 568 | |||||||||
Inventories |
491 | 341 | |||||||||
Product performance accrual |
1,448 | 1,616 | |||||||||
Foreign deferred tax assets |
133 | — | |||||||||
Other current deferred tax assets |
75 | 106 | |||||||||
Total current deferred tax assets |
$ | 3,207 | $ | 2,987 | |||||||
Long-term deferred tax assets: |
|||||||||||
Deferred compensation |
$ | 721 | $ | 728 | |||||||
Interest rate swap |
— | 1,465 | |||||||||
Foreign tax credits |
1,392 | 1,302 | |||||||||
State tax loss and credit carry forwards |
23 | 23 | |||||||||
Non-Qualified stock option compensation |
3,111 | 1,696 | |||||||||
Other long-term deferred tax assets |
35 | 26 | |||||||||
Total long-term deferred tax assets |
$ | 5,282 | $ | 5,240 | |||||||
Total deferred tax assets |
$ | 8,489 | $ | 8,227 | |||||||
Deferred tax liabilities: |
|||||||||||
Fixed assets |
(4,838 | ) | (4,754 | ) | |||||||
Intangible assets |
(73,899 | ) | (78,801 | ) | |||||||
Foreign unremitted earnings |
(9,540 | ) | (6,842 | ) | |||||||
Earnings from equity owned entities |
(337 | ) | (279 | ) | |||||||
Restricted stock compensation |
(1,021 | ) | (1,481 | ) | |||||||
Foreign deferred tax liabilities |
— | (805 | ) | ||||||||
Total deferred tax liabilities |
(89,635 | ) | (92,962 | ) | |||||||
Total net deferred tax liabilities |
$ | (81,146 | ) | $ | (84,735 | ) | |||||
The Company recognizes interest accrued related to its liability for unrecognized tax benefits and penalties in income tax expense. The Company recorded interest and penalties related to unrecognized tax benefits as a component of income tax expense in the amount of approximately $612, $476 and $534 for the years ended December 31, 2010, 2009 and 2008, respectively. The Company had approximately $1,955 and $1,492 for the payments of interest and penalties accrued at December 31, 2010 and December 31, 2009, respectively.
113
STR Holdings, Inc. and Subsidiaries
NOTES TO CONSOLIDATED FINANCIAL STATEMENTS (Continued)
(All amounts in thousands except per share / unit amounts unless otherwise noted)
NOTE 12—INCOME TAXES (Continued)
A reconciliation of the beginning and ending amount of the Company's liability for unrecognized tax benefits (excluding interest and penalties) is as follows:
Balance at January 1, 2008 |
$ | 1,341 | ||
Additions based on tax position related to the current year |
117 | |||
Reduction for tax position of prior years |
(200 | ) | ||
Balance at December 31, 2008 |
$ | 1,258 | ||
Additions for tax positions of prior years |
2,653 | |||
Reductions for tax positions of prior years |
(333 | ) | ||
Balance at December 31, 2009 |
$ | 3,578 | ||
Additions for tax positions of prior years |
201 | |||
Reductions for tax positions of prior years |
(84 | ) | ||
Balance at December 31, 2010 |
$ | 3,695 | ||
The amount of unrecognized tax benefit that would potentially impact the Company's effective tax rate was $2,543, $2,569 and $811 (excluding interest and penalties) as of December 31, 2010, 2009 and 2008, respectively.
The Company conducts its business globally and as a result, the Company and one or more of its subsidiaries file income tax returns in the U.S. federal jurisdiction and various state and foreign jurisdictions. The Company is subject to examination by taxing authorities in each of these jurisdictions.
The Company has open tax years from 2007-2010 for U.S. federal tax purposes. The Company has open tax years from 2005-2010 with various state tax jurisdictions. The Company has open tax years from 2000-2010 with various foreign tax jurisdictions. It is reasonably possible that a reduction of unrecognized tax benefits may occur within the next twelve months as a result of reductions of the uncertain tax positions. The Company estimates that unrecognized tax benefits, excluding interest and penalties, at December 31, 2010 could be reduced by approximately $376 for those years not under audit by taxing authorities.
In connection with the examination of the Company's tax returns, contingencies can arise that generally result from differing interpretations of applicable tax laws and regulations as they relate to the amount, timing or inclusion of revenues or expenses in taxable income, or the sustainability of tax credits to reduce income taxes payable. The Company believes it has sufficient accruals for its contingent tax liabilities. Annual tax provisions include amounts considered sufficient to pay assessments that may result from examination of prior year tax returns, although actual results may differ. The Company is currently under applicable tax authority audits for 2007 and 2008 in the U.S. and 2006, 2007 and 2008 in Spain.
As a result of the DLJ Transaction on June 15, 2007, the Company provided deferred taxes for the presumed repatriation of foreign earnings due to increased cash flow needs in the United States. No U.S. taxes need to be provided for the undistributed earnings of a foreign subsidiary if the Company can assert that such earnings are planned to be reinvested indefinitely outside of the United States. The Company periodically assesses its business operations and the cash flow needs of its foreign and
114
STR Holdings, Inc. and Subsidiaries
NOTES TO CONSOLIDATED FINANCIAL STATEMENTS (Continued)
(All amounts in thousands except per share / unit amounts unless otherwise noted)
NOTE 12—INCOME TAXES (Continued)
domestic subsidiaries to determine if the earnings of any of its foreign subsidiaries will be indefinitely reinvested outside the United States. The Company determined the undistributed earnings of the Company's Malaysian subsidiary will be indefinitely reinvested outside of the United States. As such, no U.S. federal and state income taxes have been provided thereon. The Company is currently pursuing an Asia growth strategy that will include capacity expansion in the region and such expansion will be funded by its Malaysian subsidiary. Upon distribution of those earnings or repatriation of cash in the form of dividends or otherwise, the Company would be subject to both U.S. income taxes (subject to an adjustment for foreign tax credits) and withholding taxes payable to the various foreign countries. As of December 31, 2010, the Company continues to provide deferred taxes on all of its undistributed foreign earnings, except for Malaysia.
The Company's state tax loss (tax-effected) and credit carryforwards total approximately $300, which if not utilized, will expire at various times through 2023.
NOTE 13—EMPLOYEE BENEFIT PLANS
The Company maintains two defined contribution benefit plans covering substantially all U.S. domestic employees. The Company makes matching contributions to the plans and can also make discretionary contributions to the plans. The Company's expense under these plans was $951, $872 and $823 for the years ended December 31, 2010, 2009 and 2008, respectively.
The Company also maintains defined contribution benefit plans for certain foreign employees. The expense under these plans was $909, $1,111 and $983 for the years ended December 31, 2010, 2009 and 2008, respectively.
NOTE 14—FAIR VALUE MEASUREMENTS
The following table provides the Company's financial assets and liabilities reported at fair value and measured on a recurring basis as of December 31, 2010 and December 31, 2009:
Description
|
Total | Quoted Prices in Active Market for Identical Assets (Level 1) |
Significant Other Observable Inputs (Level 2) |
Significant Unobservable Inputs (Level 3) |
|||||||||
|---|---|---|---|---|---|---|---|---|---|---|---|---|---|
Interest rate swap liability at December 31, 2009 |
$ | 4,018 | $ | — | $ | 4,018 | $ | — | |||||
Unrealized gain included in net income |
(4,018 | ) | — | (4,018 | ) | — | |||||||
Interest rate swap liability at December 31, 2010 |
$ | — | $ | — | $ | — | $ | — | |||||
The fair value for the Company's interest rate swap was valued using observable current market information as of the reporting date.
115
STR Holdings, Inc. and Subsidiaries
NOTES TO CONSOLIDATED FINANCIAL STATEMENTS (Continued)
(All amounts in thousands except per share / unit amounts unless otherwise noted)
NOTE 15—COMMITMENTS AND CONTINGENCIES
The Company is a party to claims and litigation in the normal course of its operations. Management believes that the ultimate outcome of these matters will not have a material adverse effect on the Company's financial position, results of operations, or cash flows.
The Company typically does not provide contractual warranties on its products. However, on limited occasions, the Company incurs costs to service its products in connection with specific product performance matters. Prior to 2008, the Company did not experience any material product performance matters. The Company has accrued for specific product performance matters incurred in 2010 and 2009 that are probable and estimable based on its best estimate of ultimate expenditures that it may incur for such items. The following table summarizes the Company's product performance liability that is recorded in accrued liabilities in the consolidated balance sheets:
| |
December 31, 2010 |
December 31, 2009 |
|||||
|---|---|---|---|---|---|---|---|
Balance as of beginning of period |
$ | 4,210 | $ | 4,736 | |||
Additions |
1,123 | 572 | |||||
Reductions |
(1,224 | ) | (1,098 | ) | |||
Balance as of end of period |
$ | 4,109 | $ | 4,210 | |||
The majority of this accrual relates to a quality claim by one of the Company's customers in connection with a non-encapsulant product that the Company purchased from a vendor in 2005 and 2006 and resold. The Company stopped selling this product in 2006 and is currently attempting to resolve this matter.
During 2010, the Company performed a Phase II environmental site assessment at its 10 Water Street, Enfield, Connecticut location. During its investigation, the site was found to contain a presence of volatile organic compounds. The Company has been in contact with the Department of Environmental Protection and has engaged a license contractor to remediate this situation. The estimated cost the Company expects to pay to remediate the current contamination is approximately $100. Accordingly, the Company has accounted for this under ASC 450—Contingencies as of December 31, 2010.
116
STR Holdings, Inc. and Subsidiaries
NOTES TO CONSOLIDATED FINANCIAL STATEMENTS (Continued)
(All amounts in thousands except per share / unit amounts unless otherwise noted)
NOTE 15—COMMITMENTS AND CONTINGENCIES (Continued)
As previously disclosed, in October 2007, the Company filed a complaint against James P. Galica ("Galica") and JPS Elastomerics Corp. ("JPS") in the Massachusetts Superior Court in Hampshire County (the "Court"). The Company alleged that the defendants misappropriated trade secrets and violated the Massachusetts Unfair and Deceptive Trade Practices Act as well as breaches of contract, the implied covenant of good faith and fair dealing, and fiduciary duty against Galica (the "State Court Action"). The Court determined that JPS and Galica had violated the Massachusetts Unfair and Deceptive Trade Practices Act, finding that the technology for the Company's polymeric sheeting product is a trade secret and that JPS and Galica had misappropriated its trade secrets. On January 27, 2011, the Court awarded the Company the right to recover from the defendants (i) actual monetary damages of $1,076, (ii) punitive damages of $2,151, (iii) reasonable attorneys fees of $3,903, (iv) reasonable costs of $1,109, and (v) 12% interest on each of the monetary awards from the date of the judgment (except for the actual monetary damages which accrues interest from October 2, 2007, the date the complaint was entered). In addition, the Court imposed a five year production injunction against producing low shrink EVA encapsulant, and a permanent use injunction against the defendants using the Company's trade secrets. On January 28, 2011, the defendants filed a motion seeking to stay certain elements of the injunction which was denied by the Court on February 8, 2011. The defendants filed a motion appealing the Court's denial of its motion as well as a notice of appeal with respect to the Court's order in favor of the Company. On February 28, 2011, the Massachusetts Appeals Court denied JPS's appeal of the lower court's denial of the request for a stay. On March 4, 2011, the defendants filed a petition to stay or modify the injunction pending appeal with the Massachusetts Supreme Judicial Court as well as an emergency motion for an immediate stay pending full briefing and hearing of the petition. The Supreme Judicial Court denied the defendants' emergency motion on March 7, 2011. To date, the Supreme Judicial Court has not taken action on the defendants' petition.
On September 17, 2010, JPS filed an amended complaint against the Company's wholly-owned subsidiary, Specialized Technology Resources, Inc. ("STR"), in the U.S. District Court for the District of Massachusetts. The amended complaint alleged various antitrust and unfair competition claims and that the State Court Action (described above) was sham litigation initiated by STR in an attempt to monopolize the domestic and international market for low-shrink EVA encapsulants. JPS also alleged other schemes to monopolize and unfair competition in violation of federal and state laws. JPS sought $60,000 in compensatory damages, treble damages, a permanent injunction against STR for various activities, reimbursement of legal fees for the State Court Action as well as for this matter, and disgorgement of proceeds obtained by STR from allegedly anti-competitive and tortious acts. On October 13, 2010, STR filed a motion to dismiss the amended complaint, and on January 5, 2011 the Court held a hearing on STR's motion to dismiss. At the hearing, the Court ruled in favor of STR and dismissed the case. On January 14, 2011, the Court issued its written opinion dismissing the case and on January 24, 2011 STR filed a motion for Rule 11 sanctions against the defendants and their counsel. On February 10, 2011, JPS filed a notice of appeal with the Appellate Court. The First Circuit Court of Appeals has scheduled a settlement conference and set a briefing schedule in this matter. The settlement conference is set for April 14, 2011. JPS' brief is due on April 18, 2011 and STR's brief will be due thirty days after JPS serves its brief. The Company intends to continue to vigorously defend this action which it considers meritless and to pursue its motion for Rule 11 sanctions against JPS and its counsel.
117
STR Holdings, Inc. and Subsidiaries
NOTES TO CONSOLIDATED FINANCIAL STATEMENTS (Continued)
(All amounts in thousands except per share / unit amounts unless otherwise noted)
NOTE 15—COMMITMENTS AND CONTINGENCIES (Continued)
The Company does not intend to record any gain related to the state court judgment until the settlement cash proceeds are received by the Company.
NOTE 16—RELATED PARTIES
Certain of the Company's shareholders with aggregate interests of 15,471,945 in shares are affiliated with the Company's First and Second Lien term loan administrative agent and one of its lenders. The Company had entered into an interest rate swap agreement with this lender (See Note 8). One of these shareholders had an advisory services agreement until November 12, 2009, with the Company that provided for the payment of $423 in annual advisory fees. This shareholder had the right to appoint five of the seven Board members of the Company.
Two of the Company's Board members had an advisory services agreement until November 12, 2009, with the Company that provided for the payment of $1,400 in fees related to the DLJ Transactions in 2007 and provided for $150 in annual advisory fees. In 2007, these two Board members were also awarded a total of 517,510 of equivalent shares in connection with the DLJ Transactions.
A former Board member and shareholder with 1,068,771 shares had an advisory services agreement until November 12, 2009 with the Company, which was terminated in September 2008 and provided for the payment of $164 in fees related to the DLJ Transactions and annual advisory services fees of $36. This former Board member was also awarded 27,126 of equivalent shares in connection with the DLJ Transactions.
On November 12, 2009, the Company closed its IPO and paid $2,600 to terminate all of the annual advisory services and monitoring agreements that it had entered into in connection with the DLJ Transactions.
Total expense under these advisory services agreements was $0, $3,224 and $638 for the years ended December 31, 2010, 2009 and 2008, respectively.
NOTE 17—REPORTABLE SEGMENTS AND GEOGRAPHICAL INFORMATION
ASC 280-10-50—Disclosure about Segments of an Enterprise and Related Information, establishes standards for the manner in which companies report information about operating segments, products, services, geographic areas and major customers. The method of determining what information to report is based on the way that management organizes the operating segments within the enterprise for making operating decisions and assessing financial performance. Based on the nature of its products and services, the Company has two reporting segments: Solar and Quality Assurance. Information as to each of these operations is set forth below.
The accounting policies of the Company's business segments are the same as those described in the summary of significant accounting policies included elsewhere herein.
Adjusted EBITDA is the main metric used by the management team and the board of directors to plan, forecast and review the Company's segment business performance. Adjusted EBITDA represents net income before interest income and expense, income tax expense, depreciation, amortization, stock-based compensation expense, transaction fees, earnings on equity investments and certain non-recurring income and expenses from the results of operations.
118
STR Holdings, Inc. and Subsidiaries
NOTES TO CONSOLIDATED FINANCIAL STATEMENTS (Continued)
(All amounts in thousands except per share / unit amounts unless otherwise noted)
NOTE 17—REPORTABLE SEGMENTS AND GEOGRAPHICAL INFORMATION (Continued)
The following table sets forth information about the Company's operations by its two reportable segments and by geographic area:
Operations by Reportable Segment
| |
Year Ended December 31, 2010 |
Year Ended December 31, 2009 |
Year Ended December 31, 2008 |
|||||||
|---|---|---|---|---|---|---|---|---|---|---|
Segment Adjusted EBITDA |
||||||||||
Solar |
$ | 114,197 | $ | 67,253 | $ | 83,042 | ||||
Quality Assurance |
15,022 | 22,857 | 17,586 | |||||||
Segment Adjusted EBITDA |
$ | 129,219 | $ | 90,110 | $ | 100,628 | ||||
| |
Year Ended December 31, 2010 |
Year Ended December 31, 2009 |
Year Ended December 31, 2008 |
|||||||
|---|---|---|---|---|---|---|---|---|---|---|
Reconciliation of Adjusted EBITDA to Net Income |
||||||||||
Segment Adjusted EBITDA |
$ | 129,219 | $ | 90,110 | $ | 100,628 | ||||
Corporate Adjusted EBITDA |
(10,272 | ) | (8,479 | ) | (3,291 | ) | ||||
Adjusted EBITDA |
118,947 | 81,631 | 97,337 | |||||||
Depreciation and amortization |
(25,222 | ) | (23,381 | ) | (21,248 | ) | ||||
Interest income |
111 | 136 | 249 | |||||||
Interest expense |
(15,784 | ) | (17,068 | ) | (20,809 | ) | ||||
Income taxes |
(24,526 | ) | (10,042 | ) | (17,870 | ) | ||||
Management advisory fees |
— | (3,224 | ) | (638 | ) | |||||
Unrealized gain (loss) on interest rate swap |
4,018 | 1,995 | (3,025 | ) | ||||||
Stock-based compensation |
(7,851 | ) | (7,308 | ) | (1,752 | ) | ||||
(Loss) gain on disposal of property, plant and equipment |
(16 | ) | (67 | ) | 3 | |||||
Earnings on equity-method investments |
168 | 317 | 178 | |||||||
Non-recurring items |
— | — | (4,320 | ) | ||||||
Transaction fees |
(534 | ) | — | — | ||||||
Net Income |
$ | 49,311 | $ | 22,989 | $ | 28,105 | ||||
119
STR Holdings, Inc. and Subsidiaries
NOTES TO CONSOLIDATED FINANCIAL STATEMENTS (Continued)
(All amounts in thousands except per share / unit amounts unless otherwise noted)
NOTE 17—REPORTABLE SEGMENTS AND GEOGRAPHICAL INFORMATION (Continued)