Attached files
| file | filename |
|---|---|
| 8-K - Essex Rental Corp. | v166771_8k.htm |

Investor Presentation
November 2009
Essex Rental Corp
2
Important Notice
This document does not constitute an offer to sell or a solicitation of an offer to buy any securities. It is an outline of matters for discussion only.
Some of the statements in this presentation and other written and oral statements made from time to time by the Company and its representatives are “forward-looking statements” within the meaning of Section 27A of the Securities Act of 1933, as amended, and Section 21E of the Securities Exchange Act of 1934, as amended. These statements include statements regarding the intent and belief or current expectations of Essex and its management team and may be identified by the use of words like "anticipate", "believe", "estimate", "expect", "intend", "may", "plan", "will", "should", "seek", the negative of these terms or other comparable terminology. Investors are cautioned that any such forward-looking statements are not guarantees of future performance and involve risks and uncertainties, and that actual results may differ materially from those projected in the forward-looking statements. Important factors that could cause actual results to differ materially from Essex’s expectations include, without limitation, the continued ability of Essex to successfully execute its business plan, the possibility of a change in demand for the products and services that Essex provides (through its subsidiary, Essex Crane), intense competition which may require us to lower prices or offer more favorable terms of sale, our reliance on third party suppliers, our indebtedness which could limit our operational and financial flexibility, global economic factors including interest rates, general economic conditions, geopolitical events and regulatory changes, our dependence on our management team and key personnel, as well as other relevant risks detailed in our Annual Report on Form 10-K and subsequent periodic reports filed with the Securities and Exchange Commission and available on our website, www.essexcrane.com. The factors listed here are not exhaustive. Many of these uncertainties and risks are difficult to predict and beyond management’s control. Forward-looking statements are not guarantees of future performance, results or events. Essex assumes no obligation to update or supplement forward-looking information in this press release whether to reflect changed assumptions, the occurrence of unanticipated events or changes in future operating results or financial conditions, or otherwise.
This presentation contains unaudited non-GAAP financial measures, including Total EBITDA, and Rental EBITDA. Management believes that the presentation of these non-GAAP financial measures serves to enhance understanding of Essex’s individual operating and financial performance. These non-GAAP financial measures should be considered in addition to, but not as substitutes for, the most directly comparable U.S. GAAP measures. A reconciliation of Total EBITDA and Rental EBITDA to income from operations for the nine months ended September 30, 2009 can be found in Essex’s Current Report on Form 8-K filed with the Securities and Exchange Commission (the “SEC”) on November 4, 2009.
The historical 2004 financial information and data of Essex Crane contained in this presentation is unaudited and was prepared by Essex Crane as a private company prior to its acquisition by the Company, and may not conform to SEC regulation S-X.
We believe the non-Company information provided herein is reliable, as of the date hereof, but do not warrant its accuracy or completeness. In preparing these materials, we have relied upon and assumed, without independent verification, the accuracy and completeness of all information available from public sources. Except as required by law, the Company, Essex and their respective directors, officers, employees, agents and consultants make no representation or warranty as to the accuracy or completeness of the non-Company information contained in this document, and take no responsibility under any circumstances for any loss or damage suffered as a result of any omission, inadequacy, or inaccuracy in this document.
Neither the Company nor Essex Crane guarantees the performance or return of capital from investments.
©2009 Essex Rental Corp.
3
Definitions
OLV: Orderly Liquidation Value as assessed by independent specialist equipment appraisers in
September 2009
Replacement Value: The cost required to replicate the current aggregate lifting tonnage of Essex’s fleet
with crawlers being produced today
CAGR: Compound Annual Growth Rate
Rental EBITDA: Earnings Before Interest, Taxes, Depreciation and Amortization generated in the
ordinary course of business, which does not include sales of equipment
Total EBITDA: Rental EBITDA + gain on sale of equipment
Free Cash Flow (“FCF”): Rental EBITDA – Maintenance Capital Expenditure – Interest Expense –
Taxes – Net Crane Investment
Net Crane Investment: Equipment Purchases – Equipment Sales
Note: The historical 2004 financial information and data of Essex Crane contained in this presentation is unaudited and was prepared
by Essex Crane as a private company prior to its acquisition by the Company,
and may not conform to SEC regulation S-X.

| 4
Introduction
1
5
Introduction to Essex
Notes:
(1)
Source: International Crane and Specialized Transport, June 2009
(2)
As assessed by independent specialist equipment appraisers in September 2009
(3)
Essex management estimates
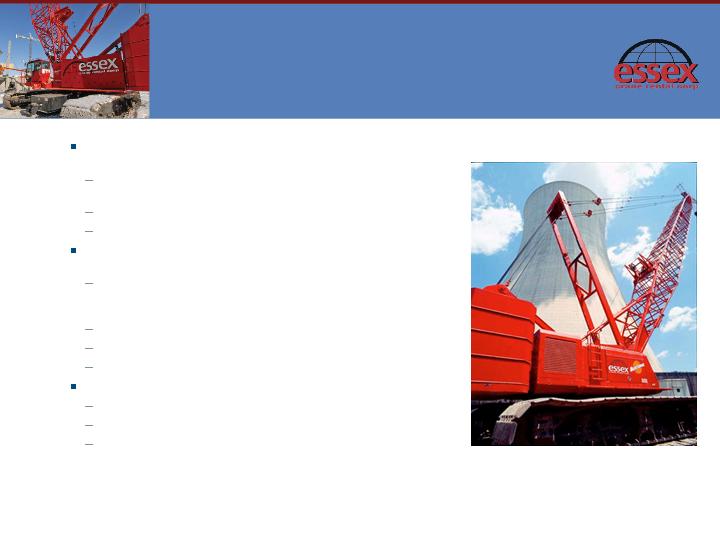
Essex owns one of the largest rental fleet of heavy lift crawler cranes in
North America(1)
>350 cranes and attachments, OLV and estimated Replacement Value
of > $260 million(2) and > $450 million(3) respectively
#1 North American “bare” crawler crane rental company(1)
50-year operating history
Majority of revenue is derived from infrastructure-related projects, which
Essex believes benefit from powerful secular trends
Bridge and road construction, power, water treatment, refineries,
alternative energy and other infrastructure-related projects comprise
majority of revenues
Historically, 40% of revenues generated from public works projects(3)
35% of revenues generated from repair and maintenance projects(3)
Exposure to residential and light commercial construction is minimal
Revenue generated from:
“Bare” (non-Essex operated) crane and attachment rental
Rental contracts are typically 6-18 months
Customers are responsible for most repair and maintenance during
lease, which minimizes Essex’s maintenance capital expenditures
6
Investment Highlights
Strong long-term secular trend
Attractive business characteristics
Over 90% of revenue generated from infrastructure and energy-related projects
Investment in infrastructure by government stimulus program is expected to be an indirect driver affecting
future crawler crane rates in the US
Product substitution risk is believed to be minimal
Market leader in heavy lift segment(1)
Well balanced target market (diversity of industries, customers served and geographic scope)
Fleet size and equipment mix provide competitive advantage
Simple business model – low operational risk and attractive margins
Low relative cost position versus Replacement Value or OLV
Assets have 30-50 year economic lives, limited technological obsolescence risk and require minimal
maintenance capital expenditures; proven history of maintaining market resale value
Notes:
(1)
Source: International Crane and Specialized Transport June 2009
Strong free cash flow and good return model
Strong free cash flow model
Excess cash flow will be used to pay down debt and to repurchase shares and warrants
Limited maintenance capital expenditures (estimated $2-3 million per year)
Return on capital versus return of capital economic model
7
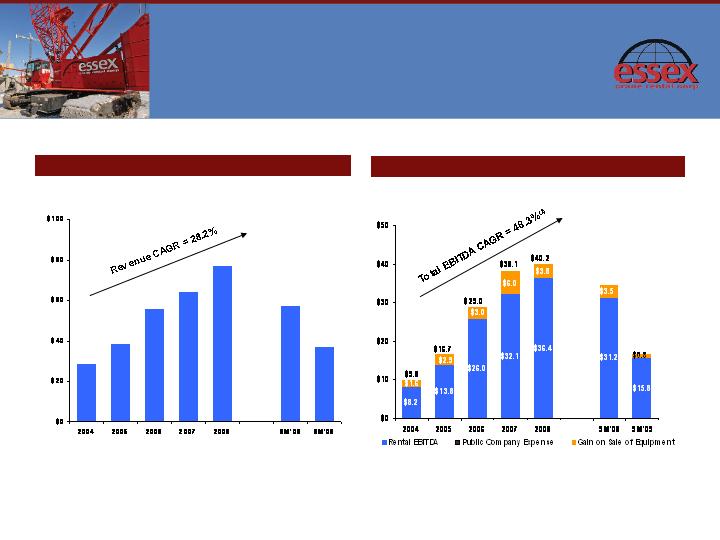
($ millions)
Rental Revenues(2)
Annual Summary Financial
Information
($ millions)
Total EBITDA
Notes:
1.
Source: Essex Crane and Essex audited (2005-2008) and unaudited (2004, 9M’08 and 9M’09) financials.
2.
Rental Revenue includes revenue from rentals, repairs & maintenance, and transportation services but excludes used rental equipment sales.
3.
2008 Total EBITDA of $40.2 million is after $2.2 million of public company expenses and one time expenses of $5.2 million associated with Essex Rental Corp’s
(formerly Hyde Park Acquisition Corp.) acquisition
of Essex Crane Rental Corp. and excludes the impact of the $23.9 million goodwill impairment charge recorded in
the fourth quarter of 2008.
4.
9M’09 Total EBITDA was reduced by $2.0 million of public company expenses.
5.
The historical 2004 financial information and data of Essex Crane contained in this presentation is unaudited and was prepared by Essex Crane as a private
company prior to its acquisition by the Company, and
may not conform to SEC regulation S-X.
$34.7
$16.6
(4)
(3)
$28.5
$38.6
$55.7
$64.5
$76.9
$57.5
$36.9
8
Return on Capital vs. Return of
Capital
Notes:
1.
Asset depreciation represents equipment market value depreciation
2.
Annual Depreciation % = (1 – Residual Value %) / Lifespan.
3.
Source: Oliver Wyman Essex Crane Assessment
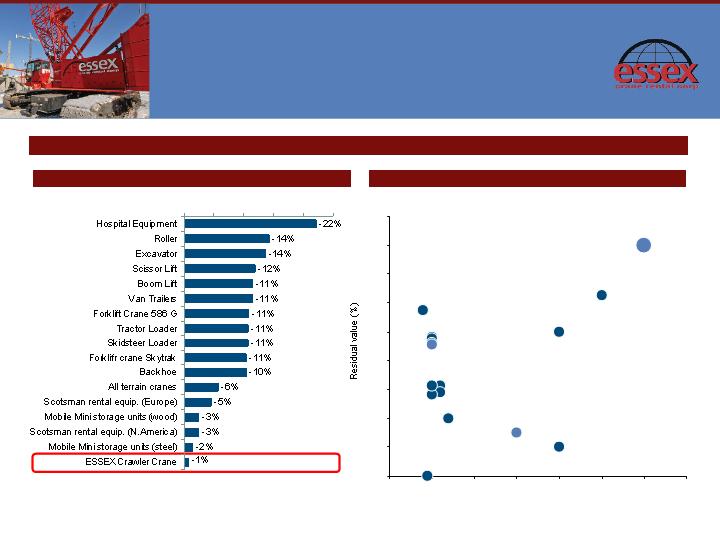
Asset Depreciation (1) Benchmark: Residual Value vs. Lifespan
Asset Depreciation (1) Benchmark: Annual Depreciation %(2)
Crawler cranes stand out from other equipment types due to their superior lifespan and residual value characteristics
Rental Lifespan (years)
Van trailers
Boom Lift
Scissor Lift
Roller
Backhoe
Tractor Loader
Forklift Crane
Excavator
Skidsteer Loader
Hospital
equipment
Mobile Mini
storage units
(steel)
Scotsman rental
equipment (North
America)
Mobile Mini
storage units
(wood)
Scotsman rental
equipment
(Europe)
All terrain cranes
ESSEX
Crawler Crane
0%
10%
20%
30%
40%
50%
60%
70%
80%
90%
0
5
10
15
20
25
30
35

| 9
Heavy Crane Rental
Industry
2

10
U.S. Heavy Crane Rental Industry
Segments
Notes:
1.
Source: Manufacturer reports and Essex management estimates
2.
Crawler crane prices reflect models in Essex’s heavy-lift niche. Light and super heavy-lift crawler cranes can range from $0.5 million to over $5 million
Crane Type
Crawler
All Terrain (ATs)
Rough Terrain (RTs)
Tower
Truck
Max. Lift Cap. (tons)
1,500
600
130
80
150
Max. Reach Cap. (ft.)
700
400
250
350
250
Price New ($ ‘000)
$800 - $2,500 (2)
$500 - $3,000
$250 - $1,000
$300 - $1,000
$300 - $800
Avg. Life (years)
50+
15+
15+
30+
15+
Rental Duration
Long-term
Short-term
Short-term
Long-term
Short-term
Key End Markets
Highways, large
bridges, railroads
Public infrastructure
(stadiums, garages)
Power generation
Sewer / water
treatment
Petrochemicals
Industrial / marine
Petrochemical
maintenance
Railroads
Highways
Office Towers
Apartments
Condominiums
Other Commercial &
Residential
Secondary type
used in variety of
markets including
sewer / water
treatment,
petrochemicals
maintenance and
public infrastructure
projects
Condominiums
Other Residential
Nuclear power
Sewer / water
treatment
High rise (>10 story)
Office Towers
Condominiums
Apartment Buildings
Railroads
Highways
Condominiums
Apartment Buildings
Other Residential
Crawlers typically service infrastructure projects, are non-substitutable and are often rented for longer periods than other crane classes
Comparison of Major Crane Types in the North American Market(1)

| 11
Company Overview
3
12
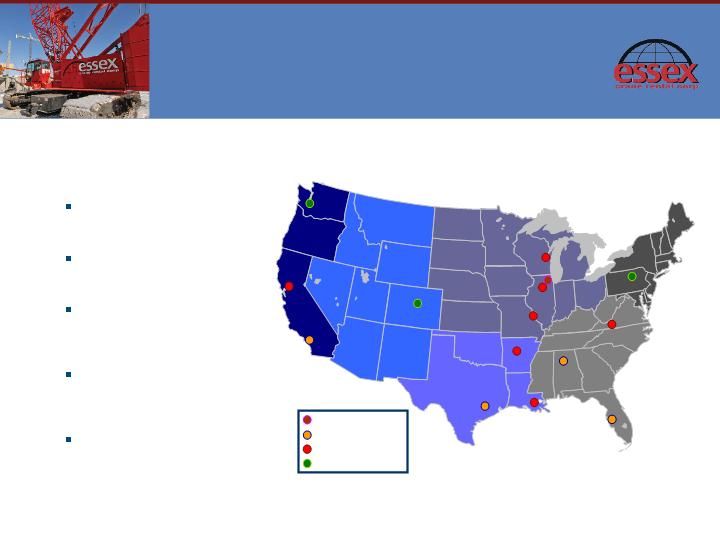
Company Highlights
Head Office
Service Center
Equipment Storage Yard
Satellite Service Center
Key Attributes
Simple business model: bare
(un-manned) rentals
Highly predictable: 6-18 month
contracts
Assets have 30-50 year
economic lives and limited
technological obsolescence risk
Well balanced target market
(industries and customers served
and geography)
Assets have a proven history of
maintaining secondary market re-
sale value
13
Essex’s Competition
Notes:
1.
Source: International Cranes and Specialized Transport, June 2009
2.
Bolded companies represent family owned and operated crawler crane rental companies
3.
Crawler equipment includes all cranes and attachments
4.
Essex management estimate of primary geographic presence (SE=Southeast; NE=Northeast)
5.
Essex management estimate of number of Lampson crawler equipment in North America
Top 10 North American Based Crawler Crane Fleets(1)
Name(2)
Crawler
Equipment (3)
Region (4)
1
ALL Erection & Crane
Rental
457
National
2
Essex Crane Rental Corp.
376
National
3
Lampson International
285(5)
National
4
Maxim Crane Works
293
National
5
Amquip Corp.
127
East
6
M.D. Moody Sons Inc.
125 (Est.)
SE
7
J.F. Lomma
65
NE
8
Ray Anthony
International
55
National
9
Buckner Heavy Lift
Cranes
53
NE
10
Biggie Crane Service
52
West
The crawler crane industry is fragmented:
Essex is the largest player in the bare crawler crane
rental industry owning a large share of the crawler
cranes in excess of 100 ton lifting capacity in the U.S.
Numerous acquisition opportunities of companies in the
top 10 of the crawler crane industry, both national and
regional players
Many competitors are focused on smaller lifting equipment
and therefore are more closely tied to residential and
commercial construction cycles
Minimal competition with general equipment rental
companies (e.g. United Rentals, H&E Equipment Rentals)
Management believes a new market entrant would face a
significant competitive economic disadvantage given the
cost of replicating Essex’s fleet, which is estimated to equal
in excess of $450 million.
$215 million purchase price versus estimated at more
than $450 million cost to replicate fleet with new
equipment
14
Essex Rental Fleet
Essex operates a fleet of >350 cranes and attachments
Fleet diversified by lift capacity
Status as large customer provides preferential pricing and lead-
time arrangements with crane manufacturers
Manitowoc and Liebherr cranes represent 100% of fleet by units
Average lifting capacity has increased from 177 tons in 2003 to
presently 250 tons as a result of Essex’s fleet re-positioning
strategy
Consistently rebalancing fleet mix:
Focus on acquiring heavier tonnage cranes and selling older,
lighter tonnage models
For nine months ended 9/30/09:
Sold 12 cranes to overseas concerns or domestic fixed
operators, with average lifting capacity of 163 tons
Took delivery of 10 new larger lifting capacity cranes with
average lifting capacity of 330 tons
Management believes heavier cranes are in shorter supply and
in higher demand than lighter cranes, which has translated into
a more favorable pricing dynamic and higher utilization rates
Heavier lift capacity cranes exist in smaller quantities in the
marketplace and with fewer suppliers. Management believes
there will be
a growth in demand for these cranes in the future
and that the tighter supply and growth opportunities will produce
higher revenue and margins (returns)
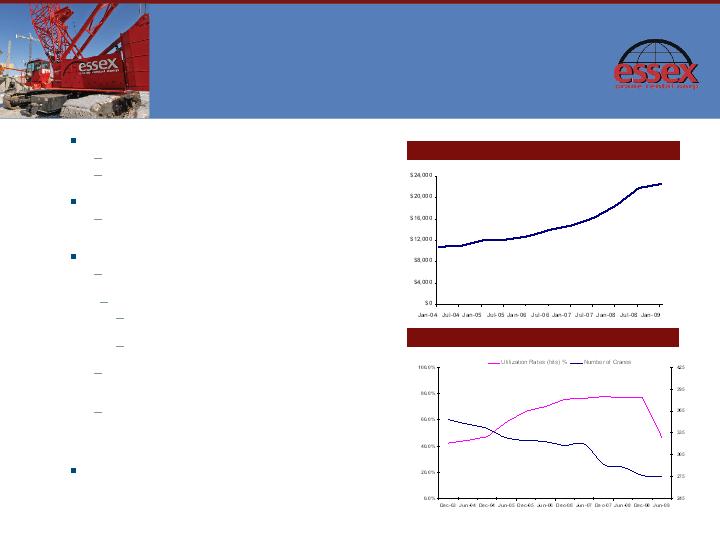
Rental rate increases expected to follow increased utilization rates
Average Monthly Rental Rates for Essex Fleet(1)
Notes:
1.
Source: Essex
2.
Based on “hits” method utilization
Fleet Utilization and Size(1)(2)
15
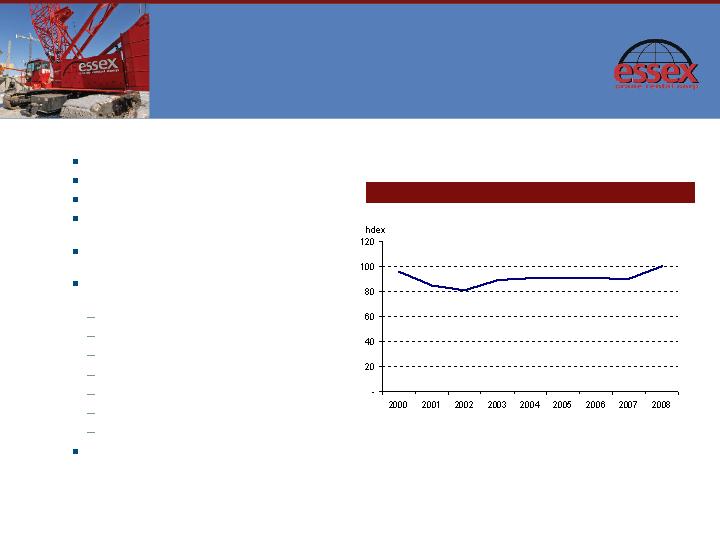
Stable Underlying Asset Value
Note: Line represents the annual OLV of a representative static group of Essex cranes
as a % of their OLV in April 2000
Extended usable lives of up to 50 years
Average fleet age of 16 years(1)
Current OLV in excess of $260 million
Approximately $177 million invested in crawler fleet
since 1995
Estimated Replacement Value of fleet is in excess of
$450 million(2)
Management believes fleet has retained value due
to a number of factors:
Substantial initial investment
High structural steel content
Replaceable components
Low duty-cycle
Enduring technology
Essex investment and maintenance expertise
Strong global demand
Fleet sales have averaged 100% of OLV from 2000
through December 2008(3)
and have averaged over
115% of OLV in 2009
Notes:
1.
Represents an OLV-weighted average age of the entire crane fleet
2.
Essex management estimates
3.
Source: Essex
Essex Crane Fleet OLV Index(3)
Less than 2% economic
depreciation per annum
16
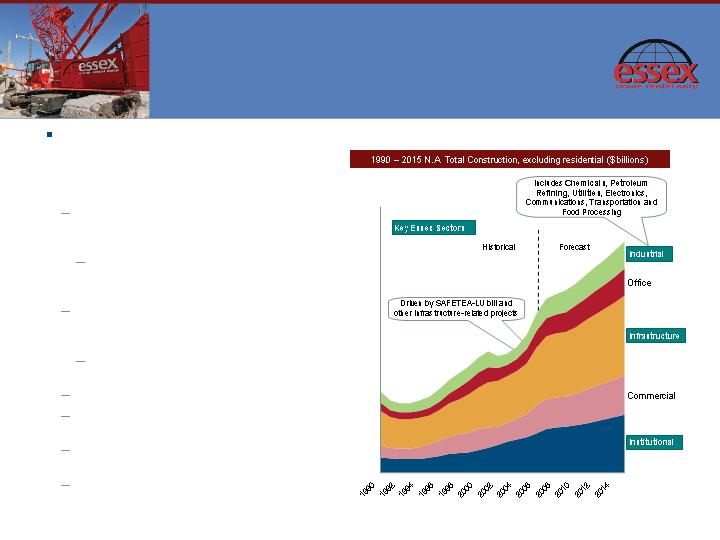
Essex End Market Overview
Source: Oliver Wyman Essex Crane
Assessment
Despite overall weakness in the infrastructure &
construction markets in the first nine months of
2009, Essex has begun to see an increase in
bookings & expects to see a slow recovery starting
early 2010. Demand drivers include:
American Recovery & Reinvestment Act (Federal
Stimulus Plan) expected to fund increased
building activity in many of Essex’ end markets
$50 billion allocated for transportation related
projects such as heavy highway work and
large bridge construction
$244.1 billion SAFETEA-LU bill and renewed
focus on US bridge system positive for
transportation infrastructure
A significantly larger highway bill is under
consideration in Congress
Growing push for new nuclear power facilities
New Orleans levee contracts currently being
awarded
Upgrade of existing national infrastructure –
power and water utilities
Pipeline of social infrastructure projects – i.e.
municipalities building convention / stadium
facilities
0
200
400
600
800
1,000
1,200
1,400

17
Essex’s End Markets
Essex 2002 Rental Revenues by End Market
Less exposure to power,
greater diversification
Industrial / Marine (33%)
Industrial Facilities
Factories
Petrochemicals (22%)
Chemical Plants
Petrochemical
Plants
General Building (6%)
Hospitals
Stadiums
Power (18%)
Power Plants
Wind Power
Transportation (14%)
Road construction
Bridge construction
Sewer & Water (1%)
Sewers
Water Treatment
Essex 2009 Rental Revenues by End Market
18
Growth Opportunities
Leverage extensive relationships and success in selling used equipment at premium prices
Provide “one stop shop” model: rent to own or try before you buy
Expand used equipment sales by purchasing used crawlers for refurbishment and sale
Management believes its relationships with international manufacturers and market players provide additional equipment
purchasing and used equipment sales opportunities
Distribution of New and Used Equipment
Organic Growth
Expected longer term growth in demand for heavy lifting equipment driving increases in rental and utilization rates
Updating fleet with heavier tonnage cranes and replacing older, lighter, less utilized equipment
Purchasing power benefits from crane manufacturer relationships
Equipment purchases of new heavier lift equipment of $53 million the last three years are expected to drive growth in 2010
Expanding customer base to take advantage of future infrastructure projects
Acquisitions / Consolidation
The fragmented rental industry is expected to consolidate
Many competitors are family owned and management expects a number of these to become available over time
Further diversification would enable expansion of current national footprint to markets in the Northeast and the West
| 19
Summary Financial
Information and
Valuation
4
20
Summary Financial Information
Notes:
1.
Source: Essex
2.
Total Rental Related Revenues excludes used rental equipment sales.
3.
2008 financial information includes $5.2 million of one-time non-recurring transaction costs incurred related to Essex Rental Corp’s (formerly Hyde Park Acquisition Corp.)
acquisition of Essex Crane Rental.
4.
Based on “hits” method utilization.
5.
The historical 2004 financial information and data of Essex Crane contained in this presentation is unaudited and was prepared by Essex Crane as a private company
prior to its acquisition by the Company, and
may not conform to SEC regulation S-X.
6.
2008 financial information excludes the impact of the $23.9 million goodwill impairment charge recorded in the fourth quarter of 2008.
December 31 Year End
Historical Unaudited
Historical Audited
Unaudited
(USD $000's)
2004 (5)
2005
2006
2007
2008 (6)
9M'09
Total Rental Related Revenues (2)
$28,524
$38,583
$55,659
$64,532
$76,888
$36,922
Operating Expenses
(13,170)
(17,183)
(20,960)
(23,322)
(27,789)
(12,377)
Gross Profit
15,354
21,400
34,699
41,210
54,099
24,545
SG&A
(7,123)
(7,585)
(8,732)
(9,112)
(12,498)
(8,712)
One-time Transaction Costs (3)
-
-
-
-
(5,200)
-
Rental EBITDA
8,231
13,815
25,967
32,098
36,401
15,834
Rental EBITDA Margin (%)
28.9%
35.8%
46.7%
49.7%
47.3%
42.9%
Gain On Sale of Equipment
1,608
2,879
3,007
6,049
3,814
780
Total EBITDA
9,839
16,694
28,974
38,147
40,215
16,614
Equipment Sale Proceeds
5,454
7,841
5,980
13,233
8,440
6,074
Revenue + Equipment Sale Proceeds
33,978
46,424
61,639
77,765
85,328
42,996
Total EBITDA Margin %
29.0%
36.0%
47.0%
49.1%
47.1%
38.6%
Maintenance Capital Expenditure
(339)
(518)
(512)
(724)
(2,375)
(625)
Discretionary Crane Investment
(383)
(5,875)
(6,004)
(18,784)
(21,153)
(14,406)
Average Fleet Utilization Rate (4)
45.7%
57.8%
72.6%
76.3%
77.0%
51.4%
Average Monthly Rental Rate ($000's)
$11.3
$12.4
$13.8
$16.3
$21.4
$21.7
21
Valuation Snapshot
Debt outstanding (9/30/09): $133.3 million
$190 million facility size
5-year facility
Libor plus 225
2 financial covenants (only become effective if availability is below
$20 million)
14.1 million shares outstanding and 13.5 million warrants exercisable
at $5.00 per share through March 2011
Accumulated tax loss of $45.0 million, which has a present value of
approximately $16.9 million(1) (estimated present value of cash tax
saved of approximately $6.8 million(2))
(1) Discount rate of 15% used to calculate present value of accumulated tax loss.
(2) Assumes use of accumulated tax loss over a seven-year period.
22
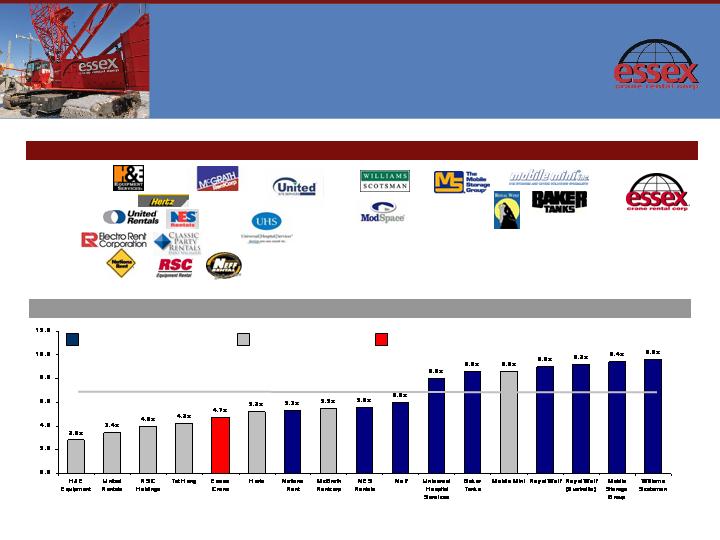
Public Company Trading and Transaction Multiples (LTM EV/Total EBITDA)
Rental Asset Life and EBITDA
Multiple Comparison
Rental Equipment Useful Life
Source: Company filings, industry research
Notes: Data as of 9/04/08; Essex Transaction multiple calculated using LTM 9/30/08 EBITDA
0 Years 5 Years 10 Years 15 Years 20 Years 25 Years 30 Years 50 Years
Mean 6.7x
Transaction EBITDA Multiples Trading EBITDA Multiples Essex Transaction Total EBITDA Multiple
23
2009 Goals & 2010 Outlook
Focus on paying down debt in 2009 and continuation of share and warrant
repurchase plan using after tax free cash flow
Continue to sell older, lower-lift capacity cranes into used crane market
Sell at significant premium to orderly liquidation value and reinvest proceeds
into larger, higher capacity cranes
Proactive cost cutting program
Reduced salaries, head count, eliminated discretionary expenses wherever
possible, decreased use of 3
rd party vendors, and reduced overtime and
associated expenses
Annualized savings of $5 million
Starting early 2010, the Company expects to benefit from Federal Stimulus Bill
funded projects, that include highway and heavy bridge construction, civil works
programs, water and waste water treatment,
and alternative energy projects
24
Investment Summary
Market leader with a long industry heritage able to leverage scale
Committed management team; management and Board of Directors represent
ownership in excess of 50% of common shares outstanding
Strong free cash flow generation characteristics
Exposure to growing infrastructure-related end markets
Numerous organic and strategic growth opportunities
Attractive, flexible and committed debt facilities
Essex is considered to be an attractive investment opportunity for the following reasons: