Attached files
| file | filename |
|---|---|
| 8-K - WALTER INVESTMENT MANAGEMENT CORP. - DITECH HOLDING Corp | b78034e8vk.htm |
| WIMC Review 3rd Quarter 2009 |
| Table of Contents Safe Harbor Statement..................................... 3 Introduction............................................................... 4 Balance Sheet........................................................ 5 Income Statement.............................................. 8 Portfolio Metrics........................................................ 12 |
| Safe Harbor Statement Certain statements in this presentation and in our public documents to which we refer, contain or incorporate by reference "forward-looking" statements as defined in Section 27A of the Securities Act of 1933, as amended and Section 21E of the Securities Exchange Act of 1934, as amended. Walter Investment Management Corp. is including this cautionary statement to make applicable and take advantage of the safe harbor provisions of the Private Securities Litigation Reform Act of 1995. Statements that are not historical fact are forward-looking statements. Words such as "expect," "believe," "anticipate," "project," "estimate," "forecast," "objective," "plan," "goal," "may," "should," "will" and similar expressions are intended to identify forward-looking statements. Forward-looking statements are based on the Company's current belief, intentions and expectations; however, forward-looking statements involve known and unknown risks, uncertainties and other important factors that could cause actual results, performance or achievements, to differ materially from those reflected in the statements made or incorporated in this release. Thus, these forward-looking statements are not guarantees of future performance and should not be relied upon as predictions of future events. These risks and uncertainties are contained in Walter Investment Management Corp.'s Registration Statement on Form S-11 dated September 22, 2009, as amended on October 8, 2009 and October 16, 2009, and Walter Investment Management Corp.'s other filings with the Securities and Exchange Commission. In particular (but not by way of limitation), the following important factors and assumptions could affect the Company's future results and could cause actual results to differ materially from those expressed in the forward-looking statements: local, regional, national and global economic trends and developments in general, and local, regional and national real estate and residential mortgage market trends and developments in particular; the availability of suitable qualifying investments for the proceeds of the Company's secondary offering and risks associated with any such investments we may purse; the availability of additional investment capital and suitable qualifying investments, and risks associated with the expansion of our business activities; limitations imposed on the Company's business due to its REIT status and the Company's continued qualification as a REIT for federal income tax purposes; financing sources and availability, and future interest expense; fluctuations in interest rates and levels of mortgage prepayments; increases in costs and other general competitive factors; natural disasters and adverse weather conditions, especially to the extent they result in material payouts under insurance policies placed with our captive insurance subsidiary; changes in federal, state and local policies, laws and regulations affecting our business, including, without limitation, mortgage financing or servicing, and/or the rights and obligations of property owners, mortgagees and tenants; the effectiveness of risk management strategies; unexpected losses resulting from pending, threatened or unforeseen litigation or other third party claims against the Company; the ability or willingness of Walter Energy and other counterparties to satisfy its/their material obligations under its/their agreements with the Company; the Company's continued listing on the NYSE Amex; uninsured losses or losses in excess of insurance limits and the availability of adequate insurance coverage at reasonable costs; the integration of the former Hanover Capital Mortgage Holdings, Inc. business into that of Walter Investment Management, LLC and its affiliates (the "Merger"), and the realization of anticipated synergies, cost savings and growth opportunities from the Merger; future performance generally; and other presently unidentified factors. This WIMC Review contains or references certain non-GAAP financial measures which are intended to assist in the evaluation of certain financial information provided by the Company. Information regarding non-GAAP financial measures and the reconciliation of them to GAAP measures are provided within this document. The financial information presented is unaudited. Should any of the financial information upon which a forward-looking statement is based change upon audit, the forward-looking statement may also change. All forward looking statements set forth herein are qualified by these cautionary statements and are made only as of the date hereof. The Company undertakes no obligation to update or revise the information contained herein, including without limitation any forward-looking statements whether as a result of new information, subsequent events or circumstances, or otherwise, unless otherwise required by law. |
| Introduction Note to Readers: Results for the quarter ended September 30, 2009 for Walter Investment Management Corp. ("WIMC") were filed with the Securities and Exchange Commission ("SEC") in a Form 10-Q on November 12, 2009. Results for the quarter ended June 30, 2009 were filed with the SEC in a Form 10-Q on August 14, 2009. Results as of and for the three year period ended December 31, 2008 and the quarter ended March 31, 2009 for Walter Investment Management, LLC ("WIM LLC"), the accounting predecessor to WIMC, were presented in a Form 8-K/A on July 10, 2009. Results for the quarter ended March 31, 2009 are available for Hanover Capital Mortgage Holdings Inc. ("Hanover") in their Form 10-Q filed with the SEC on May 15, 2009. These filings and our earnings press releases provide information about our financial results in accordance with generally accepted accounting principles (GAAP). We urge you to review these documents, which are available through our web site, www.walterinvestment.com. This document, called the WIMC Review, provides supplemental information about WIMC through a discussion of many GAAP, as well as non-GAAP measures. We believe that these figures provide additional insight into WIMC's business and future prospects. In each case in which we discuss a non-GAAP measure, you will find an explanation of how it has been calculated, why we think the figure is important, and a reconciliation between the GAAP and non-GAAP figures. We hope you find the WIMC Review helpful to your understanding of our business. |
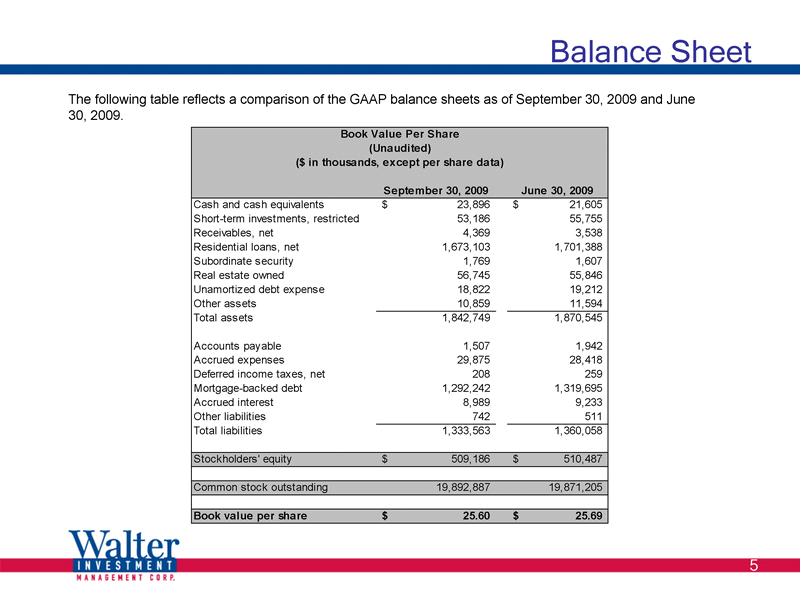
| Balance Sheet The following table reflects a comparison of the GAAP balance sheets as of September 30, 2009 and June 30, 2009. September 30, 2009 June 30, 2009 Cash and cash equivalents 23,896 $ 21,605 $ Short-term investments, restricted 53,186 55,755 Receivables, net 4,369 3,538 Residential loans, net 1,673,103 1,701,388 Subordinate security 1,769 1,607 Real estate owned 56,745 55,846 Unamortized debt expense 18,822 19,212 Other assets 10,859 11,594 Total assets 1,842,749 1,870,545 Accounts payable 1,507 1,942 Accrued expenses 29,875 28,418 Deferred income taxes, net 208 259 Mortgage-backed debt 1,292,242 1,319,695 Accrued interest 8,989 9,233 Other liabilities 742 511 Total liabilities 1,333,563 1,360,058 Stockholders' equity 509,186 $ 510,487 $ Common stock outstanding 19,892,887 19,871,205 Book value per share 25.60 $ 25.69 $ Book Value Per Share ($ in thousands, except per share data) (Unaudited) |
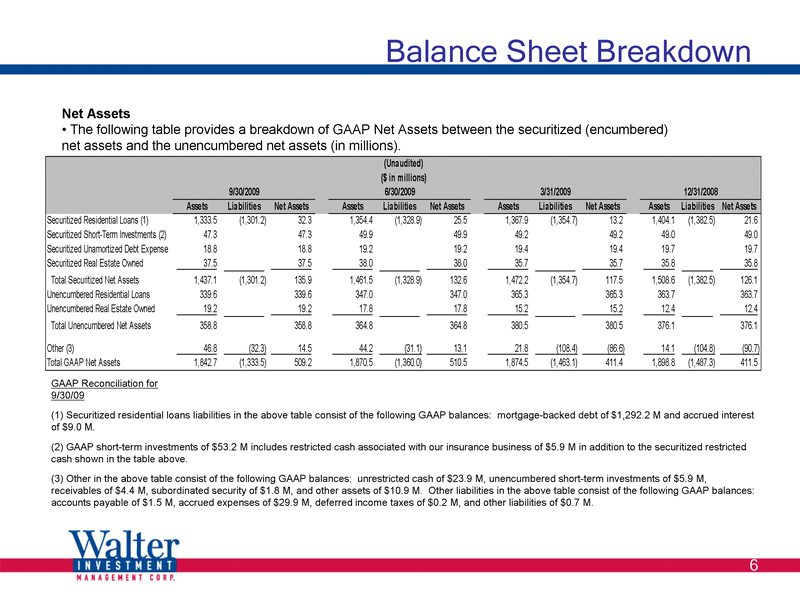
| Balance Sheet Breakdown Net Assets The following table provides a breakdown of GAAP Net Assets between the securitized (encumbered) net assets and the unencumbered net assets (in millions). GAAP Reconciliation for 9/30/09 (1) Securitized residential loans liabilities in the above table consist of the following GAAP balances: mortgage-backed debt of $1,292.2 M and accrued interest of $9.0 M. (1) Securitized residential loans liabilities in the above table consist of the following GAAP balances: mortgage-backed debt of $1,292.2 M and accrued interest of $9.0 M. (1) Securitized residential loans liabilities in the above table consist of the following GAAP balances: mortgage-backed debt of $1,292.2 M and accrued inte rest of $9.0 M. (1) Securitized residential loans liabilities in the above table consist of the following GAAP balances: mortgage-backed debt of $1,292.2 M and accrued interest of $9.0 M. (1) Securitized residential loans liabilities in the above table consist of the following GAAP balances: mortgage-backed debt of $1,292.2 M and accrued interest of $9.0 M. (1) Securitized residential loans liabilities in the above table consist of the following GAAP balances: mortgage-backed debt of $1,292.2 M and accrued interest of $9.0 M. (1) Securitized residential loans liabilities in the above table consist of the following GAAP balances: mortgage-backed debt of $1,292.2 M and accrued interest of $9.0 M. (1) Securitized residential loans liabilities in the above table consist of the following GAAP balances: mortgage-backed debt of $1,292.2 M and accrued interest of $9.0 M. (1) Securitized residential loans liabilities in the above table consist of the following GAAP balances: mortgage-backed deb t of $1,292.2 M and accrued interest of $9.0 M. (1) Securitized residential loans liabilities in the above table consist of the following GAAP balances: mortgage-backed debt of $1,292.2 M and accrued interest of $9.0 M. (1) Securitized residential loans liabilities in the above table consist of the following GAAP balances: mortgage-backed debt of $1,292.2 M and accrued interest of $9.0 M. (1) Securitized residential loans liabilities in the above table consist of the following GAAP balances: mor tgage-backed debt of $1,292.2 M and accrued interest of $9.0 M. (2) GAAP short-term investments of $53.2 M includes restricted cash associated with our insurance business of $5.9 M in addition to the securitized restricted cash shown in the table above. (2) GAAP short-term investments of $53.2 M includes restricted cash associated with our insurance business of $5.9 M in addition to the securitized restricted cash shown in the table above. (2) GAAP short-term investments of $53.2 M includes restricted cash associated with our insurance business of $5.9 M in add ition to the securitized restricted cash shown in the table above. (2) GAAP short-term investments of $53.2 M includes restricted cash associated with our insurance business of $5.9 M in addition to the securitized restricted cash shown in the table above. (2) GAAP short-term investments of $53.2 M includes restricted cash associated with our insurance business of $5.9 M in addition to the securitized restricted cash shown in the table above. (2) GAAP short-term investments of $53.2 M includes rest ricted cash associated with our insurance business of $5.9 M in addition to the securitized restricted cash shown in the table above. (2) GAAP short-term investments of $53.2 M includes restricted cash associated with our insurance business of $5.9 M in addition to the securitized restricted cash shown in the table above. (2) GAAP short-term investments of $53.2 M includes restricted cash associated with our insurance business of $5.9 M in addition to the securitized restricted cash shown in the table above. (2) GAAP short-term investments of $53.2 M includes restricted cash associated with our insurance business of $5.9 M in addition to the securitized restricted cash shown in the table above. (2) GAAP short-term investments of $53.2 M includes restricted cash associated with our insurance business of $5.9 M in addition to the securitized restricted cash shown in the table above. (2) GAAP short-term investments of $53.2 M includes restricted cash associated with our insurance business of $5.9 M in addition to the securitized restricted cash shown in the table above. (2) GAAP short-term investments of $53.2 M includes restricted cash associated with our insurance business of $5.9 M in addition to the securitized restricted cash shown in the table above. (3) Other in the above table consist of the following GAAP balances: unrestricted cash of $23.9 M, unencumbered short-term investments of $5.9 M, receivables of $4.4 M, subordinated security of $1.8 M, and other assets of $10.9 M. Other liabilities in the above table consist of the following GAAP balances: accounts payable of $1.5 M, accrued expenses of $29.9 M, deferred income taxes of $0.2 M, and other liabilities of $0.7 M. (3) Other in the above table consist of the following GAAP balances: un restricted cash of $23.9 M, unencumbered short-term investments of $5.9 M, receivables of $4.4 M, subordinated security of $1.8 M, and other assets of $10.9 M. Other liabilities in the above table consist of the following GAAP balances: accounts payable of $1.5 M, accrued expenses of $29.9 M, deferred income taxes of $0.2 M, and other liabilities of $0.7 M. (3) Other in the above table consist of the following GAAP balances: unrestricted cash of $23.9 M, unencumbered short-term investments of $5.9 M, receivables of $4.4 M, subordinated security of $1.8 M, and other assets of $10.9 M. Other liabilities in the above table consist of the following GAAP balances: accounts payable of $1.5 M, accrued expenses of $29.9 M, deferred income taxes of $0.2 M, and other liabilities of $0.7 M. (3) Other in the above table consist of the following GAAP balances: unrestricted cash of $23.9 M, unencumbered short-term investments of $5.9 M, receivables of $4.4 M, subordinated security of $1.8 M, and other assets of $10.9 M. Other liabilities in the above table consist of the following GAAP balances: accounts payable of $1.5 M, accrued expenses of $29.9 M, deferred income taxes of $0.2 M, and other liabilities of $0.7 M. (3) Other in the above table consist of the following GAAP balances: unrestricted cash of $23.9 M, unencumbered short-term investments of $5.9 M, receivables of $4.4 M, subordinated security of $1.8 M, and other assets of $10.9 M. Other liabilities in the above table consist of the following GA AP balances: accounts payable of $1.5 M, accrued expenses of $29.9 M, deferred income taxes of $0.2 M, and other liabilities of $0.7 M. (3) Other in the above table consist of the following GAAP balances: unrestricted cash of $23.9 M, unencumbered short-term investments of $5.9 M, receivables of $4.4 M, subordinated security of $1.8 M, and other assets of $10.9 M. Other liabilities in the above table consist of the following GAAP balances: accounts payable of $1.5 M, accrued expenses of $29.9 M, defe rred income taxes of $0.2 M, and other liabilities of $0.7 M. (3) Other in the above table consist of the following GAAP balances: unrestricted cash of $23.9 M, unencumbered short-term investments of $5.9 M, receivables of $4.4 M, subordinated security of $1.8 M, and other assets of $10.9 M. Other liabilities in the above table consist of the following GAAP balances: accounts payable of $1.5 M, accrued expenses of $29.9 M, deferred income taxes of $0.2 M, and other liabilities of $0.7 M. (3) Other in the above table consist of the following GAAP balances: unrestricted cash of $23.9 M, unencumbered short-term investments of $5.9 M, receivables of $4.4 M, subordinated security of $1.8 M, and other assets of $10.9 M. Other liabilities in the above table consist of the following GAAP balances: accounts payable of $1.5 M, accrued expenses of $29.9 M, deferred income taxes of $0.2 M, and other liabilities of $0.7 M. (3) Other in the above table consist of the following GAAP balances: unrestricted ca sh of $23.9 M, unencumbered short-term investments of $5.9 M, receivables of $4.4 M, subordinated security of $1.8 M, and other assets of $10.9 M. Other liabilities in the above table consist of the following GAAP balances: accounts payable of $1.5 M, accrued expenses of $29.9 M, deferred income taxes of $0.2 M, and other liabilities of $0.7 M. (3) Other in the above table consist of the following GAAP balances: unrestricted cash of $23.9 M, unencumbered short-term investments of $5.9 M, receivables o f $4.4 M, subordinated security of $1.8 M, and other assets of $10.9 M. Other liabilities in the above table consist of the following GAAP balances: accounts payable of $1.5 M, accrued expenses of $29.9 M, deferred income taxes of $0.2 M, and other liabilities of $0.7 M. (3) Other in the above table consist of the following GAAP balances: unrestricted cash of $23.9 M, unencumbered short-term investments of $5.9 M, receivables of $4.4 M, subordinated security of $1.8 M, and other assets of $10.9 M. Ot her liabilities in the above table consist of the following GAAP balances: accounts payable of $1.5 M, accrued expenses of $29.9 M, deferred income taxes of $0.2 M, and other liabilities of $0.7 M. (3) Other in the above table consist of the following GAAP balances: unrestricted cash of $23.9 M, unencumbered short-term investments of $5.9 M, receivables of $4.4 M, subordinated security of $1.8 M, and other assets of $10.9 M. Other liabilities in the above table consist of the following GAAP balances: accounts payable of $1.5 M, accrued expenses of $29.9 M, deferred income taxes of $0.2 M, and other liabilities of $0.7 M. Assets Liabilities Net Assets Assets Liabilities Net Assets Assets Liabilities Net Assets Assets Liabilities Net Assets Securitized Residential Loans (1) 1,333.5 (1,301.2) 32.3 1,354.4 (1,328.9) 25.5 1,367.9 (1,354.7) 13.2 1,404.1 (1,382.5) 21.6 Securitized Short-Term Investments (2) 47.3 47.3 49.9 49.9 49.2 49.2 49.0 49.0 Securitized Unamortized Debt Expense 18.8 18.8 19.2 19.2 19.4 19.4 19.7 19.7 Securitized Real Estate Owned 37.5 37.5 38.0 38.0 35.7 35.7 35.8 35.8 Total Securitized Net Assets 1,437.1 (1,301.2) 135.9 1,461.5 (1,328.9) 132.6 1,472.2 (1,354.7) 117.5 1,508.6 (1,382.5) 126.1 Unencumbered Residential Loans 339.6 339.6 347.0 347.0 365.3 365.3 363.7 363.7 Unencumbered Real Estate Owned 19.2 19.2 17.8 17.8 15.2 15.2 12.4 12.4 Total Unencumbered Net Assets 358.8 358.8 364.8 364.8 380.5 380.5 376.1 376.1 Other (3) 46.8 (32.3) 14.5 44.2 (31.1) 13.1 21.8 (108.4) (86.6) 14.1 (104.8) (90.7) Total GAAP Net Assets 1,842.7 (1,333.5) 509.2 1,870.5 (1,360.0) 510.5 1,874.5 (1,463.1) 411.4 1,898.8 (1,487.3) 411.5 9/30/2009 6/30/2009 3/31/2009 12/31/2008 (Unaudited) ($ in millions) |
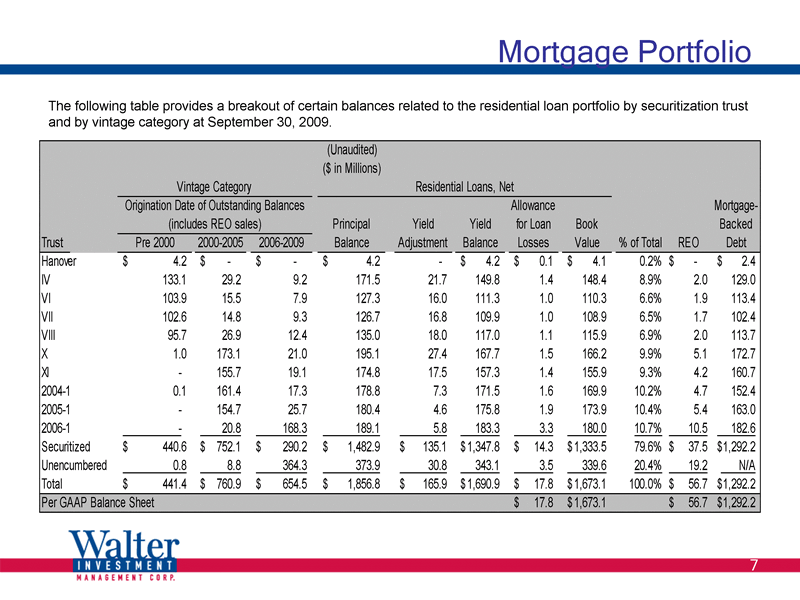
| Mortgage Portfolio The following table provides a breakout of certain balances related to the residential loan portfolio by securitization trust and by vintage category at September 30, 2009. Principal Yield Yield Allowance for Loan Book Mortgage- Backed Trust Pre 2000 2000-2005 2006-2009 Balance Adjustment Balance Losses Value % of Total REO Debt Hanover 4.2 $ - $ - $ 4.2 $ - 4.2 $ 0.1 $ 4.1 $ 0.2% - $ 2.4 $ IV 133.1 29.2 9.2 171.5 21.7 149.8 1.4 148.4 8.9% 2.0 129.0 VI 103.9 15.5 7.9 127.3 16.0 111.3 1.0 110.3 6.6% 1.9 113.4 VII 102.6 14.8 9.3 126.7 16.8 109.9 1.0 108.9 6.5% 1.7 102.4 VIII 95.7 26.9 12.4 135.0 18.0 117.0 1.1 115.9 6.9% 2.0 113.7 X 1.0 173.1 21.0 195.1 27.4 167.7 1.5 166.2 9.9% 5.1 172.7 XI - 155.7 19.1 174.8 17.5 157.3 1.4 155.9 9.3% 4.2 160.7 2004-1 0.1 161.4 17.3 178.8 7.3 171.5 1.6 169.9 10.2% 4.7 152.4 2005-1 - 154.7 25.7 180.4 4.6 175.8 1.9 173.9 10.4% 5.4 163.0 2006-1 - 20.8 168.3 189.1 5.8 183.3 3.3 180.0 10.7% 10.5 182.6 Securitized 440.6 $ 752.1 $ 290.2 $ 1,482.9 $ 135.1 $ 1,347.8 $ 14.3 $ 1,333.5 $ 79.6% 37.5 $ 1,292.2 $ Unencumbered 0.8 8.8 364.3 373.9 30.8 343.1 3.5 339.6 20.4% 19.2 N/A Total 441.4 $ 760.9 $ 654.5 $ 1,856.8 $ 165.9 $ 1,690.9 $ 17.8 $ 1,673.1 $ 100.0% 56.7 $ 1,292.2 $ Per GAAP Balance Sheet 17.8 $ 1,673.1 $ 56.7 $ 1,292.2 $ Vintage Category Origination Date of Outstanding Balances (includes REO sales) (Unaudited) Residential Loans, Net ($ in Millions) |
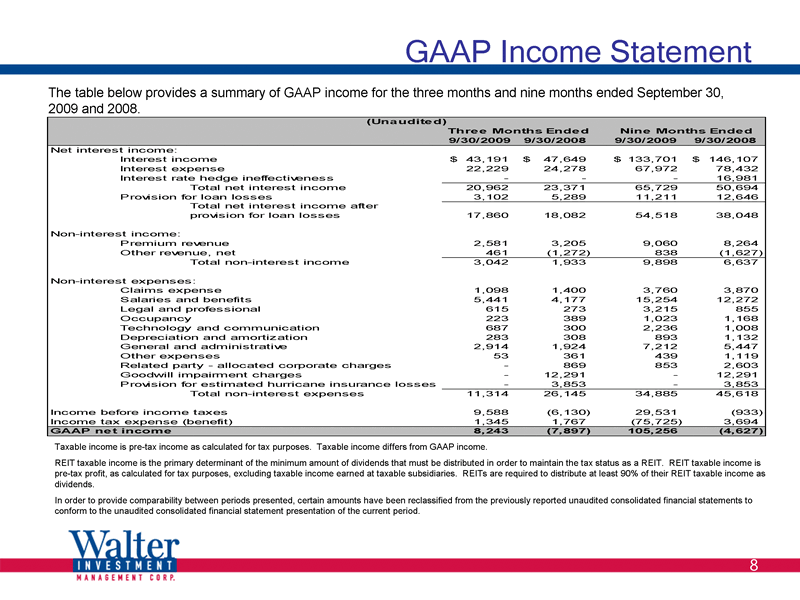
| GAAP Income Statement The table below provides a summary of GAAP income for the three months and nine months ended September 30, 2009 and 2008. Taxable income is pre-tax income as calculated for tax purposes. Taxable income differs from GAAP income. REIT taxable income is the primary determinant of the minimum amount of dividends that must be distributed in order to maintain the tax status as a REIT. REIT taxable income is pre-tax profit, as calculated for tax purposes, excluding taxable income earned at taxable subsidiaries. REITs are required to distribute at least 90% of their REIT taxable income as dividends. In order to provide comparability between periods presented, certain amounts have been reclassified from the previously reported unaudited consolidated financial statements to conform to the unaudited consolidated financial statement presentation of the current period. 9/30/2009 9/30/2008 9/30/2009 9/30/2008 Net interest income: Interest income 43,191 $ 47,649 $ 133,701 $ 146,107 $ Interest expense 22,229 24,278 67,972 78,432 Interest rate hedge ineffectiveness - - - 16,981 Total net interest income 20,962 23,371 65,729 50,694 Provision for loan losses 3,102 5,289 11,211 12,646 17,860 18,082 54,518 38,048 Non-interest income: Premium revenue 2,581 3,205 9,060 8,264 Other revenue, net 461 (1,272) 838 (1,627) Total non-interest income 3,042 1,933 9,898 6,637 Non-interest expenses: Claims expense 1,098 1,400 3,760 3,870 Salaries and benefits 5,441 4,177 15,254 12,272 Legal and professional 615 273 3,215 855 Occupancy 223 389 1,023 1,168 Technology and communication 687 300 2,236 1,008 Depreciation and amortization 283 308 893 1,132 General and administrative 2,914 1,924 7,212 5,447 Other expenses 53 361 439 1,119 Related party - allocated corporate charges - 869 853 2,603 Goodwill impairment charges - 12,291 - 12,291 Provision for estimated hurricane insurance losses - 3,853 - 3,853 Total non-interest expenses 11,314 26,145 34,885 45,618 Income before income taxes 9,588 (6,130) 29,531 (933) Income tax expense (benefit) 1,345 1,767 (75,725) 3,694 GAAP net income 8,243 (7,897) 105,256 (4,627) Nine Months Ended Total net interest income after provision for loan losses Three Months Ended (Unaudited) |
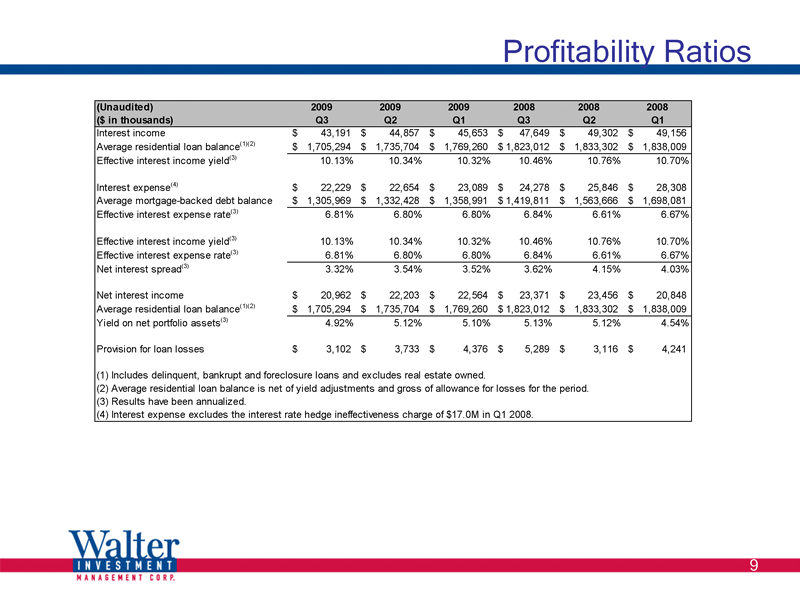
| Profitability Ratios (Unaudited) 2009 2009 2009 2008 2008 2008 ($ in thousands) Q3 Q2 Q1 Q3 Q2 Q1 Interest income 43,191 $ 44,857 $ 45,653 $ 47,649 $ 49,302 $ 49,156 $ Average residential loan balance (1)(2) 1,705,294 $ 1,735,704 $ 1,769,260 $ 1,823,012 $ 1,833,302 $ 1,838,009 $ Effective interest income yield (3) 10.13% 10.34% 10.32% 10.46% 10.76% 10.70% Interest expense (4) 22,229 $ 22,654 $ 23,089 $ 24,278 $ 25,846 $ 28,308 $ Average mortgage-backed debt balance 1,305,969 $ 1,332,428 $ 1,358,991 $ 1,419,811 $ 1,563,666 $ 1,698,081 $ Effective interest expense rate (3) 6.81% 6.80% 6.80% 6.84% 6.61% 6.67% Effective interest income yield (3) 10.13% 10.34% 10.32% 10.46% 10.76% 10.70% Effective interest expense rate (3) 6.81% 6.80% 6.80% 6.84% 6.61% 6.67% Net interest spread (3) 3.32% 3.54% 3.52% 3.62% 4.15% 4.03% Net interest income 20,962 $ 22,203 $ 22,564 $ 23,371 $ 23,456 $ 20,848 $ Average residential loan balance (1)(2) 1,705,294 $ 1,735,704 $ 1,769,260 $ 1,823,012 $ 1,833,302 $ 1,838,009 $ Yield on net portfolio assets (3) 4.92% 5.12% 5.10% 5.13% 5.12% 4.54% Provision for loan losses 3,102 $ 3,733 $ 4,376 $ 5,289 $ 3,116 $ 4,241 $ (1) Includes delinquent, bankrupt and foreclosure loans and excludes real estate owned. (2) Average residential loan balance is net of yield adjustments and gross of allowance for losses for the period. (3) Results have been annualized. (4) Interest expense excludes the interest rate hedge ineffectiveness charge of $17.0M in Q1 2008. |
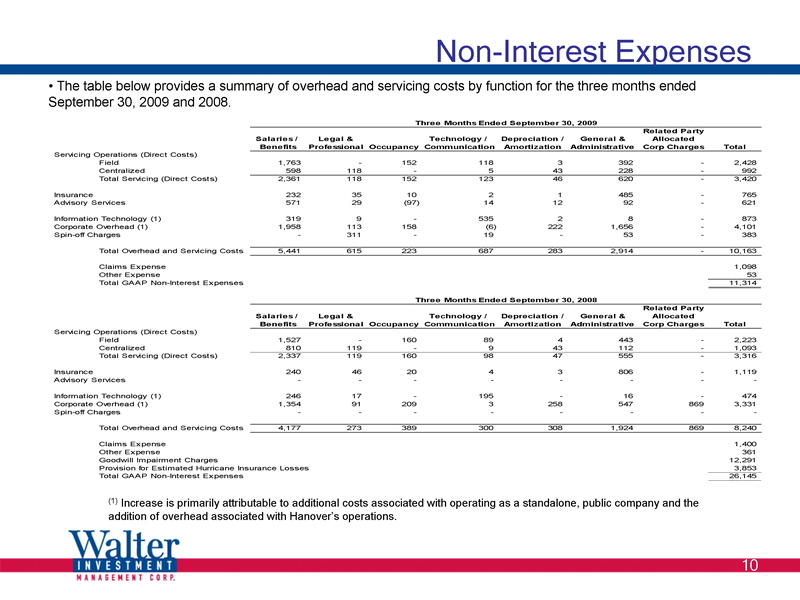
| Non-Interest Expenses The table below provides a summary of overhead and servicing costs by function for the three months ended September 30, 2009 and 2008. (1) Increase is primarily attributable to additional costs associated with operating as a standalone, public company and the addition of overhead associated with Hanover's operations. Related Party Salaries / Legal & Technology / Depreciation / General & Allocated Benefits Professional Occupancy Communication Amortization Administrative Corp Charges Total Servicing Operations (Direct Costs) Field 1,763 - 152 118 3 392 - 2,428 Centralized 598 118 - 5 43 228 - 992 Total Servicing (Direct Costs) 2,361 118 152 123 46 620 - 3,420 Insurance 232 35 10 2 1 485 - 765 Advisory Services 571 29 (97) 14 12 92 - 621 Information Technology (1) 319 9 - 535 2 8 - 873 Corporate Overhead (1) 1,958 113 158 (6) 222 1,656 - 4,101 Spin-off Charges - 311 - 19 - 53 - 383 Total Overhead and Servicing Costs 5,441 615 223 687 283 2,914 - 10,163 Claims Expense 1,098 Other Expense 53 Total GAAP Non-Interest Expenses 11,314 Related Party Salaries / Legal & Technology / Depreciation / General & Allocated Benefits Professional Occupancy Communication Amortization Administrative Corp Charges Total Servicing Operations (Direct Costs) Field 1,527 - 160 89 4 443 - 2,223 Centralized 810 119 - 9 43 112 - 1,093 Total Servicing (Direct Costs) 2,337 119 160 98 47 555 - 3,316 Insurance 240 46 20 4 3 806 - 1,119 Advisory Services - - - - - - - - Information Technology (1) 246 17 - 195 - 16 - 474 Corporate Overhead (1) 1,354 91 209 3 258 547 869 3,331 Spin-off Charges - - - - - - - - Total Overhead and Servicing Costs 4,177 273 389 300 308 1,924 869 8,240 Claims Expense 1,400 Other Expense 361 Goodwill Impairment Charges 12,291 Provision for Estimated Hurricane Insurance Losses 3,853 Total GAAP Non-Interest Expenses 26,145 Three Months Ended September 30, 2009 Three Months Ended September 30, 2008 |
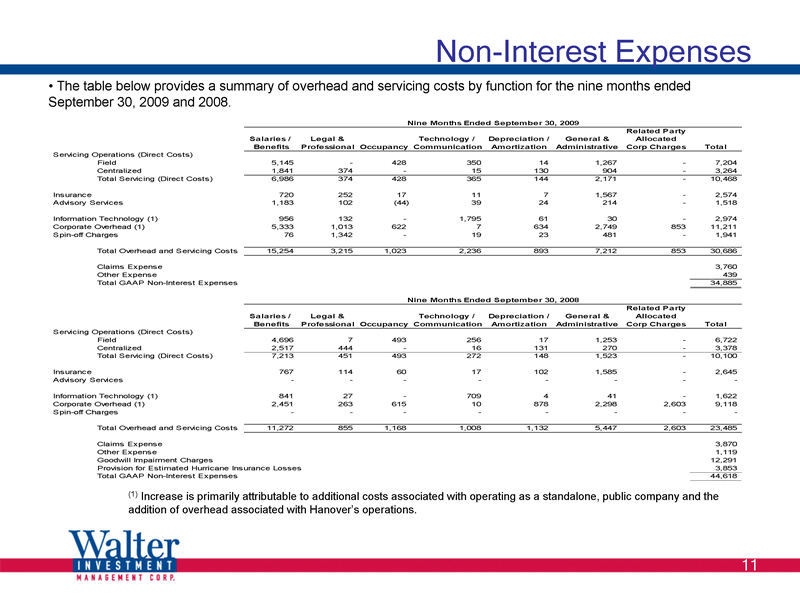
| Non-Interest Expenses The table below provides a summary of overhead and servicing costs by function for the nine months ended September 30, 2009 and 2008. (1) Increase is primarily attributable to additional costs associated with operating as a standalone, public company and the addition of overhead associated with Hanover's operations. Related Party Salaries / Legal & Technology / Depreciation / General & Allocated Benefits Professional Occupancy Communication Amortization Administrative Corp Charges Total Servicing Operations (Direct Costs) Field 5,145 - 428 350 14 1,267 - 7,204 Centralized 1,841 374 - 15 130 904 - 3,264 Total Servicing (Direct Costs) 6,986 374 428 365 144 2,171 - 10,468 Insurance 720 252 17 11 7 1,567 - 2,574 Advisory Services 1,183 102 (44) 39 24 214 - 1,518 Information Technology (1) 956 132 - 1,795 61 30 - 2,974 Corporate Overhead (1) 5,333 1,013 622 7 634 2,749 853 11,211 Spin-off Charges 76 1,342 - 19 23 481 - 1,941 Total Overhead and Servicing Costs 15,254 3,215 1,023 2,236 893 7,212 853 30,686 Claims Expense 3,760 Other Expense 439 Total GAAP Non-Interest Expenses 34,885 Related Party Salaries / Legal & Technology / Depreciation / General & Allocated Benefits Professional Occupancy Communication Amortization Administrative Corp Charges Total Servicing Operations (Direct Costs) Field 4,696 7 493 256 17 1,253 - 6,722 Centralized 2,517 444 - 16 131 270 - 3,378 Total Servicing (Direct Costs) 7,213 451 493 272 148 1,523 - 10,100 Insurance 767 114 60 17 102 1,585 - 2,645 Advisory Services - - - - - - - - Information Technology (1) 841 27 - 709 4 41 - 1,622 Corporate Overhead (1) 2,451 263 615 10 878 2,298 2,603 9,118 Spin-off Charges - - - - - - - - Total Overhead and Servicing Costs 11,272 855 1,168 1,008 1,132 5,447 2,603 23,485 Claims Expense 3,870 Other Expense 1,119 Goodwill Impairment Charges 12,291 Provision for Estimated Hurricane Insurance Losses 3,853 Total GAAP Non-Interest Expenses 44,618 Nine Months Ended September 30, 2009 Nine Months Ended September 30, 2008 |
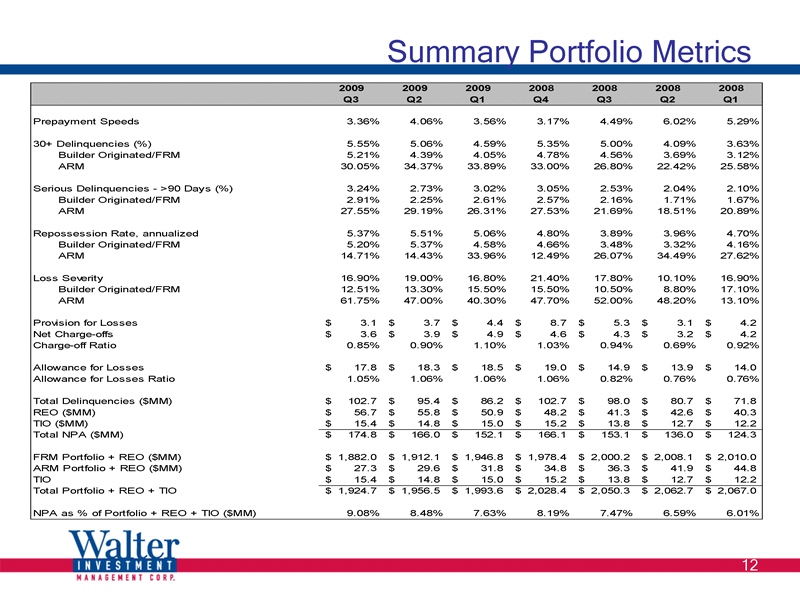
| Summary Portfolio Metrics 2009 2009 2009 2008 2008 2008 2008 Q3 Q2 Q1 Q4 Q3 Q2 Q1 Prepayment Speeds 3.36% 4.06% 3.56% 3.17% 4.49% 6.02% 5.29% 30+ Delinquencies (%) 5.55% 5.06% 4.59% 5.35% 5.00% 4.09% 3.63% Builder Originated/FRM 5.21% 4.39% 4.05% 4.78% 4.56% 3.69% 3.12% ARM 30.05% 34.37% 33.89% 33.00% 26.80% 22.42% 25.58% Serious Delinquencies - >90 Days (%) 3.24% 2.73% 3.02% 3.05% 2.53% 2.04% 2.10% Builder Originated/FRM 2.91% 2.25% 2.61% 2.57% 2.16% 1.71% 1.67% ARM 27.55% 29.19% 26.31% 27.53% 21.69% 18.51% 20.89% Repossession Rate, annualized 5.37% 5.51% 5.06% 4.80% 3.89% 3.96% 4.70% Builder Originated/FRM 5.20% 5.37% 4.58% 4.66% 3.48% 3.32% 4.16% ARM 14.71% 14.43% 33.96% 12.49% 26.07% 34.49% 27.62% Loss Severity 16.90% 19.00% 16.80% 21.40% 17.80% 10.10% 16.90% Builder Originated/FRM 12.51% 13.30% 15.50% 15.50% 10.50% 8.80% 17.10% ARM 61.75% 47.00% 40.30% 47.70% 52.00% 48.20% 13.10% Provision for Losses 3.1 $ 3.7 $ 4.4 $ 8.7 $ 5.3 $ 3.1 $ 4.2 $ Net Charge-offs 3.6 $ 3.9 $ 4.9 $ 4.6 $ 4.3 $ 3.2 $ 4.2 $ Charge-off Ratio 0.85% 0.90% 1.10% 1.03% 0.94% 0.69% 0.92% Allowance for Losses 17.8 $ 18.3 $ 18.5 $ 19.0 $ 14.9 $ 13.9 $ 14.0 $ Allowance for Losses Ratio 1.05% 1.06% 1.06% 1.06% 0.82% 0.76% 0.76% Total Delinquencies ($MM) 102.7 $ 95.4 $ 86.2 $ 102.7 $ 98.0 $ 80.7 $ 71.8 $ REO ($MM) 56.7 $ 55.8 $ 50.9 $ 48.2 $ 41.3 $ 42.6 $ 40.3 $ TIO ($MM) 15.4 $ 14.8 $ 15.0 $ 15.2 $ 13.8 $ 12.7 $ 12.2 $ Total NPA ($MM) 174.8 $ 166.0 $ 152.1 $ 166.1 $ 153.1 $ 136.0 $ 124.3 $ FRM Portfolio + REO ($MM) 1,882.0 $ 1,912.1 $ 1,946.8 $ 1,978.4 $ 2,000.2 $ 2,008.1 $ 2,010.0 $ ARM Portfolio + REO ($MM) 27.3 $ 29.6 $ 31.8 $ 34.8 $ 36.3 $ 41.9 $ 44.8 $ TIO 15.4 $ 14.8 $ 15.0 $ 15.2 $ 13.8 $ 12.7 $ 12.2 $ Total Portfolio + REO + TIO 1,924.7 $ 1,956.5 $ 1,993.6 $ 2,028.4 $ 2,050.3 $ 2,062.7 $ 2,067.0 $ NPA as % of Portfolio + REO + TIO ($MM) 9.08% 8.48% 7.63% 8.19% 7.47% 6.59% 6.01% |
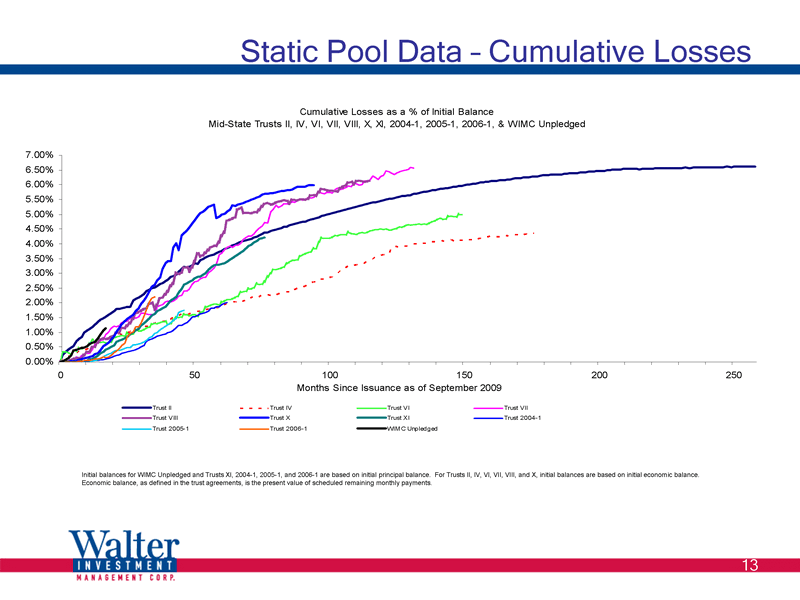
| Static Pool Data - Cumulative Losses Initial balances for WIMC Unpledged and Trusts XI, 2004-1, 2005-1, and 2006-1 are based on initial principal balance. For Trusts II, IV, VI, VII, VIII, and X, initial balances are based on initial economic balance. Economic balance, as defined in the trust agreements, is the present value of scheduled remaining monthly payments. |
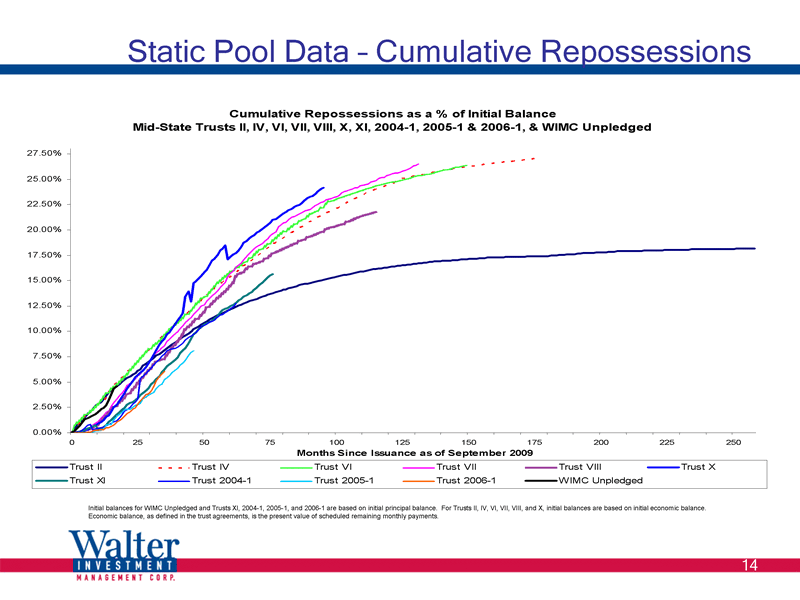
| Static Pool Data - Cumulative Repossessions Initial balances for WIMC Unpledged and Trusts XI, 2004-1, 2005-1, and 2006-1 are based on initial principal balance. For Trusts II, IV, VI, VII, VIII, and X, initial balances are based on initial economic balance. Economic balance, as defined in the trust agreements, is the present value of scheduled remaining monthly payments. |
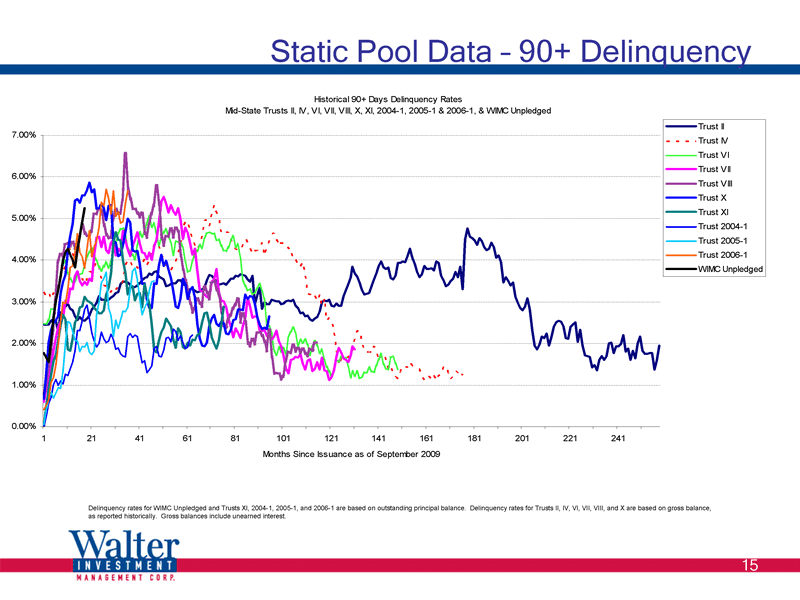
| Static Pool Data - 90+ Delinquency Delinquency rates for WIMC Unpledged and Trusts XI, 2004-1, 2005-1, and 2006-1 are based on outstanding principal balance. Delinquency rates for Trusts II, IV, VI, VII, VIII, and X are based on gross balance, as reported historically. Gross balances include unearned interest. |
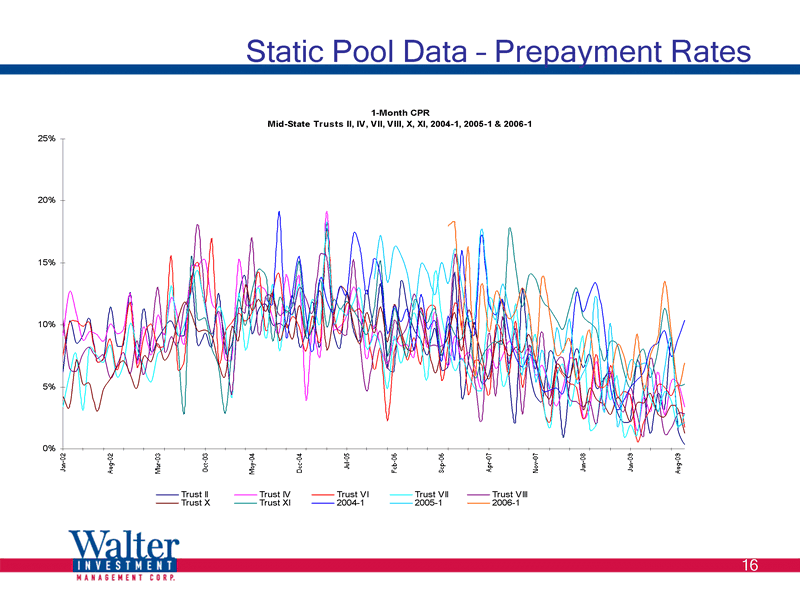
| Static Pool Data - Prepayment Rates |
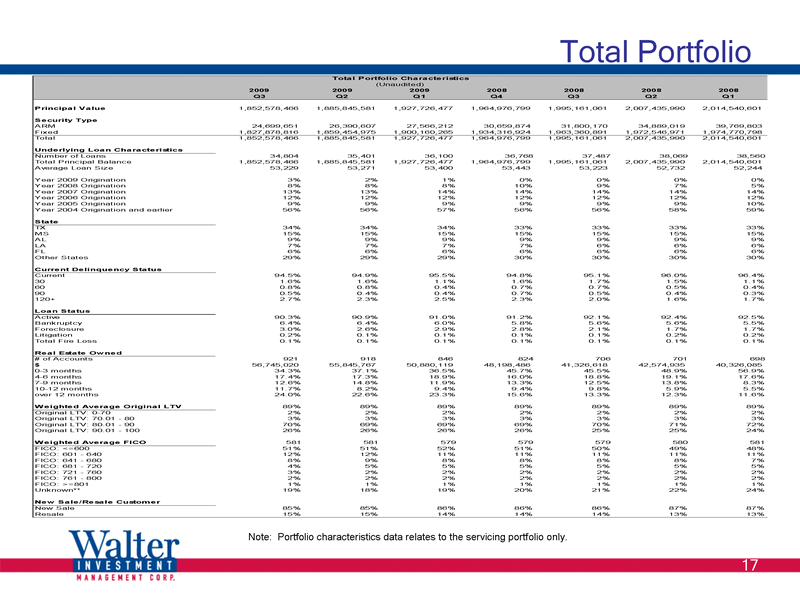
| Total Portfolio Note: Hanover is not included in the portfolio characteristics data as this relates to the servicing portfolio only. 2009 2009 2009 2008 2008 2008 2008 Q3 Q2 Q1 Q4 Q3 Q2 Q1 Principal Value 1,852,578,466 1,885,845,581 1,927,726,477 1,964,976,799 1,995,161,061 2,007,435,990 2,014,540,601 Security Type ARM 24,699,651 26,390,607 27,566,212 30,659,874 31,800,170 34,889,019 39,769,803 Fixed 1,827,878,816 1,859,454,975 1,900,160,265 1,934,316,924 1,963,360,891 1,972,546,971 1,974,770,798 Total 1,852,578,466 1,885,845,581 1,927,726,477 1,964,976,799 1,995,161,061 2,007,435,990 2,014,540,601 Underlying Loan Characteristics Number of Loans 34,804 35,401 36,100 36,768 37,487 38,069 38,560 Total Principal Balance 1,852,578,466 1,885,845,581 1,927,726,477 1,964,976,799 1,995,161,061 2,007,435,990 2,014,540,601 Average Loan Size 53,229 53,271 53,400 53,443 53,223 52,732 52,244 Year 2009 Origination 3% 2% 1% 0% 0% 0% 0% Year 2008 Origination 8% 8% 8% 10% 9% 7% 5% Year 2007 Origination 13% 13% 14% 14% 14% 14% 14% Year 2006 Origination 12% 12% 12% 12% 12% 12% 12% Year 2005 Origination 9% 9% 9% 9% 9% 9% 10% Year 2004 Origination and earlier 56% 56% 57% 56% 56% 58% 59% State TX 34% 34% 34% 33% 33% 33% 33% MS 15% 15% 15% 15% 15% 15% 15% AL 9% 9% 9% 9% 9% 9% 9% LA 7% 7% 7% 7% 6% 6% 6% FL 6% 6% 6% 6% 6% 6% 6% Other States 29% 29% 29% 30% 30% 30% 30% Current Delinquency Status Current 94.5% 94.9% 95.5% 94.8% 95.1% 96.0% 96.4% 30 1.6% 1.6% 1.1% 1.6% 1.7% 1.5% 1.1% 60 0.8% 0.8% 0.4% 0.7% 0.7% 0.5% 0.4% 90 0.5% 0.4% 0.4% 0.7% 0.5% 0.4% 0.3% 120+ 2.7% 2.3% 2.5% 2.3% 2.0% 1.6% 1.7% Loan Status Active 90.3% 90.9% 91.0% 91.2% 92.1% 92.4% 92.5% Bankruptcy 6.4% 6.4% 6.0% 5.8% 5.6% 5.6% 5.5% Foreclosure 3.0% 2.6% 2.9% 2.8% 2.1% 1.7% 1.7% Litigation 0.2% 0.1% 0.1% 0.1% 0.1% 0.2% 0.2% Total Fire Loss 0.1% 0.1% 0.1% 0.1% 0.1% 0.1% 0.1% Real Estate Owned # of Accounts 921 918 846 824 706 701 698 $ 56,745,020 55,845,767 50,880,119 48,198,486 41,326,618 42,574,935 40,326,085 0-3 months 34.3% 37.1% 36.5% 45.7% 45.5% 48.9% 56.9% 4-6 months 17.4% 17.3% 18.9% 16.0% 18.8% 19.1% 17.6% 7-9 months 12.6% 14.8% 11.9% 13.3% 12.5% 13.8% 8.3% 10-12 months 11.7% 8.2% 9.4% 9.4% 9.8% 5.9% 5.5% over 12 months 24.0% 22.6% 23.3% 15.6% 13.3% 12.3% 11.6% Weighted Average Original LTV 89% 89% 89% 89% 89% 89% 89% Original LTV: 0-70 2% 2% 2% 2% 2% 2% 2% Original LTV: 70.01 - 80 3% 3% 3% 3% 3% 3% 3% Original LTV: 80.01 - 90 70% 69% 69% 69% 70% 71% 72% Original LTV: 90.01 - 100 26% 26% 26% 26% 25% 25% 24% Weighted Average FICO 581 581 579 579 579 580 581 FICO: <=600 51% 51% 52% 51% 50% 49% 48% FICO: 601 - 640 12% 12% 11% 11% 11% 11% 11% FICO: 641 - 680 8% 9% 8% 8% 8% 8% 7% FICO: 681 - 720 4% 5% 5% 5% 5% 5% 5% FICO: 721 - 760 3% 2% 2% 2% 2% 2% 2% FICO: 761 - 800 2% 2% 2% 2% 2% 2% 2% FICO: >=801 1% 1% 1% 1% 1% 1% 1% Unknown** 19% 18% 19% 20% 21% 22% 24% New Sale/Resale Customer New Sale 85% 85% 86% 86% 86% 87% 87% Resale 15% 15% 14% 14% 14% 13% 13% Table 5: Total Portfolio Characteristics (Unaudited) |
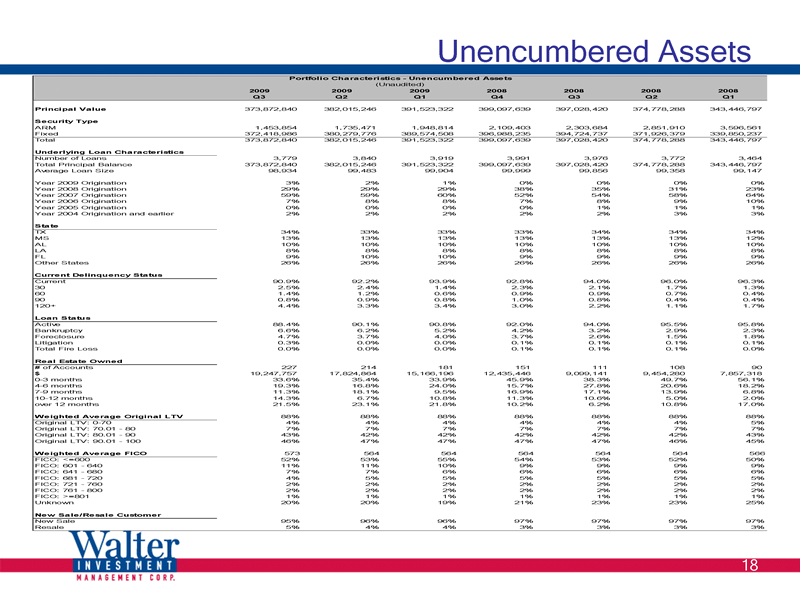
| Unencumbered Assets 2009 2009 2009 2008 2008 2008 2008 Q3 Q2 Q1 Q4 Q3 Q2 Q1 Principal Value 373,872,840 382,015,246 391,523,322 399,097,639 397,028,420 374,778,288 343,446,797 Security Type ARM 1,453,854 1,735,471 1,948,814 2,109,403 2,303,684 2,851,910 3,596,561 Fixed 372,418,986 380,279,776 389,574,508 396,988,235 394,724,737 371,926,379 339,850,237 Total 373,872,840 382,015,246 391,523,322 399,097,639 397,028,420 374,778,288 343,446,797 Underlying Loan Characteristics Number of Loans 3,779 3,840 3,919 3,991 3,976 3,772 3,464 Total Principal Balance 373,872,840 382,015,246 391,523,322 399,097,639 397,028,420 374,778,288 343,446,797 Average Loan Size 98,934 99,483 99,904 99,999 99,856 99,358 99,147 Year 2009 Origination 3% 2% 1% 0% 0% 0% 0% Year 2008 Origination 29% 29% 29% 38% 35% 31% 23% Year 2007 Origination 59% 59% 60% 52% 54% 58% 64% Year 2006 Origination 7% 8% 8% 7% 8% 9% 10% Year 2005 Origination 0% 0% 0% 0% 1% 1% 1% Year 2004 Origination and earlier 2% 2% 2% 2% 2% 3% 3% State TX 34% 33% 33% 33% 34% 34% 34% MS 13% 13% 13% 13% 13% 13% 12% AL 10% 10% 10% 10% 10% 10% 10% LA 8% 8% 8% 8% 8% 8% 8% FL 9% 10% 10% 9% 9% 9% 9% Other States 26% 26% 26% 26% 26% 26% 26% Current Delinquency Status Current 90.9% 92.2% 93.9% 92.8% 94.0% 96.0% 96.3% 30 2.5% 2.4% 1.4% 2.3% 2.1% 1.7% 1.3% 60 1.4% 1.2% 0.6% 0.9% 0.9% 0.7% 0.4% 90 0.8% 0.9% 0.8% 1.0% 0.8% 0.4% 0.4% 120+ 4.4% 3.3% 3.4% 3.0% 2.2% 1.1% 1.7% Loan Status Active 88.4% 90.1% 90.8% 92.0% 94.0% 95.5% 95.8% Bankruptcy 6.6% 6.2% 5.2% 4.2% 3.2% 2.9% 2.3% Foreclosure 4.7% 3.7% 4.0% 3.7% 2.6% 1.5% 1.8% Litigation 0.3% 0.0% 0.0% 0.1% 0.1% 0.1% 0.1% Total Fire Loss 0.0% 0.0% 0.0% 0.1% 0.1% 0.1% 0.0% Real Estate Owned # of Accounts 227 214 181 151 111 108 90 $ 19,247,757 17,824,864 15,166,196 12,435,446 9,099,141 9,454,280 7,857,318 0-3 months 33.6% 35.4% 33.9% 45.9% 38.3% 49.7% 56.1% 4-6 months 19.3% 16.8% 24.0% 15.7% 27.8% 20.6% 18.2% 7-9 months 11.3% 18.1% 9.5% 16.9% 17.1% 13.9% 6.8% 10-12 months 14.3% 6.7% 10.8% 11.3% 10.6% 5.0% 2.0% over 12 months 21.5% 23.1% 21.8% 10.2% 6.2% 10.8% 17.0% Weighted Average Original LTV 88% 88% 88% 88% 88% 88% 88% Original LTV: 0-70 4% 4% 4% 4% 4% 4% 5% Original LTV: 70.01 - 80 7% 7% 7% 7% 7% 7% 7% Original LTV: 80.01 - 90 43% 42% 42% 42% 42% 42% 43% Original LTV: 90.01 - 100 46% 47% 47% 47% 47% 46% 45% Weighted Average FICO 573 564 564 564 564 564 566 FICO: <=600 52% 53% 55% 54% 53% 52% 50% FICO: 601 - 640 11% 11% 10% 9% 9% 9% 9% FICO: 641 - 680 7% 7% 6% 6% 6% 6% 6% FICO: 681 - 720 4% 5% 5% 5% 5% 5% 5% FICO: 721 - 760 2% 2% 2% 2% 2% 2% 2% FICO: 761 - 800 2% 2% 2% 2% 2% 2% 2% FICO: >=801 1% 1% 1% 1% 1% 1% 1% Unknown 20% 20% 19% 21% 23% 23% 25% New Sale/Resale Customer New Sale 95% 96% 96% 97% 97% 97% 97% Resale 5% 4% 4% 3% 3% 3% 3% Table 5a: Portfolio Characteristics - Unencumbered Assets (Unaudited) |
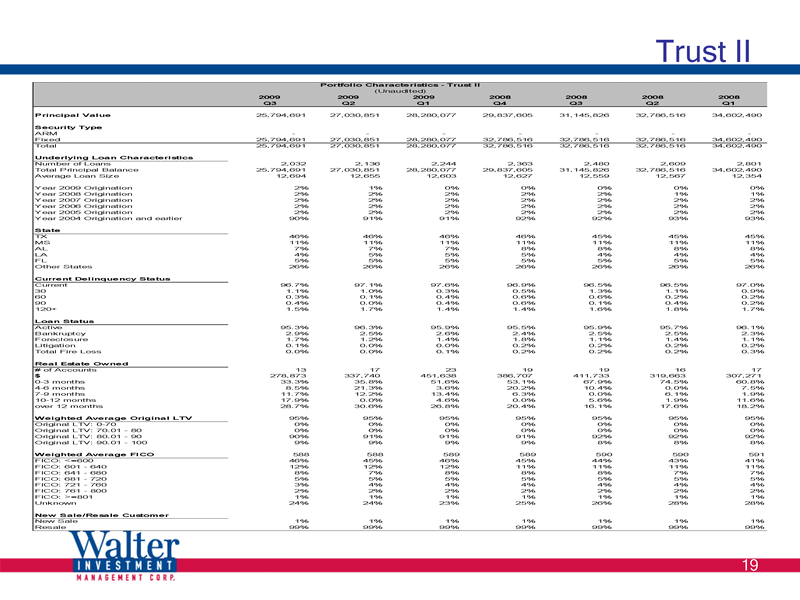
| Trust II 2009 2009 2009 2008 2008 2008 2008 Q3 Q2 Q1 Q4 Q3 Q2 Q1 Principal Value 25,794,691 27,030,851 28,280,077 29,837,605 31,145,826 32,786,516 34,602,490 Security Type ARM - - - - - - - Fixed 25,794,691 27,030,851 28,280,077 32,786,516 32,786,516 32,786,516 34,602,490 Total 25,794,691 27,030,851 28,280,077 32,786,516 32,786,516 32,786,516 34,602,490 Underlying Loan Characteristics Number of Loans 2,032 2,136 2,244 2,363 2,480 2,609 2,801 Total Principal Balance 25,794,691 27,030,851 28,280,077 29,837,605 31,145,826 32,786,516 34,602,490 Average Loan Size 12,694 12,655 12,603 12,627 12,559 12,567 12,354 Year 2009 Origination 2% 1% 0% 0% 0% 0% 0% Year 2008 Origination 2% 2% 2% 2% 2% 1% 1% Year 2007 Origination 2% 2% 2% 2% 2% 2% 2% Year 2006 Origination 2% 2% 2% 2% 2% 2% 2% Year 2005 Origination 2% 2% 2% 2% 2% 2% 2% Year 2004 Origination and earlier 90% 91% 91% 92% 92% 93% 93% State TX 46% 46% 46% 46% 45% 45% 45% MS 11% 11% 11% 11% 11% 11% 11% AL 7% 7% 7% 8% 8% 8% 8% LA 4% 5% 5% 5% 4% 4% 4% FL 5% 5% 5% 5% 5% 5% 5% Other States 26% 26% 26% 26% 26% 26% 26% Current Delinquency Status Current 96.7% 97.1% 97.6% 96.9% 96.5% 96.5% 97.0% 30 1.1% 1.0% 0.3% 0.5% 1.3% 1.1% 0.9% 60 0.3% 0.1% 0.4% 0.6% 0.6% 0.2% 0.2% 90 0.4% 0.0% 0.4% 0.6% 0.1% 0.4% 0.2% 120+ 1.5% 1.7% 1.4% 1.4% 1.6% 1.8% 1.7% Loan Status Active 95.3% 96.3% 95.9% 95.5% 95.9% 95.7% 96.1% Bankruptcy 2.9% 2.5% 2.6% 2.4% 2.5% 2.5% 2.3% Foreclosure 1.7% 1.2% 1.4% 1.8% 1.1% 1.4% 1.1% Litigation 0.1% 0.0% 0.0% 0.2% 0.2% 0.2% 0.2% Total Fire Loss 0.0% 0.0% 0.1% 0.2% 0.2% 0.2% 0.3% Real Estate Owned # of Accounts 13 17 23 19 19 16 17 $ 278,873 337,740 451,638 386,707 411,733 319,663 307,271 0-3 months 33.3% 35.8% 51.6% 53.1% 67.9% 74.5% 60.8% 4-6 months 8.5% 21.3% 3.6% 20.2% 10.4% 0.0% 7.5% 7-9 months 11.7% 12.2% 13.4% 6.3% 0.0% 6.1% 1.9% 10-12 months 17.9% 0.0% 4.6% 0.0% 5.6% 1.9% 11.6% over 12 months 28.7% 30.6% 26.8% 20.4% 16.1% 17.6% 18.2% Weighted Average Original LTV 95% 95% 95% 95% 95% 95% 95% Original LTV: 0-70 0% 0% 0% 0% 0% 0% 0% Original LTV: 70.01 - 80 0% 0% 0% 0% 0% 0% 0% Original LTV: 80.01 - 90 90% 91% 91% 91% 92% 92% 92% Original LTV: 90.01 - 100 9% 9% 9% 9% 8% 8% 8% Weighted Average FICO 588 588 589 589 590 590 591 FICO: <=600 46% 45% 46% 45% 44% 43% 41% FICO: 601 - 640 12% 12% 12% 11% 11% 11% 11% FICO: 641 - 680 8% 7% 8% 8% 8% 7% 7% FICO: 681 - 720 5% 5% 5% 5% 5% 5% 5% FICO: 721 - 760 3% 4% 4% 4% 4% 4% 4% FICO: 761 - 800 2% 2% 2% 2% 2% 2% 2% FICO: >=801 1% 1% 1% 1% 1% 1% 1% Unknown 24% 24% 23% 25% 26% 28% 28% New Sale/Resale Customer New Sale 1% 1% 1% 1% 1% 1% 1% Resale 99% 99% 99% 99% 99% 99% 99% Table 5b: Portfolio Characteristics - Trust II (Unaudited) |
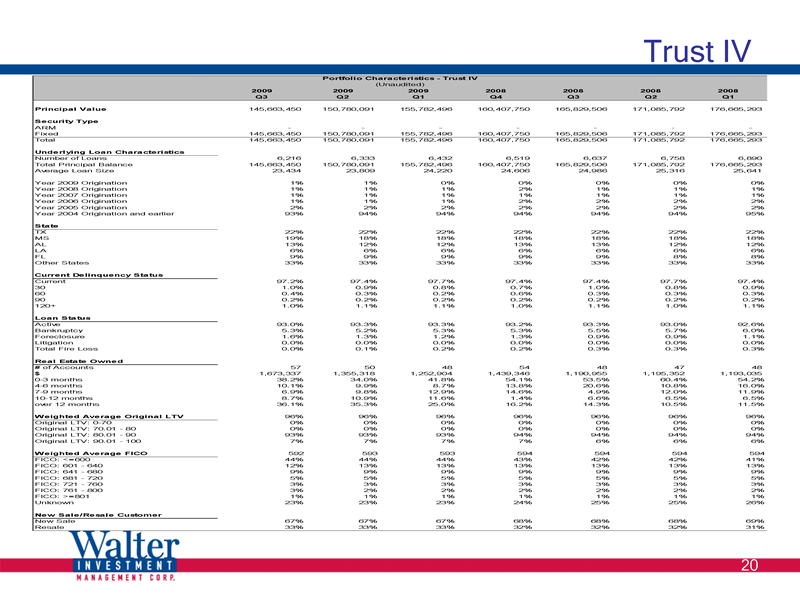
| Trust IV 2009 2009 2009 2008 2008 2008 2008 Q3 Q2 Q1 Q4 Q3 Q2 Q1 Principal Value 145,663,450 150,780,091 155,782,496 160,407,750 165,829,506 171,085,792 176,665,293 Security Type ARM - - - - - - - Fixed 145,663,450 150,780,091 155,782,496 160,407,750 165,829,506 171,085,792 176,665,293 Total 145,663,450 150,780,091 155,782,496 160,407,750 165,829,506 171,085,792 176,665,293 Underlying Loan Characteristics Number of Loans 6,216 6,333 6,432 6,519 6,637 6,758 6,890 Total Principal Balance 145,663,450 150,780,091 155,782,496 160,407,750 165,829,506 171,085,792 176,665,293 Average Loan Size 23,434 23,809 24,220 24,606 24,986 25,316 25,641 Year 2009 Origination 1% 1% 0% 0% 0% 0% 0% Year 2008 Origination 1% 1% 1% 2% 1% 1% 1% Year 2007 Origination 1% 1% 1% 1% 1% 1% 1% Year 2006 Origination 1% 1% 1% 2% 2% 2% 2% Year 2005 Origination 2% 2% 2% 2% 2% 2% 2% Year 2004 Origination and earlier 93% 94% 94% 94% 94% 94% 95% State TX 22% 22% 22% 22% 22% 22% 22% MS 19% 18% 18% 18% 18% 18% 18% AL 13% 12% 12% 13% 13% 12% 12% LA 6% 6% 6% 6% 6% 6% 6% FL 9% 9% 9% 9% 9% 8% 8% Other States 33% 33% 33% 33% 33% 33% 33% Current Delinquency Status Current 97.2% 97.4% 97.7% 97.4% 97.4% 97.7% 97.4% 30 1.0% 0.9% 0.8% 0.7% 1.0% 0.8% 0.9% 60 0.4% 0.3% 0.2% 0.6% 0.3% 0.3% 0.3% 90 0.2% 0.2% 0.2% 0.2% 0.2% 0.2% 0.2% 120+ 1.0% 1.1% 1.1% 1.0% 1.1% 1.0% 1.1% Loan Status Active 93.0% 93.3% 93.3% 93.2% 93.3% 93.0% 92.6% Bankruptcy 5.3% 5.2% 5.3% 5.3% 5.5% 5.7% 6.0% Foreclosure 1.6% 1.3% 1.2% 1.3% 0.9% 0.9% 1.1% Litigation 0.0% 0.0% 0.0% 0.0% 0.0% 0.0% 0.0% Total Fire Loss 0.0% 0.1% 0.2% 0.2% 0.3% 0.3% 0.3% Real Estate Owned # of Accounts 57 50 48 54 48 47 48 $ 1,673,337 1,355,318 1,252,904 1,439,346 1,190,955 1,195,352 1,193,035 0-3 months 38.2% 34.0% 41.8% 54.1% 53.5% 60.4% 54.2% 4-6 months 10.1% 9.9% 8.7% 13.8% 20.6% 10.8% 16.0% 7-9 months 6.9% 9.8% 12.9% 14.6% 4.9% 12.0% 11.9% 10-12 months 8.7% 10.9% 11.6% 1.4% 6.6% 6.5% 6.5% over 12 months 36.1% 35.3% 25.0% 16.2% 14.3% 10.5% 11.5% Weighted Average Original LTV 96% 96% 96% 96% 96% 96% 96% Original LTV: 0-70 0% 0% 0% 0% 0% 0% 0% Original LTV: 70.01 - 80 0% 0% 0% 0% 0% 0% 0% Original LTV: 80.01 - 90 93% 93% 93% 94% 94% 94% 94% Original LTV: 90.01 - 100 7% 7% 7% 7% 6% 6% 6% Weighted Average FICO 592 593 593 594 594 594 594 FICO: <=600 44% 44% 44% 43% 42% 42% 41% FICO: 601 - 640 12% 13% 13% 13% 13% 13% 13% FICO: 641 - 680 9% 9% 9% 9% 9% 9% 9% FICO: 681 - 720 5% 5% 5% 5% 5% 5% 5% FICO: 721 - 760 3% 3% 3% 3% 3% 3% 3% FICO: 761 - 800 3% 2% 2% 2% 2% 2% 2% FICO: >=801 1% 1% 1% 1% 1% 1% 1% Unknown 23% 23% 23% 24% 25% 25% 26% New Sale/Resale Customer New Sale 67% 67% 67% 68% 68% 68% 69% Resale 33% 33% 33% 32% 32% 32% 31% Table 5c: Portfolio Characteristics - Trust IV (Unaudited) |

| Trust VI 2009 2009 2009 2008 2008 2008 2008 Q3 Q2 Q1 Q4 Q3 Q2 Q1 Principal Value 127,322,957 130,116,606 133,055,053 135,219,533 138,629,354 141,826,998 144,843,391 Security Type ARM - - - - - - - Fixed 127,322,957 130,116,606 133,055,053 135,219,533 138,629,354 141,826,998 144,843,391 Total 127,322,957 130,116,606 133,055,053 135,219,533 138,629,354 141,826,998 144,843,391 Underlying Loan Characteristics Number of Loans 3,610 3,644 3,687 3,716 3,772 3,822 3,867 Total Principal Balance 127,322,957 130,116,606 133,055,053 135,219,533 138,629,354 141,826,998 144,843,391 Average Loan Size 35,270 35,707 36,088 36,388 36,752 37,108 37,456 Year 2009 Origination 2% 1% 1% 0% 0% 0% 0% Year 2008 Origination 2% 2% 2% 2% 2% 1% 1% Year 2007 Origination 1% 1% 1% 1% 1% 2% 2% Year 2006 Origination 2% 2% 2% 2% 2% 2% 2% Year 2005 Origination 1% 2% 2% 2% 2% 2% 2% Year 2004 Origination and earlier 92% 93% 93% 93% 93% 94% 94% State TX 22% 22% 21% 21% 21% 22% 22% MS 18% 18% 18% 18% 18% 18% 18% AL 10% 9% 10% 10% 10% 10% 10% LA 6% 6% 6% 6% 6% 6% 6% FL 6% 6% 6% 6% 6% 6% 6% Other States 39% 39% 39% 39% 39% 39% 39% Current Delinquency Status Current 97.5% 97.4% 97.7% 96.9% 97.5% 97.2% 97.6% 30 0.9% 0.8% 0.5% 1.3% 0.8% 1.3% 0.8% 60 0.3% 0.2% 0.2% 0.4% 0.4% 0.3% 0.4% 90 0.1% 0.3% 0.2% 0.5% 0.3% 0.3% 0.1% 120+ 1.2% 1.3% 1.3% 1.0% 1.1% 0.9% 1.1% Loan Status Active 94.3% 94.0% 93.8% 93.4% 93.5% 93.6% 93.6% Bankruptcy 4.1% 4.6% 4.8% 5.2% 5.2% 5.4% 5.2% Foreclosure 1.4% 1.4% 1.3% 1.3% 1.1% 0.9% 1.1% Litigation 0.1% 0.1% 0.1% 0.1% 0.1% 0.1% 0.1% Total Fire Loss 0.1% 0.0% 0.0% 0.1% 0.1% 0.0% 0.0% Real Estate Owned # of Accounts 53 49 46 50 41 38 41 $ 1,859,035 1,698,177 1,602,918 1,787,546 1,436,254 1,342,940 1,438,725 0-3 months 37.8% 35.1% 43.3% 49.5% 43.7% 49.3% 61.3% 4-6 months 13.8% 14.1% 12.7% 11.2% 23.9% 18.3% 9.9% 7-9 months 11.2% 14.5% 14.7% 19.2% 7.5% 8.4% 10.7% 10-12 months 7.3% 9.4% 9.7% 1.7% 6.0% 7.0% 2.2% over 12 months 30.0% 26.9% 19.6% 18.3% 19.0% 17.0% 15.9% Weighted Average Original LTV 97% 97% 97% 97% 97% 97% 97% Original LTV: 0-70 0% 0% 0% 0% 0% 0% 0% Original LTV: 70.01 - 80 0% 0% 0% 0% 0% 0% 0% Original LTV: 80.01 - 90 92% 92% 92% 93% 93% 93% 93% Original LTV: 90.01 - 100 8% 8% 8% 8% 8% 7% 7% Weighted Average FICO 594 594 594 594 594 595 595 FICO: <=600 45% 45% 45% 44% 44% 43% 42% FICO: 601 - 640 14% 14% 14% 14% 14% 14% 13% FICO: 641 - 680 10% 11% 11% 11% 10% 10% 10% FICO: 681 - 720 5% 5% 5% 5% 5% 5% 5% FICO: 721 - 760 3% 3% 3% 3% 3% 3% 3% FICO: 761 - 800 3% 2% 2% 2% 2% 2% 2% FICO: >=801 1% 1% 1% 1% 1% 1% 1% Unknown 19% 19% 19% 20% 21% 22% 24% New Sale/Resale Customer New Sale 76% 76% 77% 77% 77% 77% 78% Resale 24% 24% 23% 23% 23% 23% 22% Table 5d: Portfolio Characteristics - Trust VI (Unaudited) |
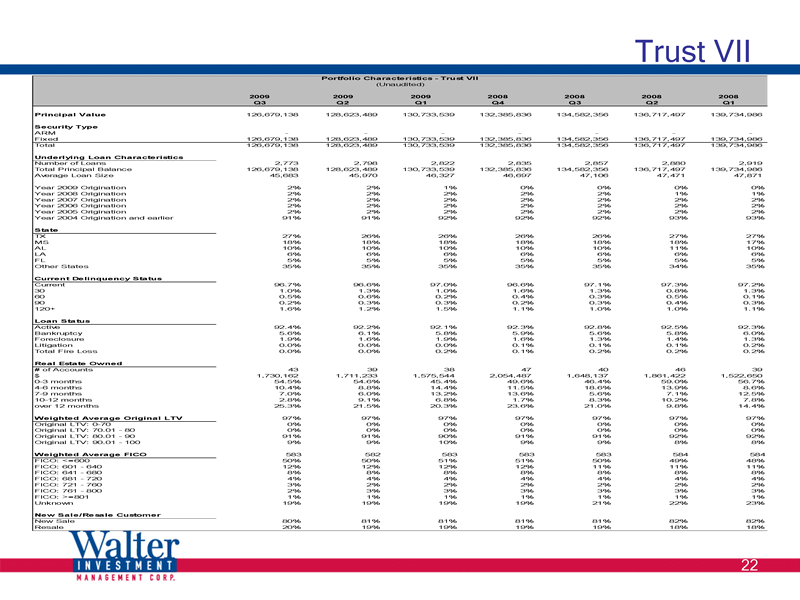
| Trust VII 2009 2009 2009 2008 2008 2008 2008 Q3 Q2 Q1 Q4 Q3 Q2 Q1 Principal Value 126,679,138 128,623,489 130,733,539 132,385,836 134,582,356 136,717,497 139,734,986 Security Type ARM - - - - - - - Fixed 126,679,138 128,623,489 130,733,539 132,385,836 134,582,356 136,717,497 139,734,986 Total 126,679,138 128,623,489 130,733,539 132,385,836 134,582,356 136,717,497 139,734,986 Underlying Loan Characteristics Number of Loans 2,773 2,798 2,822 2,835 2,857 2,880 2,919 Total Principal Balance 126,679,138 128,623,489 130,733,539 132,385,836 134,582,356 136,717,497 139,734,986 Average Loan Size 45,683 45,970 46,327 46,697 47,106 47,471 47,871 Year 2009 Origination 2% 2% 1% 0% 0% 0% 0% Year 2008 Origination 2% 2% 2% 2% 2% 1% 1% Year 2007 Origination 2% 2% 2% 2% 2% 2% 2% Year 2006 Origination 2% 2% 2% 2% 2% 2% 2% Year 2005 Origination 2% 2% 2% 2% 2% 2% 2% Year 2004 Origination and earlier 91% 91% 92% 92% 92% 93% 93% State TX 27% 26% 26% 26% 26% 27% 27% MS 18% 18% 18% 18% 18% 18% 17% AL 10% 10% 10% 10% 10% 11% 10% LA 6% 6% 6% 6% 6% 6% 6% FL 5% 5% 5% 5% 5% 5% 5% Other States 35% 35% 35% 35% 35% 34% 35% Current Delinquency Status Current 96.7% 96.6% 97.0% 96.6% 97.1% 97.3% 97.2% 30 1.0% 1.3% 1.0% 1.6% 1.3% 0.8% 1.3% 60 0.5% 0.6% 0.2% 0.4% 0.3% 0.5% 0.1% 90 0.2% 0.3% 0.3% 0.2% 0.3% 0.4% 0.3% 120+ 1.6% 1.2% 1.5% 1.1% 1.0% 1.0% 1.1% Loan Status Active 92.4% 92.2% 92.1% 92.3% 92.8% 92.5% 92.3% Bankruptcy 5.6% 6.1% 5.8% 5.9% 5.6% 5.8% 6.0% Foreclosure 1.9% 1.6% 1.9% 1.6% 1.3% 1.4% 1.3% Litigation 0.0% 0.0% 0.0% 0.1% 0.1% 0.1% 0.2% Total Fire Loss 0.0% 0.0% 0.2% 0.1% 0.2% 0.2% 0.2% Real Estate Owned # of Accounts 43 39 38 47 40 46 39 $ 1,730,162 1,711,233 1,575,544 2,054,487 1,648,137 1,861,422 1,522,650 0-3 months 54.5% 54.6% 45.4% 49.6% 46.4% 59.0% 56.7% 4-6 months 10.4% 8.8% 14.4% 11.5% 18.6% 13.9% 8.6% 7-9 months 7.0% 6.0% 13.2% 13.6% 5.6% 7.1% 12.5% 10-12 months 2.8% 9.1% 6.8% 1.7% 8.3% 10.2% 7.8% over 12 months 25.3% 21.5% 20.3% 23.6% 21.0% 9.8% 14.4% Weighted Average Original LTV 97% 97% 97% 97% 97% 97% 97% Original LTV: 0-70 0% 0% 0% 0% 0% 0% 0% Original LTV: 70.01 - 80 0% 0% 0% 0% 0% 0% 0% Original LTV: 80.01 - 90 91% 91% 90% 91% 91% 92% 92% Original LTV: 90.01 - 100 9% 9% 10% 9% 9% 8% 8% Weighted Average FICO 583 582 583 583 583 584 584 FICO: <=600 50% 50% 51% 51% 50% 49% 48% FICO: 601 - 640 12% 12% 12% 12% 11% 11% 11% FICO: 641 - 680 8% 8% 8% 8% 8% 8% 8% FICO: 681 - 720 4% 4% 4% 4% 4% 4% 4% FICO: 721 - 760 3% 2% 2% 2% 2% 2% 2% FICO: 761 - 800 2% 3% 3% 3% 3% 3% 3% FICO: >=801 1% 1% 1% 1% 1% 1% 1% Unknown 19% 19% 19% 19% 21% 22% 23% New Sale/Resale Customer New Sale 80% 81% 81% 81% 81% 82% 82% Resale 20% 19% 19% 19% 19% 18% 18% Table 5e: Portfolio Characteristics - Trust VII (Unaudited) |

| Trust VIII 2009 2009 2009 2008 2008 2008 2008 Q3 Q2 Q1 Q4 Q3 Q2 Q1 Principal Value 134,998,550 137,320,786 140,291,846 143,066,059 146,539,135 150,025,994 153,700,278 Security Type ARM - - - - - - - Fixed 134,998,550 137,320,786 140,291,846 143,066,059 146,539,135 150,025,994 153,700,278 Total 134,998,550 137,320,786 140,291,846 143,066,059 146,539,135 150,025,994 153,700,278 Underlying Loan Characteristics Number of Loans 3,246 3,405 3,564 3,776 4,033 4,308 4,490 Total Principal Balance 134,998,550 137,320,786 140,291,846 143,066,059 146,539,135 150,025,994 153,700,278 Average Loan Size 41,589 40,329 39,364 37,888 36,335 34,825 34,232 Year 2009 Origination 2% 2% 1% 0% 0% 0% 0% Year 2008 Origination 2% 2% 2% 3% 2% 2% 1% Year 2007 Origination 2% 3% 3% 2% 3% 3% 3% Year 2006 Origination 2% 2% 2% 2% 3% 3% 3% Year 2005 Origination 2% 2% 2% 2% 2% 2% 2% Year 2004 Origination and earlier 89% 89% 90% 90% 90% 91% 91% State TX 28% 28% 28% 28% 28% 28% 28% MS 19% 18% 19% 19% 19% 19% 19% AL 9% 9% 9% 9% 9% 9% 9% LA 6% 6% 6% 6% 6% 6% 6% FL 5% 5% 5% 5% 5% 5% 5% Other States 34% 34% 34% 34% 34% 34% 34% Current Delinquency Status Current 96.1% 96.5% 97.3% 96.6% 95.7% 97.0% 97.5% 30 1.3% 1.2% 0.6% 1.1% 1.8% 1.3% 0.8% 60 0.5% 0.4% 0.3% 0.4% 0.6% 0.5% 0.5% 90 0.4% 0.4% 0.4% 0.4% 0.4% 0.2% 0.3% 120+ 1.6% 1.5% 1.4% 1.4% 1.4% 0.9% 1.0% Loan Status Active 91.1% 91.3% 91.3% 91.4% 91.4% 91.4% 91.2% Bankruptcy 6.6% 6.6% 6.8% 6.7% 6.8% 7.2% 7.3% Foreclosure 2.1% 1.9% 1.6% 1.7% 1.6% 1.0% 1.3% Litigation 0.1% 0.1% 0.1% 0.1% 0.1% 0.2% 0.2% Total Fire Loss 0.1% 0.1% 0.1% 0.1% 0.1% 0.1% 0.1% Real Estate Owned # of Accounts 50 53 52 54 42 46 57 $ 2,040,360 2,228,341 2,251,670 2,341,730 1,843,813 2,075,044 2,409,407 0-3 months 47.9% 44.8% 34.6% 55.0% 36.2% 48.0% 59.9% 4-6 months 19.1% 13.8% 21.3% 5.3% 18.4% 18.4% 13.2% 7-9 months 5.3% 14.7% 6.0% 13.2% 17.5% 9.3% 2.7% 10-12 months 11.3% 6.3% 6.8% 12.3% 7.2% 3.1% 15.0% over 12 months 16.5% 20.4% 31.3% 14.2% 20.6% 21.2% 9.2% Weighted Average Original LTV 97% 97% 97% 97% 97% 97% 97% Original LTV: 0-70 0% 0% 0% 0% 0% 0% 0% Original LTV: 70.01 - 80 0% 0% 0% 0% 0% 0% 0% Original LTV: 80.01 - 90 88% 88% 88% 89% 89% 89% 90% Original LTV: 90.01 - 100 12% 12% 12% 11% 11% 11% 10% Weighted Average FICO 579 580 580 581 581 581 582 FICO: <=600 51% 51% 51% 50% 49% 49% 47% FICO: 601 - 640 12% 11% 11% 11% 11% 11% 11% FICO: 641 - 680 8% 8% 8% 8% 8% 8% 8% FICO: 681 - 720 4% 5% 5% 5% 5% 5% 5% FICO: 721 - 760 2% 2% 2% 2% 2% 2% 2% FICO: 761 - 800 2% 2% 2% 2% 2% 2% 2% FICO: >=801 1% 1% 1% 1% 1% 1% 1% Unknown 20% 20% 20% 21% 22% 23% 24% New Sale/Resale Customer New Sale 76% 76% 76% 77% 77% 77% 78% Resale 24% 24% 24% 23% 23% 23% 22% Table 5f: Portfolio Characteristics - Trust VIII (Unaudited) |

| Trust X 2009 2009 2009 2008 2008 2008 2008 Q3 Q2 Q1 Q4 Q3 Q2 Q1 Principal Value 195,052,595 197,199,333 201,085,630 202,818,530 206,621,062 210,489,354 213,576,427 Security Type ARM - - - - - - - Fixed 195,052,595 197,199,333 201,085,630 202,818,530 206,621,062 210,489,354 213,576,427 Total 195,052,595 197,199,333 201,085,630 202,818,530 206,621,062 210,489,354 213,576,427 Underlying Loan Characteristics Number of Loans 3,255 3,276 3,325 3,333 3,380 3,424 3,462 Total Principal Balance 195,052,595 197,199,333 201,085,630 202,818,530 206,621,062 210,489,354 213,576,427 Average Loan Size 59,924 60,195 60,477 60,852 61,130 61,475 61,692 Year 2009 Origination 3% 2% 1% 0% 0% 0% 0% Year 2008 Origination 3% 3% 3% 4% 3% 2% 1% Year 2007 Origination 3% 3% 3% 3% 3% 3% 3% Year 2006 Origination 2% 2% 2% 3% 3% 3% 3% Year 2005 Origination 2% 2% 2% 2% 2% 2% 3% Year 2004 Origination and earlier 87% 88% 88% 88% 89% 89% 90% State TX 33% 33% 32% 32% 32% 32% 32% MS 18% 18% 18% 18% 18% 18% 18% AL 7% 7% 7% 7% 7% 7% 7% LA 7% 7% 7% 7% 7% 7% 7% FL 4% 4% 4% 4% 4% 4% 5% Other States 32% 31% 32% 32% 32% 32% 31% Current Delinquency Status Current 95.0% 95.7% 95.6% 95.0% 94.6% 95.1% 96.4% 30 1.6% 1.3% 1.0% 1.3% 1.8% 1.6% 1.0% 60 0.7% 0.6% 0.4% 0.6% 0.8% 0.7% 0.4% 90 0.3% 0.2% 0.3% 0.7% 0.4% 0.4% 0.3% 120+ 2.4% 2.1% 2.6% 2.4% 2.4% 2.1% 2.0% Loan Status Active 89.3% 89.6% 89.1% 89.1% 89.5% 89.1% 89.3% Bankruptcy 7.9% 8.0% 7.9% 8.1% 7.9% 8.4% 8.6% Foreclosure 2.4% 2.1% 2.6% 2.3% 2.2% 2.0% 1.6% Litigation 0.2% 0.1% 0.2% 0.2% 0.2% 0.3% 0.3% Total Fire Loss 0.1% 0.1% 0.2% 0.2% 0.2% 0.2% 0.2% Real Estate Owned # of Accounts 107 107 84 96 78 72 82 $ 5,062,602 5,001,602 3,994,538 4,612,940 3,840,873 3,369,570 3,924,823 0-3 months 39.6% 40.4% 32.9% 52.4% 55.0% 45.0% 60.8% 4-6 months 15.1% 18.0% 22.4% 15.3% 12.9% 17.1% 15.3% 7-9 months 11.6% 14.4% 14.6% 10.9% 5.6% 15.9% 7.0% 10-12 months 9.0% 7.2% 5.2% 2.3% 11.7% 3.7% 3.8% over 12 months 24.6% 19.9% 24.9% 19.1% 14.8% 18.4% 13.0% Weighted Average Original LTV 97% 97% 97% 97% 97% 97% 97% Original LTV: 0-70 0% 0% 0% 0% 0% 0% 0% Original LTV: 70.01 - 80 0% 0% 0% 0% 0% 0% 0% Original LTV: 80.01 - 90 88% 87% 87% 87% 88% 88% 89% Original LTV: 90.01 - 100 12% 13% 13% 12% 12% 12% 11% Weighted Average FICO 573 573 573 573 573 573 574 FICO: <=600 53% 53% 53% 53% 53% 51% 51% FICO: 601 - 640 13% 13% 13% 13% 13% 13% 13% FICO: 641 - 680 7% 8% 8% 8% 8% 7% 7% FICO: 681 - 720 3% 3% 3% 3% 3% 3% 3% FICO: 721 - 760 2% 2% 2% 2% 2% 2% 2% FICO: 761 - 800 1% 2% 2% 2% 2% 2% 2% FICO: >=801 0% 0% 0% 0% 0% 0% 0% Unknown 20% 18% 18% 18% 18% 21% 21% New Sale/Resale Customer New Sale 82% 83% 83% 84% 84% 84% 85% Resale 18% 17% 17% 16% 16% 16% 15% Table 5g: Portfolio Characteristics - Trust X (Unaudited) |
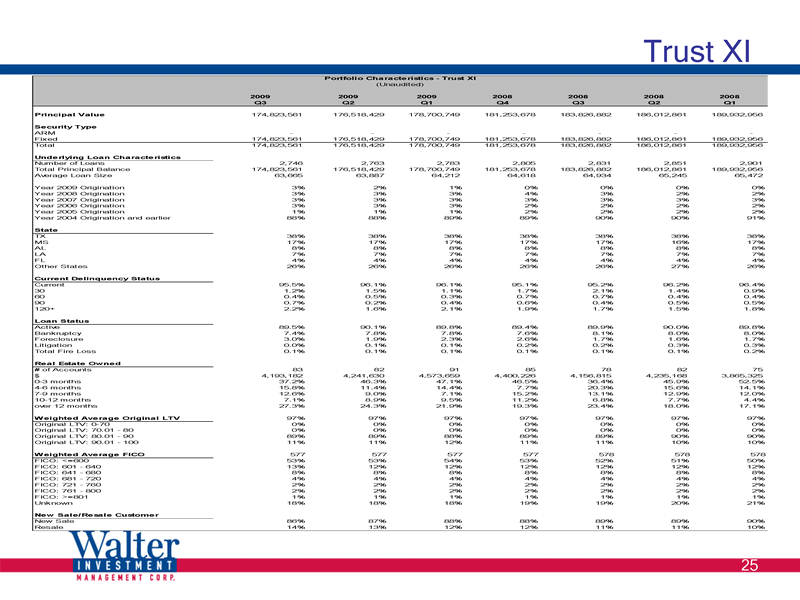
| Trust XI 2009 2009 2009 2008 2008 2008 2008 Q3 Q2 Q1 Q4 Q3 Q2 Q1 Principal Value 174,823,561 176,518,429 178,700,749 181,253,678 183,826,882 186,012,861 189,932,956 Security Type ARM - - - - - - - Fixed 174,823,561 176,518,429 178,700,749 181,253,678 183,826,882 186,012,861 189,932,956 Total 174,823,561 176,518,429 178,700,749 181,253,678 183,826,882 186,012,861 189,932,956 Underlying Loan Characteristics Number of Loans 2,746 2,763 2,783 2,805 2,831 2,851 2,901 Total Principal Balance 174,823,561 176,518,429 178,700,749 181,253,678 183,826,882 186,012,861 189,932,956 Average Loan Size 63,665 63,887 64,212 64,618 64,934 65,245 65,472 Year 2009 Origination 3% 2% 1% 0% 0% 0% 0% Year 2008 Origination 3% 3% 3% 4% 3% 2% 2% Year 2007 Origination 3% 3% 3% 3% 3% 3% 3% Year 2006 Origination 3% 3% 3% 2% 2% 2% 2% Year 2005 Origination 1% 1% 1% 2% 2% 2% 2% Year 2004 Origination and earlier 88% 88% 89% 89% 90% 90% 91% State TX 38% 38% 38% 38% 38% 38% 38% MS 17% 17% 17% 17% 17% 16% 17% AL 8% 8% 8% 8% 8% 8% 8% LA 7% 7% 7% 7% 7% 7% 7% FL 4% 4% 4% 4% 4% 4% 4% Other States 26% 26% 26% 26% 26% 27% 26% Current Delinquency Status Current 95.5% 96.1% 96.1% 95.1% 95.2% 96.2% 96.4% 30 1.2% 1.5% 1.1% 1.7% 2.1% 1.4% 0.9% 60 0.4% 0.5% 0.3% 0.7% 0.7% 0.4% 0.4% 90 0.7% 0.2% 0.4% 0.6% 0.4% 0.5% 0.5% 120+ 2.2% 1.6% 2.1% 1.9% 1.7% 1.5% 1.8% Loan Status Active 89.5% 90.1% 89.8% 89.4% 89.9% 90.0% 89.8% Bankruptcy 7.4% 7.8% 7.8% 7.6% 8.1% 8.0% 8.0% Foreclosure 3.0% 1.9% 2.3% 2.6% 1.7% 1.6% 1.7% Litigation 0.0% 0.1% 0.1% 0.2% 0.2% 0.3% 0.3% Total Fire Loss 0.1% 0.1% 0.1% 0.1% 0.1% 0.1% 0.2% Real Estate Owned # of Accounts 83 82 91 85 78 82 75 $ 4,193,182 4,241,630 4,573,659 4,400,226 4,156,815 4,235,168 3,865,325 0-3 months 37.2% 46.3% 47.1% 46.5% 36.4% 45.9% 52.5% 4-6 months 15.8% 11.4% 14.4% 7.7% 20.3% 15.6% 14.1% 7-9 months 12.6% 9.0% 7.1% 15.2% 13.1% 12.9% 12.0% 10-12 months 7.1% 8.9% 9.5% 11.2% 6.8% 7.7% 4.4% over 12 months 27.3% 24.3% 21.9% 19.3% 23.4% 18.0% 17.1% Weighted Average Original LTV 97% 97% 97% 97% 97% 97% 97% Original LTV: 0-70 0% 0% 0% 0% 0% 0% 0% Original LTV: 70.01 - 80 0% 0% 0% 0% 0% 0% 0% Original LTV: 80.01 - 90 89% 89% 88% 89% 89% 90% 90% Original LTV: 90.01 - 100 11% 11% 12% 11% 11% 10% 10% Weighted Average FICO 577 577 577 577 578 578 578 FICO: <=600 53% 53% 54% 53% 52% 51% 50% FICO: 601 - 640 13% 12% 12% 12% 12% 12% 12% FICO: 641 - 680 8% 8% 8% 8% 8% 8% 8% FICO: 681 - 720 4% 4% 4% 4% 4% 4% 4% FICO: 721 - 760 2% 2% 2% 2% 2% 2% 2% FICO: 761 - 800 2% 2% 2% 2% 2% 2% 2% FICO: >=801 1% 1% 1% 1% 1% 1% 1% Unknown 18% 18% 18% 19% 19% 20% 21% New Sale/Resale Customer New Sale 86% 87% 88% 88% 89% 89% 90% Resale 14% 13% 12% 12% 11% 11% 10% Table 5h: Portfolio Characteristics - Trust XI (Unaudited) |
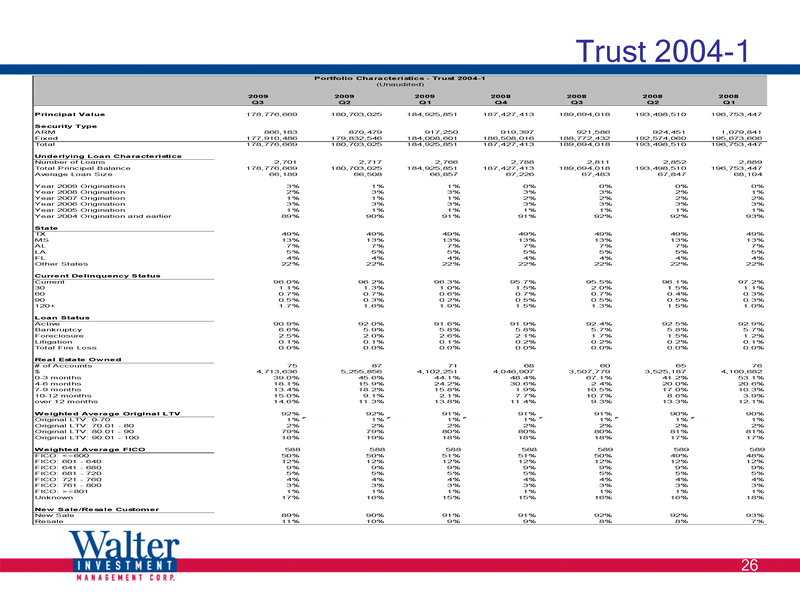
| Trust 2004-1 2009 2009 2009 2008 2008 2008 2008 Q3 Q2 Q1 Q4 Q3 Q2 Q1 Principal Value 178,776,669 180,703,025 184,925,851 187,427,413 189,694,018 193,498,510 196,753,447 Security Type ARM 866,183 870,479 917,250 919,397 921,586 924,451 1,079,841 Fixed 177,910,486 179,832,546 184,008,601 186,508,016 188,772,432 192,574,060 195,673,606 Total 178,776,669 180,703,025 184,925,851 187,427,413 189,694,018 193,498,510 196,753,447 Underlying Loan Characteristics Number of Loans 2,701 2,717 2,766 2,788 2,811 2,852 2,889 Total Principal Balance 178,776,669 180,703,025 184,925,851 187,427,413 189,694,018 193,498,510 196,753,447 Average Loan Size 66,189 66,508 66,857 67,226 67,483 67,847 68,104 Year 2009 Origination 3% 1% 1% 0% 0% 0% 0% Year 2008 Origination 2% 3% 3% 3% 3% 2% 1% Year 2007 Origination 1% 1% 1% 2% 2% 2% 2% Year 2006 Origination 3% 3% 3% 3% 3% 3% 3% Year 2005 Origination 1% 1% 1% 1% 1% 1% 1% Year 2004 Origination and earlier 89% 90% 91% 91% 92% 92% 93% State TX 49% 49% 49% 49% 49% 49% 49% MS 13% 13% 13% 13% 13% 13% 13% AL 7% 7% 7% 7% 7% 7% 7% LA 5% 5% 5% 5% 5% 5% 5% FL 4% 4% 4% 4% 4% 4% 4% Other States 22% 22% 22% 22% 22% 22% 22% Current Delinquency Status Current 96.0% 96.2% 96.3% 95.7% 95.5% 96.1% 97.2% 30 1.1% 1.3% 1.0% 1.5% 2.0% 1.5% 1.1% 60 0.7% 0.7% 0.6% 0.7% 0.7% 0.4% 0.3% 90 0.5% 0.3% 0.2% 0.5% 0.5% 0.5% 0.3% 120+ 1.7% 1.6% 1.9% 1.5% 1.3% 1.5% 1.0% Loan Status Active 90.9% 92.0% 91.6% 91.9% 92.4% 92.5% 92.9% Bankruptcy 6.6% 5.9% 5.8% 5.8% 5.7% 5.8% 5.7% Foreclosure 2.5% 2.0% 2.6% 2.1% 1.7% 1.5% 1.2% Litigation 0.1% 0.1% 0.1% 0.2% 0.2% 0.2% 0.1% Total Fire Loss 0.0% 0.0% 0.0% 0.0% 0.0% 0.0% 0.0% Real Estate Owned # of Accounts 75 87 71 68 60 65 76 $ 4,713,636 5,255,856 4,102,251 4,046,907 3,507,779 3,525,187 4,160,682 0-3 months 39.0% 45.6% 44.1% 48.4% 67.1% 41.2% 53.1% 4-6 months 18.1% 15.9% 24.2% 30.6% 2.4% 20.0% 20.6% 7-9 months 13.4% 18.2% 15.8% 1.9% 10.5% 17.0% 10.3% 10-12 months 15.0% 9.1% 2.1% 7.7% 10.7% 8.6% 3.9% over 12 months 14.6% 11.3% 13.8% 11.4% 9.3% 13.3% 12.1% Weighted Average Original LTV 92% 92% 91% 91% 91% 90% 90% Original LTV: 0-70 1% 1% 1% 1% 1% 1% 1% Original LTV: 70.01 - 80 2% 2% 2% 2% 2% 2% 2% Original LTV: 80.01 - 90 79% 79% 80% 80% 80% 81% 81% Original LTV: 90.01 - 100 18% 19% 18% 18% 18% 17% 17% Weighted Average FICO 588 588 588 588 589 589 589 FICO: <=600 50% 50% 51% 51% 50% 49% 48% FICO: 601 - 640 12% 12% 12% 12% 12% 12% 12% FICO: 641 - 680 9% 9% 9% 9% 9% 9% 9% FICO: 681 - 720 5% 5% 5% 5% 5% 5% 5% FICO: 721 - 760 4% 4% 4% 4% 4% 4% 4% FICO: 761 - 800 3% 3% 3% 3% 3% 3% 3% FICO: >=801 1% 1% 1% 1% 1% 1% 1% Unknown 17% 16% 15% 15% 16% 16% 18% New Sale/Resale Customer New Sale 89% 90% 91% 91% 92% 92% 93% Resale 11% 10% 9% 9% 8% 8% 7% Table 5i: Portfolio Characteristics - Trust 2004-1 (Unaudited) |
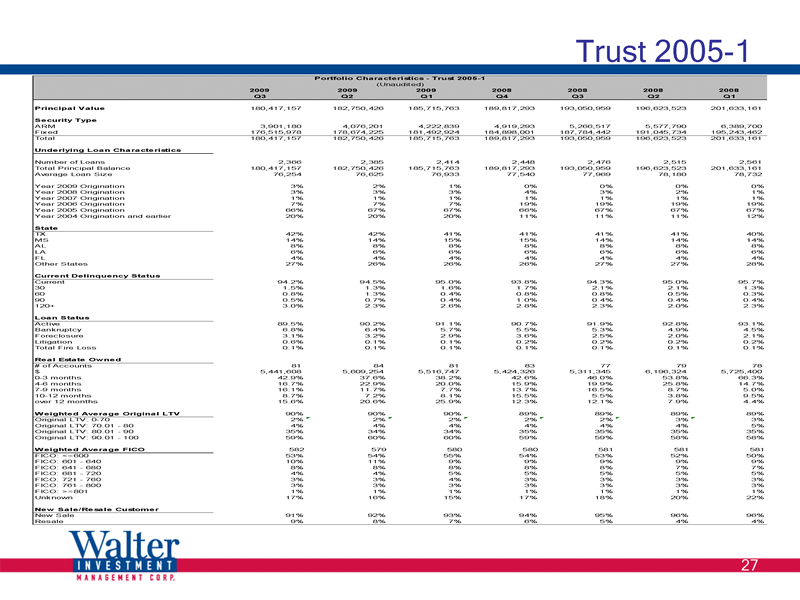
| Trust 2005-1 2009 2009 2009 2008 2008 2008 2008 Q3 Q2 Q1 Q4 Q3 Q2 Q1 Principal Value 180,417,157 182,750,426 185,715,763 189,817,293 193,050,959 196,623,523 201,633,161 Security Type ARM 3,901,180 4,076,201 4,222,839 4,919,293 5,266,517 5,577,790 6,389,700 Fixed 176,515,978 178,674,225 181,492,924 184,898,001 187,784,442 191,045,734 195,243,462 Total 180,417,157 182,750,426 185,715,763 189,817,293 193,050,959 196,623,523 201,633,161 Underlying Loan Characteristics Number of Loans 2,366 2,385 2,414 2,448 2,476 2,515 2,561 Total Principal Balance 180,417,157 182,750,426 185,715,763 189,817,293 193,050,959 196,623,523 201,633,161 Average Loan Size 76,254 76,625 76,933 77,540 77,969 78,180 78,732 Year 2009 Origination 3% 2% 1% 0% 0% 0% 0% Year 2008 Origination 3% 3% 3% 4% 3% 2% 1% Year 2007 Origination 1% 1% 1% 1% 1% 1% 1% Year 2006 Origination 7% 7% 7% 19% 19% 19% 19% Year 2005 Origination 66% 67% 67% 66% 67% 67% 67% Year 2004 Origination and earlier 20% 20% 20% 11% 11% 11% 12% State TX 42% 42% 41% 41% 41% 41% 40% MS 14% 14% 15% 15% 14% 14% 14% AL 8% 8% 8% 8% 8% 8% 8% LA 6% 6% 6% 6% 6% 6% 6% FL 4% 4% 4% 4% 4% 4% 4% Other States 27% 26% 26% 26% 27% 27% 28% Current Delinquency Status Current 94.2% 94.5% 95.0% 93.8% 94.3% 95.0% 95.7% 30 1.5% 1.3% 1.6% 1.7% 2.1% 2.1% 1.3% 60 0.8% 1.3% 0.4% 0.8% 0.8% 0.5% 0.3% 90 0.5% 0.7% 0.4% 1.0% 0.4% 0.4% 0.4% 120+ 3.0% 2.3% 2.6% 2.8% 2.3% 2.0% 2.3% Loan Status Active 89.5% 90.2% 91.1% 90.7% 91.9% 92.8% 93.1% Bankruptcy 6.8% 6.4% 5.7% 5.5% 5.3% 4.9% 4.5% Foreclosure 3.1% 3.2% 2.9% 3.6% 2.5% 2.0% 2.1% Litigation 0.6% 0.1% 0.1% 0.2% 0.2% 0.2% 0.2% Total Fire Loss 0.1% 0.1% 0.1% 0.1% 0.1% 0.1% 0.1% Real Estate Owned # of Accounts 81 84 81 83 77 79 78 $ 5,441,608 5,609,254 5,516,747 5,424,326 5,311,345 6,196,324 5,725,400 0-3 months 42.9% 37.6% 38.2% 42.6% 46.0% 53.8% 66.3% 4-6 months 16.7% 22.9% 20.0% 15.9% 19.9% 25.8% 14.7% 7-9 months 16.1% 11.7% 7.7% 13.7% 16.5% 8.7% 5.0% 10-12 months 8.7% 7.2% 8.1% 15.5% 5.5% 3.8% 9.5% over 12 months 15.6% 20.6% 25.9% 12.3% 12.1% 7.9% 4.4% Weighted Average Original LTV 90% 90% 90% 89% 89% 89% 89% Original LTV: 0-70 2% 2% 2% 2% 2% 3% 3% Original LTV: 70.01 - 80 4% 4% 4% 4% 4% 4% 5% Original LTV: 80.01 - 90 35% 34% 34% 35% 35% 35% 35% Original LTV: 90.01 - 100 59% 60% 60% 59% 59% 58% 58% Weighted Average FICO 582 579 580 580 581 581 581 FICO: <=600 53% 54% 55% 54% 53% 52% 50% FICO: 601 - 640 10% 11% 9% 9% 9% 9% 9% FICO: 641 - 680 8% 8% 8% 8% 8% 7% 7% FICO: 681 - 720 4% 4% 5% 5% 5% 5% 5% FICO: 721 - 760 3% 3% 4% 3% 3% 3% 3% FICO: 761 - 800 3% 3% 3% 3% 3% 3% 3% FICO: >=801 1% 1% 1% 1% 1% 1% 1% Unknown 17% 16% 15% 17% 18% 20% 22% New Sale/Resale Customer New Sale 91% 92% 93% 94% 95% 96% 96% Resale 9% 8% 7% 6% 5% 4% 4% Table 5j: Portfolio Characteristics - Trust 2005-1 (Unaudited) |
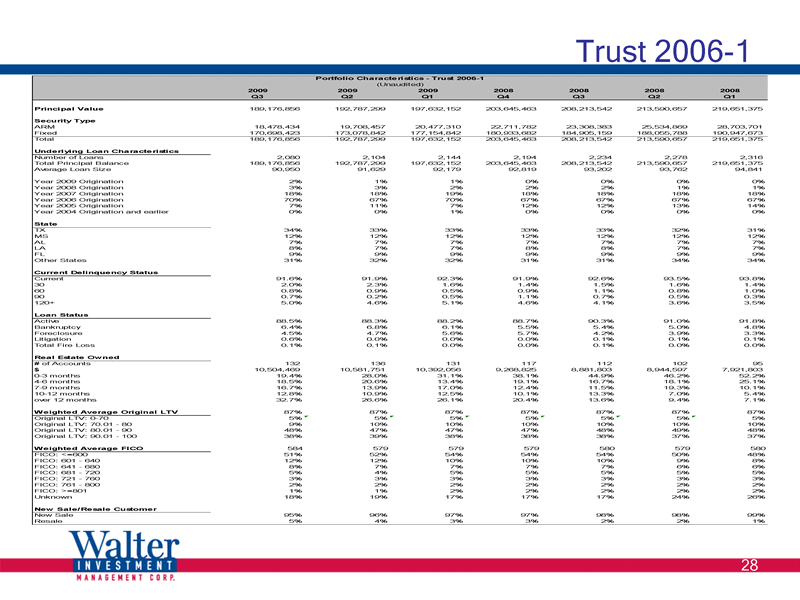
| Trust 2006-1 2009 2009 2009 2008 2008 2008 2008 Q3 Q2 Q1 Q4 Q3 Q2 Q1 Principal Value 189,176,856 192,787,299 197,632,152 203,645,463 208,213,542 213,590,657 219,651,375 Security Type ARM 18,478,434 19,708,457 20,477,310 22,711,782 23,308,383 25,534,869 28,703,701 Fixed 170,698,423 173,078,842 177,154,842 180,933,682 184,905,159 188,055,788 190,947,673 Total 189,176,856 192,787,299 197,632,152 203,645,463 208,213,542 213,590,657 219,651,375 Underlying Loan Characteristics Number of Loans 2,080 2,104 2,144 2,194 2,234 2,278 2,316 Total Principal Balance 189,176,856 192,787,299 197,632,152 203,645,463 208,213,542 213,590,657 219,651,375 Average Loan Size 90,950 91,629 92,179 92,819 93,202 93,762 94,841 Year 2009 Origination 2% 1% 1% 0% 0% 0% 0% Year 2008 Origination 3% 3% 2% 2% 2% 1% 1% Year 2007 Origination 18% 18% 19% 18% 18% 18% 18% Year 2006 Origination 70% 67% 70% 67% 67% 67% 67% Year 2005 Origination 7% 11% 7% 12% 12% 13% 14% Year 2004 Origination and earlier 0% 0% 1% 0% 0% 0% 0% State TX 34% 33% 33% 33% 33% 32% 31% MS 12% 12% 12% 12% 12% 12% 12% AL 7% 7% 7% 7% 7% 7% 7% LA 8% 7% 7% 8% 8% 7% 7% FL 9% 9% 9% 9% 9% 9% 9% Other States 31% 32% 32% 31% 31% 34% 34% Current Delinquency Status Current 91.6% 91.9% 92.3% 91.9% 92.6% 93.5% 93.8% 30 2.0% 2.3% 1.6% 1.4% 1.5% 1.6% 1.4% 60 0.8% 0.9% 0.5% 0.9% 1.1% 0.8% 1.0% 90 0.7% 0.2% 0.5% 1.1% 0.7% 0.5% 0.3% 120+ 5.0% 4.6% 5.1% 4.6% 4.1% 3.6% 3.5% Loan Status Active 88.5% 88.3% 88.2% 88.7% 90.3% 91.0% 91.8% Bankruptcy 6.4% 6.8% 6.1% 5.5% 5.4% 5.0% 4.8% Foreclosure 4.5% 4.7% 5.6% 5.7% 4.2% 3.9% 3.3% Litigation 0.6% 0.0% 0.0% 0.0% 0.1% 0.1% 0.1% Total Fire Loss 0.1% 0.1% 0.0% 0.0% 0.1% 0.0% 0.0% Real Estate Owned # of Accounts 132 136 131 117 112 102 95 $ 10,504,469 10,581,751 10,392,056 9,268,825 8,881,803 8,944,597 7,921,803 0-3 months 19.4% 28.0% 31.1% 38.1% 44.9% 46.2% 52.2% 4-6 months 18.5% 20.6% 13.4% 19.1% 16.7% 18.1% 25.1% 7-9 months 16.7% 13.9% 17.0% 12.4% 11.5% 19.3% 10.1% 10-12 months 12.8% 10.9% 12.5% 10.1% 13.3% 7.0% 5.4% over 12 months 32.7% 26.6% 26.1% 20.4% 13.6% 9.4% 7.1% Weighted Average Original LTV 87% 87% 87% 87% 87% 87% 87% Original LTV: 0-70 5% 5% 5% 5% 5% 5% 5% Original LTV: 70.01 - 80 9% 10% 10% 10% 10% 10% 10% Original LTV: 80.01 - 90 48% 47% 47% 47% 48% 49% 48% Original LTV: 90.01 - 100 38% 39% 38% 38% 38% 37% 37% Weighted Average FICO 584 579 579 579 580 579 580 FICO: <=600 51% 52% 54% 54% 54% 50% 48% FICO: 601 - 640 12% 12% 10% 10% 10% 9% 8% FICO: 641 - 680 8% 7% 7% 7% 7% 6% 6% FICO: 681 - 720 5% 4% 5% 5% 5% 5% 5% FICO: 721 - 760 3% 3% 3% 3% 3% 3% 3% FICO: 761 - 800 2% 2% 2% 2% 2% 2% 2% FICO: >=801 1% 1% 2% 2% 2% 2% 2% Unknown 18% 19% 17% 17% 17% 24% 26% New Sale/Resale Customer New Sale 95% 96% 97% 97% 98% 98% 99% Resale 5% 4% 3% 3% 2% 2% 1% Table 5k: Portfolio Characteristics - Trust 2006-1 (Unaudited) |
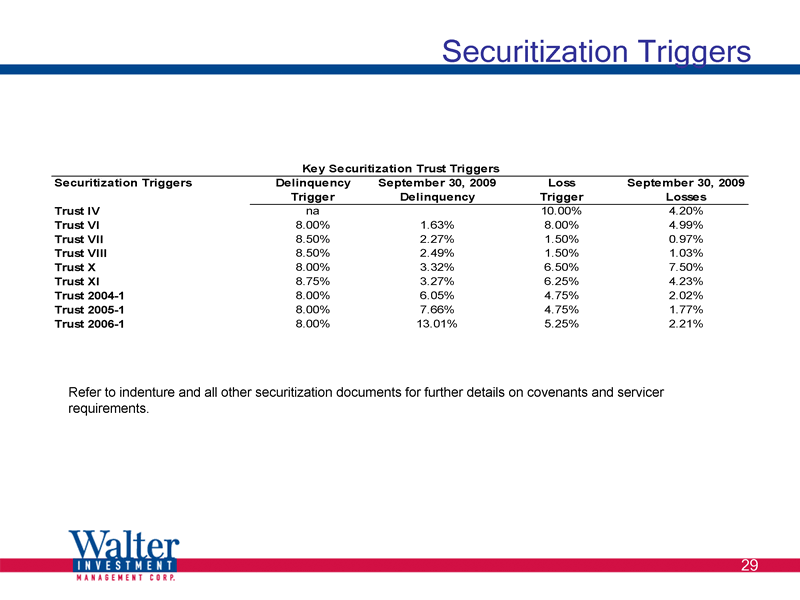
| Securitization Triggers Refer to indenture and all other securitization documents for further details on covenants and servicer requirements. Securitization Triggers Delinquency September 30, 2009 Loss September 30, 2009 Trigger Delinquency Trigger Losses Trust IV na 10.00% 4.20% Trust VI 8.00% 1.63% 8.00% 4.99% Trust VII 8.50% 2.27% 1.50% 0.97% Trust VIII 8.50% 2.49% 1.50% 1.03% Trust X 8.00% 3.32% 6.50% 7.50% Trust XI 8.75% 3.27% 6.25% 4.23% Trust 2004-1 8.00% 6.05% 4.75% 2.02% Trust 2005-1 8.00% 7.66% 4.75% 1.77% Trust 2006-1 8.00% 13.01% 5.25% 2.21% Key Securitization Trust Triggers |