Attached files
| file | filename |
|---|---|
| 8-K - FORM 8-K - APPLIED MATERIALS INC /DE | f54047e8vk.htm |
| EX-99.2 - EX-99.2 - APPLIED MATERIALS INC /DE | f54047exv99w2.htm |
| EX-99.1 - EX-99.1 - APPLIED MATERIALS INC /DE | f54047exv99w1.htm |
Exhibit 99.3
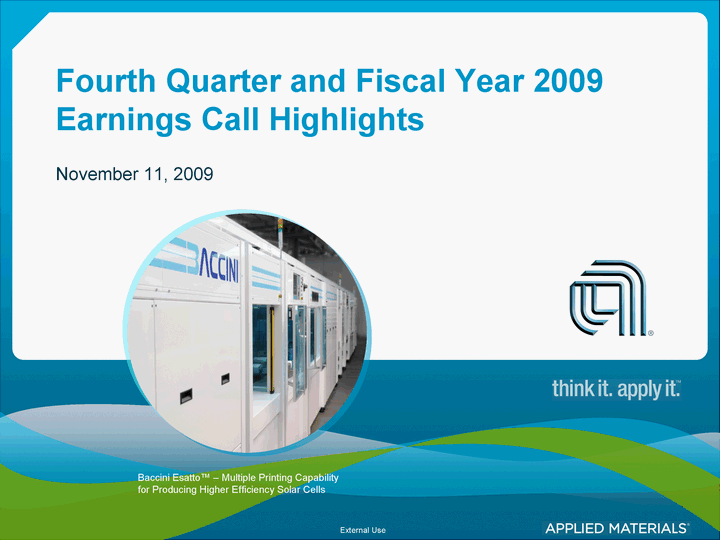
| Fourth Quarter and Fiscal Year 2009 Earnings Call Highlights November 11, 2009 Baccini Esatto(tm) - Multiple Printing Capability for Producing Higher Efficiency Solar Cells |
| 2 Safe Harbor Statement This presentation contains forward-looking statements, including those regarding Applied's performance, cost structure, strategic and cost reduction initiatives, and opportunities, as well as industry outlooks. Forward-looking statements, including their underlying assumptions, are subject to known and unknown risks and uncertainties that could cause actual results to differ materially from those expressed or implied by such statements, including but not limited to: the level of demand for Applied's products, which is subject to many factors, including uncertain global economic and industry conditions, demand for electronic products and semiconductors, governmental renewable energy policies and incentives, and customers' utilization rates and new technology and capacity requirements; Applied's ability to (i) develop, deliver and support a broad range of products, expand its markets and develop new markets, (ii) align its cost structure with business conditions, (iii) plan and manage its resources and production capability, (iv) implement initiatives that enhance global operations and efficiencies, (v) obtain and protect IP rights in key technologies, (vi) attract, motivate and retain key employees, and (vii) accurately forecast future operating and financial results; and other risks described in Applied's SEC filings. All forward-looking statements are based on management's estimates, projections and assumptions as of November 11, 2009, and Applied undertakes no obligation to update any forward-looking statements. This presentation also includes financial measures not in accordance with U.S. GAAP, along with reconciliations of GAAP results to non-GAAP results. |
| Contents Financial highlights (consolidated): Income statement (Q4'09 and FY2009) Summary income statement table (Q4'08 and FY2008) New orders regional distribution (Q4'08 and FY2008) Balance sheet Summary balance sheet table Reporting segments: FY2005 - 2009 New Orders and Net Sales by Segment Q4'09 new orders and net sales by segment Backlog by Segment Detailed financial performance by segment Q4'09 Silicon new orders summary Global and industry outlook Announced Cost Reduction Program Reconciliation of GAAP to NON-GAAP results (Net income) Reconciliation of GAAP to NON-GAAP results (FY2008 Operating income) Reconciliation of free cash flow Impact of Items Included in consolidated condensed statements of operations 3 |
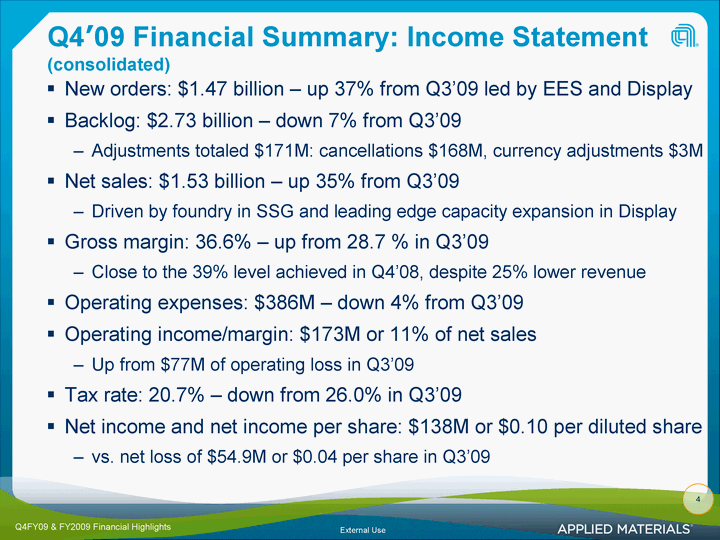
| 4 Q4'09 Financial Summary: Income Statement (consolidated) New orders: $1.47 billion - up 37% from Q3'09 led by EES and Display Backlog: $2.73 billion - down 7% from Q3'09 Adjustments totaled $171M: cancellations $168M, currency adjustments $3M Net sales: $1.53 billion - up 35% from Q3'09 Driven by foundry in SSG and leading edge capacity expansion in Display Gross margin: 36.6% - up from 28.7 % in Q3'09 Close to the 39% level achieved in Q4'08, despite 25% lower revenue Operating expenses: $386M - down 4% from Q3'09 Operating income/margin: $173M or 11% of net sales Up from $77M of operating loss in Q3'09 Tax rate: 20.7% - down from 26.0% in Q3'09 Net income and net income per share: $138M or $0.10 per diluted share vs. net loss of $54.9M or $0.04 per share in Q3'09 |

| 5 Summary Income Statement (consolidated) |
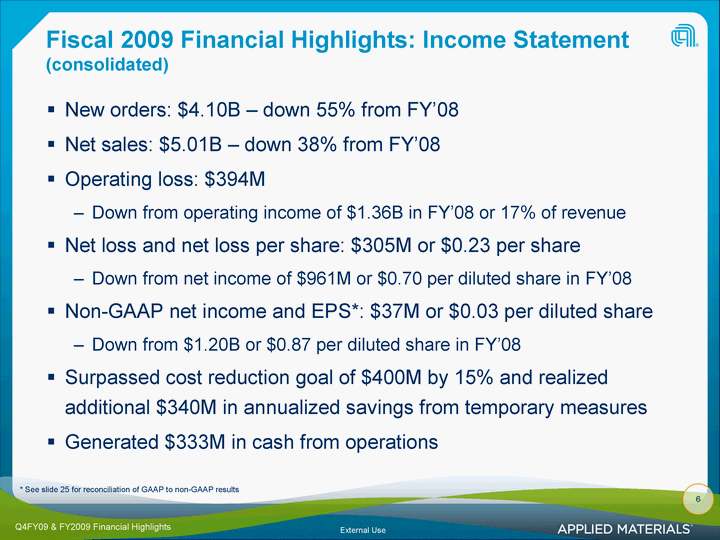
| 6 Fiscal 2009 Financial Highlights: Income Statement (consolidated) New orders: $4.10B - down 55% from FY'08 Net sales: $5.01B - down 38% from FY'08 Operating loss: $394M Down from operating income of $1.36B in FY'08 or 17% of revenue Net loss and net loss per share: $305M or $0.23 per share Down from net income of $961M or $0.70 per diluted share in FY'08 Non-GAAP net income and EPS*: $37M or $0.03 per diluted share Down from $1.20B or $0.87 per diluted share in FY'08 Surpassed cost reduction goal of $400M by 15% and realized additional $340M in annualized savings from temporary measures Generated $333M in cash from operations * See slide 25 for reconciliation of GAAP to non-GAAP results |
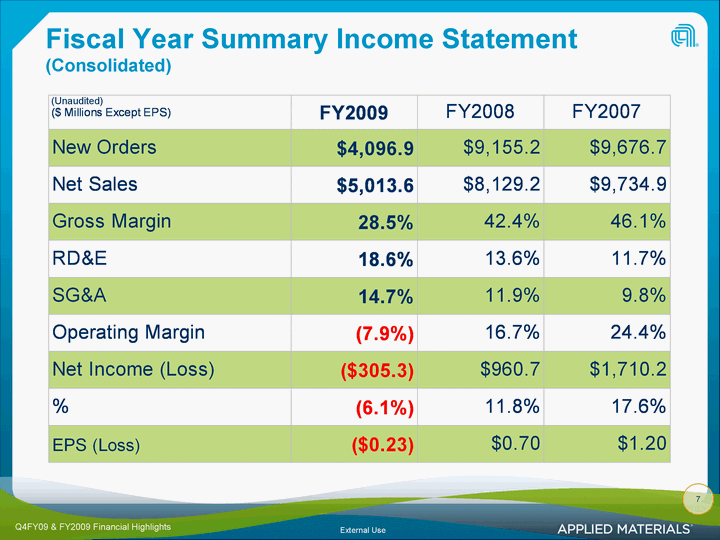
| 7 Fiscal Year Summary Income Statement (Consolidated) (Unaudited) |
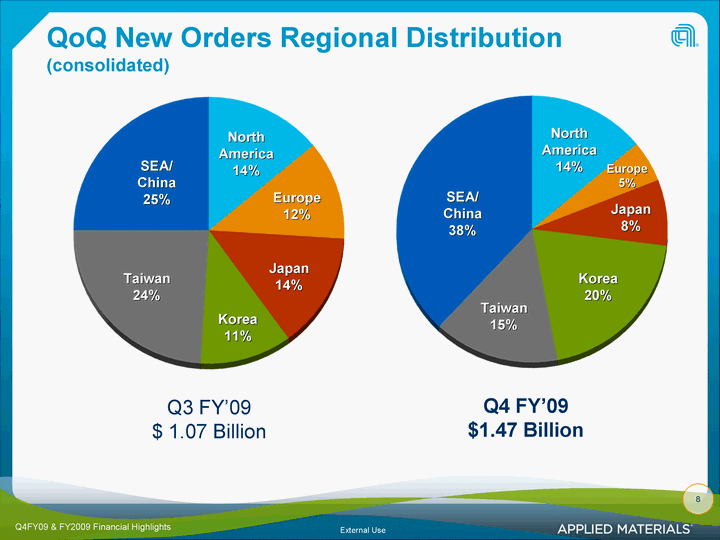
| 8 QoQ New Orders Regional Distribution (consolidated) Q4 FY'09 $1.47 Billion North America 14% Europe 5% Japan 8% Korea 20% Taiwan 15% SEA/ China 38% Q3 FY'09 $ 1.07 Billion North America 14% Europe 12% Japan 14% Korea 11% Taiwan 24% SEA/ China 25% |

| YoY New Orders Regional Distribution (consolidated) 9 FY'09 $4.10 Billion North America 17% Europe 17% Japan 13% Korea 14% Taiwan 15% SEA/ China 24% FY'08 $ 9.16 Billion North America 18% Europe 13% Japan 13% Korea 16% Taiwan 23% SEA/ China 17% |
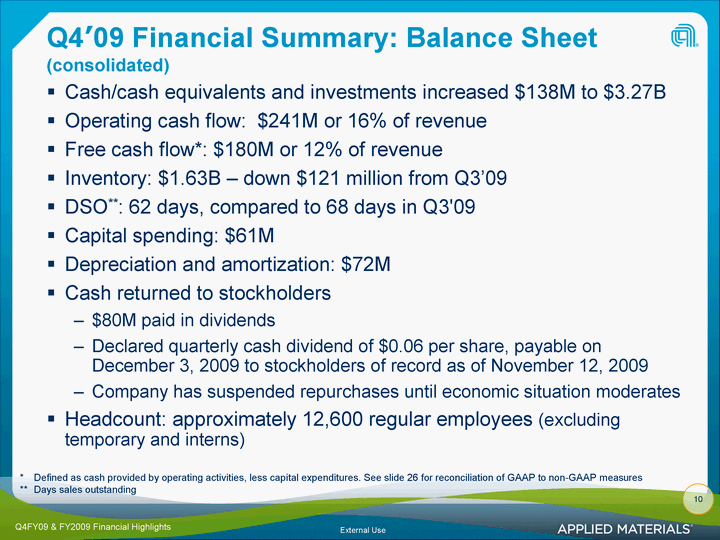
| 10 Q4'09 Financial Summary: Balance Sheet (consolidated) Cash/cash equivalents and investments increased $138M to $3.27B Operating cash flow: $241M or 16% of revenue Free cash flow*: $180M or 12% of revenue Inventory: $1.63B - down $121 million from Q3'09 DSO**: 62 days, compared to 68 days in Q3'09 Capital spending: $61M Depreciation and amortization: $72M Cash returned to stockholders $80M paid in dividends Declared quarterly cash dividend of $0.06 per share, payable on December 3, 2009 to stockholders of record as of November 12, 2009 Company has suspended repurchases until economic situation moderates Headcount: approximately 12,600 regular employees (excluding temporary and interns) * Defined as cash provided by operating activities, less capital expenditures. See slide 26 for reconciliation of GAAP to non-GAAP measures ** Days sales outstanding |
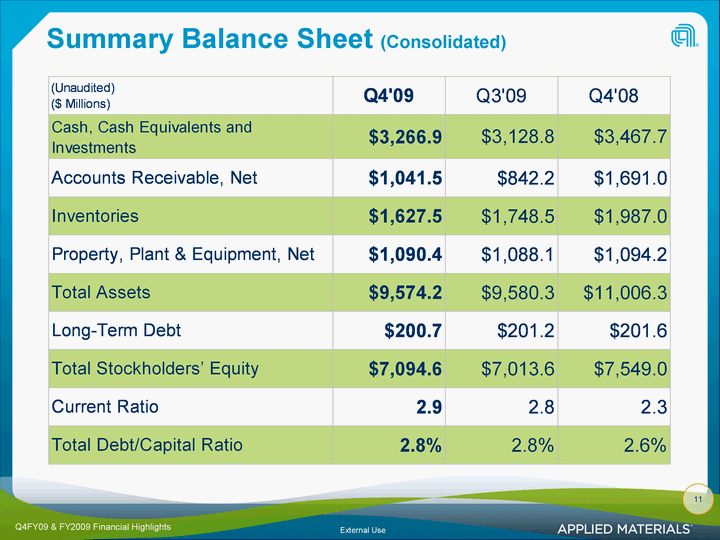
| 11 Summary Balance Sheet (Consolidated) |
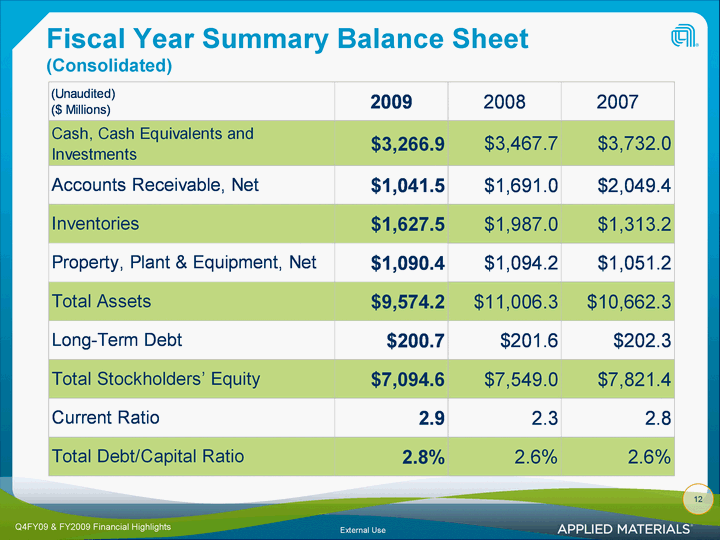
| 12 Fiscal Year Summary Balance Sheet (Consolidated) |
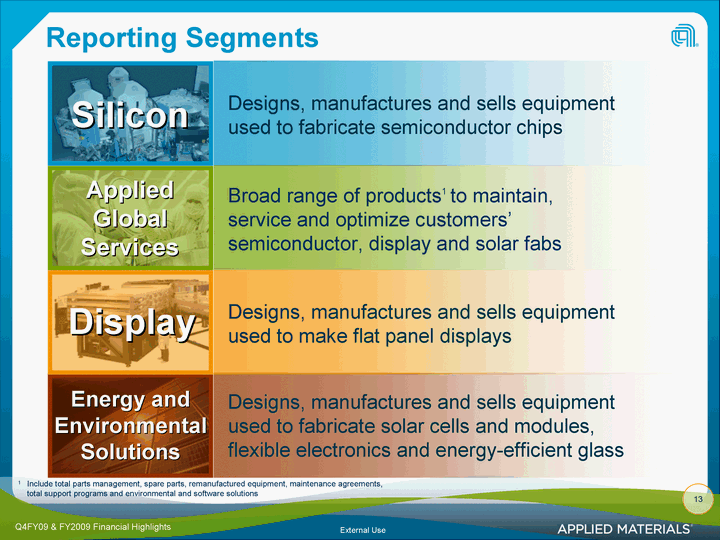
| 13 Reporting Segments Designs, manufactures and sells equipment used to fabricate semiconductor chips Designs, manufactures and sells equipment used to fabricate solar cells and modules, flexible electronics and energy-efficient glass Silicon Broad range of products1 to maintain, service and optimize customers' semiconductor, display and solar fabs Applied Global Services Energy and Environmental Solutions Designs, manufactures and sells equipment used to make flat panel displays Display 1 Include total parts management, spare parts, remanufactured equipment, maintenance agreements, total support programs and environmental and software solutions |
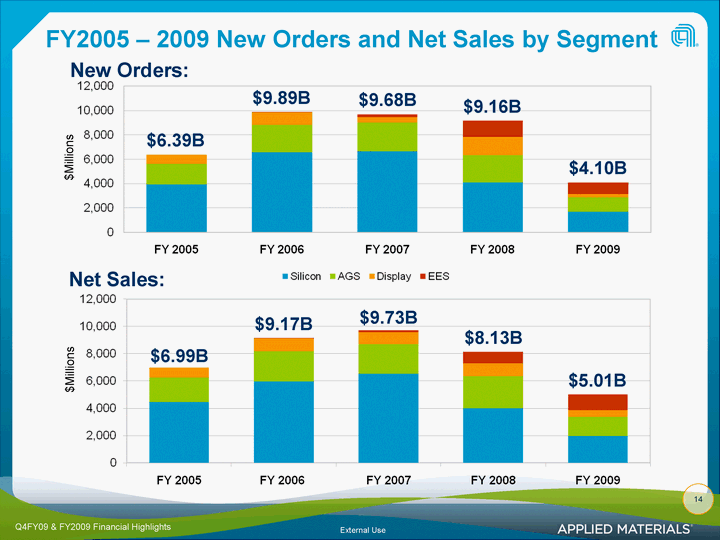
| 14 FY2005 - 2009 New Orders and Net Sales by Segment New Orders: Net Sales: $Millions $Millions $6.39B $9.89B $9.68B $6.99B $9.17B $9.73B $9.16B $8.13B $4.10B $5.01B |
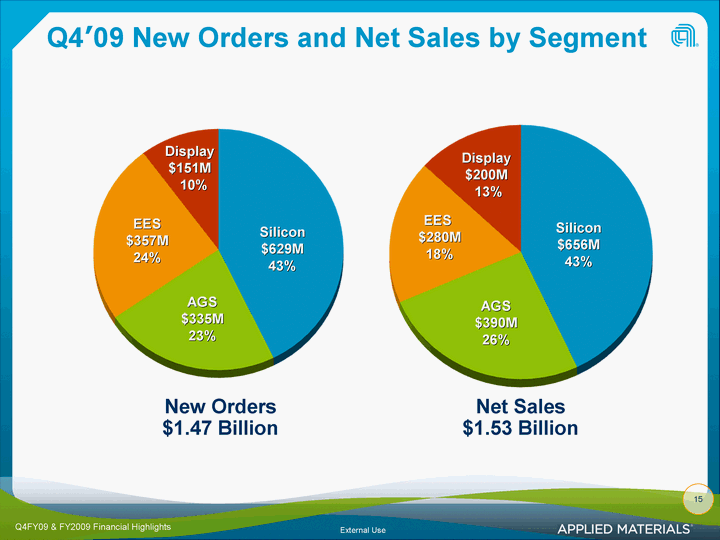
| 15 Q4'09 New Orders and Net Sales by Segment Silicon $629M 43% Display $151M 10% AGS $335M 23% EES $357M 24% New Orders $1.47 Billion Silicon $656M 43% Display $200M 13% AGS $390M 26% EES $280M 18% Net Sales $1.53 Billion |
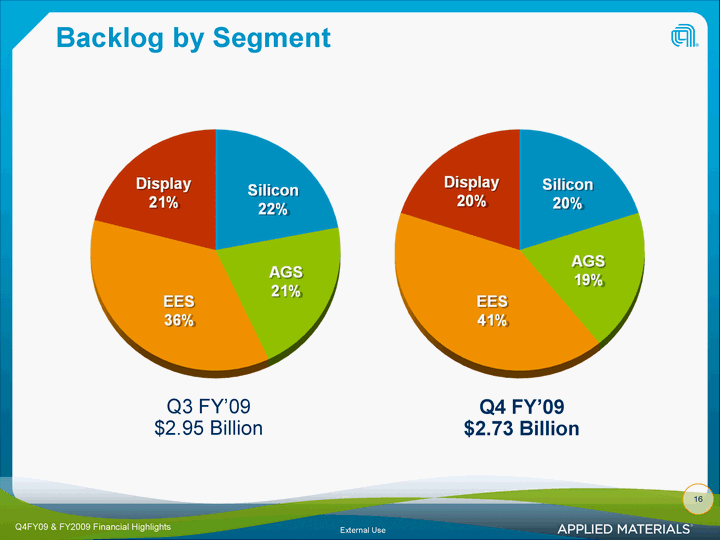
| 16 Backlog by Segment Q3 FY'09 $2.95 Billion Q4 FY'09 $2.73 Billion |
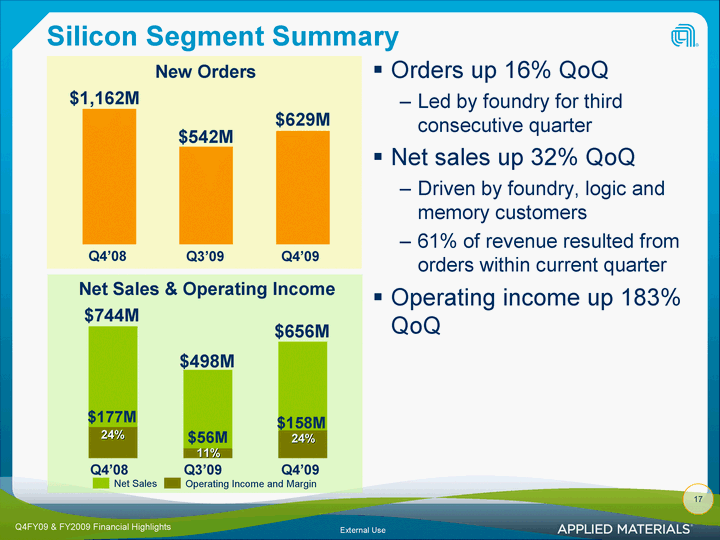
| 17 Silicon Segment Summary Orders up 16% QoQ Led by foundry for third consecutive quarter Net sales up 32% QoQ Driven by foundry, logic and memory customers 61% of revenue resulted from orders within current quarter Operating income up 183% QoQ New Orders Net Sales Operating Income and Margin 24% $177M $656M $744M Q4'08 Q3'09 Q4'09 $1,162M $542M $629M Q4'08 Q3'09 Q4'09 Net Sales & Operating Income $498M 24% $158M 11% $56M |
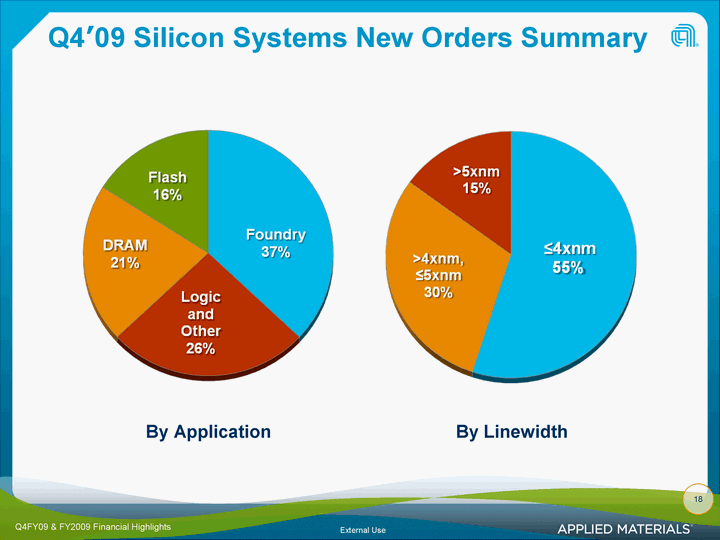
| 18 Q4'09 Silicon Systems New Orders Summary By Application By Linewidth |
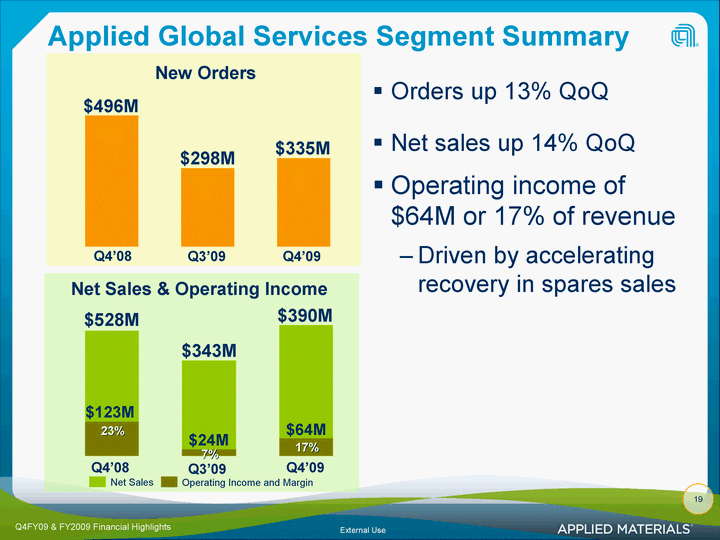
| 19 Applied Global Services Segment Summary Orders up 13% QoQ Net sales up 14% QoQ Operating income of $64M or 17% of revenue Driven by accelerating recovery in spares sales New Orders Net Sales Operating Income and Margin $496M $298M $335M 17% $64M Q4'08 Q3'09 Q4'09 Q4'08 Q3'09 Q4'09 Net Sales & Operating Income 23% $123M $390M $528M 7% $24M $343M |
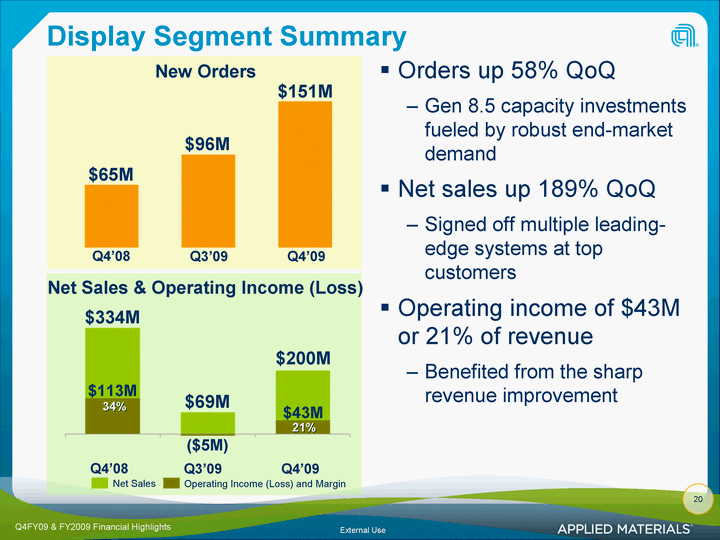
| 20 Display Segment Summary Orders up 58% QoQ Gen 8.5 capacity investments fueled by robust end-market demand Net sales up 189% QoQ Signed off multiple leading- edge systems at top customers Operating income of $43M or 21% of revenue Benefited from the sharp revenue improvement New Orders $96M $151M $65M Net Sales Operating Income (Loss) and Margin $69M $113M 34% $334M ($5M) $43M $200M Q4'08 Q3'09 Q4'09 Q4'08 Q3'09 Q4'09 Net Sales & Operating Income (Loss) 21% |
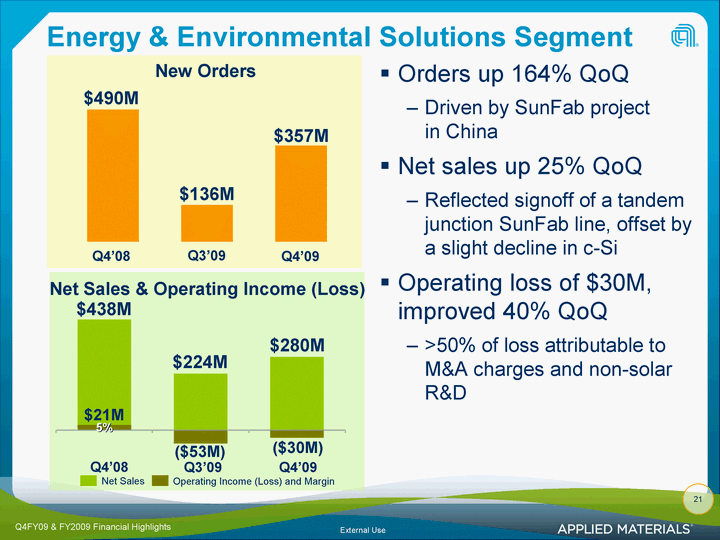
| 21 Energy & Environmental Solutions Segment Summary Orders up 164% QoQ Driven by SunFab project in China Net sales up 25% QoQ Reflected signoff of a tandem junction SunFab line, offset by a slight decline in c-Si Operating loss of $30M, improved 40% QoQ >50% of loss attributable to M&A charges and non-solar R&D Net Sales & Operating Income (Loss) Net Sales Operating Income (Loss) and Margin New Orders N/A $21M $438M $136M $490M $280M $357M Q4'08 Q3'09 Q4'09 Q4'08 Q3'09 Q4'09 ($30M) $224M ($53M) 5% |
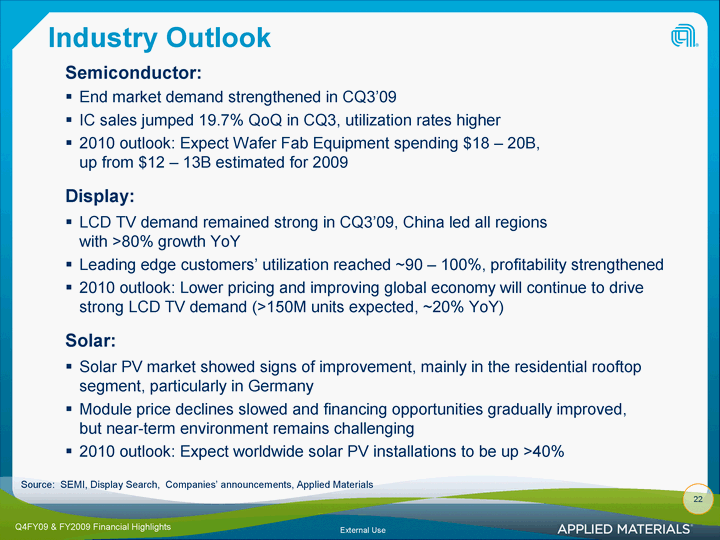
| 22 Industry Outlook Semiconductor: End market demand strengthened in CQ3'09 IC sales jumped 19.7% QoQ in CQ3, utilization rates higher 2010 outlook: Expect Wafer Fab Equipment spending $18 - 20B, up from $12 - 13B estimated for 2009 Display: LCD TV demand remained strong in CQ3'09, China led all regions with >80% growth YoY Leading edge customers' utilization reached ~90 - 100%, profitability strengthened 2010 outlook: Lower pricing and improving global economy will continue to drive strong LCD TV demand (>150M units expected, ~20% YoY) Solar: Solar PV market showed signs of improvement, mainly in the residential rooftop segment, particularly in Germany Module price declines slowed and financing opportunities gradually improved, but near-term environment remains challenging 2010 outlook: Expect worldwide solar PV installations to be up >40% Source: SEMI, Display Search, Companies' announcements, Applied Materials |
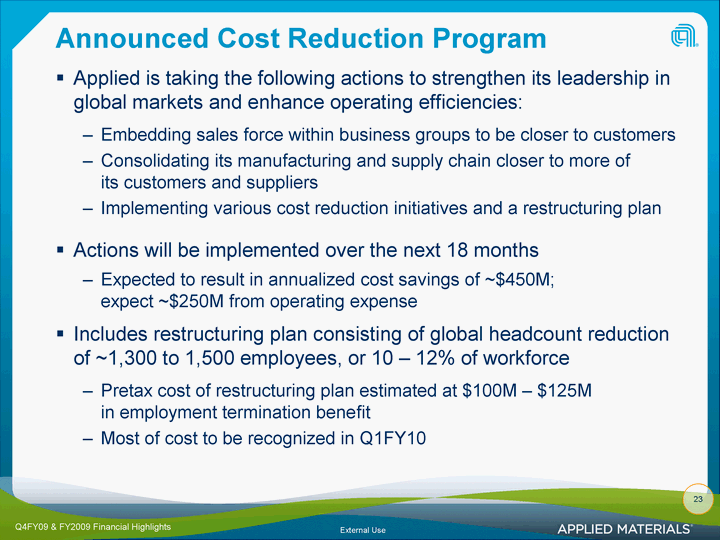
| 23 Announced Cost Reduction Program Applied is taking the following actions to strengthen its leadership in global markets and enhance operating efficiencies: Embedding sales force within business groups to be closer to customers Consolidating its manufacturing and supply chain closer to more of its customers and suppliers Implementing various cost reduction initiatives and a restructuring plan Actions will be implemented over the next 18 months Expected to result in annualized cost savings of ~$450M; expect ~$250M from operating expense Includes restructuring plan consisting of global headcount reduction of ~1,300 to 1,500 employees, or 10 - 12% of workforce Pretax cost of restructuring plan estimated at $100M - $125M in employment termination benefit Most of cost to be recognized in Q1FY10 |

| 24 Q1'10 Expectations (As of November 11, 2009) Q1'10 Expectations will be posted after earnings call |

| 25 Reconciliation of GAAP to NON-GAAP Results |

| 26 Reconciliation of GAAP to Non-GAAP Measures - Free Cash Flow Free Cash Flow Free Cash Flow Three months ended October 25, 2009 Three months ended July 26, 2009 Cash from Operations $240,582 $193,713 Capital Expenditures $(60,623) $(59,705) Free cash flow $179,959 $134,008 Revenue $1,526,394 $1,133,740 Free cash flow margin 12% 12% (Dollars in Thousands) |

| Impact of Items Included in Consolidated Condensed Statements of Operations 27 |
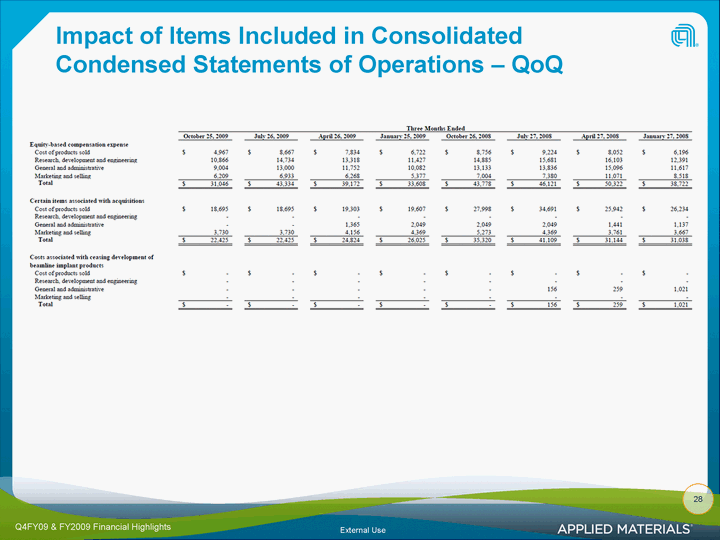
| Impact of Items Included in Consolidated Condensed Statements of Operations - QoQ 28 |

| Thank You. Applied Materials Confidential |
