Attached files
| file | filename |
|---|---|
| 8-K - FORM 8-K - OFFICIAL PAYMENTS HOLDINGS, INC. | w76232e8vk.htm |
| EX-99.1 - EX-99.1 - OFFICIAL PAYMENTS HOLDINGS, INC. | w76232exv99w1.htm |
Exhibit
99.2
| Tier Technologies Fourth Quarter and Year End Fiscal 2009 Results Earnings Call Charts November 10, 2009 |
| Forward-Looking Statements Certain statements contained in this presentation, including statements regarding the future development of and demand for our services and our markets, anticipated trends in various expenses, expected legal proceedings, and other statements that are not historical facts, are forward-looking statements within the meaning of the federal securities laws. These forward-looking statements relate to future events or our future financial and/or operating performance and can generally be identified as such because the context of the statement will include words such as "may," "will," "intends," "plans," "believes," "anticipates," "expects," "estimates," "shows," "predicts," "potential," "continue" or "opportunity," the negative of these words or words of similar import. These forward- looking statements are subject to risks and uncertainties, including the risks and uncertainties described and referred to under the "Risk Factors" section of our annual report on Form 10-K for the year ended September 30, 2009, as well as other filings with the SEC that could cause our actual events or results to differ materially from those anticipated as of the date of this presentation. Press releases and SEC filings can be found on the Investors section of our website at www.Tier.com. (c)2009, Tier Technologies, Inc. |
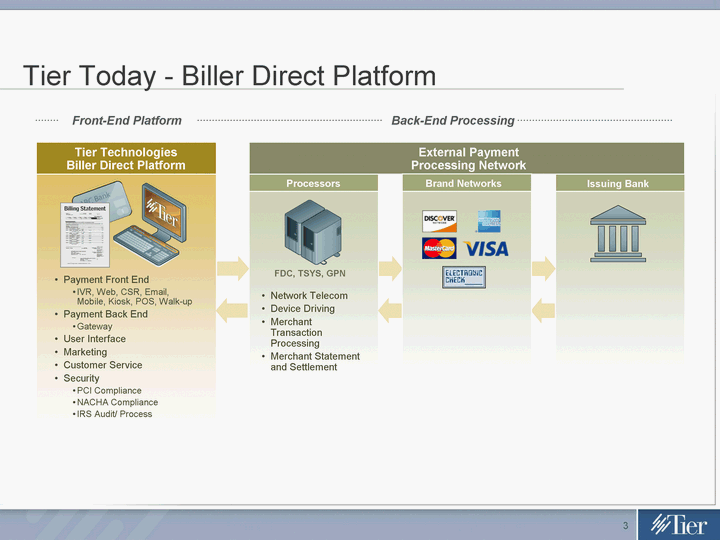
| Tier Today - Biller Direct Platform Tier Technologies Biller Direct Platform Payment Front End IVR, Web, CSR, Email, Mobile, Kiosk, POS, Walk-up Payment Back End Gateway User Interface Marketing Customer Service Security PCI Compliance NACHA Compliance IRS Audit/ Process Issuing Bank Processors Network Telecom Device Driving Merchant Transaction Processing Merchant Statement and Settlement FDC, TSYS, GPN External Payment Processing Network Front-End Platform Back-End Processing Brand Networks |
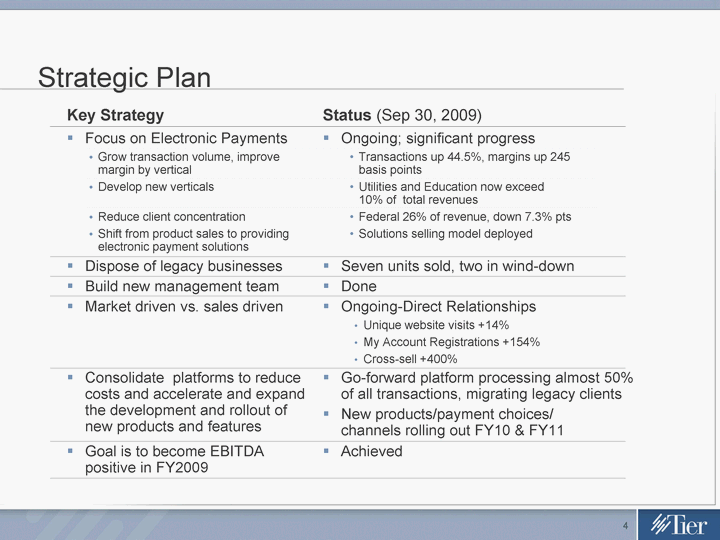
| Strategic Plan Key Strategy Dispose of legacy businesses Build new management team Market driven vs. sales driven Status (Sep 30, 2009) Seven units sold, two in wind-down Done Ongoing-Direct Relationships Unique website visits +14% My Account Registrations +154% Cross-sell +400% Focus on Electronic Payments Grow transaction volume, improve margin by vertical Develop new verticals Reduce client concentration Shift from product sales to providing electronic payment solutions Ongoing; significant progress Transactions up 44.5%, margins up 245 basis points Utilities and Education now exceed 10% of total revenues Federal 26% of revenue, down 7.3% pts Solutions selling model deployed Goal is to become EBITDA positive in FY2009 Achieved Go-forward platform processing almost 50% of all transactions, migrating legacy clients New products/payment choices/ channels rolling out FY10 & FY11 Consolidate platforms to reduce costs and accelerate and expand the development and rollout of new products and features |
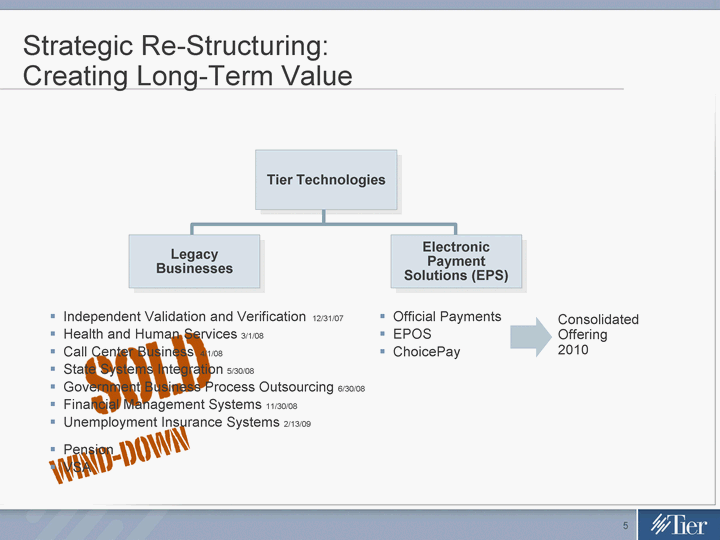
| Official Payments EPOS ChoicePay Independent Validation and Verification 12/31/07 Health and Human Services 3/1/08 Call Center Business 4/1/08 State Systems Integration 5/30/08 Government Business Process Outsourcing 6/30/08 Financial Management Systems 11/30/08 Unemployment Insurance Systems 2/13/09 Pension VSA Strategic Re-Structuring: Creating Long-Term Value Tier Technologies Legacy Businesses Electronic Payment Solutions (EPS) Consolidated Offering 2010 |

| Tier Technologies - Experienced Management Ronald L. Rossetti, Chairman and CEO (joined 5/2006) 30 years CEO experience in private and public companies primarily in emerging growth and crisis management Served on numerous private, public, and non-profit boards Private investor for the past 15 years Nina Vellayan, COO and EVP (joined 10/2008) 20 years experience in financial services, payments, cash management 14 years at Sallie Mae in Cash Management 8 years, President, ecommerce division that provided internet, IVR, lockbox and POS payment channels along with front end applications such as electronic bill presentment, refund disbursement, and installment plans to the Higher Education market. Ronald W. Johnston, CFO and SVP (joined 4/2008) 30 years senior financial management 20 years Securities and Exchange Commission reporting Domestic and International responsibilities Keith S. Kendrick, SVP, Strategic Marketing (joined 7/2008) 23 years in financial services and payments MasterCard International; AT&T Universal Card; President, First Virtual; CEO, eCommerce, Bank One Credit Corporation; CEO, Mindwave division of HNC Software (now Fair Isaac), EFD | eFunds |
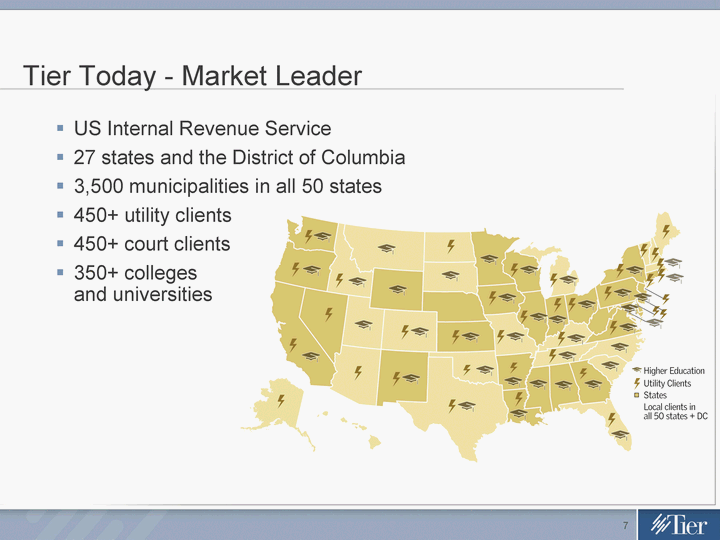
| Tier Today - Market Leader US Internal Revenue Service 27 states and the District of Columbia 3,500 municipalities in all 50 states 450+ utility clients 450+ court clients 350+ colleges and universities |
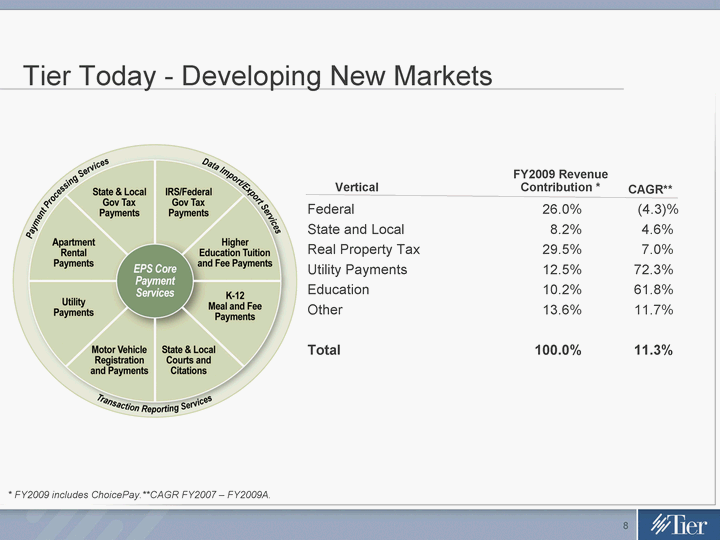
| Tier Today - Developing New Markets Federal 26.0% (4.3)% State and Local 8.2% 4.6% Real Property Tax 29.5% 7.0% Utility Payments 12.5% 72.3% Education 10.2% 61.8% Other 13.6% 11.7% Total 100.0% 11.3% FY2009 Revenue Contribution * Vertical CAGR** * FY2009 includes ChoicePay.**CAGR FY2007 - FY2009A. |
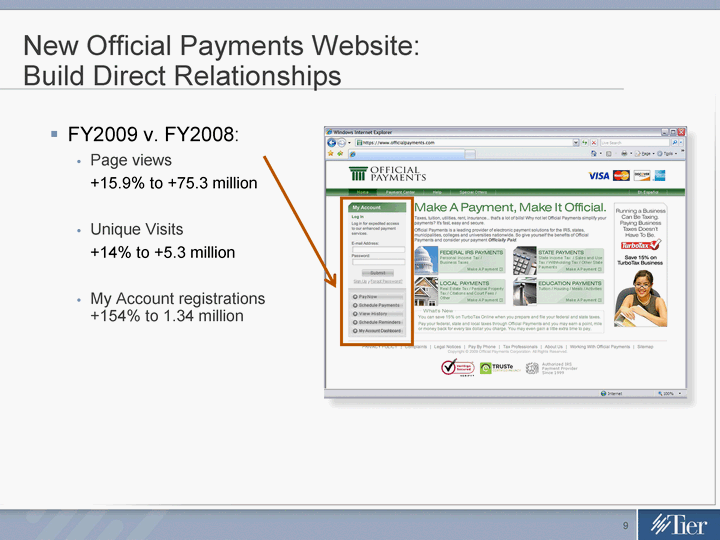
| FY2009 v. FY2008: Page views +15.9% to +75.3 million Unique Visits +14% to +5.3 million My Account registrations +154% to 1.34 million New Official Payments Website: Build Direct Relationships |
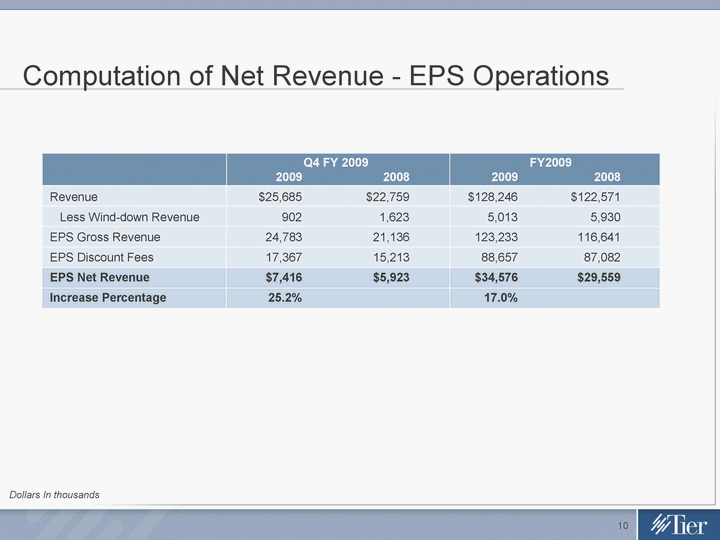
| Computation of Net Revenue - EPS Operations Q4 FY 2009 FY2009 2009 2008 2009 2008 Revenue $25,685 $22,759 $128,246 $122,571 Less Wind-down Revenue 902 1,623 5,013 5,930 EPS Gross Revenue 24,783 21,136 123,233 116,641 EPS Discount Fees 17,367 15,213 88,657 87,082 EPS Net Revenue $7,416 $5,923 $34,576 $29,559 Increase Percentage 25.2% 17.0% Dollars In thousands |
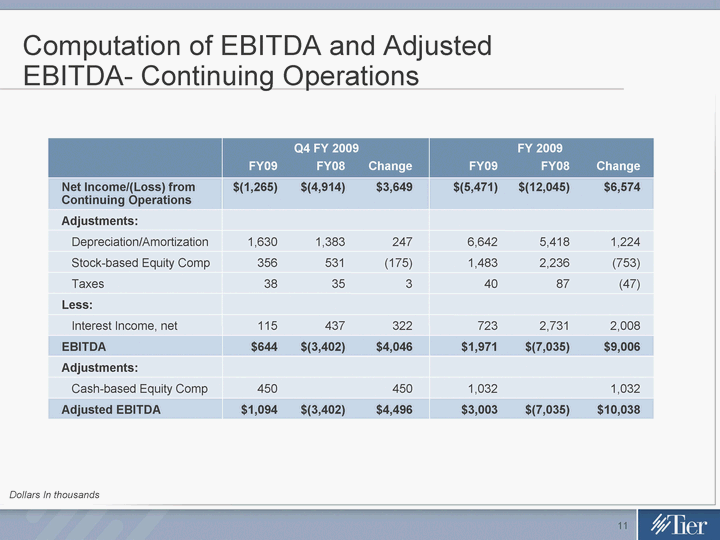
| Computation of EBITDA and Adjusted EBITDA- Continuing Operations Q4 FY2009 FY2009 Dollars In thousands FY09 FY08 Change FY09 FY08 Change Net Income/(Loss) from $(1,265) $(4,914) $3,649 $(5,471) $(12,045) $6,574 Continuing Operations Adjustments: Depreciation/Amortization 1,630 1,383 247 6,642 5,418 1,224 Stock-based Equity Comp 356 531 (175) 1,483 2,236 (753) Taxes 38 35 3 40 87 (47) Less: Interest Income, net 115 437 322 723 2,731 2,008 EBITDA $644 $(3,402) $4,046 $1,971 $(7,035) $9,006 Adjustments: Cash-based Equity Comp 450 450 1,032 1,032 Adjusted EBITDA $1,094 $(3,402) $4,496 $3,003 $(7,035) $10,038 Q4 FY 2009 FY 2009 |
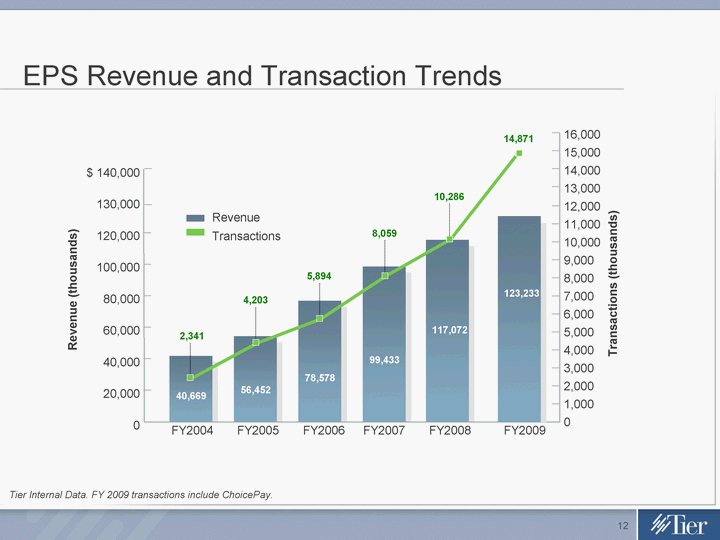
| EPS Revenue and Transaction Trends $ 140,000 130,000 120,000 100,000 80,000 60,000 40,000 20,000 0 FY2004 FY2005 FY2006 FY2007 FY2008 Revenue Transactions FY2009 16,000 15,000 14,000 13,000 12,000 11,000 10,000 9,000 8,000 7,000 6,000 5,000 4,000 3,000 2,000 1,000 0 Transactions (thousands) Tier Internal Data. FY 2009 transactions include ChoicePay. 40,669 56,452 78,578 99,433 117,072 4,203 5,894 8,059 10,286 14,871 2,341 Revenue (thousands) 123,233 123,233 |
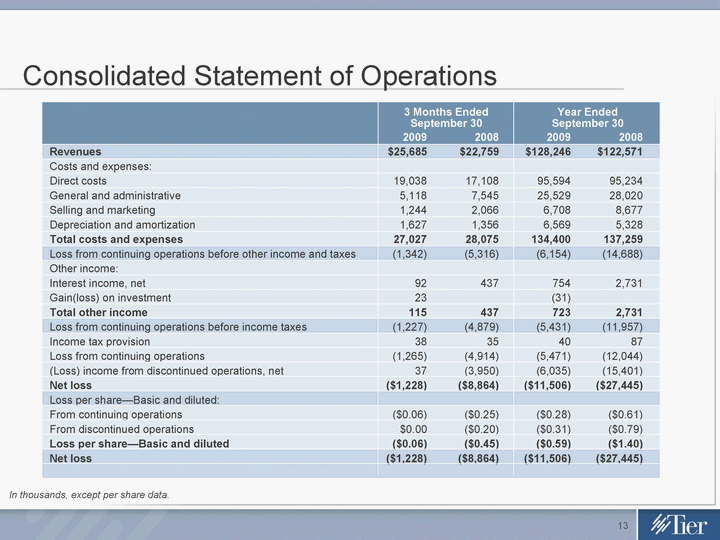
| Consolidated Statement of Operations 2009 2008 2009 2008 Revenues $25,685 $22,759 $128,246 $122,571 Costs and expenses: Direct costs 19,038 17,108 95,594 95,234 General and administrative 5,118 7,545 25,529 28,020 Selling and marketing 1,244 2,066 6,708 8,677 Depreciation and amortization 1,627 1,356 6,569 5,328 Total costs and expenses 27,027 28,075 134,400 137,259 Loss from continuing operations before other income and taxes (1,342) (5,316) (6,154) (14,688) Other income: Interest income, net 92 437 754 2,731 Gain(loss) on investment 23 (31) Total other income 115 437 723 2,731 Loss from continuing operations before income taxes (1,227) (4,879) (5,431) (11,957) Income tax provision 38 35 40 87 Loss from continuing operations (1,265) (4,914) (5,471) (12,044) (Loss) income from discontinued operations, net 37 (3,950) (6,035) (15,401) Net loss ($1,228) ($8,864) ($11,506) ($27,445) Loss per share-Basic and diluted: From continuing operations ($0.06) ($0.25) ($0.28) ($0.61) From discontinued operations $0.00 ($0.20) ($0.31) ($0.79) Loss per share-Basic and diluted ($0.06) ($0.45) ($0.59) ($1.40) Net loss ($1,228) ($8,864) ($11,506) ($27,445) 3 Months Ended September 30 Year Ended September 30 In thousands, except per share data. |
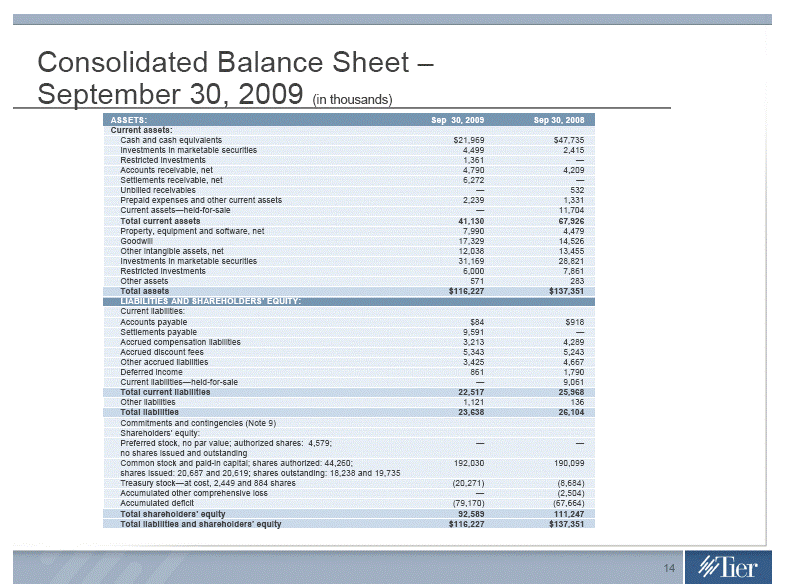
| Consolidated Balance Sheet - September 30, 2009 (in thousands) ASSETS: Sep 30, 2009 Sep 30, 2008 Current assets: Cash and cash equivalents $21,969 $47,735 Investments in marketable securities 4,499 2,415 Restricted investments 1,361 - Accounts receivable, net 4,790 4,209 Settlements receivable, net 6,272 - Unbilled receivables - 532 Prepaid expenses and other current assets 2,239 1,331 Current assets-held-for-sale - 11,704 Total current assets 41,130 67,926 Property, equipment and software, net 7,990 4,479 Goodwill 17,329 14,526 Other intangible assets, net 12,038 13,455 Investments in marketable securities 31,169 28,821 Restricted investments 6,000 7,861 Other assets 571 283 Total assets $116,227 $137,351 LIABILITIES AND SHAREHOLDERS' EQUITY: Current liabilities: Accounts payable $84 $918 Settlements payable 9,591 - Accrued compensation liabilities 3,213 4,289 Accrued discount fees 5,343 5,243 Other accrued liabilities 3,425 4,667 Deferred income 861 1,790 Current liabilities-held-for-sale - 9,061 Total current liabilities 22,517 25,968 Other liabilities 1,121 136 Total liabilities 23,638 26,104 Commitments and contingencies (Note 9) Shareholders' equity: Preferred stock, no par value; authorized shares: 4,579; - - no shares issued and outstanding Common stock and paid-in capital; shares authorized: 44,260; 192,030 190,099 shares issued: 20,687 and 20,619; shares outstanding: 18,238 and 19,735 Treasury stock-at cost, 2,449 and 884 shares (20,271) (8,684) Accumulated other comprehensive loss - (2,504) Accumulated deficit (79,170) (67,664) Total shareholders' equity 92,589 111,247 Total liabilities and shareholders' equity $116,227 $137,351 |
