Attached files
UNITED STATES
SECURITIES AND EXCHANGE COMMISSION
Washington, D.C. 20549
FORM 10-K
(Mark One)
x ANNUAL REPORT PURSUANT TO SECTION 13 OR 15(d) OF THE SECURITIES EXCHANGE ACT OF 1934
FOR THE FISCAL YEAR ENDED SEPTEMBER 30, 2010
OR
¨ TRANSITION REPORT PURSUANT TO SECTION 13 OR 15(d) OF THE SECURITIES EXCHANGE ACT OF 1934
FOR THE TRANSITION PERIOD FROM ______ TO ______
COMMISSION FILE NUMBER 000-23195
TIER TECHNOLOGIES, INC.
(Exact name of registrant as specified in its charter)
|
DELAWARE
(State or other jurisdiction of Incorporation or organization)
|
94-3145844
(I.R.S. Employer Identification No.)
|
11130 Sunrise Valley Drive, Suite 300, Reston, Virginia 20191
(Address of principal executive offices) (Zip code)
Registrant's telephone number, including area code: (571) 382-1000
Securities registered pursuant to Section 12(b) of the Act:
|
Title of each class
COMMON STOCK, $0.01 PAR VALUE
|
Name of each exchange on which registered
The NASDAQ STOCK MARKET, LLC
|
Securities registered pursuant to Section 12(g) of the Act
NONE
Indicate by check mark if the registrant is a well-known seasoned issuer, as defined in Rule 405 of the Securities Act. Yes ¨ No x
Indicate by check mark if the registrant is not required to file reports pursuant to Section 13 or Section 15(d) of the Act. Yes ¨ No x
Indicate by check mark whether the registrant (1) has filed all reports required to be filed by Section 13 or 15(d) of the Securities Exchange Act of 1934 during the preceding 12 months (or for such shorter period that the registrant was required to file such reports), and (2) has been subject to such filing requirements for the past 90 days. Yes x No ¨
Indicate by check mark whether the registrant has submitted electronically and posted on its corporate Web site, if any, every Interactive Data File required to be submitted and posted pursuant to Rule 405 of Regulation S-T (§ 232.405 of this chapter) during the preceding 12 months (or for such shorter period that the registrant was required to submit and post such files). Yes ¨ No ¨
Indicate by check mark if disclosure of delinquent filers pursuant to Item 405 of Regulation S-K (§229.405 of this chapter) is not contained herein, and will not be contained, to the best of registrant's knowledge, in definitive proxy or information statements incorporated by reference in Part III of this Form 10-K or any amendment to this Form 10-K. x
Indicate by check mark whether the registrant is a large accelerated filer, an accelerated filer, a non-accelerated filer, or a smaller reporting company. See definition of “large accelerated filer," "accelerated filer," and "smaller reporting company” in Rule 12b-2 of the Exchange Act. (Check one):
|
Large accelerated filer o
|
Accelerated filer x
|
|
Non-accelerated filer o
|
Smaller reporting company o
|
|
(Do not check if a smaller reporting company)
|
Indicate by check mark whether the registrant is a shell company (as defined in Rule 12b-2 of the Act). Yes ¨ No x
As of March 31, 2010, the aggregate market value of common stock held by non-affiliates of the registrant was $109,921,041, based on the closing sale price of the common stock on March 31, 2010, as reported on The NASDAQ Stock Market. As of November 16, 2010, there were 18,230,965 shares of common stock outstanding.
DOCUMENTS INCORPORATED BY REFERENCE
The information required by Items 10, 11, 12, 13 and 14 of Part III (except for information required with respect to our executive officers, which is set forth under "Part I—Executive Officers") of this report, which will appear in our definitive proxy statement relating to our 2011 annual meeting of stockholders, is incorporated by reference into this report.
TIER TECHNOLOGIES, INC.
FORM 10-K
TABLE OF CONTENTS
|
Part I
|
1
|
|
Item 1—Business
|
1
|
|
Item 1A—Risk Factors
|
6
|
|
Item 1B—Unresolved Staff Comments
|
7
|
|
Item 2—Properties
|
13
|
|
Item 3—Legal Proceedings
|
14
|
|
Item 4—Removed And Reserved
|
14
|
|
Executive Officers Of The Registrant
|
15
|
|
Part II
|
15
|
|
Item 5—Market for Registrant’s Common Equity, Related Stockholder Matters and Issuer Purchases of Equity Securities
|
15
|
|
Item 6—Selected Financial Data
|
18
|
|
Item 7—Management’s Discussion and Analysis of Financial Condition and Results of Operations
|
19
|
|
Item 7A—Quantitative and Qualitative Disclosures About Market Risk
|
35
|
|
Item 8—Financial Statements and Supplementary Data
|
36
|
|
Report of Independent Registered Public Accounting Firm
|
37
|
|
Item 9—Changes in and Disagreements with Accountants on Accounting and Financial Disclosure
|
72
|
|
Item 9A—Controls and Procedures
|
72
|
|
Item 9B—Other Information
|
74
|
|
Part III
|
74
|
|
Item 10—Directors, Executive Officers and Corporate Governance
|
74
|
|
Item 11—Executive Compensation
|
74
|
|
Item 12—Security Ownership of Certain Beneficial Owners and Management and Related Stockholder Matters
|
74
|
|
Item 13—Certain Relationships and Related Transactions and Director Independence
|
74
|
|
Item 14—Principal Accountant Fees and Services
|
74
|
|
Part IV
|
75
|
|
Item 15—Exhibits, Financial Statement Schedules
|
75
|
|
Signatures
|
78
|
i
Private Securities Litigation Reform Act Safe Harbor Statement
Certain statements contained in this report, including statements regarding the future development of and demand for our services and our markets, anticipated trends in various expenses, expected costs of legal proceedings, expectations about our technology projects, and other statements that are not historical facts, are forward-looking statements within the meaning of the federal securities laws. These forward-looking statements relate to future events or our future financial and/or operating performance and can generally be identified as such because the context of the statement includes words such as "may," "will," "intends," "plans," "believes," "anticipates," "expects," "estimates," "shows," "predicts," "potential," "continue," or "opportunity," the negative of these words or words of similar import. These forward-looking statements are subject to risks and uncertainties, including the risks and uncertainties described and referred to under Item 1A—Risk Factors beginning on page 6, which could cause actual results to differ materially from those anticipated as of the date of this report. We undertake no obligation to publicly update or revise any forward-looking statements, whether as a result of new information, future events or otherwise.
GENERAL
Tier Technologies, Inc., or Tier, is a leading provider of biller direct electronic payment solutions, through our primary brand Official Payments. These solutions provide payment services via multiple channels including the Internet, automated Interactive Voice Response, or IVR, call center and point-of-sale, or POS, environments. We offer our clients a front-end platform designed expressly for the biller direct market with a single source solution that simplifies the management of electronic payments. Our solutions include multiple enhanced payment services, including convenience fee payments, absorbed payments, payment reminder and automated payment scheduling. We also offer our clients a range of payment choices, including credit and debit cards, electronic checks, cash and money orders, and emerging payment methods to meet the needs of their customers. By utilizing our solutions, clients can reduce, if not eliminate, their management and expense of payment technology, PCI data security requirements, and compliance with other payment industry standards while offering their customers secure and convenient means to pay their bills. The demand for our services has been driven by an increasing preference of consumers and merchants/billers to make payments electronically, increased acceptance of online, interactive voice response systems and contact management solutions, as well as by legislative mandates.
We perform these services in a variety of markets, which we refer to as verticals. Our current verticals include:
|
·
|
Federal—which includes federal income and business tax payments;
|
|
·
|
State and Local—which includes state and local income tax payments and business tax payments;
|
|
·
|
Property Tax—which covers state and local real property tax;
|
|
·
|
Utility;
|
|
·
|
Education—which consists of services to post-secondary educational institutions; and
|
|
·
|
Other—includes local government fines and fees, motor vehicle registration and payments, rent, insurance, K-12 meal pay and fee payments and personal property tax payments.
|
During fiscal 2010, we also provided services in one business area which we are currently in the process of winding-down. While we continue to support our existing contracts in this area, we are not pursuing new contracts. The business that we are winding down is our Voice and Systems Automation business, or VSA, which provides services for interactive voice response systems, including customization, installation and maintenance. We expect to complete our VSA business within the next two years.
1
Originally incorporated in 1991 in California, we reincorporated in Delaware effective July 15, 2005. We are headquartered in Reston, Virginia. As of September 30, 2010, our 220 employees and 23 contractors provided services to over 4,600 clients nationwide.
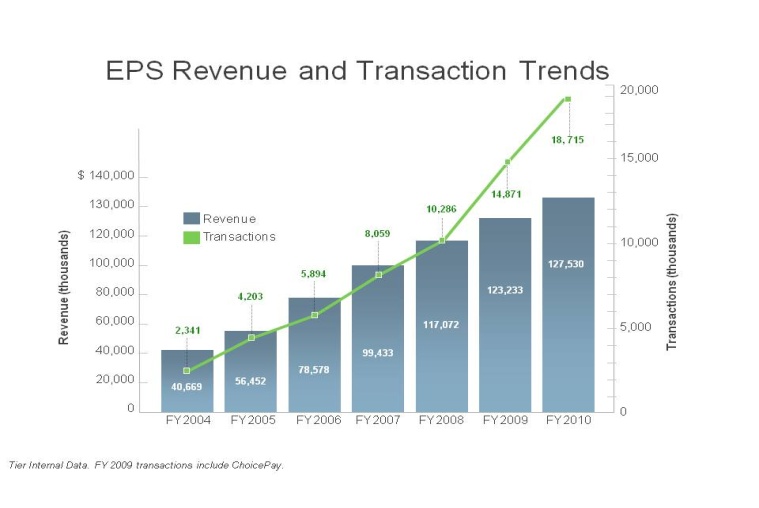
Our Continuing Operations consist of two reportable segments, Electronic Payment Solutions, or EPS, operations and Wind-down operations. Our Wind-down operations consist of one business area that we intend to wind down over the next two years. Revenues from our EPS operations were $127.2 million for the fiscal year ended September 30, 2010. For the fiscal year ended September 30, 2010, transaction volume increased 25.9% and total dollars processed increased 13.0% over the same period last year. Our EPS operations reported a net loss of $6.2 million for fiscal 2010. Revenues from our EPS operations make up 97.7% of our revenues from Continuing Operations. The seasonality of our business causes fluctuations from one quarter to the next within our revenues and direct costs. However, our general and administrative and selling and marketing expenses are more fixed in nature. We have successfully streamlined our costs to support our Wind-down operations, while still effectively managing our ongoing contracts.
Discontinued Operations is a reportable segment, which consists of businesses we have divested through fiscal year 2009. We incur minimal residual expense relating to our divested operations. For the fiscal year ended September 30, 2010 we reported a net loss of $0.2 million for Discontinued Operations primarily associated with legal fees and restructuring expense as well as the write-off of a receivable determined to be uncollectible. These expenses were offset by a $0.6 million earn-out we received from the company that purchased our former Government Business Process Outsourcing, or GBPO, business, pursuant to a Purchase and Sale Agreement dated June 9, 2008.
ELECTRONIC PAYMENT SOLUTIONS
Our core business consists of our biller direct solutions, which we refer to as Electronic Payment Solutions, or EPS. We offer our services using several pricing options such as transaction fee, convenience fee, flat fee, or client absorbed fee (fees paid directly by the client, in lieu of those charges being paid by the constituent using the service), which can be billed as a percentage fee, a fixed fee, or some combination of both. We provide services and solutions in several different verticals. Our client base includes the U.S. Internal Revenue Service, or IRS, 27 states, the District of Columbia and nearly 4,600 additional clients, consisting primarily of local governments and other public sector clients and approximately 100 private sector clients. We processed 18.7 million customer transactions, representing $7.8 billion in payments processed across all of our verticals during fiscal 2010. As of September 30, 2010, we offered nearly 9,200 payment types. In certain instances, each customer transaction is composed of two sub-transactions, one for the payment amount and one for the fee.
Verticals
Federal—We provide businesses and individuals the opportunity to pay certain federal income and business tax obligations electronically via credit or debit cards. Payment options include all major credit cards: American Express®, Discover®, MasterCard®, Visa® and all major debit cards including some regional ATM card networks. Payment channels include Internet, IVR, and agent (a third-party provider who accepts payments on behalf of our client). The revenues we receive for these services are typically based on a percentage of dollars processed. During tax year 2010, we provided payment services for 23 types of tax forms for the IRS. The leading form paid through our services is the individual IRS Form 1040, and when taxpayers submit this form, they typically pay the “balance due” on their taxes at the conclusion of the tax year. Based on the timing of tax obligation due dates, we typically see higher revenues during our second and third quarters within this payment vertical, primarily due to the April 15th federal income tax deadline for personal and business income tax payments. Revenues from our Federal vertical represented 20.5% of EPS revenues for fiscal year 2010. Our contract with the IRS to provide payment services for federal tax payments contributed 17.1% of our EPS revenue for fiscal year 2010.
2
State and Local—We offer a variety of electronic payment solutions to state and local governments for electronic payments for personal income taxes and business taxes These governments can provide electronic payment options to their constituents via Internet, IVR, agent, POS, and wedge readers using all major credit cards (see above), debit cards and e-check. Based on the client contract, revenues can be earned in any of the pricing models mentioned above. Revenues earned within this vertical can be seasonal by nature, as due dates for various state and local taxes determine the timing of revenue earned. For fiscal year 2010, this vertical represented 8.5% of EPS revenue. None of our clients within this vertical contributed more than 10% to our total revenues for EPS for fiscal year 2010.
Property Tax—We offer a variety of electronic payment solutions to state and local governments for the collection of real property taxes. Electronic payment options include Internet, IVR, agent, POS, and wedge readers using all major credit cards (see above), debit cards and e-check. Depending on the client contract, revenues can be earned in any of the pricing models mentioned above. As with any of our tax-based business, revenues earned are seasonal by nature, as due dates for various state and local taxes determine the timing of revenue. For fiscal year 2010, this vertical represented 27.3% of EPS revenue. None of our clients within this vertical contributed more than 10% to our total revenues for EPS for fiscal year 2010.
Utility—Within this vertical we allow customers and constituents of various companies and municipalities to pay their utility obligations electronically using all major credit cards (see above), debit card, e-check, cash or money order. The utility company customers can utilize the Internet, IVR, POS, agent, walk-up locations or kiosks to make these payments. For fiscal year 2010, this vertical represented 15.3% of EPS revenue. None of our clients within this vertical generated more than 10% of our EPS revenues for fiscal year 2010.
Education—Our solutions within the education vertical service post-secondary education institutions. Solutions we provide to these clients include electronic payment options for tuition and fee payments, housing and alumni donations. Individuals with obligations to post-secondary institutions may pay their obligations using all major credit cards (as above) and e-check via Internet, IVR and POS. During fiscal year 2010, this vertical represented 13.6% of EPS revenue. None of our clients within this vertical generated more than 10% of our EPS revenues for fiscal year 2010.
Other—Our “other” vertical encompasses state and local courts and citations, rent payments and insurance payments for various entities, electronic payment options for meal and fee payments for K-12 educational institutions, plus personal property tax payments. Generally speaking, all major credit cards and e-check are accepted payment forms using the following payment channels: Internet, IVR, POS, agent, and wedge readers. During fiscal year 2010, this vertical represented 14.8% of our EPS revenues.
Revenue Trends
As seen in the chart below, EPS revenue and transaction volumes have increased over the past six years. These increases are attributable to several factors: (1) the shift among federal, state and local governments, education institutions and private entities to electronic payment options, (2) organic growth, including adding new vertical and payment options, and (3) general market shift in consumer preference from cash and check to electronic forms of payment.
3
Commencing in the fall of 2006, our Board oversaw a strategic review of our business. That review resulted in a decision to focus on electronic payment solutions and divest our other businesses. During fiscal 2009, we completed the divestiture of our former GBPO business and our former Packaged Software Systems Integrations, or PSSI, business. As part of our strategic decision to focus on electronic payment solutions, we have also invested in growing new verticals, especially education and utilities. We made these investments to provide a richer value proposition to our end-users by offering more billers and payment types that could be accessed through our primary site OfficialPayments.com and to diversify the risk to our investors by balancing concentration in vertical markets. The federal income tax vertical, which used to represent more than half of total company revenue, is now just over 20% of EPS revenue. Our education and utilities verticals, which were small to non-existent in 2007, currently represent more than 10% of EPS revenue.
|
Vertical
|
Revenue Contribution
Fiscal year 2010
|
CAGR(1)
|
|
Federal
|
20.5%
|
(9.3)%
|
|
State and Local
|
8.5%
|
5.4%
|
|
Property Tax
|
27.3%
|
3.1%
|
|
Utility
|
15.3%
|
55.6%
|
|
Education
|
13.6%
|
53.4%
|
|
Other
|
14.8%
|
11.5%
|
|
Total
|
100.0%
|
8.6%
|
|
(1)Compound Annual Growth Rate of EPS Revenue for Fiscal Year 2007 to Fiscal Year 2010
|
||
WIND-DOWN OPERATIONS
As of September 30, 2010, our Wind-down operations consist of our VSA business from our former GBPO segment whose operations are neither compatible with our long-term strategic direction nor complementary
4
with the other business units that we divested. We intend to complete these projects over the next two years. Our VSA business provides interactive voice response systems and support services, including customization, installation and maintenance. We service over 100 customers within this business. None of the VSA customers contributed more than 10% of our consolidated revenues.
DATA SECURITY
Tier takes the integrity and security of the financial information it processes on behalf of individuals, businesses and other entities seriously. We are PCI Data Security Standard and National Automated Clearing House Association compliant, meaning we have professional security standards in place to protect the information we obtain to process electronic payments. We also undergo an annual comprehensive audit by the IRS. Tier has secured or is in the process of securing Money Transmitter Licenses in every state where this legislation is applicable.
During fiscal 2010, the responsibilities of our Data Security Committee of the Board of Directors were expanded to include operational risks. This committee’s primary function is to act on behalf of the board in fulfilling data security management responsibilities as defined by applicable law and regulations, as well as policies and procedures developed internally by Tier management. The Data Security Committee oversees our work on identifying and evaluating security and operational risks and implementing safeguards and programs on data security integrity and mitigation of security risks. This committee works with Tier management to enhance current, and develop new, technical policies and procedures which will strengthen security measures.
TECHNOLOGY
As a result of a number of acquisitions, including Official Payments Corporation, or OPC, EPOS Corporation and most recently, ChoicePay, Inc., we operate our business on multiple technology platforms. In 2009, we made the decision to consolidate our operations onto a single technology platform over time. While we have made some progress in the consolidation efforts, we determined in fiscal 2010 that completion of the development of a consolidated platform and the migration of our approximately 4,600 biller direct clients to that platform would take longer than originally anticipated. We are continuing to evaluate the platform consolidation project. We expect to review our plans related to a consolidated platform in mid-fiscal 2011. At this time, we have postponed all migration plans for current customers. During fiscal year 2011, we expect that our technology efforts will focus principally on (1) increasing platform stability by improving the platforms’ availability and reliability, (2) improving security and compliance, (3) retention of existing clients, by increasing the products and features available to clients, and (4) completion of infrastructure initiatives.
SEGMENT REPORTING
Tier manages and reports its business in three segments: EPS, Wind-down and Discontinued operations. Our Discontinued Operations consists of portions of our former GBPO and PSSI segments, which we have sold. Detailed information about the profitability of EPS and Wind-down can be found in Note 11—Segment Information to our Consolidated Financial Statements. Information about our Discontinued Operations can be found in Note 14—Discontinued Operations to our Consolidated Financial Statements.
SALES AND MARKETING
Our sales and marketing objective is to develop relationships with customers and clients that result in repeat long-term and cross-sale engagements. Throughout fiscal year 2010 our selling and marketing efforts have been dedicated to the growth of our EPS business. We have focused on upgrading our strategic information systems to allow us to establish direct relationships with end-users of our services, to grow transactions across verticals, and deepen the strength of our primary brand Official Payments. We continue these initiatives in utilizing our dedicated sales force, network of partnerships, experienced marketing team, and our senior executive group. Members of our executive team have a wide range of industry contacts and
5
established reputations in the electronic payments industry. They play a key role in developing, selling and managing major engagements. As a result of our market-focused sales approach, we believe that we are able to identify and qualify for opportunities quickly and cost-effectively.
We employ an integrated marketing strategy that creates broad-scale awareness to support targeted marketing initiatives to our existing and prospective customers and clients. These coordinated efforts are delivered by leveraging the resources and communication channels of our strategic partners, vertical clients and our own Official Payments communication channels. Our reliance on marketing partnerships has begun to diminish as the Official Payments customer base and client footprint have grown and we have successfully developed our own online targeted communication channels including email, web promotion and cross sell initiatives.
We are launching programs to increase customer adoption and utilization through expanded cross-selling capabilities and enhanced My Account functionality. My Account is a personal registration function offered through our subsidiary, Official Payments Corporation. We plan to launch new e-commerce products and payment services for partners and biller direct clients including additional payment channels such as mobile and walk-up payment.
INTELLECTUAL PROPERTY RIGHTS
Our success depends, in part, on protection of our methodologies, solutions and intellectual property rights. We rely upon a combination of nondisclosure, licensing and other contractual arrangements, as well as trade secret, copyright and trademark laws to protect our proprietary rights and the proprietary rights of third parties from whom we license intellectual property. We enter into nondisclosure agreements with all our employees, subcontractors and parties with whom we team. In addition, we control and limit distribution of proprietary information.
COMPETITION
The biller direct payments category is highly competitive and served by a wide array of organizations involved in transaction payment markets including Link2Gov, a subsidiary of FIS; RBS WorldPay; SallieMae Business Office Solutions; TouchNet Information Systems, Inc; CheckFree and Bill Matrix, subsidiaries of Fiserv; Oracle, and Online Resources. We believe that the principal competitive factors in our markets include reputation, industry expertise, client breadth, speed of development and implementation, technical expertise, effective marketing programs, competitive pricing and the ability to deliver results in a timely manner.
AVAILABLE INFORMATION
Our Internet address is www.tier.com. There we make available, free of charge, our annual report on Form 10-K, quarterly reports on Form 10-Q, current reports on Form 8-K and any amendments to these reports, as soon as reasonably practicable after we electronically file such material with or furnish it to the Securities and Exchange Commission, or SEC. Our SEC reports can be accessed through the Investor Relations section of our Web site. The information found on our Web site is not part of this or any other report we file with or furnish to the SEC.
Investing in our common stock involves a degree of risk. You should carefully consider the risks and uncertainties described below in addition to the other information included or incorporated by reference in this annual report. If any of the following risks actually occur, our business, financial condition or results of operations would likely suffer. In that case, the trading price of our common stock could fall.
The following factors and other risk factors could cause our actual results to differ materially from those contained in forward-looking statements in this Form 10-K.
6
We have incurred losses in the past and may not be profitable in the future. While we reported net income of $1.1 million in fiscal year 2005, we have reported net losses of $6.2 million in fiscal 2010, $11.5 million in fiscal 2009, $27.4 million in fiscal 2008, $3.0 million in fiscal 2007, and $9.5 million in fiscal 2006.
Our revenues and operating margins may decline and may be difficult to forecast, which could result in a decline in our stock price. Our revenues, operating margins and cash flows are subject to significant variation from quarter to quarter due to a number of factors, many of which are outside our control. These factors include:
|
·
|
economic conditions in the marketplace, including recession;
|
|
·
|
loss of significant clients;
|
|
·
|
demand for our services;
|
|
·
|
seasonality of business, resulting from timing of property tax payments and federal and state income tax payments;
|
|
·
|
timing of service and product implementations;
|
|
·
|
unplanned increases in costs;
|
|
·
|
delays in completion of projects;
|
|
·
|
intense competition;
|
|
·
|
costs of compliance with laws and government regulations; and
|
|
·
|
costs of acquisitions, consolidation and integration of new business and technology.
|
The occurrence of any of these factors may cause the market price of our stock to decline or fluctuate significantly, which may result in substantial losses to investors. We believe that period-to-period comparisons of our operating results are not necessarily meaningful and/or indicative of future performance. From time to time, our operating results may fail to meet analysts’ and investors’ expectations, which could cause a significant decline in the market price of our stock. Fluctuations in the price and trading volume of our stock may be rapid and severe and may leave investors little time to react. Other factors that may affect the market price of our stock include announcements of technological innovations or new products or services by competitors and general economic or political conditions, such as recession, acts of war or terrorism. Fluctuations in the price of our stock could cause investors to lose all or part of their investment.
Our income tax and property tax processing revenue has been negatively impacted by recent economic conditions and may continue to decline. As a result of the current global and U.S. economic conditions, including unemployment and real estate foreclosures, we have suffered a downturn in revenue in our property tax and federal verticals, due to decreased payments of federal income tax and property tax by taxpayers who pay taxes on our website and IVR payment processing systems. If current conditions do not improve, additional declines in revenue may occur, especially in the property tax and federal verticals, negatively impacting use of our services and our overall revenues.
We could suffer material losses and liability if our operations, systems or platforms are disrupted or fail to perform properly or effectively. The continued efficiency and proper functioning of our technical systems, platforms, and operational infrastructure is integral to our performance. We operate on multiple platforms. If any or all of the platforms or portions of the platforms, systems, or resources are disrupted or fail to perform properly or effectively, we could incur significant remediation costs and we might not be able to process transactions or provide services during the disruption or failure, which would result in a decrease in revenue. Our operations, systems and platforms might be disrupted or fail to perform properly for many reasons including operational or technical failures of our systems and platforms, human error, failure of third-party support and services, system failure due to age and lack of integrity of hardware and software infrastructure, existence of single points of failure which has resulted in system interruption and outages, diminished availability and reliability of our services causing us to fail to meet contractual service level requirements, and loss of key individuals or failure of key individuals to perform who have unique knowledge of system architecture and platform customizations. We process a high volume of time-sensitive payment
7
transactions. The majority of our tax-related transactions are processed in short periods of time, including between April 1 and April 15 of each tax year for federal tax payments. If there is a defect or malfunction in our platforms or system software or hardware, an interruption or failure due to damage or destruction, a loss of system or platform functionality, a delay in our system processing speed, a lack of system capacity, or a loss of personnel on short notice, even for a short period of time, our ability to process transactions and provide services may be significantly limited, delayed or eliminated, resulting in lost business and revenue and harm to our reputation. We might be required to incur significant costs to remediate or address any such defect, malfunction, interruption, failure, loss of functionality, delay, lack of capacity, or loss of personnel. Our insurance may not provide coverage or be adequate to compensate us for losses that may occur as a result of any such event, or any system, platform, security or operational failure or disruption.
In the event we proceed with consolidation of our technology platforms, the consolidation involves significant risk and may not be successful or may be delayed. We are in the process of evaluating the consolidation of our technology platforms. We currently maintain three processing platforms: one in San Ramon, California; one in Auburn, Alabama; and a third in Tulsa, Oklahoma, which we recently acquired in the ChoicePay acquisition. Consolidation of our technology platforms could result in significant risks, including restricted and limited transaction volume, operational inefficiencies, inability to add new products or services, inability to achieve our goals for fiscal year 2011 and 2012, inability to expand existing products and services, significant development costs, higher labor costs, increased hardware and software costs, inability to provide certain functionality, or system and service disruption or failure. Our business is highly dependent upon having safe and secure information technology platforms with sufficient capacity to meet both the high volume of transactions and the future growth of our business. If our ability to develop and/or acquire upgrades or replacements for our existing platforms does not keep pace with the growth of our business, we may not be able to meet our requirements for the sustainable and economic growth of the business. Furthermore, if we are not able to acquire or develop these platforms and systems on a timely and economical basis, our profitability may be adversely affected. If we are unable to successfully integrate and consolidate these technology platforms it could result in a significant loss of clients, loss of revenues, and risk of liability.
We could suffer material losses or significant disruption of our operations and business if we are not successful in integration and consolidation of our operations. We are consolidating and moving certain operations, facilities, departments, and positions as part of our strategic plan to save costs and eliminate duplicative operations and functions. We completed consolidation of the customer service/call center, client services, implementation services, and some information technology services from San Ramon, California, and Tulsa, Oklahoma, to our existing facility in Auburn, Alabama, and we consolidated financial operations to Reston, Virginia. If this restructuring and consolidation is not successful, we could suffer disruption of our operations, systems or services; incur a significant increase in costs; or suffer a loss of valuable staff and historical knowledge, which could have a material adverse impact on our business, significantly increase operating costs and result in operational weaknesses and compliance deficiencies. On January 27, 2009, we purchased substantially all of the assets of ChoicePay, Inc., an ePayments solution provider based in Tulsa, Oklahoma. The acquisition included intellectual property, the ChoicePay processing platform, systems, operations, services, products, clients, employees, and other resources. We may not be successful in integrating the acquired assets into our existing business, which could result in disruption of operations, inefficiencies, excess costs, legal and financial liability, additional outsourcing of services and consulting charges, failure to provide services and products as contracted with clients and vendors, and impairment of earning and operating results.
Security breaches or unauthorized access to confidential data and personally identifiable information in our facilities, computer networks, or databases, or those of our suppliers, may cause harm to our business and result in liability and systems interruptions. Our business requires us to obtain, process, use, and destroy confidential and personally identifiable data and information of clients and consumers. We have programs, procedures and policies in place to protect against security breaches, unauthorized access and fraud. Despite security measures we have taken, our systems may be vulnerable to physical break-ins, fraud, computer viruses, attacks by hackers and similar acts and events, causing interruption in service and
8
loss or theft of confidential data and personally identifiable information that we process and/or store. It is possible that our security controls over confidential information and personal data, our training on data security, and other practices we follow may not prevent the improper disclosure or unauthorized access to confidential data and personally identifiable information. In addition, our service could be subject to employee fraud or other internal security breaches, and we may be required to reimburse customers for any funds stolen as a result of such actions or breaches. Our third-party vendors or suppliers also may experience security breaches, fraud, computer viruses, attacks by hackers or other similar incidents involving the unauthorized access and theft of confidential data and personally identifiable information. In January 2009, Heartland Payment Systems reported a breach of security of its systems resulting in the loss or theft of personally identifiable information. We contract with Heartland for certain payment processing services for credit and debit transactions in the education market. Although no security breach occurred within our systems, and there is no specific information to date that our clients’ or their related consumers’ information or data was compromised as a result of this incident, if such client or consumer data and information was lost or stolen, such an incident could potentially result in compliance costs, loss of clients and revenues, liability and fines. Any security breach within our systems, software or hardware or our vendors’ or suppliers’ systems, software or hardware could result in unauthorized access, theft, loss, disclosure, deletion or modification of such data and information, and could cause harm to our business and reputation, liability for fines and damages, costs of notification, and a loss of clients and revenue.
Financial loss could result from fraudulent payments, lack of integrity of systems, or fraudulent use of our systems or the systems of third parties. We receive funds and facilitate payment and settlement of funds on behalf of clients, consumers and businesses for a variety of transaction types including debit/credit cards, ACH payments and other electronic bill payments. Our facilitation of these payments depends on the integrity of our systems and our technology infrastructure as well as the integrity of the systems and technology infrastructure of third parties in the payment transaction process such as financial institutions, processors, networks, and other businesses, and vendors and suppliers. In addition, our service could be subject to employee fraud or other internal security breaches, and we may be required to reimburse customers for any funds stolen as a result of such actions or breaches. If the integrity of this payment process is impaired or the ability to detect fraud or fraudulent payments compromised, including in connection with verification, authentication, settlement, and other payment processes, it could result in financial loss.
We could suffer material losses and liabilities if the services of any of our third party suppliers, vendors or other providers are disrupted, eliminated or fail to perform properly or effectively. Our payment solution services, systems, security, infrastructure and technology platforms are highly dependent on third party services, software, hardware, including data transmission and telecom service providers, subcontractors, co-location facilities, network access providers, card companies, processors, banks, merchants and other suppliers and providers. We also provide services on complex multi-party projects where we depend on integration and implementation of third-party products and services. The failure or loss of any of these third party systems, services, software or products, our inability to obtain third party replacement services, or damage to or destruction of such services could cause degraded functionality, loss of product and service offerings, restricted transaction capacity, limited processing speed and/or capacity, or system failure, which could result in significant cost, liability, diminished profitability and damage to our reputation and competitive position. Our insurance may not provide coverage or be adequate to compensate us for losses that may occur as a result of any such event, or any system, security or operational failure or disruption.
Our revenues and cash flows could decline significantly if we were unable to retain our largest client, or a number of significant clients. The majority of our client contracts, including our contract with the U.S. Internal Revenue Service, allow clients to terminate all or part of their contracts on short notice, or provide notice of non-renewal with little prior notification. Our contract with the IRS has generated 17.1%, 19.8%, and 27.8% of our annual revenues from Electronic Payment Solutions for fiscal years 2010, 2009, and 2008, respectively. In April 2009 we were one of three companies awarded a multi-year contract by the IRS to provide electronic payment solutions for personal and business taxes. The contract contains a base period
9
commencing April 2, 2009 and ending December 31, 2009 and four one-year option periods running until December 31, 2013. To obtain this contract, we reduced our historical pricing. We compete with the other contract award recipients to provide services to the IRS. If the other recipients reduce their prices, or if additional companies are awarded contracts, we may have to reduce our prices further to remain competitive. If we were unable to retain this client, or replace it in the event it is terminated, or if we were unable to renew this contract, or are unsuccessful in future re-bids of this contract, or if we are forced to reduce our prices in response to competitive pressures, our operating results and cash flows could decline significantly. Termination or non-renewal of a number of client contracts, or certain significant client contracts, including the IRS contract, or a number of large state, local, utility or education-related contracts, could result in significant loss of revenues and reduction in profitability.
Violation of any existing or future laws or regulations, including laws governing money transmitters and anti-money laundering laws, could expose us to substantial liability and fines, force us to cease providing our services, or force us to change our business practices. Our business is subject to numerous federal and state laws and regulations, including some states’ money transmitter regulations and related licensing requirements, and anti-money laundering laws. Compliance with federal and state laws and government regulations regarding money transmitters, money laundering, privacy, data security, fraud, and other laws and regulations associated with payment transaction services is critical to our business. New laws and regulations in these areas may be enacted, or existing ones changed, which could negatively impact our services, restrict or eliminate our ability to provide services, make our services unprofitable, or create significant liability for us. Our anti-money laundering program requires us to monitor transactions, report suspicious activity, and prohibit certain transactions. We are registered as a money services business, have a number of state money transmitter licenses and have additional applications for licensure as a money transmitter pending. We entered into consent orders with two states which included payment of a fine for unlicensed activity prior to our submission of the money transmitter application, and two other states have imposed an assessment or fine. In the future we may be subject to additional states’ money transmitter regulations, money laundering regulations, regulation of internet transactions, and related payment of fees and fines. We are also subject to the applicable rules of the credit/debit card association, the National Automated Clearing House Association (NACHA), and other industry standards. If we are found to be in violation of any laws, rules, regulations or standards, we could be exposed to significant financial liability, substantial fines and penalties, cease and desist orders, and other sanctions that could restrict or eliminate our ability to provide our services in one or more states or accept certain types of transactions in one or more states, or could force us to make costly changes to our business practices. Even if we are not forced to change our business practices, the costs of compliance and obtaining necessary licenses and regulatory approvals, could be substantial.
We could suffer material revenue losses and liability in the event the divested business projects and contracts are not successfully concluded. We have completed divestment of certain operations and portions of the business including our former Financial Institutions Data Match services, State Systems Integration, Financial Management Systems and Unemployment Insurance operations. Certain divestitures include contractual earn-outs and revenue sharing arrangements based on the buyers’ successful operation of the businesses divested. If the businesses are not profitable or there are revenue shortfalls, we may not receive the expected benefits from the divestitures, which could have an adverse impact on our revenues. Additionally, we remain liable for certain obligations under some of the divested projects and their related contracts. In February 2009, we completed the sale of our Unemployment Insurance, or UI, business to RKV Technologies, Inc, or RKV. The sale was completed pursuant to an Asset Purchase Agreement dated February 6, 2009. As a part of the agreement, Tier is required to leave in place a $2.4 million performance bond on the continuing contract for the State of Indiana, or the State. Subsequent to the sale of the UI business to RKV, the prime contractor, Haverstick Corporation, or Haverstick, the State, and RKV determined that the contract completion would be delayed and additional funding would be needed to complete the contract. In November 2009 Haverstick cancelled its contract with RKV and directly rehired various RKV resources and contractors. Tier retains certain liabilities for completion of the project, and continues as the indemnitor under the performance bond. Mediation is expected to take place by September 2011 to discuss the costs of project completion. If this contract or other divested contracts are not performed
10
successfully, or if there is a claim of delay or breach in connection with services or products provided by either us or the acquiring company, liability to Tier could result, causing damages, unanticipated costs, bond forfeitures and loss of revenue.
As a result of our divestitures and the transition to a primary focus on electronic payment solutions, our business is less diverse and therefore more vulnerable to changes affecting the electronic payments business generally. Our focus on electronic payment solutions since fiscal year 2007 and the divestiture of the majority of our legacy business units unrelated to electronic payment solutions, including software licensing and government system integration businesses, has resulted in loss of historical revenue sources and a decrease in diversification of services and markets. In the event of a business downturn in the electronic payment solutions business due to increased competition, loss of clients, economic conditions, technology changes, or in the event of increased costs, disruption in services, a change in laws, or other events related to the electronic payment solutions business, there could be a greater negative impact on our revenues than if we had retained our diverse businesses.
If we undertake acquisitions, they could be expensive, increase our costs or liabilities or disrupt our business. One of our strategies may be to pursue growth through acquisitions. Negotiations of potential acquisitions and the integration of acquired business operations could disrupt our business by diverting management attention away from day-to-day operations. Acquisitions of businesses or other material operations may require additional debt or equity financing, resulting in leverage or dilution of ownership. We also may not realize cost efficiencies or synergies that we anticipated when selecting our acquisition candidates. In addition, we may need to record write-downs from future impairments of identified intangible assets and goodwill, which could reduce our future reported earnings. Acquisition candidates may have liabilities or adverse operating issues that we fail to discover through due diligence prior to the acquisition. Any costs, liabilities or disruptions associated with any future acquisitions we may pursue could harm our operating results.
Changes in laws and government and regulatory compliance requirements may result in additional compliance costs and may adversely impact our reported earnings. Our business is subject to numerous federal, state and local laws, government regulations, corporate governance standards, compliance controls, accounting standards, licensing and bonding requirements, industry/association rules, and public disclosure requirements including under the Sarbanes Oxley Act of 2002, SEC regulations, and Nasdaq Stock Market rules. Compliance with and changes in these laws, regulations, standards and requirements may result in increased general and administrative expenses for outside services, increased risks associated with compliance, and a diversion of management time and attention from revenue-generating activities, which could curtail the growth of our business.
On July 21, 2010, the Dodd-Frank Wall Street Reform and Consumer Protection Act of 2010 (the “Dodd-Frank Act”), was signed into law which implements new laws and regulations. At this time, it is difficult to predict the extent to which the Dodd-Frank Act or the resulting rules and regulations will impact our business. Compliance with these new laws and regulations will likely result in additional costs which could be significant and could adversely impact the Company’s results of operations, financial condition and liquidity.
We operate in highly competitive markets. If we do not compete effectively, we could face price reductions, reduced profitability and loss of market share. Our business is focused on electronic payment transaction solutions and e-commerce services, which are highly competitive markets and are served by numerous international, national and local firms. Many of our competitors have significantly greater financial, technical and marketing resources and name recognition than we do. In addition, there are relatively low barriers to entry into these markets, and we expect to continue to face additional competition from new entrants into our markets. Parts of our business are subject to increasing pricing pressures from competitors, as well as from clients facing pressure to control costs. Some competitors are able to operate at significant losses for extended periods of time, which increases pricing pressure on our products and services. If we do not compete effectively, the demand for our products and services and our revenue growth and operating margins could decline, resulting in reduced profitability and loss of market share.
11
Our revenues may fluctuate, and our ability to maintain profitability is uncertain. Our business primarily provides credit and debit card and electronic check payment options for the payment of federal and state personal income taxes, real estate and personal property taxes, business taxes, fines for traffic violations and parking citations, educational, utility and rent obligations. Our revenues depend on consumers’ continued willingness to pay a convenience fee and our relationships with clients, such as government taxing authorities, educational institutions, public utilities and their respective constituents. Demand for our services could decline if consumers are not receptive to paying a convenience fee, card associations change their rules, laws are passed that do not allow us to charge the convenience fees, or if credit or debit card issuers, marketing partners, or alliance partners change terms, terminate services or products, or eliminate or reduce the value of rewards to consumers under their respective rewards programs. The fees charged by credit/debit card associations, financial institutions, and our suppliers can be increased with little or no notice, which could reduce our margins and harm our profitability.
Demand for our services could also be adversely affected by a decline in the use of the Internet, economic factors such as a decline in availability of credit, increased unemployment, foreclosures, or consumer migration to a new or different technology or payment method. The use of credit and debit cards and electronic checks (ACH) to make payments is subject to increasing competition and rapid technological change. If we are not able to develop, market and deliver competitive technologies, our market share will decline and our operating results and financial condition could suffer.
Change in interchange rates could have a significant impact on our cost of revenue generation. Interchange rates charged by credit and debit card companies through card issuing banks are a major factor in our delivery costs for the services we perform. A change in such rates could have a significant impact on our financial performance. On July 21, 2010, President Obama signed HR 4173, the Dodd-Frank Wall Street Reform and Consumer Protection Act. Section 1075 of this legislation requires the Federal Reserve to set guidelines for reasonable interchange transaction fees for electronic debit transactions. The Federal Reserve has nine months from the date of enactment to publish guidelines and the guidelines will become effective one year from the date of enactment. Among areas of relevance to the Company, the law provides for assessing if any interchange transaction fee is reasonable and proportionate to the cost incurred by the card issuer with respect to the transaction and prohibits payment card networks from restricting the number of payment card networks on which an electronic debit transaction may be processed, prohibits payment card networks from inhibiting the ability of the Company from setting a minimum transaction amount for credit card transactions.
The success of our business is based largely on our ability to attract and retain talented and qualified employees and contractors. The market for skilled workers in our industry is extremely competitive. In particular, qualified managers and senior technical and professional staff are in great demand. If we are not successful in our recruiting efforts or are unable to retain key employees, our ability to staff projects and deliver products and services may be adversely affected. We believe our success also depends upon the continued services of senior management and a number of key employees whose employment may terminate at any time. If one or more key employees resigns to join a competitor, to form a competing company, or as a result of termination or a divestiture, the loss of such personnel and any resulting loss of existing or potential clients could harm our competitive position.
If we are not able to protect our intellectual property, our business could suffer serious harm. Our systems and operating platforms, scripts, software code and other intellectual property are generally proprietary, confidential, and may be trade secrets. We protect our intellectual property rights through a variety of methods, such as use of nondisclosure and license agreements and use of trade secret, copyright and trademark laws. Despite our efforts to safeguard and protect our intellectual property and proprietary rights, there is no assurance that these steps will be adequate to avoid the loss or misappropriation of our rights or that we will be able to detect unauthorized use of our intellectual property rights. If we are unable to protect our intellectual property, competitors could market services or products similar to ours, and demand for our offerings could decline, resulting in an adverse impact on revenues.
12
We may be subject to infringement claims by third parties, resulting in increased costs and loss of business. Our business is dependent on intellectual property rights including software license rights and restrictions, and trademark rights. From time to time we receive notices from others claiming we are infringing on their intellectual property rights. Defending a claim of infringement against us could prevent or delay our providing products and services, cause us to pay substantial costs and damages or force us to redesign products or enter into royalty or licensing agreements on less favorable terms. If we are required to enter into such agreements or take such actions, our operating margins could decline.
As a result of the recent conditions in the financial and credit markets we may not be able to obtain credit. The recent worldwide and U.S. economic crisis has made it difficult to borrow money or obtain credit. We currently have no credit line or credit facility and rely solely on cash on hand, investments and cash from operations to fund our business. If current levels of economic and market disruption and volatility continue or worsen, there can be no assurance that credit, bank loans, contractual lending agreements or other funding sources will be available on reasonable terms, or at all. If we were not able to fund operations our level of services, staffing, resources or equipment may need to be reduced or eliminated which could negatively impact our revenue and stock price.
If we are not able to obtain adequate or affordable insurance coverage or bonds, we could face significant liability claims and increased premium costs and our ability to compete for business could be compromised. We maintain insurance to cover various risks in connection with our business. Additionally, our business includes projects that require us to obtain performance, statutory and bid bonds from a licensed surety. There is no guarantee that such insurance coverage or bonds will continue to be available on reasonable terms, or at all. If we are unable to obtain or maintain adequate insurance and bonding coverage, potential liabilities associated with the risks discussed in this report could exceed our coverage, and we may not be able to obtain new contracts or continue to provide existing services, which could result in decreased business opportunities and declining revenues.
Our markets are changing rapidly. If we are not able to adapt to changing conditions, we may lose market share and may not be able to compete effectively. The markets for our products are characterized by rapid changes in technology, client expectations and evolving industry standards. Our future success depends on our ability to innovate, develop, acquire and introduce successful new products and services for our target markets and to respond quickly to changes in the market. If we are unable to address these requirements, or if our products or services do not achieve market acceptance, we may lose market share, and our revenues could decline.
Our business is subject to increasing performance requirements, which could result in reduced revenues and increased liability. On certain projects we make performance guarantees, based upon defined operating specifications, service levels and delivery dates, which are sometimes backed by contractual guarantees and performance, statutory or bid bonds. Unsatisfactory performance of services, disruption of services, or unanticipated difficulties or delays in processing payments or providing contracted services may result in termination of the contract, a reduction in revenues, liability for penalties and damages, or claims against a bond. Additionally, the failure to meet client expectations could damage our reputation and compromise our ability to attract new business.
ITEM 1B—UNRESOLVED STAFF COMMENTS
There are no unresolved written comments that were received from the Securities and Exchange Commission’s staff 180 days or more before the end of our fiscal year 2010 regarding our periodic or current reports under the Securities Exchange Act of 1934.
As of September 30, 2010, we leased 38,324 square feet of space throughout the country, which includes our 25,583 square foot corporate headquarters in Reston, Virginia. We also leased 12,741 square feet of space in
13
California and Oklahoma, to support portions of our EPS operations. In addition, we own a 28,060 square-foot building in Alabama which houses certain administrative, call center, and other operations.
We are not currently involved in any material pending legal proceedings.
14
The names, ages and positions of our executive officers at November 1, 2010, are listed in the following table, together with their business experience during the past five years. Unless otherwise specified, all officers served continuously since the date indicated.
|
Name, age and position with Registrant
|
Date elected
or appointed
|
|
Alex P. Hart, Age 48 (a)
|
|
|
President, Chief Executive Officer and Director
|
August 2010
|
|
Ronald W. Johnston, Age 64 (b)
|
|
|
Senior Vice President, Chief Financial Officer
|
July 2008
|
|
Keith S. Kendrick, Age 53 (c)
|
|
|
Senior Vice President, Strategic Marketing
|
June 2008
|
|
Atul Garg, Age 44 (d)
|
|
|
Senior Vice President, Product Management
|
November 2010
|
|
Keith S. Omsberg, Age 49 (e)
|
|
|
Vice President, General Counsel and Corporate Secretary
|
April 2008
|
|
(a) Mr. Hart served as President of the Fuelman Fleet Cards business unit of Fleetcor Technologies, Inc., a provider of specialized payment products and services to commercial fleets, major oil companies and petroleum marketers, from September 2009 through August 2010. From May 2007 to April 2008 Mr. Hart served as Executive Vice President and General Manager of Electronic Banking Services for Check Free Corporation, a provider of financial electronic commerce products and services. From October 2002 to May 2007, he served as President and Chief Executive Officer of Corillian Corporation, a provider of online banking and bill payment software and services.
|
|
|
(b) Mr. Johnston served as a CFO partner with Tatum LLC, a professional services firm, from August 2007 through June 2008; CFO and Treasurer for Grantham Education Corporation, a for-profit post-secondary university, from October 2004 through March 2007; and CFO for WorldSpace Corporation, a satellite broadcast and content development company from September 2002 through September 2004.
|
|
|
(c) Mr. Kendrick served as Senior Vice President, Corporate Marketing and Strategy with EFunds Corporation, a publicly traded enterprise payments and data solutions company, from December 2005 through September 2007 and co-founder and Chief Executive Officer of Vericate Corporation, an analytical software company focused on fraud detection in the retail drug transaction industry, from January 2003 through March 2005.
|
|
|
(d) Mr. Garg served as Executive consultant, Senior Vice President with Fleetcor Technologies, Inc., a provider of specialized payment products and services to commercial fleets, major oil companies and petroleum marketers, from June 2009 to October 2010. Mr. Garg served as Senior Vice President, eBusiness from November 2007 to May 2009, Senior Vice President, Small Business Cards from October 2006 to November 2007, Senior Manager, Commercial Cards and Small Business from October 2004 to October 2006 and Director, Project Development, Private Label Credit Card from June 2002 to October 2004, for HSBC Bank USA, N.A., one of the world’s largest banks, providing personal financial services and commercial, global and private banking services.
|
|
|
(e) Mr. Omsberg served as Assistant General Counsel of Tier from June 2002 to April 2008.
|
|
ITEM 5—MARKET FOR REGISTRANT'S COMMON EQUITY, RELATED STOCKHOLDER MATTERS AND ISSUER PURCHASES OF EQUITY SECURITIES
Our common stock is quoted on the Nasdaq Global Market under the symbol TIER. On November 8, 2010, there were 203 record holders of our common stock. The quarterly high and low prices per share during fiscal 2010 and 2009 were as follows:
15
|
Fiscal year ended September 30,
|
||||||||||||||||
|
2010
|
2009
|
|||||||||||||||
|
High
|
Low
|
High
|
Low
|
|||||||||||||
|
First quarter
|
$ | 9.00 | $ | 7.43 | $ | 7.57 | $ | 3.41 | ||||||||
|
Second quarter
|
$ | 8.32 | $ | 7.10 | $ | 6.39 | $ | 4.48 | ||||||||
|
Third quarter
|
$ | 8.58 | $ | 5.99 | $ | 7.90 | $ | 4.35 | ||||||||
|
Fourth quarter
|
$ | 6.90 | $ | 4.53 | $ | 8.90 | $ | 7.10 | ||||||||
We have never declared or paid cash dividends on our common stock and do not anticipate doing so for the foreseeable future. Our current letter of credit facility prohibits us from declaring dividends.
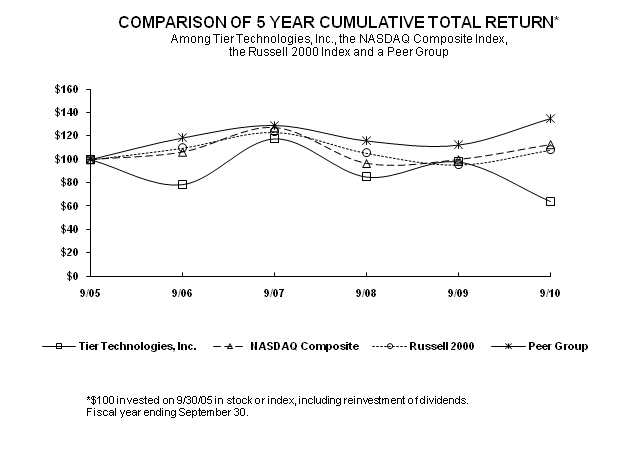
COMPARISON OF 5-YEAR CUMULATIVE TOTAL RETURN
The following graph compares the percentage change in cumulative stockholder return on our common stock for the period September 30, 2005 through September 30, 2010, with the cumulative total return on the NASDAQ Composite Index, the Russell 2000 Index and a composite of selected peers. The peer group consists of: ACI Worldwide Inc., Alliance Data Systems Corporation, Bottomline Technologies (de), Inc, Fiserv, Inc., Global Payments Inc., Heartland Payment Systems, Inc., Jack Henry & Associates, Inc, Online Resource Corporation, Total Systems Services Inc and Wright Express Corporation. We selected these companies because these are all the public companies that operate primarily in the electronic payments industry. We have included a peer group index this year in order to facilitate a comparison between an investment in Tier and an investment in other companies in our industry. The comparison assumes $100.00 was invested on September 30, 2005 in our common stock and in each of the foregoing indices and assumes reinvestment of all dividends, if any.
16
|
Measurement
Date
|
Tier
Technologies, Inc.
|
NASDAQ
Composite
|
Russell
2000
|
Peer
Group
|
||||||||||||
|
9/30/05
|
$ | 100.00 | $ | 100.00 | $ | 100.00 | $ | 100.00 | ||||||||
|
9/30/06
|
78.61 | 106.39 | 109.92 | 118.44 | ||||||||||||
|
9/30/07
|
117.92 | 127.37 | 123.49 | 129.16 | ||||||||||||
|
9/30/08
|
85.09 | 96.70 | 105.60 | 115.92 | ||||||||||||
|
9/30/09
|
98.03 | 100.00 | 95.52 | 112.39 | ||||||||||||
|
9/30/10
|
64.05 | 112.86 | 108.27 | 134.99 | ||||||||||||
The information included under the heading "Comparison of 5 Year Cumulative Total Return" in Item 5 of this Annual Report on Form 10-K is "furnished" and not "filed" and shall not be deemed to be "soliciting material" or subject to Regulation 14A, shall not be deemed "filed" for purposes of Section 18 of the Securities Exchange Act of 1934, as amended (the "Exchange Act"), or otherwise subject to the liabilities of that section, nor shall it be deemed incorporated by reference in any filing under the Securities Act of 1933, as amended, or the Exchange Act.
UNREGISTERED SALES OF EQUITY SECURITIES AND USE OF PROCEEDS
During the three months ended September 30, 2010, we did not repurchase any of our common stock. On January 21, 2009, our Board of Directors authorized the repurchase of up to $15.0 million of our common stock in the open market from time to time. On August 13, 2009, the Board increased the maximum repurchase amount to $20.0 million. As of September 30, 2010, we had purchased 1,651,898 shares of common stock for
17
$12.3 million under this repurchase program. Up to $7.7 million worth of our common stock may be purchased by us under this repurchase program in the future.
The following table summarizes selected consolidated financial data for the fiscal years ended September 30, 2006 through 2010. You should read the following selected consolidated financial data in conjunction with the financial statements, including the related notes, and Item 7—Management's Discussion and Analysis of Financial Condition and Results of Operations. Historical results are not necessarily indicative of results to be expected for any future period. Certain historical information in the following table has been reclassified to conform to the current year presentation.
|
Fiscal years ended September 30,
|
||||||||||||||||||||
|
(in thousands, except per share data)
|
2010
|
2009
|
2008
|
2007
|
2006
|
|||||||||||||||
|
Revenues
|
$ | 130,224 | $ | 128,246 | $ | 122,571 | $ | 108,306 | $ | 90,916 | ||||||||||
|
Costs and expenses
|
136,593 | 134,400 | 137,259 | 130,724 | 113,956 | |||||||||||||||
|
Loss from continuing operations before other income and income taxes
|
(6,369 | ) | (6,154 | ) | (14,688 | ) | (22,418 | ) | (23,040 | ) | ||||||||||
|
Other income
|
451 | 723 | 2,731 | 4,094 | 3,470 | |||||||||||||||
|
Loss from continuing operations before income taxes
|
(5,918 | ) | (5,431 | ) | (11,957 | ) | (18,324 | ) | (19,570 | ) | ||||||||||
|
Income tax provision
|
30 | 40 | 87 | 76 | 45 | |||||||||||||||
|
Loss from continuing operations
|
(5,948 | ) | (5,471 | ) | (12,044 | ) | (18,400 | ) | (19,615 | ) | ||||||||||
|
(Loss) income from discontinued operations, net
|
(245 | ) | (6,035 | ) | (15,401 | ) | 15,366 | 10,164 | ||||||||||||
|
Net loss
|
$ | (6,193 | ) | $ | (11,506 | ) | $ | (27,445 | ) | $ | (3,034 | ) | $ | (9,451 | ) | |||||
|
Total assets
|
$ | 113,025 | $ | 120,547 | $ | 137,351 | $ | 166,424 | $ | 169,860 | ||||||||||
|
Long-term obligations, less current portion
|
$ | 1,853 | $ | 1,121 | $ | 136 | $ | 200 | $ | 1,359 | ||||||||||
|
(Loss) earnings per share—Basic and diluted:
|
||||||||||||||||||||
|
Continuing operations
|
$ | (0.33 | ) | $ | (0.28 | ) | $ | (0.61 | ) | $ | (0.94 | ) | $ | (1.00 | ) | |||||
|
Discontinued operations
|
$ | (0.01 | ) | $ | (0.31 | ) | $ | (0.79 | ) | $ | 0.78 | $ | 0.52 | |||||||
|
Loss per share—Basic and diluted
|
$ | (0.34 | ) | $ | (0.59 | ) | $ | (1.40 | ) | $ | (0.16 | ) | $ | (0.48 | ) | |||||
|
Weighted average common shares used in computing:
|
||||||||||||||||||||
|
Basic and diluted (loss) earnings per share
|
18,153 | 19,438 | 19,616 | 19,512 | 19,495 | |||||||||||||||
18
This Management’s Discussion and Analysis of Financial Condition and Results of Operations includes forward-looking statements. We have based these forward-looking statements on our current plans, expectations and beliefs about future events. Our actual performance could differ materially from the expectations and beliefs reflected in the forward-looking statements in this section and throughout this report, as a result of the risks, uncertainties and assumptions discussed under Item 1A—Risk Factors of this Annual Report on Form 10-K and other factors discussed in this section. For information regarding what constitutes a forward-looking statement please refer to Private Securities Litigation Reform Act Safe Harbor Statement on page 1.
OVERVIEW
Tier Technologies, Inc., or Tier, is a leading provider of biller direct electronic payment solutions. These solutions provide processing for Web, call center and point-of-sale environments. We partner and connect with a host of payment processors and other payment service providers to offer our clients a single source solution that simplifies electronic payment management. Our solutions include multiple payment options, including bill presentment, convenience payments, installment payments and flexible payment scheduling. Our solutions offer our clients a range of online payment options, including credit and debit cards, electronic checks, cash and money orders, and alternative payment types.
SUMMARY OF FISCAL YEAR 2010 OPERATING RESULTS
The following table provides a summary of our operating results by segment for the fiscal year ended September 30, 2010, for our Electronic Payment Solutions, or EPS, operations, our Wind-down operations and Discontinued operations:
|
Year ended September 30, 2010
|
||||||||
|
(in thousands, except per share)
|
Net (loss) income
|
(Loss) earnings per share
|
||||||
|
Continuing Operations:
|
||||||||
|
EPS
|
$ | (6,207 | ) | $ | (0.34 | ) | ||
|
Wind-down
|
259 | 0.01 | ||||||
|
Total Continuing Operations
|
$ | (5,948 | ) | $ | (0.33 | ) | ||
|
Total Discontinued Operations
|
$ | (245 | ) | $ | (0.01 | ) | ||
|
Net loss
|
$ | (6,193 | ) | $ | (0.34 | ) | ||
Our Continuing Operations consists of EPS and Wind-down operations. Our Wind-down operations consist of one business area we intend to wind down over the next two years. Our revenues from our EPS operations were $127.2 million for the fiscal year ended September 30, 2010. Transaction volume grew 25.9% and total dollars processed grew 13.0% when compared to the fiscal year ended September 30, 2009. Given the nature of our transaction based business, increases in our revenue also result in increases in our direct costs, although not always at the same rate. Our direct costs increased 3.9% in fiscal year 2010 over fiscal year 2009, primarily due to additional co-location and telephonic costs associated with our data center consolidation efforts.
EPS operations reported a net loss of $6.2 million for the fiscal year ended September 30, 2010. The reported net loss for the fiscal year ended September 30, 2009 was $5.6 million. The $0.6 million variance is primarily attributable to the increase in direct costs as discussed above and an increase in depreciation expense as we continue to enhance our IT infrastructure and data security efforts. We incurred some one-time legal and severance costs, which further contributed to the increase in net loss year over year.
19
Our Wind-down operations reported net income of $0.3 million for the fiscal year ended September 30, 2010. We continue to make efforts to streamline our costs associated with supporting our Wind-down operations.
Our Discontinued Operations consist of businesses we have divested through February 2010. Our Discontinued Operations reported a net loss of $0.2 million for the fiscal year ended September 30, 2010.
STRATEGY AND GOALS FOR 2011
During fiscal 2011 we expect to focus on the following key objectives:
|
·
|
Expand market share in the biller direct market;
|
|
·
|
Strengthen our technology environment;
|
|
·
|
Establish a market driven approach to our business;
|
|
·
|
Strengthen our management team; and
|
|
·
|
Improve profitability.
|
Expand market share in the biller direct market: During fiscal 2010, we continued to explore strategic partnerships and potential acquisitions that would allow us to penetrate new markets and increase our share in existing vertical markets. We offer a low-cost service platform to our billers and their customers as well as a number of payment and channel options, which facilitates the acquisition of new billers and provides the opportunity to cross sell and up sell our existing billers. During fiscal 2011, we expect to review our costs and seek more efficient means of delivering services to our clients while expanding our product offerings to increase our market share. We will continue to focus increased resources and marketing programs on our fastest growing, higher margin verticals, education and utilities. As a result of our continued growth, we provide services to billers and their customers in all 50 states and the District of Columbia.
Strengthen our technology environment: As a result of a number of acquisitions, including Official Payments Corporation (OPC), EPOS Corporation and most recently, ChoicePay, Inc., we operate our business on multiple technology platforms. In 2009, we made the decision to consolidate our operations onto a single technology platform over time. The goals of the consolidation were to facilitate our ability to develop, sell and implement new and enhanced product offerings, improve margins by spreading fixed platform costs over a growing number of transactions, simplify our operations and reporting structure and make it easier to integrate potential future acquisitions. While we have made some progress in the consolidation efforts, we have found that completion of the development of a consolidated platform and the migration of our approximately 4,000 biller direct customers to that platform would take longer than originally anticipated. Our original plan was to complete development during calendar year 2010 and complete customer migration in calendar year 2011. We are continuing to evaluate the platform consolidation. At this time, we have postponed all migration plans for current customers. Our immediate focus is to strengthen our present platforms and make the necessary investments to provide competitive products on each of our existing platforms. We are developing these products as self-contained, reusable components, which could be used with multiple clients and platforms. Previously, we had delayed product rollout so that products could be made available on the consolidated platform. During fiscal year 2011, we expect that our technology efforts will focus principally on (1) increasing platform stability by improving the platforms’ availability and reliability, (2) security and compliance, (3) retention of existing clients, by increasing the products and features to clients, and (4) completion of infrastructure initiatives. We expect to review our plans related to a consolidated platform in mid-fiscal 2011.
Establish a market driven approach to our business: We have increased our focus on understanding the dynamics of our markets so that our market strategies and product offerings better meet the evolving needs of the market. We continue to broaden our product offerings in line with the evolving needs of our customers. We have expanded our payment channels to include the Web; automated interactive voice response (IVR); agent based call centers and point-of-sale environments, including financial services kiosks. We offer our billers a technology platform designed expressly for the biller direct market with a single
20
source solution that simplifies the management of electronic payments. We offer bill-payers a range of payment choices including credit and debit cards, electronic checks (ACH), cash and money orders. We are beginning to implement emerging payment methods such as Green Dot MoneyPak, Bill Me Later and the Revolution card. By utilizing our solutions, clients can reduce the time and expense devoted to management of their payment technology and compliance with PCI-DSS and other industry standards. We have started an ongoing upgrade of our strategic information systems to allow us to establish direct relationships with end-users of the Company’s services allowing us to grow transactions across multiple verticals and deepen the strength of our primary brand, Official Payments.
Strengthen our management team: In the last quarter of fiscal 2010, the Board appointed Alex P. Hart to the position of President and Chief Executive Officer. During fiscal year 2011 we expect to reevaluate our people and organizational structure, with the goal of ensuring that we have the right people to meet the needs of our clients and their customers in an efficient and effective manner. In November 2010, Atul Garg joined us as Senior Vice President, Product Management. We expect to strengthen our technology leadership early in fiscal 2011.
Improve profitability: Having completed the divestiture of business units that were not profitable or not in line with our strategic focus on the biller direct market, we have aggressively worked to reduce our sales, marketing, general and administrative (SG&A) costs over the last several years. This has involved substantial headcount reductions and facilities consolidations including the consolidation of our data centers, which is in progress. We expect to continue to improve profitability by growing revenues while continuing to aggressively manage SG&A expenses. We are also working to manage our direct costs, which are primarily the interchange fees, payment processing fees, banking fees and dues and assessments we pay the card companies. In fiscal 2011 we expect to improve our margins by negotiating better rates with our merchant acquirers and payment processors, adding lower cost providers and incenting our billers and their customers to use payment options and channels which offer better margins.
RESULTS OF OPERATIONS—FISCAL YEAR 2010 AND 2009
The following table provides an overview of our results of operations for the fiscal years ended September 30, 2010 and 2009:
| Year ended |
Variance
|
|||||||||||||||
|
September 30,
|
2010 vs. 2009
|
|||||||||||||||
|
(in thousands, except percentages)
|
2010
|
2009
|
$ | % | ||||||||||||
|
Revenues
|
$ | 130,224 | $ | 128,246 | $ | 1,978 | 1.5 | % | ||||||||
|
Costs and expenses:
|
||||||||||||||||
|
Direct costs
|
98,328 | 95,594 | 2,734 | 2.9 | % | |||||||||||
|
General and administrative
|
25,199 | 25,529 | (330 | ) | (1.3 | )% | ||||||||||
|
Selling and marketing
|
6,355 | 6,708 | (353 | ) | (5.3 | )% | ||||||||||
|
Depreciation and amortization
|
6,711 | 6,569 | 142 | 2.2 | % | |||||||||||
|
Total costs and expenses
|
136,593 | 134,400 | 2,193 | 1.6 | % | |||||||||||
|
Loss from continuing operations before other income
and income taxes
|
(6,369 | ) | (6,154 | ) | (215 | ) | 3.5 | % | ||||||||
|
Other income
|
451 | 723 | (272 | ) | (37.6 | )% | ||||||||||
|
Loss from continuing operations before income taxes
|
(5,918 | ) | (5,431 | ) | (487 | ) | (9.0 | )% | ||||||||
|
Income tax provision
|
30 | 40 | (10 | ) | (25.0 | )% | ||||||||||
|
Loss from continuing operations
|
(5,948 | ) | (5,471 | ) | (477 | ) | (8.7 | )% | ||||||||
|
Loss from discontinued operations, net
|
(245 | ) | (6,035 | ) | 5,790 | 95.9 | % | |||||||||
|
Net loss
|
$ | (6,193 | ) | $ | (11,506 | ) | $ | 5,313 | 46.2 | % | ||||||
The following sections describe the reasons for key variances from year to year in the results that we are reporting for Continuing and Discontinued Operations.
21
COMPARISON—FISCAL YEAR 2010 TO 2009
CONTINUING OPERATIONS
The Continuing Operations section of our Consolidated Statements of Operations includes the results of operations of our core EPS operations and our Wind-down operations. The following is an analysis of the variances in these financial results.
Revenues (Continuing Operations)
The following table compares the revenues generated by our Continuing Operations during fiscal years 2010 and 2009:
|
Year ended September 30,
|
Variance
|
|||||||||||||||
|
(in thousands, except percentages)
|
2010
|
2009
|
$ | % | ||||||||||||
|
Revenues
|
||||||||||||||||
|
EPS
|
$ | 127,223 | $ | 123,233 | $ | 3,990 | 3.2 | % | ||||||||
|
Wind-down
|
3,001 | 5,013 | (2,012 | ) | (40.1 | )% | ||||||||||
|
Total
|
$ | 130,224 | $ | 128,246 | $ | 1,978 | 1.5 | % | ||||||||
The following sections discuss the key factors that caused these changes in revenue from our Continuing Operations.
EPS Revenues: EPS provides electronic processing solutions, including payment of taxes, fees and other obligations owed to government entities, educational institutions, utilities and other public sector clients. EPS’s revenues reflect the number of contracts with clients, the volume of transactions processed under each contract and the rates that we charge for each transaction that we process.
During the fiscal year ended September 30, 2010, EPS generated $127.2 million of revenues, a $4.0 million, or 3.2%, increase over the same period last year. During fiscal year 2010, we processed 25.9% more transactions than we did in our prior fiscal year, representing 13.0% more dollars. The lower growth in dollars processed as compared with growth in transactions is due primarily to the success of our stated strategic intent to develop new verticals to diversify the business and lower average dollar transactions in our various tax verticals primarily related to current economic conditions. A significant amount of the new transactions were from verticals with lower average dollar size, which resulted in lower revenue per transaction. For example, average utility payments per transaction are lower than in our established property tax and income tax businesses and therefore produced lower average revenue per transaction. At the same time we introduced ACH and a fixed price debit card as a payment option in the utility vertical and several other verticals. In the last year, we have also seen that this shift in payment type has reduced our average revenue per transaction and our average direct costs per transaction. For this reason, the shift in payment type has increased our average “profit” per transaction, when profit is calculated on a percentage basis, even though the average “profit” per transaction may not have increased on an absolute dollar basis. During fiscal year 2010, all of our verticals experienced an increase in the transactions processed when compared to fiscal year 2009, ranging from 9.0% to 44.1%. During fiscal year 2010, we added 728 new payment types, bringing our total of payment types offered to nearly 9,200.
We expect to see revenue growth in fiscal year 2011 compared with the fiscal year 2010 as we continue to add new payment types for existing clients and continue our selling and marketing efforts to add new clients in our various verticals. As with the fiscal year 2010, the rate of growth will be dependent on general economic trends. Our government-based businesses, especially in the tax verticals, experienced low revenue growth during fiscal year 2010 and we have the same expectation for fiscal year 2011.
Wind-down Revenues: During the fiscal year ended September 30, 2010, our Wind-down operations generated $3.0 million, a $2.0 million or 40.1%, decrease from the fiscal year ended September 30, 2009. Completion of several maintenance contracts within our VSA business and the substantial completion of our
22
Pension business contract contributed to the decreases. We expect to continue to see decreases in Wind-down revenues as we continue to complete and wind down existing maintenance projects over the next two years.
Direct Costs (Continuing Operations)
Direct costs, which represent costs directly attributable to providing services to clients, consist predominantly of discount fees. Discount fees include payment card interchange fees and assessments payable to the banks as well as payment card processing fees. Other, less significant costs include: payroll and payroll-related costs; travel-related expenditures; co-location and telephony costs; and the cost of hardware, software and equipment sold to clients. The following table provides a year-over-year comparison of direct costs incurred by our Continuing Operations during fiscal years 2010 and 2009:
|
Year ended September 30,
|
Variance
|
|||||||||||||||
|
(in thousands, except percentages)
|
2010
|
2009
|
$ | % | ||||||||||||
|
Direct costs
|
||||||||||||||||
|
EPS:
|
||||||||||||||||
|
Discount fees
|
$ | 90,853 | $ | 88,657 | $ | 2,196 | 2.5 | % | ||||||||
|
Other costs
|
6,197 | 4,777 | 1,420 | 29.7 | % | |||||||||||
|
Total EPS
|
97,050 | 93,434 | 3,616 | 3.9 | % | |||||||||||
|
Wind-down
|
1,278 | 2,160 | (882 | ) | (40.8 | )% | ||||||||||
|
Total
|
$ | 98,328 | $ | 95,594 | $ | 2,734 | 2.9 | % | ||||||||
The following sections discuss the key factors that caused these changes in direct costs for Continuing Operations.
EPS Direct Costs: For the fiscal year ended September 30, 2010, direct costs increased $3.6 million, or 3.9%, over the fiscal year ended September 30, 2009. Discount fees increased $2.2 million, or 2.5%, over the same period last year, attributable to an increased number of transactions processed offset by several cost savings initiatives and a shift in payment method. In addition, we received a benefit of $0.3 million in one-time cost savings initiatives.
Other costs increased $1.4 million, or 29.7%, over the same period last year. The increase is primarily associated with an increase in telephonic and co-location costs of $1.6 million associated with increased usage of our customer and client support centers, as well as one-time costs for consolidation of our data centers. Labor and labor-related costs increased $0.6 million, primarily attributable to the acquisition of ChoicePay and enhancements to our call center in Auburn, Alabama, offset by reduced consulting fees of $0.3 million, as a result of our efforts to decrease dependency on outside resources. Equipment expenses also increased $0.1 million as additional call center equipment was required as a result of consolidation efforts and increased staffing at our Auburn call center. These increases were offset by a $0.6 million decrease in product and material costs and other miscellaneous direct costs.
During fiscal 2011, we expect to see continued increases in our EPS direct costs, in tandem with revenue growth, as we strive to enhance this business and as more clients move toward electronic payment solutions options. We also may see some additional expenses as a result of the Dodd-Frank Wall Street Reform and Consumer Protection Act of 2010, which could impact our interchange fees and lead to additional compliance costs.
Wind-down Direct Costs: During the fiscal year ended September 30, 2010, our Wind-down direct costs decreased $0.9 million, or 40.8%, from the same period last year. This decrease was primarily attributable to a decrease in labor and labor-related expenses, including consultants and subcontractors, of $0.9 million, a decrease in product and material costs of $0.1 million, attributable to the completion of projects and $0.1 million in telephonic costs. Offsetting these decreases is an increase of $0.2 million of maintenance costs associated with the support of our current projects.
As we wind down these operations, we expect that the direct costs of these operations will continue to decrease during fiscal 2011.
23
General and Administrative (Continuing Operations)
General and administrative expenses consist primarily of payroll and payroll-related costs for technology, product management, strategic initiatives, information systems, general management, administrative, accounting, legal and fees paid for outside services. Our information systems expenses include costs to consolidate and enhance our processing platforms as well as the costs associated with ongoing maintenance of these platforms. The following table compares general and administrative costs incurred by our Continuing Operations during fiscal years 2010 and 2009:
|
Year ended September 30,
|
Variance
|
|||||||||||||||
|
(in thousands, except percentages)
|
2010
|
2009
|
$ | % | ||||||||||||
|
General and administrative
|
||||||||||||||||
|
EPS
|
$ | 24,821 | $ | 24,509 | $ | 312 | 1.3 | % | ||||||||
|
Wind-down
|
378 | 1,020 | (642 | ) | (62.9 | )% | ||||||||||
|
Total
|
$ | 25,199 | $ | 25,529 | $ | (330 | ) | (1.3 | )% | |||||||
EPS General and Administrative: During the fiscal year ended September 30, 2010, EPS incurred $24.8 million of general and administrative expenses, a $0.3 million, or 1.3%, increase over the same period last year. During fiscal year 2010 we incurred $1.0 million in additional legal expenses when compared to fiscal year 2009, primarily associated with various corporate governance issues. In addition, severance expense increased $0.6 million year-over-year as a result of the departure of two executives, partially offset by the absence of severance costs associated with our office consolidation during fiscal year 2009. We also incurred year-over-year increases as follows: $0.4 million in recruiting expenses as a result of executive searches during fiscal year 2010; $0.3 million in equipment and software expenses associated with enhancements to our IT infrastructure and data security; $0.3 million in tax expenses, which is the result of the reversal of over-accrued tax expenses during the fiscal year 2009 thereby reducing our tax expense during fiscal year 2009 as well as additional state tax responsibilities in fiscal year 2010; $0.2 million in bad debt expense as a result of longer payment cycles; $0.2 million in bank fees as a result of fee increases and lower earnings credits; $0.1 million in rent expense associated with the duplicate rent period during the build-out of our new Reston headquarters offset by reduction in office space in Georgia and Tulsa; and $0.1 million in telephone and related expenses.
Primarily offsetting these increases is a decrease in labor and other labor-related expenses of $2.1 million. This decrease is made up of a reduction in incentive compensation of $1.7 million for fiscal year 2010 compared to fiscal year 2009, based on estimated bonus payouts for fiscal year 2010. In addition, share-based payment expenses decreased $0.2 million year-over-year primarily as a result of decreases in fair market value associated with our performance stock units and $0.2 million in other miscellaneous labor and related expenses as a result of streamlining our general and administrative workforce. Restructuring expenses were down $0.4 million when comparing fiscal year 2010 with fiscal year 2009 due to the completion of our office consolidation efforts during fiscal year 2009. Travel and travel-related expenses decreased $0.2 million year-over-year primarily associated with a reduction in executive travel. Further contributing to the decreases are a $0.1 million decrease in accounting fees and a $0.1 million decrease in business licenses and fees as we move from application status to renewal status for our money transmitter licenses.
During fiscal year 2010 we incurred some one-time costs we do not anticipate incurring during fiscal year 2011. As such, we are expecting our general and administrative costs to decrease during fiscal year 2011.
Wind-down General and Administrative: During the fiscal year ended September 30, 2010, our Wind-down general and administrative costs decreased $0.6 million, or 62.9%, as compared to the fiscal year ended September 30, 2009. Our labor and labor related expenses, including consultants, decreased $0.8 million year-over-year as a result of our strategic decision to focus on EPS operations. Our telephone and related costs also decreased $0.1 million when comparing fiscal year 2010 to fiscal year 2009. Offsetting these decreases is an increase of $0.2 million in bad debt expense associated with a receivable we have determined may be uncollectable.
24
We expect to see continued decreases in general and administrative expenses for our Wind-down operations as we complete projects.
Selling and Marketing (Continuing Operations)
Selling and marketing expenses consist primarily of payroll and payroll-related costs, commissions, advertising and marketing expenditures and travel-related expenditures. We expect selling and marketing expenses to fluctuate from quarter to quarter due to a variety of factors, such as increased advertising and marketing expenses incurred in anticipation of the April 15th federal tax season. The following table provides a year-over-year comparison of selling and marketing costs incurred by our Continuing Operations during fiscal years 2010 and 2009:
|
Year ended September 30,
|
Variance
|
|||||||||||||||
|
(in thousands, except percentages)
|
2010
|
2009
|
$ | % | ||||||||||||
|
Selling and marketing
|
||||||||||||||||
|
EPS
|
$ | 6,355 | $ | 6,697 | $ | (342 | ) | (5.1 | )% | |||||||
|
Wind-down
|
— | 11 | (11 | ) | (100.0 | )% | ||||||||||
|
Total
|
$ | 6,355 | $ | 6,708 | $ | (353 | ) | (5.3 | )% | |||||||
EPS Selling and Marketing: During the fiscal year ended September 30, 2010, EPS incurred $6.4 million of selling and marketing expenses, a $0.3 million or 5.1%, decrease compared to the fiscal year ended September 30, 2009. Contributing to the overall decrease in expense is a reduction of $0.7 million in labor and labor related costs as follows: a $0.6 million decrease in labor force and related expenses as we continue to streamline our business; a $0.3 million decrease in severance expense year-over-year attributable to severance expense recognized in fiscal year 2009 relating to the departure of an executive as well expense associated with our consolidation efforts; and a $0.2 million reduction in share-based payment expense, primarily due to the reduction in the fair market value of our performance stock units, offset by an increase in commission expense of $0.5 million relating to an adjustment in fiscal year 2009 to modify historical commission plans. In addition, our strategic partnership fees decreased $0.2 million year-over-year due to the nature of our current partnership agreements. These decreases are offset by an increase of $0.3 million in advertising expenses as we work towards more targeted marketing campaigns and $0.2 million in miscellaneous travel and office related expenses.
During fiscal year 2011, we anticipate an increase in selling and marketing expenses, primarily in labor and labor related expenses, as well as advertising expenses, as we focus on adding new clients and new payment types and services to existing clients.
Wind-down Selling and Marketing: We did not incur any selling and marketing expenses in our Wind-down operations during fiscal year 2010 and incurred minimal expenses during fiscal year 2009. This is consistent with our efforts to focus the maintenance and growth of our business on our EPS operations.
Depreciation and Amortization (Continuing Operations)
Depreciation and amortization represents expenses associated with the depreciation of equipment, software and leasehold improvements, as well as the amortization of intangible assets from acquisitions and other intellectual property not directly attributable to client projects. The following table provides a year-over-year comparison of depreciation and amortization costs incurred by our Continuing Operations during fiscal years 2010 and 2009:
|
Year ended September 30,
|
Variance
|
|||||||||||||||
|
(in thousands, except percentages)
|
2010
|
2009
|
$ | % | ||||||||||||
|
Depreciation and amortization
|
||||||||||||||||
|
EPS
|
$ | 5,625 | $ | 4,885 | $ | 740 | 15.2 | % | ||||||||
|
Wind-down
|
1,086 | 1,684 | (598 | ) | (35.5 | )% | ||||||||||
|
Total
|
$ | 6,711 | $ | 6,569 | $ | 142 | 2.2 | % | ||||||||
25
Depreciation and amortization relating to our EPS operations increased $0.7 million, or 15.2%, for the fiscal year ended September 30, 2010 over the fiscal year ended September 30, 2009, primarily due to the acquisition of ChoicePay assets during January 2009 as well as the depreciation of internally developed capitalized software during fiscal year 2010. Our Wind-down operations depreciation and amortization expense decreased $0.6 million, or 35.5% when comparing fiscal year 2010 to 2009, consistent with our strategic decision to focus on our EPS operations.
Other Income (Continuing Operations)
Gain on investment: During the fiscal year ended September 30, 2010 we recognized a $31,000 gain related to the increase in fair value of our auction rate securities. This is a $62,000 improvement over the fiscal year ended September 30, 2009.
Gain on sale of assets: During the fiscal year ended September 30, 2010 we recognized a $6,000 gain associated with the sale of assets during the current fiscal year.
Interest income, net: Interest income during the fiscal year ended September 30, 2010 decreased $0.3 million compared to the fiscal year ended September 30, 2009, attributable to both a decrease in the amount within our investment portfolio and decreases in interest rates. Due to current market conditions, we have elected to sell as many municipal bond debt securities as possible and invest the funds in money market accounts, treasury bills, discount notes and commercial paper – often at lower interest rates than our debt securities. Our interest rates fluctuate with changes in the marketplace.
Income Tax Provision (Continuing Operations)
We reported income tax provisions of $30,000 for the fiscal year ended September 30, 2010, a $10,000 decrease from September 30, 2009. The provision for income taxes represents state tax obligations incurred by our EPS operations. Our Consolidated Statements of Operations for the fiscal years ended September 30, 2010 and 2009 do not reflect a federal tax provision because of offsetting adjustments to our valuation allowance. Our effective tax rates differ from the federal statutory rate due to state income taxes, tax-exempt interest income and the charge for establishing a valuation allowance on our net deferred tax assets. Our future tax rate may vary due to a variety of factors, including, but not limited to: the relative income contribution by tax jurisdiction; changes in statutory tax rates; the amount of tax exempt interest income generated during the year; changes in our valuation allowance; our ability to utilize net operating losses and any non-deductible items related to acquisitions or other nonrecurring charges.
At September 30, 2010, we had $111.3 million of federal net operating loss carryforwards, which expire beginning in fiscal 2018 through 2030, and $94.7 million of state net operating loss carryforwards, most of which begin to expire after fiscal 2017 through 2025. Our ability to realize the acquired federal net operating loss carryforward is limited to $3,350,000 per year pursuant to Internal Revenue Code Section 382. The balance of our federal net operating loss carryforwards, is currently limited to $5,993,000 per annum pursuant to Internal Revenue Code Section 382.
DISCONTINUED OPERATIONS
Our Discontinued Operations consist of portions of our former GBPO and PSSI businesses which we have divested and no longer operate. During years ended September 30, 2010 and 2009, net loss from Discontinued Operations was $0.2 million and $6.0 million, respectively.
RESULTS OF OPERATIONS—FISCAL YEARS 2009 AND 2008
The following table provides an overview of our results of operations for the fiscal years ended September 30, 2009 and 2008:
26
| Year ended |
Variance
|
|||||||||||||||
|
September 30,
|
2009 vs. 2008
|
|||||||||||||||
|
(in thousands, except percentages)
|
2009
|
2008
|
$ | % | ||||||||||||
|
Revenues
|
$ | 128,246 | $ | 122,571 | $ | 5,675 | 4.6 | % | ||||||||
|
Costs and expenses:
|
||||||||||||||||
|
Direct costs
|
95,594 | 95,234 | 360 | 0.4 | % | |||||||||||
|
General and administrative
|
25,529 | 28,020 | (2,491 | ) | (8.9 | )% | ||||||||||
|
Selling and marketing
|
6,708 | 8,677 | (1,969 | ) | (22.7 | )% | ||||||||||
|
Depreciation and amortization
|
6,569 | 5,328 | 1,241 | 23.3 | % | |||||||||||
|
Total costs and expenses
|
134,400 | 137,259 | (2,859 | ) | (2.1 | )% | ||||||||||
|
Loss from continuing operations before other income
and income taxes
|
(6,154 | ) | (14,688 | ) | 8,534 | 58.1 | % | |||||||||
|
Other income
|
723 | 2,731 | (2,008 | ) | (73.5 | )% | ||||||||||
|
Loss from continuing operations before income taxes
|
(5,431 | ) | (11,957 | ) | 6,526 | 54.6 | % | |||||||||
|
Income tax provision
|
40 | 87 | (47 | ) | (54.0 | )% | ||||||||||
|
Loss from continuing operations
|
(5,471 | ) | (12,044 | ) | 6,573 | 54.6 | % | |||||||||
|
Loss from discontinued operations, net
|
(6,035 | ) | (15,401 | ) | 9,366 | 60.8 | % | |||||||||
|
Net loss
|
$ | (11,506 | ) | $ | (27,445 | ) | $ | 15,939 | 58.1 | % | ||||||
The following sections describe the reasons for key variances from year to year in the results that we are reporting for Continuing and Discontinued Operations.
COMPARISON—FISCAL YEAR 2009 TO 2008
CONTINUING OPERATIONS
The Continuing Operations section of our Consolidated Statements of Operations includes the results of operations of our core EPS operations and our Wind-down operations. The following is an analysis of the variances in these financial results.
Revenues (Continuing Operations)
The following table compares the revenues generated by our Continuing Operations during fiscal years 2009 and 2008:
|
Year ended September 30,
|
Variance
|
|||||||||||||||
|
(in thousands, except percentages)
|
2009
|
2008
|
$ | % | ||||||||||||
|
Revenues
|
||||||||||||||||
|
EPS
|
$ | 123,233 | $ | 116,641 | $ | 6,592 | 5.7 | % | ||||||||
|
Wind-down
|
5,013 | 5,930 | (917 | ) | (15.5 | )% | ||||||||||
|
Total
|
$ | 128,246 | $ | 122,571 | $ | 5,675 | 4.6 | % | ||||||||
The following sections discuss the key factors that caused these changes in revenue from our Continuing Operations.
EPS Revenues: EPS provides electronic processing solutions, including payment of taxes, fees and other obligations owed to government entities, educational institutions, utilities and other public sector clients. EPS’s revenues reflect the number of contracts with clients, the volume of transactions processed under each contract and the rates that we charge for each transaction that we process.
EPS generated $123.2 million of revenues during the fiscal year ended September 30, 2009, a $6.6 million, or 5.7%, increase over fiscal year ended September 30, 2008. The acquisition of ChoicePay in January, 2009 and an increase in transactions and dollars processed contributed to the year over year increase in revenues. During fiscal year ended September 30, 2009, we processed 44.5% more transactions than we did in the same period last year, representing 17.6% more dollars. Most of our verticals experienced an
27
increase in transactions processed during the fiscal year ended September 30, 2009, compared to the same period last year, ranging from 4.9% to 321.4%. However, our Federal vertical and portions of our Other vertical experienced decreases in transactions processed, by 1.5% and 24.1%, respectively. During the 2009 fiscal year, we added 287 new clients, 50 of which we acquired as a result of our acquisition of ChoicePay, which contributed to the increase in revenues.
Wind-down Revenues: During the fiscal year ended September 30, 2009, our Wind-down operations generated $5.0 million in revenues, a $0.9 million, or 15.5%, decrease from the fiscal year ended September 30, 2008. Our VSA business reported $4.7 million in revenues during fiscal year ended September 30, 2009, which is a $0.6 million decrease over the same period last year. This decrease is primarily due to the completion of projects. Our Pension business generated $0.3 million in revenues for the fiscal year ended September 30, 2009. This is a $0.3 million decrease over the same period last year due to the substantial completion of all Pension projects during fiscal 2009.
Direct Costs (Continuing Operations)
Direct costs, which represent costs directly attributable to providing services to clients, consist predominantly of discount fees. Discount fees include payment card interchange fees and assessments payable to the banks as well as payment card processing fees. Other, less significant costs include: payroll and payroll-related costs; travel-related expenditures; co-location and telephony costs; and the cost of hardware, software and equipment sold to clients. The following table provides a year-over-year comparison of direct costs incurred by our Continuing Operations during fiscal years 2009 and 2008:
|
Year ended September 30,
|
Variance
|
|||||||||||||||
|
(in thousands, except percentages)
|
2009
|
2008
|
$ | % | ||||||||||||
|
Direct costs
|
||||||||||||||||
|
EPS:
|
||||||||||||||||
|
Discount fees
|
$ | 88,657 | $ | 87,082 | $ | 1,575 | 1.8 | % | ||||||||
|
Other costs
|
4,777 | 4,208 | 569 | 13.5 | % | |||||||||||
|
Total EPS
|
93,434 | 91,290 | 2,144 | 2.3 | % | |||||||||||
|
Wind-down
|
2,160 | 3,944 | (1,784 | ) | (45.2 | )% | ||||||||||
|
Total
|
$ | 95,594 | $ | 95,234 | $ | 360 | 0.4 | % | ||||||||
The following sections discuss the key factors that caused these changes in direct costs for Continuing Operations.
EPS Direct Costs: For the fiscal year ended September 30, 2009, direct costs increased $2.1 million, or 2.3%, over the fiscal year ended September 30, 2008. Discount fees increased $1.6 million, or 1.8%, over the same period last year, attributable to an increased number of transactions processed offset by several cost savings initiatives and a shift in vertical payment type and a shift in payment method. In addition, we received a benefit of $0.5 million in one-time cost savings initiatives. Other direct costs increased $0.6 million, or 13.5%, over the same period last year, primarily attributable to the acquisition of ChoicePay, offset by the consolidation of our San Ramon, California and Auburn, Alabama operations.
Wind-down Direct Costs: During the fiscal year ended September 30, 2009, our Wind-down direct costs decreased $1.8 million, or 45.2%, from the same period last year. This decrease was primarily attributable to a decrease in labor and labor-related expenses, including consultants and subcontractors, of $1.1 million, a decrease in product and material costs of $0.6 million, attributable to the completion of projects and $0.1 million of travel and travel related expenditures.
General and Administrative (Continuing Operations)
General and administrative expenses consist primarily of payroll and payroll-related costs for technology, product management, strategic initiatives, information systems, general management, administrative, accounting, legal and fees paid for outside services. Our information systems expenses include costs to consolidate and enhance our processing platforms as well as the costs associated with ongoing
28
maintenance of these platforms. The following table compares general and administrative costs incurred by our Continuing Operations during fiscal years 2009 and 2008:
|
Year ended September 30,
|
Variance
|
|||||||||||||||
|
(in thousands, except percentages)
|
2009
|
2008
|
$ | % | ||||||||||||
|
General and administrative
|
||||||||||||||||
|
EPS
|
$ | 24,509 | $ | 26,932 | $ | (2,423 | ) | (9.0 | )% | |||||||
|
Wind-down
|
1,020 | 1,088 | (68 | ) | (6.3 | )% | ||||||||||
|
Total
|
$ | 25,529 | $ | 28,020 | $ | (2,491 | ) | (8.9 | )% | |||||||
EPS General and Administrative: During the fiscal year ended September 30, 2009, EPS incurred $24.5 million of general and administrative expenses, a $2.4 million, or 9.0%, decrease over fiscal year ended September 30, 2008. The most significant cost savings during fiscal 2009 were a reduction in outside consulting services of $2.0 million, primarily attributable to the completion in late fiscal 2008 of our strategic initiative reviews and our efforts during fiscal 2009 to reduce our dependency on outside consultants and subcontractors. We also had a reduction of $1.0 million in legal expenses, attributable to reduced legal costs associated with our divestiture process, which were primarily incurred during fiscal 2008, as well as reduced legal expenses associated with an investigation being conducted by the Securities and Exchange Commission during fiscal 2009 as compared to fiscal 2008, offset by additional costs incurred during fiscal 2009 relating to our proxy and annual shareholders’ meeting. Our other tax expense decreased $0.4 million year-over-year. We also had a $0.3 million reduction in executive search fees.
Overall, our labor and labor-related expenses decreased $0.3 million during fiscal 2009. Reductions in workforce as a result of our strategic initiatives (despite added staff through our ChoicePay acquisition) contributed $0.8 million to the overall decrease. Our reduction in share-based payment expense attributable to one-time expense recognized in fiscal 2008 contributed $0.6 million to the overall decrease. We also recognized $0.1 million less severance cost during fiscal 2009. Offsetting these decreases is an increase in expense of $1.2 million attributable to the performance stock unit plan introduced during fiscal 2009.
Offsetting these decreases are: a $0.5 million increase in restructuring costs associated with reducing our facility needs as a result of our consolidation efforts; a $0.4 million increase in office expense attributable to hardware and software maintenance and repairs associated with our IT services as well as the acquisition of ChoicePay; a $0.2 million increase in travel and travel-related expenses associated with the acquisition of ChoicePay and our platform consolidation initiative; and $0.2 million increase in business and licensing fees. In addition, during fiscal 2008 we recognized a $0.2 million benefit of the reversal of a legal reserve relating to a previously conducted Department of Justice investigation that concluded in January 2008. The remaining $0.1 million increase is attributable to miscellaneous administrative expenses.
Wind-down General and Administrative: During the fiscal year ended September 30, 2009, our Wind-down operations general and administrative expenses decreased $68,000 or 6.3% over the fiscal year ended September 30, 2008. These decreases are primarily attributable to the shift in resources from our Wind-down operations to our EPS operations, which has resulted in decreases in labor and labor-related expenses, including outside consultants. Offsetting these decreases was an increase in bad debt expense, which was a result of the benefit of bad debt collections during fiscal 2008.
Selling and Marketing (Continuing Operations)
Selling and marketing expenses consist primarily of payroll and payroll-related costs, commissions, advertising and marketing expenditures and travel-related expenditures. We expect selling and marketing expenses to fluctuate from quarter to quarter due to a variety of factors, such as increased advertising and marketing expenses incurred in anticipation of the April 15th federal tax season. The following table provides a year-over-year comparison of selling and marketing costs incurred by our Continuing Operations during fiscal years 2009 and 2008:
29
|
Year ended September 30,
|
Variance
|
|||||||||||||||
|
(in thousands, except percentages)
|
2009
|
2008
|
$ | % | ||||||||||||
|
Selling and marketing
|
||||||||||||||||
|
EPS
|
$ | 6,697 | $ | 8,486 | $ | (1,789 | ) | (21.1 | )% | |||||||
|
Wind-down
|
11 | 191 | (180 | ) | (94.2 | )% | ||||||||||
|
Total
|
$ | 6,708 | $ | 8,677 | $ | (1,969 | ) | (22.7 | )% | |||||||
EPS Selling and Marketing: During the fiscal year ended September 30, 2009, EPS incurred $6.7 million of selling and marketing expenses, a $1.8 million, or 21.1%, decrease over the same period last year. Decreases in labor and labor-related expenses resulting from staff reductions, lower commissionable revenue activities and modifications to historical commission plans resulted in net savings of $1.5 million. This decrease was partially offset by severance expense of $0.3 million associated with the departure of a sales department executive. A reduction in travel and travel-related costs contributed $0.3 million to the year over year decrease and a reduction in advertising and partnership-related costs contributed $0.3 million to the overall decrease, primarily attributable to a more targeted advertising effort. Furthermore, we had a $0.2 million reduction in outside services as a result of our actions to reduce our past dependency on outside consultants and subcontractors. Partially offsetting these decreases is $0.2 million in other miscellaneous costs.
Wind-down Selling and Marketing: During fiscal year ended September 30, 2009, our Wind-down selling and marketing expenses decreased $0.2 million, or 94.2%, over the fiscal year ended September 30, 2008. These variances are attributable to our strategic decision to focus on our EPS operations, toward which all selling and marketing efforts have been directed. We expect to incur minimal selling and marketing expenses relating to Wind-down operations during fiscal 2010.
Depreciation and Amortization (Continuing Operations)
Depreciation and amortization represents expenses associated with the depreciation of equipment, software and leasehold improvements, as well as the amortization of intangible assets from acquisitions and other intellectual property not directly attributable to client projects. The following table provides a year-over-year comparison of depreciation and amortization costs incurred by our Continuing Operations during fiscal years 2009 and 2008:
|
Year ended September 30,
|
Variance
|
|||||||||||||||
|
(in thousands, except percentages)
|
2009
|
2008
|
$ | % | ||||||||||||
|
Depreciation and amortization
|
||||||||||||||||
|
EPS
|
$ | 4,885 | $ | 3,900 | $ | 985 | 25.3 | % | ||||||||
|
Wind-down
|
1,684 | 1,428 | 256 | 17.9 | % | |||||||||||
|
Total
|
$ | 6,569 | $ | 5,328 | $ | 1,241 | 23.3 | % | ||||||||
Depreciation and amortization relating to our EPS operations increased $1.0 million, or 25.3%, for the fiscal year ended September 30, 2009 over the fiscal year ended September 30, 2008, primarily due to the acquisition of ChoicePay assets during January 2009. We incurred an additional $0.3 million, or 17.9%, in amortization expense during fiscal year ended September 30, 2009 over fiscal year ended September 30, 2008 for our Wind-down operations as a result of the decision at the end of fiscal 2008 to decrease the remaining useful life of certain intangible assets from four to two years.
Other Income/(Loss) (Continuing Operations)
Gain/(loss) on investment: During fiscal year ended September 30, 2009, we recognized a $31,000 loss related to the decrease in fair value of our auction rate securities. During fiscal year ended September 30, 2008, these securities were classified as available-for-sale, and therefore any gain or loss was unrealized and recorded within Accumulated other comprehensive loss on our Consolidated Balance Sheets.
Interest income, net: Interest income during fiscal year ended September 30, 2009 decreased $2.0 million compared to fiscal year ended September 30, 2008, attributable to both a decrease in the amount within our investment portfolio and decreases in interest rates. Due to current market conditions, we have elected to sell as many municipal bond debt securities as possible and invest the funds in money market accounts,
30
treasury bills and commercial paper – often at lower interest rates than our debt securities. Our interest rates fluctuate with changes in the marketplace.
Income Tax Provision (Continuing Operations)
We reported income tax provisions of $40,000 the fiscal year ended September 30, 2009, a $47,000 decreased from September 30, 2008. The provision for income taxes represents state tax obligations incurred by our EPS operations. Our Consolidated Statements of Operations for the fiscal years ended September 30, 2009 and 2008 do not reflect a federal tax provision because of offsetting adjustments to our valuation allowance. Our effective tax rates differ from the federal statutory rate due to state income taxes, tax-exempt interest income and the charge for establishing a valuation allowance on our net deferred tax assets. Our future tax rate may vary due to a variety of factors, including, but not limited to: the relative income contribution by tax jurisdiction; changes in statutory tax rates; the amount of tax exempt interest income generated during the year; changes in our valuation allowance; our ability to utilize net operating losses and any non-deductible items related to acquisitions or other nonrecurring charges.
At September 30, 2009, we had $98.9 million of federal net operating loss carryforwards, which expire beginning in fiscal 2018 through 2029, and $82.1 million of state net operating loss carryforwards, most of which begin to expire after fiscal 2017 through 2024.
DISCONTINUED OPERATIONS
Our Discontinued operations consist of portions of our former GBPO and PSSI businesses which we have divested and no longer operate. During years ended September 30, 2009 and 2008, net loss from Discontinued Operations was $6.0 million and $15.4 million, respectively.
LIQUIDITY AND CAPITAL RESOURCES
At September 30, 2010 we had $54.0 million in cash, cash equivalents and marketable securities compared with $57.6 million at September 30, 2009. Of the $57.6 million at September 30, 2009, $31.2 million consisted of marketable securities which were illiquid as of September 30, 2009. During fiscal year 2010, we were able to liquidate these securities and invest the proceeds in short-term and cash equivalent investments. In addition, as of September 30, 2010 we had restricted cash of $7.3 million, of which $6.0 million is used as a compensating balance required by our bank to guarantee availability of funds for processing outgoing Automated Clearing House payments to our clients and $1.3 million is used to collateralize outstanding letters of credit, which are scheduled to come due during calendar year 2010. We currently have an Amended and Restated Credit and Security Agreement, as amended, with our lender, under which we may obtain up to $5.0 million of letters of credit. This agreement also grants the lender a perfected security interest in cash collateral in an amount equal to all issued and to be issued letters of credit. The $1.3 million of letters of credit outstanding were issued to secure performance bonds and a property lease.
Our current investment strategy is to ensure our cash, cash equivalents and marketable securities remain as liquid as possible. We intend to concentrate our investments in short term U.S. Treasury bills to ensure we can meet our liquidity needs over the next twelve months. We believe we have sufficient liquidity to meet currently anticipated needs, including capital expenditures, working capital investments, and acquisitions, as well as participation in our stock repurchase program for the next twelve months. We expect to generate cash flows from operating activities over the long term; however, we may experience significant fluctuations from quarter to quarter resulting from the timing of billing and collections. To the extent that our existing capital resources are insufficient to meet our capital requirements, we will have to raise additional funds. There can be no assurance that additional funding, if necessary, will be available on favorable terms, if at all. Currently, we do not have any short or long-term debt.
Net Cash from Continuing Operations—Operating Activities. During the fiscal year ended September 30, 2010, our operating activities from Continuing Operations provided $2.0 million of cash. This reflects a net
31
loss of $5.9 million from Continuing Operations and $9.4 million of non-cash items. During fiscal 2010, $0.8 million of cash was generated by a decrease in accounts and settlements receivable, $0.6 million of cash was generated by decrease in prepaid expenses and other assets and $0.1 million of cash was generated by a decrease in income tax. A decrease in accounts and settlements payable and other accrued liabilities used $2.7 million of cash and a decrease in deferred income used $0.3 million of cash.
Net Cash from Continuing Operations—Investing Activities. Net cash generated by our investing activities from Continuing Operations for the fiscal year ended September 30, 2010 was $22.8 million, including $31.2 million of cash generated by the sale of trading securities and $19.9 million of cash generated by the maturities and sale of available-for-sale securities, offset by the use of $23.6 million of cash to purchase available-for-sale securities. The collection of a note receivable generated $0.5 million of cash. The purchase of equipment and software to support our EPS operations used $5.2 million of cash and additional goodwill recognized associated with the ChoicePay earn-out used $0.1 million of cash.
Net Cash from Continuing Operations—Financing Activities. Net cash used in our financing activities from Continuing Operations for the fiscal year ended September 30, 2010 was $0.7 million. The purchase of company stock used $0.7 million of cash, offset by $82,000 provided by the issuance of stock. Capital lease obligations used $36,000 of cash.
Net Cash from Discontinued Operations—Operating Activities. During the fiscal year ended September 30, 2010, our operating activities from Discontinued Operations used $0.9 million of cash as a result of residual expenses related to our divested businesses.
Net Cash from Discontinued Operations—Investing Activities. During the fiscal year ended September 30, 2010, investing activities from discontinued operations provided $0.6 million of cash as a result of an earn-out payment from the company that purchased our former GBPO business, pursuant to the Purchase and Sale Agreement.
CRITICAL ACCOUNTING POLICIES
Our discussion and analysis of our financial condition and results of operations is based on our Consolidated Financial Statements, which have been prepared in accordance with accounting principles generally accepted in the United States, or US GAAP. Note 2—Summary of Significant Accounting Policies of our Notes to Consolidated Financial Statements contains a summary of our significant accounting policies, many of which require the use of estimates and assumptions. We believe that of our significant policies, the following are the most noteworthy because they are based upon estimates and assumptions that require complex subjective judgments by management, which can have a material effect on our reported results. Changes in these estimates or assumptions could materially impact our financial condition and results of operations. Actual results could differ materially from management’s estimates.
Revenue Recognition. Certain judgments affect the application of our revenue policy. We derive revenues primarily from transaction and payment processing, systems design and integration, and maintenance and support services. We recognize revenues in accordance with accounting principles generally accepted in the United States, which, in some cases, require us to estimate costs and project status. Our EPS operations primarily recognize revenues using a transaction-based method as described below.
The methods that we use to recognize revenues are described below:
|
|
Transaction-based contracts—revenues are recognized based on fees charged on a per-transaction basis or fees charged as a percentage of dollars processed;
|
|
|
Time and materials contracts—revenues are recognized when we perform services and incur expenses;
|
|
|
Delivery-based contracts—revenues are recognized when we have delivered, and the customer has accepted, the product or service; and
|
|
|
Software maintenance contracts—revenues are recognized on a straight-line basis over the contract term, which is typically one year.
|
32
Any given contract may contain one or more elements with attributes of more than one of the contract types described above. In those cases, we account for each element separately, using the applicable accounting standards. In addition, we also establish an allowance for credit card reversals and charge-backs as part of our revenue recognition practices. For all our operations, the amount and timing of our revenue is difficult to predict.
Collectability of Receivables. Accounts receivable includes funds that are due to us to compensate us for the services we provide to our customers. We have established an allowance for doubtful accounts, which represents our best estimate of probable losses inherent in the accounts receivable balance. Each quarter we adjust this allowance based upon management’s review and assessment of each category of receivable. Factors that we consider to establish this adjustment include the age of receivables, past payment history and the demographics of the associated debtors. Our allowance for uncollectible accounts is based both on the performance of specific debtors and upon general categories of debtors.
Goodwill and Other Intangible Assets. We review goodwill and purchased intangible assets with indefinite lives for impairment annually at the reporting unit level and whenever events or changes indicate that the carrying value of an asset may not be recoverable. These events or circumstances could include a significant change in the business climate, legal factors, operating performance indicators, competition, or sale or disposition of a significant portion of a reporting unit. Application of the goodwill impairment test requires judgment, including the identification of reporting units, assignment of assets and liabilities to reporting units, assignment of goodwill to reporting units and determination of the fair value of each reporting unit. The fair value of each reporting unit is estimated using a discounted cash flow methodology. This requires significant judgments, including estimation of future cash flows, which is dependent on internal forecasts, estimation of the long-term rate of growth for our business, the useful life over which cash flows will occur and determination of our weighted-average cost of capital. Changes in these estimates and assumptions could materially affect the determination of fair value and/or goodwill impairment for each reporting unit.
Investments. We review our investments quarterly to identify other-than-temporary impairments in accordance with US GAAP. This determination requires us to use significant judgment in evaluating a number of factors, including: the duration and extent to which the fair value of an investment is less than its cost; the financial health of and near-term business outlook for the investee, including factors such as industry and sector performance, changes in technology and operational and financing cash flow; and our intent and ability to hold the investment. When investments exhibit unfavorable attributes in these and other areas, we conduct additional analyses to determine whether the fair value of the investment is other-than-temporarily impaired.
Fair-value Measurements. In accordance with US GAAP, we record our financial assets including: cash equivalents, restricted cash, accounts receivable, accounts payable and accrued liabilities at cost, which approximates fair value due to their short-term nature. Investments in marketable securities are recorded at their estimated fair value. Factors considered in determining their fair value were: current and projected interest rates, quality of the underlying collateral, credit ratings of the issuer, percentage participation in the Federal Family Education Loan Program and a factor for illiquidity.
Contingencies. The outcomes of legal proceedings and claims brought against us are subject to significant uncertainty. US GAAP requires that an estimated loss from a loss contingency such as a legal proceeding or claim should be accrued by a charge to income if it is probable that an asset has been impaired or a liability has been incurred and the amount of the loss can be reasonably estimated. Disclosure of a contingency is required if there is at least a reasonable possibility that a loss has been incurred. In determining whether a loss should be accrued, we evaluate a number of factors, including the degree of probability of an unfavorable outcome and the ability to make a reasonable estimate of the amount of loss. Changes in these factors could materially impact our financial position and our results of operations.
Income Taxes. The objectives of accounting for income taxes are to recognize the amount of taxes payable or refundable for the current year and deferred tax liabilities and assets for the future tax consequences of events that have been recognized in an entity’s financial statements or tax returns. US GAAP states we may
33
recognize a tax benefit from an uncertain tax position only if it is more-likely-than-not that the tax position will be sustained on examination by the taxing authorities, based on technical merits. Judgment is required in assessing the future tax consequences of events that have been recognized in our financial statements or tax returns. Variations in the actual outcome of these future tax consequences could materially impact our financial position, results of operations or cash flows.
Share-Based Compensation. US GAAP requires public companies to expense employee share-based payments (including options, restricted stock units and performance stock units) based on fair value. We must use our judgment to determine key factors in determining the fair value of the share-based payment, such as volatility, forfeiture rates and the expected term in which the award will be outstanding.
RECENT ACCOUNTING STANDARDS
FASB ASC 860. In June 2009, the FASB issued FASB ASC 860, which eliminates the concept of a qualifying special-purpose entity, creates more stringent conditions for reporting a transfer of a portion of a financial asset as a sale, clarifies other sale-accounting criteria, and changes the initial measurement of a transferor’s interest in transferred financial assets. FASB ASC 860 will be effective for transfers of financial assets in fiscal years beginning after November 15, 2009 and in interim periods within those fiscal years with earlier adoption prohibited. We will adopt FASB ASC 860 on October 1, 2010. We are currently evaluating the effect the adoption of FASB ASC 860 will have on our financial position and results of operations.
FASB ASU 2010-06. In January 2010, the FASB issued Accounting Standards Update, or ASU, or FASB ASU 2010-06, which amends the disclosure requirements relating to recurring and nonrecurring fair value measurements. New disclosures are required about transfers into and out of the levels 1 and 2 fair value hierarchy and separate disclosures about purchases, sales, issuances and settlements relating to Level 3 measurements. This ASU also requires an entity to present information about purchases, sales, issuances and settlements for significant unobservable inputs on a gross basis rather than as a net number. This ASU was effective for us with the reporting period beginning January 1, 2010, except for the disclosures on the roll forward activities for Level 3 fair value measurements, which will become effective for us with the reporting period beginning October 1, 2011. The adoption of this ASU had no impact on our financial position and results of operations, as it only requires additional disclosures.
FASB ASU 2010-20. In July 2010, the FASB issued, FASB ASU 2010-20, which amends ASC 310 by requiring additional, more robust disclosures about the credit quality of an entity’s financing receivables and its allowance for credit losses. We will adopt the disclosure requirements in our December 31, 2010 quarterly report. The adoption of this ASU had no impact on our financial position and results of operations, as it only changes disclosure requirements.
OFF-BALANCE SHEET ARRANGEMENTS AND CONTRACTUAL OBLIGATIONS
OFF-BALANCE SHEET ARRANGEMENTS
We do not have any off-balance sheet arrangements as those are defined under the SEC rules.
INDEMNIFICATION AGREEMENTS
Our Certificate of Incorporation obligates us to indemnify our directors and officers against all expenses, judgments, fines and amounts paid in settlement for which such persons become liable as a result of acting in any capacity on behalf of Tier, if the director or officer met the standard of conduct specified in the Certificate, and subject to the limitations specified in the Certificate. In addition, we have indemnification agreements with certain of our directors and officers, which supplement the indemnification obligations in our Certificate. These agreements generally obligate us to indemnify the indemnitees against expenses incurred because of their status as a director or officer, if the indemnitee met the standard of conduct specified in the agreement, and subject to the limitations specified in the agreement.
34
EMPLOYMENT AGREEMENTS
As of September 30, 2010, we had employment and change of control agreements with four executives and one other key manager. If certain termination or change of control events were to occur under the five contracts as of September 30, 2010, we could be required to pay up to $3.9 million. In addition, pursuant to the terms of our employment contract with our current CEO, we could be required to pay up to $0.1 million relating to relocation expenses and legal fees in association with the review and negotiation of the employment contract.
CONTRACTUAL OBLIGATIONS
We have contractual obligations to make future payments on lease agreements, which have remaining terms that extend beyond five years. During the fiscal year ended September 30, 2010, we entered into a lease agreement for space in Reston, Virginia to house our headquarters. This lease agreement ends in fiscal year 2018. Additionally, in the normal course of business, we enter into contractual arrangements whereby we commit to future purchases of products or services from unaffiliated parties. Purchase obligations are legally binding arrangements whereby we agree to purchase products or services with a specific minimum quantity defined at a fixed minimum or variable price over a specified period of time. The following table presents our expected payments for contractual obligations that were outstanding at September 30, 2010. All of our contractual obligations expire by 2018.
|
(in thousands)
|
Total
|
2011
|
2012-2013 | 2014-2015 |
Thereafter
|
|||||||||||||||
|
Capital lease obligations (equipment) (1)
|
$ | 78 | $ | 31 | $ | 47 | $ | — | $ | — | ||||||||||
|
Operating lease obligations:
|
||||||||||||||||||||
|
Facilities leases
|
5,563 | 468 | 1,590 | 1,625 | 1,880 | |||||||||||||||
|
Equipment leases
|
23 | 6 | 12 | 5 | — | |||||||||||||||
|
Purchase obligations:
|
||||||||||||||||||||
|
Subcontractor
|
110 | 110 | — | — | — | |||||||||||||||
|
Purchase order
|
182 | 182 | — | — | — | |||||||||||||||
|
Total contractual obligations
|
$ | 5,956 | $ | 797 | $ | 1,649 | $ | 1,630 | $ | 1,880 | ||||||||||
|
(1) Includes interest payments of $1.
|
||||||||||||||||||||
We maintain a portfolio of cash equivalents and investments in a variety of securities, including certificates of deposit, money market funds and government securities. These securities are subject to interest rate risk and may decline in value if market interest rates increase. If market interest rates increase immediately and uniformly by ten percentage points from levels at September 30, 2010 the fair value of the portfolio would decline by approximately $43,000.
35
|
Report of Independent Registered Public Accounting Firm
|
37
|
|
Consolidated Balance Sheets
|
38
|
|
Consolidated Statements of Operations
|
39
|
|
Consolidated Statements of Shareholders’ Equity
|
40
|
|
Consolidated Statements of Comprehensive Loss
|
41
|
|
Consolidated Statements of Cash Flows
|
42
|
|
Notes To Consolidated Financial Statements
|
44
|
|
Note 1—Nature of Operations
|
44
|
|
Note 2—Summary of Significant Accounting Policies
|
44
|
|
Note 3—Investments
|
49
|
|
Note 4—Fair Value Measurements
|
50
|
|
Note 5—Customer Concentration and Risk
|
52
|
|
Note 6—Property, Equipment and Software
|
53
|
|
Note 7—Goodwill and Other Intangible Assets
|
54
|
|
Note 8—Income Taxes
|
55
|
|
Note 9— Commitments And Contingencies
|
57
|
|
Note 10—Related Party Transactions
|
59
|
|
Note 11—Segment Information
|
60
|
|
Note 12—Shareholders’ Equity
|
62
|
|
Note 13—Share-based Payment
|
62
|
|
Note 14—Discontinued Operations
|
65
|
|
Note 15—Loss per Share
|
67
|
|
Note 16—Acquisition
|
67
|
|
Note 17—Restructuring
|
68
|
|
Note 18—Subsequent Events
|
69
|
|
Selected Quarterly Financial Data (Unaudited)
|
70
|
|
Schedule II
|
71
|
36
To the Board of Directors and Shareholders
Tier Technologies, Inc.
We have audited the accompanying consolidated balance sheets of Tier Technologies, Inc. and subsidiaries as of September 30, 2010 and 2009, and the related consolidated statements of operations, shareholders' equity, comprehensive loss, and cash flows for each of the three years in the period ended September 30, 2010. Our audits also included the financial statement schedule of Tier Technologies, Inc. and subsidiaries listed in Item 15(a). These financial statements and financial statement schedule are the responsibility of the Company's management. Our responsibility is to express an opinion on these financial statements based on our audits.
We conducted our audits in accordance with the standards of the Public Company Accounting Oversight Board (United States). Those standards require that we plan and perform the audit to obtain reasonable assurance about whether the financial statements are free of material misstatement. An audit includes examining, on a test basis, evidence supporting the amounts and disclosures in the financial statements. An audit also includes assessing the accounting principles used and significant estimates made by management, as well as evaluating the overall financial statement presentation. We believe that our audits provide a reasonable basis for our opinion.
In our opinion, the consolidated financial statements referred to above present fairly, in all material respects, the financial position of Tier Technologies, Inc. and subsidiaries as of September 30, 2010 and 2009, and the results of their operations and their cash flows for each of the three years in the period ended September 30, 2010, in conformity with U.S. generally accepted accounting principles. Also, in our opinion, the related financial statement schedule, when considered in relation to the basic consolidated financial statements taken as a whole, presents fairly in all material respects the information set forth therein.
We have also audited, in accordance with the standards of the Public Company Accounting Oversight Board (United States), Tier Technologies, Inc. and subsidiaries’ internal control over financial reporting as of September 30, 2010, based on criteria established in Internal Control — Integrated Framework issued by the Committee of Sponsoring Organizations of the Treadway Commission, and our report dated November 22, 2010, expressed an unqualified opinion on the effectiveness of Tier Technologies Inc. and subsidiaries’ internal control over financial reporting.
/s/ McGladrey & Pullen, LLP
Vienna, VA
November 22, 2010
37
TIER TECHNOLOGIES, INC.
|
CONSOLIDATED BALANCE SHEETS
|
|
(in thousands)
|
September 30,
2010
|
September 30,
2009
|
||||||
|
ASSETS:
|
||||||||
|
Current assets:
|
||||||||
|
Cash and cash equivalents
|
$ | 45,757 | $ | 21,969 | ||||
|
Investments in marketable securities
|
8,249 | 4,499 | ||||||
|
Restricted investments
|
1,311 | 1,361 | ||||||
|
Accounts receivable, net
|
4,883 | 4,790 | ||||||
|
Settlements receivable, net
|
8,356 | 10,592 | ||||||
|
Prepaid expenses and other current assets
|
1,407 | 2,239 | ||||||
|
Total current assets
|
69,963 | 45,450 | ||||||
|
Property, equipment and software, net
|
12,032 | 7,990 | ||||||
|
Goodwill
|
17,381 | 17,329 | ||||||
|
Other intangible assets, net
|
7,477 | 12,038 | ||||||
|
Investments in marketable securities
|
— | 31,169 | ||||||
|
Restricted investments
|
6,000 | 6,000 | ||||||
|
Other assets
|
172 | 571 | ||||||
|
Total assets
|
$ | 113,025 | $ | 120,547 | ||||
|
LIABILITIES AND SHAREHOLDERS’ EQUITY:
|
||||||||
|
Current liabilities:
|
||||||||
|
Accounts payable
|
$ | 1,059 | $ | 84 | ||||
|
Settlements payable
|
10,716 | 13,911 | ||||||
|
Accrued compensation liabilities
|
4,261 | 3,213 | ||||||
|
Accrued discount fees
|
4,624 | 5,343 | ||||||
|
Other accrued liabilities
|
2,718 | 3,425 | ||||||
|
Deferred income
|
558 | 861 | ||||||
|
Total current liabilities
|
23,936 | 26,837 | ||||||
|
Other liabilities:
|
||||||||
|
Deferred rent
|
1,257 | — | ||||||
|
Other liabilities
|
596 | 1,121 | ||||||
|
Total other liabilities
|
1,853 | 1,121 | ||||||
|
Total liabilities
|
25,789 | 27,958 | ||||||
|
Commitments and contingencies (Note 9)
|
||||||||
|
Shareholders’ equity:
|
||||||||
|
Preferred stock, no par value; authorized shares: 4,579;
no shares issued and outstanding
|
— | — | ||||||
|
Common stock, $0.01 par value, and paid-in capital; shares authorized: 44,260;
shares issued: 20,706 and 20,687; shares outstanding: 18,170 and 18,238
|
193,620 | 192,030 | ||||||
|
Treasury stock—at cost, 2,536 and 2,449 shares
|
(21,020 | ) | (20,271 | ) | ||||
|
Accumulated other comprehensive loss
|
(1 | ) | — | |||||
|
Accumulated deficit
|
(85,363 | ) | (79,170 | ) | ||||
|
Total shareholders’ equity
|
87,236 | 92,589 | ||||||
|
Total liabilities and shareholders’ equity
|
$ | 113,025 | $ | 120,547 | ||||
See Notes to Consolidated Financial Statements
38
TIER TECHNOLOGIES, INC.
|
CONSOLIDATED STATEMENTS OF OPERATIONS
|
|
Year ended September 30,
|
||||||||||||
|
(in thousands, except per share data)
|
2010
|
2009
|
2008
|
|||||||||
|
Revenues
|
$ | 130,224 | $ | 128,246 | $ | 122,571 | ||||||
|
Costs and expenses:
|
||||||||||||
|
Direct costs
|
98,328 | 95,594 | 95,234 | |||||||||
|
General and administrative
|
25,199 | 25,529 | 28,020 | |||||||||
|
Selling and marketing
|
6,355 | 6,708 | 8,677 | |||||||||
|
Depreciation and amortization
|
6,711 | 6,569 | 5,328 | |||||||||
|
Total costs and expenses
|
136,593 | 134,400 | 137,259 | |||||||||
|
Loss from continuing operations before other income and income taxes
|
(6,369 | ) | (6,154 | ) | (14,688 | ) | ||||||
|
Other income:
|
||||||||||||
|
Interest income, net
|
414 | 754 | 2,731 | |||||||||
|
Gain (loss) on investment
|
31 | (31 | ) | — | ||||||||
|
Gain on sale of assets
|
6 | — | — | |||||||||
|
Total other income
|
451 | 723 | 2,731 | |||||||||
|
Loss from continuing operations before income taxes
|
(5,918 | ) | (5,431 | ) | (11,957 | ) | ||||||
|
Income tax provision
|
30 | 40 | 87 | |||||||||
|
Loss from continuing operations
|
(5,948 | ) | (5,471 | ) | (12,044 | ) | ||||||
|
Loss from discontinued operations, net
|
(245 | ) | (6,035 | ) | (15,401 | ) | ||||||
|
Net loss
|
$ | (6,193 | ) | $ | (11,506 | ) | $ | (27,445 | ) | |||
|
Loss per share—Basic and diluted:
|
||||||||||||
|
From continuing operations
|
$ | (0.33 | ) | $ | (0.28 | ) | $ | (0.61 | ) | |||
|
From discontinued operations
|
$ | (0.01 | ) | $ | (0.31 | ) | $ | (0.79 | ) | |||
|
Loss per share—Basic and diluted
|
$ | (0.34 | ) | $ | (0.59 | ) | $ | (1.40 | ) | |||
|
Weighted average common shares used in computing:
|
||||||||||||
|
Basic and diluted loss per share
|
18,153 | 19,438 | 19,616 | |||||||||
See Notes to Consolidated Financial Statements
39
TIER TECHNOLOGIES, INC.
|
CONSOLIDATED STATEMENTS OF SHAREHOLDERS’ EQUITY
|
| Accumulated other | Total | |||||||||||||||||||||||||||||||
| Common Stock Issued | Paid-in- | Treasury Stock | comprehensive | Accumulated | shareholders' | |||||||||||||||||||||||||||
| (in thousands) | Shares | Amount | capital | Shares | Amount | (loss) income | deficit | equity | ||||||||||||||||||||||||
|
Balance at September 30, 2007
|
20,425 | $ | 204 | $ | 186,213 | (884 | ) | $ | (8,684 | ) | $ | — | $ | (40,219 | ) | $ | 137,514 | |||||||||||||||
|
Net loss
|
— | — | — | — | — | — | (27,445 | ) | (27,445 | ) | ||||||||||||||||||||||
|
Exercise of stock options
|
194 | 2 | 1,281 | — | — | — | — | 1,283 | ||||||||||||||||||||||||
|
Share-based payment
|
— | — | 2,399 | — | — | — | — | 2,399 | ||||||||||||||||||||||||
|
Unrealized loss on
investments
|
— | — | — | — | — | (2,504 | ) | — | (2,504 | ) | ||||||||||||||||||||||
|
Balance at September 30, 2008
|
20,619 | 206 | 189,893 | (884 | ) | (8,684 | ) | (2,504 | ) | (67,664 | ) | 111,247 | ||||||||||||||||||||
|
Net loss
|
— | — | — | — | — | — | (11,506 | ) | (11,506 | ) | ||||||||||||||||||||||
|
Exercise of stock options
|
68 | 1 | 421 | — | — | — | — | 422 | ||||||||||||||||||||||||
|
Share-based payment
|
— | — | 1,509 | — | — | — | — | 1,509 | ||||||||||||||||||||||||
|
Repurchase of common
stock
|
— | — | — | (1,565 | ) | (11,587 | ) | — | — | (11,587 | ) | |||||||||||||||||||||
|
Impact of realized losses transferred from Accumulated Other Comprehensive Income and included in net loss
|
— | — | — | — | — | 2,504 | — | 2,504 | ||||||||||||||||||||||||
|
Balance at September 30, 2009
|
20,687 | 207 | 191,823 | (2,449 | ) | (20,271 | ) | — | (79,170 | ) | 92,589 | |||||||||||||||||||||
|
Net loss
|
— | — | — | — | — | — | (6,193 | ) | (6,193 | ) | ||||||||||||||||||||||
|
Exercise of stock options
|
19 | — | 82 | — | — | — | — | 82 | ||||||||||||||||||||||||
|
Share-based payment
|
— | — | 1,508 | — | — | — | — | 1,508 | ||||||||||||||||||||||||
|
Repurchase of common
stock
|
— | — | — | (87 | ) | (749 | ) | — | — | (749 | ) | |||||||||||||||||||||
|
Unrealized loss on investment
|
— | — | — | — | — | (1 | ) | — | (1 | ) | ||||||||||||||||||||||
|
Balance at September 30, 2010
|
20,706 | $ | 207 | $ | 193,413 | (2,536 | ) | $ | (21,020 | ) | $ | (1 | ) | $ | (85,363 | ) | $ | 87,236 | ||||||||||||||
See Notes to Consolidated Financial Statements
40
TIER TECHNOLOGIES, INC.
|
CONSOLIDATED STATEMENTS OF COMPREHENSIVE LOSS
|
|
Year ended September 30,
|
||||||||||||
|
(in thousands)
|
2010
|
2009
|
2008
|
|||||||||
|
Net loss
|
$ | (6,193 | ) | $ | (11,506 | ) | $ | (27,445 | ) | |||
|
Other comprehensive (loss) income, net of taxes:
|
||||||||||||
|
Investments in marketable securities:
|
||||||||||||
|
Unrealized loss
|
(1 | ) | — | (2,504 | ) | |||||||
|
Impact of realized loss transferred from Accumulated Other Comprehensive Income and included in net loss
|
— | 2,504 | — | |||||||||
|
Other comprehensive (loss) income
|
(1 | ) | 2,504 | (2,504 | ) | |||||||
|
Comprehensive loss
|
$ | (6,194 | ) | $ | (9,002 | ) | $ | (29,949 | ) | |||
See Notes to Consolidated Financial Statements
41
TIER TECHNOLOGIES, INC.
|
CONSOLIDATED STATEMENTS OF CASH FLOWS
|
|
Year ended September 30,
|
||||||||||||
|
(In thousands)
|
2010
|
2009
|
2008
|
|||||||||
|
CASH FLOWS FROM OPERATING ACTIVITIES:
|
||||||||||||
|
Net loss
|
$ | (6,193 | ) | $ | (11,506 | ) | $ | (27,445 | ) | |||
|
Less: Loss from discontinued operations, net
|
(245 | ) | (6,035 | ) | (15,401 | ) | ||||||
|
Loss from continuing operations, net
|
(5,948 | ) | (5,471 | ) | (12,044 | ) | ||||||
|
Non-cash items included in net loss from continuing operations:
|
||||||||||||
|
Depreciation and amortization
|
6,712 | 6,642 | 5,497 | |||||||||
|
Provision for doubtful accounts
|
1,304 | 417 | 239 | |||||||||
|
Deferred rent
|
388 | — | — | |||||||||
|
Share-based compensation
|
1,012 | 2,522 | 2,224 | |||||||||
|
(Gain) loss on trading investments
|
(31 | ) | 31 | — | ||||||||
|
Gain on sale of equipment
|
(10 | ) | — | — | ||||||||
|
Other
|
1 | (19 | ) | 453 | ||||||||
|
Net effect of changes in assets and liabilities:
|
||||||||||||
|
Accounts and settlements receivable, net
|
839 | (6,510 | ) | 473 | ||||||||
|
Prepaid expenses and other assets
|
629 | (89 | ) | 261 | ||||||||
|
Accounts payable and accrued liabilities
|
(2,681 | ) | 5,399 | 311 | ||||||||
|
Income taxes receivable
|
84 | 1 | 19 | |||||||||
|
Deferred income
|
(303 | ) | (929 | ) | (859 | ) | ||||||
|
Cash provided by (used in) operating activities from continuing operations
|
1,996 | 1,994 | (3,426 | ) | ||||||||
|
Cash (used in) provided by operating activities from discontinued operations
|
(855 | ) | (5,187 | ) | 3,955 | |||||||
|
Cash provided by (used in) by operating activities
|
1,141 | (3,193 | ) | 529 | ||||||||
|
CASH FLOWS FROM INVESTING ACTIVITIES:
|
||||||||||||
|
Purchases of available-for-sale securities
|
(23,587 | ) | (38,455 | ) | (7,325 | ) | ||||||
|
Sales and maturities of available-for-sale securities
|
19,886 | 36,371 | 33,815 | |||||||||
|
Sales of trading securities
|
31,200 | 125 | — | |||||||||
|
Sales and maturities of restricted investments
|
— | 500 | 1,250 | |||||||||
|
Purchase of equipment and software
|
(5,244 | ) | (3,889 | ) | (1,951 | ) | ||||||
|
ChoicePay asset purchase net of cash acquired
|
— | (6,927 | ) | — | ||||||||
|
Additions to goodwill—ChoicePay
|
(52 | ) | — | — | ||||||||
|
Collection of note receivable
|
527 | 71 | — | |||||||||
|
Proceeds from sale of equipment
|
10 | — | — | |||||||||
|
Cash provided by (used in) investing activities from continuing operations
|
22,740 | (12,204 | ) | 25,789 | ||||||||
|
Cash provided by investing activities from discontinued operations
|
610 | 818 | 3,678 | |||||||||
|
Cash provided by (used in) investing activities
|
23,350 | (11,386 | ) | 29,467 | ||||||||
|
CASH FLOWS FROM FINANCING ACTIVITIES:
|
||||||||||||
|
Net proceeds from issuance of common stock
|
82 | 421 | 1,283 | |||||||||
|
Purchase of company stock
|
(749 | ) | (11,587 | ) | — | |||||||
|
Capital lease obligations and other financing arrangements
|
(36 | ) | (21 | ) | (56 | ) | ||||||
|
Cash (used in) provided by financing activities from continuing operations
|
(703 | ) | (11,187 | ) | 1,227 | |||||||
|
Cash used in financing activities from discontinued operations
|
— | — | (4 | ) | ||||||||
|
Cash (used in) provided by financing activities
|
(703 | ) | (11,187 | ) | 1,223 | |||||||
|
Net increase (decrease) in cash and cash equivalents
|
23,788 | (25,766 | ) | 31,219 | ||||||||
|
Cash and cash equivalents at beginning of period
|
21,969 | 47,735 | 16,516 | |||||||||
|
Cash and cash equivalents at end of period
|
$ | 45,757 | $ | 21,969 | $ | 47,735 | ||||||
See Notes to Consolidated Financial Statements
42
TIER TECHNOLOGIES, INC.
|
CONSOLIDATED SUPPLEMENTAL CASH FLOW INFORMATION
|
|
Year ended September 30,
|
||||||||||||
|
(in thousands)
|
2010
|
2009
|
2008
|
|||||||||
|
SUPPLEMENTAL DISCLOSURES OF CASH FLOW INFORMATION:
|
||||||||||||
|
Cash paid during the period for:
|
||||||||||||
|
Interest
|
$ | 26 | $ | 14 | $ | 11 | ||||||
|
Income taxes paid, net
|
$ | 35 | $ | 38 | $ | 24 | ||||||
|
SUPPLEMENTAL SCHEDULE OF NON-CASH INVESTING AND FINANCING ACTIVITIES:
|
||||||||||||
|
Tenant improvement acquired with deferred rent credit
|
$ | 959 | $ | — | $ | — | ||||||
|
Investments released from restriction
|
$ | 50 | $ | — | $ | 2,415 | ||||||
|
Equipment acquired under capital lease obligations and other financing arrangements
|
$ | — | $ | 116 | $ | 28 | ||||||
|
Fair value of ARS Rights
|
$ | 3,289 | $ | 3,289 | $ | — | ||||||
|
Receivables from third parties
|
$ | — | $ | 950 | $ | — | ||||||
|
Transfer from available-for-sale to trading securities, at par value
|
$ | — | $ | 31,325 | $ | — | ||||||
|
Fair value adjustment of trading securities
|
$ | 3,320 | $ | 816 | $ | — | ||||||
|
SUPPLEMENTAL SCHEDULE OF INVESTING ACTIVITIES:
|
||||||||||||
|
Purchase price of ChoicePay acquisition
|
$ | — | $ | 7,597 | $ | — | ||||||
|
Fair value of identifiable net assets acquired
|
$ | — | $ | 4,794 | $ | — | ||||||
|
Goodwill arising from ChoicePay acquisition
|
$ | — | $ | 2,803 | $ | — | ||||||
See Notes to Consolidated Financial Statements
43
|
NOTES TO CONSOLIDATED FINANCIAL STATEMENTS
|
|
NOTE 1—NATURE OF OPERATIONS
|
Tier Technologies, Inc., or Tier, primarily provides Electronic Payment Solutions, or EPS services which are provided by our wholly owned subsidiary Official Payments Corporation, or OPC. We operate in the following biller direct markets:
|
·
|
Federal—which includes federal income and business tax payments;
|
|
·
|
State and Local—which includes state and local income tax payments and business tax payments;
|
|
·
|
Property Tax— which covers state and local real property tax;
|
|
·
|
Utility;
|
|
·
|
Education—which consists of services to post-secondary educational institutions; and
|
|
·
|
Other—which includes local government fines and fees, motor vehicle registration and payments, rent, insurance, K-12 education meal pay and fee payments, and personal property tax payments.
|
During fiscal 2010, we also operated in one other business area called our Voice and Systems Automation, or VSA, business, which we are winding down over the next two years because the services are neither compatible with our long-term strategic direction nor complementary with businesses we have divested. VSA provides call center interactive voice response systems and support services, which include customization, installation and maintenance.
For additional information about our EPS and Wind-down operations, see Note 11—Segment Information.
For additional information about businesses in which we no longer operate, and have divested, see Note 14—Discontinued Operations.
|
NOTE 2—SUMMARY OF SIGNIFICANT ACCOUNTING POLICIES
|
SIGNIFICANT ACCOUNTING POLICIES
Basis of Presentation. These financial statements and the accompanying notes are prepared in accordance with accounting principles generally accepted in the United States of America and conform to Regulation S-X under the Securities Exchange Act of 1934, as amended. We believe we have made all necessary adjustments so that the financial statements are presented fairly and that all such adjustments are of a normal recurring nature.
Principles of Consolidation. The financial statements include the accounts of Tier Technologies, Inc. and its subsidiaries. Intercompany transactions and balances have been eliminated.
Use of Estimates. Preparing financial statements requires management to make estimates and assumptions that affect the amounts reported on our Consolidated Financial Statements and accompanying notes. We believe that near-term changes could reasonably impact the following estimates: collectability of receivables; share-based compensation; valuation of goodwill, intangibles and investments; contingent liabilities; effective tax rates; deferred taxes and associated valuation allowance; and project costs and project percentage of completion. Although we believe the estimates and assumptions used in preparing our Consolidated Financial Statements and notes thereto are reasonable in light of known facts and circumstances, actual results could differ materially.
Cash and Cash Equivalents. Cash equivalents are highly liquid investments with maturities of three months or less at the date of purchase and are stated at amounts that approximate fair value, based on quoted market prices. Cash equivalents consist principally of investments in interest-bearing demand deposit accounts with financial institutions and U.S. Treasury bills.
44
Revenue Recognition and Credit Risk. As discussed in more detail below, EPS revenues are primarily attributable to fees for processing incoming payment obligations electronically. Within our Wind-down operations, we recognize revenue when persuasive evidence of an arrangement exists, delivery has occurred, the fee is fixed or determinable and collectability is probable. When we enter into certain arrangements where we are obligated to deliver multiple products and/or services, we account for each unit of the contract separately when each unit provides value to the customer on a standalone basis and there is objective evidence of the fair value of the standalone unit.
We assess collectability based upon our clients’ financial condition and prior payment history, as well as our performance under the arrangement.
Continuing Operations
Our EPS operations offer payment solutions services to our clients, which allow them to offer their constituents (individuals or businesses) the ability to pay certain financial obligations with their credit or debit cards, electronic check, cash or money order, depending on the terms of the arrangement. Our revenue is generated in the form of the convenience fee we are permitted to charge for the electronic payment solutions service provided. Depending on the agreement with the client, the convenience fee can be a fixed fee or a percentage of the payment processed. In more than 90% of our arrangements, this fee is charged directly to the constituent and is added to their payment obligation at the point the payment is processed. Our clients pay the remainder of the convenience fees we receive. We recognize the revenue in the month in which the service is provided.
We used the percentage-of-completion method to recognize revenue associated with our Pension wind-down operations in fiscal years 2009 and 2008. This method of revenue recognition is discussed in more detail in the following Discontinued Operations section. We did not recognize any revenue associated with Pension during fiscal year 2010.
Our remaining Wind-down operations include software sales and maintenance and support, as well as non-essential training and consulting. We recognize the revenues on training and consulting projects in the month the services are performed. The method of revenue recognition for software sales and maintenance and support is discussed in more detail in the following Discontinued Operations section.
Discontinued Operations
Typically, our payment processing and call center operations earn revenues based upon a specific fee per transaction or percentage of the dollar amount processed. We recognize these revenues in the month that the service is provided. As of September 30, 2008 our payment processing and call center operations were completely divested.
We use the percentage-of-completion method to recognize revenues for software licenses and related services for projects that require significant modification or customization that is essential to the functionality of the software. We record a provision in those instances in which we believe it is probable that a contract will generate a net loss and we can reasonably estimate this loss. If we cannot reasonably estimate the loss, we limit the amount of revenue that we recognize to the costs we have incurred, until we can estimate the total loss. Advance payments from clients and amounts billed to clients in excess of revenue recognized are recorded as deferred revenue. Amounts recognized as revenue in advance of contractual billing are recorded as unbilled receivables.
For the sale of software that does not require significant modification, we recognize revenues from license fees when persuasive evidence of an agreement exists, delivery of the software has occurred, no significant implementation or integration obligations exist, the fee is fixed or determinable and collectability is probable. If we do not believe it is probable that we will collect a fee, we do not recognize the associated revenue until we collect the payment.
For software license arrangements with multiple obligations (for example, undelivered maintenance and support), we allocate revenues to each component of the arrangement using the residual value method of
45
accounting based on the fair value of the undelivered elements, which is specific to our company. Fair value for the maintenance and support obligations for software licenses is based upon the specific renewal rates.
Our license agreements do not offer return rights or price protection; therefore, we do not have provisions for sales returns on these types of agreements. We do, however, offer routine, short-term warranties that our proprietary software will operate free of material defects and in conformity with written documentation. Under these agreements, if we have an active maintenance agreement, we record a liability for our estimated future warranty claims, based on historical experience. If there is no maintenance contract, the warranty is considered implied maintenance and we defer revenues consistent with other maintenance and support obligations.
When we provide ongoing maintenance and support services, the associated revenue is deferred and recognized on a straight-line basis over the life of the related contract—typically one year. Generally, we recognize the revenues earned for non-essential training and consulting support when the services are performed.
Finally, under the terms of a number of our contracts, we are reimbursed for certain costs that we incur to support the project, including travel, postage, stationery and printing. We include the amounts that we are entitled to be reimbursed and any associated mark-up on these expenses and the expenses Loss from discontinued operations, net on our Consolidated Statements of Operations.
Allowance for Doubtful Accounts. The allowance for doubtful accounts reflects our best estimate of probable losses inherent in the accounts receivable balance. We determine the allowance based on known troubled accounts, historical experience and other currently available evidence. In addition, our OPC subsidiary records a sales return allowance, calculated monthly as 0.40% of gross revenues on the applicable contracts, to establish an allowance for the reversal of convenience fees. Convenience fees are charged to cardholders on a per transaction basis and are reinstated to cardholders upon an approved payment reversal. Additions to the provision for bad debts are included in General and administrative on our Consolidated Statements of Operations, while the provision for sales return allowance is included as a reduction against Revenues. The balance of our allowance for doubtful accounts for Continuing Operations was $1.1 million at September 30, 2010 and $0.4 million at September 30, 2009.
Settlements receivable, net. Individuals and businesses settle their obligations to our various clients, primarily utility and other public sector clients, using credit or debit cards or via ACH payments. We create a receivable for the amount due from the credit or debit card company or bank and an offsetting payable to the client. Once we receive confirmation the funds have been received, we settle the obligation to the client.
Fair Value of Financial Instruments. The carrying amounts of certain financial instruments, including cash equivalents, restricted cash, accounts receivable, accounts payable and accrued liabilities, approximate fair value due to their short maturities.
Investments in Marketable Securities. Investments in marketable securities are composed of available-for-sale securities and trading securities. Restricted investments pledged in connection with performance bonds and real estate operating leases are reported as Restricted investments on the Consolidated Balance Sheets. Unrestricted investments with remaining maturities of 90 days or less (as of the date that we purchased the securities) are classified as cash equivalents. Other securities that would not otherwise be included in Restricted investments or Cash and cash equivalents are classified on the Consolidated Balance Sheets as Investments in marketable securities. Our investments are categorized as available-for-sale and trading securities and recorded at estimated fair value, based on quoted market prices, or financial models if quoted market prices are unavailable. Increases and decreases in fair value are recorded as unrealized gains and losses in Other comprehensive loss for available-for-sale securities, and are recorded in the Consolidated Statements of Operations as (Gain)/loss in investments for trading securities. Realized gains and losses and declines in fair value judged to be other-than-temporary are included in the Consolidated Statements of Operations as a Loss on investment. Interest earned is included in Interest income, net.
During fiscal year 2010 our securities consisted of U.S. Treasury bills, U.S government agency discount notes and certificates of deposit and municipal bonds collateralized with student loans. For additional
46
information on the composition of our marketable securities, please see Note 3—Investments. Beginning in February 2008 we began to experience unsuccessful auctions resulting from the uncertainty and turmoil of the credit markets, particularly with the concerns about mortgage-backed securities. Due to the lack of liquidity in the market, during fiscal 2008 we began classifying these investments as long-term.
In November 2008, we entered into an agreement with our investment manager, UBS AG, or UBS, which entitled us to sell our Auction Rate Securities, or ARS, to UBS for a price equal to the par value plus accrued but unpaid interest over a given period of time. For complete details on this agreement, please see Note 3—Investments. We valued this agreement in accordance with US GAAP at the fair value option for recognized financial assets, in order to match the changes in the fair value of the ARS. Consistent with this accounting treatment, we recorded unrealized gains and losses in (Gain)/loss on investment in our Consolidated Statements of Operations. On June 30, 2010 we formally exercised our rights to sell the ARS remaining in our portfolio to UBS at par value plus accrued but unpaid interest. This transaction was completed on July 2, 2010 and we invested the proceeds in other liquid short term investments.
Advertising Expense. We expense advertising costs, net of cooperative advertising cash contributions received from partners, during the period the advertising takes place. We incurred $0.7 million during fiscal 2010, $0.4 million during fiscal 2009, and $0.5 million during fiscal 2008 of net advertising expenses from Continuing Operations.
Property, Equipment and Software. Property, equipment and software are stated at cost and depreciated using the straight-line method over the shorter of the estimated useful lives of the assets or the lease terms, ranging from three to seven years. When assets are retired or otherwise disposed of, the cost and accumulated depreciation are removed from the accounts and any resulting gain or loss is reflected in operations in the period realized.
We expense the costs incurred for software that we expect to use internally until the preliminary project stage has been completed. Subsequently, we capitalize direct service and material costs, as well as direct payroll and payroll-related costs and interest costs incurred during development. Once the software is placed in use, we amortize it on a straight-line basis over the estimated economic life of the software.
We expense the cost of software that we expect to sell, lease or market as research and development costs, prior to the time that technical feasibility is established. Once technical feasibility is established, we capitalize software development costs until the date that the software is available for sale. During fiscal year 2009 we recognized $2.6 million in impairment expense related to internally-developed software related to our discontinued operations.
Goodwill. Goodwill is not amortized, but instead is tested for impairment at least annually at the reporting unit level. We perform this impairment test by first comparing the fair value of our reporting units to their carrying amount. If an indicator of impairment exists, we would then compare the implied fair value of our goodwill to the carrying amount in order to determine the amount of the impairment, if any. We determine fair value of our reporting units using the income approach, which uses a discounted cash flow model. During fiscal 2008, we recorded goodwill impairment and sale-related write downs of $8.8 million for Discontinued Operations. No impairment existed during fiscal 2010.
Intangible Assets. We amortize intangible assets with finite lives over their estimated benefit period, ranging from five to 16 years. We evaluate the recoverability of intangible assets periodically and take into account events or circumstances that warrant revised estimates of useful lives or that indicate that impairment exists. No impairment existed during fiscal 2010.
(Loss) Earnings Per Share. Basic (loss) earnings per share are computed by dividing net (loss) income by the weighted-average number of shares of common stock outstanding for the period. Diluted earnings per share reflect the potential dilution that could occur if securities or other contracts to issue common stock were exercised or converted into common stock.
Share-Based Payment. Share-based compensation cost for an option award is measured at the grant date based on the fair value of the award and is recognized as expense over the applicable vesting period of the
47
award (typically three to five years) using the ratable method. We also issue restricted stock units and performance stock units. For restricted stock units issuable in shares, we measure the award at the grant date fair value and recognize the expense over the applicable vesting period of three years. For the restricted stock units and performance stock units payable in cash, we record expense based on the fair value of the awards on the dates of each valuation, consistent with the recognition of awards classified as liabilities under US GAAP.
Income Taxes. Deferred income taxes are provided for the tax effect of temporary differences between the tax basis of assets and liabilities and their reported amounts in the financial statements. The liability method is used to account for income taxes, which requires deferred taxes to be recorded at the statutory rate expected to be in effect when the taxes are paid or the differences are reversed. Valuation allowances are established against net deferred tax assets when it is more likely than not that some portion or all of the deferred tax assets will not be realized. We recognize the tax benefit of an uncertain tax position only if it is more-likely-than-not that the tax position will be sustained on examination by the taxing authorities, based on the technical merits of the position.
Accumulated Comprehensive (Loss) Income. Our accumulated comprehensive (loss) income is composed of net (loss) income and unrealized (losses) gains on marketable investment securities, net of related taxes.
Accrued Discount Fees. Our direct costs for our EPS operations primarily consist of credit card interchange fees, in addition to assessments and other costs passed onto us by our processors. Collectively, these fees and costs are considered to be discount fees. Discount fees are charged to us as a percentage of the dollar volume we transact, and for expense purposes, are incurred during the month that the related transaction is authorized for payment. Accrued discount fees represent the total amount of discount fees which have been incurred by us on authorized transactions, but have yet to be remitted by us as of the reporting date. Discount fees are typically remitted by us in the calendar month which follows the date of transaction authorization.
RECENT ACCOUNTING PRONOUNCEMENTS
FASB ASC 860. In June 2009, the FASB issued FASB ASC 860, which eliminates the concept of a qualifying special-purpose entity, creates more stringent conditions for reporting a transfer of a portion of a financial asset as a sale, clarifies other sale-accounting criteria, and changes the initial measurement of a transferor’s interest in transferred financial assets. FASB ASC 860 will be effective for transfers of financial assets in fiscal years beginning after November 15, 2009 and in interim periods within those fiscal years with earlier adoption prohibited. We will adopt FASB ASC 860 on October 1, 2010. We are currently evaluating the effect the adoption of FASB ASC 860 will have on our financial position and results of operations.
FASB ASU 2010-06. In January 2010, the FASB issued Accounting Standards Update, or ASU, or FASB ASU 2010-06, which amends the disclosure requirements relating to recurring and nonrecurring fair value measurements. New disclosures are required about transfers into and out of the levels 1 and 2 fair value hierarchy and separate disclosures about purchases, sales, issuances and settlements relating to Level 3 measurements. This ASU also requires an entity to present information about purchases, sales, issuances and settlements for significant unobservable inputs on a gross basis rather than as a net number. This ASU was effective for us with the reporting period beginning January 1, 2010, except for the disclosures on the roll forward activities for Level 3 fair value measurements, which will become effective for us with the reporting period beginning October 1, 2011. The adoption of this ASU had no impact on our financial position and results of operations, as it only requires additional disclosures.
FASB ASU 2010-20. In July 2010, the FASB issued, FASB ASU 2010-20, which amends ASC 310 by requiring additional, more robust disclosures about the credit quality of an entity’s financing receivables and its allowance for credit losses. We will adopt the disclosure requirements in our December 31, 2010 quarterly report. The adoption of this ASU had no impact on our financial position and results of operations, as it only changes disclosure requirements.
48
|
NOTE 3—INVESTMENTS
|
We own investments in marketable securities designated as available-for-sale or trading securities as defined by US GAAP. Current Restricted investments on the Consolidated Balance Sheets, totaling $1.3 million at September 30, 2010 and $1.4 million at September 30, 2009, were pledged in connection with performance bonds and will be restricted for the terms of the project performance periods, the latest of which is estimated to end in December 2010. Our bank requires us to maintain a $6.0 million money market investment as a compensating balance to guarantee availability of funds for processing outgoing Automated Clearing House payments to our clients. This money market investment is reported as long-term Restricted investments on the Consolidated Balance Sheets.
We evaluate certain available-for-sale investments for other-than-temporary impairment when the fair value of the investment is lower than its book value. Factors that management considers when evaluating for other-than-temporary impairment include: the length of time and the extent to which market value has been less than cost; the financial condition and near-term prospects of the issuer; interest rates; credit risk; the value of any underlying portfolios or investments; and our intent and ability to hold the investment for a period of time sufficient to allow for any anticipated recovery in the market. We do not adjust the recorded book value for declines in fair value that we believe are temporary, if we have the intent and ability to hold the associated investments for the foreseeable future and we have not made the decision to dispose of the securities as of the reported date.
At September 30, 2010, our investment portfolio included $8.2 million of marketable securities consisting primarily of discount notes. At September 30, 2009, our investment portfolio included $31.2 million, par value, of auction rate securities that were made up of municipal bonds that were collateralized with student loans. As further discussed below, during fiscal year 2010, we liquidated all $31.2 million of these auction rate securities, or ARS, and have invested those funds in other short term liquid investments and cash equivalents.
On November 11, 2008, we accepted an offer from our investment manager, UBS AG, or UBS, providing us with rights related to our ARS, or ARS Rights. The ARS Rights (which had features that operate like put options) were covered in a prospectus dated October 7, 2008. The ARS Rights entitled us to sell our existing ARS to UBS for a price equal to the par value plus accrued but unpaid interest, at any time during the period from June 30, 2010 through July 2, 2012. The ARS Rights also granted to UBS the sole discretion and right to sell or otherwise dispose of our eligible ARS at any time until July 2, 2012, without prior notification, so long as we received a payment of par value. On June 30, 2010 we formally exercised our rights under the ARS Rights to sell the ARS remaining in our portfolio to UBS at par value plus accrued but unpaid interest. This transaction was completed on July 2, 2010 and we invested the proceeds in other liquid short term investments and cash equivalents.
Unrestricted investments with original maturities of 90 days or less (as of the date that we purchased the securities) are classified as cash equivalents. Except for our restricted investments, ARS, and ARS Rights, all other investments are categorized as available-for-sale investments. These securities are recorded at estimated fair value, based on quoted market prices or pricing methodologies. Any increases or decreases in fair value would be recorded as unrealized gains and losses in other comprehensive income. ARS and ARS Rights were classified as trading securities with changes in fair value recorded in current earnings.
The following table shows the balance sheet classification, amortized cost and estimated fair value of investments included in current and long-term investments in marketable securities:
49
|
September 30, 2010
|
September 30, 2009
|
|||||||||||||||||||||||
|
(in thousands)
|
Amortized cost
|
Unrealized gain/(loss)
|
Estimated fair value
|
Amortized cost
|
Net loss
impact
|
Estimated fair value
|
||||||||||||||||||
|
Short-term investments in marketable securities:
|
||||||||||||||||||||||||
|
Available for sale securities:
|
||||||||||||||||||||||||
|
Discount notes
|
$ | 8,199 | $ | — | $ | 8,199 | $ | — | $ | — | $ | — | ||||||||||||
|
Certificate of Deposit
|
50 | — | 50 | — | — | — | ||||||||||||||||||
|
Treasury bills
|
— | — | — | 4,499 | — | 4,499 | ||||||||||||||||||
|
Total available for sale securities
|
8,249 | — | 8,249 | 4,499 | — | 4,499 | ||||||||||||||||||
|
Long-term investments in marketable securities:
|
||||||||||||||||||||||||
|
Trading Investments:
|
||||||||||||||||||||||||
|
Debt securities (State and local bonds)
|
— | — | — | 31,200 | (3,320 | ) | 27,880 | |||||||||||||||||
|
Auction rate securities Rights Series
|
— | — | — | — | 3,289 | 3,289 | ||||||||||||||||||
|
Total trading investments
|
— | — | — | 31,200 | (31 | ) | 31,169 | |||||||||||||||||
|
Total investments
|
$ | 8,249 | $ | — | $ | 8,249 | $ | 35,699 | $ | (31 | ) | $ | 35,668 | |||||||||||
As of September 30, 2010, all of the debt securities that were included in marketable securities had remaining maturities within one year.
|
NOTE 4—FAIR VALUE MEASUREMENTS
|
Fair value is defined under US GAAP as the exchange price that would be received for an asset or paid to transfer a liability (an exit price) in the principal or most advantageous market for the asset or liability in an orderly transaction between market participants on the measurement date. Valuation techniques used to measure fair value must maximize the use of observable inputs and minimize the use of unobservable inputs. The fair value hierarchy is based on three levels of inputs that may be used to measure fair value as follows:
|
Level 1—
|
Quoted prices in active markets for identical assets or liabilities. Our Level 1 investments include: money market accounts, U.S. treasury securities, discount notes and commercial paper.
|
|
Level 2—
|
Inputs other than quoted prices in active markets, that are observable, either directly or indirectly, such as quoted prices for similar assets or liabilities; quoted prices in markets that are not active; or other inputs that are observable or can be corroborated by observable market data for substantially the full term of the assets or liabilities. Our Level 2 investments consist of certificates of deposit, which we value at cost.
|
|
Level 3—
|
Unobservable inputs, for which there is little or no market data for the assets or liabilities. Our Level 3 investments consisted of auction rate securities and our auction rate securities rights (see Note 3—Investments for more information on these securities), which we valued using the income approach.
|
The following table represents the fair value hierarchy for our financial assets, comprised of cash equivalents and investments, measured at fair value on a recurring basis as of September 30, 2010 and September 30, 2009.
50
|
Fair value measurements as of September 30, 2010
|
||||||||||||||||
|
(in thousands)
|
Level 1
|
Level 2
|
Level 3
|
Total
|
||||||||||||
|
Cash equivalents:
|
||||||||||||||||
|
U.S. Treasury bills
|
$ | 23,514 | $ | — | $ | — | $ | 23,514 | ||||||||
|
Money market
|
1,932 | — | — | 1,932 | ||||||||||||
|
Investments in marketable securities:
|
||||||||||||||||
|
Discount notes
|
— | 8,199 | — | 8,199 | ||||||||||||
|
Certificates of deposit
|
— | 50 | — | 50 | ||||||||||||
|
Restricted investments:
|
||||||||||||||||
|
Money market
|
6,000 | — | — | 6,000 | ||||||||||||
|
Certificates of deposit
|
— | 1,311 | — | 1,311 | ||||||||||||
|
Total
|
$ | 31,446 | $ | 9,560 | $ | — | $ | 41,006 | ||||||||
|
Fair value measurements as of September 30, 2009
|
||||||||||||||||
|
(in thousands)
|
Level 1
|
Level 2
|
Level 3
|
Total
|
||||||||||||
|
Cash equivalents:
|
||||||||||||||||
|
Money market
|
$ | 816 | $ | — | $ | — | $ | 816 | ||||||||
|
Investments in marketable securities:
|
||||||||||||||||
|
U.S. Treasury bills
|
4,499 | — | — | 4,499 | ||||||||||||
|
Debt securities
|
— | — | 27,880 | 27,880 | ||||||||||||
|
Auction Rate Securities Rights
|
— | — | 3,289 | 3,289 | ||||||||||||
|
Restricted investments:
|
||||||||||||||||
|
Money market
|
6,000 | — | — | 6,000 | ||||||||||||
|
Certificates of deposit
|
— | 1,361 | — | 1,361 | ||||||||||||
|
Total
|
$ | 11,315 | $ | 1,361 | $ | 31,169 | $ | 43,845 | ||||||||
We valued ARS using a discounted cash flow approach. The assumptions used in preparing the discounted cash flow model included estimates of the amount and timing of future interest and principal payments, projections of interest rate benchmarks, probability of full repayment of the principal considering the credit quality of the issuers, and the rate of return required by investors to own ARS given the current liquidity risk. The ARS Rights are a free standing asset separate from the ARS. In order to value the ARS Rights, we considered the intrinsic value, time value of money, and the creditworthiness of UBS.
Changes in fair value measurements of securities we classify as trading are included in Gain/(loss) on investments on our Consolidated Statements of Operations. Changes in fair value measurements for securities we classify as available for sale are included in Accumulated other comprehensive loss/(income) on our Consolidated Balance Sheets. The following table presents a reconciliation of all assets and liabilities measured at fair value on a recurring basis using significant unobservable inputs (Level 3) as of September 30, 2010 and 2009:
51
|
(in thousands)
|
Significant unobservable inputs (Level 3)
|
|||
|
Balance at October 1, 2009
|
$ | 31,169 | ||
|
Sale of debt securities
|
(31,200 | ) | ||
|
Gain on investments included in earnings
|
31 | |||
|
Balance at September, 2010
|
$ | — | ||
|
Gain included in Other income for the fiscal year ended September 30, 2010 related to assets sold
|
$ | 31 | ||
|
(in thousands)
|
Significant unobservable inputs (Level 3)
|
|||
|
Balance at October 1, 2008
|
$ | 28,821 | ||
|
Change in temporary valuation adjustment included in Accumulated other comprehensive loss
|
2,504 | |||
|
Loss on investments included in earnings
|
(3,320 | ) | ||
|
Sale of debt security
|
(125 | ) | ||
|
Recognition of ARS rights
|
3,289 | |||
|
Balance at September 30, 2009
|
$ | 31,169 | ||
|
Loss included in Other income for the fiscal year ended September 30, 2009 related to assets held as of September 30, 2009
|
$ | (31 | ) | |
|
NOTE 5—CUSTOMER CONCENTRATION AND RISK
|
We derive a significant portion of our revenue from a limited number of governmental customers. Typically, the contracts allow these customers to terminate all or part of the contract for convenience or cause. We have one client, the Internal Revenue Service, or IRS, whose revenues exceeds 10% of revenues from EPS operations.
The following table shows the revenues specific to our contract with the IRS:
|
Year ended September 30,
|
||||||||||||
|
(in thousands)
|
2010
|
2009
|
2008
|
|||||||||
|
Revenue
|
$ | 21,763 | $ | 24,354 | $ | 32,572 | ||||||
|
Percentage of EPS operations revenue
|
17.1 | % | 19.8 | % | 27.8 | % | ||||||
Accounts receivable, net. As of September 30, 2010 and 2009, we reported $4.9 million and $4.8 million, respectively, in Accounts receivable, net on our Consolidated Balance Sheets. This item represents the short-term portion of receivables from our customers and other parties and retainers that we expect to receive, offset by an allowance for uncollectible accounts. Approximately 19.8% and 30.9% of the balances reported at September 30, 2010 and 2009, respectively, represent accounts receivable attributable to operations that we intend to wind down over the next two years. Within our Wind-down operations, we have one client whose accounts receivable balance makes up 43.0% of the balance at September 30, 2010, which we have fully reserved. The remainder of the Accounts receivable, net balance is composed of receivables from certain of our EPS customers. None of our EPS customers have receivables that exceed 10% of our total receivable balance. As of September 30, 2010 and 2009, Accounts receivable, net included an allowance for uncollectible accounts of $1.1 million and $0.3 million, respectively, which represents the balance of receivables that we believe are likely to become uncollectible.
Settlements receivable, net. As of September 30, 2010 and 2009, we reported $8.4 million and $10.6 million in Settlements receivable, net on our Consolidated Balance Sheets, which represents amounts due from credit or debit card companies or banks. Individuals and businesses settle their obligations to our various clients, primarily utility and other public sector clients, using credit or debit cards or via ACH payments. We create a receivable for the amount due from the credit or debit card company or bank and an offsetting payable to the client. Once we receive confirmation the funds have been received, we settle the obligation to the client. See Note 9—Commitments and Contingencies for information about the settlements payable to
52
our clients. As of September 30, 2010 and 2009, Settlements receivable, net included an allowance for the reversal of convenience fees of $47,000 and $131,000, respectively.
|
NOTE 6—PROPERTY, EQUIPMENT AND SOFTWARE
|
Property, equipment and software, net consist of the following:
|
September 30,
|
||||||||
|
(in thousands)
|
2010
|
2009
|
||||||
|
Software (a)
|
$ | 7,961 | $ | 5,003 | ||||
|
Computer equipment
|
6,214 | 4,563 | ||||||
|
Furniture and equipment
|
912 | 1,294 | ||||||
|
Land and building
|
2,651 | 2,651 | ||||||
|
Leasehold improvements
|
1,356 | 290 | ||||||
|
Total property, equipment and software, gross
|
19,094 | 13,801 | ||||||
|
Less: Accumulated depreciation and amortization
|
(7,062 | ) | (5,811 | ) | ||||
|
Total property, equipment and software, net
|
$ | 12,032 | $ | 7,990 | ||||
|
(a) Includes internally developed software in development phase
|
||||||||
We depreciate fixed assets on a straight-line basis over their estimated useful lives. Leasehold improvements are amortized over the lesser of the estimated remaining life of the leasehold or the remaining term of the lease. Depreciation and amortization expense associated with property, equipment and software that we held and used for our Continuing Operations is reported on the following lines on our Consolidated Statements of Operations:
|
Year ended September 30,
|
||||||||||||
|
(in thousands)
|
2010
|
2009
|
2008
|
|||||||||
|
Depreciation and amortization expenses for property, equipment and software:
|
||||||||||||
|
Included in Direct costs:
|
||||||||||||
|
Software
|
$ | — | $ | 26 | $ | 12 | ||||||
|
Property and equipment
|
— | 47 | 78 | |||||||||
|
Total included in Direct costs
|
— | 73 | 90 | |||||||||
|
Included in Depreciation and amortization:
|
||||||||||||
|
Software
|
767 | 410 | 180 | |||||||||
|
Property and equipment
|
1,384 | 1,198 | 964 | |||||||||
|
Total included in Depreciation and amortization
|
2,151 | 1,608 | 1,144 | |||||||||
|
Total depreciation and amortization expense for property, equipment and software
|
$ | 2,151 | $ | 1,681 | $ | 1,234 | ||||||
In addition to the depreciation and amortization reflected in the above table, the line titled Loss from discontinued operations, net on our Consolidated Statements of Operations included depreciation and amortization expense of $79,000 for fiscal 2008. This amount represents depreciation and amortization expense that was recorded until these assets were classified as held for sale. See Note 14—Discontinued Operations for additional information.
The cost of assets acquired under capital leases for our Continuing Operations was approximately $134,000 at September 30, 2010 and $152,000 at September 30, 2009. The related accumulated depreciation and amortization was $61,000 at September 30, 2010 and $44,000 at September 30, 2009.
At September 30, 2010 we had $0.5 million cost of internally developed software cost for projects still in the development phase. We expect to complete the development of these projects and place them into production during fiscal year 2011.
53
|
NOTE 7—GOODWILL AND OTHER INTANGIBLE ASSETS
|
GOODWILL
As a result of our acquisition of substantially all of the assets of ChoicePay, Inc. in January 2009, ChoicePay, Inc. has the potential to receive an earn-out of up to $2.0 million. Any earn-out is recorded as additional goodwill associated with the asset acquisition. As of September 30, 2010, we have paid ChoicePay $0.1 million for this earn-out. The following table summarizes changes in the carrying amount of goodwill during fiscal years 2010 and 2009.
|
(in thousands)
|
EPS
|
Wind-down
|
Total
|
|||||||||
|
Balance at September 30, 2008
|
$ | 14,526 | $ | — | $ | 14,526 | ||||||
|
ChoicePay, Inc. Asset Purchase
|
2,803 | — | 2,803 | |||||||||
|
Balance at September 30, 2009
|
17,329 | — | 17,329 | |||||||||
|
ChoicePay, Inc. earn-out payments
|
52 | — | 52 | |||||||||
|
Balance at September 30, 2010
|
$ | 17,381 | $ | — | $ | 17,381 | ||||||
As a general practice, we test goodwill for impairment during the fourth quarter of each fiscal year at the reporting unit level using a fair value approach. If an event occurs or circumstances change that would more likely than not reduce the fair value of a reporting unit below its carrying value, we would evaluate goodwill for impairment between annual tests. One such triggering event is when there is a more-likely-than-not expectation that a reporting unit or a significant portion of a reporting unit will be sold or otherwise disposed of. No such event occurred during fiscal year 2010.
OTHER INTANGIBLE ASSETS, NET
Currently, all of our other intangible assets are included in Continuing Operations. We test our other intangible assets for impairment when an event occurs or circumstances change that would more likely than not reduce the fair value of the assets below the carrying value. No such events occurred during fiscal years ended September 30, 2010 or 2009. The following table summarizes Other intangible assets, net, for our Continuing operations:
|
September 30, 2010
|
September 30, 2009
|
||||||||||||||||||||||||
|
(in thousands)
|
Amortization period
|
Gross
|
Accumulated amortization
|
Net
|
Gross
|
Accumulated amortization
|
Net
|
||||||||||||||||||
|
Client relationships
|
8-16 years
|
$ | 30,037 | $ | (24,378 | ) | $ | 5,659 | $ | 30,037 | $ | (20,557 | ) | $ | 9,480 | ||||||||||
|
Technology and research and development
|
5 years
|
5,618 | (4,556 | ) | 1,062 | 5,618 | (4,192 | ) | 1,426 | ||||||||||||||||
|
Trademarks
|
6-10 years
|
3,463 | (2,707 | ) | 756 | 3,463 | (2,331 | ) | 1,132 | ||||||||||||||||
|
Other intangible assets, net
|
$ | 39,118 | $ | (31,641 | ) | $ | 7,477 | $ | 39,118 | $ | (27,080 | ) | $ | 12,038 | |||||||||||
All of our other intangible assets have finite lives and, as such, are subject to amortization. Amortization expense for other intangible assets was $4.6 million for fiscal 2010, $5.0 million for fiscal 2009 and $4.2 million for fiscal 2008, all of which is related to Continuing Operations. As of September 30, 2010, we expect to recognize the following amortization expense on other intangible assets over the next five years:
54
|
(in thousands)
|
Future
expense
|
|||
|
Years ending September 30,
|
||||
|
2011
|
$ | 3,434 | ||
|
2012
|
2,940 | |||
|
2013
|
587 | |||
|
2014
|
134 | |||
|
2015
|
100 | |||
|
Thereafter
|
282 | |||
|
Total future amortization expense
|
$ | 7,477 | ||
|
NOTE 8—INCOME TAXES
|
Significant components of the provision for income taxes are as follows:
|
Continuing Operations
|
Discontinued Operations
|
|||||||||||||||||||||||
|
Year ended September 30,
|
Year ended September 30,
|
|||||||||||||||||||||||
|
(in thousands)
|
2010
|
2009
|
2008
|
2010
|
2009
|
2008
|
||||||||||||||||||
|
Current income tax provision:
|
||||||||||||||||||||||||
|
State
|
$ | 30 | $ | 40 | $ | 87 | $ | — | $ | — | $ | — | ||||||||||||
|
Federal
|
— | — | — | — | — | — | ||||||||||||||||||
|
Total provision for income taxes
|
$ | 30 | $ | 40 | $ | 87 | $ | — | $ | — | $ | — | ||||||||||||
The effective tax rate differs from the applicable U.S. statutory federal income tax rate as follows:
|
Year ended September 30,
|
||||||||||||
|
2010
|
2009
|
2008
|
||||||||||
|
U.S. statutory federal tax rate
|
34.0 | % | 34.0 | % | 34.0 | % | ||||||
|
State taxes, net of federal tax benefit
|
4.4 | % | 2.9 | % | 4.1 | % | ||||||
|
Tax exempt interest income
|
— | — | 0.1 | % | ||||||||
|
Non-deductible expenses
|
(0.7 | )% | (0.7 | )% | (0.6 | )% | ||||||
|
Valuation allowance
|
(34.7 | )% | (32.9 | )% | (34.1 | )% | ||||||
|
Stock-based compensation
|
(3.7 | )% | (4.8 | )% | (3.6 | )% | ||||||
|
Other
|
— | 0.8 | % | (0.6 | )% | |||||||
|
Effective tax rate
|
(0.7 | )% | (0.7 | )% | (0.7 | )% | ||||||
Deferred income taxes reflect the tax effect of temporary differences between the carrying amount of assets and liabilities for financial reporting purposes and the amounts used for income tax purposes. The components of deferred income tax assets and liabilities are as follows:
55
|
September 30,
|
||||||||
|
(in thousands)
|
2010
|
2009
|
||||||
|
Deferred tax assets:
|
||||||||
|
Accrued expenses
|
$ | 1,645 | $ | 1,224 | ||||
|
Accounts receivable allowance
|
407 | 13 | ||||||
|
Intangibles
|
1,016 | 4,129 | ||||||
|
Other deferred tax assets
|
1,699 | 1,030 | ||||||
|
Net operating loss carryforward
|
42,515 | 38,111 | ||||||
|
Valuation allowance
|
(44,980 | ) | (43,763 | ) | ||||
|
Total deferred tax assets
|
2,302 | 744 | ||||||
|
Deferred tax liabilities:
|
||||||||
|
Investment in subsidiary
|
286 | 286 | ||||||
|
Depreciation
|
159 | 132 | ||||||
|
Other deferred tax liabilities
|
1,857 | 326 | ||||||
|
Total deferred tax liabilities
|
2,302 | 744 | ||||||
|
Net deferred tax assets (liabilities)
|
$ | — | $ | — | ||||
At September 30, 2010, we had $111.3 million of federal net operating loss carryforwards, which begin to expire in fiscal 2018 through 2030. At September 30, 2010, we had $94.7 million of state net operating loss carryforwards, most of which begin to expire after fiscal 2017 through 2025.
Deferred tax assets are reduced by a valuation allowance when, in the opinion of management, it is more likely than not that some portion or all of the deferred tax assets will not be realized. In evaluating our ability to realize deferred tax assets, we considered all available positive and negative evidence. As of September 30, 2010, we maintained a full valuation allowance against the net deferred tax assets due to the uncertainty regarding utilization. As of September 30, 2010, a total of $20.3 million of the valuation allowance related to deferred tax assets for which any subsequently recognized tax benefits would be subject to FASB ASC 805, therefore adjustments to the valuation allowances will be recorded as a component of income tax expense, and $3.0 million of the valuation allowance related to deferred tax assets for which any subsequent recognized tax benefits would increase common stock.
We have completed a detailed study regarding the application of Section 382 of the Internal Revenue Code of 1986 (Section 382) which imposes an annual limitation on the utilization of net operating loss carryforwards following an ownership change. Application of the findings of this study resulted in a limitation of net operating loss carryforward amounts. Of the $111.3 million of federal net operating loss carryforward and $94.7 million on the state net operating loss carryforward, $48.6 million and $28.1 million, respectively, were acquired with the purchase of Official Payments Corporation in 2002. Our ability to realize the acquired federal net operating loss carryforward is limited to $3,350,000 per year pursuant to Internal Revenue Code Section 382. The balance of our federal net operating loss carryforwards, is currently limited to $5,993,000 per annum pursuant to Internal Revenue Code Section 382.
LIABILITIES FOR UNRECOGNIZED TAX BENEFITS
We have examined our current and past tax positions taken, and have concluded that it is more-likely-than-not these tax positions will be sustained in the event of an examination and that there would be no material impact to our effective tax rate. In the event interest or penalties had been accrued, our policy is to include these amounts related to unrecognized tax benefits in income tax expense. As of September 30, 2010, we had no accrued interest or penalties related to uncertain tax positions. Our audit with the IRS for tax year ended September 30, 2005, concluded with no interest or penalties imposed. We file tax returns with the IRS and in various states in which the statute of limitations may go back to the tax year ended September 30, 2005. As of September 30, 2010, we were not engaged in any federal or state tax audits.
As of September 30, 2010 and 2009, we had no unrecognized tax benefits.
56
|
NOTE 9— COMMITMENTS AND CONTINGENCIES
|
LEGAL ISSUES
From time to time during the normal course of business, we are a party to litigation and/or other claims. At September 30, 2010, none of these matters was expected to have a material impact on our financial position, results of operations or cash flows. At September 30, 2010 and September 30, 2009, we had legal accruals of $1.0 million and $0.2 million, respectively, based upon estimates of key legal matters.
BANK LINES OF CREDIT
At September 30, 2010, we had a letter of credit facility that allowed us to obtain letters of credit up to a total of $5.0 million. This letter of credit facility, which is scheduled to mature on January 31, 2011, grants the lender a perfected security interest in cash collateral in an amount equal to all issued and to be issued letters of credit. We pay 0.75% per annum for outstanding letters of credit, but are not assessed any fees for the unused portion of the line. This letter of credit facility prohibits us from declaring dividends. As of September 30, 2010, $1.3 million of letters of credit were outstanding under this letter of credit facility. These letters of credit were issued to secure a performance bond.
SETTLEMENTS PAYABLE
Settlements payable on our Consolidated Balance Sheets consists of payments due primarily to utility companies and other public sector clients. As individuals and businesses settle their obligations to our various clients, we generate a receivable from the credit or debit card company and a payable to the client. Once we receive confirmation the funds have been received by the card company, we settle the liabilities to the client. This process may take several business days to complete and can result in unsettled funds at the end of a reporting period. We had $10.7 million and $13.9 million, respectively, of settlements payable at September 30, 2010 and September 30, 2009.
CREDIT RISK
We maintain our cash in bank deposit accounts, certificates of deposit and money market accounts. Typically, the balance in a number of these accounts significantly exceeds federally insured limits. We have not experienced any losses in such accounts and believe that any associated credit risk is de minimis. At September 30, 2010, our investment portfolio is comprised of U.S. Treasury bills, certificates of deposit and U.S. government agency discount notes. Our investment portfolio and cash and cash equivalents approximate fair value.
PERFORMANCE, BID AND GUARANTEE PAYMENT BONDS
Pursuant to the terms of money transmitter licenses we obtain with individual states, we are required to provide guarantee payment bonds from a licensed surety. At September 30, 2010, we had $10.6 million of bonds posted with 45 jurisdictions. There were no claims pending against any of these bonds.
Under certain contracts or bids, we are required to obtain performance or bid bonds from a licensed surety and to post the bonds with our customers. Fees for obtaining the bonds are expensed over the life of each bond. At September 30, 2010, we had $7.5 million of performance bonds posted with clients. There were no claims pending against any of these bonds.
In February 2009, we completed the sale of our Unemployment Insurance, or UI, business to RKV Technologies, Inc., or RKV. The sale was completed pursuant to an Asset Purchase Agreement dated February 6, 2009. As part of the agreement, we are required to leave in place a $2.4 million performance bond on the continuing contract with the State of Indiana, or the State. Subsequent to the sale of the UI business to RKV, the prime contractor, Haverstick Corporation, or Haverstick, the State, and RKV determined that contract completion would be delayed and additional funding needed to complete the contract. In November 2009 Haverstick cancelled its contract with RKV and directly rehired various RKV resources and RKV contractors. We retain certain liabilities for completion of the project and continue as the indemnitor under the performance bond. Mediation is expected to take place by September 2011 to discuss the
57
costs of project completion. We do not believe resolution of this matter will have a material effect on our financial position or results of operations.
EMPLOYMENT AGREEMENTS
As of September 30, 2010, we had employment and change of control agreements with four executives and one other key manager. If certain termination or change of control events were to occur under the five contracts as of September 30, 2010, we could be required to pay up to $3.9 million. In addition, pursuant to the terms of our employment contract with our current CEO, we could be required to pay up to $0.1 million relating to relocation expenses and legal fees in association with the review and negotiation of the employment contract.
In June 2010, we accrued $1.2 million of severance expense associated with the departure on June 23, 2010 of our former CEO, in accordance with the Employment Agreement signed on April 30, 2008. Pursuant to the terms of the employment agreement, the severance, and any additional agreed upon payments, will be paid after receipt of a Separation Agreement and Release executed by the former executive. This accrual is included in Accrued compensation liabilities on our Consolidated Balance Sheets.
In August 2010, we accrued $0.3 million of severance expense associated with the departure on August 17, 2010, of our former COO, in accordance with the Employment Agreement signed on October 1, 2008 and the Severance Agreement and Release of Claims dated August 17, 2010. Pursuant to the terms of the employment agreement and Internal Revenue Service Code Section 409A, the severance will be paid on February 18, 2011. This accrual is included in Accrued compensation liabilities on our Consolidated Balance Sheets.
In December 2008, the Compensation Committee of our Board of Directors adopted the Tier Technologies, Inc. Executive Performance Stock Unit Plan, or the PSU Plan. Executives selected by our chief executive officer are eligible to participate. Under the PSU Plan, up to 800,000 Performance Stock Units, or PSUs, have been approved for issuance. As of September 30, 2010, 425,000 PSUs have been issued to key executives. During the three months ended September 30, 2010, 180,000 PSUs were cancelled as a result of the departure of a former executive. The PSUs will be awarded upon the achievement and maintenance for a period of 60 days of specific share performance targets of $8.00, $9.50, $11.00, and $13.00 per share. We intend to pay the PSUs in cash in the pay period in which the PSUs become fully vested. The PSUs are considered liability awards under US GAAP. As such, their expense is calculated quarterly based on fair market value on the last day of the quarterly period. Since we cannot estimate the fair market value of future dates, we are unable to estimate the expense that will be recognized over the remaining life of these PSUs. See Note 13—Share-based Payment for additional information regarding the valuation of the PSUs.
Pursuant to compensation decisions made in April 2008 and January 2009, and subject to the terms of our former chief executive officer’s Enterprise Value Award Plan and related documents, our former CEO may receive 200,000 restricted stock units, or RSUs, which may be payable in cash. Pursuant to the former CEO’s employment agreement, these RSUs remain ungranted and are subject to award in the circumstances described in the Enterprise Value Award Plan and related documents. These RSUs are considered liability awards, and as such their expense is calculated quarterly based on fair market value on the last day of the quarterly period. Since we cannot estimate the fair market value of future dates, we are unable to estimate the expense that will be recognized over the remaining life of these RSUs. See Note 13—Share-based Payment for additional information regarding the valuation of these RSUs.
OPERATING AND CAPITAL LEASE OBLIGATIONS
We lease our principal facilities and certain equipment under non-cancelable operating and capital leases, which expire at various dates through fiscal year 2018. Future minimum lease payments for non-cancelable leases with terms of one year or more as of September 30, 2010 are as follows:
58
|
(in thousands)
|
Operating leases
|
Capital
Leases (1)(2)
|
Total
|
|||||||||
|
Twelve months ending September 30,
|
||||||||||||
|
2011
|
$ | 474 | $ | 31 | $ | 505 | ||||||
|
2012
|
798 | 30 | 828 | |||||||||
|
2013
|
804 | 17 | 821 | |||||||||
|
2014
|
826 | — | 826 | |||||||||
|
2015
|
805 | — | 805 | |||||||||
|
Thereafter
|
1,880 | — | 1,880 | |||||||||
|
Total minimum lease payments
|
$ | 5,587 | $ | 78 | $ | 5,665 | ||||||
|
(1) On our Consolidated Balance Sheets, the amount due within twelve months is included in Other accrued liabilities. The remainder is included in Other liabilities.
(2) Total amount includes interest payments of $1.
|
||||||||||||
In addition to fixed rentals, certain leases contain provisions for rental options and rent escalations based on scheduled increases, as well as increases resulting from a rise in certain costs incurred by the lessor. Rent expense under these agreements was approximately $1.1 million during fiscal 2010, $1.1 million during fiscal 2009 and $1.9 million during fiscal 2008.
INDEMNIFICATION AGREEMENTS
Our Certificate of Incorporation obligates us to indemnify our directors and officers against all expenses, judgments, fines and amounts paid in settlement for which such persons become liable as a result of acting in any capacity on behalf of Tier, if the director or officer met the standard of conduct specified in the Certificate, and subject to the limitations specified in the Certificate. In addition, we have indemnification agreements with certain of our directors and officers, which supplement the indemnification obligations in our Certificate. These agreements generally obligate us to indemnify the indemnitees against expenses incurred because of their status as a director or officer, if the indemnitee met the standard of conduct specified in the agreement, and subject to the limitations specified in the agreement.
|
NOTE 10—RELATED PARTY TRANSACTIONS
|
ITC DELTACOM, INC.
During the fiscal year ended September 30, 2010, 2009 and 2008, we purchased $0.2 million, $0.2 million and $0.6 million, respectively, of telecom services from ITC Deltacom, Inc., a company affiliated with a member of our Board of Directors.
GIANT INVESTMENT, LLC
During the quarter ended March 31, 2010, we entered into an agreement with certain entities affiliated with Giant Investment, LLC, a stockholder affiliated with a member of our Board of Directors, regarding our 2010 annual meeting of stockholders and other matters. We also reimbursed Giant and its affiliates $48,000 for legal expenses incurred by it related to our 2009 annual meeting.
AGREEMENT WITH DISCOVERY EQUITY PARTNERS, L.P.
In February 2010 we signed an agreement with two entities affiliated with two members of our board who did not stand for re-election at our 2010 annual meeting of stockholders, Discovery Equity Partners, L.P. and Discovery Group I, LLC, which we refer to as Discovery, with respect to our 2010 annual meeting of stockholders and other matters. The agreement provided, among other things, for Tier to reimburse Discovery $175,000 for expenses related to its costs associated with our 2009 annual meeting of stockholders. This payment, due to Discovery within five days of our 2010 annual meeting of stockholders, which occurred on April 8, 2010, was made on April 13, 2010. We also agreed to pay $55,000 in legal expenses on behalf of Discovery. In addition, pursuant to this agreement we accelerated the vesting of restricted stock units awarded to those two board members, effective on March 20, 2012. See Note 13—Share-based Payment for additional information regarding the valuation of these RSUs.
59
EDGAR, DUNN & COMPANY
During the fiscal year ended September 30, 2009 and 2008, we purchased $0.2 million and $0.3 million, respectively, of consultancy services relating to our EPS operations from Edgar, Dunn & Company, a company affiliated with a member of our Board of Directors.
|
NOTE 11—SEGMENT INFORMATION
|
Our business consists of three reportable segments: Electronic Payment Solutions, or EPS, Wind-down and Discontinued operations. Our Discontinued operations include businesses within our former GBPO and PSSI operations that have been sold. Information regarding our Discontinued Operations can be found in Note 14—Discontinued Operations.
The following table presents the results of operations for our Continuing Operations which consist of, EPS and Wind-down for fiscal years ended September 30, 2010, 2009, and 2008.
|
(in thousands)
|
EPS
|
Wind-
down
|
Total
|
|||||||||
|
Fiscal year ended September 30, 2010:
|
||||||||||||
|
Revenues
|
$ | 127,223 | $ | 3,001 | $ | 130,224 | ||||||
|
Costs and expenses:
|
||||||||||||
|
Direct costs
|
97,050 | 1,278 | 98,328 | |||||||||
|
General and administrative
|
24,821 | 378 | 25,199 | |||||||||
|
Selling and marketing
|
6,355 | — | 6,355 | |||||||||
|
Depreciation and amortization
|
5,625 | 1,086 | 6,711 | |||||||||
|
Total costs and expenses
|
133,851 | 2,742 | 136,593 | |||||||||
|
(Loss) income from continuing operations before
other income and income taxes
|
(6,628 | ) | 259 | (6,369 | ) | |||||||
|
Other income:
|
||||||||||||
|
Interest income (expense)
|
414 | — | 414 | |||||||||
|
Gain on investment
|
31 | — | 31 | |||||||||
|
Gain on sale of asset
|
6 | — | 6 | |||||||||
|
Total other income
|
451 | — | 451 | |||||||||
|
(Loss) income from continuing operations before taxes
|
(6,177 | ) | 259 | (5,918 | ) | |||||||
|
Income tax provision
|
30 | — | 30 | |||||||||
|
(Loss) income from continuing operations
|
$ | (6,207 | ) | $ | 259 | $ | (5,948 | ) | ||||
60
|
(in thousands)
|
EPS
|
Wind-
down
|
Total
|
|||||||||
|
Fiscal year ended September 30, 2009:
|
||||||||||||
|
Revenues
|
$ | 123,233 | $ | 5,013 | $ | 128,246 | ||||||
|
Costs and expenses:
|
||||||||||||
|
Direct costs
|
93,434 | 2,160 | 95,594 | |||||||||
|
General and administrative
|
24,509 | 1,020 | 25,529 | |||||||||
|
Selling and marketing
|
6,697 | 11 | 6,708 | |||||||||
|
Depreciation and amortization
|
4,885 | 1,684 | 6,569 | |||||||||
|
Total costs and expenses
|
129,525 | 4,875 | 134,400 | |||||||||
|
(Loss) income from continuing operations before
other income and income taxes
|
(6,292 | ) | 138 | (6,154 | ) | |||||||
|
Other income (expense):
|
||||||||||||
|
Interest income (expense)
|
754 | — | 754 | |||||||||
|
Loss on investment
|
(31 | ) | — | (31 | ) | |||||||
|
Total other income
|
723 | — | 723 | |||||||||
|
(Loss) income from continuing operations before taxes
|
(5,569 | ) | 138 | (5,431 | ) | |||||||
|
Income tax provision
|
40 | — | 40 | |||||||||
|
(Loss) income from continuing operations
|
$ | (5,609 | ) | $ | 138 | $ | (5,471 | ) | ||||
|
(in thousands)
|
EPS
|
Wind-
down
|
Total
|
|||||||||
|
Fiscal year ended September 30, 2008:
|
||||||||||||
|
Revenues
|
$ | 116,641 | $ | 5,930 | $ | 122,571 | ||||||
|
Costs and expenses:
|
||||||||||||
|
Direct costs
|
91,290 | 3,944 | 95,234 | |||||||||
|
General and administrative
|
26,932 | 1,088 | 28,020 | |||||||||
|
Selling and marketing
|
8,486 | 191 | 8,677 | |||||||||
|
Depreciation and amortization
|
3,900 | 1,428 | 5,328 | |||||||||
|
Total costs and expenses
|
130,608 | 6,651 | 137,259 | |||||||||
|
Loss from continuing operations before
other income and income taxes
|
(13,967 | ) | (721 | ) | (14,688 | ) | ||||||
|
Other income (expense):
|
||||||||||||
|
Interest income (expense)
|
2,733 | (2 | ) | 2,731 | ||||||||
|
Total other income (expense)
|
2,733 | (2 | ) | 2,731 | ||||||||
|
Loss from continuing operations before taxes
|
(11,234 | ) | (723 | ) | (11,957 | ) | ||||||
|
Income tax provision
|
87 | — | 87 | |||||||||
|
Loss from continuing operations
|
$ | (11,321 | ) | $ | (723 | ) | $ | (12,044 | ) | |||
Our total assets for each of these businesses are shown in the following table:
61
|
As of September 30,
|
||||||||
|
(in thousands)
|
2010
|
2009
|
||||||
|
Continuing Operations:
|
||||||||
|
EPS
|
$ | 112,368 | $ | 117,920 | ||||
|
Wind-down
|
657 | 2,627 | ||||||
|
Total assets
|
$ | 113,025 | $ | 120,547 | ||||
|
Expenditures for long-lived assets
|
$ | 6,254 | $ | 5,724 | ||||
|
NOTE 12—SHAREHOLDERS’ EQUITY
|
As of September 30, 2010, a total of 44,259,762 shares of $0.01 par value common stock were authorized, of which 18,170,054 shares were outstanding, and a total of 4,579,047 shares of preferred stock were authorized, of which none were outstanding. Under our current letter of credit facility, we are prohibited from declaring or paying any dividends (see Note 9—Commitments and Contingencies).
COMMON STOCK REPURCHASE PROGRAM
In January 2009, our Board of Directors, or the Board, authorized the repurchase of up to $15.0 million of our common stock in the open market. On August 13, 2009, our Board increased the repurchase amount to $20.0 million. Through September 30, 2010, we purchased 1,651,898 shares of common stock for $12.3 million under this repurchase program. We also participated in a previous repurchase program authorized by our Board in October 2003 in which we purchased 884,400 shares of common stock for $8.7 million. As of September 30, 2010, we have repurchased 2,536,298 shares of common stock for $21.0 million under the two plans, which are reported as Treasury stock on our Consolidated Balance Sheets.
EQUITY INCENTIVE PLAN
Under our Amended and Restated 2004 Stock Incentive Plan, options for 2,953,081 shares of common stock were outstanding at September 30, 2010. Of those shares, 500,000 are restricted stock units which vest when both the price target is achieved and the required service period is met.
|
NOTE 13—SHARE-BASED PAYMENT
|
Stock options are issued under the Amended and Restated 2004 Stock Incentive Plan, or the Plan. The Plan provides our Board of Directors discretion in creating employee equity incentives, including incentive and non-statutory stock options. Generally, these options vest as to 20% of the underlying shares each year on the anniversary of the date granted and expire in ten years. At September 30, 2010, there were 1,240,036 shares of common stock reserved for future grants under the Plan.
STOCK OPTIONS
Stock-based compensation expense for all option awards granted was based on the grant-date fair value using the Black-Scholes model. We recognize compensation expense for stock option awards on a ratable basis over the requisite service period of the award. Stock-based compensation expense was $0.9 million for fiscal 2010, $1.0 million for fiscal 2009 and $2.1 million for fiscal 2008.
The following table shows the weighted-average assumptions we used to calculate fair value of share-based options using the Black-Scholes model, as well as the weighted-average fair value of options granted and the weighted-average intrinsic value of options exercised.
62
|
September 30,
|
||||||||||||
|
2010
|
2009
|
2008
|
||||||||||
|
Weighted-average assumptions used in Black-Scholes model:
|
||||||||||||
|
Expected period that options will be outstanding (in years)
|
5.00 | 5.00 | 5.00 | |||||||||
|
Interest rate (based on U.S. Treasury yields at time of grant)
|
1.40 | % | 2.02 | % | 3.52 | % | ||||||
|
Volatility
|
45.50 | % | 45.60 | % | 42.87 | % | ||||||
|
Dividend yield
|
— | — | — | |||||||||
|
Weighted-average fair value of options granted
|
$ | 2.08 | $ | 2.14 | $ | 3.98 | ||||||
|
Weighted-average intrinsic value of options exercised (in thousands)
|
$ | 24 | $ | 81 | $ | 251 | ||||||
Expected volatilities are based on historical volatility of our stock. In addition, we used historical data to estimate option exercise and employee termination within the valuation model.
Stock option activity for the fiscal year ended September 30, 2010 is as follows:
|
Weighted-average
|
|||||||||||||
|
(in thousands, except price and years)
|
Shares under option
|
Exercise price
|
Remaining contractual term
|
Aggregate intrinsic value
|
|||||||||
|
Options outstanding at October 1, 2009
|
2,359 | $ | 7.86 | ||||||||||
|
Granted
|
400 | 5.06 | |||||||||||
|
Exercised
|
(19 | ) | 4.25 | ||||||||||
|
Forfeitures or expirations
|
(287 | ) | 7.84 | ||||||||||
|
Options outstanding at
September 30, 2010
|
2,453 | $ | 7.43 |
7.15 years
|
$ | 508 | |||||||
|
Options vested and expected to vest at September 30, 2010
|
2,074 | $ | 7.50 |
6.27 years
|
$ | 388 | |||||||
|
Options exercisable at
September 30, 2010
|
1,338 | $ | 7.89 |
6.08 years
|
$ | 144 | |||||||
As of September 30, 2010, a total of $2.0 million of unrecognized compensation cost related to stock options, including estimated forfeitures, was expected to be recognized over a 3.3 year weighted-average period.
RESTRICTED STOCK UNITS
In April 2008, we granted 550,000 Restricted Stock Units, or RSUs, which vest when both the price target is achieved and the required service period is met. In January 2009 we granted another 150,000 RSUs which vest when both the price target is achieved and the required service period is met. Under the Plan, the maximum number of shares that can be issued to settle the RSUs is 500,000. If more than 500,000 RSUs vest, we intend to pay those RSUs in cash. As such, pursuant to the Plan, 500,000 shares, with target prices of $8.00, $11.00, and $13.00 can be payable in shares of our common stock. The remaining 200,000 shares, with target prices of $13.00 and $15.00, may be payable in cash. We used a Monte Carlo simulation option pricing model to estimate the grant-date fair value using the following assumptions:
|
September 30, 2010
|
||||||||
|
Payable in shares
|
Payable in cash
|
|||||||
|
Weighted-average assumptions used in Monte Carlo simulation:
|
||||||||
|
Original period over which units vest (in years)
|
3.00 | 3.00 | ||||||
|
Remaining period that units will be outstanding (in years)
|
0.58 | 0.58 | ||||||
|
Interest rate (based on U.S. Treasury yield)
|
1.98 | % | 0.20 | % | ||||
|
Volatility
|
39.53 | % | 46.84 | % | ||||
|
Dividend yield
|
— | — | ||||||
|
Weighted-average fair value of options granted
|
$ | 3.50 | $ | — | ||||
The following table provides information on the expense related to the restricted stock unit awards:
63
|
(in thousands)
|
Equity Award
|
Liability Award
|
||||||
|
Expense recognized for fiscal year ended September 30, 2010
|
$ | 622 | $ | (195 | ) | |||
|
Expense recognized through September 30, 2010
|
$ | 1,388 | $ | 1 | ||||
|
Estimated expense to be recognized through April 2011*
|
$ | 363 |
(a)
|
|||||
|
* The CEO departed on June 23, 2010. Pursuant to the terms of his employment agreement, these RSUs remain ungranted and are subject to award in the circumstances described in the Enterprise Value Award Plan and related documents.
a. Liability awards are revalued at the end of every quarter based on the closing price of our stock on the last day of the quarter and other assumptions noted above as used in the Monte Carlo simulation. We are unable to estimate the expense expected to be recognized for these awards.
|
BOARD OF DIRECTOR RESTRICTED STOCK UNITS
In accordance with our Board compensation package, our non-employee Board members are awarded 9,000 restricted stock units upon their election to our Board at our annual meeting. The following awards have been made:
|
Total restricted stock
units awarded
|
Vesting date
|
||||
|
2009 annual meeting
|
72,000 |
March 20, 2012
|
|||
|
2010 annual meeting
|
54,000 |
May 11, 2011
|
|||
The amount payable to each member at the vesting date will be the equivalent of 9,000 restricted stock units multiplied by the closing price of our stock on the vesting date. During February 2010 we entered into an agreement in which two of our board members not standing for re-election at our 2010 annual meeting of stockholders were each entitled to the accelerated vesting on April 8, 2010 of the restricted stock units that they were awarded in March 2009. During fiscal year 2010 we recognized $0.1 million in expenses related to this acceleration.
The following table provides information on the expense related to the restricted stock unit awards to the Board of Directors:
|
(in thousands)
|
2010 annual meeting
|
2009 annual meeting
|
||||||
|
Expense recognized for fiscal year ended September 30, 2010
|
$ | 125 | $ | 187 | (a) | |||
|
Expense recognized through September 30, 2010
|
$ | 125 | $ | 289 | (a) | |||
|
Estimated expense to be recognized through vesting date
|
(b)
|
(b)
|
||||||
|
a. This amount includes the $0.1 million recognized related to the acceleration for the two board members not standing for re-election at our 2010 annual meeting.
b. Liability awards are revalued at the end of every quarter based on the closing price of our stock on the last day of the quarter. We are unable to estimate the expense expected to be recognized for these awards.
|
PERFORMANCE STOCK UNITS
In December 2008, the Compensation Committee of our Board of Directors adopted the Tier Technologies, Inc. Executive Performance Stock Unit Plan, or the PSU Plan. Executives selected by our Chief Executive Officer are eligible to participate. Under the PSU Plan, up to 800,000 Performance Stock Units, or PSUs, have been approved for issuance. The PSUs will be awarded upon the achievement and maintenance for a period of 60 days of specific share performance targets of $8.00, $9.50, $11.00, and $13.00 per share. We intend to pay the PSUs in cash in the pay period in which the PSUs become fully vested. The executives will receive a cash payment equal to (x) the price of a share of our common stock as of the close of market on the date of vesting, but not more than $15.00, multiplied by (y) the number of PSUs that have been awarded to the executive.
As of September 30, 2010, 425,000 PSUs have been issued under the PSU Plan. During the three months ended September 30, 2010, 180,000 PSUs were cancelled as a result of the departure of a former executive. As of September 30, 2010, these shares are recorded at their fair value of $0.1 million, as Other liabilities on
64
our Consolidated Balance Sheets. We used a Monte Carlo simulation option pricing model to estimate the grant-date fair value using the following assumptions:
|
Payable in cash
|
||||
|
Weighted-average assumptions used in Monte Carlo simulation:
|
||||
|
Original period over which units vest (in years)
|
3.00 | |||
|
Expected period that units will be outstanding (in years)
|
1.18 | |||
|
Interest rate (based on U.S. Treasury yield)
|
0.30 | % | ||
|
Volatility
|
38.13 | % | ||
|
Dividend yield
|
— | |||
|
Weighted-average fair value of options granted
|
$ | 0.55 | ||
The following table provides information on the expense related to the performance stock unit awards:
|
(in thousands)
|
Liability Award
|
|||
|
Expense recognized for fiscal year ended September 30, 2010
|
$ | (613 | ) | |
|
Expense recognized through September 30, 2010
|
$ | 134 | ||
|
Estimated expense to be recognized through December 2011
|
(a)
|
|||
|
(a) Liability awards are revalued at the end of every quarter based on the closing price of our stock on the last day of the quarter and other assumptions noted above as used in the Monte Carlo simulation. We are unable to estimate the expense expected to be recognized for these awards.
|
|
NOTE 14—DISCONTINUED OPERATIONS
|
DIVESTITURES
On November 30, 2008, we completed the sale of the assets, operations and certain liabilities of our Financial Management Systems, or FMS, business. The sale was completed pursuant to an Asset Purchase Agreement dated November 4, 2008 for a purchase price of $0.8 million, subject to a working capital adjustment, of which $0.2 million was payable in cash and the remaining $0.6 million was secured with an interest bearing note payable over 18 months.
In February 2009, we completed the sale of our Unemployment Insurance, or UI, business. The sale was completed pursuant to an Asset Purchase Agreement dated February 6, 2009 for a purchase price of $1.5 million payable as follows, $1,050,000 due at closing, $300,000 due in July 2009, and $150,000 due upon assignment of three contracts. In addition, if the purchaser is awarded a named contract, the purchaser will pay Tier 5% of service related revenue. This sale completed our divestiture process.
Long-lived asset groups classified as held-for-sale are to be measured at the lower of their carrying value or fair value less cost to sell. As a result of our analysis, we determined operations within our former GBPO and PSSI operations had carrying values which exceeded their fair value. The following table shows the impairment expense recorded for fiscal years ended September 30, 2009 and 2008, which is included in (Loss)/ income from discontinued operations, net:
|
Year ended September 30,
|
||||||||
|
(in thousands)
|
2009
|
2008
|
||||||
|
Impairment expense
|
||||||||
|
Goodwill impairment
|
$ | — | $ | 8,790 | ||||
|
Long-lived asset impairment
|
2,594 | 8,974 | ||||||
|
Total impairment expense
|
$ | 2,594 | $ | 17,764 | ||||
65
SUMMARY OF REVENUE AND NET LOSS FROM DISCONTINUED OPERATIONS
Except for minor transitional activities, we do not have any ongoing involvement or cash flows from former GBPO and PSSI businesses that we divested during fiscal 2008 and fiscal 2009. During the quarter ended March 31, 2010, we received an earn-out payment of $0.6 million from the company that purchased our former GBPO business, pursuant to the Purchase and Sale Agreement dated June 9, 2008. We recorded this transaction as a gain on disposal of discontinued operations within our Consolidated Statements of Operations. We have an additional year of earn-out opportunity in our fiscal year 2011. During fiscal year 2010, we incurred $0.6 million of expense associated with our former PSSI operation, associated with legal fees and restructuring expense, as well as the write-off of a receivable we determined to be uncollectible. The following table summarizes our revenue, pre-tax loss, prior to any gain/(loss) on sale, and net loss from discontinued operations generated by these operations for the fiscal years ended September 30, 2010, 2009 and 2008.
|
Year ended September 30,
|
||||||||||||
|
(in thousands)
|
2010
|
2009
|
2008
|
|||||||||
|
Revenues (Discontinued Operations):
|
||||||||||||
|
GBPO
|
$ | — | $ | — | $ | 20,235 | ||||||
|
PSSI
|
— | 4,777 | 24,608 | |||||||||
|
Total revenues
|
$ | — | $ | 4,777 | $ | 44,843 | ||||||
|
(Loss) income from discontinued operations:
|
||||||||||||
|
GBPO
|
$ | — | $ | (59 | ) | $ | 6,448 | |||||
|
PSSI
|
(573 | ) | (4,511 | ) | (21,674 | ) | ||||||
|
Other/eliminations
|
— | — | 757 | |||||||||
|
Total (loss) income before taxes
|
$ | (573 | ) | $ | (4,570 | ) | $ | (14,469 | ) | |||
| Gain (loss) on disposal | ||||||||||||
|
GBPO
|
$ | 610 | $ | (22 | ) | $ | (1,028 | ) | ||||
|
PSSI
|
(282 | ) | (1,472 | ) | 85 | |||||||
|
Other/eliminations
|
— | 29 | 11 | |||||||||
|
Net loss from discontinued operations
|
$ | (245 | ) | $ | (6,035 | ) | $ | (15,401 | ) | |||
66
NOTE 15—LOSS PER SHARE
The following table sets forth the computation of basic and diluted loss per share:
|
Year ended September 30,
|
||||||||||||
|
(in thousands, except per share data)
|
2010
|
2009
|
2008
|
|||||||||
|
Numerator:
Loss from:
|
||||||||||||
|
Continuing operations, net of income taxes
|
$ | (5,948 | ) | $ | (5,471 | ) | $ | (12,044 | ) | |||
|
Discontinued operations, net of income taxes
|
(245 | ) | (6,035 | ) | (15,401 | ) | ||||||
|
Net loss
|
$ | (6,193 | ) | $ | (11,506 | ) | $ | (27,445 | ) | |||
|
Denominator:
|
||||||||||||
|
Weighted-average common shares outstanding
|
18,153 | 19,438 | 19,616 | |||||||||
|
Effects of dilutive common stock options
|
— | — | — | |||||||||
|
Adjusted weighted-average shares
|
18,153 | 19,438 | 19,616 | |||||||||
|
Loss per basic and diluted share
|
||||||||||||
|
From continuing operations
|
$ | (0.33 | ) | $ | (0.28 | ) | $ | (0.61 | ) | |||
|
From discontinued operations
|
$ | (0.01 | ) | $ | (0.31 | ) | $ | (0.79 | ) | |||
|
Loss per basic and diluted share
|
$ | (0.34 | ) | $ | (0.59 | ) | $ | (1.40 | ) | |||
The following options were not included in the computation of diluted loss per share because the exercise price was greater than the average market price of our common stock for the periods stated and, therefore, the effect would be anti-dilutive:
|
Year ended September 30,
|
||||||||||||
|
(in thousands)
|
2010
|
2009
|
2008
|
|||||||||
|
Weighted-average options excluded from computation of diluted loss per share
|
1,274 | 1,422 | 1,709 | |||||||||
Due to net losses from Continuing operations, we have excluded an additional 204,292 shares at September 30, 2010, 425,556 shares at September 30, 2009 and 234,270 shares at September 30, 2008, of common stock equivalents from the calculation of diluted loss per share since their effect would have been anti-dilutive. We have also excluded 500,000 shares of restricted stock from the computation of diluted loss per share since their effect would have been anti-dilutive.
|
NOTE 16—ACQUISITION
|
In January 2009, we completed the acquisition of substantially all of the assets of ChoicePay, Inc. for $7.5 million in cash. Per the terms of the acquisition agreement, ChoicePay, Inc. is entitled to a potential earn-out through December 31, 2013, based upon a percentage of the profitability of future defined new client business, not to exceed $2.0 million. As of September 30, 2010, we have paid ChoicePay $0.1 million for this earn-out.
67
The following table summarizes the fair values of the assets acquired and liabilities assumed of ChoicePay, Inc. at the acquisition date:
|
(in thousands)
|
As of January 27, 2009
|
|||
|
Assets
|
||||
|
Cash and cash equivalents
|
$ | 4,552 | ||
|
Accounts receivable, net
|
248 | |||
|
Prepaid assets
|
140 | |||
|
Property, equipment and software, net
|
1,250 | |||
|
Other intangible assets, net
|
3,544 | |||
|
Total assets acquired
|
9,734 | |||
|
Liabilities
|
||||
|
Settlements payable
|
3,892 | |||
|
Other accrued liabilities
|
1,048 | |||
|
Total liabilities assumed
|
4,940 | |||
|
Net assets acquired
|
$ | 4,794 | ||
The unaudited pro forma financial information in the table below combines the historical results for Tier and the historical results for ChoicePay for the fiscal years ended September 30, 2009 and 2008, as if the acquisition took place at the beginning of the fiscal year. This pro forma information is provided for illustrative purposes only and does not purport to be indicative of the actual results that would have been achieved by the combined operations for the periods presented or that will be achieved by the combined operations in the future.
|
Year ended September 30,
|
||||||||
|
(in thousands, except per share data)
|
2009
|
2008
|
||||||
|
Revenues—continuing operations
|
$ | 130,472 | $ | 128,446 | ||||
|
Net loss—continuing operations
|
(7,034 | ) | (15,781 | ) | ||||
|
Net loss
|
(13,069 | ) | (31,182 | ) | ||||
|
Basic/diluted loss per share—continuing operations
|
$ | (0.36 | ) | $ | (0.80 | ) | ||
|
Basic/diluted loss per share
|
$ | (0.67 | ) | $ | (1.59 | ) | ||
|
NOTE 17—RESTRUCTURING
|
As part of our cost reduction initiatives, during fiscal 2009 we incurred restructuring liabilities of $1.4 million for severance and facility closing costs. Severance costs relate to combining certain operational functions within our EPS operations and the wind down of our VSA operations.
The following table summarizes restructuring liability charges we incurred relating to our Continuing operations during fiscal years 2009 and 2008. The restructuring liability charges are included in General and administrative on our Consolidated Statement of Operations.
|
Year ended September 30,
|
||||||||
|
(in thousands)
|
2009
|
2008
|
||||||
|
Office closure costs (net of sublease income)
|
$ | 630 | $ | 6 | ||||
|
Severance costs
|
778 | 845 | ||||||
|
Total restructuring liability charges
|
$ | 1,408 | $ | 851 | ||||
The following table summarizes restructuring liabilities associated with Continuing Operations for fiscal years 2010 and 2009:
68
|
(in thousands)
|
Severance
|
Facilities closures
|
Total
|
|||||||||
|
Balance at September 30, 2008
|
$ | 596 | $ | — | $ | 596 | ||||||
|
Additions
|
778 | 630 | 1,408 | |||||||||
|
Cash payments
|
(1,356 | ) | (394 | ) | (1,750 | ) | ||||||
|
Balance at September 30, 2009
|
18 | 236 | 254 | |||||||||
|
Additions/(reductions)
|
— | (21 | ) | (21 | ) | |||||||
|
Cash payments
|
(18 | ) | (215 | ) | (233 | ) | ||||||
|
Balance at September 30, 2010
|
$ | — | $ | — | $ | — | ||||||
At September 30, 2009 we had $0.3 million of restructuring liabilities associated with our Continuing operations which is included in Other current liabilities on our Consolidated Balance Sheets.
|
NOTE 18—SUBSEQUENT EVENTS
|
We have reviewed our business activities through November 22, 2010, the issue date of our financial statements, and do not have any subsequent events to report.
69
|
SELECTED QUARTERLY FINANCIAL DATA (UNAUDITED)
|
The following tables set forth certain unaudited consolidated quarterly statements of operations data for each of the eight fiscal quarters ended September 30, 2010. In our opinion, this information has been prepared on the same basis as the audited Consolidated Financial Statements contained herein. This information should be read in conjunction with our Consolidated Financial Statements and the notes thereto appearing elsewhere in this report. Our operating results for any one quarter are not necessarily indicative of results for any future period.
|
2010 fiscal quarters
|
2009 fiscal quarters
|
|||||||||||||||||||||||||||||||
|
(In thousands, except per share data)
|
Fourth
|
Third
|
Second
|
First
|
Fourth
|
Third
|
Second
|
First
|
||||||||||||||||||||||||
|
Consolidated statements of operations data:
|
||||||||||||||||||||||||||||||||
|
Revenues
|
$ | 27,335 | $ | 39,447 | $ | 30,674 | $ | 32,768 | $ | 25,685 | $ | 44,213 | $ | 28,608 | $ | 29,740 | ||||||||||||||||
|
Costs and expenses:
|
||||||||||||||||||||||||||||||||
|
Direct costs
|
21,089 | 30,611 | 22,536 | 24,092 | 19,038 | 33,367 | 20,771 | 22,418 | ||||||||||||||||||||||||
|
General and administrative
|
6,730 | 5,950 | 6,192 | 6,327 | 5,118 | 6,269 | 7,512 | 6,630 | ||||||||||||||||||||||||
|
Selling and marketing
|
1,920 | 1,396 | 1,438 | 1,601 | 1,244 | 2,236 | 1,912 | 1,316 | ||||||||||||||||||||||||
|
Depreciation and
amortization
|
1,798 | 1,670 | 1,635 | 1,608 | 1,628 | 1,858 | 1,624 | 1,459 | ||||||||||||||||||||||||
|
(Loss) income from continuing
operations
|
(4,202 | ) | (180 | ) | (1,127 | ) | (860 | ) | (1,343 | ) | 483 | (3,211 | ) | (2,083 | ) | |||||||||||||||||
|
Total other income
|
22 | 117 | 173 | 139 | 115 | 163 | 253 | 192 | ||||||||||||||||||||||||
|
(Loss) income from continuing operations before income taxes
|
(4,180 | ) | (63 | ) | (954 | ) | (721 | ) | (1,228 | ) | 646 | (2,958 | ) | (1,891 | ) | |||||||||||||||||
|
Income tax provision (benefit)
|
18 | 157 | (145 | ) | — | 37 | 1 | 1 | 1 | |||||||||||||||||||||||
|
(Loss) income from continuing
operations
|
(4,198 | ) | (220 | ) | (809 | ) | (721 | ) | (1,265 | ) | 645 | (2,959 | ) | (1,892 | ) | |||||||||||||||||
|
(Loss) income from discontinued operations, net
|
(306 | ) | (180 | ) | 295 | (54 | ) | 37 | (408 | ) | (2,402 | ) | (3,262 | ) | ||||||||||||||||||
|
Net (loss) income
|
$ | (4,504 | ) | $ | (400 | ) | $ | (514 | ) | $ | (775 | ) | $ | (1,228 | ) | $ | 237 | $ | (5,361 | ) | $ | (5,154 | ) | |||||||||
|
Weighted average shares issued and outstanding:
|
||||||||||||||||||||||||||||||||
|
Basic
|
18,153 | 18,151 | 18,151 | 18,156 | 19,438 | 19,458 | 19,711 | 19,735 | ||||||||||||||||||||||||
|
Diluted
|
18,153 | 18,151 | 18,151 | 18,156 | 19,438 | 19,597 | 19,711 | 19,735 | ||||||||||||||||||||||||
|
Performance ratios:
|
||||||||||||||||||||||||||||||||
|
Return on average assets
|
(3.85 | )% | (0.32 | )% | (0.42 | )% | (0.66 | )% | (1.00 | )% | 0.18 | % | (4.05 | )% | (3.78 | )% | ||||||||||||||||
|
Return on average shareholders'
equity
|
(5.05 | )% | (0.44 | )% | (0.56 | )% | (0.84 | )% | (1.27 | )% | 0.23 | % | (5.05 | )% | (4.68 | )% | ||||||||||||||||
|
Total ending equity to total
ending assets
|
77.18 | % | 75.30 | % | 72.13 | % | 77.58 | % | 79.66 | % | 78.89 | % | 79.87 | % | 80.54 | % | ||||||||||||||||
|
Total average equity to total average assets
|
76.21 | % | 73.68 | % | 74.76 | % | 76.62 | % | 79.25 | % | 79.38 | % | 80.21 | % | 80.77 | % | ||||||||||||||||
|
Per share of common stock data:
|
||||||||||||||||||||||||||||||||
|
(Loss) earnings per share—Basic & Diluted:
|
||||||||||||||||||||||||||||||||
|
Continuing operations(1)
|
$ | (0.23 | ) | $ | (0.01 | ) | $ | (0.04 | ) | $ | (0.04 | ) | $ | (0.06 | ) | $ | 0.03 | $ | (0.15 | ) | $ | (0.10 | ) | |||||||||
|
Discontinued operations(1)
|
$ | (0.02 | ) | $ | (0.01 | ) | $ | 0.01 | $ | 0.00 | $ | 0.00 | $ | (0.02 | ) | $ | (0.12 | ) | $ | (0.16 | ) | |||||||||||
|
(Loss) earnings per share—Basic & Diluted
|
$ | (0.25 | ) | $ | (0.02 | ) | $ | (0.03 | ) | $ | (0.04 | ) | $ | (0.06 | ) | $ | 0.01 | $ | (0.27 | ) | $ | (0.26 | ) | |||||||||
|
Book value per share
|
$ | 4.81 | $ | 5.03 | $ | 5.03 | $ | 5.04 | $ | 4.76 | $ | 5.18 | $ | 5.24 | $ | 5.53 | ||||||||||||||||
|
Average balance sheet data:
|
||||||||||||||||||||||||||||||||
|
Total assets
|
$ | 117,114 | $ | 123,894 | $ | 122,234 | $ | 117,055 | $ | 122,477 | $ | 129,077 | $ | 132,435 | $ | 136,397 | ||||||||||||||||
|
Total liabilities
|
$ | 27,861 | $ | 32,606 | $ | 30,851 | $ | 25,031 | $ | 25,409 | $ | 26,617 | $ | 26,205 | $ | 26,230 | ||||||||||||||||
|
Total shareholders' equity
|
$ | 89,253 | $ | 91,288 | $ | 91,383 | $ | 92,024 | $ | 97,068 | $ | 102,460 | $ | 106,230 | $ | 110,167 | ||||||||||||||||
|
Market price per share of common stock:
|
||||||||||||||||||||||||||||||||
|
High
|
$ | 6.90 | $ | 8.58 | $ | 8.32 | $ | 9.00 | $ | 8.90 | $ | 7.90 | $ | 6.39 | $ | 7.57 | ||||||||||||||||
|
Low
|
$ | 4.53 | $ | 5.99 | $ | 7.10 | $ | 7.43 | $ | 7.10 | $ | 4.35 | $ | 4.48 | $ | 3.41 | ||||||||||||||||
|
(1) The sum of quarterly per share amounts may not equal annual per share amounts as the quarterly calculations are based on varying number of shares of common stock.
|
||||||||||||||||||||||||||||||||
70
|
SCHEDULE II
|
|
VALUATION AND QUALIFYING ACCOUNTS
|
|
(in thousands)
|
Balance at beginning of period
|
Additions/ (reductions)
|
Write-offs
|
Balance at
end of period
|
||||||||||||
|
Year ended September 30, 2010:
|
||||||||||||||||
|
Allowance for receivables
|
$ | 388 | $ | 1,304 | $ | (622 | ) | $ | 1,070 | |||||||
|
Allowance for sales returns
|
131 | 529 | (613 | ) | 47 | |||||||||||
|
Deferred tax asset valuation allowance
|
43,763 | 1,217 | — | 44,980 | ||||||||||||
|
Year ended September 30, 2009:
|
||||||||||||||||
|
Allowance for receivables
|
$ | 346 | $ | 417 | $ | (375 | ) | $ | 388 | |||||||
|
Allowance for sales returns
|
95 | 374 | (338 | ) | 131 | |||||||||||
|
Deferred tax asset valuation allowance
|
36,698 | 7,065 | — | 43,763 | ||||||||||||
|
Year ended September 30, 2008:
|
||||||||||||||||
|
Allowance for receivables
|
$ | 1,195 | $ | (557 | ) | $ | (292 | ) | $ | 346 | ||||||
|
Allowance for sales returns
|
273 | 208 | (386 | ) | 95 | |||||||||||
|
Deferred tax asset valuation allowance
|
28,875 | 7,823 | — | 36,698 | ||||||||||||
|
Inventory allowance
|
75 | 390 | (465 | ) | — | |||||||||||
71
None.
EVALUATION OF DISCLOSURE CONTROLS AND PROCEDURES
Our management, with the participation of our Chief Executive Officer and Chief Financial Officer, evaluated the effectiveness of our disclosure controls and procedures (as defined in Rules 13a-15(e) and 15d-15(e) under the Exchange Act) as of September 30, 2010. The term “disclosure controls and procedures” means controls and other procedures that are designed to ensure that information required to be disclosed by a company in the reports that it files or submits under the Exchange Act is recorded, processed, summarized and reported, within the time periods specified in the SEC’s rules and forms. Disclosure controls and procedures include, without limitation, controls and procedures designed to ensure that such information is accumulated and communicated to the company’s management, including its principal executive and principal financial officers, as appropriate, to allow timely decisions regarding required disclosure. Management recognizes that any controls and procedures, no matter how well designed and operated, can provide only reasonable assurance of achieving their objectives and management necessarily applies its judgment in evaluating the cost-benefit relationship of possible controls and procedures. Based on the evaluation of our disclosure controls and procedures as of September 30, 2010, our Chief Executive Officer and our Chief Financial Officer concluded that as of that date, our disclosure controls and procedures were effective at the reasonable assurance level.
MANAGEMENT’S REPORT ON INTERNAL CONTROL OVER FINANCIAL REPORTING
Our management is responsible for establishing and maintaining adequate internal control over financial reporting for the company. Internal control over financial reporting is defined in Rule 13a-15(f) or 15d-15(f) promulgated under the Securities Exchange Act of 1934 as a process designed by, or under the supervision of, the company’s principal executive and principal financial officers and effected by the company’s board of directors, management and other personnel, to provide reasonable assurance regarding the reliability of financial reporting and the preparation of financial statements for external purposes in accordance with generally accepted accounting principles and includes those policies and procedures that:
|
·
|
pertain to the maintenance of records that in reasonable detail accurately and fairly reflect the transactions and dispositions of the assets of the company;
|
|
·
|
provide reasonable assurance that transactions are recorded as necessary to permit preparation of financial statements in accordance with generally accepted accounting principles, and that receipts and expenditures of the company are being made only in accordance with authorizations of management and directors of the company; and
|
|
·
|
provide reasonable assurance regarding prevention or timely detection of unauthorized acquisition, use or disposition of the company’s assets that could have a material effect on the financial statements.
|
Because of its inherent limitations, internal control over financial reporting may not prevent or detect misstatements. Projections of any evaluation of effectiveness to future periods are subject to the risk that controls may become inadequate because of changes in conditions, or that the degree of compliance with the policies or procedures may deteriorate.
Our management assessed the effectiveness of our internal control over financial reporting as of September 30, 2010. In making this assessment, our management used the criteria set forth by the Committee of Sponsoring Organizations of the Treadway Commission (COSO) in Internal Control—Integrated Framework.
Based on our assessment, management concluded that, as of September 30, 2010, our internal control over financial reporting is effective based on those criteria.
Our independent auditors have issued an audit report on our internal control over financial reporting. This report appears on page 73.
72
To the Board of Directors and Shareholders
Tier Technologies, Inc.
We have audited Tier Technologies Inc.’s internal control over financial reporting as of September 30, 2010, based on criteria established in Internal Control — Integrated Framework issued by the Committee of Sponsoring Organizations of the Treadway Commission. Tier Technologies Inc.’s management is responsible for maintaining effective internal control over financial reporting and for its assessment of the effectiveness of internal control over financial reporting included in the accompanying Management’s Report on Internal Control over Financial Reporting. Our responsibility is to express an opinion on the company's internal control over financial reporting based on our audit.
We conducted our audit in accordance with the standards of the Public Company Accounting Oversight Board (United States). Those standards require that we plan and perform the audit to obtain reasonable assurance about whether effective internal control over financial reporting was maintained in all material respects. Our audit included obtaining an understanding of internal control over financial reporting, assessing the risk that a material weakness exists, and testing and evaluating the design and operating effectiveness of internal control based on the assessed risk. Our audit also included performing such other procedures as we considered necessary in the circumstances. We believe that our audit provides a reasonable basis for our opinion.
A company's internal control over financial reporting is a process designed to provide reasonable assurance regarding the reliability of financial reporting and the preparation of financial statements for external purposes in accordance with generally accepted accounting principles. A company's internal control over financial reporting includes those policies and procedures that (a) pertain to the maintenance of records that, in reasonable detail, accurately and fairly reflect the transactions and dispositions of the assets of the company; (b) provide reasonable assurance that transactions are recorded as necessary to permit preparation of financial statements in accordance with generally accepted accounting principles, and that receipts and expenditures of the company are being made only in accordance with authorizations of management and directors of the company; and (c) provide reasonable assurance regarding prevention or timely detection of unauthorized acquisition, use, or disposition of the company's assets that could have a material effect on the financial statements.
Because of its inherent limitations, internal control over financial reporting may not prevent or detect misstatements. Also, projections of any evaluation of effectiveness to future periods are subject to the risk that controls may become inadequate because of changes in conditions, or that the degree of compliance with the policies or procedures may deteriorate.
In our opinion, Tier Technologies Inc. maintained, in all material respects, effective internal control over financial reporting as of September 30, 2010, based on criteria established in Internal Control — Integrated Framework issued by the Committee of Sponsoring Organizations of the Treadway Commission.
We have also audited, in accordance with the standards of the Public Company Accounting Oversight Board (United States), the consolidated balance sheets of Tier Technologies, Inc. and subsidiaries as of September 30, 2010 and 2009, and the related consolidated statements of operations, shareholders’ equity, comprehensive loss and cash flows for each of the three years in the period ended September 30, 2010 and our report dated November 22, 2010 expressed an unqualified opinion.
/s/ McGladrey & Pullen, LLP
Vienna, VA
November 22, 2010
73
CHANGES IN INTERNAL CONTROL OVER FINANCIAL REPORTING
There have been no changes in our internal control over financial reporting during the quarter ended September 30, 2010 that have materially affected, or are reasonably likely to materially affect, our internal control over financial reporting.
None.
A list of our executive officers and their biographical information appears in Part I of this report. Information about our Directors may be found under the caption Election of Directors in our Proxy Statement for our 2011 Annual Meeting of Stockholders, or the Proxy Statement. That information is incorporated herein by reference.
The information in the Proxy Statement set forth under the captions Audit Committee Financial Expert, Audit Committee and Section 16(a) Beneficial Ownership Reporting Compliance is incorporated herein by reference.
We have adopted the Tier Technology Code of Ethics, a code of ethics that applies to our Chief Executive Officer, Chief Financial Officer, Chief Accounting Officer, Corporate Controller and other finance organization employees. The code of ethics is available publicly on our website at www.Tier.com. If we make any amendments to the Code of Ethics or grant any waiver, including any implicit waiver, from a provision of the code to our Chief Executive Officer, Chief Financial Officer, Chief Accounting Officer, or the Corporate Controller, we will disclose the nature of such amendment or waiver on our website or in a report on Form 8-K.
The information in the Proxy Statement set forth under the captions Compensation Discussion and Analysis, Executive Compensation, Director Compensation, Compensation Committee Interlocks and Insider Participation and Compensation Committee Report is incorporated herein by reference.
ITEM 12—SECURITY OWNERSHIP OF CERTAIN BENEFICIAL OWNERS AND MANAGEMENT AND RELATED STOCKHOLDER MATTERS
The information in the Proxy Statement set forth under the captions Stock Ownership and Equity Compensation Plan Information is incorporated herein by reference.
AND DIRECTOR INDEPENDENCE
The information set forth under the captions Certain Relationships and Related Transactions and Director Independence of the Proxy Statement is incorporated herein by reference.
Information concerning principal accountant fees and services appears in the Proxy Statement under the heading Principal Accounting Fees and Services and is incorporated herein by reference.
74
(a) The following documents are filed as part of the report:
|
|
Financial Statements – The financial statements are set forth under Item 8 of this Annual Report on Form 10-K. See Financial Statements and Supplementary Data on page 36.
|
|
|
Financial Statement Schedules – Schedule II—Valuation and Qualifying Accounts is set forth under Item 8 of this Annual Report on Form 10-K on page 71. All other schedules have been omitted because they were either not required or not applicable or because the information is otherwise included.
|
|
|
Exhibits
|
|
Exhibit number
|
Exhibit description
|
|
2.1
|
Purchase and Sale Agreement between Tier Technologies, Inc. and Informatix, Inc., dated June 30, 2008 (1)
|
|
2.2
|
Asset Purchase Agreement between Tier Technologies, Inc., Cowboy Acquisition Company and ChoicePay, Inc., dated as of January 13, 2009 (2)
|
|
3.1
|
Restated Certificate of Incorporation (3)
|
|
3.2
|
Amended and Restated Bylaws of Tier Technologies, Inc., as amended (4)
|
|
4.1
|
Form of common stock certificate (3)
|
|
4.2
|
See Exhibits 3.1 and 3.2, for provisions of the Restated Certificate of Incorporation and Amended and Restated Bylaws, as amended of the Registrant defining rights of the holders of common stock of the Registrant
|
|
10.1
|
Amended and Restated 1996 Equity Incentive Plan, dated January 28, 1999 (5)*
|
|
10.2
|
Form of Incentive Stock Option Agreement under the Registrant’s Amended and Restated 1996 Equity Incentive Plan (6)*
|
|
10.3
|
Form of Nonstatutory Stock Option Agreement under the Registrant’s Amended and Restated 1996 Equity Incentive
Plan (6)*
|
|
10.4
|
Amended and Restated 2004 Stock Incentive Plan (7)*
|
|
10.5
|
Form of Incentive Stock Option Agreement under the Registrant’s Amended and Restated 2004 Stock Incentive Plan (7)*
|
|
10.6
|
Form of Nonstatutory Stock Option Agreement under the Registrant’s Amended and Restated 2004 Stock Incentive Plan (7)*
|
|
10.7
|
Form of Restricted Stock Agreement under the Registrant’s Amended and Restated 2004 Stock Incentive Plan (7)*
|
|
10.8
|
Form of California Indemnification Agreement (8)
|
|
10.9
|
Form of Delaware Indemnification Agreement for officers (9)
|
|
10.10
|
Form of Delaware Indemnification Agreement for directors (9)
|
|
10.11
|
Tier Corporation 401(k) Plan, Summary Plan Description (8)*
|
|
10.12
|
Supplemental Indemnity Agreement by and between Registrant and Bruce R. Spector, dated September 2, 2004 (10)*
|
|
10.13
|
Amended and Restated Credit and Security Agreement between the Registrant, Official Payments Corporation, EPOS Corporation and City National Bank dated March 6, 2006 (11)
|
|
10.14
|
Employment Agreement between Tier Technologies, Inc., and Ronald L. Rossetti, dated July 26, 2006 (12)*
|
|
10.15
|
Non-Statutory Stock Option Agreement between Tier and Ronald L. Rossetti, dated July 26, 2006 (12)*
|
|
10.16
|
Option Grants awarded to Charles Berger, Morgan Guenther, and fifteen other employees, dated August 24, 2006 (13)*
|
|
10.17
|
First Amendment to Amended and Restated Credit and Security Agreement dated March 20, 2007 between the Registrant, Official Payments Corporation, EPOS Corporation and City National Bank (14)
|
|
10.18
|
Second Amendment to Amended and Restated Credit and Security Agreement dated September 26, 2007 between the
|
75
| Exhibit number | Exhibit description |
| Registrant, Official Payments Corporation, EPOS Corporation and City National Bank (15) | |
|
10.19
|
Share Repurchase Agreement between CPAS Systems, Inc., Tier Ventures Corporation and Tier Technologies, Inc. dated June 29, 2007 (16)
|
|
10.20
|
Employment Agreement between Tier Technologies, Inc. and Ronald L. Rossetti, dated April 30, 2008. (17)*
|
|
10.21
|
Employment Agreement between Tier Technologies, Inc. and Keith Kendrick, dated June 30, 2008 (18)*
|
|
10.22
|
Employment Agreement between Tier Technologies, Inc. and Ronald W. Johnston, dated July 1, 2008 (18)*
|
|
10.23
|
Third Amendment to Amended and Restated Credit and Security Agreement between Tier Technologies, Inc., Official Payments Corporation, EPOS Corporation and City National Bank dated September 29, 2008 (19)
|
|
10.24
|
Employment Agreement between Tier Technologies, Inc. and Nina K. Vellayan, dated September 22, 2008 (20)
|
|
10.25
|
Enterprise Value Award Plan Amendment to Reflect Supplemental Award dated December 4, 2008 between Tier Technologies, Inc. and Ronald L. Rossetti (21)*
|
|
10.26
|
Tier Technologies, Inc. Executive Performance Stock Unit Plan (22)*
|
|
10.27
|
Employment Agreement between Tier Technologies, Inc. and Keith Omsberg, effective as of May 6, 2009 (23)*
|
|
10.28
|
Renewal Letter: Short Clear Extension of Termination Date between Tier Technologies, Inc., Official Payments Corporation, EPOS Corporation and City National Bank (24)
|
|
10.29
|
Amendment of Solicitation/Modification of Contract No. 0001 dated October 30, 2009 between the Internal Revenue Service and Official Payments Corporation (25)
|
|
10.30
|
Amendment of Solicitation/Modification of Contract No. 0002 dated January 4, 2010 between the Internal Revenue Service and Official Payments Corporation (25)
|
|
10.31
|
Amendment of Solicitation/Modification of Contract No. 0003 dated March 29, 2010 between the Internal Revenue Service and Official Payments Corporation (25)
|
|
10.32
|
Amendment of Solicitation/Modification of Contract No. 0004 dated March 30, 2010 between the Internal Revenue Service and Official Payments Corporation (25)
|
|
10.33
|
Amendment of Solicitation/Modification of Contract No. 0005 dated April 15, 2010 between the Internal Revenue Service and Official Payments Corporation (25)
|
|
10.34
|
Deed of Lease agreement between Tier Technologies, Inc. and Sunrise Campus Investors, LLC, dated December 9, 2009. (26)
|
|
10.35
|
Agreement dated as of January 8, 2010 among Giant Investment, LLC, Parthenon Investors II, L.P., PCap Partners II, LLC, PCap II, LLC, John C. Rutherford, and Tier Technologies, Inc. (27)
|
|
10.36
|
Agreement dated February 25, 2010 among Discovery Equity Partners, L.P., Discovery Group I, LLC, Daniel J. Donoghue, and Michael R. Murphy and Tier Technologies, Inc. (28)
|
|
10.37
|
Fourth Amendment to Amended and Restated Credit and Security Agreement dated January 14, 2010 between Tier Technologies, Inc., Official Payments Corporation and City National Bank. (29)
|
|
10.38
|
Letter Agreement dated July 15, 2010 between Charles W. Berger and Tier Technologies, Inc. (30)
|
|
10.39
|
Employment Agreement between Tier Technologies, Inc. and Alex P. Hart, dated August 10, 2010 (31)
|
|
10.40
|
First amendment to Employment Agreement between Tier Technologies, Inc and Alex P. Hart, dated August 13, 2010 (32)
|
|
10.41
|
Severance Agreement and Release of Claims dated August 17, 2010 between Nina Vellayan and Tier Technologies, Inc. (33)
|
|
10.42
|
Amendment of Solicitation/Modification of Contract No. 0006 dated July 12, 2010 between the Internal Revenue Service and Official Payments Corporation † ‡
|
|
10.43
|
Letter of amendment to Employment Agreement dated August 31, 2010, between Ronald W. Johnston and Tier Technologies, Inc. †*
|
|
10.44
|
Letter of amendment to Employment Agreement dated November 3, 2010, between Keith Omsberg and Tier Technologies, Inc. †*
|
|
10.45
|
Employment Agreement between Tier Technologies, Inc. and Atul Garg, dated October 19, 2010 †*
|
76
| Exhibit number | Exhibit description |
|
10.46
|
Nonstatutory Stock Option Agreement for Inducement Grant between Tier Technologies, Inc. and Alex P. Hart †*
|
|
10.47
|
Incentive and Nonstatutory Stock Option Agreement between Tier Technologies, Inc. and Alex P. Hart †*
|
|
21.1
|
Subsidiaries of the Registrant †
|
|
23.1
|
Consent of McGladrey & Pullen, LLP, Independent Registered Public Accounting Firm †
|
|
31.1
|
Certification of Chief Executive Officer pursuant to Rules 13a-14(a) and 15d-14(a) promulgated under the Securities Exchange Act of 1934 †
|
|
31.2
|
Certification of Chief Financial Officer pursuant to Rules 13a-14(a) and 15d-14(a) promulgated under the Securities Exchange Act of 1934 †
|
|
32.1
|
Certification of Chief Executive Officer pursuant to 18 U.S.C. Section 1350, as adopted pursuant to Section 906 of the Sarbanes-Oxley Act of 2002 †
|
|
32.2
|
Certification of Chief Financial Officer pursuant to 18 U.S.C. Section 1350, as adopted pursuant to Section 906 of the Sarbanes-Oxley Act of 2002 †
|
|
* Management contract or compensatory plan required to be filed as an exhibit to this report
† Filed as an exhibit to this report
‡ Confidential treatment requested as to certain portions, which portions were omitted and filed separately with the Securities and Exchange Commission pursuant to a Confidential Treatment Request.
(1) Filed as an exhibit to Form 10-Q, filed July 7, 2008, and incorporated herein by reference
(2) Filed as an exhibit to Form 8-K, filed on January 20, 2009, and incorporated herein by reference
(3) Filed as an exhibit to Form 8-K, filed on July 19, 2005, and incorporated herein by reference
(4) Filed as an exhibit to Form 8-K, filed on February 24, 2009, and incorporated herein by reference
(5) Filed as an exhibit to Form 10-Q, filed May 11, 2001, and incorporated herein by reference
(6) Filed as an exhibit to Form 8-K, filed November 12, 2004, and incorporated herein by reference
(7) Filed as an exhibit to Form 8-K, filed July 5, 2005 and incorporated herein by reference
(8) Filed as an exhibit to Form S-1 (No. 333-37661), filed on October 10, 1997, and incorporated herein by reference
(9) Filed as an exhibit to Form 10-K, filed December 14, 2007, and incorporated herein by reference
(10) Filed as an exhibit to Form 10-K, filed December 28, 2004, and incorporated herein by reference
(11) Filed as an exhibit to Form 8-K, filed March 9, 2006, and incorporated herein by reference
(12) Filed as an exhibit to Form 8-K, filed August 1, 2006, and incorporated herein by reference
(13) Filed as a Form 8-K, filed August 29, 2006, and incorporated herein by reference
(14) Filed as an exhibit to Form 8-K, filed March 28, 2007, and incorporated herein by reference
(15) Filed as an exhibit to Form 8-K, filed September 27, 2007, and incorporated herein by reference
(16) Filed as an exhibit to Form 8-K, filed July 3, 2007, and incorporated herein by reference
(17) Filed as an exhibit to Form 10-Q, filed May 6, 2008, and incorporated herein by reference
(18) Filed as an exhibit to Form 8-K, filed July 7, 2008, and incorporated herein by reference
(19) Filed as an exhibit to Form 8-K, filed October 3, 2008, and incorporated herein by reference
(20) Filed as an exhibit to Form 10-K, filed December 8, 2008, and incorporated herein by reference
(21) Filed as an exhibit to Form 10-Q, filed May 11, 2009, and incorporated herein by reference
(22) Filed as a Form 8-K, filed January 22, 2009, and incorporated herein by reference
(23) Filed as an exhibit to Form 8-K, filed May 19, 2009, and incorporated herein by reference
(24) Filed as an exhibit to Form 10-K, filed November 10, 2009, and incorporated herein by reference
(25) Filed as an exhibit to Form 10-K/A (Amendment 3), filed June 22, 2010 and incorporated herein by reference
(26)Filed as an exhibit to Form 10-Q, filed February 9, 2010, and incorporated herein by reference
(27) Filed as an exhibit to Form 8-K, filed January 11, 2010, and incorporated herein by reference
(28) Filed as an exhibit to Form 8-K, filed March 1, 2010, and incorporated herein by reference
(29) Filed as an exhibit to Form 10-Q, filed May 10, 2010, and incorporated herein by reference
(30) Filed as an exhibit to Form 8-K, filed July 19, 2010, and incorporated herein by reference
(31) Filed as an exhibit to Form 8-K, filed August 11, 2010, and incorporated herein by reference
(32) Filed as an exhibit to Form 8-K, filed August 18, 2010, and incorporated herein by reference
(33) Filed as an exhibit to Form 8-K, filed August 18, 2010, and incorporated herein by reference
|
|
77
Pursuant to the requirements of Section 13 or 15(d) of the Securities Exchange Act of 1934, the Registrant has duly caused this report to be signed on its behalf by the undersigned, thereunto duly authorized.
|
TIER TECHNOLOGIES, INC.
|
||
|
Dated: November 22, 2010
|
By:
|
/s/ ALEX P. HART
Alex P. Hart
President, Chief Executive Officer
|
Pursuant to the requirements of the Securities Exchange Act of 1934, this report has been signed by the following persons in the capacities and on the dates indicated.
|
Signature
|
Title
|
Date
|
|
/s/ ALEX P. HART
Alex P. Hart
|
President, Chief Executive Officer (principal executive officer)
|
November 22, 2010
|
|
/s/ RONALD W. JOHNSTON
Ronald W. Johnston
|
Chief Financial Officer (principal financial officer and principal accounting officer)
|
November 22, 2010
|
|
/s/ CHARLES W. BERGER
Charles W. Berger
|
Director
|
November 22, 2010
|
|
/s/ JOHN J. DELUCCA
John J. Delucca
|
Director
|
November 22, 2010
|
|
/s/ MORGAN P. GUENTHER
Morgan P. Guenther
|
Director
|
November 22, 2010
|
|
/s/ PHILIP G. HEASLEY
Philip G. Heasley
|
Director
|
November 22, 2010
|
|
/s/ DAVID A. POE
David A. Poe
|
Director
|
November 22, 2010
|
|
/s/ RONALD L. ROSSETTI
Ronald L. Rossetti
|
Director
|
November 22, 2010
|
|
/s/ ZACHARY F. SADEK
Zachary F. Sadek
|
Director
|
November 22, 2010
|
78