Attached files
| file | filename |
|---|---|
| 8-K - 8K RE Q3'09 WENDY'S/ARBY'S GROUP EARNINGS CALL PRESENTATION NOV. 5, 2009 - Wendy's Co | form8-k2009q3slides.htm |
EXHIBIT
99.1


Steve Hare
Chief Financial Officer


Third
Quarter 2009
Earnings Call
Earnings Call
November
5, 2009
Opening
Comments
John
Barker
SVP and Chief Communications Officer
SVP and Chief Communications Officer
2
n Third
Quarter Highlights - Roland Smith
− Business
overview
− Third
quarter financial highlights
− Key
profit drivers
n Financial
Results - Steve Hare
− Consolidated
financial overview
− Brand
operating results
− Dividend
and stock repurchase program
n Brand
Updates, Growth Opportunities and Outlook -
Roland Smith
Roland Smith
n Q&A
Today’s
earnings release and financial statements are available on the
Investor
Relations section of our website at www.wendysarbys.com.
Agenda
3
Wendy’s/Arby’s
Group Reported Today:
n Third
Quarter and YTD Results
− Q3
2009 and YTD are not comparable to 2008 due to the merger
n Balance
Sheet Highlights
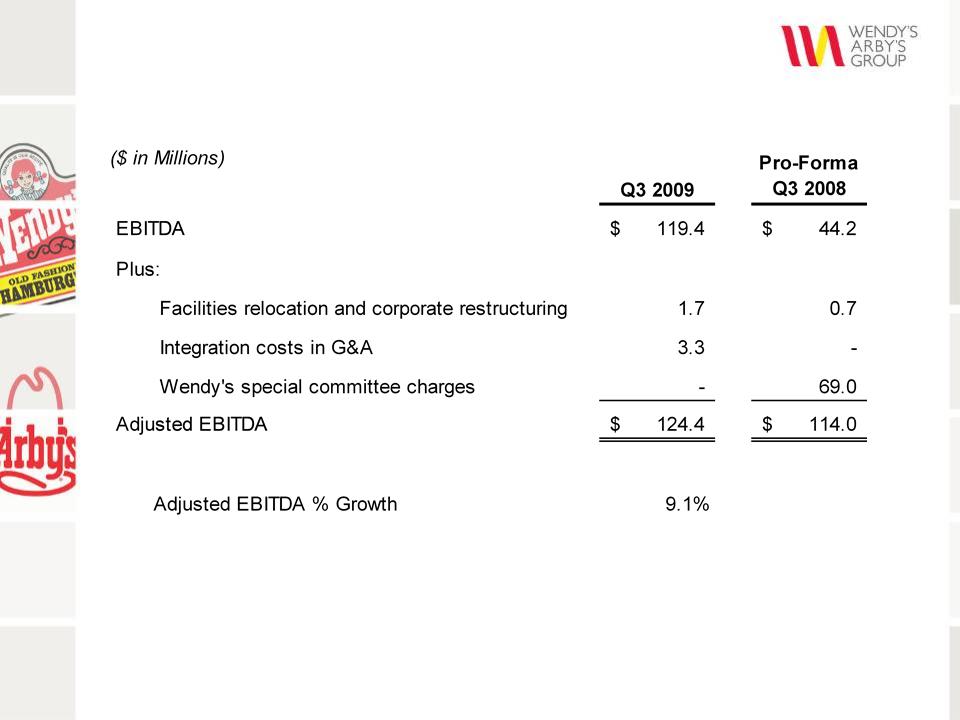
n Adjusted
EBITDA Compared to Pro-Forma Adjusted
EBITDA
EBITDA
n Selected
Financial Highlights for Each Brand
n Form
10-Q
Third
Quarter 2009
4
Forward-Looking
Statements and
Regulation G
Regulation G
This
presentation, and certain information that management may discuss in
connection
with this presentation, may contain statements that are not historical facts, including,
importantly, information concerning possible or assumed future results of our operations.
Those statements constitute “forward-looking statements” within the meaning of the
Private Securities Litigation Reform Act of 1995 (the “Reform Act”). For all our forward-
looking statements, we claim the protection of the safe harbor for forward-looking
statements contained in the Reform Act.
Many
important factors could affect our future results and could cause those results
to
differ materially from those expressed in or implied by our forward-looking statements.
Such factors, all of which are difficult or impossible to predict accurately, and many of
which are beyond our control, include but are not limited to those identified under the
caption “Forward-Looking Statements” in our most recent earnings press release and in
the “Special Note Regarding Forward-Looking Statements and Projections” and “Risk
Factors” sections of our most recent Form 10-K and subsequent Form 10-Qs.
In
addition, this presentation and certain information management may discuss
in
connection with this presentation reference non-GAAP financial measures, such as
earnings before interest, taxes, depreciation and amortization, or EBITDA.
Reconciliations of non-GAAP financial measures to the most directly comparable GAAP
financial measure are in the Appendix to this presentation, and are included in the
earnings release and posted on the Investor Relations section of our website.
Third
Quarter 2009 Highlights
Roland
Smith
President & Chief Executive Officer
President & Chief Executive Officer
6
n Wendy’s/Arby’s
Group: 3rd Largest QSR Company
in the U.S.
n Solid
Earnings Growth in a Challenging Market
n Margin
Improvement at Wendy’s
− Ahead
of plan to generate $100 million in incremental annual EBITDA by
improving Wendy’s restaurant margins by 500 basis points by end of 2011
improving Wendy’s restaurant margins by 500 basis points by end of 2011
n Cost
Savings through Wendy’s/Arby’s Integration
− Ahead
of plan to achieve G&A savings goal of $60 million on an annualized
basis by end of 2011 and beginning to work on additional cost saving
opportunities
basis by end of 2011 and beginning to work on additional cost saving
opportunities
n Significant
Product Innovation
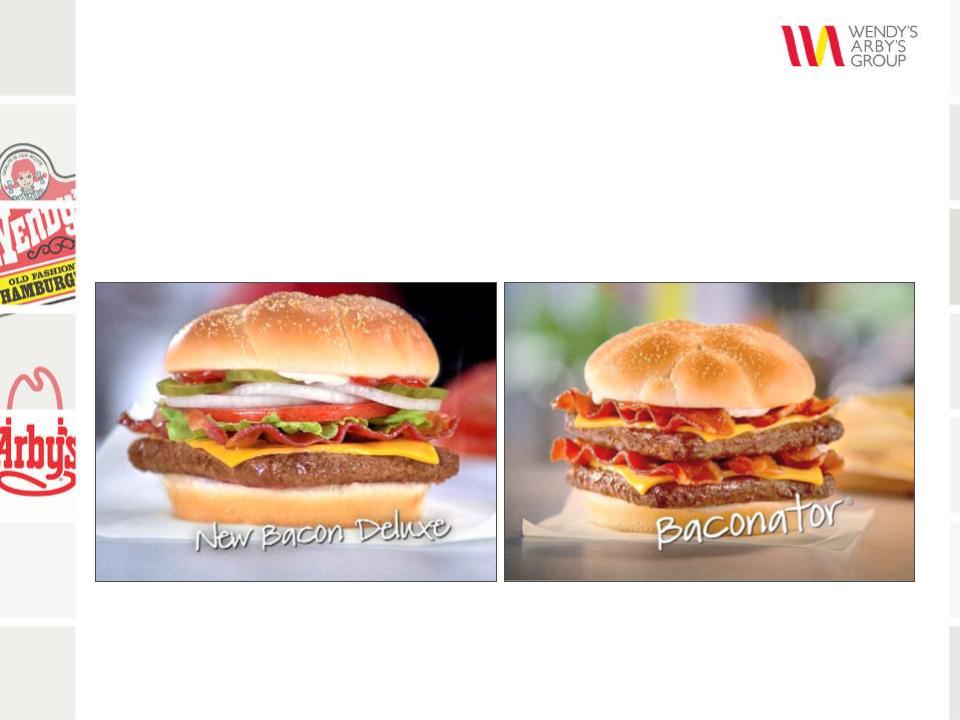
− Introduced
new premium products - Arby’s Roastburger™ and Wendy’s
Boneless Wings and Bacon Deluxe Cheeseburger
Boneless Wings and Bacon Deluxe Cheeseburger
n Implementing
Improved Value Strategies at Each Brand
n Revitalizing
the Wendy’s Brand with New Advertising Campaign
n Signed
Agreement to form Wendy’s Purchasing Co-op
n Strong
Cash Flow and Financial Flexibility
First
Year Accomplishments
7
n Adjusted
EBITDA Grew 9.1% to $124.4 million*
n Strong
Performance at Wendy’s
− Positive
systemwide same-store sales, excluding breakfast removal
− 400
basis points improvement in company-operated margin
n Sales
and Margins Declined at Arby’s
− Launched
1st Phase of
Arby’s Everyday Value Platform in October
*See
Appendix.
Third
Quarter Business Overview
8
Wendy’s
Third Quarter Results
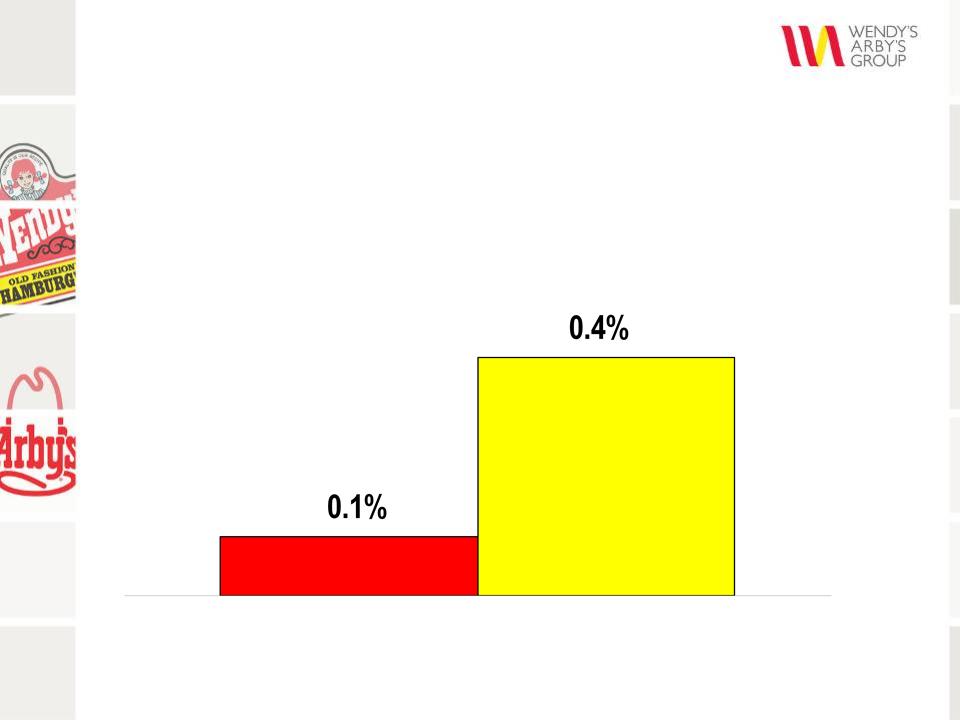
North
America Same-Store Sales
n Third
Quarter Same-Store Sales, Excluding the Impact of
Breakfast, were Positive
Breakfast, were Positive
Company
excl
breakfast
breakfast
Franchise
9
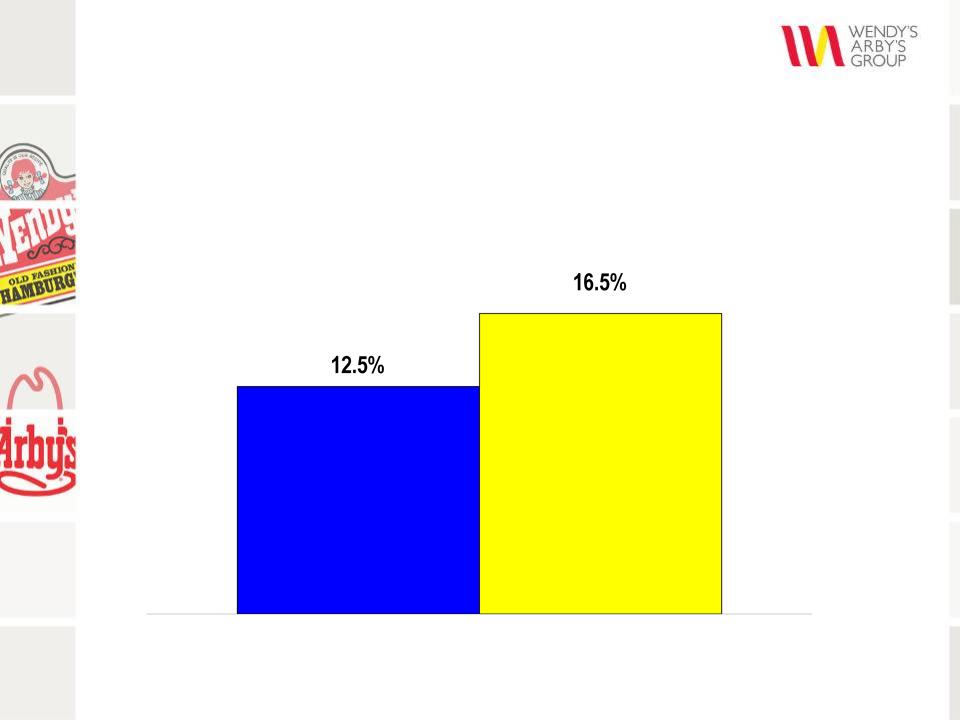
Wendy’s
Third Quarter Results
Restaurant
Margin
n Q3
2009 Company-Operated Restaurant Margin was +400 bps
vs. Year Ago
vs. Year Ago
Q3
2008
Q3
2009
10
Arby’s
Third Quarter Results
North
America Same-Store Sales
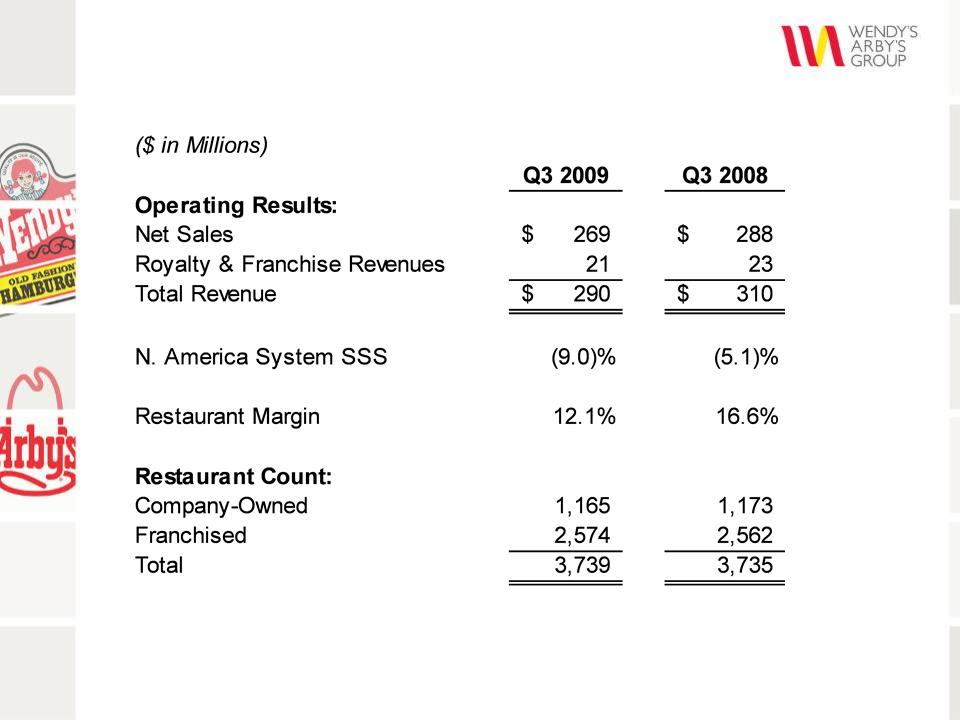
n Same-store
Sales Impacted by Significant Competitor
Discounting
Discounting
n Margins
Decreased Driven Primarily Due to Significant
Deleveraging
Deleveraging
Restaurant
Margin
Q3
2009
Q3
2008
12.1%
16.6%
-6.5%
-10.2%
Company
Franchise
Q3
2009
11
n Delivered
400 bps Improvement in Q3 and +300 bps YTD
n Expect
to Exceed +250 bps for the Full-Year 2009
n Remain
Confident in Our Ability to Achieve +500 bps by 2011
Original
Margin Improvement Targets by Year
150-170
bps
2008 2009 2010 2011 2011
Target Target Target Target
11.7%
16.7%
160-180
bps
160-180
bps
Wendy’s
Restaurant Margin
12
2008
2009
2010
2011
$60
million Target
Additional
Savings
Savings
n Ahead
of Schedule to Achieve Cost Savings Goal of
$60
Million through Synergies and Efficiencies
n Key
Projects Under Way
− Shared
Services Center in place
− Completing
IT rationalization projects
− Signed
agreement to form Wendy’s purchasing co-op
n Working
on Additional Cost Saving Opportunities
G&A
Synergies and Efficiencies
Financial
Overview
Steve Hare
Chief Financial Officer
14
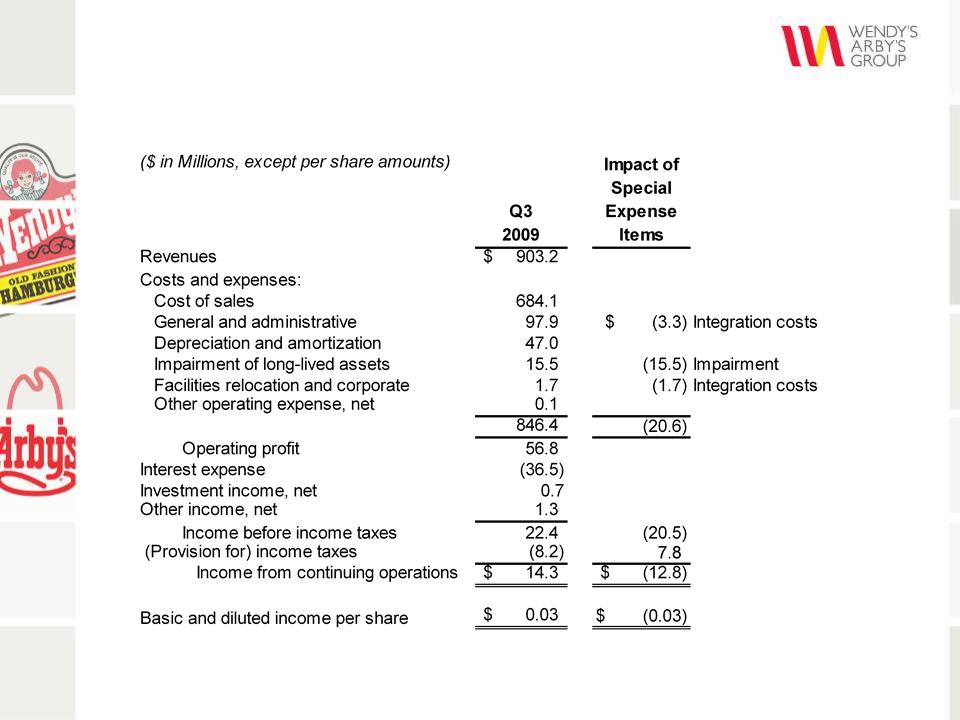
Q3
Consolidated Operating Results
15
*See
Appendix.
Q3
EBITDA and Adjusted EBITDA*
16
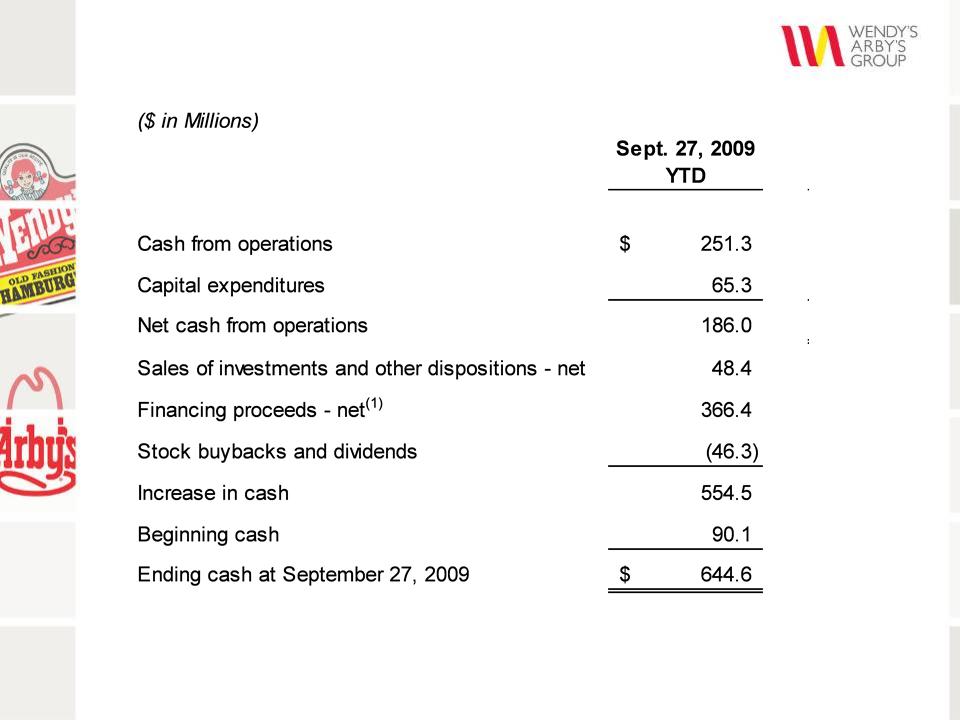
(1) Includes $1.1
million of net cash from exchange rate changes and discontinued
operations
Cash
Flow - 2009 YTD
17
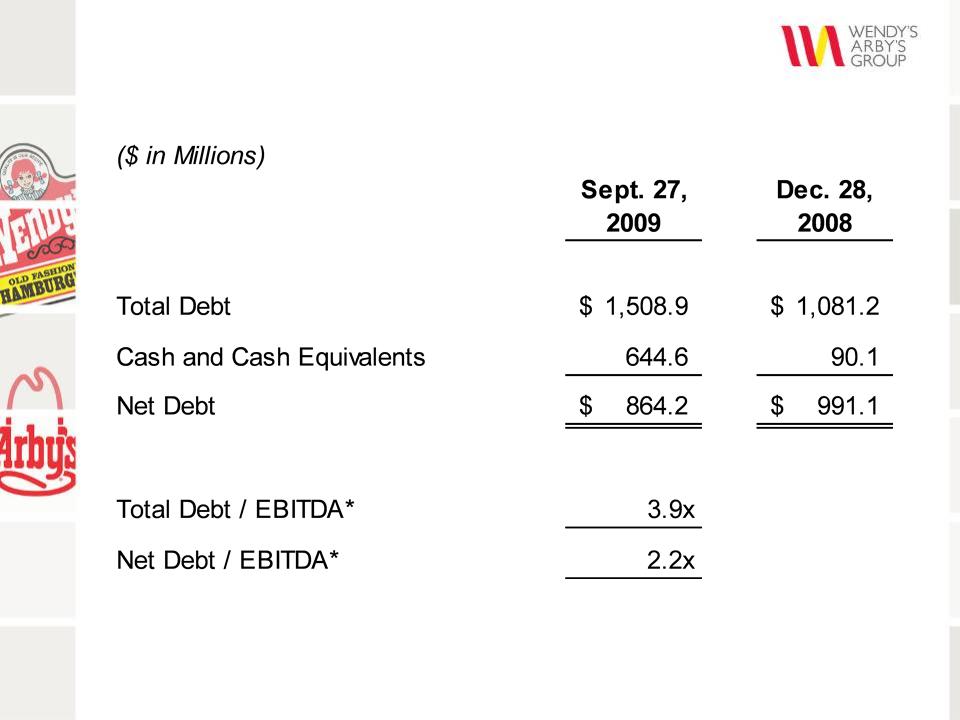
*
Represents trailing twelve month pro-forma adjusted EBITDA
Debt
Capitalization
18
*See
Appendix
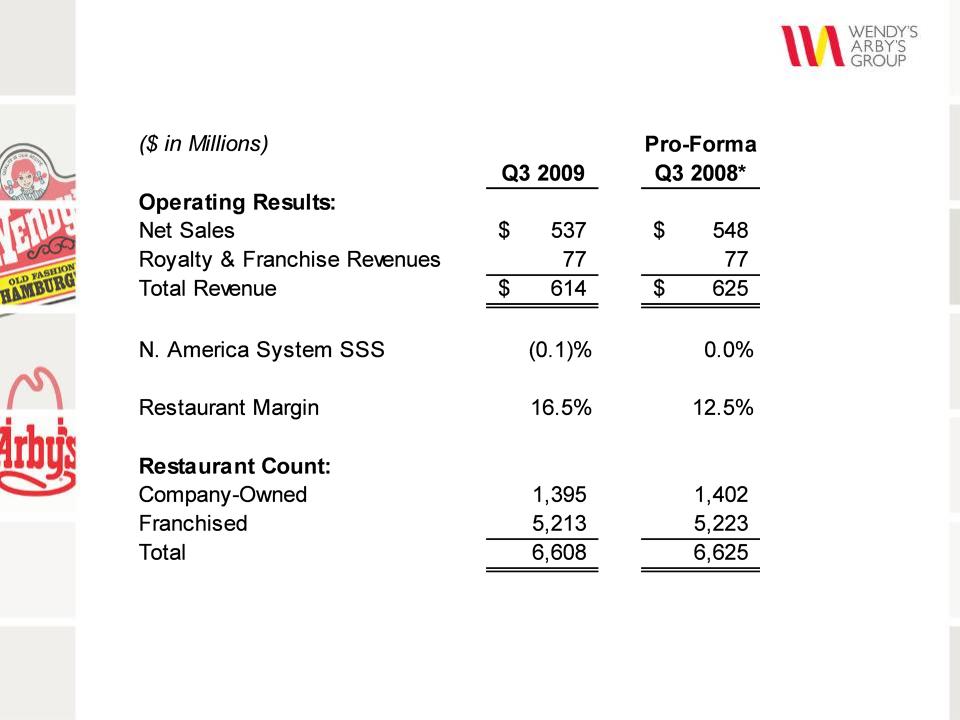
Q3
Wendy’s Brand Operating Results
19
Q3
Arby’s Brand Operating Results
20
n Will
Manage Food and Related Product Purchases and
Distribution Services
Distribution Services
n Offers
Cost Savings Opportunities While Maintaining the
Quality of the Wendy’s Brand
Quality of the Wendy’s Brand
n Company
Committed $15.5 Million for Initial Startup
− Expensed
in the fourth quarter
− Paid
over the next 18 months
n Operating
Costs Of QSCC will be Paid by All Members
Including Franchisees after an Initial Startup Period
Including Franchisees after an Initial Startup Period
n Longer-term
Opportunity to Leverage QSCC and Arby’s Co-op
Combined Volume in Non-Brand Specific Purchases
Combined Volume in Non-Brand Specific Purchases
Wendy’s
New Purchasing Co-op
Quality Supply Chain Co-op (QSCC)
Quality Supply Chain Co-op (QSCC)
21
n Board
Amended Stock Repurchase Program and Increased
Authorization to $100 million
Authorization to $100 million
− Company
purchased $49 million of common stock as of October
26, 2009; 10.3 million shares for approximately $4.77 per share
26, 2009; 10.3 million shares for approximately $4.77 per share
− Authorization
will remain in effect through January 2, 2011
− Company
will repurchase additional shares as market
conditions warrant
conditions warrant
n Quarterly
Dividend
− $0.015
per share
− Payable
on December 15, 2009 to stockholders of record as of
December 1, 2009
December 1, 2009
Recent
Board Actions
Brand
Updates, Growth
Opportunities and Outlook
Opportunities and Outlook
Roland
Smith
President & Chief Executive Officer
President & Chief Executive Officer
23
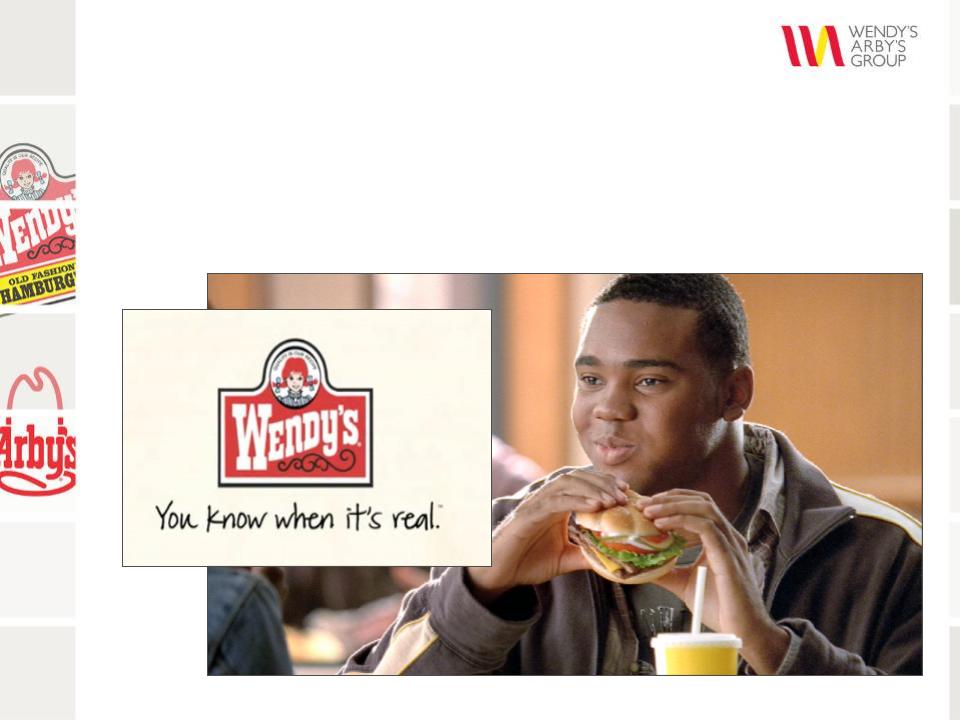
n Unveiled
New Advertising Campaign in October
− “You
Know When It’s Real™”
− Reinforces
Wendy’s quality brand positioning
Re-Energizing
the Wendy’s Brand
24
n Launched
New Bacon Deluxe Cheeseburger in October
n Full
Pipeline of New Products in Various Test Phases
Re-Energizing
the Wendy’s Brand
25
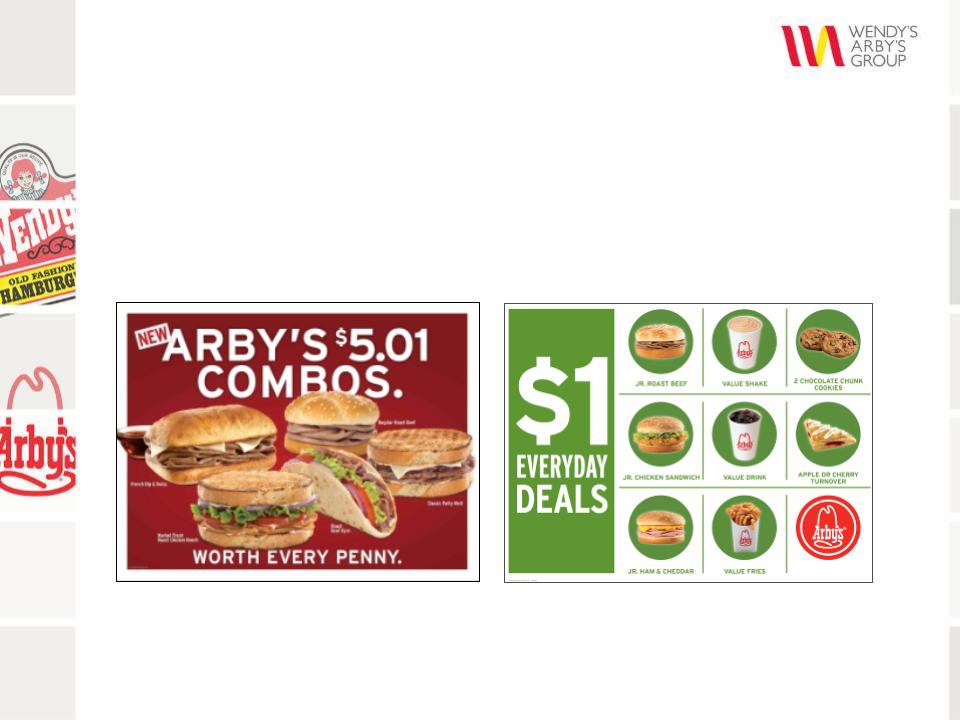
n Launched
1st Phase of Everyday Value Strategy
– $5.01
Combos: One of
5 full-sized sandwiches + fries & drink
n 2nd
Phase will Feature Expansion of $1 Menu
Arby’s:
Balancing Premium and Value
26
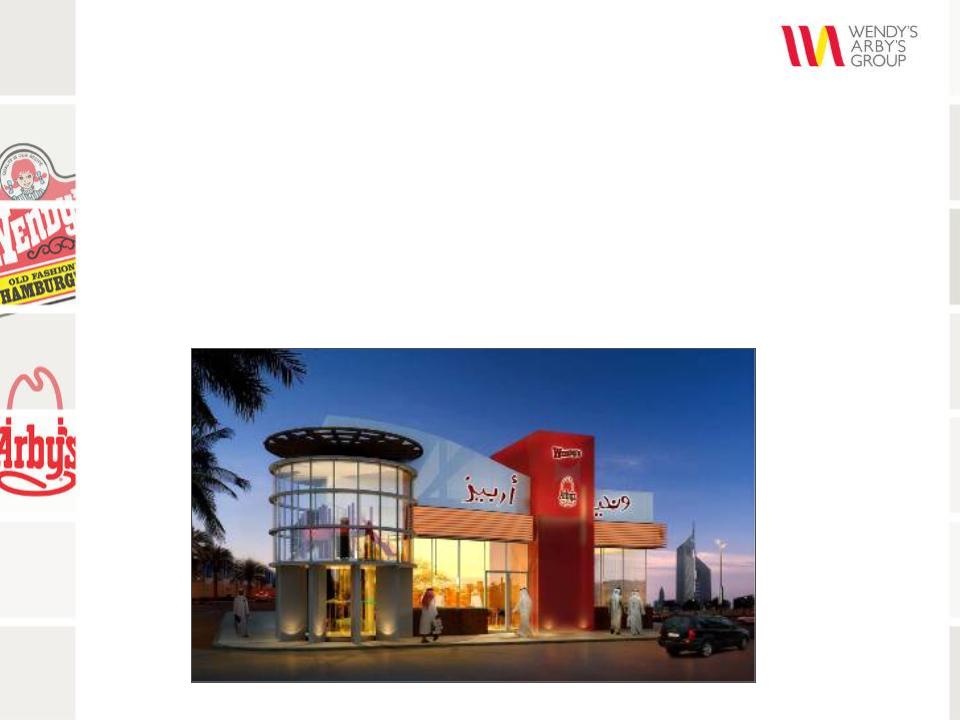
n Announced
New SVP of International, Andy Skehan
n Wendy’s
and Arby’s are Under-Penetrated in International
Markets
Markets
n Potential
for 8,000 Restaurants Outside of North America
n 1st
International Dual-branded Restaurant Expected to
Open in Dubai in Early 2010
Open in Dubai in Early 2010
*Artist
rendering (not actual restaurant)
International
Growth
27
n 2009
Financial Outlook
n 10%
Growth in 2009 Year-to-Date Adjusted EBITDA*
n Strong
Performance at Wendy’s
n Implementing
Everyday Value Strategy at Arby’s
n Key
Profit Drivers Ahead of Plan
n Strong
Free Cash Flow
n Growth
Opportunities in International
n Average
Annual Adjusted EBITDA Growth in the Mid-Teens
through 2011
through 2011
*See
Appendix.
Summary
www.wendysarbys.com
Q&A
Appendix
30
31