Attached files
| file | filename |
|---|---|
| 8-K - FORM 8K FINANCIAL INFORMATION 2009 Q3 - CNO Financial Group, Inc. | form8k.htm |
| EX-99.2 - QUARTERLY FINANCIAL SUPPLEMENT - CNO Financial Group, Inc. | exh99-2.htm |

Exhibit
99.1
Third
Quarter 2009
Financial
and Operating Results
For
the period ended September 30, 2009
Conseco,
Inc.
November
5, 2009

2
Forward-Looking
Statements
Cautionary
Statement Regarding Forward-Looking Statements. Our statements,
trend analyses and other information contained in these
materials relative to markets for Conseco’s products and trends in Conseco’s operations or financial results, as well as other statements,
contain forward-looking statements within the meaning of the federal securities laws and the Private Securities Litigation Reform Act of 1995.
Forward-looking statements typically are identified by the use of terms such as “anticipate,” “believe,” “plan,” “estimate,” “expect,” “project,”
“intend,” “may,” “will,” “would,” “contemplate,” “possible,” “attempt,” “seek,” “should,” “could,” “goal,” “target,” “on track,” “comfortable with,”
“optimistic” and similar words, although some forward-looking statements are expressed differently. You should consider statements that
contain these words carefully because they describe our expectations, plans, strategies and goals and our beliefs concerning future business
conditions, our results of operations, financial position, and our business outlook or they state other ‘‘forward-looking’’ information based on
currently available information. Assumptions and other important factors that could cause our actual results to differ materially from those
anticipated in our forward-looking statements include, among other things: (i) our ability to continue to satisfy the financial ratio and balance
requirements and other covenants of our debt agreements; (ii) liquidity issues associated with the right of holders of our convertible debentures
to require us to repurchase existing debentures on September 30, 2010; (iii) general economic, market and political conditions, including the
performance and fluctuations of the financial markets which may affect our ability to raise capital or refinance existing indebtedness and the
cost of doing so; (iv) our ability to generate sufficient liquidity to meet our debt service obligations and other cash needs; (v) our ability to obtain
adequate and timely rate increases on our supplemental health products including our long-term care business; (vi) the receipt of any required
regulatory approvals for dividend and surplus debenture interest payments from our insurance subsidiaries; (vii) mortality, morbidity, the
increased cost and usage of health care services, persistency, the adequacy of our previous reserve estimates and other factors which may
affect the profitability of our insurance products; (viii) changes in our assumptions related to the cost of policies produced or the value of policies
in force at the effective date of our emergence from bankruptcy; (ix) the recoverability of our deferred tax asset and the effect of potential
ownership changes and tax rate changes on its value; (x) our assumption that the positions we take on our tax return filings, including our
position that the debentures will not be treated as stock for purposes of Section 382 of the Code and will not trigger an ownership change, will
not be successfully challenged by the Internal Revenue Service (IRS); (xi) changes in accounting principles and the interpretation thereof; (xii)
our ability to achieve anticipated expense reductions and levels of operational efficiencies including improvements in claims adjudication and
continued automation and rationalization of operating systems; (xiii) performance and valuation of our investments, including the impact of
realized losses (including other-than-temporary impairment charges); (xiv) our ability to identify products and markets in which we can compete
effectively against competitors with greater market share, higher ratings, greater financial resources and stronger brand recognition; (xv) the
ultimate outcome of lawsuits filed against us and other legal and regulatory proceedings to which we are subject; (xvi) our ability to complete the
remediation of the material weakness in internal controls over our actuarial reporting process and to maintain effective controls over financial
reporting; (xvii) our ability to continue to recruit and retain productive agents and distribution partners and customer response to new products,
distribution channels and marketing initiatives; (xviii) our ability to achieve eventual upgrades of the financial strength ratings of Conseco and
our insurance company subsidiaries as well as the impact of rating downgrades on our business and our ability to access capital; (xix) the risk
factors or uncertainties listed from time to time in our filings with the Securities and Exchange Commission; (xx) regulatory changes or actions,
including those relating to regulation of the financial affairs of our insurance companies, such as the payment of dividends and surplus
debenture interest to us, regulation of financial services affecting (among other things) bank sales and underwriting of insurance products,
regulation of the sale, underwriting and pricing of products, and health care regulation affecting health insurance products; and (xxi) changes in
the Federal income tax laws and regulations which may affect or eliminate the relative tax advantages of some of our products. Other factors
and assumptions not identified above are also relevant to the forward-looking statements, and if they prove incorrect, could also cause actual
results to differ materially from those projected. All written or oral forward-looking statements attributable to us are expressly qualified in their
entirety by the foregoing cautionary statement. Our forward-looking statements speak only as of the date made. We assume no obligation to
update or to publicly announce the results of any revisions to any of the forward-looking statements to reflect actual results, future events or
developments, changes in assumptions or changes in other factors affecting the forward-looking statements.

Non-GAAP
Measures
3
This
presentation contains the following financial measures that differ from the
comparable measures
under Generally Accepted Accounting Principles (GAAP): operating earnings measures; book value,
excluding accumulated other comprehensive income (loss) per share; operating return measures;
earnings before net realized investment gains (losses) and corporate interest and taxes; debt to capital
ratios, excluding accumulated other comprehensive income (loss); and interest-adjusted benefit ratios.
Reconciliations between those non-GAAP measures and the comparable GAAP measures are
included in the Appendix, or on the page such measure is presented.
While
management believes these measures are useful to enhance understanding and
comparability
of our financial results, these non-GAAP measures should not be considered substitutes for the most
directly comparable GAAP measures.
of our financial results, these non-GAAP measures should not be considered substitutes for the most
directly comparable GAAP measures.
Additional
information concerning non-GAAP measures is included in our periodic filings
with the
Securities and Exchange Commission that are available in the “Investor - SEC Filings” section of
Conseco’s website, www.conseco.com.
Securities and Exchange Commission that are available in the “Investor - SEC Filings” section of
Conseco’s website, www.conseco.com.

Q3
2009 Summary
4
CNO
§ Third
consecutive profitable quarter
• Continued
profitability in all three insurance segments
• EBIT*
of $107.0 million, up 2% over Q3 2008
• Net
income of $15.4 million, compared to net loss of $183.3
million in Q3 2008
million in Q3 2008
§ Core
sales** of $93.4 million, up 1% from Q3 2008
§ Trailing
four-quarter premium up 3% over a year ago
§ Agent
recruitment continues to be strong
*Management believes
that an analysis of earnings or loss before net realized investment gains
(losses),
discontinued
operations, corporate interest and taxes (“EBIT,” a non-GAAP financial measure)
provides a
clearer
comparison of the operating results of the company quarter-over-quarter because
it excludes:
(1)
corporate interest expense; and (2) net realized investment gains (losses) that
are unrelated to the
company’s
underlying fundamentals.
**Excludes
PFFS.

Q3
2009 Summary
5
CNO
§ Net
realized investment losses of $18.9 million
• Total
other-than-temporary impairments (OTTI) of $162.4 million
• $35.7 million
recorded in earnings
• $126.7 million
recorded in accumulated other comprehensive loss (AOCL)
§ AOCL
improved to $146 million:
• $1.6 billion
improvement from 12/31/08
• $0.9 billion
improvement from 6/30/09
§ Book
value per share:
• Excluding AOCL* rose
to $18.82 at 9/30/09, from $18.41 at 12/31/08
• Including AOCL rose
to $18.03 at 9/30/09, from $8.82 at 12/31/08
*See
Appendix for corresponding GAAP measure.

6
CNO
§ Addresses
most pressing financial priority: re-financing the
3.5% convertible debentures
3.5% convertible debentures
§ Structured
to protect NOL, while preserving ability to raise
additional common equity
additional common equity
§ Improves
financial covenant margins; increases liquidity
§ Basics
of the deal:
• Private
placement of common stock and warrants
• Issuance
of new convertible debentures to refinance existing
convertible debentures
convertible debentures
• Tender
offer for existing convertible debentures
Recapitalization
of Conseco

7
CNO
Sources
Net
Proceeds from Equity Private Placement
Net
Proceeds from New Convertible Debentures
Total
Sources
Uses
Retirement of Old
Convertible Debentures
Payment
under Credit Agreement (50% of Net
Proceeds
of Equity Private Placement)
Funds
Available for Corporate Purposes
Total
Uses
$74
281
$355
$293
37
25
$355
($
millions)
*Assumes all
debentures are tendered and extinguished as of 9/30/09. If debentures are
tendered on 10/5/10
(the latest possible date), net proceeds from the new debenture issue would be $18 million less.
(the latest possible date), net proceeds from the new debenture issue would be $18 million less.
*
Anticipated
Sources and Uses of Cash

CNO
8
Credit
Facility (matures 10/13)
6%
Senior Note ($25MM due annually beginning 11/09)
3.5%
Convertible Debentures (puttable by holders 9/10)
7.0%
Convertible Debentures (matures 12/16)
Unamortized Discount
on Convertible Debentures
Total
Corporate Notes Payable
Equity
excluding Accumulated Other Comprehensive Loss*
Accumulated Other
Comprehensive Loss (“AOCL”)
Total
Shareholders’ Equity
Total
Capital
Debt/Total
Capital (excluding AOCL)
Book
Value per Share
Book
Value per Share (excluding AOCL)
$855
125
293
-
(11)
$1,262
3,480
(146)
$3,334
$4,596
26.6%
$18.03
$18.82
Actual
9/30/09
($
millions)
*Includes
recognition of $10.4 million after-tax loss on the assumed extinguishment of all
$293 million of existing
debentures and $0.1 million after-tax loss related to the writedown of deferred issuance costs associated with
the repayment of the credit facility.
debentures and $0.1 million after-tax loss related to the writedown of deferred issuance costs associated with
the repayment of the credit facility.
$(37)
(293)
293
3
63
Recapitalization
Adjustments
$818
125
-
293
(8)
$1,228
3,543
(146)
$3,397
$4,625
25.7%
$16.88
$17.60
As
Adjusted
9/30/09
Capital
Structure

Collected
Premiums
9
CNO
§ Total
collected premiums
for trailing 4 quarters up
3% vs comparable period
in prior year
for trailing 4 quarters up
3% vs comparable period
in prior year
§ Slight
decline at Bankers
due to termination of
PFFS group quota share
contracts
due to termination of
PFFS group quota share
contracts
§ Consistent
growth at
Colonial Penn
Colonial Penn
§ Slight
decline at CIG due
to focus on more
profitable business and
de-emphasizing annuity
sales
to focus on more
profitable business and
de-emphasizing annuity
sales
BLC
($
millions)
CP
CIG
Collected
Premiums-Trailing 4 Quarters
Q3
2008
$4,275.1
Q4
2008
$4,524.9
Q1
2009
$4,549.3
Q2
2009
$4,494.9
Q3
2009
$4,423.1

Q3
2009
Summary
of Results
10
CNO
$85.4
7.4
21.6
(31.4)
$83.0
--
(18.9)
$64.1
Pre-Tax
After
Tax
EPS
($
millions, except per-share amounts)
$54.3
(20.0)
(18.9)
$15.4
$0.29
(0.11)
(0.10)
$0.08
*Management
believes that an analysis of earnings before net realized investment gains
(losses) and increases to
our
valuation allowance for deferred tax assets (a non-GAAP financial measure)
provides an alternative measure
of the
operating results of the company because such items are unrelated to the
company’s continuing operations.
The
table above provides a reconciliation to the corresponding GAAP
measure.
**See
Appendix for a reconciliation to the corresponding GAAP measure.
Bankers
Life
Colonial
Penn
Conseco
Insurance Group
Corporate operations
and interest expense
Income
before net realized investment losses
and
valuation allowance for deferred tax assets*
Valuation allowance
for deferred tax assets**
Net
realized investment losses**
Total

Q3
Earnings
11
CNO
Consolidated
*Management believes
that an analysis of earnings before net realized investment gains (losses),
losses related to
the transfer of Senior Health to an independent trust (included in Discontinued Operations) and corporate interest
and taxes (“EBIT,” a non-GAAP financial measure) provides an alternative measure to compare the operating
results of the company quarter-over-quarter because it excludes: (1) corporate interest expense; and (2) items that
are unrelated to the company’s continuing operations. The table above provides a reconciliation of EBIT to net
income (loss).
($
millions)

Operating
ROE
12
CNO
Operating ROE*,
Trailing 4 Quarters

Operating
EPS*
13
CNO
*Operating earnings
per share exclude net realized investment gains (losses), valuation allowance
related to
deferred
tax assets and discontinued operations. See Appendix for corresponding GAAP
measure.
**Represents the
expected ratio of quarterly Operating EPS to annual Operating EPS, based
on
historical
experience.
Seasonality of Q3 Q4 Q1 Q2 Q3
Operating EPS** 23-28% 26-31% 17-22% 20-25% 23-28%
Statutory
Surplus ($ millions)
*Excludes Accumulated Other Comprehensive Loss, as defined by the senior credit facility.
$1,270
$1,100
Current
Amendment Levels
“Snapback” Levels
(effective Q3 2010)
CNO
14
250%
200%
1.5x
2.0x
Covenant
Metrics

Liquidity
Projection
For
Remainder of 2009*
15
CNO
($
millions)
Cash
Balance 9/30/09
Sources
Equity
Private Placement Proceeds, net of expenses
Net
Proceeds from New Convertible Debentures
Surplus
Debenture Interest
Management
and Investment Fees
Total
Sources
Uses
Interest
Debt
Repayments:
Senior
Credit Facility
Retirement
of Old Convertible Debentures
Senior
Health Note
Holding
Company Expenses
Total
Uses
Cash
Balance 12/31/09
$85.6
$73.7
281.3
12.2
9.0
376.2
18.9
36.8
293.0
25.0
15.1
388.8
$73.0
*Assumes 100% tender
in Q4 2009, and assumes that net equity proceeds are retained at the parent
company.
**Includes $4.3
million of expenses related to the retirement of the convertible
debentures.
**

Consolidated
RBC Ratio*
16
CNO
*Risk-Based Capital
(“RBC”) requirements provide a tool for insurance regulators to determine the
levels of
statutory
capital and surplus an insurer must maintain in relation to its insurance and
investment risks. The
RBC
ratio is the ratio of the statutory consolidated adjusted capital of our
insurance subsidiaries to RBC.
§ Q3
2009 positive impacts:
• Statutory operating
results (19 pts)
• Wilton Re
reinsurance (10 pts)
§ Q3
2009 negative impacts:
• Credit rating
migration and net
statutory capital losses (22 pts)
statutory capital losses (22 pts)

Consolidated
RBC Ratio -
Changes
Over Last Four Quarters
17
CNO
9/30/08
RBC
9/30/09
RBC
257%
252%
+45%
+11%
+4%
-50%
-48%
+17%
+9%
+5%
+2%

Capital
and
Risk
Management Initiatives
18
CNO
§ Reinsure
new and inforce business
§ Manage
investment portfolio to mitigate RBC impact of ratings
migration
migration
§ Terminate
PFFS quota share agreements with Coventry at 12/31/09 -
improves consolidated RBC by 8 pts in 2010
improves consolidated RBC by 8 pts in 2010
§ Limit
Bankers branch expansion
§ Reduce
direct marketing spending at Colonial Penn
§ Regulatory
• Merger
of three CIG insurance subsidiaries
• Deferred
tax asset
• Mortgage
Experience Adjustment Factor
• Modification
of RMBS ratings

Q3
Summary
19
Bankers
§ Earnings
of $85.4 million, up 26% over Q3 2008:
• Higher PFFS income
(+$20 million) due to mid-year premium
sweeps and favorable IBNR development
sweeps and favorable IBNR development
• Increase in COLI
surrender value (+$7 million)
• Lower LTC margins
(-$7 million) due to slightly higher interest-
adjusted benefit ratio
adjusted benefit ratio
§ Record-setting
third quarter for both Life and Med Supp sales
§ Continued
strong core sales and record agent recruiting
• 16% increase in new
agents YTD

Bankers
20
($
millions)
Quarterly Core NAP
(Excludes PFFS)
NAP-Quarterly*: $65.8 $72.8 $94.5 $69.4 $62.3
PFFS
NAP-Quarterly*: $4.6 $0.9 $34.1** $6.3 $(0.2)
*Excludes group
business not sold by Bankers agents.
**Net
of $7 million reserve for anticipated chargebacks related to sales still within
their 90-day disenrollment period.
NAP
Results
§ Core
NAP up 2% vs Q3 2008
• Strong sales of Life
(+21%) and
Med Supp (+20%), partially offset
by lower sales of Annuities (-15%)
and LTC (-14%)
Med Supp (+20%), partially offset
by lower sales of Annuities (-15%)
and LTC (-14%)
§ PFFS
YTD 2009 sales down 30%
• Changes in consumer
preferences
• Stopped selling
Coventry PFFS in
Q3 2009
Q3 2009

Q3
2009 Sales and
Distribution
Results
21
Bankers
§ Continued
growth in agent force
• Average agent count
YTD 5,186, up 10% vs. first nine months of
2008
2008
§ Branch
manager retention is strong
• Since 2004, the
annual turnover rate in our top 48 branches has
been less than 3%
been less than 3%
• Average length of
service for these top managers is 15+ years

Medicare
Advantage
22
Bankers
§ As
previously announced, Coventry is exiting PFFS business
effective 12/31/09
effective 12/31/09
• PFFS relationship
terminates; affects approximately 55,000
Bankers-sold PFFS members, partially reinsured by Bankers
Bankers-sold PFFS members, partially reinsured by Bankers
• PDP relationship
(distribution and reinsurance) remains
unchanged
unchanged
§ Coventry
policyholder progress
• Early results
indicate policyholder shift from PFFS to Med Supp;
for month of October, Med Supp sales are significantly ahead of
prior year
for month of October, Med Supp sales are significantly ahead of
prior year
§ Humana
sales begin in earnest on November 15

§ Annuity sales down
15% vs
Q3 2008
Q3 2008
§ Lower results are in
line with
overall market
overall market
§ Reduced bonus rate
to
maintain margins
maintain margins
Bankers
Annuities -
NAP*
($
millions)
23
*Calculated as 6% of
annuity deposits.
Q1
2009
$18.2
$9.0
$10.4
$18.2
$6.2
$5.0
$13.2
$6.8
$11.0
Q2
2009
$17.8
Q3
2009
$16.4
$4.8
$11.6
Annuity
Sales
Annuity
Surrenders
24
Bankers
IA
Surrenders
(annualized
quarterly rate)
Non-IA
Surrenders
(annualized
quarterly rate)
§ Both
indexed and non-indexed
annuity surrenders lower than
prior year
annuity surrenders lower than
prior year
§ Total
account value:
• IAs - $1.5
billion
• Non-IAs - $4.7
billion
§ Average
account value:
• IAs -
$41,000
• Non-IAs -
$36,000
§ Over
89% of our annuities are
still in surrender charge period:
still in surrender charge period:
• IAs -
95%
• Non-IAs -
87%

LTC
Update
25
Bankers
§ Rate
increase filings ahead of schedule (2008 round - policies
issued prior to 2002); expect to exceed original filing goals
issued prior to 2002); expect to exceed original filing goals
• Completed filing of
$102.5 million of rate increases
• As of
9/30/09:
• Approvals = $77.4
million, 109% of original goal
• Projected financial
impact = $58.1 million, 109% of original goal
§ Continued
focus on claims management/underwriting
§ New
products (as of 9/30/09)
• LTC/Annuity Combo
product launched in 31 states
• LTC product revision
launched in 19 states, with rates reflecting
current claim experience and in line with target profit margins
current claim experience and in line with target profit margins
Q3
Earnings
26
Bankers
($
millions)
Trailing
4 Quarter Operating Return on Equity: 10.0%
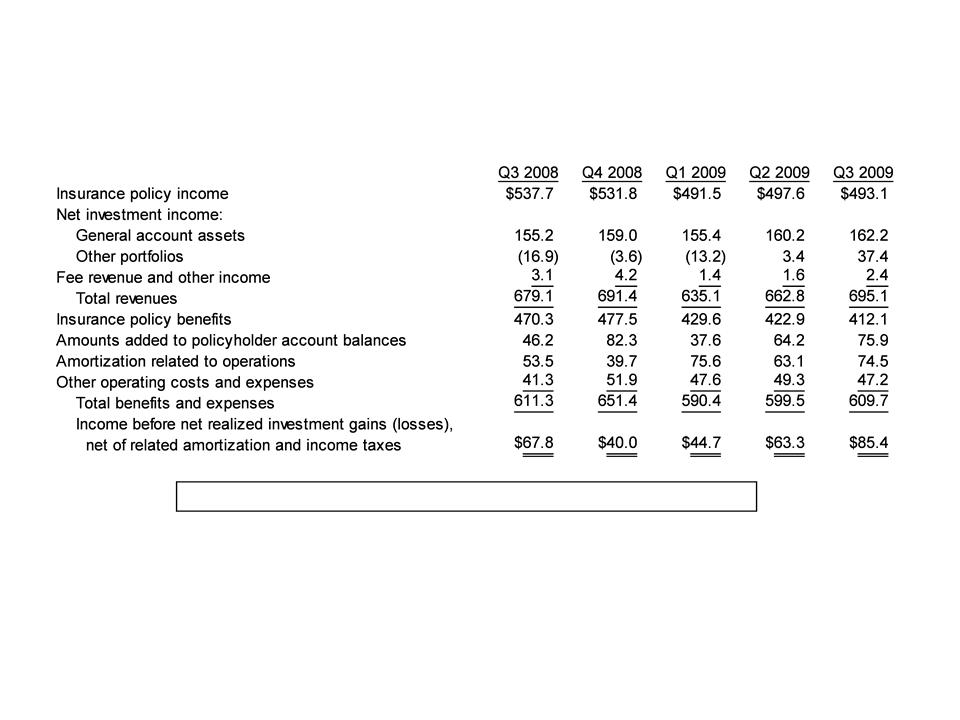
Management believes
that an analysis of income (loss) before net realized investment gains (losses),
net of
related amortization (a non-GAAP financial measure), is important to evaluate the financial performance of
our business, and is a measure commonly used in the life insurance industry. Management uses this
measure to evaluate performance because realized gains or losses can be affected by events that are
unrelated to a company’s underlying fundamentals. The table on Page 11 reconciles the non-GAAP measure
to the corresponding GAAP measure. See Appendix for a reconciliation of the return on equity measure to
the corresponding GAAP measure.

Q3
Summary
27
Colonial
Penn
§ Earnings
of $7.4 million, up 14% over Q3 2008
• Increase primarily
driven by margin growth
§ Life
sales of $10.6 million, down 12% from Q3 2008
• Consistent with
reduced marketing spend as part of our capital
management efforts
management efforts
• Q3 2009 marketing
costs associated with lead-based advertising
and related fulfillment costs were reduced by $5.3 million (45%)
from Q3 2008
and related fulfillment costs were reduced by $5.3 million (45%)
from Q3 2008
§ YTD
campaign productivity remains consistent with
expectations

Q3
Earnings
28
Colonial
Penn
($
millions)
Trailing
4 Quarter Operating Return on Equity: 14.9%
Management believes
that an analysis of income (loss) before net realized investment gains (losses),
net of
related amortization (a non-GAAP financial measure), is important to evaluate the financial performance of
our business, and is a measure commonly used in the life insurance industry. Management uses this
measure to evaluate performance because realized gains or losses can be affected by events that are
unrelated to a company’s underlying fundamentals. The table on Page 11 reconciles the non-GAAP measure
to the corresponding GAAP measure. See Appendix for a reconciliation of the return on equity measure to
the corresponding GAAP measure.
related amortization (a non-GAAP financial measure), is important to evaluate the financial performance of
our business, and is a measure commonly used in the life insurance industry. Management uses this
measure to evaluate performance because realized gains or losses can be affected by events that are
unrelated to a company’s underlying fundamentals. The table on Page 11 reconciles the non-GAAP measure
to the corresponding GAAP measure. See Appendix for a reconciliation of the return on equity measure to
the corresponding GAAP measure.

Q3
Summary
29
CIG
§ Earnings
of $21.6 million, down 37% vs Q3 2008:
• Additional Universal
Life amortization expense
• Higher expenses
related to litigation settlements
§ NAP
of $20.3 million, up 7% vs Q3 2008
• Turning around three
consecutive quarters of negative sales
comparisons
comparisons
§ Continued
strong sales growth in Specified Disease products
and strong agent recruiting
and strong agent recruiting

CIG
($
millions)
§ Specified
Disease sales up 26% over Q3 2008
§ Worksite
sales continue strong momentum,
up 11% YTD
up 11% YTD
§ Strong
recruiting results in Q3 2009
§ Decrease
in Annuity sales, as expected, due
to shift in focus to Specified Disease and
Worksite sales
to shift in focus to Specified Disease and
Worksite sales
Q3
2008
Q3
2009
Q3
2009 Sales and
Distribution
Results
Annuity
Surrenders
31
CIG
IA
Surrenders
(annualized
quarterly rate)
Non-IA
Surrenders
(annualized
quarterly rate)
*Statistics based on
account value and GAAP reserves.
§ IA
surrenders down significantly
from Q2 2009
from Q2 2009
§ Non-IA
surrenders stable
§ Total
account value:
• IAs - $732
million
• Non-IAs - $370
million
§ Average
account value:*
• IAs -
$44,400
• Non-IAs -
$21,100
§ 65%
of our annuities are still in
surrender charge period:*
surrender charge period:*
• IAs -
99%
• Non-IAs -
34%

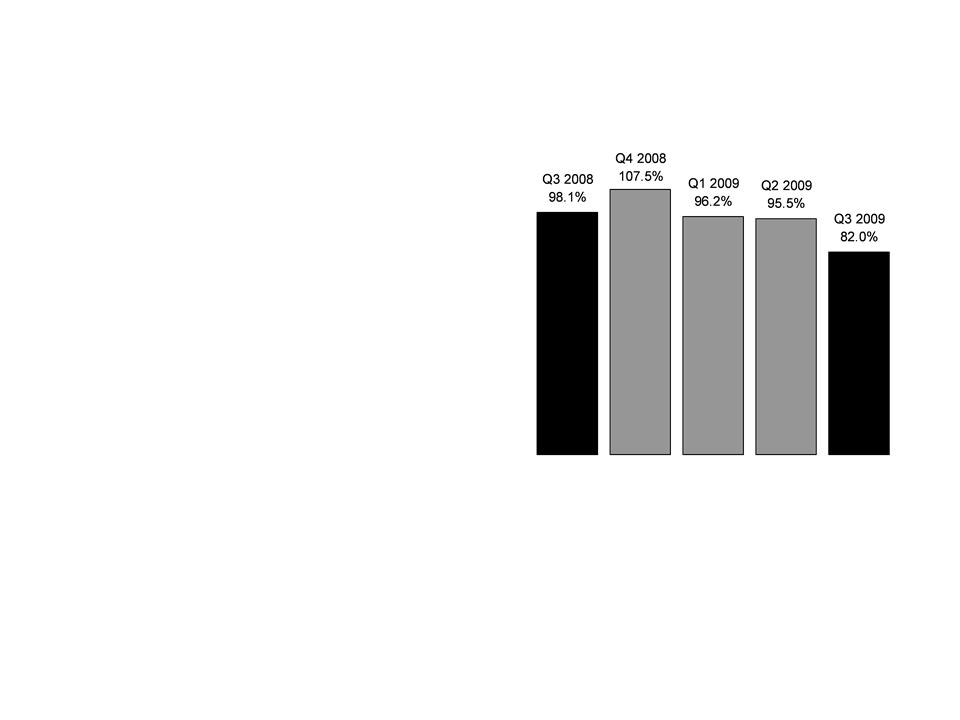
Q3
Earnings
32
CIG
Management believes
that an analysis of income (loss) before net realized investment gains (losses),
net of
related amortization (a non-GAAP financial measure), is important to evaluate the financial performance of
our business, and is a measure commonly used in the life insurance industry. Management uses this
measure to evaluate performance because realized gains or losses can be affected by events that are
unrelated to a company’s underlying fundamentals. The table on Page 11 reconciles the non-GAAP measure
to the corresponding GAAP measure. See Appendix for a reconciliation of the return on equity measure to
the corresponding GAAP measure.
related amortization (a non-GAAP financial measure), is important to evaluate the financial performance of
our business, and is a measure commonly used in the life insurance industry. Management uses this
measure to evaluate performance because realized gains or losses can be affected by events that are
unrelated to a company’s underlying fundamentals. The table on Page 11 reconciles the non-GAAP measure
to the corresponding GAAP measure. See Appendix for a reconciliation of the return on equity measure to
the corresponding GAAP measure.
($
millions)
Trailing
4 Quarter Operating Return on Equity: 2.2%

Net
Investment Income
33
CNO
($
millions)
General
Account Investment Income
|
Yield:
|
5.82%
|
5.93%
|
5.67%
|
5.65%
|
5.63%
|
§ Decreases
in 2009 primarily
due to lower new money rates
and increase in cash and short-
term investment balances
compared to prior periods
due to lower new money rates
and increase in cash and short-
term investment balances
compared to prior periods

Q3
2009
Net Realized Losses
Net Realized Losses
34
CNO
Gains
on sales
Losses
on sales
Losses
due to recognition of other-
than-temporary
impairments
Amortization
adjustment to insurance
intangibles
Net
investment losses before tax
Tax
benefit
Increase to tax
valuation allowance
Net
investment losses after tax
($
millions)
-
-
$(126.7)
18.7
(108.0)
(38.8)
-
$(69.2)
$99.5
(84.1)
(162.4)
20.1
(126.9)
(45.5)
6.7
$(88.1)
$99.5
(84.1)
(35.7)
1.4
(18.9)
(6.7)
6.7
$(18.9)
Gross
Amounts
Amount
Recognized
through Accumulated
Other Comprehensive
Loss
through Accumulated
Other Comprehensive
Loss
Amount
Recognized
through Net Income
through Net Income

Q3
2009 Impairment Losses
35
CNO
IG
Corporates
Alt-A
ABS
Prime
Jumbos
Commercial Mortgage
Loans
Other
Total
($
millions)
Gross
Amounts
Amount
Recognized
through Accumulated
Other Comprehensive
Income
through Accumulated
Other Comprehensive
Income
Amount
Recognized
through Net Income
through Net Income
$5.5
35.0
14.5
88.3
12.3
6.8
$162.4
$0.0
29.9
12.7
84.1
0.0
0.0
$126.7
$5.5
5.1
1.8
4.2
12.3
6.8
$35.7

Asset
Allocation at 9/30/09*
36
CNO
($
millions)
*Excludes
investments from a variable interest entity which we consolidate under GAAP (the
related liabilities are
non-recourse to Conseco).
non-recourse to Conseco).

Investment
Quality:
Fixed
Maturities*
37
CNO
Actively Managed
Fixed Maturities by Rating at
9/30/09 (Market Value)
9/30/09 (Market Value)
|
%
of Bonds which are Investment Grade:
|
9/30/08
93%
|
12/31/08
92%
|
3/31/08
91%
|
6/30/09
91%
|
9/30/09
93%
|
*Excludes
investments from a variable interest entity which we consolidate under GAAP (the
related liabilities are
non-recourse to Conseco).
non-recourse to Conseco).
AAA
13%
AA
6%
A
31%
BBB
43%
7%
§ Investment-grade
bonds at 93%:

Impact
of Downgrades
on
BIG Ratio*
38
CNO
*Actively managed
fixed maturities (market value).

Q3
2009 Downgrades from Investment
Grade to Below Investment Grade
Grade to Below Investment Grade
39
CNO
IG
Corporates
Alt-A
Prime
Jumbo
CMBS
Other
Total
($
millions)
$41.5
9.9
61.1
4.9
52.7
$170.1
7
1
4
2
13
27
(0.7%)
(0.6%)
(0.9%)
(0.1%)
(0.9%)
(3.2%)
Type
Statutory
Book
Value
Value
#
Issues
Effect
of
Downgrades on
Downgrades on
RBC
Ratio*
*Includes estimated
effect of covariance and tax.
RBC
Impact of Downgrades
40
CNO
$753
million
downgraded
$997
million
downgraded
$680
million
downgraded
$825
million
downgraded
§ Ratings downgrades
have resulted in a decrease to our RBC ratio of 50
percentage points over the last four quarters.
percentage points over the last four quarters.
§ Ratings
downgrades
have been significant
have been significant

Alt-A
at 9/30/09
CNO
41
AA
BBB
Total
$13.2
$44.5
$143.4
$201.1
$17.5
$49.1
$193.8
$260.4
6.6%
22.1%
71.3%
100.00%
0.06%
0.21%
0.66%
0.93%
Market
Value
(mil.)
Book
Value
(mil.)
%
of
Alt-A*
%
of
Portfolio*
Rating
§ Allocation reduced
by 46% (book value) from 12/31/08 to 9/30/09
§ No exposure to
“affordability products” - option ARMs, hybrid, neg-ams
§ While delinquencies
are higher than anticipated, collateral performing better than
overall Alt-A market in terms of average delinquency and accumulated loss
overall Alt-A market in terms of average delinquency and accumulated loss
§ Adequate credit
support inherent in structures relative to expected cumulative losses
and recoverability of book values
and recoverability of book values
693
733
710
714
Avg.
FICO
FICO
14.0%
8.2%
10.1%
9.9%
Avg.
Support
9.4%
6.6%
18.9%
15.5%
Avg.
60+
Delinq.
*Market
value.
($
millions)
1.45%
0.50%
1.46%
1.25%
Avg.
Accum.
Loss

Prime
Jumbo at 9/30/09
CNO
42
AAA
AA
A
BBB
Total
$223.8
$59.3
$76.8
$164.2
$197.0
$721.1
$247.0
$64.2
$100.3
$198.4
$314.1
$924.0
31.0%
8.2%
10.7%
22.8%
27.3%
100.00%
1.04%
0.27%
0.35%
0.76%
0.91%
3.34%
Market
Value
(mil.)
Book
Value
(mil.)
%
of
Prime
Jumbo*
Jumbo*
%
of
Portfolio*
Rating
§ 73% investment
grade
§ 3.3% of total
invested assets
§ 46 securitizations -
highly diversified
736
741
744
741
739
739
Avg.
FICO
FICO
7.9%
4.4%
4.8%
5.8%
7.9%
6.5%
Avg.
Support
1.4%
2.1%
3.4%
5.2%
9.2%
4.7%
Avg.
60+
Delinq.
*Market
value.
($
millions)
0.03%
0.11%
0.08%
0.36%
0.59%
0.27%
Avg.
Accum.
Loss
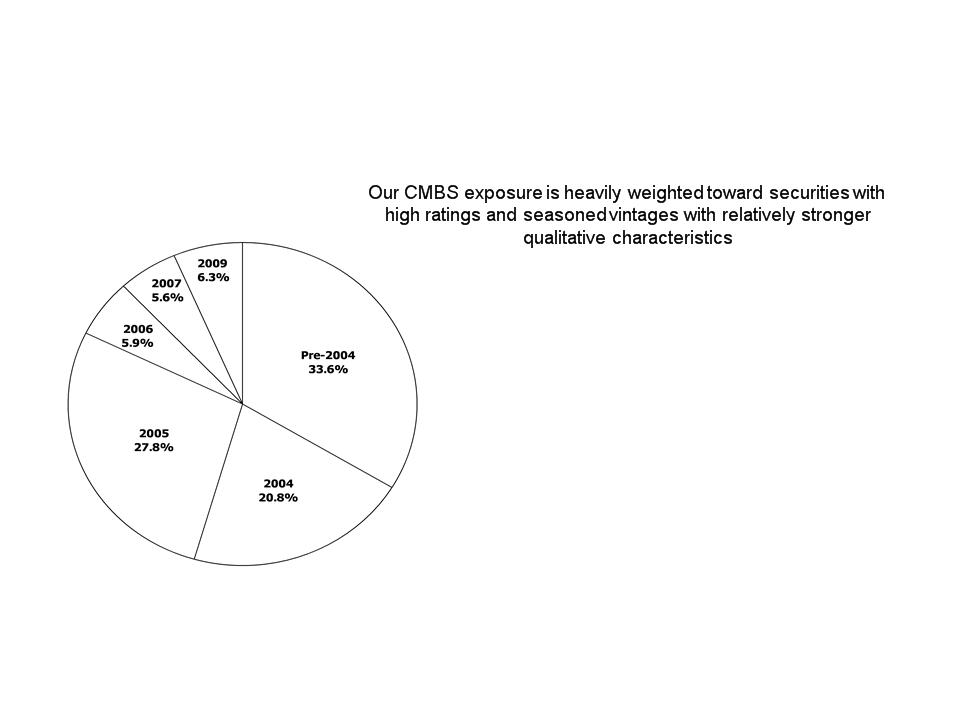
CMBS
by Vintage at 9/30/09
43
CNO
(GAAP
book value - $ millions)
$194.5
$136.0
$138.0
$0.0
$47.0
$53.1
$568.6
$556.1
$34.2
$8.8
$0.0
$14.7
$0.0
$0.0
$57.7
$45.0
$48.2
$13.1
$23.1
$15.6
$0.0
$0.0
$100.0
$60.3
$6.0
$17.2
$69.8
$15.0
$0.0
$0.0
$108.0
$36.8
$0.0
$0.0
$3.0
$3.8
$0.0
$0.0
$6.8
$1.6
Pre-2004
2004
2005
2006
2007
2009
Total
BV
Total
MV
AAA
AA
A
BBB

CMBS
at 9/30/09
CNO
44
AAA
AA
A
BBB
Total
$556.1
$45.0
$60.3
$36.8
$1.6
$699.8
$568.6
$57.7
$100.0
$108.0
$6.8
$841.1
79.5%
6.4%
8.6%
5.3%
0.2%
100.0%
2.57%
0.21%
0.28%
0.17%
0.01%
3.24%
Market
Value
(mil.)
Book
Value
(mil.)
%
of
CMBS*
%
of
Portfolio*
Rating
§ Collateral
performing materially better than overall CMBS market in terms of delinquency
and
cumulative loss
cumulative loss
§ Substantial credit
support inherent in structures relative to expected cumulative
losses
29.7%
22.8%
11.6%
8.6%
6.1%
26.6%
Avg.
Support
1.5%
0.8%
1.3%
1.2%
1.4%
1.4%
Avg.
60+
Del.
& FCR
*% of
market value
($
millions)
0.41%
0.07%
0.12%
0.03%
0.00%
0.34%
Avg.
Cum.
Loss

Commercial
Mortgage Loans
at
9/30/09
By
Vintage
45
CNO
§ Current LTV of
approximately 63.9%
§ Trailing debt
service coverage ratio stable relative to underwritten levels of approximately
1.55
§ Emphasis on reducing
overall allocation via prepayments, etc.

CNO
Summary
46
CNO
§ Third
consecutive quarter of net income
§ Core
sales and agent recruitment continue to improve in declining
market
market
§ Recapitalization
addresses the company’s most pressing financial
priority
priority
• Refinances the 3.5%
convertible debentures
• Structured to
protect the NOLs
• Demonstrates
investor confidence in Conseco
§ Capital
and risk management remain top priorities
• Continue to evaluate
reinsurance opportunities
• Insurance company
merger anticipated in Q1 2010
§ Favorable
target market demographics

47
Questions
and Answers

48
Appendix

Ø Agreement to sell
common stock and issue warrants
to Paulson & Co.
to Paulson & Co.
Ø 16.4MM
shares
Ø 5 million warrants
with a $6.50 exercise
price expiring on 12/30/2016 and not
exercisable until 6/30/2013
price expiring on 12/30/2016 and not
exercisable until 6/30/2013
Ø Aggregate purchase
price of $78MM
Ø Closing upon first
settlement date for new
Convertible Debentures
Convertible Debentures
Ø Refinances $293
million 3.50% convertible
debentures puttable to Conseco on 9/30/2010
debentures puttable to Conseco on 9/30/2010
Ø Preserves
flexibility to raise common equity to
strengthen capital and reduce outstanding senior
secured debt
strengthen capital and reduce outstanding senior
secured debt
Ø Announced intention
to file registration
statement with respect to $200 million of
common equity in the near future
statement with respect to $200 million of
common equity in the near future
Ø Enhances the
Company’s liquidity and capital
positions
positions
Ø Demonstrates
investor confidence in Conseco
Transaction
Highlights
Sale
of Common Stock and Warrants
|
Cash
Tender Offer of Convertible Debenture
|
|
|
For “Any and
All” of 3.50% convertible debenture due 9/30/2035
|
|
|
Tender
Price
|
100% par +
accrued and unpaid interest
|
|
Launch
Date
|
10/15/2009
|
|
Expiration
|
11/12/09
|
|
Financing
|
New convertible
debentures and sale of common stock and
warrants to be issued simultaneously with closing of tender offer |
|
Convertible
Debentures
|
|
|
Total
Issuance
|
Up
to $293MM
|
|
Coupon
|
7.0%
|
|
Conversion
Price
|
$5.49
|
|
Maturity
Date
|
12/30/2016
|
|
Convertibility
|
Non-convertible
until on or after 6/30/2013
|
|
Call
Protection
|
Non-call life;
conversion feature terminable at company’s option at
any time on or after 6/30/2013 if stock trades at or above 140% of the conversion price for at least 20 trading days in a 30 consecutive trading day period |
|
Ranking
|
Senior
unsecured
|
|
Settlement:
|
In
whole or in part based upon success of one or more tender offers
and put or call of outstanding $293MM convertible debentures |
|
Forward
Purchase Commitment
|
|
|
Escrow
|
Purchase price
pre-funded into segregated deposit accounts at Bank
of New York Mellon |
|
Yield
|
7%
annual return on the proceeds in the deposit account provided in
form of discount from par when the Convertible Debentures are issued |
|
Maturity
|
No
later than 10/5/2010
|
CNO
49
Recapitalization
Summary

50
CNO
§ Plan
to file a registration statement with the SEC relating to a
proposed registered offering of common stock
proposed registered offering of common stock
§ Will
use reasonable best efforts to consummate the proposed
registered offering no later than 120 days after the settlement
of the cash tender offer (expected to be by 3/31/10)
registered offering no later than 120 days after the settlement
of the cash tender offer (expected to be by 3/31/10)
§ Required
to use half of net proceeds to pay down
indebtedness under the credit agreement
indebtedness under the credit agreement
§ Remaining
net proceeds would be used for general corporate
purposes
purposes
Proposed
Registered Offering of
Common Stock
Common Stock

Key
Debt Covenants
51
CNO
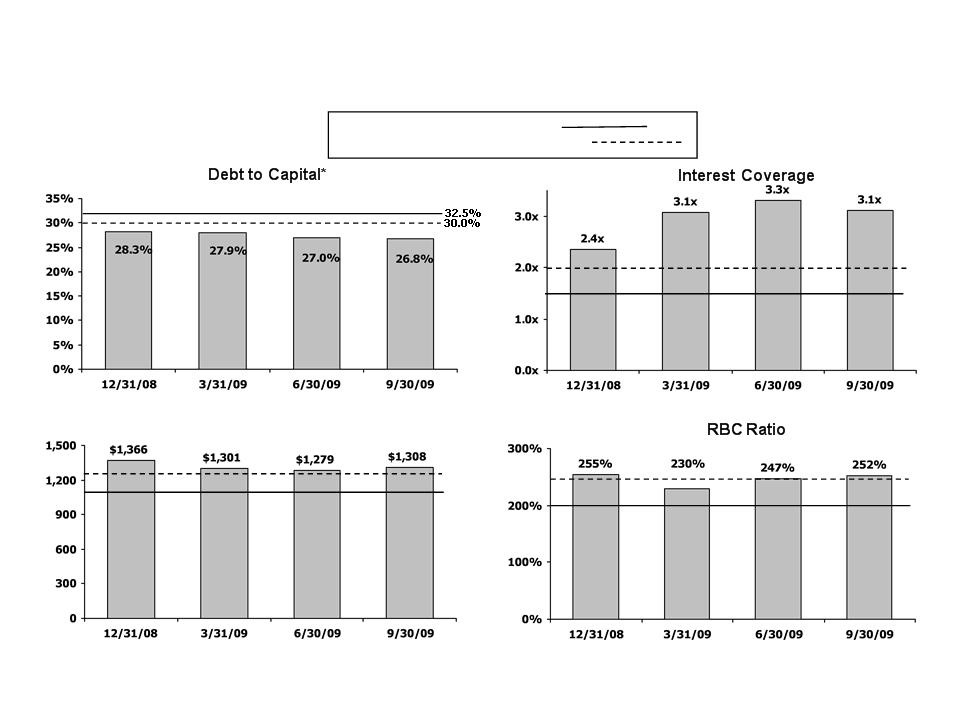
*Reflects
impact of modification to the covenants which are applicable from March 31, 2009
through June 30,
2010. Effective
with the third quarter of 2010, the covenant margins return to Q4 2008
levels.
**Calculated per
bank covenants; excludes Accumulated Other Comprehensive Loss.
($
millions)
Debt/Capital
Ratio**
Covenant
Maximum
Actual
Interest
Coverage
Covenant
Minimum
Actual
Statutory
Capital
Covenant
Minimum
Actual
RBC
Ratio
Covenant
Minimum
Actual
Q2
2009
Covenant
Margins as of 9/30/09*
Reduction to
statutory capital and
surplus of approximately $269
million, or an increase to the risk-
based capital of approximately
$134 million.
surplus of approximately $269
million, or an increase to the risk-
based capital of approximately
$134 million.
Reduction to
combined statutory
capital and surplus of
approximately $208 million.
capital and surplus of
approximately $208 million.
Reduction in cash
flows to the
holding company of
approximately $101 million.
holding company of
approximately $101 million.
Reduction to
shareholders’ equity of
approximately $831 million or
additional debt of $400 million.
approximately $831 million or
additional debt of $400 million.
Q4
2008
30.0%
28.3%
2.00X
2.35X
$1,270
$1,366
250%
255%
Q1
2009
32.5%
27.9%
1.50X
3.07X
$1,100
$1,301
200%
230%
32.5%
27.0%
1.50X
3.31X
$1,100
$1,279
200%
247%
Q3
2009
32.5%
26.8%
1.50X
3.12X
$1,100
$1,308
200%
252%

Book
Value Per Share*
52
CNO
*Book
value excludes accumulated other comprehensive income (loss). See Appendix for
corresponding GAAP
measure.
measure.
§ Increase
from Q2 2009 due to
Q3 2009 net income
Q3 2009 net income

Commercial
Mortgage Loans
at
9/30/09
Geographic
Distribution
53
CNO
Pacific
8.6%
Mountain
9.5%
West
North
Central
Central
12.7%
West
South
Central
Central
5.7%
East
North
Central
Central
22.0%
East
South
Central
Central
5.3%
New
England
8.7%
Middle
Atlantic
Atlantic
6.3%
South
Atlantic
Atlantic
21.2%

Commercial
Mortgage Loans
at
9/30/09
By
Maturity
54
CNO
($
millions)

Expenses
55
CNO
($
millions)
Adjusted Operating
Expenses*
*Adjusted operating
expenses exclude primarily acquisition costs, capitalization of software
development
costs, initial PFFS marketing costs and contractual vacancy charges related to exiting the Merchandise Mart
in Chicago. This measure is used by the Company to evaluate its progress in reducing operating expenses.
Expenses have been restated for all periods to reflect the SHIP separation.
costs, initial PFFS marketing costs and contractual vacancy charges related to exiting the Merchandise Mart
in Chicago. This measure is used by the Company to evaluate its progress in reducing operating expenses.
Expenses have been restated for all periods to reflect the SHIP separation.
§ Approximately $20
million in savings
from back-office consolidation
realized in 2007 and 2008; remaining
$5 million expected in 2009
from back-office consolidation
realized in 2007 and 2008; remaining
$5 million expected in 2009
§ Q3 2009 reflects
leveling off to more
stable level following quarter of high
taxes and insurance and premium
tax payments, and reduction of
consulting expense
stable level following quarter of high
taxes and insurance and premium
tax payments, and reduction of
consulting expense

Segment
Performance
56
Bankers
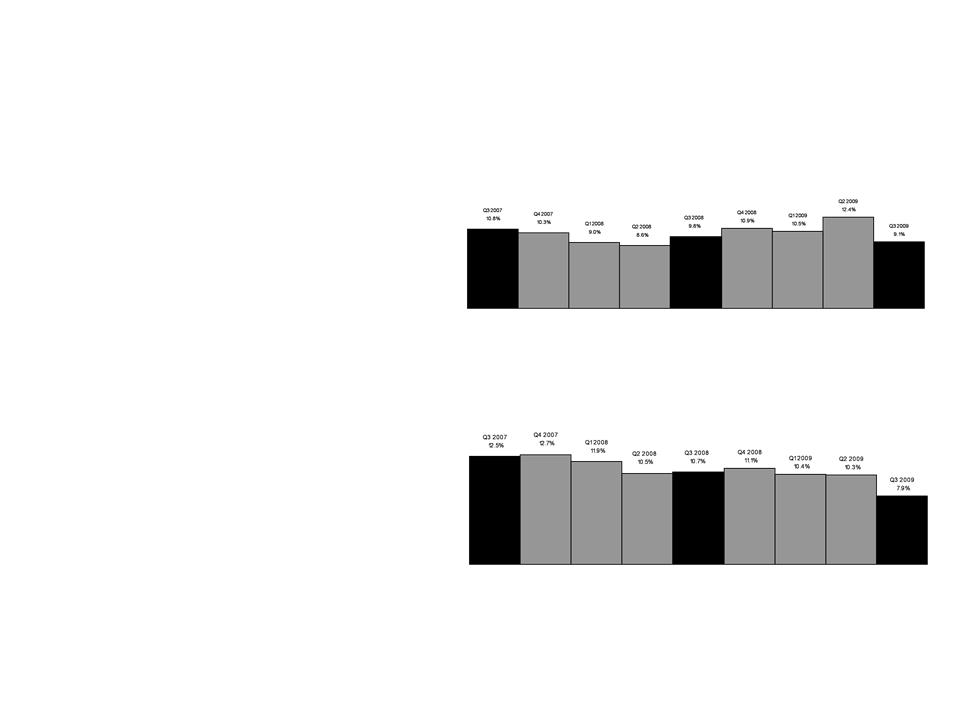
*Operating earnings
exclude net realized gains (losses). See
Appendix for corresponding GAAP measure of
our consolidated results of operations.
our consolidated results of operations.
PTOI-Trailing 4
Quarters: $189.8 $171.5 $187.1 $215.8 $233.4
Revenues-Quarterly: $679.1 $691.4 $635.1 $662.8 $695.1
Pre-Tax
Operating Income*
Revenues -Tr. 4
Quarters: $2,594.5 $2,679.1 $2,686.3 $2,668.4 $2,684.4
($
millions)
§ Earnings
up 26% vs Q3 2008,
positively affected by:
positively affected by:
• Higher PFFS/PDP
income
• Increase in
COLI
§ Offset
by lower LTC margins

Premiums
-
Medicare
Supplement
57
Bankers
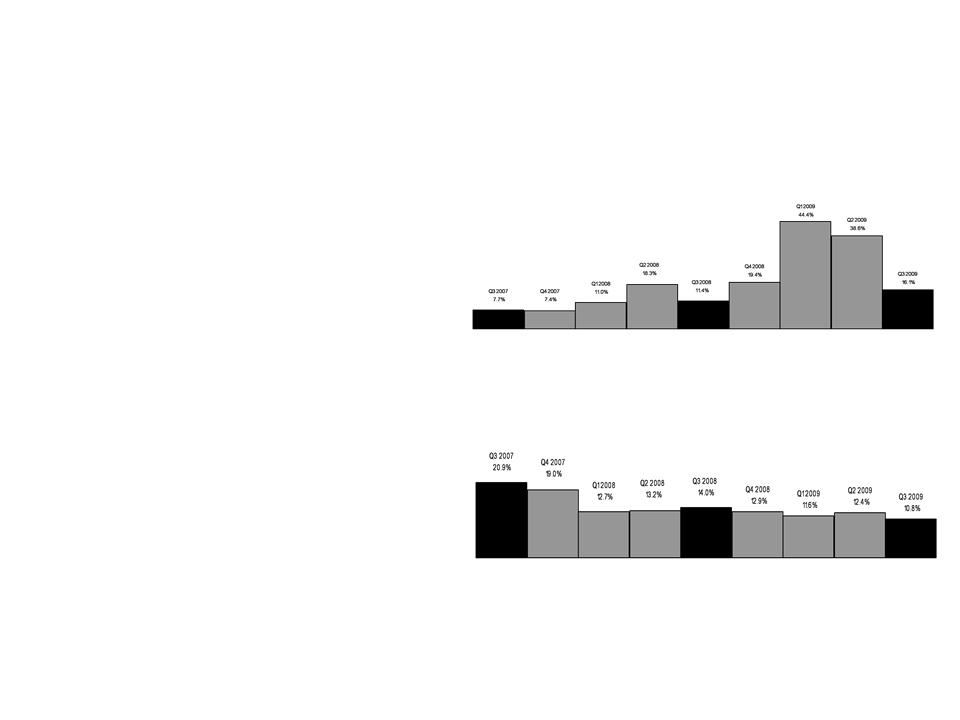
§ First-year
premiums up 15%
vs Q3 2008
vs Q3 2008
Med.
Supp. First-Year Prems.-Tr. 4 Qtrs: $79.3 $81.3 $81.9 $83.6 $86.5
Med.
Supp. Total Premiums-Quarterly: $153.8 $172.3 $155.8 $155.2 $168.9
Med.
Supp. NAP-Quarterly: $16.6 $27.9 $18.4 $19.2 $19.9
Med.
Supp. NAP-Trailing 4 Quarters: $73.7 $78.6 $79.9 $82.1 $85.4
($
millions)
Premiums
-
Long-Term
Care
58
Bankers
($
millions)
First-Year
Prems.-Tr. 4 Qtrs: $43.9 $42.7 $35.9 $30.0 $22.1
Total
Premiums-Quarterly: $154.8 $159.1 $145.9 $151.9 $154.3
Long-Term Care -
First-Year Premiums*
NAP-Quarterly: $11.4 $7.9 $7.5 $9.8 $9.8
NAP-Trailing 4
Quarters: $42.3 $39.4 $37.5 $36.6 $35.0
*Includes $4.4
million in both Q1 2009 and Q2 2009 and $6.6 million in Q3 2009 of premiums
ceded
under
new business reinsurance agreement.
Q2
2009
(Direct)
$9.1
Q1
2009
(Direct)
$8.6
Q3
2009
(Direct)
$9.5
§ Quarterly
first-year premium
declines due to new business
reinsurance
declines due to new business
reinsurance
§ NAP
decline attributable to three
main factors:
main factors:
• Overall industry
sales decline
• Agent force shift
toward other products
• Tightened
underwriting

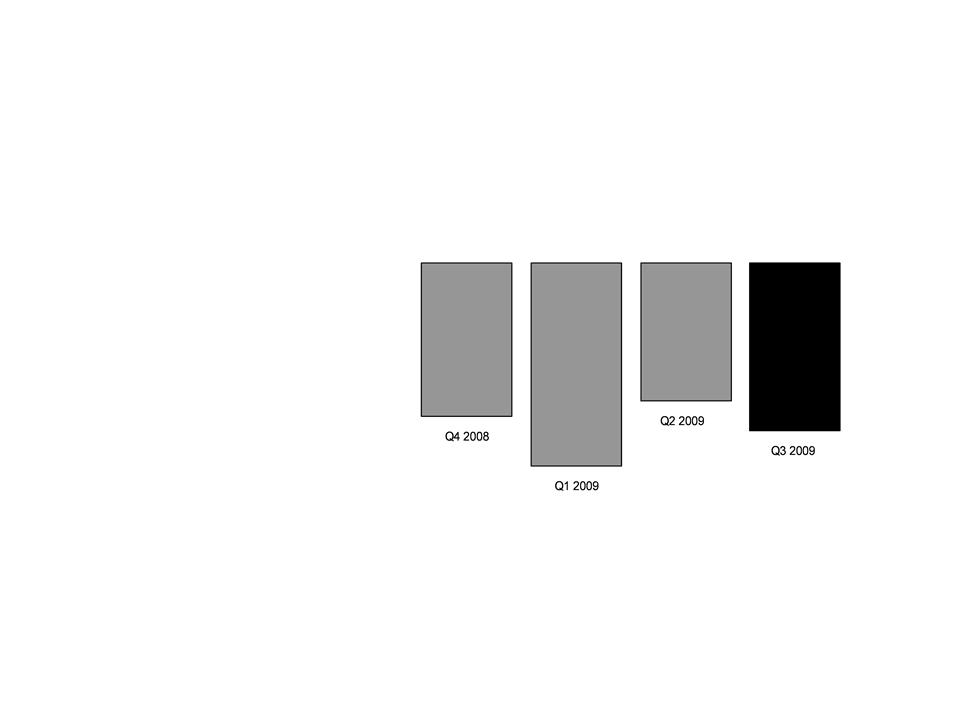
Premiums
-
Life
Insurance
59
Bankers
($
millions)
First-Year
Prems.-Tr. 4 Qtrs: $81.8 $80.7 $79.0 $75.9 $79.8
Total
Premiums-Quarterly: $51.9 $55.7 $48.9 $55.3 $63.2
Life -
First-Year Premiums
NAP-Quarterly: $13.1 $11.4 $12.6 $15.6 $15.8
NAP-Trailing 4
Quarters: $53.6 $51.9 $52.8 $52.7 $55.4
SPWL
Non-
SPWL
$7.5
$12.0
Q3
2008
$19.5
Q4
2008
$20.2
$8.2
$12.0
Q1
2009
$16.8
$6.2
$10.6
Q2
2009
$19.4
$7.8
$11.6
Q3
2009
$23.4
$10.5
$12.9
§ Fluctuations
in first-year
premiums primarily reflect
variance in sales of single-
premium policies
premiums primarily reflect
variance in sales of single-
premium policies
§ Non-SPWL
premiums up 8%
vs Q3 2008
vs Q3 2008

Premiums
-
Annuity
60
Bankers
($
millions)
First-Year
Prems.-Tr. 4 Qtrs: $1,031.3 $1,220.6 $1,294.1 $1,308.7 $1,270.3
Total
Premiums-Quarterly: $323.1 $411.2 $302.1 $275.4 $284.7
Annuity
- First-Year Premiums
§ Annuity
first-year premiums
down 12% from Q3 2008
down 12% from Q3 2008
Benefit
Ratio* - PDP
61
Bankers
*We
calculate benefit ratios by dividing insurance policy benefits by insurance
policy income.
§ Down
16% vs Q3 2008
§ Impacted
by mid-year premium
sweeps and favorable claims
experience
sweeps and favorable claims
experience
Benefit
Ratio* -
PFFS
Individual Business
62
Bankers
*We
calculate benefit ratios by dividing insurance policy benefits by insurance
policy income.
§ Comparison
vs Q3 2008
impacted by premium sweeps
and favorable IBNR development
impacted by premium sweeps
and favorable IBNR development

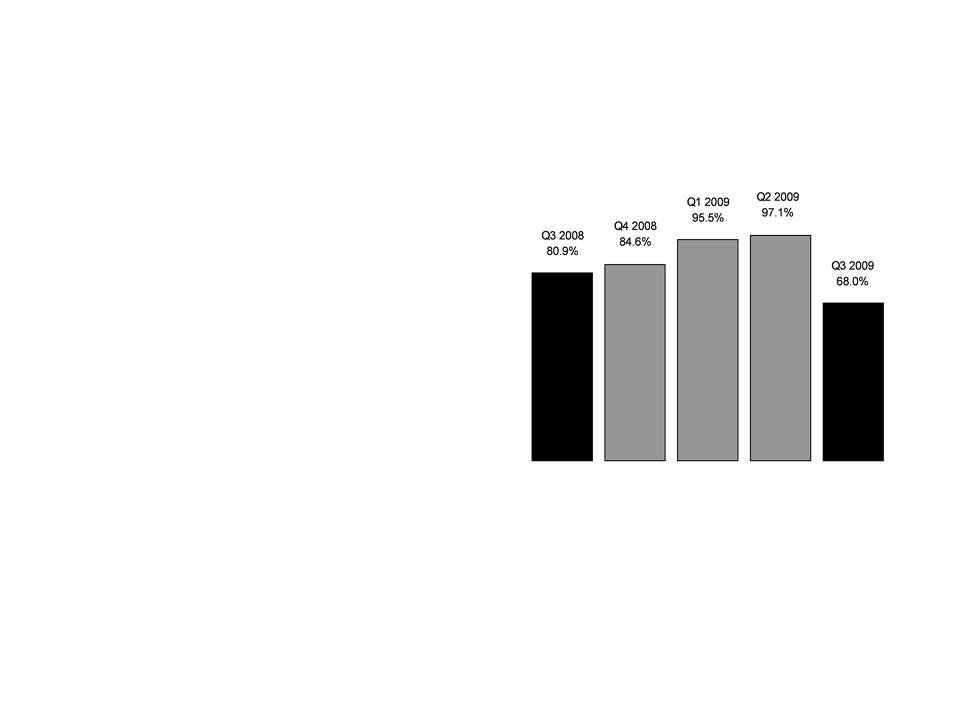
Interest-Adjusted
Benefit Ratio* -
Long
Term Care
63
Bankers
*We
calculate interest-adjusted benefit ratios by dividing insurance policy benefits
less interest income on
the accumulated assets backing the insurance liabilities by insurance policy income.
the accumulated assets backing the insurance liabilities by insurance policy income.
Trailing 4 Quarter
Avg.: 74.9% 74.0% 71.4% 67.6% 68.2%
Qtrly.
non-int. adjusted: 102.1% 102.2% 105.1% 103.2% 108.3%
§ Q3
2009 positively impacted by
continued stabilization of
incurred claims and excess
terminations
continued stabilization of
incurred claims and excess
terminations

Segment
Performance
64
Colonial
Penn
*Operating earnings
exclude net realized gains (losses). See
Appendix for corresponding GAAP measure of
our consolidated results of operations.
our consolidated results of operations.
PTOI-Trailing 4
Quarters: $18.3 $25.2 $26.6 $29.3 $30.2
Revenues-Quarterly: $57.0 $57.2 $57.1 $62.7 $58.1
Pre-Tax
Operating Income*
Revenues -Tr. 4
Quarters: $213.3 $226.2 $229.4 $234.0 $235.1
($
millions)
§ Q3
2008 to Q3 2009 change affected by
margin growth
margin growth
§ Q2
2009 to Q3 2009 change affected by:
• Lower margin from
non-recurring
reinsurance pool termination in Q2 2009
reinsurance pool termination in Q2 2009
• Lower margin due to
seasonality
• Higher amortization
charges

Premiums
-
Life
Insurance
65
Colonial
Penn
($
millions)
First-Year
Prems.-Tr. 4 Qtrs: $33.7 $35.0 $35.8 $35.3 $34.4
Total
Premiums-Quarterly: $43.6 $43.8 $47.0 $45.8 $45.6
Life -
First-Year Premiums
NAP-Quarterly: $12.1 $10.8 $12.3 $10.6 $10.6
NAP-Trailing 4
Quarters: $48.6 $50.1 $49.7 $45.8 $44.3
§ NAP:
• Quarterly and
trailing four quarters
consistent with expectations arising
from capital management
consistent with expectations arising
from capital management
§ Premium:
• First-year premium
trending lower due
to capital management
to capital management

Segment
Performance
66
CIG
*Operating earnings
exclude net realized gains (losses). See Appendix for corresponding GAAP
measure
of our consolidated results of operations.
of our consolidated results of operations.
PTOI-Trailing 4
Quarters: $99.4 $121.3 $129.2 $118.1 $105.5
Revenues-Quarterly: $371.8 $382.4 $379.2 $382.5 $381.2
Pre-Tax
Operating Income*
Revenues-Tr. 4
Quarters: $1,511.3 $1,513.1 $1,511.7 $1,515.9 $1,525.3
($
millions)
§ Lower
Universal Life results
primarily due to additional
amortization expense
primarily due to additional
amortization expense
§ Higher
expenses related to
litigation settlements
litigation settlements
Premiums
-
Medicare
Supplement
67
($
millions)
First-Year
Prems.-Tr. 4 Qtrs: $10.6 $9.6 $8.3 $7.9 $8.0
Total
Premiums-Quarterly: $48.5 $52.6 $42.8 $44.4 $46.9
Medicare
Supplement -
First-Year Premiums
NAP-Quarterly: $1.8 $3.5 $1.7 $1.3 $1.3
NAP-Trailing 4
Quarters: $8.9 $8.9 $8.3 $8.3 $7.8
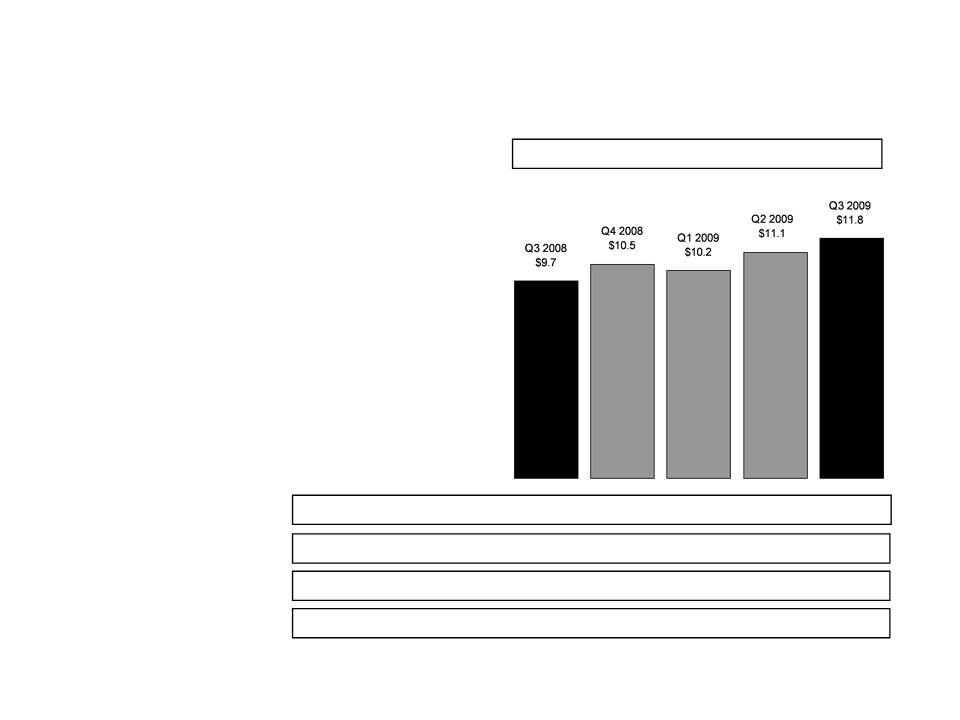
Premiums
-
Specified
Disease
68
CIG
($
millions)
First-Year
Prems.-Tr. 4 Qtrs: $37.6 $39.4 $40.2 $41.5 $43.6
Total
Premiums-Quarterly: $92.3 $95.6 $93.0 $95.1 $96.2
Specified
Disease -
First-Year Premiums
NAP-Quarterly: $12.8 $12.0 $11.5 $14.7 $16.1
NAP-Trailing 4
Quarters: $46.1 $46.8 $48.7 $51.0 $54.3
§ NAP
up 26% from Q3 2008:
• Increased PMA focus
on
Specified Disease products
Specified Disease products
• Increased
recruitment of Health
IMOs
IMOs
• Momentum increasing
in
Worksite market
Worksite market

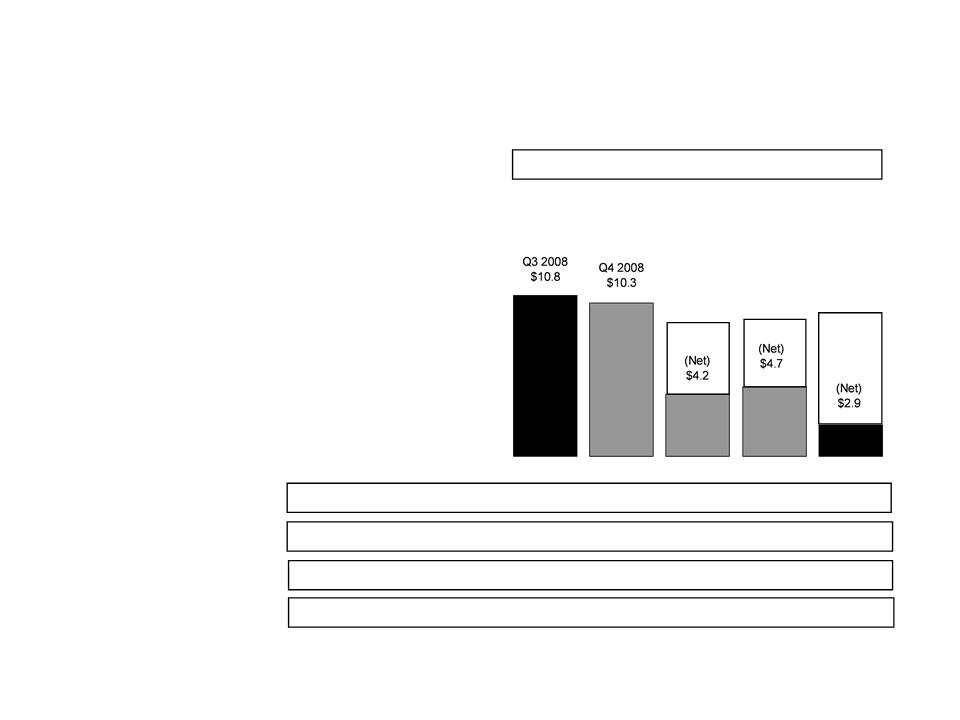
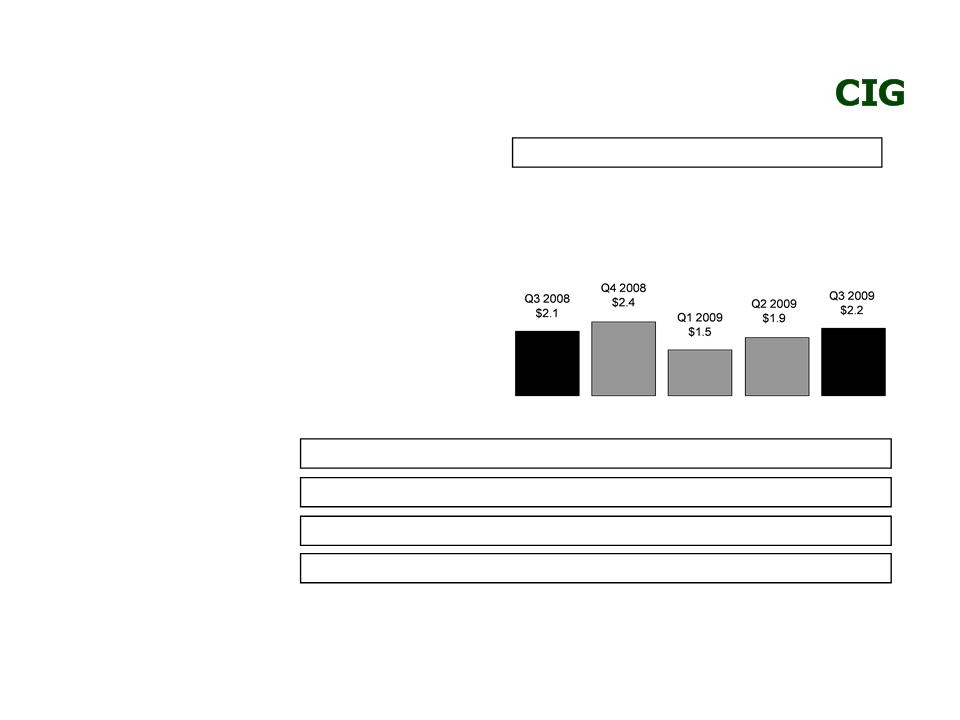
Premiums
-
Annuity
69
CIG
($
millions)
First-Year
Prems.-Tr. 4 Qtrs: $155.3 $119.9 $98.5 $84.7 $83.0
Total
Premiums-Quarterly: $27.4 $23.7 $19.5 $22.3 $25.2
Annuity
- First-Year Premiums
§ First-year
collections down
7% from Q3 2008:
7% from Q3 2008:
• Discontinuance of
products due
to an annuity coinsurance
transaction
to an annuity coinsurance
transaction
• Focus on profitable
products
(i.e., Specified Disease)
(i.e., Specified Disease)

Benefit
Ratio* -
Medicare
Supplement
70
CIG
Trailing 4 Quarter
Avg.: 69.1% 68.4% 68.8% 68.6% 67.3%
*We
calculate benefit ratios by dividing insurance policy benefits by insurance
policy income.
§ In
line with expectations and
recent trends
recent trends
§ Stable
persistency
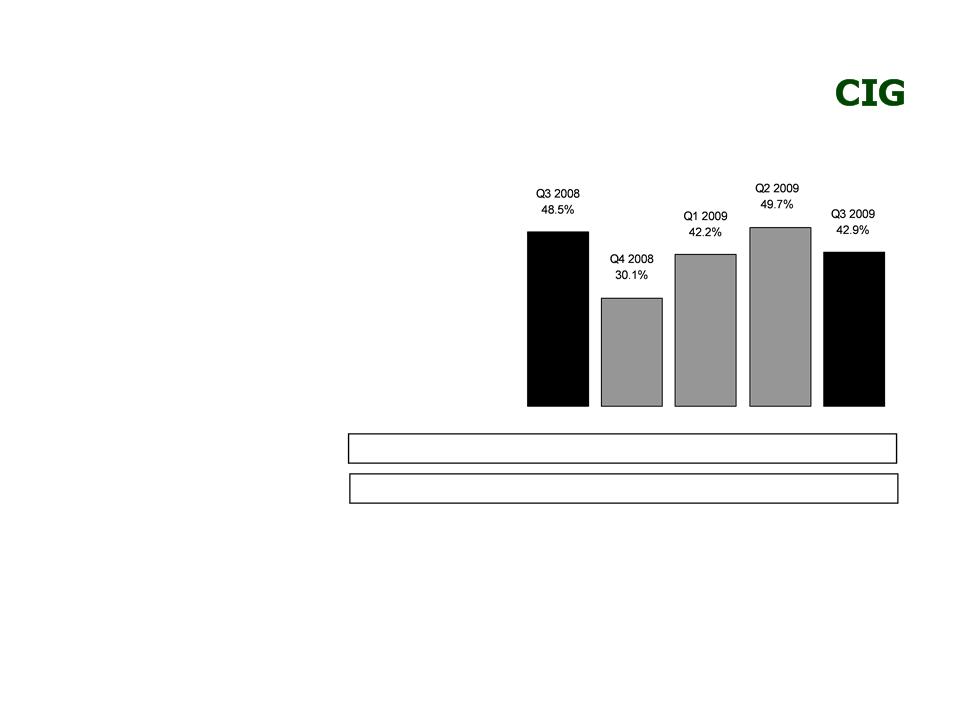
Interest-Adjusted
Benefit Ratio* -
Specified
Disease
71
Trailing 4 Quarter
Avg.: 47.4% 43.3% 41.8% 42.6% 41.2%
Qtrly.
non-int. adjusted: 82.6% 63.8% 76.0% 83.3% 76.6%
*We
calculate interest-adjusted benefit ratios by dividing insurance policy
benefits, less interest income on
the accumulated assets backing the insurance liabilities, by insurance policy income.
the accumulated assets backing the insurance liabilities, by insurance policy income.
§ Q3
2008 included recognition of
deferred ROP adjustment
related to prior periods
deferred ROP adjustment
related to prior periods

72
Information Related to Certain Non-GAAP Financial Measures
The
following provides additional information regarding certain non-GAAP measures
used in this presentation. A
non-GAAP measure is a
numerical measure of a company’s performance, financial position, or cash flows that excludes or includes amounts that are normally excluded
or included in the most directly comparable measure calculated and presented in accordance with GAAP. While management believes these
measures are useful to enhance understanding and comparability of our financial results, these non-GAAP measures should not be considered
as substitutes for the most directly comparable GAAP measures. Additional information concerning non-GAAP measures is included in our
periodic filings with the Securities and Exchange Commission that are available in the “Investor - SEC Filings” section of Conseco’s website,
www.conseco.com.
Operating
earnings measures
Management believes that an analysis of net income applicable to common stock before net realized gains or losses, discontinued operations
and increases to our valuation allowance for deferred tax assets (“net operating income,” a non-GAAP financial measure) is important to
evaluate the performance of the Company and is a key measure commonly used in the life insurance industry. Management uses this measure
to evaluate performance because realized investment gains or losses, discontinued operations and increases to our valuation allowance for
deferred tax assets are unrelated to the Company’s continuing operations.

Information Related to Certain Non-GAAP Financial Measures
A
reconciliation of net income applicable to common stock to net operating income
(and related per-share amounts) is as follows (dollars in
millions, except per-share amounts):
millions, except per-share amounts):

Book
value, excluding accumulated other comprehensive income, per share
This non-GAAP financial measure differs from book value per diluted share because accumulated other comprehensive income has been
excluded from the book value used to determine the measure. Management believes this non-GAAP financial measure is useful because it
removes the volatility that arises from changes in accumulated other comprehensive income. Such volatility is often caused by changes in the
estimated fair value of our investment portfolio resulting from changes in general market interest rates rather than the business decisions made
by management.
A
reconciliation from book value per share to book value per share, excluding
accumulated other comprehensive income (loss) is as follows
(dollars in millions, except per share amounts):
(dollars in millions, except per share amounts):
Information Related to Certain Non-GAAP Financial Measures

75
Operating
return measures
Management believes
that an analysis of return before net realized gains or losses, discontinued
operations and increases to our valuation
allowance for deferred tax assets (“net operating income,” a non-GAAP financial measure) is important to evaluate the performance of the
Company and is a key measure commonly used in the life insurance industry. Management uses this measure to evaluate performance
because realized investment gains or losses, discontinued operations and increases to our valuation allowance for deferred tax assets are
unrelated to the Company’s continued operations.
This
non-GAAP financial measure also differs from return on equity because
accumulated other comprehensive income (loss) has been
excluded from the value of equity used to determine this ratio. Management believes this non-GAAP financial measure is useful because it
removes the volatility that arises from changes in accumulated other comprehensive income (loss). Such volatility is often caused by changes in
the estimated fair value of our investment portfolio resulting from changes in general market interest rates rather than the business decisions
made by management.
In
addition, our equity includes the value of significant net operating loss
carryforwards (included in income tax assets). In
accordance with
GAAP, these assets are not discounted, and accordingly will not provide a return to shareholders (until after it is realized as a reduction to taxes
that would otherwise be paid). Management believes that excluding this value from the equity component of this measure enhances the
understanding of the effect these non-discounted assets have on operating returns and the comparability of these measures from period-to-
period. Operating return measures are used in measuring the performance of our business units and are used as a basis for incentive
compensation.
All
references to segment operating return measures assume a 25% debt to total
capital ratio at the segment level. Additionally,
corporate
expenses have been allocated to the segments.
expenses have been allocated to the segments.
Information Related to Certain Non-GAAP Financial Measures
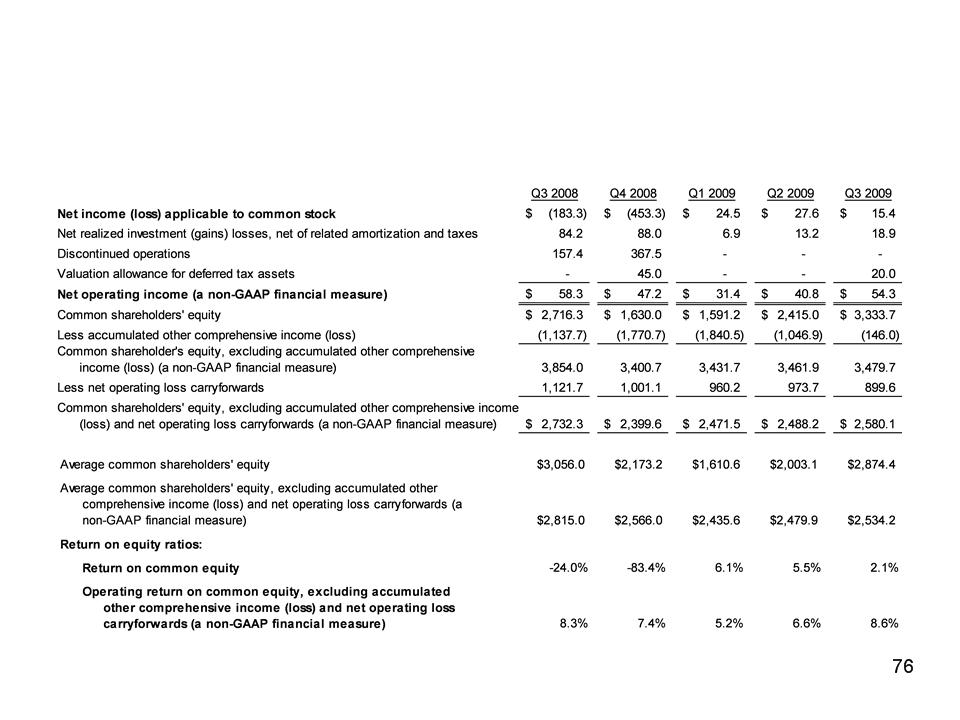
A
reconciliation of return on common equity to operating return on common equity
(excluding accumulated other comprehensive income (loss) and
net operating loss carryforwards) is as follows (dollars in millions, except per share amounts):
net operating loss carryforwards) is as follows (dollars in millions, except per share amounts):
Information Related to Certain Non-GAAP Financial Measures

77
A
reconciliation of pretax operating earnings (a non-GAAP financial measure) to
segment operating income (loss) and consolidated net income
(loss) for the nine months ended September 30, 2009, is as follows (dollars in millions):
(loss) for the nine months ended September 30, 2009, is as follows (dollars in millions):
(Continued on next
page)
Information Related to Certain Non-GAAP Financial Measures

78
A
reconciliation of common shareholders’ equity, excluding accumulated other
comprehensive income (loss) and net operating loss
carryforwards (a non-GAAP financial measure) to common shareholders’ equity at September 30, 2009, is as follows (dollars in millions):
carryforwards (a non-GAAP financial measure) to common shareholders’ equity at September 30, 2009, is as follows (dollars in millions):
(Continued on next
page)
(Continued from
previous page)
Information Related to Certain Non-GAAP Financial Measures

79
A
reconciliation of average common shareholders’ equity, excluding accumulated
other comprehensive income (loss) and net operating loss
carryforwards (a non-GAAP financial measure) to average common shareholders’ equity at September 30, 2009, is as follows (dollars in millions):
carryforwards (a non-GAAP financial measure) to average common shareholders’ equity at September 30, 2009, is as follows (dollars in millions):
(Continued from
previous page)
Information Related to Certain Non-GAAP Financial Measures
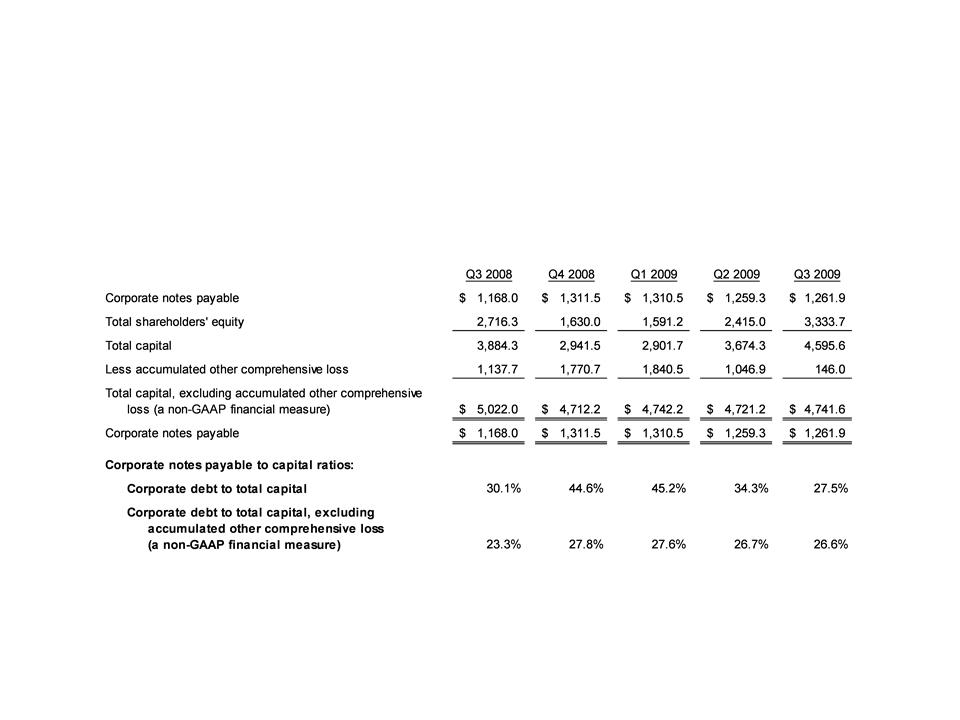
80
A
reconciliation of the debt to capital ratio to debt to capital, excluding
accumulated other comprehensive loss is as follows (dollars in
millions):
Debt
to capital ratio, excluding accumulated other comprehensive income
(loss)
This
non-GAAP financial measure differs from the debt to capital ratio because
accumulated other comprehensive income has been excluded
from the value of capital used to determine this measure. Management believes this non-GAAP financial measure is useful because it removes
the volatility that arises from changes in accumulated other comprehensive income. Such volatility is often caused by changes in the estimated
fair value of our investment portfolio resulting from changes in general market interest rates rather than the business decisions made by
management.
Information Related to Certain Non-GAAP Financial Measures