Attached files
Table of Contents
UNITED STATES
SECURITIES AND EXCHANGE COMMISSION
Washington, D.C. 20549
FORM 10-Q
(Mark One)
| x | QUARTERLY REPORT PURSUANT TO SECTION 13 OR 15(d) OF THE SECURITIES EXCHANGE ACT OF 1934 |
For the quarterly period ended September 30, 2009
OR
| ¨ | TRANSITION REPORT PURSUANT TO SECTION 13 OR 15(d) OF THE SECURITIES EXCHANGE ACT OF 1934 |
For the transition period from to
Commission File Number: 001-32726
POWERSHARES DB COMMODITY INDEX TRACKING FUND
(Exact name of Registrant as specified in its charter)
| Delaware | 32-6042243 | |
| (State or Other Jurisdiction of Incorporation or Organization) |
(I.R.S. Employer Identification No.) |
| c/o DB Commodity Services LLC 60 Wall Street New York, New York |
10005 | |
| (Address of Principal Executive Offices) | (Zip Code) |
DB COMMODITY INDEX TRACKING MASTER FUND
(Exact name of Rule 140 Co-Registrant as specified in its charter)
| Delaware | 30-0317551 | |
| (State or Other Jurisdiction of Incorporation or Organization) |
(I.R.S. Employer Identification No.) |
| c/o DB Commodity Services LLC 60 Wall Street New York, New York |
10005 | |
| (Address of Principal Executive Offices) | (Zip Code) |
Registrant’s telephone number, including area code: (212) 250-5883
Indicate by check mark whether the Registrant (1) has filed all reports required to be filed by Section 13 or 15(d) of the Securities Exchange Act of 1934 during the preceding 12 months (or for such shorter period that the Registrant was required to file such reports), and (2) has been subject to such filing requirements for the past 90 days. Yes x No ¨
Indicate by check mark whether the Registrant has submitted electronically and posted on its corporate Web site, if any, an Interactive Data File required to be submitted and posted pursuant to Rule 405 of Regulation S-T (§232.405 of this chapter) during the preceding 12 months (or for such shorter period that the Registrant was required to submit and post such files). Yes ¨ No ¨
Indicate by check mark whether the registrant is a large accelerated filer, an accelerated filer, a non-accelerated filer, or a smaller reporting company. See definition of “accelerated filer,” “large accelerated filer,” and “smaller reporting company” in Rule 12b-2 of the Exchange Act. (Check one):
| Large Accelerated Filer | x | Accelerated Filer | ¨ | |||
| Non-Accelerated Filer | ¨ (Do not check if a smaller reporting company) | Smaller reporting company | ¨ | |||
Indicate by check mark whether the registrant is a shell company (as defined in Rule 12b-2 of the Exchange Act). Yes ¨ No x
Indicate the number of outstanding Shares as of September 30, 2009: 156,000,000 Shares.
Table of Contents
POWERSHARES DB COMMODITY INDEX TRACKING FUND
QUARTER ENDED SEPTEMBER 30, 2009
TABLE OF CONTENTS
| Page | ||||||
| PART I. |
FINANCIAL INFORMATION | 1 | ||||
| ITEM 1. |
FINANCIAL STATEMENTS | 1 | ||||
| Consolidated Statements of Financial Condition September 30, 2009 (unaudited) and December 31, 2008 |
1 | |||||
| Unaudited Consolidated Schedule of Investments September 30, 2009 |
2 | |||||
| 3 | ||||||
| 4 | ||||||
| 5 | ||||||
| 6 | ||||||
| 7 | ||||||
| 8 | ||||||
| 9 | ||||||
| 10 | ||||||
| ITEM 2. |
MANAGEMENT’S DISCUSSION AND ANALYSIS OF FINANCIAL CONDITION AND RESULTS OF OPERATIONS | 19 | ||||
| ITEM 3. |
QUANTITATIVE AND QUALITATIVE DISCLOSURES ABOUT MARKET RISK | 30 | ||||
| ITEM 4. |
CONTROLS AND PROCEDURES | 33 | ||||
| PART II. |
OTHER INFORMATION | 33 | ||||
| Item 1. |
Legal Proceedings | 33 | ||||
| Item 1A |
Risk Factors | 33 | ||||
| Item 2. |
Unregistered Sales of Equity Securities and Use of Proceeds | 33 | ||||
| Item 3. |
Defaults Upon Senior Securities | 34 | ||||
| Item 4. |
Submission of Matters to a Vote of Security Holders | 34 | ||||
| Item 5. |
Other Information | 34 | ||||
| Item 6. |
Exhibits | 34 | ||||
| 35 | ||||||
| E-1 | ||||||
| Exhibit 31.1 |
Certification required under Exchange Act Rules 13a–14 and 15d–14 | E-2 | ||||
| Exhibit 31.2 |
Certification required under Exchange Act Rules 13a–14 and 15d–14 |
E-3 | ||||
| Exhibit 32.1 |
E-4 | |||||
| Exhibit 32.2 |
E-5 | |||||
i
Table of Contents
| ITEM 1. | FINANCIAL STATEMENTS. |
PowerShares DB Commodity Index Tracking Fund and Subsidiary
Consolidated Statements of Financial Condition
September 30, 2009 (unaudited) and December 31, 2008
| September 30, 2009 | December 31, 2008 | |||||||
| Assets |
||||||||
| Equity in broker trading accounts: |
||||||||
| United States Treasury Obligations, at fair value (cost $3,402,284,062 and $174,784,186, respectively) |
$ | 3,402,537,602 | $ | 174,793,945 | ||||
| Cash held by broker |
365,051,959 | 1,713,943,642 | ||||||
| Net unrealized depreciation on futures contracts |
(144,288,364 | ) | (688,785,759 | ) | ||||
| Deposits with broker |
3,623,301,197 | 1,199,951,828 | ||||||
| Other assets |
1,000 | 1,000 | ||||||
| Total assets |
$ | 3,623,302,197 | $ | 1,199,952,828 | ||||
| Liabilities |
||||||||
| Payable to broker |
$ | 14,797 | $ | — | ||||
| Payable for securities purchased |
159,955,511 | — | ||||||
| Management fee payable |
2,118,926 | 689,981 | ||||||
| Brokerage fee payable |
13,825 | 15,910 | ||||||
| Total liabilities |
$ | 162,103,059 | $ | 705,891 | ||||
| Commitments and Contingencies (Note 9) |
||||||||
| Equity |
||||||||
| Shareholders’ equity |
||||||||
| General shares: |
||||||||
| Paid in capital - 40 shares issued and outstanding as of September 30, 2009 and December 31, 2008, respectively |
1,000 | 1,000 | ||||||
| Accumulated deficit |
(113 | ) | (143 | ) | ||||
| Total General shares |
887 | 857 | ||||||
| Shares: |
||||||||
| Paid in capital - 156,000,000 and 56,000,000 redeemable Shares issued and outstanding as of September 30, 2009 and December 31, 2008, respectively |
3,532,566,620 | 1,359,626,738 | ||||||
| Accumulated deficit |
(71,369,256 | ) | (160,381,515 | ) | ||||
| Total Shares |
3,461,197,364 | 1,199,245,223 | ||||||
| Total shareholders’ equity |
3,461,198,251 | 1,199,246,080 | ||||||
| Non-controlling interest in consolidated subsidiary - related party |
887 | 857 | ||||||
| Total equity |
3,461,199,138 | 1,199,246,937 | ||||||
| Total liabilities and equity |
$ | 3,623,302,197 | $ | 1,199,952,828 | ||||
| Net asset value per share |
||||||||
| General shares |
$ | 22.18 | $ | 21.43 | ||||
| Shares |
$ | 22.19 | $ | 21.42 | ||||
See accompanying notes to unaudited consolidated financial statements.
1
Table of Contents
PowerShares DB Commodity Index Tracking Fund and Subsidiary
Unaudited Consolidated Schedule of Investments
September 30, 2009
| Description |
Percentage of Net Assets |
Fair Value |
Face Value | ||||||
| United States Treasury Obligations |
|||||||||
| U.S. Treasury Bills, 0.085% due October 1, 2009 |
4.62 | % | $ | 160,000,000 | $ | 160,000,000 | |||
| U.S. Treasury Bills, 0.09% due October 8, 2009 |
25.40 | 878,997,363 | 879,000,000 | ||||||
| U.S. Treasury Bills, 0.03% due October 15, 2009 |
4.64 | 160,498,234 | 160,500,000 | ||||||
| U.S. Treasury Bills, 0.04% due October 22, 2009 |
3.32 | 114,997,470 | 115,000,000 | ||||||
| U.S. Treasury Bills, 0.145% due October 29, 2009 |
5.09 | 176,291,714 | 176,300,000 | ||||||
| U.S. Treasury Bills, 0.18% due November 5, 2009 |
6.39 | 220,991,381 | 221,000,000 | ||||||
| U.S. Treasury Bills, 0.185% due November 12, 2009 |
10.72 | 370,978,482 | 371,000,000 | ||||||
| U.S. Treasury Bills, 0.18% due November 19, 2009 |
4.42 | 152,986,536 | 153,000,000 | ||||||
| U.S. Treasury Bills, 0.16% due November 27, 2009 |
5.72 | 197,982,774 | 198,000,000 | ||||||
| U.S. Treasury Bills, 0.15% due December 3, 2009 |
3.44 | 118,988,100 | 119,000,000 | ||||||
| U.S. Treasury Bills, 0.14% due December 10, 2009 |
6.12 | 211,973,288 | 212,000,000 | ||||||
| U.S. Treasury Bills, 0.135% due December 17, 2009 |
7.37 | 254,955,375 | 255,000,000 | ||||||
| U.S. Treasury Bills, 0.1% due December 24, 2009 |
6.44 | 222,945,365 | 223,000,000 | ||||||
| U.S. Treasury Bills, 0.115% due December 31, 2009 |
4.62 | 159,951,520 | 160,000,000 | ||||||
| Total United States Treasury Obligations (cost $3,402,284,062) |
98.31 | % | $ | 3,402,537,602 | |||||
A portion of the above United States Treasury Obligations are held as initial margin against open futures contracts, as described in Note 4(e).
| Description |
Percentage of Net Assets |
Fair Value |
|||||
| Unrealized Appreciation/(Depreciation) on Futures Contracts |
|||||||
| Aluminum (8,947 contracts, settlement date November 16, 2009) |
0.19 | % | $ | 6,631,519 | |||
| Corn (16,254 contracts, settlement date December 14, 2009) |
(2.22 | ) | (76,929,675 | ) | |||
| Corn (1,245 contracts, settlement date March 12, 2010) |
0.03 | 1,119,863 | |||||
| Light, Sweet Crude Oil (6,795 contracts, settlement date June 21, 2010) |
(0.42 | ) | (14,587,280 | ) | |||
| Light, Sweet Crude Oil (10,815 contracts, settlement date June 22, 2010) |
(0.30 | ) | (10,372,010 | ) | |||
| Gold (1,155 contracts, settlement date, February 24, 2010) |
0.19 | 6,521,210 | |||||
| Gold (3,878 contracts, settlement date April 28, 2010) |
0.99 | 34,099,090 | |||||
| Heating Oil (1,664 contracts, settlement date April 30, 2010) |
(0.11 | ) | (3,839,942 | ) | |||
| Heating Oil (5,587 contracts, settlement date May 28, 2010) |
1.20 | 41,460,434 | |||||
| Red Wheat (1,146 contracts, settlement date, December 14, 2009) |
(0.10 | ) | (3,300,050 | ) | |||
| Red Wheat (1,043 contracts, settlement date July 21, 2010) |
(0.17 | ) | (5,858,850 | ) | |||
| Soybean Meal (994 contracts, settlement date December 14, 2009) |
(0.03 | ) | (1,009,760 | ) | |||
| Wheat (10,988 contracts, settlement date July 14, 2010) |
(3.42 | ) | (118,222,913 | ) | |||
| Net Unrealized Depreciation on Futures Contracts |
(4.17 | )% | $ | (144,288,364 | ) | ||
Net unrealized depreciation is comprised of unrealized losses of $275,492,541 and unrealized gains of $131,204,177.
See accompanying notes to unaudited consolidated financial statements.
2
Table of Contents
PowerShares DB Commodity Index Tracking Fund and Subsidiary
Consolidated Schedule of Investments
December 31, 2008
| Description |
Percentage of Net Assets |
Fair Value |
Face Value | ||||||
| United States Treasury Obligations |
|||||||||
| U.S. Treasury Bills, 0.95% due January 15, 2009 |
0.79 | % | $ | 9,499,953 | $ | 9,500,000 | |||
| U.S. Treasury Bills, 0.65% due January 22, 2009 |
3.34 | 39,999,840 | 40,000,000 | ||||||
| U.S. Treasury Bills, 0.03% due January 29, 2009 |
1.78 | 21,299,531 | 21,300,000 | ||||||
| U.S. Treasury Bills, 0.53% due February 05, 2009 |
2.50 | 29,999,190 | 30,000,000 | ||||||
| U.S. Treasury Bills, 0.355% due February 12, 2009 |
0.75 | 8,999,712 | 9,000,000 | ||||||
| U.S. Treasury Bills, 0.15% due February 19, 2009 |
0.33 | 3,999,868 | 4,000,000 | ||||||
| U.S. Treasury Bills, 0.15% due February 26, 2009 |
2.00 | 23,998,944 | 24,000,000 | ||||||
| U.S. Treasury Bills, 0.005% due March 12, 2009 |
2.67 | 31,997,472 | 32,000,000 | ||||||
| U.S. Treasury Bills, 0.04% due March 26, 2009 |
0.42 | 4,999,435 | 5,000,000 | ||||||
| Total United States Treasury Obligations (cost $174,784,186) |
14.58 | % | $ | 174,793,945 | |||||
A portion of the above United States Treasury Obligations are held as initial margin against open futures contracts, as described in Note 4(e).
| Description |
Percentage of Net Assets |
Fair Value |
|||||
| Unrealized Appreciation (Depreciation) on Futures Contracts |
|||||||
| Aluminum (3,212 contracts, settlement date November 16, 2009) |
(4.50 | )% | $ | (54,038,632 | ) | ||
| Corn (6,854 contracts, settlement date December 14, 2009) |
0.07 | 878,113 | |||||
| Light, Sweet Crude Oil (7,022 contracts, settlement date June 22, 2009) |
(34.32 | ) | (411,542,490 | ) | |||
| Gold (1,823 contracts, settlement date June 26, 2009) |
1.64 | 19,647,490 | |||||
| Heating Oil (3,147 contracts, settlement date May 29, 2009) |
(16.39 | ) | (196,562,915 | ) | |||
| Wheat (5,413 contracts, settlement date July 14, 2009) |
(3.93 | ) | (47,167,325 | ) | |||
| Net Unrealized Depreciation on Futures Contracts |
(57.43 | )% | $ | (688,785,759 | ) | ||
See accompanying notes to unaudited consolidated financial statements.
3
Table of Contents
PowerShares DB Commodity Index Tracking Fund and Subsidiary
Unaudited Consolidated Statements of Income and Expenses
For the Three Months and Nine Months Ended September 30, 2009 and 2008
| Three Months Ended | Nine Months Ended | |||||||||||||||
| September 30, 2009 |
September 30, 2008 |
September 30, 2009 |
September 30, 2008 |
|||||||||||||
| Income |
||||||||||||||||
| Interest Income, net |
$ | 1,310,739 | $ | 9,811,634 | $ | 2,589,237 | $ | 32,936,753 | ||||||||
| Expenses |
||||||||||||||||
| Management Fee |
6,216,143 | 4,263,707 | 13,071,789 | 12,856,742 | ||||||||||||
| Brokerage Commissions and Fees |
120,554 | 79,796 | 589,823 | 446,386 | ||||||||||||
| Total Expenses |
6,336,697 | 4,343,503 | 13,661,612 | 13,303,128 | ||||||||||||
| Net investment income (loss) |
(5,025,958 | ) | 5,468,131 | (11,072,375 | ) | 19,633,625 | ||||||||||
| Net Realized and Net Change in Unrealized Gain (Loss) on United States Treasury Obligations and Futures |
||||||||||||||||
| Net Realized Gain (Loss) on |
||||||||||||||||
| United States Treasury Obligations |
1,943 | 144,291 | (14,766 | ) | 439,271 | |||||||||||
| Futures |
(10,231,862 | ) | 44,102,126 | (444,641,716 | ) | 662,488,055 | ||||||||||
| Net realized gain (loss) |
(10,229,919 | ) | 44,246,417 | (444,656,482 | ) | 662,927,326 | ||||||||||
| Net Change in Unrealized Gain (Loss) on |
||||||||||||||||
| United States Treasury Obligations |
252,127 | 1,840,251 | 243,781 | 1,640,223 | ||||||||||||
| Futures |
(34,774,661 | ) | (718,786,663 | ) | 544,497,395 | (523,078,504 | ) | |||||||||
| Net change in unrealized gain (loss) |
(34,522,534 | ) | (716,946,412 | ) | 544,741,176 | (521,438,281 | ) | |||||||||
| Net realized and net change in unrealized gain (loss) on United States Treasury Obligations and Futures |
(44,752,453 | ) | (672,699,995 | ) | 100,084,694 | 141,489,045 | ||||||||||
| Net Income (Loss) |
$ | (49,778,411 | ) | $ | (667,231,864 | ) | $ | 89,012,319 | $ | 161,122,670 | ||||||
| Less: net (income) loss attributed to the non-controlling interest in consolidated subsidiary - related party |
11 | 453 | (30 | ) | (345 | ) | ||||||||||
| Net Income (Loss) Attributable to PowerShares DB Commodity Index Tracking Fund and Subsidiary |
$ | (49,778,400 | ) | $ | (667,231,411 | ) | $ | 89,012,289 | $ | 161,122,325 | ||||||
See accompanying notes to unaudited consolidated financial statements.
4
Table of Contents
PowerShares DB Commodity Index Tracking Fund and Subsidiary
Unaudited Consolidated Statement of Changes in Shareholders’ Equity
For the Three Months Ended September 30, 2009
| General Shares | Shares | Total Shareholders’ Equity |
Non-controlling Interest |
Total Equity |
||||||||||||||||||||||||||||||||||||
| Shares | Paid in Capital |
Accumulated Earnings (Deficit) |
Total Equity |
Shares | Paid in Capital |
Accumulated Earnings (Deficit) |
Total Equity |
|||||||||||||||||||||||||||||||||
| Balance at July 1, 2009 |
40 | $ | 1,000 | $ | (102 | ) | $ | 898 | 132,600,000 | $ | 3,000,244,358 | $ | (21,590,867 | ) | $ | 2,978,653,491 | $ | 2,978,654,389 | $ | 898 | $ | 2,978,655,287 | ||||||||||||||||||
| Sale of Shares |
27,400,000 | 618,543,062 | 618,543,062 | 618,543,062 | 618,543,062 | |||||||||||||||||||||||||||||||||||
| Redemption of Shares |
(4,000,000 | ) | (86,220,800 | ) | (86,220,800 | ) | (86,220,800 | ) | (86,220,800 | ) | ||||||||||||||||||||||||||||||
| Net Loss |
||||||||||||||||||||||||||||||||||||||||
| Net investment loss |
(2 | ) | (2 | ) | (5,025,954 | ) | (5,025,954 | ) | (5,025,956 | ) | (2 | ) | (5,025,958 | ) | ||||||||||||||||||||||||||
| Net realized loss on United States Treasury Obligations and Futures |
(4 | ) | (4 | ) | (10,229,911 | ) | (10,229,911 | ) | (10,229,915 | ) | (4 | ) | (10,229,919 | ) | ||||||||||||||||||||||||||
| Net change in unrealized loss on United States Treasury Obligations and Futures |
(5 | ) | (5 | ) | (34,522,524 | ) | (34,522,524 | ) | (34,522,529 | ) | (5 | ) | (34,522,534 | ) | ||||||||||||||||||||||||||
| Net Loss |
(11 | ) | (11 | ) | (49,778,389 | ) | (49,778,389 | ) | (49,778,400 | ) | (11 | ) | (49,778,411 | ) | ||||||||||||||||||||||||||
| Balance at September 30, 2009 |
40 | $ | 1,000 | $ | (113 | ) | $ | 887 | 156,000,000 | $ | 3,532,566,620 | $ | (71,369,256 | ) | $ | 3,461,197,364 | $ | 3,461,198,251 | $ | 887 | $ | 3,461,199,138 | ||||||||||||||||||
See accompanying notes to unaudited consolidated financial statements.
5
Table of Contents
PowerShares DB Commodity Index Tracking Fund and Subsidiary
Unaudited Consolidated Statement of Changes in Shareholders’ Equity
For the Three Months Ended September 30, 2008
| General Shares | Shares | Total Shareholders’ Equity |
Non-controlling Interest |
Total Equity |
||||||||||||||||||||||||||||||||||||
| Shares | Paid in Capital |
Accumulated Earnings |
Total Equity |
Shares | Paid in Capital |
Accumulated Earnings |
Total Equity |
|||||||||||||||||||||||||||||||||
| Balance at July 1, 2008 |
40 | $ | 1,000 | $ | 798 | $ | 1,798 | 66,000,000 | $ | 1,844,828,404 | $ | 1,121,505,012 | $ | 2,966,333,416 | $ | 2,966,335,214 | $ | 1,798 | $ | 2,966,337,012 | ||||||||||||||||||||
| Sale of Shares |
3,800,000 | 145,776,468 | 145,776,468 | 145,776,468 | 145,776,468 | |||||||||||||||||||||||||||||||||||
| Redemption of Shares |
(16,400,000 | ) | (649,931,558 | ) | (649,931,558 | ) | (649,931,558 | ) | (649,931,558 | ) | ||||||||||||||||||||||||||||||
| Net Loss |
||||||||||||||||||||||||||||||||||||||||
| Net investment income |
4 | 4 | 5,468,123 | 5,468,123 | 5,468,127 | 4 | 5,468,131 | |||||||||||||||||||||||||||||||||
| Net realized gain on United States Treasury Obligations and Futures |
23 | 23 | 44,246,371 | 44,246,371 | 44,246,394 | 23 | 44,246,417 | |||||||||||||||||||||||||||||||||
| Net change in unrealized loss on United States Treasury Obligations and Futures |
(480 | ) | (480 | ) | (716,945,452 | ) | (716,945,452 | ) | (716,945,932 | ) | (480 | ) | (716,946,412 | ) | ||||||||||||||||||||||||||
| Net Loss |
(453 | ) | (453 | ) | (667,230,958 | ) | (667,230,958 | ) | (667,231,411 | ) | (453 | ) | (667,231,864 | ) | ||||||||||||||||||||||||||
| Balance at September 30, 2008 |
40 | $ | 1,000 | $ | 345 | $ | 1,345 | 53,400,000 | $ | 1,340,673,314 | $ | 454,274,054 | $ | 1,794,947,368 | $ | 1,794,948,713 | $ | 1,345 | $ | 1,794,950,058 | ||||||||||||||||||||
See accompanying notes to unaudited consolidated financial statements.
6
Table of Contents
PowerShares DB Commodity Index Tracking Fund and Subsidiary
Unaudited Consolidated Statement of Changes in Shareholders’ Equity
For the Nine Months Ended September 30, 2009
| General Shares | Shares | Total Shareholders’ Equity |
Non-controlling Interest |
Total Equity |
||||||||||||||||||||||||||||||||||||
| Shares | Paid in Capital |
Accumulated Earnings (Deficit) |
Total Equity |
Shares | Paid in Capital |
Accumulated Earnings (Deficit) |
Total Equity |
|||||||||||||||||||||||||||||||||
| Balance at January 1, 2009 |
40 | $ | 1,000 | $ | (143 | ) | $ | 857 | 56,000,000 | $ | 1,359,626,738 | $ | (160,381,515 | ) | $ | 1,199,245,223 | $ | 1,199,246,080 | $ | 857 | $ | 1,199,246,937 | ||||||||||||||||||
| Sale of Shares |
105,000,000 | 2,278,817,934 | 2,278,817,934 | 2,278,817,934 | 2,278,817,934 | |||||||||||||||||||||||||||||||||||
| Redemption of Shares |
(5,000,000 | ) | (105,878,052 | ) | (105,878,052 | ) | (105,878,052 | ) | (105,878,052 | ) | ||||||||||||||||||||||||||||||
| Net Income |
||||||||||||||||||||||||||||||||||||||||
| Net investment loss |
(5 | ) | (5 | ) | (11,072,365 | ) | (11,072,365 | ) | (11,072,370 | ) | (5 | ) | (11,072,375 | ) | ||||||||||||||||||||||||||
| Net realized loss on United States Treasury Obligations and Futures |
(164 | ) | (164 | ) | (444,656,154 | ) | (444,656,154 | ) | (444,656,318 | ) | (164 | ) | (444,656,482 | ) | ||||||||||||||||||||||||||
| Net change in unrealized gain on United States Treasury Obligations and Futures |
199 | 199 | 544,740,778 | 544,740,778 | 544,740,977 | 199 | 544,741,176 | |||||||||||||||||||||||||||||||||
| Net Income |
30 | 30 | 89,012,259 | 89,012,259 | 89,012,289 | 30 | 89,012,319 | |||||||||||||||||||||||||||||||||
| Balance at September 30, 2009 |
40 | $ | 1,000 | $ | (113 | ) | $ | 887 | 156,000,000 | $ | 3,532,566,620 | $ | (71,369,256 | ) | $ | 3,461,197,364 | $ | 3,461,198,251 | $ | 887 | $ | 3,461,199,138 | ||||||||||||||||||
See accompanying notes to unaudited consolidated financial statements.
7
Table of Contents
PowerShares DB Commodity Index Tracking Fund and Subsidiary
Unaudited Consolidated Statement of Changes in Shareholders’ Equity
For the Nine Months Ended September 30, 2008
| General Shares | Shares | Total Shareholders’ Equity |
Non-controlling Interest |
Total Equity |
||||||||||||||||||||||||||||||||||||
| Shares | Paid in Capital |
Accumulated Earnings |
Total Equity |
Shares | Paid in Capital |
Accumulated Earnings |
Total Equity |
|||||||||||||||||||||||||||||||||
| Balance at January 1, 2008 |
40 | $ | 1,000 | $ | 259 | $ | 1,259 | 49,000,000 | $ | 1,248,525,348 | $ | 293,151,815 | $ | 1,541,677,163 | $ | 1,541,678,422 | $ | 1,000 | $ | 1,541,679,422 | ||||||||||||||||||||
| Sale of Shares |
27,800,000 | 1,009,983,770 | 1,009,983,770 | 1,009,983,770 | 1,009,983,770 | |||||||||||||||||||||||||||||||||||
| Redemption of Shares |
(23,400,000 | ) | (917,835,804 | ) | (917,835,804 | ) | (917,835,804 | ) | (917,835,804 | ) | ||||||||||||||||||||||||||||||
| Net Income |
||||||||||||||||||||||||||||||||||||||||
| Net investment income |
14 | 14 | 19,633,587 | 19,633,587 | 19,633,601 | 24 | 19,633,625 | |||||||||||||||||||||||||||||||||
| Net realized gain on United States Treasury Obligations and Futures |
404 | 404 | 662,926,484 | 662,926,484 | 662,926,888 | 438 | 662,927,326 | |||||||||||||||||||||||||||||||||
| Net change in unrealized loss on United States Treasury Obligations and Futures |
(332 | ) | (332 | ) | (521,437,832 | ) | (521,437,832 | ) | (521,438,164 | ) | (117 | ) | (521,438,281 | ) | ||||||||||||||||||||||||||
| Net Income |
86 | 86 | 161,122,239 | 161,122,239 | 161,122,325 | 345 | 161,122,670 | |||||||||||||||||||||||||||||||||
| Balance at September 30, 2008 |
40 | $ | 1,000 | $ | 345 | $ | 1,345 | 53,400,000 | $ | 1,340,673,314 | $ | 454,274,054 | $ | 1,794,947,368 | $ | 1,794,948,713 | $ | 1,345 | $ | 1,794,950,058 | ||||||||||||||||||||
See accompanying notes to unaudited consolidated financial statements.
8
Table of Contents
PowerShares DB Commodity Index Tracking Fund and Subsidiary
Unaudited Consolidated Statements of Cash Flows
For the Nine Months Ended September 30, 2009 and 2008
| Nine Months Ended | ||||||||
| September 30, 2009 | September 30, 2008 | |||||||
| Cash flow provided by and (used for) operating activities: |
||||||||
| Net Income |
$ | 89,012,319 | $ | 161,122,670 | ||||
| Adjustments to reconcile net income to net cash used for operating activities: |
||||||||
| Cost of securities purchased |
(8,043,271,472 | ) | (7,035,064,078 | ) | ||||
| Proceeds from securities sold and matured |
4,818,353,745 | 6,872,266,672 | ||||||
| Net accretion of discount on United States Treasury Obligations |
(2,596,915 | ) | (31,628,721 | ) | ||||
| Net realized (gain) loss on United States Treasury Obligations |
14,766 | (439,271 | ) | |||||
| Net change in unrealized (gain) loss on United States Treasury Obligations and futures |
(544,741,176 | ) | 521,438,281 | |||||
| Increase in restricted cash |
— | (11,675,110 | ) | |||||
| Change in operating receivables and liabilities: |
||||||||
| Receivable for Shares issued |
— | 6,292,540 | ||||||
| Payable for securities purchased |
159,955,511 | (5,956,083 | ) | |||||
| Payable to broker |
14,797 | (200,008,381 | ) | |||||
| Management fee payable |
1,428,945 | 1,549,181 | ||||||
| Brokerage fee payable |
(2,085 | ) | (2,666 | ) | ||||
| Net cash provided by and (used for) operating activities |
(3,521,831,565 | ) | 277,895,034 | |||||
| Cash flows from financing activities: |
||||||||
| Proceeds from sale of Shares |
2,278,817,934 | 1,009,983,770 | ||||||
| Redemption of Shares |
(105,878,052 | ) | (917,835,804 | ) | ||||
| Net cash provided by financing activities |
2,172,939,882 | 92,147,966 | ||||||
| Net change in cash held by broker |
(1,348,891,683 | ) | 370,043,000 | |||||
| Unrestricted cash held by broker at beginning of period |
1,713,943,642 | — | ||||||
| Unrestricted cash held by broker at end of period |
$ | 365,051,959 | $ | 370,043,000 | ||||
See accompanying notes to unaudited consolidated financial statements.
9
Table of Contents
PowerShares DB Commodity Index Tracking Fund and Subsidiary
Notes to Unaudited Consolidated Financial Statements
September 30, 2009
(1) Organization
PowerShares DB Commodity Index Tracking Fund (the “Fund”; “Fund” may also refer to the Fund and the Master Fund, collectively, as the context requires) and its subsidiary, DB Commodity Index Tracking Master Fund (the “Master Fund”), were formed as Delaware statutory trusts on May 23, 2005. DB Commodity Services LLC, a Delaware Limited Liability Company (“DBCS” or the “Managing Owner”), funded both the Fund and the Master Fund with a capital contribution of $1,000 to each fund in exchange for 40 General Shares of each fund. The Fund was originally named “DB Commodity Index Tracking Fund”. The Fund changed its name to “PowerShares DB Commodity Index Tracking Fund” effective August 10, 2006. The fiscal year end of the Fund is December 31st. The term of the Fund is perpetual (unless terminated earlier in certain circumstances) as provided in the Amended and Restated Declaration of Trust and Trust Agreement of the Fund and the Master Fund (each a “Trust Agreement”, and collectively, the “Trust Agreements”).
The Fund offers common units of beneficial interest (the “Shares”) only to certain eligible financial institutions (the “Authorized Participants”) in one or more blocks of 200,000 Shares, called a Basket. The proceeds from the offering of Shares are invested in the Master Fund. The Fund and the Master Fund commenced investment operations on January 31, 2006. The Fund commenced trading on the American Stock Exchange (now known as the NYSE Alternext US LLC (the “NYSE Alternext”)) on February 3, 2006 and, as of November 25, 2008, is listed on the NYSE Arca, Inc. (the “NYSE Arca”).
This report covers the three months ended September 30, 2009 and 2008 (hereinafter referred to as the “Three Months Ended September 30, 2009” and the “Three Months Ended September 30, 2008”, respectively) and the nine months ended September 30, 2009 and 2008 (hereinafter referred to as the “Nine Months Ended September 30, 2009” and the “Nine Months Ended September 30, 2008”, respectively).
(2) Fund Investment Overview
The Master Fund invests with a view to tracking the changes, whether positive or negative, in the level of the Deutsche Bank Liquid Commodity Index–Optimum Yield Excess Return™ (“DBLCI-OY ER™”, or the “Index”) plus the excess, if any, of the Master Fund’s income from its holdings of United States Treasury Obligations and other high credit quality short-term fixed income securities over the expenses of the Fund and the Master Fund.
The Index is intended to reflect the change in market value of certain commodities. The commodities comprising the Index, or the Index Commodities, are Light, Sweet Crude Oil, Heating Oil, Aluminum, Gold, Corn and Wheat. The Master Fund holds United States Treasury Obligations and other high credit quality short-term fixed income securities for deposit with the Master Fund’s commodity broker as margin and for investment. The Commodity Futures Trading Commission (the “CFTC”) and commodity exchanges impose position limits on market participants trading in certain commodities included in the Index. The Index is comprised of futures contracts on the Index Commodities that expire in a specific month and trade on a specific exchange (the “Index Contracts”). As disclosed in the Fund’s Prospectus, if the Managing Owner determines in its commercially reasonable judgment that it has become impracticable or inefficient for any reason for the Master Fund to gain full or partial exposure to any Index Commodity by investing in a specific Index Contract, the Master Fund may invest in a futures contract referencing the particular Index Commodity other than the Index Contract or, in the alternative, invest in other futures contracts not based on the particular Index Commodity if, in the commercially reasonable judgment of the Managing Owner, such futures contracts tend to exhibit trading prices that correlate with such Index Commodity. Because the Master Fund is approaching or has reached position limits with respect to certain futures contracts comprising the Index, the Master Fund has commenced investing in other futures contracts based on commodities that comprise the Fund’s Index and in futures contracts based on commodities other than commodities that comprise the Fund’s Index.
The Fund does not employ leverage. As of September 30, 2009 and December 31, 2008, the Fund had $3,623,301,197 (or 100%) and $1,199,951,828 (or 100%), respectively, of its holdings of cash, United States Treasury Obligations and unrealized appreciation/depreciation on futures contracts on deposit with its Commodity Broker. Of this, $248,578,351 (6.86%) and $154,620,803 (or 12.88%), respectively, of the Fund’s holdings of cash and United States Treasury Obligations are required to be deposited as margin in support of the Fund’s long futures positions as of September 30,
10
Table of Contents
PowerShares DB Commodity Index Tracking Fund and Subsidiary
Notes to Unaudited Consolidated Financial Statements—(Continued)
September 30, 2009
2009 and December 31, 2008. For additional information, please see the unaudited Consolidated Schedule of Investments as of September 30, 2009 and the audited Consolidated Schedule of Investments as of December 31, 2008 for a breakdown of the Fund’s portfolio holdings.
DBLCI™ and Deutsche Bank Liquid Commodity Index™ are trademarks of Deutsche Bank AG London (the “Index Sponsor”). Trademark applications in the United States are pending with respect to both the Fund and the Index. The Fund and the Master Fund have been licensed by the Index Sponsor to use the above noted trademarks. Deutsche Bank AG London is an affiliate of the Fund, the Master Fund and the Managing Owner.
(3) Service Providers and Related Party Agreements
The Trustee
Under the Trust Agreements, Wilmington Trust Company, the trustee of the Fund and Master Fund (the “Trustee”), has delegated to the Managing Owner the exclusive management and control of all aspects of the business of the Fund and the Master Fund. The Trustee will have no duty or liability to supervise or monitor the performance of the Managing Owner, nor will the Trustee have any liability for the acts or omissions of the Managing Owner.
The Managing Owner
The Managing Owner serves the Fund and Master Fund as commodity pool operator, commodity trading advisor, and managing owner, and is an indirect wholly-owned subsidiary of Deutsche Bank AG. During the Three Months Ended September 30, 2009 and 2008, the Fund and the Master Fund incurred Management Fees of $6,216,143 and $4,263,707, respectively. Management Fees incurred during the Nine Months Ended September 30, 2009 and 2008 by the Fund and the Master Fund were $13,071,789 and $12,856,742, respectively. As of September 30, 2009 and December 31, 2008, Management Fees payable to the Managing Owner were $2,118,926 and $689,981, respectively.
The Commodity Broker
Deutsche Bank Securities Inc., a Delaware corporation, serves as the Master Fund’s clearing broker (the “Commodity Broker”). The Commodity Broker is an indirect wholly-owned subsidiary of Deutsche Bank AG. In its capacity as clearing broker, the Commodity Broker executes and clears each of the Master Fund’s futures transactions and performs certain administrative and custodial services for the Master Fund. The Commodity Broker is an affiliate of the Managing Owner. As custodian of the Master Fund’s assets, the Commodity Broker is responsible, among other things, for providing periodic accountings of all dealings and actions taken by the Master Fund during the reporting period, together with an accounting of all securities, cash or other indebtedness or obligations held by it or its nominees for or on behalf of the Master Fund. During the Three Months Ended September 30, 2009 and 2008, the Fund and the Master Fund incurred brokerage fees of $120,554 and $79,796, respectively. Brokerage fees incurred during the Nine Months Ended September 30, 2009 and 2008 by the Fund and the Master Fund were $589,823 and $446,386, respectively. As of September 30, 2009 and December 31, 2008, brokerage fees payable were $13,825 and $15,910, respectively.
The Administrator
The Bank of New York Mellon (the “Administrator”) has been appointed by the Managing Owner as the administrator, custodian and transfer agent of the Master Fund and the Fund, and have entered into separate administrative, custodian, transfer agency and service agreements (collectively referred to as the “Administration Agreement”).
Pursuant to the Administration Agreement, the Administrator performs or supervises the performance of services necessary for the operation and administration of the Fund and the Master Fund (other than making investment decisions), including receiving and processing orders from Authorized Participants to create and redeem Baskets, net asset value calculations, accounting and other fund administrative services. The Administrator retains certain financial books and records, including: Basket creation and redemption books and records, fund accounting records, ledgers with respect to assets, liabilities, capital, income and expenses, the registrar, transfer journals and related details, and trading and related documents received from futures commission merchants.
The Administration Agreement will continue in effect from the commencement of trading operations unless terminated on at least 90 days’ prior written notice by either party to the other party. Notwithstanding the foregoing, the
11
Table of Contents
PowerShares DB Commodity Index Tracking Fund and Subsidiary
Notes to Unaudited Consolidated Financial Statements—(Continued)
September 30, 2009
Administrator may terminate the administrative portion of the Administration Agreement upon 30 days’ prior written notice if the Fund and/or Master Fund has materially failed to perform its obligations under the Administration Agreement.
The Distributor
ALPS Distributors, Inc. (the “Distributor”) provides certain distribution services to the Fund. Pursuant to the Distribution Services Agreement between the Managing Owner in its capacity as managing owner of the Fund and the Distributor, the Distributor assists the Managing Owner and the Administrator with certain functions and duties relating to distribution and marketing services to the Fund including reviewing and approving marketing materials.
The Distribution Services Agreement is terminable without penalty on sixty days’ written notice by the Managing Owner or by the Distributor. The Distribution Services Agreement will automatically terminate in the event of its assignment.
Invesco Powershares Capital Management LLC
Under the License Agreement among Invesco Powershares Capital Management LLC (the “Licensor”), and the Managing Owner in its own capacity and in its capacity as managing owner of the Fund (the Fund and the Managing Owner, collectively, the “Licensees”), the Licensor granted to each Licensee a non-exclusive license to use the “PowerShares®” trademark (the “Trademark”) anywhere in the world, solely in connection with the marketing and promotion of the Fund and to use or refer to the Trademark in connection with the issuance and trading of the Fund as necessary.
Invesco Aim Distributors, Inc.
Through a marketing agreement between the Managing Owner and Invesco Aim Distributors, Inc. (“Invesco Aim Distributors”), an affiliate of Invesco PowerShares Capital Management LLC (“Invesco PowerShares”), the Managing Owner, on behalf of the Fund and the Master Fund, has appointed Invesco Aim Distributors as a marketing agent. Invesco Aim Distributors assists the Managing Owner and the Administrator with certain functions and duties such as providing various educational and marketing activities regarding the Fund, primarily in the secondary trading market, which activities include, but are not limited to, communicating the Fund’s name, characteristics, uses, benefits, and risks, consistent with the prospectus. Invesco Aim Distributors will not open or maintain customer accounts or handle orders for the Fund. Invesco Aim Distributors engages in public seminars, road shows, conferences, media interviews, and distributes sales literature and other communications (including electronic media) regarding the Fund.
(4) Summary of Significant Accounting Policies
(a) Basis of Presentation and Consolidation
The consolidated financial statements of the Fund have been prepared using U.S. generally accepted accounting principles, and they include the consolidated financial statement balances of the Fund and the Master Fund. Upon the initial offering of the Shares on January 31, 2006, the capital raised by the Fund was used to purchase 100% of the common units of beneficial interest of the Master Fund (the “Master Fund Limited Units”) (excluding common units of beneficial interest of the Master Fund held by the Managing Owner (the “Master Fund General Units”)). The Master Fund Limited Units owned by the Fund provide the Fund and its investors certain controlling rights and abilities over the Master Fund. Consequently, the financial statement balances of the Master Fund have been consolidated with the Fund’s financial statement balances and all significant inter-company balances and transactions have been eliminated. Certain amounts in the 2008 financial statements have been reclassified to conform to the 2009 presentation.
(b) Use of Estimates
The preparation of the consolidated financial statements in conformity with U.S. generally accepted accounting principles requires management to make estimates and assumptions that affect the reported amounts of assets and liabilities, revenues and expenses and related disclosure of contingent assets and liabilities during the reporting period of the consolidated financial statements and accompanying notes. Actual results could differ from those estimates.
12
Table of Contents
PowerShares DB Commodity Index Tracking Fund and Subsidiary
Notes to Unaudited Consolidated Financial Statements—(Continued)
September 30, 2009
(c) Financial Instruments and Fair Value
United States Treasury Obligations and commodity futures contracts are recorded in the consolidated statements of financial condition on a trade date basis at fair value with changes in fair value recognized in earnings in each period. The fair value of a financial instrument is the amount that would be received to sell an asset or paid to transfer a liability in an orderly transaction between market participants at the measurement date (the exit price).
Financial Accounting Standards Board, (FASB), fair value measurement and disclosure guidance requires a fair value hierarchy that prioritizes the inputs to valuation techniques used to measure fair value. The hierarchy gives the highest priority to unadjusted quoted prices in active markets for identical assets and liabilities (Level 1 measurements) and the lowest priority to unobservable inputs (Level 3 measurements). The three levels of the fair value hierarchy are described below:
Basis of Fair Value Measurement
| Level 1: | Unadjusted quoted prices in active markets that are accessible at the measurement date for identical, unrestricted assets or liabilities; | |
| Level 2: | Quoted prices in markets that are not active or financial instruments for which all significant inputs are observable, either directly or indirectly; | |
| Level 3: | Prices or valuations that require inputs that are both significant to the fair value measurement and unobservable. | |
A financial instrument’s level within the fair value hierarchy is based on the lowest level of any input that is significant to the fair value measurement.
In determining fair value of United States Treasury Obligations and commodity futures contracts, the Fund uses unadjusted quoted market prices in active markets. United States Treasury Obligations and commodity futures contracts are classified within Level 1 of the fair value hierarchy. The Fund does not adjust the quoted prices for United States Treasury Obligations and commodity futures contracts.
(d) Deposits with Broker
The Fund deposits cash and United States Treasury Obligations with its Commodity Broker subject to Commodity Futures Trading Commission (the “CFTC”) regulations and various exchange and broker requirements. The combination of the Fund’s deposits with its Commodity Broker of cash and United States Treasury Obligations and the unrealized profit or loss on open futures contracts (variation margin) represents the Fund’s overall equity in its broker trading account. To meet the Fund’s initial margin requirements, the Fund holds United States Treasury Obligations. The Fund uses its cash held by the Commodity Broker to satisfy variation margin requirements. The Fund earns interest on its cash deposited with the Commodity Broker.
(e) United States Treasury Obligations
The Fund records purchases and sales of United States Treasury Obligations on a trade date basis. These holdings are marked to market based on quoted market closing prices. The Fund holds United States Treasury Obligations for deposit with the Master Fund’s Commodity Broker to meet margin requirements and for trading purposes. Interest income is recognized on an accrual basis when earned. Premiums and discounts are amortized or accreted over the life of the United States Treasury Obligations. Included in the United States Treasury Obligations as of September 30, 2009 and December 31, 2008 was $248,578,351 and $154,620,803, respectively, which is restricted and held against initial margin of the open futures contracts. The Fund purchased $160,000,000 notional amount of United States Treasury Obligations which was unpaid as of September 30, 2009. As a result, a payable for securities purchased is reported for $159,955,511. There was no amount payable for securities purchased as of December 31, 2008.
(f) Cash Held by Broker
The Fund’s arrangement with the Commodity Broker requires the Fund to meet its variation margin requirement related to the price movements, both positive and negative, on futures contracts held by the Fund by keeping cash on deposit
13
Table of Contents
PowerShares DB Commodity Index Tracking Fund and Subsidiary
Notes to Unaudited Consolidated Financial Statements—(Continued)
September 30, 2009
with the Commodity Broker. The Fund defines cash and cash equivalents held by the Commodity Broker to be highly liquid investments, with original maturities of three months or less, when purchased. As of September 30, 2009 and December 31, 2008, the Fund had cash held by the Commodity Broker of $365,051,959 and $1,713,943,642, respectively, of which $144,288,364 and $688,785,759 was on deposit to satisfy the Fund’s negative variation margin on open futures contracts, respectively. There were no cash equivalents held by the Fund as of September 30, 2009 and December 31, 2008.
(g) Income Taxes
The Fund and the Master Fund are classified as partnerships for U.S. federal income tax purposes. Accordingly, neither the Fund nor the Master Fund will incur U.S. federal income taxes. No provision for federal, state, and local income taxes has been made in the accompanying consolidated financial statements, as investors are individually liable for income taxes, if any, on their allocable share of the Fund’s share of the Master Fund’s income, gain, loss, deductions and other items.
The following are the major tax jurisdictions for the Fund and the earliest tax year subject to examination:
| Jurisdiction |
Tax Year | |
| US Federal |
2006 | |
| State of New York |
2006 | |
| New York City |
2006 | |
| State of Florida |
2006 | |
| State of Georgia |
2006 | |
| State of Maine |
2006 | |
| State of Missouri |
2006 | |
| State of New Jersey |
2006 | |
| State of Oregon |
2006 | |
| State of Pennsylvania |
2006 | |
| State of Utah |
2006 | |
| State of West Virginia |
2006 |
(h) Futures Contracts
All commodity futures contracts are held and used for trading purposes. The commodity futures are recorded on a trade date basis and open contracts are recorded in the consolidated statement of financial condition at fair value on the last business day of the period, which represents market value for those commodity futures for which market quotes are readily available. However, when market closing prices are not available, the Managing Owner may value an asset of the Master Fund pursuant to policies the Managing Owner has adopted, which are consistent with normal industry standards. Realized gains (losses) and changes in unrealized appreciation (depreciation) on open positions are determined on a specific identification basis and recognized in the consolidated statement of income and expenses in the period in which the contract is closed or the changes occur, respectively. As of September 30, 2009 and December 31, 2008, the futures contracts held by the Fund were in a net unrealized depreciation position of $144,288,364 and $688,785,759, respectively.
(i) Management Fee
The Master Fund pays the Managing Owner a management fee (the “Management Fee”), monthly in arrears, in an amount equal to 0.75% per annum of the daily net asset value of the Master Fund. No separate Management Fee is paid by the Fund. The Management Fee is paid in consideration of the Managing Owner’s commodity futures trading advisory services.
(j) Brokerage Commissions and Fees
The Master Fund incurs all brokerage commissions, including applicable exchange fees, NFA fees, give-up fees, pit brokerage fees and other transaction related fees and expenses charged in connection with trading activities by the Commodity Broker. These costs are recorded as brokerage commissions and fees in the consolidated statement of income and expenses as incurred. The Commodity Broker’s brokerage commissions and trading fees are determined on a contract-by-contract basis. On average, total charges paid to the Commodity Broker were less than $10.00 per round-turn trade for the Three Months Ended September 30, 2009 and 2008 and the Nine Months Ended September 30, 2009 and 2008.
14
Table of Contents
PowerShares DB Commodity Index Tracking Fund and Subsidiary
Notes to Unaudited Consolidated Financial Statements—(Continued)
September 30, 2009
(k) Routine Operational, Administrative and Other Ordinary Expenses
The Managing Owner assumes all routine operational, administrative and other ordinary expenses of the Fund and the Master Fund, including, but not limited to, computer services, the fees and expenses of the Trustee, legal and accounting fees and expenses, tax preparation expenses, filing fees and printing, mailing and duplication costs. Accordingly, all such expenses are not reflected in the consolidated statement of income and expenses of the Fund.
(l) Organizational and Offering Costs
All organizational and offering expenses of the Fund and its Master Fund are incurred and assumed by the Managing Owner. Neither the Fund nor its Master Fund are, or will be, responsible to the Managing Owner for the reimbursement of organizational and offering costs. Expenses incurred in connection with the continuous offering of Shares also will be paid by the Managing Owner.
(m) Non-Recurring and Unusual Fees and Expenses
The Master Fund pays all fees and expenses, if any, of the Fund and the Master Fund, which are non-recurring and unusual in nature. Such expenses include legal claims and liabilities, litigation costs or indemnification or other unanticipated expenses. Such fees and expenses, by their nature, are unpredictable in terms of timing and amount. For the Three Months Ended September 30, 2009 and 2008 and the Nine Months Ended September 30, 2009 and 2008, the Fund and the Master Fund did not incur such expenses.
(5) Fair Value Measurements
The Fund’s assets and liabilities recorded at fair value have been categorized based upon the fair value hierarchy discussed in Note 4(c).
Assets and Liabilities Measured at Fair Value were as follows:
| September 30, 2009 | December 31, 2008 | |||||||
| United States Treasury Obligations (Level 1) |
$ | 3,402,537,602 | $ | 174,793,945 | ||||
| Commodity Futures Contracts (Level 1) |
$ | (144,288,364 | ) | $ | (688,785,759 | ) | ||
There were no Level 2 or Level 3 holdings as of September 30, 2009 and December 31, 2008.
(6) Financial Instrument Risk
In the normal course of its business, the Master Fund is party to financial instruments with off-balance sheet risk. The term “off-balance sheet risk” refers to an unrecorded potential liability that, even though it does not appear on the balance sheet, may result in a future obligation or loss. The financial instruments used by the Master Fund are commodity futures, whose values are based upon an underlying asset and generally represent future commitments that have a reasonable possibility of being settled in cash or through physical delivery. The financial instruments are traded on an exchange and are standardized contracts.
Market risk is the potential for changes in the value of the financial instruments traded by the Master Fund due to market changes, including fluctuations in commodity prices. In entering into these futures contracts, there exists a market risk that such futures contracts may be significantly influenced by adverse market conditions, resulting in such futures contracts being less valuable. If the markets should move against all of the futures contracts at the same time, the Master Fund could experience substantial losses.
Credit risk is the possibility that a loss may occur due to the failure of an exchange clearinghouse to perform according to the terms of a futures contract. Credit risk with respect to exchange-traded instruments is reduced to the extent that an exchange or clearing organization acts as a counterparty to the transactions. The Master Fund’s risk of loss in the event of counterparty default is typically limited to the amounts recognized in the consolidated statement of financial condition and not represented by the futures contract or notional amounts of the instruments.
15
Table of Contents
PowerShares DB Commodity Index Tracking Fund and Subsidiary
Notes to Unaudited Consolidated Financial Statements—(Continued)
September 30, 2009
The Fund and the Master Fund have not utilized, nor do they expect to utilize in the future, special purpose entities to facilitate off-balance sheet financing arrangements and have no loan guarantee arrangements or off-balance sheet arrangements of any kind, other than agreements entered into in the normal course of business noted above.
(7) Share Purchases and Redemptions
(a) Purchases
Shares may be purchased from the Fund only by Authorized Participants in one or more blocks of 200,000 Shares, called a Basket. The Fund issues Shares in Baskets only to Authorized Participants continuously as of noon, New York time, on the business day immediately following the date on which a valid order to create a Basket is accepted by the Fund, at the net asset value of 200,000 Shares as of the closing time of the NYSE Arca or the last to close of the exchanges on which the Master Fund’s assets are traded, whichever is later, on the date that a valid order to create a Basket is accepted by the Fund.
(b) Redemptions
On any business day, an Authorized Participant may place an order with the Managing Owner to redeem one or more Baskets. Redemption orders must be placed by 10:00 a.m., New York time. The day on which the Managing Owner receives a valid redemption order is the redemption order date. Redemption orders are irrevocable. The redemption procedures allow Authorized Participants to redeem Baskets. Individual shareholders may not redeem directly from the Fund.
By placing a redemption order, an Authorized Participant agrees to deliver the Baskets to be redeemed through The Depository Trust Company’s (the “DTC”) book-entry system to the Fund not later than noon, New York time, on the business day immediately following the redemption order date. By placing a redemption order, and prior to receipt of the redemption proceeds, an Authorized Participant’s DTC account is charged the non-refundable transaction fee due for the redemption order.
The redemption proceeds from the Fund consist of the cash redemption amount. The cash redemption amount is equal to the net asset value of the number of Basket(s) requested in the Authorized Participant’s redemption order as of the closing time of the NYSE Arca or the last to close of the exchanges on which the Master Fund’s assets are traded, whichever is later, on the redemption order date. The Fund will distribute the cash redemption amount at noon, New York time, on the business day immediately following the redemption order date through DTC to the account of the Authorized Participant as recorded on DTC’s book-entry system.
The redemption proceeds due from the Fund are delivered to the Authorized Participant at noon, New York time, on the business day immediately following the redemption order date if, by such time on such business day immediately following the redemption order date, the Fund’s DTC account has been credited with the Baskets to be redeemed. If the Fund’s DTC account has not been credited with all of the Baskets to be redeemed by such time, the redemption proceeds are delivered to the extent of whole Baskets received. Any remainder of the redemption proceeds are delivered on the next business day to the extent of remaining whole Baskets received if the Managing Owner receives the fee applicable to the extension of the redemption distribution date which the Managing Owner may, from time-to-time, determine and the remaining Baskets to be redeemed are credited to the Fund’s DTC account by noon, New York time, on such next business day. Any further outstanding amount of the redemption order will be canceled. The Managing Owner is also authorized to deliver the redemption proceeds notwithstanding that the Baskets to be redeemed are not credited to the Fund’s DTC account by noon, New York time, on the business day immediately following the redemption order date if the Authorized Participant has collateralized its obligation to deliver the Baskets through DTC’s book-entry system on such terms as the Managing Owner may from time-to-time agree upon.
[Remainder of page left blank intentionally.]
16
Table of Contents
PowerShares DB Commodity Index Tracking Fund and Subsidiary
Notes to Unaudited Consolidated Financial Statements—(Continued)
September 30, 2009
(c) Share Transactions
Summary of Share Transactions for the Three Months Ended September 30, 2009 and 2008
and Nine Months Ended September 30, 2009 and 2008
| Shares Three Months Ended |
Paid in Capital Three Months Ended |
Shares Nine Months Ended |
Paid in Capital Nine Months Ended |
|||||||||||||||||||||||||
| September 30, 2009 |
September 30, 2008 |
September 30, 2009 |
September 30, 2008 |
September 30, 2009 |
September 30, 2008 |
September 30, 2009 |
September 30, 2008 |
|||||||||||||||||||||
| Shares Sold |
27,400,000 | 3,800,000 | $ | 618,543,062 | $ | 145,776,468 | 105,000,000 | 27,800,000 | $ | 2,278,817,934 | $ | 1,009,983,770 | ||||||||||||||||
| Shares Redeemed |
(4,000,000 | ) | (16,400,000 | ) | (86,220,800 | ) | (649,931,558 | ) | (5,000,000 | ) | (23,400,000 | ) | (105,878,052 | ) | (917,835,804 | ) | ||||||||||||
| Net Increase (Decrease) |
23,400,000 | (12,600,000 | ) | $ | 532,322,262 | $ | (504,155,090 | ) | 100,000,000 | 4,400,000 | $ | 2,172,939,882 | $ | 92,147,966 | ||||||||||||||
(8) Profit and Loss Allocations and Distributions
Pursuant to the Amended and Restated Declaration of Trust and Trust Agreement of the Master Fund, income and expenses are allocated pro rata to the Managing Owner as holder of the General Shares and to the Shareholders monthly based on their respective percentage interests as of the close of the last trading day of the preceding month. Any losses allocated to the Managing Owner (as the owner of the General Shares) which are in excess of the Managing Owner’s capital balance are allocated to the Shareholders in accordance with their respective interest in the Master Fund as a percentage of total shareholders’ equity. Distributions (other than redemption of units) may be made at the sole discretion of the Managing Owner on a pro rata basis in accordance with the respective capital balances of the shareholders.
(9) Commitments and Contingencies
The Managing Owner, either in its own capacity or in its capacity as the Managing Owner and on behalf of the Fund and the Master Fund, has entered into various service agreements that contain a variety of representations, or provide indemnification provisions related to certain risks service providers undertake in performing services which are in the best interests of the Fund and the Master Fund. As of September 30, 2009, no claims had been received by the Fund or the Master Fund and it was therefore not possible to estimate the Fund’s and the Master Fund’s potential future exposure under such indemnification provisions.
(10) Net Asset Value and Financial Highlights
The Fund is presenting the following net asset value and financial highlights related to investment performance for a Share outstanding for the Three Months Ended September 30, 2009 and 2008 and for the Nine Months Ended September 30, 2009 and 2008. The net investment income and total expense ratios are calculated using average net asset value. The net asset value presentation is calculated using daily Shares outstanding. The net investment income and total expense ratios have been annualized. The total return is based on the change in net asset value of the Shares during the period. An individual investor’s return and ratios may vary based on the timing of capital transactions.
The Fund invests substantially all of its assets in the Master Fund in a master-feeder structure. The Fund holds no investment assets other than Master Fund Limited Units. The Fund is the majority Master Fund Limited Unit owner and the Managing Owner holds a non-controlling interest in the Master Fund. Each Share issued by the Fund correlates with the Master Fund Limited Unit issued by the Master Fund and held by the Fund.
Net asset value per Master Fund Limited Unit and Master Fund General Unit (collectively, “Master Fund Units”) is the net asset value of the Master Fund divided by the number of outstanding Master Fund Units. Because there is a one-to-one correlation between Shares and the Master Fund Limited Units, the net asset value per Share and the net asset value per Master Fund Limited Unit are equal.
[Remainder of page left blank intentionally.]
17
Table of Contents
PowerShares DB Commodity Index Tracking Fund and Subsidiary
Notes to Unaudited Consolidated Financial Statements—(Continued)
September 30, 2009
| Three Months Ended | Nine Months Ended | |||||||||||||||
| September 30, 2009 |
September 30, 2008 |
September 30, 2009 |
September 30, 2008 |
|||||||||||||
| Net Asset Value |
||||||||||||||||
| Net asset value per Share, beginning of period |
$ | 22.46 | $ | 44.94 | $ | 21.42 | $ | 31.46 | ||||||||
| Net realized and change in unrealized gain (loss) on United States Treasury Obligations and Futures |
(0.24 | ) | (11.43 | ) | 0.87 | 1.82 | ||||||||||
| Net investment income (loss) |
(0.03 | ) | 0.10 | (0.10 | ) | 0.33 | ||||||||||
| Net income (loss) |
(0.27 | ) | (11.33 | ) | 0.77 | 2.15 | ||||||||||
| Net asset value per Share, end of period |
$ | 22.19 | $ | 33.61 | $ | 22.19 | $ | 33.61 | ||||||||
| Market value per Share, beginning of period |
$ | 22.62 | $ | 44.78 | $ | 21.19 | $ | 31.56 | ||||||||
| Market value per Share, end of period |
$ | 22.06 | $ | 33.89 | $ | 22.06 | $ | 33.89 | ||||||||
| Ratio to average Shares* |
||||||||||||||||
| Net investment income (loss) |
(0.61 | )% | 0.97 | % | (0.63 | )% | 1.14 | % | ||||||||
| Total expenses |
0.76 | % | 0.77 | % | 0.78 | % | 0.78 | % | ||||||||
| Total Return, at net asset value ** |
(1.20 | )% | (25.21 | )% | 3.59 | % | 6.83 | % | ||||||||
| Total Return, at market value ** |
(2.48 | )% | (24.32 | )% | 4.11 | % | 7.38 | % | ||||||||
| * | Percentages are annualized. |
| ** | Percentages are not annualized. |
(11) Subsequent Events
The Fund evaluated the need for disclosures and/or adjustments resulting from subsequent events through November 2, 2009, the date the financial statements were available to be issued. This evaluation did not result in any subsequent events that necessitated disclosures and/or adjustments, other than events disclosed below.
On September 30, 2009, the Managing Owner announced it will replace the Index with the Deutsche Bank Liquid Commodity Index-Optimum Yield Diversified Excess Return. The Fund will commence tracking the Deutsche Bank Liquid Commodity Index-Optimum Yield Diversified Excess Return on October 19, 2009. The Fund will add Brent Crude, Copper Grade A, Natural Gas, RBOB Gasoline, Silver, Soybeans, Sugar and Zinc in addition to the six commodities the Fund currently tracks. The additional commodities will diversify the Fund’s exposure and reduce the Fund’s holdings in Chicago Corn and Wheat, and satisfy position limits imposed by the Commodity Futures Trading Commission in those two commodities.
18
Table of Contents
| ITEM 2. | MANAGEMENT’S DISCUSSION AND ANALYSIS OF FINANCIAL CONDITION AND RESULTS OF OPERATIONS. |
This information should be read in conjunction with the consolidated financial statements and notes included in Item 1 of Part I of this Quarterly Report (the “Report”). The discussion and analysis which follows may contain trend analysis and other forward-looking statements within the meaning of Section 21E of the Securities Exchange Act of 1934 which reflect our current views with respect to future events and financial results. Words such as “anticipate”, “expect”, “intend,” “plan,” “believe,” “seek,” “outlook” and “estimate”, as well as similar words and phrases, signify forward-looking statements. PowerShares DB Commodity Index Tracking Fund’s forward-looking statements are not guarantees of future results and conditions and important factors, risks and uncertainties may cause our actual results to differ materially from those expressed in our forward-looking statements.
You should not place undue reliance on any forward-looking statements. Except as expressly required by the Federal securities laws, DB Commodity Services LLC (the “Managing Owner”), undertakes no obligation to publicly update or revise any forward-looking statements or the risks, uncertainties or other factors described in this Report, as a result of new information, future events or changed circumstances or for any other reason after the date of this Report.
Overview/Introduction
The Fund and the Master Fund seek to track changes, whether positive or negative, in the level of the Deutsche Bank Liquid Commodity Index–Optimum Yield Excess Return™ (the “Index”), over time, plus the excess, if any, of the Master Fund’s interest income from its holdings of United States Treasury Obligations and other high credit quality short-term fixed income securities over the expenses of the Fund and the Master Fund. The Shares are designed for investors who want a cost-effective and convenient way to invest in a group of commodity futures on U.S. and non-U.S. markets.
The Fund pursues its investment objective by investing substantially all of its assets in the Master Fund. The Master Fund pursues its investment objective by investing in a portfolio of exchange-traded futures contracts in the commodities comprising the Index (the “Index Commodities”). The Index Commodities are Light, Sweet Crude Oil, Heating Oil, Aluminum, Gold, Corn and Wheat. The Index is composed of notional amounts of each of the Index Commodities. The notional amounts of each Index Commodity included in the Index are broadly in proportion to historic levels of the world’s production and stocks of the Index Commodities. The Master Fund’s portfolio also includes United States Treasury Obligations and other high credit quality short-term fixed income securities for deposit with the Master Fund’s Commodity Broker as margin. The sponsor of the Index is Deutsche Bank AG London (the “Index Sponsor”). DBLCI™ and Deutsche Bank Liquid Commodity Index™ are trademarks of Deutsche Bank AG London. Trademark applications in the United States are pending with respect to both the Fund and the Index. Deutsche Bank AG London is an affiliate of the Fund, the Master Fund and the Managing Owner.
The closing level of the Index is calculated on each business day by the Index Sponsor based on the closing price of the futures contracts for each of the Index Commodities and the notional amount of such Index Commodity.
The Index is rebalanced annually in November to ensure that each of the Index Commodities is weighted in the same proportion that such Index Commodities were weighted on July 31, 1988 (the “Base Date”). The following table reflects the index base weights of each Index Commodity on the Base Date (the “Index Base Weights”):
| Index Commodity |
Index Base Weight (%) | |
| Light, Sweet Crude Oil |
35.00 | |
| Heating Oil |
20.00 | |
| Aluminum |
12.50 | |
| Gold |
10.00 | |
| Corn |
11.25 | |
| Wheat |
11.25 | |
| Closing Level on Base Date: |
100.00 | |
The Index has been calculated back to the Base Date. On the Base Date, the closing level was 100.
19
Table of Contents
The Index Commodities are traded on the following futures exchanges: Light, Sweet Crude Oil and Heating Oil: New York Mercantile Exchange; Aluminum: The London Metal Exchange Limited; Gold: Commodity Exchange Inc., New York; and Corn and Wheat: Board of Trade of the City of Chicago Inc.
The composition of the Index may be adjusted in the event that the Index Sponsor is not able to calculate the closing prices of the Index Commodities.
The Index includes provisions for the replacement of futures contracts as they approach maturity. This replacement takes place over a period of time in order to lessen the impact on the market for the futures contracts being replaced. With respect to each Index Commodity, the Master Fund employs a rule-based approach when it “rolls” from one futures contract to another. Rather than select a new futures contract based on a predetermined schedule (e.g., monthly), each Index Commodity rolls to the futures contract which generates the best possible “implied roll yield.” The futures contract with a delivery month within the next thirteen months which generates the best possible implied roll yield will be included in the Index. As a result, each Index Commodity is able to potentially maximize the roll benefits in backwardated markets and minimize the losses from rolling in contangoed markets.
In general, as a futures contract approaches its expiration date, its price will move towards the spot price in a contangoed market. Assuming the spot price does not change, this would result in the futures contract price decreasing and a negative implied roll yield. The opposite is true in a backwardated market. Rolling in a contangoed market will tend to cause a drag on an Index Commodity’s contribution to the Fund’s return while rolling in a backwardated market will tend to cause a push on an Index Commodity’s contribution to the Fund’s return.
If the Managing Owner determines in its commercially reasonable judgment that it has become impracticable or inefficient for any reason for the Master Fund to gain full or partial exposure to any Index Commodity by investing in a specific futures contract that is a part of the Index, the Master Fund may invest in a futures contract referencing the particular Index Commodity other than the specific contract that is a part of the Index or, in the alternative, invest in other futures contracts not based on the particular Index Commodity if, in the commercially reasonable judgment of the Managing Owner, such futures contracts tend to exhibit trading prices that correlate with a futures contract that is a part of the Index. Please see http://dbfunds.db.com/dbc/weights.aspx with respect to the most recently available weighted composition of the DBC Fund and http://dbfunds.db.com/dbc/index.aspx with respect to the composition of the DBC Fund’s index on the Base Date.
The Index is calculated in USD on both an excess return (unfunded) and total return (funded) basis.
The futures contract price for each Index Commodity will be the exchange closing prices for such Index Commodity on each weekday when banks in New York, New York, are open (the “Index Business Days”). If a weekday is not an Exchange Business Day (as defined in the following sentence) but is an Index Business Day, the exchange closing price from the previous Index Business Day will be used for each Index Commodity. “Exchange Business Day” means, in respect of an Index Commodity, a day that is a trading day for such Index Commodity on the relevant exchange (unless either an Index disruption event or force majeure event has occurred).
On the first New York business day (the “Verification Date”) of each month, each Index Commodity futures contract will be tested in order to determine whether to continue including it in the Index. If the Index Commodity futures contract requires delivery of the underlying commodity in the next month, known as the Delivery Month, a new Index Commodity futures contract will be selected for inclusion in the Index. For example, if the first New York business day is October 1, 2009, and the Delivery Month of the Index Commodity futures contract currently in the Index is November 2009, a new Index Commodity futures contract with a later Delivery Month will be selected.
For each underlying Index Commodity in the Index, the new Index Commodity futures contract selected will be the Index Commodity futures contract with the best possible “implied roll yield” based on the closing price for each eligible Index Commodity futures contract. Eligible Index Commodity futures contracts are any Index Commodity futures contracts having a Delivery Month (i) no sooner than the month after the Delivery Month of the Index Commodity futures contract currently in the Index, and (ii) no later than the 13th month after the Verification Date. For example, if the first New York business day is October 1, 2009 and the Delivery Month of an Index Commodity futures contract currently in the Index is November 2009, the Delivery Month of an eligible new Index Commodity futures contract must be between December 2009 and October 2010. The implied roll yield is then calculated and the futures contract on the Index Commodity with the best possible implied roll yield is then selected. If two futures contracts have the same implied roll yield, the futures contract with the minimum number of months prior to the Delivery Month is selected.
20
Table of Contents
After the futures contract selection, the monthly roll for each Index Commodity subject to a roll in that particular month unwinds the old futures contract and enters a position in the new futures contract. This takes place between the 2nd and 6th Index Business Day of the month.
On each day during the roll period, new notional holdings are calculated. The calculations for the old Index Commodities that are leaving the Index and the new Index Commodities are then calculated.
On all days that are not monthly index roll days, the notional holdings of each Index Commodity future remains constant.
The Index is re-weighted on an annual basis on the 6th Index Business Day of each November.
The calculation of the Index is expressed as the weighted average return of the Index Commodities.
Under the Amended and Restated Declaration of Trust and Trust Agreements of each of the Fund and the Master Fund (the “Trust Agreements”), Wilmington Trust Company, the Trustee of the Fund and the Master Fund, has delegated to the Managing Owner the exclusive management and control of all aspects of the business of the Fund and the Master Fund. The Trustee will have no duty or liability to supervise or monitor the performance of the Managing Owner, nor will the Trustee have any liability for the acts or omissions of the Managing Owner.
The Index Sponsor obtains information for inclusion in, or for use in the calculation of, the Index from sources the Index Sponsor considers reliable. None of the Index Sponsor, the Managing Owner, the Fund, the Master Fund or any of their respective affiliates accepts responsibility for or guarantees the accuracy and/or completeness of the Index or any data included in the Index.
The Shares are intended to provide investment results that generally correspond to the changes, positive or negative, in the levels of the Index over time. The value of the Shares is expected to fluctuate in relation to changes in the value of the Master Fund’s portfolio. The market price of the Shares may not be identical to the net asset value per Share, but these two valuations are expected to be very close.
Performance Summary
This report covers the three months ended September 30, 2009 and 2008 (hereinafter referred to as the “Three Months Ended September 30, 2009” and the “Three Months Ended September 30, 2008”, respectively) and the nine months ended September 30, 2009 and 2008 (hereinafter referred to as the “Nine Months Ended September 30, 2009” and the “Nine Months Ended September 30, 2008”, respectively). The Fund commenced trading on the American Stock Exchange (now known as the NYSE Alternext US LLC (the “NYSE Alternext”)) on February 3, 2006, and, as of November 25, 2008, is listed on the NYSE Arca, Inc. (the “NYSE Arca”).
Performance of the Fund and the exchange traded Shares are detailed below in “Results of Operations”. Past performance of the Fund is not necessarily indicative of future performance.
The Index is intended to reflect the change in market value of the Index Commodities. In turn, the notional amounts of each Index Commodity are broadly in proportion to historic levels of the world’s production and stocks of such Index Commodities. The Deutsche Bank Liquid Commodity Index-Optimum Yield Total Return™, or DBLCI-OYTR™ consists of the Index plus 3-month United States Treasury Obligations returns. Past Index results are not necessarily indicative of future changes, positive or negative, in the Index closing levels.
The section “Summary of DBLCI-OYTR™ and Underlying Index Commodity Returns for the Three Months Ended September 30, 2009 and 2008 and the Nine Months Ended September 30, 2009 and 2008” below provides an overview of the changes in the closing levels of DBLCI-OYTR™ by disclosing the change in market value of each underlying component Index Commodity through a “surrogate” (and analogous) index plus 3-month United States Treasury Obligations returns.
The following chart highlights the results of the DBLCI-OYTR™ for the Three Months Ended September 30, 2009 and 2008 and the Nine Months Ended September 30, 2009 and 2008. Please note also that the Fund’s objective is to track the Index (not the DBLCI-OYTR™), and the Fund does not attempt to outperform or underperform the Index.
21
Table of Contents
Summary of DBLCI-OYTR™ and Underlying Index Commodity Returns for
the Three Months Ended September 30, 2009 and 2008 and the Nine Months Ended September 30, 2009 and 2008
| Underlying Index |
Aggregate returns for indexes in the DBLCI-OYTR™ | |||||||||||
| Three Months Ended September 30, 2009 |
Three Months Ended September 30, 2008 |
Nine Months Ended September 30, 2009 |
Nine Months Ended September 30, 2008 |
|||||||||
| DB Crude Oil Indices |
-1.04 | % | -27.12 | % | 23.36 | % | 11.40 | % | ||||
| DB Heating Oil Indices |
-3.10 | % | -25.59 | % | 5.71 | % | 21.63 | % | ||||
| DB Aluminum Indices |
14.04 | % | -23.08 | % | 14.72 | % | -3.06 | % | ||||
| DB Gold Indices |
8.49 | % | -5.72 | % | 13.28 | % | 3.21 | % | ||||
| DB Corn Indices |
-6.29 | % | -35.35 | % | -23.71 | % | 4.31 | % | ||||
| DB Wheat Indices |
-17.03 | % | -20.63 | % | -30.52 | % | -14.32 | % | ||||
| AGGREGATE RETURN | -0.89 | % | -25.30 | % | 4.36 | % | 7.03 | % | ||||
If the Fund’s interest income from its holdings of fixed income securities were to exceed the Fund’s fees and expenses, the total return on an investment in the Fund is expected to outperform the Index and underperform the DBLCI-OYTR™. The only difference between the Index and the DBLCI-OYTR™ is that the Index does not include interest income from a hypothetical basket of fixed income securities while the DBLCI-OYTR™ does include such a component. The difference between the Index and the DBLCI-OYTR™ is attributable entirely to the hypothetical interest income from this hypothetical basket of fixed income securities. If the Fund’s interest income from its holdings of fixed income securities exceeds the Fund’s fees and expenses, then the amount of such excess is expected to be distributed periodically. The market price of the Shares is expected to closely track the Index. The total return on an investment in the Fund over any period is the sum of the capital appreciation or depreciation of the Shares over the period, plus the amount of any distributions during the period. Consequently, the Fund’s total return is expected to outperform the Index by the amount of the excess, if any, of its interest income over its fees and expenses but, as a result of the Fund’s fees and expenses, the total return on the Fund is expected to underperform the DBLCI-OYTR™. If the Fund’s fees and expenses were to exceed the Fund’s interest income from its holdings of fixed income securities, the total return on an investment in the Fund is expected to underperform the Index.
Net Asset Value
Net asset value means the total assets of the Master Fund, including, but not limited to, all futures, cash and investments less total liabilities of the Master Fund, each determined on the basis of U.S. generally accepted accounting principles, consistently applied under the accrual method of accounting. In particular, net asset value includes any unrealized appreciation or depreciation on open commodity futures contracts, and any other credit or debit accruing to the Master Fund but unpaid or not received by the Master Fund. All open commodity futures contracts will be calculated at their then current market value, which will be based upon the settlement price for that particular commodity futures contract traded on the applicable exchange on the date with respect to which net asset value is being determined; provided, that if a commodity futures contract could not be liquidated on such day, due to the operation of daily limits or other rules of the exchange upon which that position is traded or otherwise, the settlement price on the most recent day on which the position could have been liquidated will be the basis for determining the market value of such position for such day. The Managing Owner may in its discretion (and only under extraordinary circumstances, including, but not limited to, periods during which a settlement price of a futures contract is not available due to exchange limit orders or force majeure type events such as systems failure, natural or man-made disaster, act of God, armed conflict, act of terrorism, riot or labor disruption or any similar intervening circumstance) value any asset of the Master Fund pursuant to such other principles as the Managing Owner deems fair and equitable so long as such principles are consistent with normal industry standards. Interest earned on the Master Fund’s brokerage account is accrued monthly. The amount of any distribution is a liability of the Master Fund from the day when the distribution is declared until it is paid.
22
Table of Contents
The Fund invests substantially all of its assets in the Master Fund in a master-feeder structure. The Fund holds no investment assets other than Master Fund Limited Units. The Fund is the majority Master Fund Limited Unit owner and the Managing Owner holds a minority interest in the Master Fund. Each Share issued by the Fund correlates with the Master Fund Limited Unit issued by the Master Fund and held by the Fund.
Net asset value per Master Fund Limited Unit and Master Fund General Unit (collectively, “Master Fund Units”) is the net asset value of the Master Fund divided by the number of outstanding Master Fund Units. Because there is a one-to-one correlation between Shares of the Fund and Master Fund Limited Units, the net asset value per Share of the Fund and the net asset value per Master Fund Limited Unit are equal.
Critical Accounting Policies
The Fund’s and Master Fund’s critical accounting policies are as follows:
Preparation of the financial statements and related disclosures in conformity with U.S. generally accepted accounting principles requires the application of appropriate accounting rules and guidance, as well as the use of estimates, and requires management to make estimates and assumptions that affect the reported amounts of assets and liabilities, revenue and expense and related disclosure of contingent assets and liabilities during the reporting period of the consolidated financial statements and accompanying notes. Both the Fund’s and the Master Fund’s application of these policies involve judgments and actual results may differ from the estimates used.
The Master Fund holds a significant portion of its assets in futures contracts and United States Treasury Obligations, both of which are recorded on a trade date basis and at fair value in the consolidated financial statements, with changes in fair value reported in the consolidated statement of income and expenses.
The use of fair value to measure financial instruments, with related unrealized gains or losses recognized in earnings in each period is fundamental to the Fund’s financial statements. The fair value of a financial instrument is the amount that would be received to sell an asset or paid to transfer a liability in an orderly transaction between market participants at the measurement date (the exit price).
In determining fair value of United States Treasury Obligations and commodity futures contracts, the Fund uses unadjusted quoted market prices in active markets. FASB fair value measurement and disclosure guidance requires a fair value hierarchy that prioritizes the inputs to valuation techniques used to measure fair value. The objective of a fair value measurement is to determine the price that would be received to sell an asset or paid to transfer a liability in an orderly transaction between market participants at the measurement date (an exit price). The hierarchy gives the highest priority to unadjusted quoted prices for identical assets or liabilities (Level 1 measurements) and the lowest priority to unobservable inputs (Level 3 measurements). Assets and liabilities are classified in their entirety based on the lowest level of input that is significant to the fair value measurement. See Note 4(c) within the financial statements in Item 1 for further information.
When market closing prices are not available, the Managing Owner may value an asset of the Master Fund pursuant to policies the Managing Owner has adopted, which are consistent with normal industry standards.
Realized gains (losses) and changes in unrealized gain (loss) on open positions are determined on a specific identification basis and recognized in the consolidated statement of income and expenses in the period in which the contract is closed or the changes occur, respectively.
Interest income on United States Treasury Obligations is recognized on an accrual basis when earned. Premiums and discounts are amortized or accreted over the life of the United States Treasury Obligations.
Market Risk
Trading in futures contracts involves the Master Fund entering into contractual commitments to purchase a particular commodity at a specified date and price. The market risk associated with the Master Fund’s commitments to purchase commodities is limited to the gross or face amount of the contracts held.
The Master Fund’s exposure to market risk is also influenced by a number of factors including the volatility of interest rates and foreign currency exchange rates, the liquidity of the markets in which the contracts are traded and the
23
Table of Contents
relationships among the contracts held. The inherent uncertainty of the Master Fund’s trading as well as the development of drastic market occurrences could ultimately lead to a loss of all or substantially all of the investors’ capital.
Credit Risk
When the Master Fund enters into futures contracts, the Master Fund will be exposed to credit risk that the counterparty to the contract will not meet its obligations. The counterparty for futures contracts traded on United States and on most foreign futures exchanges is the clearing house associated with the particular exchange. In general, clearing houses are backed by their corporate members who may be required to share in the financial burden resulting from the nonperformance by one of their members and, as such, should significantly reduce this credit risk. In cases where the clearing house is not backed by the clearing members (i.e., some foreign exchanges), it may be backed by a consortium of banks or other financial institutions. There can be no assurance that any counterparty, clearing member or clearinghouse will meet its obligations to the Master Fund.
The Commodity Broker, when acting as the Master Fund’s futures commission merchant in accepting orders for the purchase or sale of domestic futures contracts, is required by CFTC regulations to separately account for and segregate as belonging to the Master Fund all assets of the Master Fund relating to domestic futures trading and the Commodity Broker is not allowed to commingle such assets with other assets of the Commodity Broker. In addition, CFTC regulations also require the Commodity Broker to hold in a secure account assets of the Master Fund related to foreign futures trading.
Liquidity
All of the Master Fund’s source of capital is derived from the Fund through the Fund’s offering of Shares to Authorized Participants. Authorized Participants may then subsequently redeem such Shares. The Master Fund in turn allocates its net assets to commodities trading. A significant portion of the net asset value is held in United States Treasury Obligations and cash, which is used as margin for the Master Fund’s trading in commodities. The percentage that United States Treasury Obligations bear to the total net assets will vary from period to period as the market values of the Master Fund’s commodity interests change. The balance of the net assets are held in the Master Fund’s commodity trading account. Interest earned on the Master Fund’s interest-bearing funds is paid to the Master Fund.
The Master Fund’s commodity contracts may be subject to periods of illiquidity because of market conditions, regulatory considerations or for other reasons. For example, commodity exchanges generally have the ability to limit fluctuations in certain commodity futures contract prices during a single day by regulations referred to as “daily limits.” During a single day, no trades may be executed at prices beyond the daily limit. Once the price of a futures contract for a particular commodity has increased or decreased by an amount equal to the daily limit, positions in the commodity can neither be taken nor liquidated unless the traders are willing to effect trades at or within the limit. Commodity futures prices have occasionally moved the daily limit for several consecutive days with little or no trading. Such market conditions could prevent the Master Fund from promptly liquidating its commodity futures positions.
Because the Master Fund trades futures contracts, its capital is at risk due to changes in the value of futures contracts (market risk) or the inability of counterparties to perform under the terms of the contracts (credit risk).
On any business day, an Authorized Participant may place an order with the Managing Owner to redeem one or more Baskets. Redemption orders must be placed by 10:00 a.m., New York time. The day on which the Managing Owner receives a valid redemption order is the redemption order date. Redemption orders are irrevocable. The redemption procedures allow Authorized Participants to redeem Baskets. Individual Shareholders may not redeem directly from the Fund. By placing a redemption order, an Authorized Participant agrees to deliver the Baskets to be redeemed through DTC’s book-entry system to the Fund not later than noon, New York time, on the business day immediately following the redemption order date. By placing a redemption order, and prior to receipt of the redemption proceeds, an Authorized Participant’s DTC account is charged the non-refundable transaction fee due for the redemption order.
Cash Flows
The primary cash flow activities of the Fund are to raise capital from Authorized Participants through the issuance of Shares. This cash is invested into the Master Fund where it is used to invest in United States Treasury Obligations and to meet margin requirements as a result of the positions taken in futures contracts to match the fluctuations of the Index the Fund is tracking.
24
Table of Contents
Operating Activities
Net cash flow (used for) and provided by operating activities was $(3,521.8) million and $277.9 million for the Nine Months Ended September 30, 2009 and 2008, respectively. This amount primarily includes net purchases and sales of United States Treasury Obligations which are held at fair value on the statement of financial condition.
During the Nine Months Ended September 30, 2009, $8,043.3 million was paid to purchase United States Treasury Obligations and $4,818.4 million was received from sales and maturing contracts. During the Nine Months Ended September 30, 2008, $7,035.1 million was paid to purchase United States Treasury Obligations and $6,872.3 million was received from sales and maturing contracts. Unrealized appreciation on United States Treasury Obligations and futures increased by $544.7 million and decreased by $521.4 million during the Nine Months Ended September 30, 2009 and 2008, respectively.
Financing Activities
The Fund’s net cash flow provided by financing activities was $2,172.9 million and $92.1 million during the Nine Months Ended September 30, 2009 and 2008, respectively. This included $2,278.8 million and $1,010.0 million from the sale of Shares to Authorized Participants during the Nine Months Ended September 30, 2009 and 2008, respectively.
Results of Operations
FOR THE THREE MONTHS ENDED SEPTEMBER 30, 2009 AND 2008 AND THE NINE MONTHS ENDED SEPTEMBER 30, 2009 AND 2008
The Fund was launched on February 3, 2006 at $25.00 per Share. The Shares of the Fund traded on the NYSE Alternext from February 3, 2006 to November 25, 2008 and have been trading on the NYSE Arca since November 25, 2008.
The Fund and the Master Fund seek to track changes in the closing levels of the Deutsche Bank Liquid Commodity Index–Optimum Yield Excess Return™ (the “Index”), over time, plus the excess, if any, of the Master Fund’s interest income from its holdings of United States Treasury Obligations and other high credit quality short-term fixed income securities over the expenses of the Fund and the Master Fund. The following graphs illustrate changes in (i) the price of the Shares (as reflected by the graph “DBC”), (ii) the Fund’s NAV (as reflected by the graph “DBCNAV”), and (iii) the closing levels of the Index (as reflected by the graph “DBLCIX”). Whenever the interest income earned by the Fund exceeds Fund expenses, the price of the Shares generally has exceeded the levels of the Index primarily because the Share price reflects interest income from the Master Fund’s collateral holdings whereas the Index does not consider such interest income. There can be no assurances that the price of the Shares will continue to exceed the Index levels.
[Remainder of page left blank intentionally.]
25
Table of Contents
COMPARISON OF DBC, DBCNAV AND DBLCIX FOR THE THREE MONTHS ENDED
SEPTEMBER 30, 2009 AND 2008 AND THE NINE MONTHS ENDED SEPTEMBER 30, 2009 AND 2008
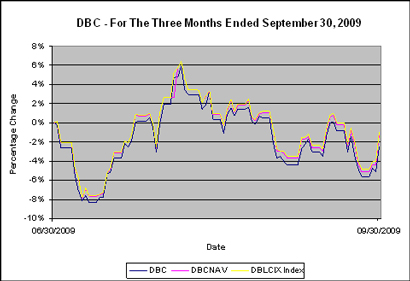
NEITHER THE PAST PERFORMANCE OF THE FUND NOR THE PRIOR INDEX LEVELS AND CHANGES, POSITIVE OR NEGATIVE, SHOULD BE TAKEN AS AN INDICATION OF THE FUND’S FUTURE PERFORMANCE.
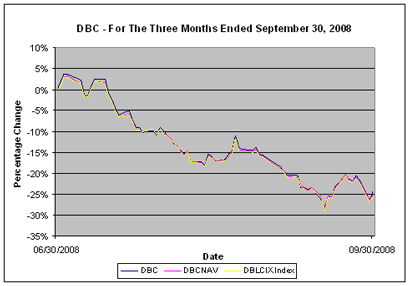
NEITHER THE PAST PERFORMANCE OF THE FUND NOR THE PRIOR INDEX LEVELS AND CHANGES, POSITIVE OR NEGATIVE, SHOULD BE TAKEN AS AN INDICATION OF THE FUND’S FUTURE PERFORMANCE.
See Additional Legends below.
26
Table of Contents
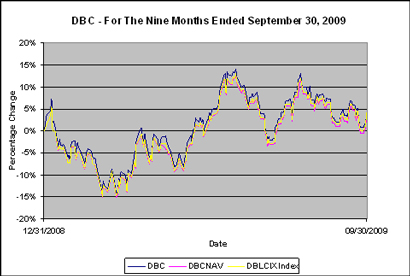
NEITHER THE PAST PERFORMANCE OF THE FUND NOR THE PRIOR INDEX LEVELS AND CHANGES, POSITIVE OR NEGATIVE, SHOULD BE TAKEN AS AN INDICATION OF THE FUND’S FUTURE PERFORMANCE.
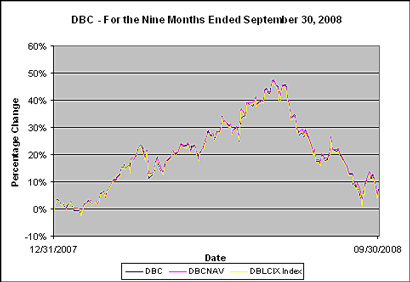
NEITHER THE PAST PERFORMANCE OF THE FUND NOR THE PRIOR INDEX LEVELS AND CHANGES, POSITIVE OR NEGATIVE, SHOULD BE TAKEN AS AN INDICATION OF THE FUND’S FUTURE PERFORMANCE.
See Additional Legends below.
27
Table of Contents
Additional Legends
Deutsche Bank Liquid Commodity Index–Optimum Yield Excess Return™ is an index and does not reflect (i) actual trading and (ii) any fees or expenses.
WHILE THE FUND’S OBJECTIVE IS NOT TO GENERATE PROFIT THROUGH ACTIVE PORTFOLIO MANAGEMENT, BUT IS TO TRACK THE INDEX, BECAUSE THE INDEX WAS ESTABLISHED IN MARCH 2003, CERTAIN INFORMATION RELATING TO THE INDEX CLOSING LEVELS MAY BE CONSIDERED TO BE “HYPOTHETICAL.” HYPOTHETICAL INFORMATION MAY HAVE CERTAIN INHERENT LIMITATIONS, SOME OF WHICH ARE DESCRIBED BELOW.
WITH RESPECT TO INDEX DATA, NO REPRESENTATION IS BEING MADE THAT THE INDEX WILL OR IS LIKELY TO ACHIEVE ANNUAL OR CUMULATIVE CLOSING LEVELS CONSISTENT WITH OR SIMILAR TO THOSE SET FORTH HEREIN. SIMILARLY, NO REPRESENTATION IS BEING MADE THAT THE FUND WILL GENERATE PROFITS OR LOSSES SIMILAR TO THE FUND’S PAST PERFORMANCE OR THE HISTORICAL ANNUAL OR CUMULATIVE CHANGES IN THE INDEX CLOSING LEVELS. IN FACT, THERE ARE FREQUENTLY SHARP DIFFERENCES BETWEEN HYPOTHETICAL RESULTS AND THE ACTUAL RESULTS SUBSEQUENTLY ACHIEVED BY INVESTMENT METHODOLOGIES, WHETHER ACTIVE OR PASSIVE.
WITH RESPECT TO INDEX DATA, ONE OF THE LIMITATIONS OF HYPOTHETICAL INFORMATION IS THAT IT IS GENERALLY PREPARED WITH THE BENEFIT OF HINDSIGHT. TO THE EXTENT THAT INFORMATION PRESENTED HEREIN RELATES TO THE PERIOD JANUARY 1988 THROUGH FEBRUARY 2003, THE INDEX CLOSING LEVELS REFLECT THE APPLICATION OF THE INDEX METHODOLOGY, AND SELECTION OF INDEX COMMODITIES, IN HINDSIGHT.
NO HYPOTHETICAL RECORD CAN COMPLETELY ACCOUNT FOR THE IMPACT OF FINANCIAL RISK IN ACTUAL TRADING. FOR EXAMPLE, THERE ARE NUMEROUS FACTORS, INCLUDING THOSE DESCRIBED UNDER ITEM 1A. – “RISK FACTORS” SET FORTH IN THE FUND’S ANNUAL REPORT ON FORM 10-K FOR THE YEAR ENDED DECEMBER 31, 2008, RELATED TO THE COMMODITIES MARKETS IN GENERAL OR TO THE IMPLEMENTATION OF THE FUND’S EFFORTS TO TRACK THE INDEX OVER TIME WHICH CANNOT BE, AND HAVE NOT BEEN, ACCOUNTED FOR IN THE PREPARATION OF THE INDEX INFORMATION SET FORTH ON THE FOLLOWING PAGES, ALL OF WHICH CAN ADVERSELY AFFECT ACTUAL PERFORMANCE RESULTS FOR THE FUND. FURTHERMORE, THE INDEX INFORMATION DOES NOT INVOLVE FINANCIAL RISK OR ACCOUNT FOR THE IMPACT OF FEES AND COSTS ASSOCIATED WITH THE FUND.
THE MANAGING OWNER, AN INDIRECT WHOLLY OWNED SUBSIDIARY OF DEUTSCHE BANK AG, COMMENCED OPERATIONS IN JANUARY 2006. AS MANAGING OWNER, THE MANAGING OWNER AND ITS TRADING PRINCIPALS HAVE BEEN MANAGING THE DAY-TO-DAY OPERATIONS FOR THE FUND AND RELATED PRODUCTS AND MANAGING FUTURES ACCOUNTS. BECAUSE THERE ARE LIMITED ACTUAL TRADING RESULTS TO COMPARE TO THE INDEX CLOSING LEVELS SET FORTH HEREIN, PROSPECTIVE INVESTORS SHOULD BE PARTICULARLY WARY OF PLACING UNDUE RELIANCE ON THE ANNUAL OR CUMULATIVE INDEX RESULTS.
FOR THE THREE MONTHS ENDED SEPTEMBER 30, 2009 COMPARED TO THE THREE MONTHS ENDED SEPTEMBER 30, 2008
Fund Share Price Performance
For the Three Months Ended September 30, 2009, the NYSE Arca market value of each Share decreased 2.48% from $22.62 per Share to $22.06 per Share. The Share price high and low for the Three Months Ended September 30, 2009 and related change from the Share price on June 30, 2009 was as follows: Shares traded from a high of $23.95 per Share (+5.88%) on August 5, 2009 to a low of $20.74 per Share (-8.31%) on July 10, 2009.
For the Three Months Ended September 30, 2008, the NYSE Alternext market value of each Share decreased 24.32% from $44.78 per Share to $33.89 per Share. The Share price high and low for the Three Months Ended September 30, 2008 and related change from the Share price on June 30, 2008 was as follows: Shares traded from a high of $46.44 per Share (+3.71%) on July 2, 2008 to a low of $32.28 per Share (-27.91%) on September 16, 2008.
Fund Share Net Asset Performance
For the Three Months Ended September 30, 2009, the net asset value of each Share decreased 1.20% from $22.46 per Share to $22.19 per Share. Declines in the futures contract prices for crude oil, heating oil, corn and wheat were partially
28
Table of Contents
offset by higher futures contract prices for aluminum and gold during the Three Months Ended September 30, 2009 contributing to an overall 0.89% decrease in the level of the DBLCI-OYTR™.
Net loss for the Three Months Ended September 30, 2009 was $49.8 million, resulting from $1.3 million of interest income, realized and unrealized losses of $44.8 million, and operating expenses of $6.3 million.
For the Three Months Ended September 30, 2008, the net asset value of each Share decreased 25.21% from $44.94 per share to $33.61 per Share. Depreciation in the futures prices of crude oil, heating oil, gold, corn, aluminum, and wheat during the Three Months Ended September 30, 2008, contributed to an overall 25.30% decrease in the level of the DBLCI-OYTR™.
Net loss for the Three Months Ended September 30, 2008 was $667.2 million, resulting from $9.8 million of interest income, realized and unrealized losses of $672.7 million and operating expenses of $4.3 million.
FOR THE NINE MONTHS ENDED SEPTEMBER 30, 2009 COMPARED TO THE NINE MONTHS ENDED SEPTEMBER 30, 2008
Fund Share Price Performance
For the Nine Months Ended September 30, 2009, the NYSE Arca market value of each Share increased 4.11% from $21.19 per Share to $22.06 per Share. The Share price low and high for the Nine Months Ended September 30, 2009 and related change from the Share price on December 31, 2008 was as follows: Shares traded from a low of $18.15 per Share (-14.35%) on March 2, 2009 to a high of $24.19 per Share (+14.16%) on June 11, 2009.
For the Nine Months Ended September 30, 2008, the NYSE Alternext market value of each Share increased 7.38% from $31.56 per Share to $33.89 per Share. The Share price low and high for the Nine Months Ended September 30, 2008 and related change from the Share price on December 31, 2007 was as follows: Shares traded from a low of $30.72 per Share (-2.66%) on January 23, 2008 to a high of $46.44 per Share (+47.15%) on July 2, 2008.
Fund Share Net Asset Performance
For the Nine Months Ended September 30, 2009, the net asset value of each Share increased 3.59% from $21.42 per Share to $22.19 per Share. Appreciation in the futures contract prices for crude oil, heating oil, aluminum and gold were partially offset by lower futures contract prices for corn and wheat during the Nine Months Ended September 30, 2009 contributing to an overall 4.36% increase in the level of the DBLCI-OYTR™.
Net income for the Nine Months Ended September 30, 2009 was $89.0 million, resulting from $2.6 million of interest income, realized and unrealized gains of $100.1 million, and operating expenses of $13.7 million.
For the Nine Months Ended September 30, 2008, the net asset value of each Share increased 6.83% from $31.46 per share to $33.61 per Share. Strong appreciation in the futures contract prices of crude oil, heating oil, gold and corn during the Nine Months Ended September 30, 2008 more than offset falling prices for aluminum and wheat during that same period, contributing to an overall 7.03% increase in the level of the DBLCI-OYTR™.
Net income for the Nine Months Ended September 30, 2008 was $161.1 million, resulting from $32.9 million of interest income, realized and unrealized gains of $141.5 million and operating expenses of $13.3 million.
Off-Balance Sheet Arrangements and Contractual Obligations
In the normal course of its business, the Master Fund is party to financial instruments with off-balance sheet risk. The term “off-balance sheet risk” refers to an unrecorded potential liability that, even though it does not appear on the balance sheet, may result in a future obligation or loss. The financial instruments used by the Master Fund are commodity futures, whose values are based upon an underlying asset and generally represent future commitments which have a reasonable possibility to be settled in cash or through physical delivery. The financial instruments are traded on an exchange and are standardized contracts.
29
Table of Contents
The Fund and the Master Fund have not utilized, nor do they expect to utilize in the future, special purpose entities to facilitate off-balance sheet financing arrangements and have no loan guarantee arrangements or off-balance sheet arrangements of any kind, other than agreements entered into in the normal course of business noted above, which may include indemnification provisions related to certain risks service providers undertake in performing services which are in the best interests of the Fund and the Master Fund. While the Fund’s and the Master Fund’s exposure under such indemnification provisions cannot be estimated, these general business indemnifications are not expected to have a material impact on either the Fund’s or the Master Fund’s financial position.
The Fund and Master Fund’s contractual obligations are with the Managing Owner and the Commodity Broker. Management Fee payments made to the Managing Owner are calculated as a fixed percentage of the Master Fund’s net asset value. Commission payments to the Commodity Broker are on a contract-by-contract, or round-turn, basis. As such, the Managing Owner cannot anticipate the amount of payments that will be required under these arrangements for future periods as net asset values are not known until a future date. These agreements are effective for one-year terms, renewable automatically for additional one-year terms unless terminated. Additionally, these agreements may be terminated by either party for various reasons.
| ITEM 3. | QUANTITATIVE AND QUALITATIVE DISCLOSURES ABOUT MARKET RISK. |
INTRODUCTION
The Fund is designed to replicate positions in a commodity index. The market sensitive instruments held by it are subject to the risk of trading loss. Unlike an operating company, the risk of market sensitive instruments is integral, not incidental, to the Fund’s main line of business.
Market movements can produce frequent changes in the fair market value of the Fund’s open positions and, consequently, in its earnings and cash flow. The Fund’s market risk is primarily influenced by changes in the price of commodities.
Value at Risk is a measure of the maximum amount which the Fund could reasonably be expected to lose in a given market sector. However, the inherent uncertainty in the markets in which the Fund trades and the recurrence in the markets traded by the Fund of market movements far exceeding expectations could result in actual trading or non-trading losses far beyond the indicated Value at Risk or the Fund’s experience to date (i.e., “risk of ruin”). In light of this, as well as the risks and uncertainties intrinsic to all future projections, the inclusion of the quantification included in this section should not be considered to constitute any assurance or representation that the Fund’s losses in any market sector will be limited to Value at Risk or by the Fund’s attempts to manage its market risk.
Standard of Materiality
Materiality as used in this section, “Quantitative and Qualitative Disclosures About Market Risk,” is based on an assessment of reasonably possible market movements and the potential losses caused by such movements, taking into account the effects of margin, and any other multiplier features, as applicable, of the Fund’s market sensitive instruments.
QUANTIFYING THE FUND’S TRADING VALUE AT RISK
Quantitative Forward-Looking Statements
The following quantitative disclosures regarding the Fund’s market risk exposures contain “forward-looking statements” within the meaning of the safe harbor from civil liability provided for such statements by the Private Securities Litigation Reform Act of 1995 (set forth in Section 27A of the Securities Act of 1933 and Section 21E of the Securities Exchange Act of 1934). All quantitative disclosures in this section are deemed to be forward-looking statements for purposes of the safe harbor, except for statements of historical fact (such as the dollar amount of maintenance margin required for market risk sensitive instruments held at the end of the reporting period).
The Fund’s risk exposure in the various market sectors traded by the Fund is quantified below in terms of Value at Risk. Exchange maintenance margin requirements have been used by the Fund as the measure of its Value at Risk. Maintenance margin requirements are set by exchanges to equal or exceed 95-99% of the maximum one-day losses at fair value of any given contract incurred during the time period over which historical price fluctuations are researched for purposes of establishing margin levels. The maintenance margin levels are established by exchanges using historical price studies as well as an assessment of current market volatility and economic fundamentals to provide a probabilistic estimate of the maximum expected near-term one-day price fluctuation.
30
Table of Contents
THE FUND’S TRADING VALUE AT RISK IN DIFFERENT MARKET SECTORS
The following table indicates the trading Value at Risk associated with the Fund’s open positions by market category as of September 30, 2009.
| Market Sector |
Delivery Month |
Value at Risk (VaR) $ Value* |
Value at Risk (VaR)* % of Net Assets |
Number of times VaR Exceeded | |||||
| Corn |
December 2009 - March 2010 | 25,236,856 | 0.73 | % | 11 | ||||
| WTI Crude Oil |
June 2010 | 127,263,748 | 3.68 | % | 7 | ||||
| Gold |
February-April 2010 | 14,495,986 | 0.42 | % | 8 | ||||
| Heating Oil |
April-May 2010 | 54,030,921 | 1.56 | % | 6 | ||||
| Aluminum |
November 2009 | 22,082,601 | 0.64 | % | 7 | ||||
| Wheat |
December 2009 - July 2010 | 24,710,146 | 0.71 | % | 11 | ||||
| Aggregate/Total |
214,625,951 | 6.20 | % | 3 |
The following table indicates the trading Value at Risk associated with the Fund’s open positions by market category as of December 31, 2008.
| Market Sector |
Delivery Month |
Value at Risk (VaR) $ Value* |
Value at Risk (VaR)* % of Net Assets |
Number of times VaR Exceeded | |||||
| Corn |
December 2009 | 8,458,411 | 0.71 | % | 8 | ||||
| WTI Crude Oil |
June 2009 | 33,189,511 | 2.77 | % | 11 | ||||
| Gold |
June 2009 | 5,485,483 | 0.46 | % | 9 | ||||
| Heating Oil |
May 2009 | 15,326,574 | 1.28 | % | 9 | ||||
| Aluminum |
November 2009 | 6,599,504 | 0.55 | % | 9 | ||||
| Wheat |
July 2009 | 9,917,241 | 0.83 | % | 9 | ||||
| Aggregate/Total |
61,867,926 | 5.16 | % | 9 |
| * | The VaR for a contract represents the one-day, downside risk, under normal market conditions, with a 99% confidence level. It is calculated using the variance/co-variance methodology taking historical market moves for the contract and using a one-year look-back. The aggregate VaR for the Fund represents the VaR of the Fund’s open positions across all contracts and is less than the sum of VaRs for each individual contract due to the diversification benefit across the contracts. |
NON-TRADING RISK
The Fund has non-trading market risk as a result of investing in short-term United States Treasury Obligations. The market risk represented by these investments is expected to be immaterial.
QUALITATIVE DISCLOSURES REGARDING PRIMARY TRADING RISK EXPOSURES
The following qualitative disclosures regarding the Fund’s market risk exposures — except for those disclosures that are statements of historical fact — constitute forward-looking statements within the meaning of Section 27A of the Securities Act and Section 21E of the Securities Exchange Act. The Fund’s primary market risk exposures are subject to numerous uncertainties, contingencies and risks. Government interventions, defaults and expropriations, illiquid markets, the emergence of dominant fundamental factors, political upheavals, changes in historical price relationships, an influx of new market participants, increased regulation and many other factors could result in material losses as well as in material changes to the risk exposures of the Fund. There can be no assurance that the Fund’s current market exposure will not change materially. Investors may lose all or substantially all of their investment in the Fund.
The following were the primary trading risk exposures of the Fund as of September 30, 2009 by market sector.
Energy. The Fund’s primary energy market exposure is to pricing movements in light, sweet crude oil and heating oil. Oil prices can be volatile and substantial profits and losses have been and are expected to continue to be experienced in this market. The level of global industrial activity influences the demand for light, sweet crude oil. In addition, various other
31
Table of Contents
factors can affect the demand for light, sweet crude oil, such as weather, political events and labor activity. The supply of light, sweet crude oil can be affected by many events, in particular, the meetings of the Organization of Petroleum Exporting Countries. Market expectations about events that will influence either demand or supply can cause prices for light, sweet crude oil to fluctuate greatly. A significant amount of the world oil production capacity is controlled by a relatively small number of producers. Any large change in production by one of these producers could have a substantial effect on the price of light, sweet crude oil.
The level of global industrial activity influences the demand for heating oil. In addition, the seasonal temperatures in countries throughout the world can also heavily influence the demand for heating oil. Heating oil is derived from crude oil and as such, any factors that influence the supply of crude oil may also influence the supply of heating oil.
Metals. The Fund’s metal market exposure is to fluctuations in the price of aluminum and gold. The price movement of aluminum may be influenced by a variety of factors, including the level of global industrial activity and demand, especially relating to the transportation, packaging and building sectors, each of which significantly influences the demand, and in turn, the price of aluminum. Prices for aluminum are influenced by a number of factors including the level of economic activity in large aluminum consuming markets, political uncertainties, economic concerns and the rate of supply of new metal from producers. The production of aluminum is a power intensive process that requires large amounts of inexpensive power. Disruptions in the amount of energy available to aluminum producers could affect the supply of aluminum.
Because trading is to be conducted on a commodity exchange outside the United States, such trading is not regulated by any United States governmental agency and may involve certain risks not applicable to trading on United States exchanges, including different or diminished investor protections. In trading contracts denominated in currencies other than U.S. dollars, Shares are subject to the risk of adverse exchange-rate movements between the dollar and the functional currencies of such contracts. Investors could incur substantial losses from trading on foreign exchanges which such Investors would not have otherwise been subject had the trading been limited to U.S. markets.
The price of gold is volatile. Gold prices float freely in accordance with supply and demand. The price movement of gold may be influenced by a variety of factors, including announcements from central banks regarding reserve gold holdings, agreements among central banks, purchases and sales of gold by central banks, other governmental agencies that hold large supplies of gold, political uncertainties, economic concerns such as an increase or decrease in confidence in the global monetary system, the relative strength of the U.S. dollar, interest rates and numerous other factors. Gold prices may also be affected by industry factors such as industrial and jewelry demand.
Agricultural. The Fund’s agricultural market exposure is to agricultural pricing movements in wheat and corn. Both of these are often directly affected by, among other things, severe or unexpected weather conditions or by the level of import and export activity between countries. The price movement of wheat may be influenced by three primary supply factors: farmer planting decisions, climate, and government agricultural policies and three major market demand factors: food, shortages or surpluses of world grain supplies, and domestic and foreign government policies and trade agreements. Additionally, the price movement of wheat may be influenced by a variety of other factors, including weather conditions, disease, transportation costs, political uncertainties and economic concerns.
The price movement of corn may be influenced by three primary supply factors: farmer planting decisions, climate, and government agricultural policies and three major market demand factors: livestock feeding, shortages or surpluses of world grain supplies, and domestic and foreign government policies and trade agreements. Additionally, the price movement of corn may be influenced by a variety of other factors, including weather conditions, disease, transportation costs, political uncertainties and economic concerns.
QUALITATIVE DISCLOSURES REGARDING NON-TRADING RISK EXPOSURE
General
The Fund is unaware of any (i) anticipated known demands, commitments or capital expenditures; (ii) material trends, favorable or unfavorable, in its capital resources; or (iii) trends or uncertainties that will have a material effect on operations.
32
Table of Contents
QUALITATIVE DISCLOSURES REGARDING MEANS OF MANAGING RISK EXPOSURE
Under ordinary circumstances, the Managing Owner’s discretionary power is limited to determining whether the Fund will make a distribution. Under emergency or extraordinary circumstances, the Managing Owner’s discretionary powers increase, but remain circumscribed. These special circumstances, for example, include the unavailability of the Index or certain natural or man-made disasters. The Managing Owner does not apply risk management techniques. The Fund initiates positions only on the “long” side of the market and does not employ “stop-loss” techniques.
| ITEM 4. | CONTROLS AND PROCEDURES. |
Evaluation of Disclosure Controls and Procedures
Under the supervision and with the participation of the management of the Managing Owner, including Hans Ephraimson, its Chief Executive Officer and Michael Gilligan, its Principal Financial Officer, the Fund carried out an evaluation of the effectiveness of the design and operation of its disclosure controls and procedures (as defined in Rule 13a-15(e) or 15d-15(e) of the Securities Exchange Act of 1934, as amended (the “Exchange Act”)) as of the end of the period covered by this quarterly report, and, based upon that evaluation, Hans Ephraimson, the Chief Executive Officer and Michael Gilligan, the Principal Financial Officer of the Managing Owner, concluded that the Fund’s disclosure controls and procedures were effective to ensure that information the Fund is required to disclose in the reports that it files or submits with the Securities and Exchange Commission (the “SEC”) under the Exchange Act is recorded, processed, summarized and reported, within the time periods specified in the SEC’s rules and forms, and to ensure that information required to be disclosed by the Fund in the reports that it files or submits under the Exchange Act is accumulated and communicated to management of the Managing Owner, including its Chief Executive Officer and Principal Financial Officer, as appropriate to allow timely decisions regarding required disclosure.
Changes in Internal Control Over Financial Reporting
There has been no change in internal control over financial reporting (as defined in the Rules 13a-15(f) and 15d-15(f) of the Exchange Act) that occurred during the Fund’s last fiscal quarter that has materially affected, or is reasonably likely to materially affect, the Fund’s internal control over financial reporting.
| Item 1. | Legal Proceedings. |
Not Applicable.
| Item 1A. | Risk Factors. |
There are no material changes from risk factors as previously disclosed in the Annual Report on Form 10-K for the year ended December 31, 2008, filed February 24, 2009.
| Item 2. | Unregistered Sales of Equity Securities and Use of Proceeds. |
(a) There have been no unregistered sales of the Fund’s securities. No Fund securities are authorized for issuance by the Fund under equity compensation plans.
(b) The Registrant’s Registration Statement on Form S-1 (Registration No.: 333-125325) was declared effective on January 17, 2006 with information with respect to the use of proceeds from the sale of the Shares being disclosed therein. A Post-Effective Amendment No. 1 to the Registrant’s Registration Statement on Form S-1 was declared effective on August 14, 2006, which also contained this information. The Registrant’s Registration Statement on Form S-1 (Registration No.: 333-141631) was declared effective on May 1, 2007 with information with respect to the use of proceeds from the sale of the Shares being disclosed therein. The Registrant’s Registration Statement on Form S-1 (Registration No.: 333-150217) was declared effective on May 1, 2008 with information with respect to the use of proceeds from the sale of the Shares being disclosed therein. A Post-Effective Amendment No. 1 to the Registrant’s Registration Statement on Form S-1 (Registration No.: 333-150217) was declared effective on April 15, 2009, which also contained this information. A Registration Statement on Form S-3 was filed and declared effective on April 23, 2009, which also contained this
33
Table of Contents
information. The Shares commenced trading on the NYSE Alternext on February 3, 2006 and, as of November 25, 2008, are listed for trading on the NYSE Arca.
The proceeds from the sale of the Shares are used to purchase Master Fund Limited Units. The Master Fund uses the proceeds from the sale of the Master Fund Limited Units for general corporate purposes in accordance with its investment objectives and policies.
For the Three Months Ended September 30, 2009, 27.4 million Shares were created for $618.5 million and 4.0 million Shares were redeemed for $86.2 million. On September 30, 2009, 156.0 million Shares of the Fund were outstanding for a market capitalization of $3,441.4 million.
(c) The following table summarizes the redemptions by Authorized Participants during the Three Months Ended September 30, 2009 and 2008:
| Period of Redemption |
Total Number of Shares Redeemed | Average Price Paid per Share | |||
| Three Months Ended September 30, 2009 |
4,000,000 | $ | 21.56 | ||
| Three Months Ended September 30, 2008 |
16,400,000 | $ | 39.63 | ||
| Item 3. | Defaults Upon Senior Securities. |
None.
| Item 4. | Submission of Matters to a Vote of Security Holders. |
None.
| Item 5. | Other Information. |
None.
| Item 6. | Exhibits. |
| 31.1 | Certification required under Exchange Act Rules 13a-14 and 15d-14 (filed herewith) | |
| 31.2 | Certification required under Exchange Act Rules 13a-14 and 15d-14 (filed herewith) | |
| 32.1 | Certification of Chief Executive Officer pursuant to 18 U.S.C. Section 1350 as adopted pursuant to Section 906 of the Sarbanes-Oxley Act of 2002 (furnished herewith) | |
| 32.2 | Certification of Principal Financial Officer pursuant to 18 U.S.C. Section 1350 as adopted pursuant to Section 906 of the Sarbanes-Oxley Act of 2002 (furnished herewith) | |
34
Table of Contents
Pursuant to the requirements of the Securities Exchange Act of 1934, the Registrant has duly caused this report to be signed on its behalf by the undersigned, thereunto duly authorized.
| PowerShares DB Commodity Index Tracking Fund | ||||||
| By: | DB Commodity Services LLC, | |||||
| its Managing Owner | ||||||
| By: | /S/ HANS EPHRAIMSON | |||||
| Name: | Hans Ephraimson | |||||
| Title: | Chief Executive Officer | |||||
| By: | /S/ MICHAEL GILLIGAN | |||||
| Name: | Michael Gilligan | |||||
| Title: | Principal Financial Officer | |||||
| DB Commodity Index Tracking Master Fund | ||||||
| By: | DB Commodity Services LLC, | |||||
| its Managing Owner | ||||||
| By: | /S/ HANS EPHRAIMSON | |||||
| Name: | Hans Ephraimson | |||||
| Title: | Chief Executive Officer | |||||
| Dated: November 2, 2009 | By: | /S/ MICHAEL GILLIGAN | ||||
| Name: | Michael Gilligan | |||||
| Title: | Principal Financial Officer | |||||
35
Table of Contents
| Exhibit |
Description of Document |
Page | ||
| 31.1 | Certification required under Exchange Act Rules 13a-14 and 15d-14 (filed herewith) | E-2 | ||
| 31.2 | Certification required under Exchange Act Rules 13a-14 and 15d-14 (filed herewith) | E-3 | ||
| 32.1 | Certification of Chief Executive Officer pursuant to 18 U.S.C. Section 1350 as adopted pursuant to Section 906 of the Sarbanes-Oxley Act of 2002 (furnished herewith) | E-4 | ||
| 32.2 | Certification of Principal Financial Officer pursuant to 18 U.S.C. Section 1350 as adopted pursuant to Section 906 of the Sarbanes-Oxley Act of 2002 (furnished herewith) | E-5 | ||
E-1