Attached files
| file | filename |
|---|---|
| EX-31.2 - China Housing & Land Development, Inc. | v163561_ex31-2.htm |
| EX-23.2 - China Housing & Land Development, Inc. | v163561_ex23-2.htm |
| EX-32.1 - China Housing & Land Development, Inc. | v163561_ex32-1.htm |
| EX-31.1 - China Housing & Land Development, Inc. | v163561_ex31-1.htm |
| EX-32.2 - China Housing & Land Development, Inc. | v163561_ex32-2.htm |
UNITED
STATES
SECURITIES
AND EXCHANGE COMMISSION
WASHINGTON,
D.C. 20549
FORM
10-K/A
Amendment
No. 3
x ANNUAL REPORT PURSUANT
TO SECTION 13 OR 15(d) OF THE
SECURITIES
EXCHANGE ACT OF 1934
For
the fiscal year ended December 31, 2008
OR
o TRANSITION REPORT
PURSUANT TO SECTION 13 OR 15(d) OF THE
SECURITIES
EXCHANGE ACT OF 1934
For
the transition period from ____________ to ____________
Commission
file number: 333-105903
|
China
Housing & Land Development, Inc.
|
|
(Exact
name of registrant as specified in our
charter)
|
|
NEVADA
|
20-1334845
|
|
(State
or other jurisdiction of incorporation or
organization)
|
(I.R.S.
Employer Identification No.)
|
|
6
Youyi Dong Lu, Han Yuan 4 Lou
Xi'an,
Shaanxi Province
China
710054
|
|
(Address
of principal executive offices) (Zip
Code)
|
|
(Registrant's
telephone number, including area code)
|
|
86-29-82582632
|
(Former
name, former address and former fiscal year,
if
changed since last report)
Securities
registered pursuant to Section 12(b) of the Act: None
Securities
registered pursuant to Section 12(g) of the Act:
|
Title
of each class
|
Name
of each exchange on
which
registered
|
|
Common
Stock, $ .001 par value per share
|
NASDAQ
|
Indicate
by check mark if the registrant is a well-known seasoned issuer, as defined in
Rule 405 of the Securities Act. Yes p No x
Indicate
by check mark if the registrant is not required to file reports pursuant to
Section 13 or Section 15(d) of the Exchange Act. Yes p
No x
Indicate
by check mark whether the registrant (1) has filed all reports required to be
filed by Section 13 or 15(d) of the Securities Exchange Act of 1934 during the
preceding 12 months (or for such shorter period that the registrant was required
to file such reports), and (2) has been subject to such filing requirements
for the past 90 days. Yes x No ¨
Indicate
by check mark if disclosure of delinquent filers pursuant to Item 405 of
Regulation S-K is not contained herein, and will not be contained, to the best
of registrant’s knowledge, in definitive proxy or information statements
incorporated by reference in Part III of this Form 10-K or any amendment to this
Form 10-K. ¨
Indicate
by check mark whether the registrant is a large accelerated filer, an
accelerated filer, or a non-accelerated filer. See definition of “accelerated
filer and large accelerated filer” in Rule 12b-2 of the Exchange
Act.
|
Large accelerated filer ¨
|
Accelerated filer ¨
|
|||
|
Non-accelerated filer ¨
|
(Do not check if a smaller reporting company)
|
Smaller reporting company x
|
||
Indicate
by check mark whether the registrant is a shell company (as defined in Rule
12b-2 of the Exchange Act). Yes
p No x
The
number of shares outstanding of our common stock as of June 30, 2008, was
30,143,757 shares. The aggregate market value of the common stock held by
non-affiliates (12,702,110 shares), based on the closing market price ($3.99 per
share) of the common stock as of June 30, 2008 was $50,681,419.
As of
March 25, 2009 the number of shares of the registrant’s classes of common stock
outstanding was 30,948,340, though they mean the same.
|
Class
|
Outstanding
at March 25, 2009
|
|
Common
Stock, $ .001 par value per share
|
30,948,340
shares
|
DOCUMENTS
INCORPORATED BY REFERENCE
|
Document
|
Parts
Into Which Incorporated
|
|
None
|
Not
applicable
|
EXPLANATORY
NOTE
This
Amendment No. 3 to our annual report on Form 10-K initially filed with the
Securities and Exchange Commission (the “Commission”) on March 25, 2009 is being
filed in response to the Commission’s comment letter dated August 18,
2009. In
additional, this Amendment No. 3 to our annual report on Form 10-K is being
filed to correct certain financial data and disclosure including Management’s
Discussion and Analysts of Financial Condition and Results of Operations and to
restate our consolidated financial statements.
SPECIAL
NOTE REGARDING FORWARD-LOOKING STATEMENTS
This
annual report includes forward-looking statements within the meaning of Section
27A of the Securities Act and Section 21E of the Securities Exchange Act of
1934, as amended. All statements, other than statements of historical fact, are
statements that could be deemed forward-looking statements, including, but not
limited to, statements regarding our future financial position, business
strategy and plans and objectives of management for future operations. When used
in this filing, the words believe, may, will, estimate, continue, anticipate,
intend, expect, and similar expressions are intended to identify forward-looking
statements.
We have
based these forward-looking statements largely on our current expectations and
projections about future events and financial trends that we believe may affect
our financial condition, results of operations, business strategy, short-term
and long-term business operations and objectives, and financial needs.
These forward-looking statements are subject to certain risks and
uncertainties that could cause our actual results to differ materially from
those reflected in the forward-looking statements. Factors that could cause or
contribute to such differences include, but are not limited to the risks
discussed under the heading “Risk Factors”. Except as required by law, we assume
no obligation to update these forward-looking statements publicly or to update
the reasons actual results could differ materially from those anticipated in
these forward-looking statements.
In light
of these risks, uncertainties, and assumptions, the forward-looking events and
circumstances discussed in this annual report may not occur and actual results
could differ materially and adversely from those anticipated or implied in the
forward-looking statements. Accordingly, readers are cautioned not to place
undue reliance on such forward-looking statements.
TABLE
OF CONTENT
|
PART
I
|
||
|
ITEM
1
|
BUSINESS
|
1
|
|
ITEM
1A
|
RISK
FACTORS
|
18
|
|
ITEM
2
|
PROPERTIES
|
24
|
|
ITEM
3
|
LEGAL
PROCEEDINGS
|
25
|
|
ITEM
4
|
SUBMISSION
OF MATTERS TO A VOTE OF SECURITY HOLDERS
|
25
|
|
PART
II
|
||
|
ITEM
5
|
MARKET
FOR REGISTRANT’S COMMON EQUITY, RELATED STOCKHOLDER MATTERS AND ISSUER
PURCHASES OF EQUITY SECURITIES
|
25
|
|
ITEM
6
|
SELECTED
FINANCIAL DATA
|
26
|
|
ITEM
7
|
MANAGEMENT
DISCUSSION AND ANALYSIS OF FINANCIAL CONDITION AND RESULTS OF
OPERATIONS
|
27
|
|
ITEM
7A
|
QUANTITATIVE
AND QUALITATIVE DISCLOSURES ABOUT MARKET RISK
|
41
|
|
ITEM
8
|
FINANCIAL
STATEMENT AND SUPPLEMENTARY DATA
|
42
|
|
ITEM
9
|
CHANGES
IN AND DISAGREEMENTS WITH ACCOUNTANTS ON ACCOUNTING AND FINANCIAL
DISCLOSURES
|
66
|
|
ITEM
9A(T)
|
CONTROLS
AND PROCEDURES
|
66
|
|
ITEM
9B
|
OTHER
INFORMATION
|
67
|
|
PART
III
|
||
|
ITEM
10
|
DIRECTORS
AND EXECUTIVE OFFICERS AND CORPORATE GOVERNANCE
|
68
|
|
ITEM
11
|
EXECUTIVE
COMPENSATION
|
71
|
|
ITEM
12
|
SECURITY
OWNERSHIP OF CERTAIN BENEFICIAL OWNERS AND MANAGEMENT AND RELATED
STOCKHOLDER MATTERS
|
73
|
|
ITEM
13
|
CERTAIN
RELATIONSHIPS AND RELATED TRANSACTIONS
|
73
|
|
ITEM
14
|
PRINCIPAL
ACCOUNTING FEES AND SERVICES
|
74
|
|
PART
IV
|
||
|
ITEM
15
|
EXHIBITS
AND REPORTS ON FORM 10-K
|
75
|
|
SIGNATURES
|
76
|
|
PART
I
ITEM
1. BUSINESS
China
Housing & Land Development, Inc., is a leading developer of residential and
commercial properties in northwest China. The Company is based in Xi’an, the
capital city of China’s Shaanxi province. Since 1992, China Housing has been
engaged in the acquisition, development, management, and sales of residential
and commercial real estate properties and land through its subsidiaries in
China.
China
Housing & Land Development is the first and only Chinese real estate
development company traded on NASDAQ.
By
leveraging its strong background and capability, China Housing & Land
Development has been able to capitalize on the supply of available land and
develop residential and commercial properties, further increase China Housing's
brand recognition, and outperform its competitors in the development of medium
size residential and commercial real estate projects in greater
Xi'an.
China
Housing & Land Development is the number one non-government middle-and-upper
income residential real estate development company in Xi'an.
Company
History
China
Housing & Land Development, Inc. (China Housing, we, our, us, or the
Company) was incorporated in the state of Nevada on July 6, 2004, as Pacific
Northwest Productions Inc., (Pacific). On April 21, 2006, Pacific entered into
and completed a share purchase agreement with Xi’an Tsining Housing Development
Co., Ltd., (Tsining), a corporation formed under the laws of the People’s
Republic of China on September 7, 1999. Pursuant to the purchase agreement,
Pacific acquired all of the issued and outstanding capital stock of Tsining in
exchange for 16,000,000 (post-split) shares of Pacific’s common
stock.
Concurrent
with the completion of the purchase agreement and as a condition thereof,
Pacific entered into an agreement with Deljit Bains and Davinder Bains, the then
executive officers, pursuant to which they each returned 4,000,000 (post-split)
shares (8,000,000 shares in total) of Pacific’s common stock to the company for
cancellation. They were not compensated in any way for the cancellation of their
shares of the Pacific common stock. Upon completion of the foregoing
transactions, Pacific had an aggregate of 20,000,000 shares of common stock
issued and outstanding.
As a
result of the merger, Tsining’s stockholders owned approximately 80 percent of
the combined company and the directors and executive officers of Tsining became
the directors and executive officers of Pacific. Accordingly, the transaction
has been accounted for as a reverse acquisition of Pacific by Tsining, resulting
in a recapitalization of Tsining rather than as a business combination. Tsining
is deemed to be the purchaser and surviving company for accounting
purposes.
Accordingly,
our assets and liabilities are included in the balance sheet at their historical
book values and the results of operations of Tsining have been presented for the
comparative prior period. The historical cost of the net liabilities of Pacific
that were acquired was $432. Pro forma information is not presented since the
financial statements of Pacific are insignificant.
On May 5,
2006, Pacific Northwest Productions Inc., changed its name to China Housing
& Land Development, Inc., and the stockholders approved a stock dividend of
seven shares for each share held, which was accounted for as an eight-to-one
forward stock split. All shares and per share data have been restated
retrospectively.
In March
2007, China Housing acquired 100 percent of the equity of Xi’an New Land
Development Co., Ltd, (New Land). The total purchase price for the acquisition
is RMB 270 million, approximately $35 million. New Land was originally
incorporated in September 2003 in Xi’an, Shaanxi province, China. In 2006, New
Land entered into an agreement with Baqiao District Government of Xi’an to
develop Baqiao Science & Technology Industrial Park, a provincial
development zone in Shaanxi Province, under which New Land has the exclusive
right to purchase and develop approximately 487 acres in Baqiao
Park.
In
November 2008, China Housing agreed to form a joint venture with Prax Capital
Real Estate Holding Ltd., to finance the development of the first 79 acres
within the Baqiao project. As planned, the joint venture was subsequently formed
in late December and announced in January 2009 after all documentation and
permits had been approved.
- 1
-
In
January, 2009, the Company completed the acquisition of Xi’an Xinxing Property
Management Co., Ltd. (“Xinxing”). Xinxing was privately owned and provides
property management services to most of China Housing’s past residential and
commercial projects, as well as to other prominent customers like the Xi’an
branch office building of the People’s Bank of China, China Xi’an Electric Group
headquarters, Shaanxi Bureau of State Taxation offices, and the Xi’an University
of International Studies, to name a few. Xinxing’s current service area totals
1.67 million square meters in 43 facilities that include residential,
commercial, and school buildings and parks. Xinxing’s revenues in 2008 were RMB
15.42 million, net income was RMB 1.82 million, and assets at yearend
2008 totaled RMB 11.29 million. Total consideration for the acquisition
will be RMB 12 million.
China
Housing, through subsidiaries, is engaged in the development, construction, and
sale of residential and commercial real estate units, as well as land
development in the People’s Republic of China (“China”). Tsining has completed a
number of significant real estate development and construction projects in
Xi’an, and is considered as the leading private developer of middle and upper
income housing in Xi’an. Tsining intends to continue investing in Xi’an, in the
Shaanxi province, and potentially in other developing urban markets in western
China. New Land improves and develops land and performs infrastructure projects
for local governments, frequently in conjunction with China Housing’s planned
housing projects. The infrastructure work can include engineering and
installation of water systems, roads, sewer systems, waterway damns and bridges,
and public park facilities. As compensation for the infrastructure work, New
Land often receives the prime land in the development from local government, on
which China Housing usually constructs and sells residential and or
commercial facilities.
We
maintain our statutory registered agent's office at 711 S. Carson Street, Suite
4, Carson City, Nevada 89701.
Our
corporate offices are located at 6 Youyi Lu, Han Yuan 4th Floor, Xi’an, China.
Our telephone number at that location is +86-29-8258-2632.
Notable
Company Events in 2008
Notable
company events or activities affecting China Housing’s 2008 consolidated
financial results include the following:
|
▪
|
On
January 1, China Housing adopted the percentage of completion method of
accounting for building construction projects. Infrastructure construction
work and sales of land continue to be reported only at the completion of
each project, using the full accrual method of
accounting.
|
|
▪
|
In
January, the company issued $20 million in senior secured convertible
debt.
|
|
▪
|
In
May, China Housing became the first and only Chinese real estate
development company to trade on NASDAQ. Ticker symbol is
CHLN.
|
|
▪
|
In
July, the company received a RMB 1 billion construction line of credit
with the China Construction Bank Shaanxi Branch. In September, China
Housing also received a RMB 35 million infrastructure construction line of
credit with the Xi'an Commercial
Bank.
|
|
▪
|
In
October, the company selected the world- renowned U.S. architecture and
engineering firm of Leo A Daly to provide site planning and detailed
architectural designs for the first 79 acres within the Baqiao
project.
|
|
▪
|
In
November, China Housing agreed to form a joint venture with Prax Capital
Real Estate Holding Ltd., to finance the development of the first 79 acres
within the Baqiao project. As planned, the joint venture was formed in
late December, subject to certain conditions and approvals, which were
subsequently satisfied; the completion of the joint venture’s formation
was announced in January 2009.
|
- 2
-
|
Industry
Overview
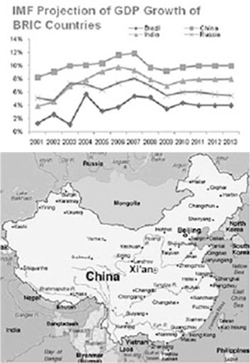
China’s
economic growth
China
has experienced rapid economic growth in the last 20 years. According to
China’s Department of Commercial Affairs, China’s gross domestic product
(GDP) achieved an annual growth rate of 17.1 percent from 2004 to 2008.
According to the National Statistics Bureau of China, the GDP of China in
2008 was RMB 30.1 billion, up 9.0 percent over 2007. Despite the
current global economic crisis, China is expected to achieve relatively
good economic growth in the next several years, compared to many other
major economies in the world.
Sources:
World Economic Outlook database, IMF.
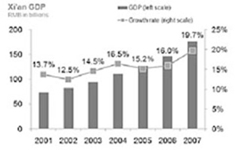
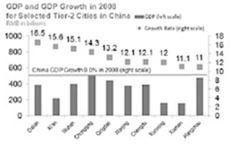
Xi’an:
economic growth higher than China
Xi’an
served as the capital of China during 13 dynasties (from West Zhou in 1066
BC to Tang in 907 AD) and is well known for its Terracotta Army and other
famous historic landmarks. It is now the largest metropolis in
northwestern China, and one of the ten largest nationwide. A new wave of
economic growth is occurring in tier two cities, and Xi’an has benefitted
from the government’s “Go West” policy, which plans to develop Xi’an into
a regional economic center.
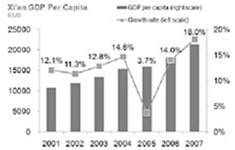
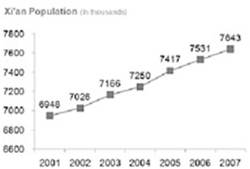
With
this rich heritage as a foundation, today the city’s economic leadership
is based on its high-technology, pharmaceutical, military, aerospace,
tourism, and advanced education industries. Xi’an recorded a CAGR of 16.0
percent for GDP and a CAGR of 12.3 percent for GDP per capita between 2001
and 2007.
|
 |
 |
 |
Source:
Xi’an Municipal Bureau of Statistics.
- 3
-
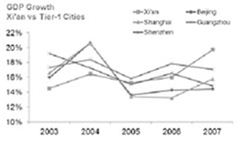
Driven by
the government’s “Go West” policy and the city’s highly productive workforce,
Xi’an has experienced a relatively stronger growth compared with other
second-tier cities in 2008. Xi’an’s gross domestic product grew 15.6 percent in
2008, compared with 9.0 percent in 2008 for all of China. Similar to other tier
two cities, the historically significant city of Xi’an in northwestern China
is experiencing an economic renaissance. Compared to tier one cities, we
believe Xi’an will continue its growth momentum in the next few years, and we
also expect that its strong economic fundamentals, compared to other tier two
cities, will provide a solid foundation for growth in the real estate
sector.
 |
 |
Source:
The Municipal Bureau of Statistics for the cities shown above.
China
Real Estate Industry Factors
Structural
long-term growth
China’s
real estate sector is in the early stage of a long-term growth cycle, supported
by growth in its gross domestic product (GDP), rising demand for housing, and
substantial structural changes similar to those of Japan in the early 1970s and
Hong Kong of early 1980s. Hong Kong’s property market, for example, increased in
value by 8 times between 1980 and 1997, or a compound annual growth rate of
about 15 percent, while Japan’s property boom ran for more than 20 years from
early 1970s to the early 1990s. There are many fundamental similarities among
the growth paths of these three economies.
China’s
real estate bull market began more than six years ago. Despite the moderations
in growth caused by the global economic weakness, we believe the fundamental
structural forces in China support continued growing demand for real estate in
China during the next 10 years. The two key industry drivers for this long-term
real estate demand in China are the dramatic migration of people from rural to
urban areas and the rising disposable income per capita in the
cities.
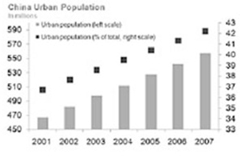
China is
continuing its rapid urbanization process. In 2006, there were more than 577
million Chinese living in urban areas, accounting for about 44 percent of total
population of about 1.31 billion. According to the National Bureau of Statistics
of China, by the end of 2008, China’s urban population had reached 600 million.
The State Council of China estimated in 2007 that China’s urban population in
2020 would comprise about 870 million people or about 60 percent of the total
population of 1.45 billion.
Another
source, the United Nations’
State of World Population 2007, reports that about 18 million people in
China are expected to migrate from rural to urban areas each year, and that the
urban population would reach about 877 million in the next 10
years.
 |
 |
Sources:
The World Bank’s World Development Indicators and National Bureau of
Statistics.
- 4
-
Regardless
of which projection you prefer, it is reasonable to expect that the migration
into urban areas is likely to continue, both because of the potential for higher
income and greater wealth accumulation, and because of the evolution of China’s
farming toward larger-scale and more efficient methods that require fewer people
to do the agricultural work.
With the
substantial housing demand created by the structural shift of the migration, the
urban real estate market has been thriving, and that long-term trend is expected
to continue.
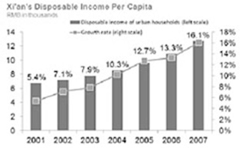
Higher
disposable incomes encourage home ownership
Rural
dwellers are drawn to cities primarily by the potential of higher incomes and
greater wealth, because urban jobs generally pay higher wages and
salaries.
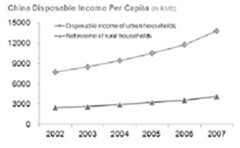
The data
below from the National Bureau of Statistics of China shows that both disposable
income and wealth accumulation are higher for urban dwellers and confirms the
economic attractiveness of the migration from rural to urban areas.
|
Annual
per capita
disposable
income and
expenses
(RMB)
|
2002
|
2003
|
2004
|
2005
|
2006
|
2007
|
||||||||||||||||||
|
Urban
per capita
|
||||||||||||||||||||||||
|
Disposable
income of urban households
|
7703.00
|
8472.00
|
9422.00
|
10493.00
|
11759.45
|
13786.00
|
||||||||||||||||||
|
Consumption
expenditures of urban households
|
6030.00
|
6511.00
|
7182.00
|
7943.00
|
8696.55
|
9997.50
|
||||||||||||||||||
|
Net
increase in wealth, urban
|
1673.00
|
1961.00
|
2240.00
|
2550.00
|
3062.90
|
3788.50
|
||||||||||||||||||
|
Rural
per capita
|
||||||||||||||||||||||||
|
Net
income of rural households
|
2476.00
|
2622.00
|
2936.00
|
3255
|
3587.0
|
4140.36
|
||||||||||||||||||
|
Living
expenditures of rural households
|
1834.00
|
1943.00
|
2185.00
|
2555.00
|
2829
|
3223.85
|
||||||||||||||||||
|
Net
increase in wealth, rural
|
642.00
|
679.00
|
751.00
|
700.00
|
758.00
|
916.51
|
||||||||||||||||||
Source:
The National Bureau of Statistics of China.
China
real estate: Quite warm but still comparatively undervalued
Despite
the significant appreciation of property prices in China in recent years,
comparative analysis of fundamental factors indicate that prices are still
reasonable.
Studies
have shown that a key underlying driver for property market growth is per capita
GDP. Recent International Monetary Fund studies report that China’s recent
property appreciation is supported by strong personal economic growth. When
compared using “price per capita GDP” in the U.S. and India, China’s property
market appears undervalued. For example, although Shanghai represents the most
expensive property market in China, India’s Mumbai (Bombay) has seen real estate
prices grow to more than twice those of Shanghai, even though China has higher
economic growth.
Growth
in second-tier and third-tier markets
Just as
the rapid economic growth in eastern China’s large cities has created a healthy
demand in the east coast real estate property market in recent years, the
economic multiplier effect of economic growth moving from the first-tier cities
to the second- and third-tier cities is likely to create increases in growth for
the real estate markets in those cities.
In search
of lower costs, an educated talent pool, and new markets, multinational
corporations have been expanding out of mega cities, like Beijing, Shanghai, and
Shenzhen, into neighboring and inland cities.
Intel,
for example, has opened a development center in Chengdu, while the Liberty
Mutual Group, the U.S. insurance giant, has chosen Chongqing for its Chinese
headquarters. Unilever has relocated its Chinese headquarters from Shanghai to
the neighboring province of Hefei due to the lower labor and land costs and its
strategic location.
- 5
-
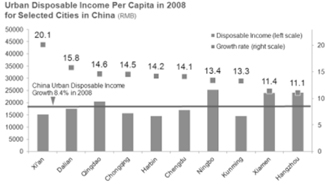
The
wealth gap is expected to narrow between the first-tier and second-tier
cities.
Rising
disposable income in the second-tier cities has lured top luxury goods
manufacturers, including LVMH Group, to expand aggressively into key second-tier
cities. The Chinese government has also been instrumental in stimulating
regional growth by designating certain second-tier regions as priority zones.
These actions are benefitting Xi’an, the Company’s primary market. Xi’an’s urban
disposable income grew 20.1 percent in 2008.
Source:
The Municipal Bureau of Statistics for the cities shown above.
Xi’an
Real Estate Market Factors
City
of Xi’an: first class in the second tier
As the
ripple effect of economic growth continues to permeate second-tier cities and
create a healthy environment for real estate development, leading indicators are
signaling continuing moderate growth in local property markets.
 |
 |
Source:
Xi’an Municipal Bureau of Statistics.
Growth
factors include the transition of certain industries to higher value-added
business, especially high-technology and services, rising GDP per capita (shown
above), increasing foreign investments, and expanding foreign retailing and
hotel operations. In addition, concerted efforts by the local governments to
create clear strategies, institute attractive policies, and invest in the
necessary infrastructure are all focused on creating favorable investment
environments in their cities.
The city
of Xi’an has demonstrated all of these characteristics.
Transformation
and urbanization
Xi’an
served as the capital of China during 13 dynasties (from West Zhou in 1066 BC to
Tang in 907 AD) and is well known for its Terracotta Army and other famous
historic landmarks. With that rich heritage as a foundation, today the city’s
economic leadership is based on its high-technology, pharmaceutical, military,
aerospace, tourism, and advanced education industries.
Xi’an
also is being transformed into a high-tech international city that offers a
large and educated work force. The city has China’s third largest
university-educated workforce, making it a hotbed for research &
development, high-technology manufacturing, and information technology
solutions.
Xi’an has
begun to attract well-known high-tech companies, including IBM, Applied
Materials, Micron Technology, and Infineon. Applied Materials, for example,
selected Xi’an for its $255 million phase one R&D center that will design
and develop equipment for semiconductor chip manufacturing. In addition, Micron
Technology has invested $250 million in Xi’an for packaging and testing of
semiconductor chips.
- 6
-
China has
announced its intention to become a world-class center for information
technology research and development, production, outsourcing, and services to
rival and perhaps surpass the success of India’s IT industry. Xi’an plays an
important role in that effort, having been designated by the government as one
of five China Outsourcing Bases. Similar to Bangalore and Hyderabad, the Xi’an
government is carving out a niche in IT outsourcing by creating the 400,000
square-meter Xi’an Software Park. The park has already attracted top software
and technology companies, including IBM, which is the government’s joint venture
partner in creating the software park. Sybase, SPSS, Nortel, Fujouru, and NEC
are already operating in the park. The Xi’an government anticipates that the
city’s IT outsourcing workforce will grow to 200,000 by 2010.
The Xi’an
government has a clear master plan through the year 2020 to foster economic
transformation and urbanization. For example, Xi’an is now limiting development
in the city’s famous historical Gated Wall City (or Inner Ring), which will be
revamped primarily for tourism. The city plans to relocate about 450,000
residents from the Inner Ring to the second, third, and fourth rings of the city
and beyond.
One of
the most ambitious plans is the development of a new satellite city in the
Baqiao district, about 8 kilometers from Xi’an’s center. The Xi’an government is
developing the Baqiao district into the “First Water City of the West”, complete
with high-end residential properties and hotels, international convention
centers, and a high-technology industry center. The new urban area will be home
for 900,000 middle-to-upper income residents and for firms in industries that
include R&D, services, and high-technology, plus the potential headquarters
for the Chinese operations of multinational corporations.
Emerging
as an international city
Xi’an’s
government has been proactive in enhancing the city’s international image by
hosting world class events like the Euro-Asia Economic Forum every second year
and the Formula One Powerboat World Championship. In November 2007, Xi’an hosted
the Euro-Asia Economic Forum in the Baqiao district, where high level delegates
held discussions on economic issues related to energy, finance, tourism, and
other cooperative industries. Baqiao is the permanent venue for the
Euro-Asia Economic Forum. On October 5, 2007, Xi’an hosted the Formula One
Powerboat World Championship on the Ba River near China Housing’s development
site.
To
attract international tourists, Xi’an is leveraging its famous historical and
cultural significance. Xi’an has revamped its tourism infrastructure in numerous
ways, including the redevelopment of the famous Terracotta theme park. It also
has selected China’s largest construction company to build a RMB 20 billion
($2.5 billion) theme park and a residential and commercial redevelopment project
on the grounds of the famous Da Ming Gong Palace that was built 1,300 years ago
during the Tang Dynasty.
The city
has also revamped its tourism infrastructure to attract international travelers
and is drawing large foreign retailers. The big box retailers have entered
Xi’an, including Wal-mart, Carrefour of France, and Metro of Germany. Xi’an’s
historic mystique and economic potential has also lured top luxury brands,
including Louis Vuitton, Gucci, Prada, and Versace to Xi’an.
Attracting
world-class investors
Property
markets in nearly all of China’s major cities have benefitted from capital
investments by major international developers, especially those from Hong Kong.
Xi’an is no exception.
Top Hong
Kong developer Henderson Land has signed agreements to develop two residential
projects in Xi’an. Partnering with Surbana, a unit of Singapore’s Temasek,
Henderson plans to develop a 30,000 unit residential project with a GFA of 1.5
million square meters and a budgeted cost of RMB 5 billion. Henderson will
develop 1,200 units for its second project with an estimated cost of RMB 1.3
billion. The projects give Baqiao a major vote of confidence because Henderson
Land and Temasek are two of the leading property developers and investors in
Asia. With developments adjacent to China Housing’s site, Henderson &
Temasek’s second project should benefit China Housing’s JunJing II residential
project. Because China Housing’s land was acquired at a substantially lower
cost, China Housing expects healthy margins from the JunJing II project when the
construction is finished.
Prices
catching up to fundamentals
Good
demographic and economic factors, including emerging high-tech industries and
increasing foreign capital inflow, bode well for Xi’an’s future
growth.
In 2007,
the average urban living area per person was 23.4 square meters in
Xi’an, slightly higher than China’s urban average of 22.6 square meters per
person in the same year. Xi’an has announced plans to increase the average
living area per person to 31.1 square meters by 2020, which will require an
additional 130 million square meters of new development by 2020. That growth
target is already creating significant opportunity for property
developers.
- 7
-
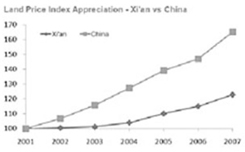
Despite
the solid economic growth and rising housing demand, real estate prices in Xi’an
are still less than half of those in the mega cities such
as Shanghai, Beijing, and Shenzhen. As shown below, land appreciation
since 2001 is lower than the national average and the gap of property
appreciation between Xi’an and tier-one cities has widened since
2002.
 |
 |
Sources:
National Bureau of Statistics and E-House China Real Estate Research Institute,
Xi’an Branch.
Xi’an:
Growing, leading, and still affordable
The
central government’s “Go West” policy has designated Xi’an as the regional
economic center of western China. To further encourage western China’s
development, the central government has planned to establish the Central Shanxi
Plain Economic region that will help enable the free flow of people, skills,
capital, and trade among the western provinces. Xi’an, as the economic center of
the west, will play a unique leadership role among the western tier-two
cities.
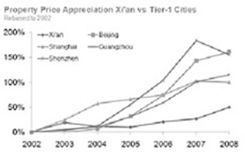
Despite
its role as the economic center of the west, compared with other tier-two
cities, shown below, Xi’an’s new-property price appreciation since 2002 is
relatively modest, making Xi’an still a very affordable city.
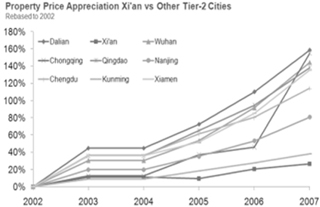
Sources:
E-House China Real Estate Research Institute.
2008
and Early 2009 Xi’an market update
In 2007,
China experienced the highest rise in residential property prices in the world.
The first half of 2008, however, saw a marked slowdown. The housing price index
for 70 major cities rose 7 percent in July 2008 from July 2007, the smallest
increase yet in 2008, following by a decline in those 70 cities in the fourth
quarter of 2008.
The real
estate sector in Xi’an was influenced by that broader market decline, with both
prices and volume in Xi’an falling in the fourth quarter 2008. Given the global
economic uncertainty, we believe many consumers chose to delay their new housing
decisions until the falling prices stabilized.
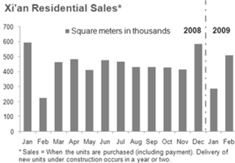
The Xi’an
real estate market warmed in January and February 2009, with consumers
apparently sensing that it was time to buy. Both sales volume and prices were up
as illustrated below.
Residential
pre-sales volume, measured by per square meter sold in the January-February 2009
period, increased 5.9 percent from the same two-month period of 2007, perhaps
indicating that the outlook for the Xi’an housing market may be
improving.
- 8
-
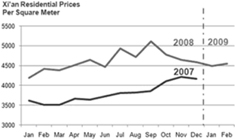
Residential
pre-sales average price per square meter increased by 4.5 percent in
January and by 7.0 percent in February 2009 compared with January and February
of 2008.
China
Housing’s pre-sales volume and prices in January and February 2009 were up over
the same periods of 2007, as well.
While the
volume and price increases in January and February are good news, it is still
too early to determine if the increases were caused by a temporary release of
pent up demand or by a sustainable upturn in the Xi’an housing
market.
 |
 |
|
|
|
Sources:
E-House China Real Estate Research Institute, Xi’an
Branch.
|
February
2007 and January 2008 reflect the holiday Lunar
New Year
and Spring Festival periods in China.
Sources:
E-House China Real Estate Research Institute, Xi’an Branch.
Economic
and Industry Stimulus Programs of 2008 and early 2009
Xi’an’s
real estate stimulation in 2008
To
stimulate its housing market, in August 2008, the Xi’an municipal government
announced a series of favorable new policies to encourage the growth of its
housing market by making homes more available and more affordable for Xi’an
citizens and by providing support and improvements for real estate
developers.
The Xi’an
municipal government’s new policy consists of three broad actions, which will be
in effect through the end of 2009. First, the Xi’an government is providing
subsidy discounts to consumers for housing purchases that will vary primarily by
the size of the home. Buyers will receive subsidized discounts on their home
purchase prices, with a 1.5 percent subsidy on apartments less than 90 square
meters, a 1.0 percent on medium-sized homes, and a 0.5 percent
for apartments larger than 144 square meters.
Second,
the Xi’an city government is relaxing qualifications for residential housing
loans, increasing the total RMB available for each loan, and reducing the
interest rates on the loans.
And
third, real estate developers will be able to receive subsidies and supports on
loans and land rights purchases, plus reductions in fees and taxes, and will
also benefit from streamlined project planning, approval, and oversight
processes by the city.
- 9
-
China’s
4 trillion RMB stimulation package of 2008
In
response to the global financial crisis, the People’s Republic of China
announced a 4 trillion RMB stimulation program on November 27, 2008.
Subsequently, on March 6, 2009, the National Development and Reform Commission
Director, Mr. Zhang Ping, announced a reshaping of that economic stimulus
package that retained the investment total of 4 trillion RMB but adjusted its
focus. Within the 4 trillion RMB package, about 400 billion RMB will go toward
civil works, including low-income housing and renovation. Two additional
categories (technology advances & industry restructuring for 370 billion RMB
and infrastructure for 1.5 trillion RMB) are also expected to benefit Xi’an’s
industries, and therefore further support demand in the city’s real estate
market.
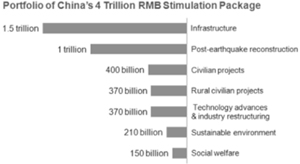
Source:
Zhang Ping, National Development and Reform Commission, press conference, March
6, 2009.
China’s
10-industry stimulation of 2009
On
February 26, 2009, China’s State Council reinforced China’s 2008 stimulation
package by further measures to stimulate specific industries in 2009. The
industries include automobile, iron and steel, textiles, equipment
manufacturing, shipbuilding, electronics and information technology,
petrochemicals, light industries, nonferrous metals, and logistics.
Cautionary
disclaimer
Although
the individuals and governments around the world hope that government
stimulation efforts will have the desired effects, the global economy and global
financial markets have not yet stabilized, so the true effects of these and
perhaps additional stimulation efforts by local, provincial, and national
governments in China, as well as by other countries, remain unknowable at the
moment.
Our
Goal
Our goal
is to become the leading residential property developer in Xi’an and in other
urban markets in western China, measured by the combination of high customer
satisfaction, high quality design and construction, the gross floor area created
each year, total assets, and return on investment (IRR).
Our
Strategies
|
1.
|
Focus
on continuing to serve the greater Xi’an market and on expanding our real
estate development business into the leading urban markets in western
China, because western China —
|
|
▪
|
accounts
for about half the geographic area of China in total and a growing share
of the country’s population,
|
|
▪
|
has
substantial natural resources that are being mined and that are creating
jobs and higher incomes per capita,
|
|
|
▪
|
has
high potential GDP growth, creating higher disposable
incomes,
|
|
▪
|
has
high population growth due to —
|
|
▪
|
China’s
Go West policy that encourages people to move from the tier 1 cities to
smaller cities in the west,
|
|
▪
|
China’s
rural to urban migration, and
|
|
▪
|
the
emerging economies based on resource exploitation and plans for industry
diversification, and
|
|
▪
|
is
a market that is just emerging, so the development cost will be relatively
inexpensive but the potential price appreciation should be
attractive.
|
|
2.
|
Serve
the rapidly growing middle and upper income
families.
|
Our
target market customers appreciate our high quality and can afford our
attractive cost-effective apartments.
- 10
-
|
3.
|
Maintain
modern cost control systems to ensure cost-effective and efficient
operations.
|
We have
established modern processes and systems to analyze and manage all functions in
our company, including operating and construction schedules and associated
costs, land rights acquisition costs, cash, working capital, assets,
liabilities, bidding and selection processes, and capital
expenditures.
|
4.
|
Leverage
our strong brand.
|
With more
than 16 years in the Xi’an real estate market, China Housing has built a widely
recognized brand, using the Tsining name, that is known for high quality at
reasonable prices. Each of our seven completed projects has strengthened our
reputation, and we believe our current projects will do the same.
Our
acquisition of the Xi’an Xinxing property management company in early 2009 will
further strengthen our high-quality brand by providing outstanding property
management services to customers long after they have purchased their
apartments. The buildings and grounds will be better maintained, and the value
of the apartments should be better retained.
Our
strong brand gives us a competitive advantage in acquiring property rights,
attracting customers, negotiating prices, achieving target internal rates of
return, and expanding into other markets.
|
5.
|
Use
our access in the global capital markets to expand our organic growth and
increase our prudent acquisitions and
expansions.
|
Because
we have an unblemished record as a borrower, we have good access to capital,
both in China, and in the global capital markets. Our listing on NASDAQ in 2008
broadened investors’ and bankers’ awareness, recognition, and interest in our
Company, which has already made our access to capital easier and at relatively
lower costs.
Our
Strengths
|
1.
|
We
are effectively positioned in greater Xi’an and expect to be similarly
positioned in our targeted
locations.
|
|
2.
|
We
understand and serve our chosen target market segments (middle and
middle-upper income families) well and have a proven ability to provide
large-scale high-quality housing that our customers desire and will
cherish for many years to come.
|
|
3.
|
We
have extensive core competencies, supplemented by training and development
programs. Our core competencies, listed below, are woven into every phase
of our real estate development business. Our staff works as one integrated
team on each phase. China Housing's core competencies
include:
|
|
▪
|
Land
analysis and acquisition,
|
|
▪
|
Site
planning and development,
|
|
▪
|
Design,
architecture, engineering, and
construction,
|
|
▪
|
Environmental
awareness and actions,
|
|
▪
|
Project
management,
|
|
▪
|
Finance,
|
|
▪
|
Marketing
and sales,
|
|
▪
|
Joint
ventures and co-developments,
|
|
▪
|
Government
relations,
|
|
▪
|
Property
management,
|
|
▪
|
Demolition
and recycling, and
|
|
▪
|
Acquisition
integration.
|
4. Our
experienced management team has a proven track record of high-quality
performance and high investment returns.
In every
position, we have effective and efficient people who focus on extending our
track record of successful operating and financial performance.
Our top
five leaders have a total of more than 85 years of relevant
experience.
- 11
-
|
5.
|
Our
access to the global capital
markets.
|
We
believe our good record with our banks and investors, plus the greater awareness
and recognition created by our listing on NASDAQ and our investor relations
program, will give us continuing access to adequate capital.
|
6.
|
Our
local market knowledge and familiarity with the real estate market and
participants in northwest China.
|
We know
the real estate market, the players, and the parcels. Usually, we have the best
relationships in the industry, which give us a substantial competitive advantage
— to acquire development rights and land rights, to select the best
subcontractors and suppliers, to have the most effective marketing and sales
programs, to attract the best leaders and staff, to support the government in
implementing its desired housing policies, and to achieve our target rates of
return on investment.
Our
Property Projects
We
provide three fundamental types of real estate development
products:
|
▪
|
High-rise
apartment buildings, typically 12 to 28 stories high, usually of
steel-reinforced concrete, that are completed within about 24 months after
securing all required permits.
|
|
▪
|
Mid-rise
apartment buildings, typically 7 to 11 stories high, usually of
steel-reinforced concrete, that are completed within 12 to 18 months after
securing all required permits.
|
|
▪
|
Low-rise
apartment buildings and villas, typically 2 to 6 stories high, often of
steel-reinforced concrete, that are completed within about 12 months after
securing all required permits.
|
Our
projects can be classified into one of four stages of development:
|
▪
|
Projects
under construction, where the building construction has started but has
not yet been completed;
|
|
▪
|
Projects
in process, which include developments where typically we have secured the
development and land use rights, and where the site planning,
architecture, engineering, and infrastructure work is
progressing;
|
|
▪
|
Projects
in planning, where we have purchased the development and or land use
rights for parcels of land as part of our project development pipeline.
The completion of projects on these sites is subject to adequate
financing, permits, licensing, and certain market conditions;
and
|
|
▪
|
Completed
projects, where the construction has been finished and most of the units
in the buildings have been sold, leased, or
rented.
|
Project
under construction
|
Project
name
|
Type of
Projects
|
Actual or
Estimated
Construction
Period
|
Actual or
Estimated Pre-
sale
Commencement
Date
|
Total
Site
Area
(m2)
|
Total
Gross
Floor Area
(m2)
|
Sold GFA
by December
31,
2008
(m2)
|
||||||||||||||
|
JunJing
II phase
one
|
|
Multi-Family
residential & Commercial
|
|
Q3/
2007
- Q3/2009
|
Q2/2008 |
|
39,524 | 136,012 | 57,098 | |||||||||||
|
JunJing
II phase
two
|
|
Multi-Family
residential & Commercial
|
|
Q2/2009
- Q2/2011
|
Q3/2009 |
|
29,800 | 112,556 | - | |||||||||||
|
Puhua
Project
|
|
Multi-Family
residential & Commercial
|
|
Q2/2009
- Q32014
|
Q3/2009 |
|
192,582 | 610,000 | - | |||||||||||
|
Project
name
|
Total
Number of
Units
|
Number of
Units sold
by
December
31,
2008
|
Estimated
Revenue
(million)
|
Contracted
Revenue by
Dec 31,
2008
(million)
|
Recognized
Revenue
by
December
31, 2008
(million)
|
|||||||||||||||
|
JunJing
II phase
one
|
1,182 | 559 |
95.6
|
33.6
|
23.8 | |||||||||||||||
|
|
|
|||||||||||||||||||
|
JunJing
II phase
two
|
1,015 | - | 94.1 | - | - | |||||||||||||||
|
Puhua
Project
|
5,000 | - | 700.0 | - | - | |||||||||||||||
- 12
-
JunJing II: JunJing II is
located at 38 East Hujiamiao, Xi’an, with total GFA about 248,568 square meters.
It is the first Canadian style residential community with “green and
energy-saving” characteristics, and won the “National Energy Saving Project.”
The project is divided into 2 phases, namely JunJing II phase one and JunJing II
phase two. We started the construction of JunJing II phase one in the third
quarter of 2007 and started the presale campaign in the second quarter of
2007.
As
of December 31, 2008, our customers have signed pre-sale purchase
agreements for apartments with purchase prices totaling $33.6 million, of which
we have recognized $23.8 million in revenues in 2008 based on the
percentage of completion method of accounting. Approximately $9.2 million of
pre-sale payments were booked as advances from customers and will be recognized
as revenues as construction advances.
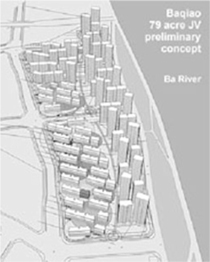
Puhua: The Puhua project, the
Company’s 79 acre joint venture located in the Baqiao project, has a total land
area of 192,582 square meters and an expected gross floor area of
approximately 610,000 square meters. In November 2008, the Company entered into
an agreement with Prax Capital China Real Estate Fund I, Ltd., to form a
joint venture. The joint venture was formed in late 2008, subject to certain
conditions and approvals, which have been satisfied. Prax Capital Real
Estate Holdings Limited invested US$29.3 million in cash in the joint venture,
the joint venture acquired the land use rights early in the first quarter
of 2009, and the joint venture is proceeding with the project.
The
construction of the Puhua project began in June 2009. The whole project, which
consists of four phases, is expected to be completed in the third quarter of
2014, with estimated revenues of $700 million. We will begin accepting pre-sale
purchase agreements during the third quarter of 2009. Revenue from the pre-sales
will begin to be recognized upon the completion of the foundation.
Projects
under planning and in process
|
Project
name
|
Type of
Projects
|
Estimated
Construction
Period
|
Estimated Pre-
sale
Commencement
Date
|
Total Site
Area
(m2)
|
Total GFA
(m2)
|
Total
Number of
Units
|
||||||||||||||
|
Baqiao
New Development Zone
|
Land
Development
|
2009
-
2020
|
N/A
|
N/A
|
N/A
|
N/A
|
||||||||||||||
|
JunJing
III
|
|
Multi-Family
residential & Commercial
|
Q3/2009
- Q3/2011
|
Q3/2009
|
8,094
|
51,470
|
570
|
|||||||||||||
|
Park
Plaza
|
|
Multi-Family
residential & Commercial
|
Q4/2009
- Q4/2013
|
Q1/2010
|
44,250
|
200,000
|
2,000
|
|||||||||||||
|
Golden
Bay
|
Multi-Family
residential & Commercial
|
Q4/2010
- Q4/2014
|
Q1/2011
|
160,665
|
351,812
|
N/A
|
||||||||||||||
Baqiao New Development
Zone: On March 9, 2007, we entered into a Shares Transfer
Agreement with the shareholders of Xi’an New Land Development Co., Ltd. (New
Land), under which the Company acquired 32,000,000 shares of New Land,
constituting 100 percent equity ownership of New Land. This acquisition gave the
Company the exclusive right to develop and sell 487 acres of land in a
newly designated satellite city of Xi’an. We believe this represents a major
growth opportunity for the Company.
Xi’an has
designated the Baqiao District as a major resettlement zone where the city
expects 900,000 middle to upper income people to settle. The Xi’an government
intends to generate a success similar to that created by Pudong for Shanghai,
which has resulted in new economic opportunities and provided housing for
Shanghai’s growing population.
The Xi’an
municipal government plans to invest 50 billion RMB (over $6 billion) in
infrastructure in the Baqiao New Development Zone. The construction of a
large-scale public wetland park is well underway; it will embellish the natural
environment adjacent to China Housing’s Baqiao project.
|
Through
its New Land subsidiary, China Housing sold 18.4 acres to another
developer in 2007 and generated about $24.41 million in
revenue.
In
2008, we established a joint venture with Prax Capital Real Estate
Holdings Limited (Prax Capital) to develop 79 acres within the Baqiao
project, which will be the first phase of the Baqiao project’s
development. Prax Capital invested $29.3 million cash in the joint
venture. The project is further described in Puhua section
below.
After
selling 18.4 acres and placing 79 acres in the joint venture, about 390
acres remained available for the Company to develop in the Baqiao
project.
JunJing III: JunJing
III is near our JunJing II project and the city expressway. It will
have an expected total gross floor area of about 51,470 square
meters. The project will consist of 3 high rise buildings, each 28 to 30
stories high. The project is targeting middle to high income customers who
require a high quality living environment and convenient transportation to
the city center. We plan to start construction during the third
quarter 2009 and the pre-sales during the same quarter. The total
estimated revenue from this project is about $46.0
million.
|
|
 |
Park Plaza: In July 2009, the
Company entered into a Letter of Intent to acquire 44,250 square meters of land
in the center of Xi'an for the Park Plaza project. The Company intends to
develop a large mid-upper income residential and commercial development project
on this site, with a gross floor area of 200,000 square meters. The four-year
construction of Park Plaza is expected to begin in the fourth quarter 2009. We
anticipate accepting pre-sale purchase agreements in the second quarter of 2010,
and revenues from pre-sale agreements will be begin to be recognized upon the
completion of the foundation. The total revenue from Park Plaza is estimated to
be $206 million.
Golden Bay: The Golden Bay
project is located within the Baqiao project, with a total gross floor area of
351,812 square meters. The Golden Bay project will consist of a hotel, office
buildings, residential buildings, as well as a commercial area. Construction is
anticipated to begin in the fourth quarter of 2010, and we expect to begin
accepting pre-sale purchase agreements in the second quarter of 2011. Revenue
will be recognized upon the completion of the foundation.
- 13
-
Completed
Projects
|
Project name
|
Type of
Projects
|
Completion
Date
|
Total Site
Area
(m2)
|
Total GFA
(m2)
|
Total
Number of
Units
|
Number of
Units sold by
December
31,
2008
|
|||||||||||||||
|
Tsining
Mingyuan
|
|
Multi-Family
residential & Commercial
|
|
Q2/2000
|
17,526
|
53,055
|
303
|
303
|
|||||||||||||
|
Lidu
Mingyuan
|
|
Multi-Family
residential & Commercial
|
|
Q4/2001
|
5,289
|
8,284
|
56
|
56
|
|||||||||||||
|
Tsining
Hanyuan
|
Multi-Family
residential & Commercial
|
Q4/2003
|
3,026
|
32,229
|
238
|
238
|
|||||||||||||||
|
Tsining
Home IN
|
Multi-Family
residential & Commercial
|
Q4/2003
|
8,483
|
30,072
|
215
|
213
|
|||||||||||||||
|
Tsining
Gangwan
|
Multi-Family
residential & Commercial
|
Q4/2004
|
12,184
|
41,803
|
466
|
464
|
|||||||||||||||
|
Tsining-24G
|
Hotel,
Commercial
|
Q2/2006
|
8,227
|
43,563
|
773
|
672
|
|||||||||||||||
|
JunJing
I
|
Multi-Family
residential & Commercial
|
Q3/2006
|
55,588
|
167,931
|
1,671
|
1,566
|
|||||||||||||||
Tsining Mingyuan: 8 East
Youyi Road, Xi’an. The construction area was 53,055 square meters. Mingyuan is a
residential complex consisting of 303 apartments ranging from two to four
bedrooms. Construction commenced in March 1998 and was completed in April 2000.
In total, the project generated total sales of $19.98 million as of December 31,
2008.
Lidu Mingyuan: 25 East
Mutoushi, Xi’an. Located in the prime area near Xi’an historic Bell Tower, the
project covers 1.3 acres with a building area of 8,284 square meters, and has 56
apartments ranging from two to four bedrooms. The project began in October 2000
and was completed in November 2001. Total sales were $4.32 million as of
December 31, 2008
Tsining Hanyuan: 6 East Youyi
Road, Xi’an. Located in the south of Xi’an, the area is noted for its schools
and universities. The project was started in February 2002 and completed in
December 2003. It is comprised of 238 two and three bedroom apartments and
covering a total construction area of 32,229 square meters. The project
generated total sales of $14.05 million as of December 31, 2008
Tsining Home IN: 88 North
Xingqing Road, Xi’an. Located near the city center, the Home IN project consists
of 215 two and three bedroom western-style apartments. Total construction area
is 30,072 square meters. The project, completed in December 2003, generated
sales of $12.77 million in total sales as of December 31, 2008
Tsining GangWan: 123 Laodong
Road, Xi’an. Less than one mile from the western hi-tech industrial zone,
GangWan spans three acres and is comprised of eight buildings with a total
construction area of 41,803 square meters. The project began in April 2003 and
was completed in December 2004. GangWan has 466 apartments ranging from
one to three bedrooms. Total sales were $18.28 million as of December
31, 2008
Tsining-24G: 133 Changle Road, Xi’an.
24G is a redevelopment of an existing 26 floor building, located in the center
of the most mature and developed commercial belt of the city. This upscale
development includes secured parking, cable TV, hot water, air conditioning,
natural gas access, internet connection, and exercise facilities. This project
was awarded “The Most Investment Potential Award in Xi’an city” in 2006,
Its target Customer were white-collar workers, small business owners and
traders, entrepreneurs. Total area available for residential use was 43,563
square meters, covering 372 one to three bedroom serviced apartments. The
project started construction in June 2005 and was completed in June 2006. Sales
totaled $38.22 million as of December 31, 2008
Tsining JunJing Garden I: 369
North Jinhua Road, Xi’an. It is the first German style residential &
commercial community in Xi’an, designed by the world-famous WSP architectural
design house. Its target Customer is local middle income families. The project
has 15 residential apartment buildings consisting of 1,230 one to five bedroom
apartments. The Garden features secured parking, cable TV, hot water, heating
systems, and access to natural gas. Total GFA available was 167,931 square
meters. JunJing Garden I was also a commercial venture that houses small
businesses serving the needs of JunJing Garden I residents and surrounding
residential communities. The project was completed in September 2006 and
generated total revenue $48.88 million as of December 31, 2008
- 14
-
Customers
Middle
income families comprise the Company’s primary residential customer group and
represent the fastest growing segment in Xi’an as well as China in general. The
annual income for the middle-income family targeted by the Company ranges
between RMB100,000 and RMB200,000. Xi’an’s per capita GDP has grown at a 12.5
percent CAGR during the most recently available five years (2002-2007)
with continued growth anticipated over the next five years with the
strengthening of Xi’an’s economic and cultural significance in the central and
western part of China. The middle-market niche segment partially insulates the
company from direct competition with the international and national developers
in Xi’an that are targeting primarily the high-end market due to their high cost
structure and brand recognition.
Marketing
The
Company currently has seven sales managers and more than 30 primarily
commission driven direct sales employees who are on site to
service prospective clients. Its marketing campaigns typically include
television, radio, billboard, and the internet. The company also has membership
program (gold and silver members) where existing and potential customers can pay
for “points” at a discount that can be redeemed for the purchase of
property units later. The program has been very popular and provides good a
indication of future project sales and creates better cash liquidity for the
Company. The Company has been focusing on building brand equity and has
hired a third-party evaluation company to survey both existing and potential
customers about the company’s services, recognition of our
“Tsining” brand, and so on. Every year the China Housing has
achieved customer satisfaction ratings between 80-85 percent, which is very
high.
Advertising
and sales promotion costs are expensed as incurred. Advertising expense totaled
$1,261,495 in 2008 and $781,998 in 2007. The company conducted an
aggressive marketing campaign during 2008 for Tsining JunJing II, which included
advertising and fully furnished showrooms where potential buyers could see
possible layouts and decorative effects. These showrooms have attracted hundreds
of potential buyers and continue to create buyer interest and result in
additional pre-sales purchase agreements.
Suppliers
The
supply of land is controlled by the government. There are generally three ways
in which we acquire land.
|
▪
|
Purchase
by auction held by the Land Consolidation and Rehabilitation
Center;
|
|
▪
|
Purchase
by auction held by court under bankruptcy
proceedings;
|
|
▪
|
Merger
with or acquisition of a state-owned enterprise that controls developable
land.
|
All such
purchases of land are required to be reported to and authorized by the Xi’an
Bureau of Land and Natural Resources.
As for
other suppliers of design and construction services, we typically selects the
lowest-cost provider through an open bidding process. Such service providers are
numerous in China and we foresee no difficulties in securing alternative sources
of services as needed.
Intellectual
Property
We
currently have no registered intellectual property.
Research
and Development
We have
not had any material research and development expenses over the past two years.
Due to the characteristic of the housing and land development industry,
“R&D” consists of marketing research. The funding of all marketing research
is expected to come from operating cash flow.
- 15
-
Governmental
and Environmental Regulation
To date,
we have been compliant with all registrations and requirements for the issuance
and maintenance of all licenses required by the applicable governing authorities
in China. These licenses include:
“Level 1
Qualification Certificate for Real Estate Development” authorized by the
Shaanxi Construction Bureau, effective from December 20, 2006 to December 20,
2009. License number JianKaiQi (2006) 603. The housing & land development
process is regulated by the Ministry of Construction and authorized by the local
offices of the Ministry. Each development project must obtain the following
licenses:
“License
for Construction Area Planning" and "License for Construction Project Planning",
authorized by Xi’an Bureau of Municipal Design;
“Building
Permit” authorized by the Committee of Municipal and Rural
Construction;
After
construction is complete, the project must obtain a validation certificate.
There are various standards that must be met to obtain this certificate. These
standards are regulated by Local Ministry of Construction Bureau.
Housing
and land development sales companies are regulated by the Ministry of Land &
Natural Resources and authorized by the local office of the Ministry. Each
project also has to be authorized and must obtain a “Commercial License for
Housing Sale” from the Real Estate Bureau.
Competition
The real
estate industry in China tier two cities is fragmented and highly competitive.
We compete primarily with local and regional property developers and an
increasing number of large national property developers have also started
to enter these markets.
There are
developers of various sizes targeting the Xi’an real estate market, including
pure developers, subsidiaries of traditional industries, and municipal
government real estate development companies. We have divided them into three
categories: local, national, and international. The national and international
developers tend to limit themselves to the high end residential markets in
Xi’an, targeting annual family income above RMB300,000, whereas China Housing
focuses on the middle tier with annual income between RMB 100,000 and RMB
200,000.
- 16
-
Typically,
the housing and land development industry is a regional business with mostly
local players competing with us for small to medium size projects.
Local
competition
The local
Xi’an development market is fragmented with close to 350 listed developers, most
of which are of small scale and scope and currently do not have active
development projects. Tsining is one of the four Level I rated
developers in Xi’an. The other three major local companies are government
related and one is publicly listed in Shanghai Stock Exchange.
Tande Co.
(Tiandiyuan) is considered the largest developer in Xi’an. It is a government
affiliated company that has been targeting primarily the High-tech Development
Zone. China Housing has not seen any direct competition with Tande
since China Housing focuses mainly on the eastern and southern part of
Xi’an. Tande targets primarily the southwestern Xi’an.
Xi’an
Jingfa Real Estate Co., Ltd., (Jingfa) is also a state owned enterprise. So
far, Jingfa has only engaged in one project in northern Xi’an. The Company
has not seen direct competition with Jingfa.
Shaanxi
International Trust & Investment Corp., was acquired by China Minsheng
Banking Corp., Ltd., in March 2008, and is no longer in real estate
development business.
With the
new stringent government policy striving to enhance buyers’ services and reduce
property development speculation, many smaller local developers are finding it
harder and harder to survive when faced with increased regulatory oversight,
weakened ability to borrow, and enhanced international competition. This
presents an attractive opportunity for well financed and managed companies like
China Housing to acquire developers with attractive parcels of
land.
National
or regional competition
The
larger scale national developers have increased their presence in Xi’an,
including Vanke, Greenland, Guangzhou R&F, Gemdale, and China Overseas &
Land. Most of these national players target the higher end markets due to their
higher cost base and better name recognition. Their projects are located in
Qujiang and the high-tech zone of Xi’an. The average price
of Gemdale’s projects in these areas is RMB 10,438 per square meter. China
Overseas & Land’s project is priced at about RMB 6,587 per square
meters. Since China Housing targets different income levels and geographic
regions than they do, we have not seen any significant direct competition with
these national players.
International
competition
There are
a number of top international developers starting to focus on Xi’an, including
Hutchinson Whampoa, Henderson Land, Surbana, Mapletree Group, GIC Group, and so
on.
Hong
Kong’s Henderson Land and Singapore’s Temasek are working on a 30,000 unit joint
project in the Baqiao district. Known as La Botanica, the project covers
about 323 acres, with a GFA about 3 million square meters, in which residences
account for about 85 percent of the GFA, with commercial spaces occupying the
remainder. Facilities will include restaurants, a shopping mall, entertainment,
one-stop education from kindergarten to high school, a hospital, and a giant
club covering 12,000 square meters. Although these brand name Asian
developers may present competition for the acquisition of land, over the
long run, we believe they help to bring a higher standard of living and higher
real estate valuations to Xi’an’s and China Housing’s market.
Qualification
levels
The real
estate development business in China is organized into four levels under the
structure of the “Qualification Certificate for Real Estate Development
Enterprise.” The starting level is Level 4 (see table below). Dependent upon the
registered capital, the number of years of industry experience, the area of land
it has developed and its safety record, a company may climb the scale to
participate in larger projects. However, only one level may be ascended per
year.
|
|
Registered Capital
(million)
|
Experience
(years)
|
Developed
Area
(square
meters)
|
Other
|
Time for
license to
be
authorized
|
|||||||
|
Level
1
|
US$
|
6.250
|
5
|
300,119
|
No
|
|||||||
|
Level
2
|
US$
|
2.500
|
3
|
150,059
|
Severe
|
20
Days
|
||||||
|
Level
3
|
US$
|
1.000
|
2
|
50,020
|
Accident
|
|||||||
|
Level
4
|
US$
|
0.125
|
1
|
N/A
|
||||||||
- 17
-
On the
national level, there are numerous Level 1 companies that have real estate
projects across China (to develop in multiple regions, a Level 1 status is
required). There are 79 housing and land development companies listed on the
Shanghai, Shenzhen, and Hong Kong stock exchanges. However, such companies
usually undertake large scale projects and are unlikely to compete with us for
business, since we target small to medium size projects.
We had
gained Level 1 status under the China Ministry of Construction licensing policy
in December 2006.
Employees
As of
December 31, 2008, we had 77 employees in the following capacities: 11
management, 4 administrative, 11 finance, 4 planning, 3 research and
development, and 44 employees in subsidiaries, including 30 in Tsining, 9 in New
Land, and 5 in the Puhua.
We
believe we have a good working relationship with our employees. We are not a
party to any collective bargaining agreements. At present, no significant change
in our staffing is expected over the next 12 months, except for our acquisition
of the property management company we acquired in January 2009. All employees
are eligible for performance-based compensation.
ITEM
1A. RISK FACTORS
The
investment in our company has a high degree of risk. Before you invest you
should carefully consider the risks and uncertainties described below and
the other information in this filing. If any of the following risks
actually occur, our business, operating results, and financial condition could
be harmed and the value of our stock could go down. This means you
could lose all or a part of your investment.
Risks
Related to Our Business
Our home
sales and operating revenues could decline due to macro-economic and other
factors outside of our control, such as changes in consumer confidence and
declines in employment levels.
Changes
in national and regional economic conditions, as well as local economic
conditions where the Company conducts its operations and where
prospective purchasers of our homes live, may result in more caution on the
part of home buyers and consequently may make fewer home purchases. These
economic uncertainties involve, among other things, conditions of supply
and demand in local markets and changes in consumer confidence and income,
employment levels, and government regulations. These risks and
uncertainties could periodically have an adverse effect on consumer demand for
and the pricing of our homes, which could cause our operating revenues
to decline. In addition, builders are subject to various risks, many of them
outside the control of the homebuilder including competitive overbuilding,
availability and cost of building lots, materials and labor, adverse weather
conditions which can cause delays in construction schedules, cost overruns,
changes in government regulations, and increases in real estate taxes and other
local government fees. A reduction in our revenues could, in
turn, negatively affect the market price of our securities.
An
increase in mortgage interest rates or unavailability of mortgage financing may
reduce consumer demand for the Company’s homes. Virtually all purchasers of
our homes finance their acquisitions through lenders providing mortgage
financing. A substantial increase in mortgage interest rates
or unavailability of mortgage financing would adversely affect the ability
of prospective home buyers to obtain the financing they would need in order
to purchase our homes, as well as adversely affect the ability of
prospective move-up home buyers to sell their current homes. For
example, if mortgage financing became less available, demand for our
homes could decline. A reduction in demand could also have an adverse effect on
the pricing of our homes because we and our competitors may reduce prices
in an effort to better compete for home buyers. A reduction in pricing could
result in a decline in revenues and in our margins.
We could
experience a reduction in home sales and revenues or reduced cash flows if we
are unable to obtain reasonably priced financing to support
our home building and land development activities.
The real
estate development industry is capital intensive, and development requires
significant up-front expenditures to acquire land and begin
development. Accordingly, we incur substantial indebtedness to finance our
home building and land development activities. Although we believe that
internally generated funds and current borrowing capacity will be
sufficient to fund our capital and other expenditures (including land
acquisition, development, and construction activities), the amounts
available from such sources may not be adequate to meet our needs. If such
sources are not sufficient, we would seek additional capital in the form of
debt or equity financing from a variety of potential sources, including bank
financing and or securities offerings. The availability of borrowed funds,
to be used for land acquisition, development, and construction, may be
greatly reduced, and the lending community may require increased amounts of
equity to be invested in a project by borrowers in connection with new
loans. The failure to obtain sufficient capital to fund our planned capital and
other expenditures could have a material adverse effect on our
business.
- 18
-
We are
subject to extensive government regulation which could cause the Company to
incur significant liabilities or restrict its business
activities. Regulatory requirements also could cause us to incur
significant liabilities and operating expenses and could restrict our business
activities. We are subject to statutes and rules regulating, among other
things, certain developmental matters, building and site design, and matters
concerning the protection of health and the environment. Our operating
expenses may be increased by governmental regulations such as building permit
allocation ordinances and other fees and taxes, which may be imposed to
defray the cost of providing certain governmental services and improvements. Any
delay or refusal from government agencies to grant us necessary licenses,
permits, and approvals could have an adverse effect on our
operations.
We may
require additional capital in the future, which may not be available on
favorable terms or at all.
Our
future capital requirements will depend on many factors, including industry and
market conditions, our ability to successfully implement our new
branding and marketing initiative, and expansion of our production
capabilities. We anticipate that we may need to raise additional funds in
order to grow our business and implement our business strategy. We
anticipate that any such additional funds would be raised through equity or debt
financings. In addition, we may enter into a revolving credit facility or a
term loan facility with one or more syndicates of lenders. Any equity or debt
financing, if available at all, may be on terms that are not favorable to
us. Even if we are able to raise capital through equity or debt financings, as
to which there can be no assurance, the interest of existing shareholders
in our company may be diluted, and the securities we issue may have rights,
preferences, and privileges that are senior to those of our common stock or
may otherwise materially and adversely affect the holdings or rights of our
existing shareholders. If we cannot obtain adequate capital, we may not be able
to fully implement our business strategy, and our business, results of
operations, and financial condition would be adversely affected. See also
“Management’s Discussion and Analysis of Financial Condition and Results of
Operations — Liquidity and Capital Resources.” In addition, we have and will
continue to raise additional capital through private placements or
registered offerings, in which broker-dealers will be engaged. The activities of
such broker-dealers are highly regulated, and we cannot assure that the
activities of such broker-dealers will not violate relevant regulations and
generate liabilities despite our expectation otherwise.
We depend
on the availability of additional human resources for future
growth.
We are
currently experiencing a period of significant growth in our sales volume. We
believe that continued expansion is essential for us to remain
competitive and to capitalize on the growth potential of our business. Such
expansion may place a significant strain on our management and operations and
financial resources. As our operations continue to grow, we will have to
continually improve our management, operational and financial systems,
procedures and controls, and other resources infrastructure, and expand our
workforce. There can be no assurance that our existing or future management,
operating and financial systems, procedures, and controls will be adequate
to support our operations, or that we will be able to recruit, retain, and
motivate employees. Further, there can be no assurance that we will be
able to establish, develop, or maintain the business relationships beneficial to
our operations, or to do so or to implement any of the above activities in
a timely manner. Failure to manage our growth effectively could have a material
adverse effect on our business and the results of our operations and
financial condition.
We may be
adversely affected by the fluctuation in raw material prices and selling prices
of our products.
Our
projects and the raw materials we use have experienced significant price
fluctuations in the past. There is no assurance that they will not be subject to
future price fluctuations or pricing control. The land and raw materials we
use may experience price volatility caused by events such as market fluctuations
or changes in governmental programs. The market price of land and raw
materials may also experience significant upward adjustment, if, for instance,
there is a material under-supply or over-demand in the market. These price
changes may ultimately result in increases in the selling prices of our
products, and may, in turn, adversely affect our sales volume, revenue, and
operating profit.
We could
be adversely affected by the occurrence of natural disasters.
From time
to time, our developed sites may experience strong winds, storms, floods, and
earthquakes. Natural disasters could impede operations and or
damage infrastructure necessary to our constructions and operations. The
occurrence of natural disasters could adversely affect our business, the results
of our operations, prospects, and financial condition, even though we
currently have insurance against damages caused by natural disasters, including
typhoons, accidents, or similar events.
- 19
-
Intense
competition from existing and new entities may adversely affect our revenues and
profitability.
In
general, the property development industry is intensely competitive and highly
fragmented. We compete with various companies. Many of our competitors
are more established than we are and have significantly greater financial,
technical, marketing, and other resources than we presently possess. Some of
our competitors have greater name recognition and a larger customer base.
These competitors may be able to respond more quickly to new or changing
opportunities and customer requirements and may be able to undertake more
extensive promotional activities, offer more attractive terms to customers, and
adopt more aggressive pricing policies. We intend to create greater
awareness for our brand name so that we can successfully compete with our
competitors. We cannot assure you that we will be able to compete
effectively or successfully with current or future competitors or that the
competitive pressures we face will not harm our business.
Our
operating subsidiaries must comply with environmental protection laws that could
adversely affect our profitability.
We are
required to comply with the environmental protection laws and regulations
promulgated by the national and local governments of the People’s
Republic of China (“PRC” or “China”). Some of these regulations govern the
level of fees payable to government entities providing environmental protection
services and the prescribed standards relating to the constructions.
Although our construction technologies allow us to efficiently control the level
of pollution resulting from our construction process, due to the nature of
our business, waste are unavoidably generated in the processes. If we fail to
comply with any of these environmental laws and regulations in the PRC,
depending on the types and seriousness of the violation, we may be subject to,
among other things, warning from relevant authorities, imposition of
fines, specific performance and or criminal liability, forfeiture of
profits made, being ordered to close down our business operations, and
suspension of relevant permits.
Our
success depends on our management team and other key personnel, the loss of any
of whom could disrupt our business operations.
Our
future success will depend in substantial part on the continued service of our
senior management, including Mr. Lu Pingji, our Chairman of the Board of
Directors, Mr. Feng Xiaohong, our Chief Executive Officer, and Ms. Lu Jing, our
Chief Operating Officer. The loss of the services of one or more of our
key people could impede implementation of our business plan and result
in reduced profitability. We do not carry key person life or other insurance in
respect of any of our officers or employees. Our future success will
also depend on the continued ability to attract, retain, and motivate
highly qualified technical, sales and marketing, customer support, and
other employees. Because of the rapid growth of the economy in the People’s
Republic of China, competition for qualified people is intense. We cannot
guarantee that we will be able to retain our key people or that we will be
able to attract, assimilate, or retain qualified people in the
future.
Risk
Relating to the Residential Property Industry in China
We are
heavily dependent on the performance of the residential property market in
China, which is at a relatively early development stage.
The
residential property industry in the PRC is still in a relatively early stage of
development. Although demand for residential property in the PRC has
been growing rapidly in recent years, such growth is often coupled with
volatility in market conditions and fluctuation in property prices. It is
extremely difficult to predict how much and when demand will develop, as
many social, political, economic, legal, and other factors, most of which are
beyond our control, may affect the development of the market. The level of
uncertainty is increased by the limited availability of accurate financial and
market information, as well as the overall low level of transparency in
the PRC, especially in tier two cities, which have lagged in progress in
these aspects when compared to tier one cities. The lack of a liquid
secondary market for residential property may discourage investors from
acquiring new properties. The limited amount of property mortgage
financing available to PRC individuals may further inhibit demand for
residential developments.
We face
intense competition from other real estate developers.
The
property industry in the PRC is highly competitive. In the tier two cities on
which we focus, local and regional property developers are our major
competitors, and an increasing number of large state-owned and private
national property developers have started entering these markets. Many of our
competitors, especially the state-owned and private national property
developers, are well capitalized and have greater financial, marketing, and
other resources than we have. Some also have larger land banks, greater
economies of scale, broader name recognition, a longer track record, and
more established relationships in certain markets. In addition, the PRC
government’s recent measures designed to reduce land supply further increased
competition for land among property developers.
- 20
-
Competition
among property developers may result in increased costs for the acquisition of
land for development, increased costs for raw materials, shortages
of skilled contractors, oversupply of properties, decrease in property
prices in certain parts of the PRC, a slowdown in the rate at which new property
developments will be approved and or reviewed by the relevant
government authorities, and an increase in administrative costs for hiring or
retaining qualified personnel, any of which may adversely affect our
business and financial condition. Furthermore, property developers that are
better capitalized than we are may be more competitive in acquiring land
through the auction process. If we cannot respond to changes in market
conditions as promptly and effectively as our competitors, or effectively
compete for land acquisition through the auction systems and acquire other
factors of production, our business and financial condition will
be adversely affected.
In
addition, risk of property over-supply is increasing in parts of China, where
property investment, trading, and speculation have become overly active. We
are exposed to the risk that in the event of actual or perceived
over-supply, property prices may fall drastically, and our revenue and
profitability will be adversely affected.
The PRC
government may adopt further measures to curtail the overheating of the property
sector.
Along
with the economic growth in China, investments in the property sectors have
increased significantly in the past few years. In response to concerns over
the scale of the increase in property investments, the PRC government has
introduced policies to curtail property development. We believe the following
regulations, among others, significantly affect the property industry in
China.
In May
2006, the Ministry of Construction, National Development and Reform Commission
(NDRC), the People’s Bank of China (PBOC), and other relevant PRC
government authorities jointly issued the Opinions on Adjusting the Housing
Supply Structure and Stabilizing the Property Prices, which introduced measures
to limit resources allocated to the luxury residential market. For
instance, the new measures require that at least 70 percent of a residential
project must consist of units with a GFA of less than 90 square meters per
unit, and the minimum amount of down payment was increased from 20 percent to 30
percent of the purchase price of the underlying property if it has a unit
GFA of 90 square meters or more. In September 2007, PBOC and China Banking
Regulatory Commission issued the Circular on Strengthening the Management
of Commercial Real Estate Credit Facilities, which increased the minimum down
payment for any purchase of second or subsequent residential property to 40
percent of the purchase price if the purchaser had obtained a bank loan to
finance the purchase of his or her first property.
In July
2006, the Ministry of Construction, the Ministry of Commerce, NDRC, PBOC, the
State Administration for Industry and Commerce, and the State Administration for
Foreign Exchange issued Opinions on Regulating the Entry and Administration
of Foreign Investment in Real Property Market, which impose significant
requirements on foreign investment in the PRC real estate sector. For
instance, these opinions set forth requirements of registered capital of a
foreign invested real property enterprise as well as thresholds for a
foreign invested real property enterprise to borrow domestic or overseas loans.
In addition, since June 2007, a foreign invested real property enterprise
approved by local authorities is required to register such approvals with the
Ministry of Commerce.
The PRC
government’s restrictive regulations and measures to curtail the overheating of
the property sector could increase our operating costs in adapting to these
regulations and measures, limit our access to capital resources or even restrict
our business operations. We cannot be certain that the PRC government
will not issue additional and more stringent regulations or measures, which
could further slow down property development in China and adversely affect our
business and prospects.
Our sales
will be affected if mortgage financing becomes more costly or otherwise becomes
less attractive.
Substantially
all purchasers of our residential properties rely on mortgages to fund their
purchases. An increase in interest rates may significantly increase
the cost of mortgage financing, thus affecting the affordability of
residential properties. In 2008, PBOC changed the lending rates five times. The
benchmark lending rate for loans with a term of over five years, which
affects mortgage rates, has been increased to 5.94 percent on December 31, 2008.
The PRC government and commercial banks may also increase the down payment
requirement, impose other conditions or otherwise change the regulatory
framework in a manner that would make mortgage financing unavailable or
unattractive to potential property purchasers. Under current PRC laws and
regulations, purchasers of residential properties generally must pay at
least 20 percent of the purchase price of the properties before they can finance
their purchases through mortgages. In May 2006, the PRC
government increased the minimum amount of down payment to 30 percent of
the purchase price of the underlying property if such property has a unit GFA of
90 square meters or more. In September 2007, the minimum down payment for
any purchase of second or subsequent residential property was increased to 40
percent of the purchase price if the purchaser had obtained a bank loan to
finance the purchase of his or her first property. Moreover, the interest
rate for bank loans of such purchase shall not be less than 110 percent of
the PBOC benchmark rate of the same term and category. For further purchases of
properties, there would be upward adjustments on the minimum down payment
and interest rate for any bank loan. In addition, mortgagee banks may not lend
to any individual borrower if the monthly repayment of the anticipated
mortgage loan would exceed 50 percent of the individual borrower’s monthly
income or if the total debt service of the individual borrower would exceed
55 percent of such individual’s monthly income. If the availability or
attractiveness of mortgage financing is reduced or limited, many of our
prospective customers may not be able to purchase our properties and, as a
result, our business, liquidity and results of operations could
be adversely affected.
- 21
-
In line
with industry practice, we provide guarantees to PRC banks with respect to loans
procured by the purchasers of our properties for the total amount
of mortgage loans. Such guarantees expire upon the completion of the
registration of the mortgage with the relevant mortgage registration
authorities. If there are changes in laws, regulations, policies, and
practices that would prohibit property developers from providing guarantees to
banks in respect of mortgages offered to property purchasers and as a
result, banks would not accept any alternative guarantees by third parties, or
if no third party is available or willing in the market to provide such
guarantees, it may become more difficult for property purchasers to obtain
mortgages from banks and other financial institutions during sales
and pre-sales of our properties. Such difficulties in financing could
result in a substantially lower rate of sale and pre-sale of our properties,
which would adversely affect our cash flow, financial condition, and
results of operations. We are not aware of any impending changes in laws,
regulations, policies, or practices that will prohibit such practice in
China. However, there can be no assurance that such changes in laws,
regulations, policies, or practices will not occur in China in the
future.
Risks
Related to China
China’s
economic policies could affect our business.
Substantially
all of our assets are located in China and substantially all of our revenue is
derived from our operations in China. Accordingly, our results of
operations and prospects are subject, to a significant extent, to the economic,
political, and legal developments in China. While China’s economy has
experienced significant growth in the past 20 years, such growth has been
uneven, both geographically and among various sectors of the economy. The
Chinese government has implemented various measures to encourage
economic growth and guide the allocation of resources. Some of these
measures benefit the overall economy of China, but they may also have a negative
effect on us. For example, operating results and financial condition may be
adversely affected by the government control over capital investments or changes
in tax regulations.
The
economy of China has been changing from a planned economy to a more
market-oriented economy. In recent years the Chinese government
has implemented measures emphasizing the utilization of market forces for
economic reform and the reduction of state ownership of productive assets, and
the establishment of corporate governance in business enterprises; however,
a substantial portion of productive assets in China are still owned by the
Chinese government. In addition, the Chinese government continues to play a
significant role in regulating industry development by imposing industrial
policies. It also exercises significant control over China’s economic
growth through the allocation of resources, the control of payment of
foreign currency- denominated obligations, the setting of monetary policy,
and the provision of preferential treatment to particular industries or
companies.
Capital
outflow policies in China may hamper our ability to remit income to the United
States.
China has
adopted currency and capital transfer regulations. These regulations may require
us to comply with complex regulations for the movement of capital. Although
our directors believe that it is currently in compliance with these regulations,
should these regulations or the interpretation of them by courts
or regulatory agencies change; we may not be able to remit all income
earned and proceeds received in connection with our operations or from the sale
of our operating subsidiaries to our stockholders.
In
addition, there can be no assurance that we will be able to obtain sufficient
foreign exchange to pay dividends or satisfy other foreign exchange
requirements in the future.
It may be
difficult to effect service of process and enforcement of legal judgments upon
our company and our officers and directors because some of them
reside outside the United States.
As our
operations are presently based in China and some of our key directors and
officers reside outside the United States, service of process on our key
directors and officers may be difficult to effect within the United States.
Also, substantially all of our assets are located outside the United States and
any judgment obtained in the United States against us may not be
enforceable outside the United States. We have appointed Lu Pingji, our Chairman
of the Board of Directors, as our agent to receive service of process in any
action against our company in the United States. If relations between the
United States and China worsen, our stock price may decrease, and we may have
difficulty accessing the U.S. capital markets.
At
various times during recent years, the United States and China have had
disagreements over political and economic issues. Controversies may arise in
the future between these two countries. Any political or trade
controversies between the United States and China could adversely affect the
market price of our common stock and our ability to access U.S. capital
markets.
- 22
-
We may
face obstacles from the communist system in China.
Foreign
companies conducting operations in China face significant political,
economic, and legal risks. The political system in China, including a
cumbersome bureaucracy, may hinder Western investment. We may have difficulty
establishing adequate management, legal, and financial controls in China.
China historically has not adopted a Western style of management and financial
reporting concepts and practices, modern banking, computer, or other
control systems. We may have difficulty in hiring and retaining a sufficient
number of qualified employees to work in China. As a result of these
factors, we may experience difficulty in establishing management, legal, and
financial controls, collecting financial data and preparing financial
statements, books of account and corporate records, and instituting business
practices that meet Western standards.
It will
be extremely difficult to acquire jurisdiction and enforce liabilities against
our officers, directors, and assets based in China. Because the Company’s
executive officers and directors, including, the chairman of its board of
directors, are Chinese citizens, it may be difficult, if not impossible, to
acquire jurisdiction over these persons in the event a lawsuit is initiated
against us and or our officers and directors by a stockholder or group
of stockholders in the United States. Also, because the majority of our
assets are located in China, it would also be extremely difficult to access
those assets to satisfy an award entered against it in a United States
court.
We may
face judicial corruption in the People’s Republic of China.
Another
obstacle to foreign investment in the People’s Republic of China is corruption.
There is no assurance that we will be able to obtain recourse, if
desired, through the People’s Republic of China’s poorly developed and
sometimes corrupt judicial systems.
Risks
Related to Our Common Stock
Our
common stock is currently traded on the NASDAQ Capital Market. The market price
of our common stock could fluctuate substantially due to a variety
of factors, including market perception of our ability to achieve our
planned growth, quarterly operating results of competitors, trading volume in
our common stock, changes in general conditions in the economy, and
the financial markets or other developments affecting our competitors or us. In
addition, the stock market is subject to extreme price and volume
fluctuations. This volatility has had a significant effect on the market price
of securities issued by many companies for reasons unrelated to their
operating performance and could have the same effect on our common
stock.
Our
principal stockholders and current executive officers and directors own a
significant percentage of our company and will be able to exercise significant
influence over our company. Our executive officers and directors and
principal stockholders together will beneficially own a majority of the
total voting power of our outstanding voting capital stock. These
stockholders will be able to determine the composition of our Board of
Directors, will retain the voting power to approve all matters requiring
stockholder approval, and will continue to have significant influence over
our affairs. This concentration of ownership could have the effect of
delaying or preventing a change in our control or otherwise discouraging a
potential acquirer from attempting to obtain control of us, which in turn could
have a material and adverse effect on the market price of the common stock
or prevent our stockholders from realizing a premium over the market prices for
their shares of common stock. See “Principal Stockholders” for
information about the ownership of common by our executive officers,
directors, and principal stockholders.
We do not
anticipate paying dividends on the Common Stock.
We have
never paid dividends on our common stock and do not anticipate paying dividends
in the foreseeable future. Our directors intend to follow a policy
of retaining all of our earnings, if any, to finance the development and
expansion of our business.
Our
common stock could be considered to be a “penny stock.”
Our
common stock could be considered to be a “penny stock” if it meets one or more
of the definitions in Rules 15g-2 through 15g-6 promulgated under
Section 15(g) of the Securities Exchange Act of 1934, as amended. These
include but are not limited to the following: (i) the stock trades at a price
less than $5.00 per share; (ii) it is NOT traded on a “recognized” national
exchange; (iii) it is NOT quoted on The Nasdaq Stock Market, or even if so,
has a price less than $5.00 per share; or (iv) is issued by a company with
net tangible assets less than $2.0 million, if in business more than a
continuous three years, or with average revenues of less than $6.0 million
for the past three years. The principal result or effect of being designated a
“penny stock” is that securities broker-dealers cannot recommend the stock
but must trade in it on an unsolicited basis.
- 23
-
Broker-dealer
requirements may affect trading and liquidity.
Section
15(g) of the Securities Exchange Act of 1934, as amended, and Rule 15g-2
promulgated there under by the SEC require broker-dealers dealing in
penny stocks to provide potential investors with a document disclosing the
risks of penny stocks and to obtain a manually signed and dated written receipt
of the document before effecting any transaction in a penny stock for the
investor’s account.
Potential
investors in our common stock are urged to obtain and read such disclosure
carefully before purchasing any shares that are deemed to be “penny
stock.” Moreover, Rule 15g-9 requires broker-dealers in penny stocks to
approve the account of any investor for transactions in such stocks before
selling any penny stock to that investor. This procedure requires the
broker-dealer to (i) obtain from the investor information concerning his or her
financial situation, investment experience, and investment objectives; (ii)
reasonably determine, based on that information, that transactions in penny
stocks are suitable for the investor and that the investor has sufficient
knowledge and experience as to be reasonably capable of evaluating the risks of
penny stock transactions; (iii) provide the investor with a written
statement setting forth the basis on which the broker-dealer made the
determination in (ii) above; and (iv) receive a signed and dated copy of
such statement from the investor, confirming that it accurately reflects
the investor’s financial situation, investment experience, and investment
objectives. Compliance with these requirements may make it more difficult
for holders of our common stock to resell their shares to third parties or to
otherwise dispose of them in the market or otherwise.
Shares
eligible for future sale may adversely affect the market price of our common
stock, as the future sale of a substantial amount of our restricted stock in
the public marketplace could reduce the price of our common
stock.
From time
to time, certain of our stockholders may be eligible to sell all or some of
their shares of common stock by means of ordinary brokerage transactions
in the open market pursuant to Rule 144, promulgated under the Securities
Act (Rule 144), subject to certain limitations. In general, pursuant to Rule
144, a stockholder (or stockholders whose shares are aggregated) who has
satisfied a one-year holding period may, under certain circumstances, sell
within any three-month period a number of securities which does not exceed
the greater of 1 percent of the then outstanding shares of common stock or the
average weekly trading volume of the class during the four calendar weeks
prior to such sale. Rule 144 also permits, under certain circumstances, the sale
of securities, without any limitations, by a non-affiliate of our company
that has satisfied a two-year holding period. Any substantial sale of common
stock pursuant to Rule 144 or pursuant to any resale prospectus may have an
adverse effect on the market price of our securities.
ITEM
2. PROPERTIES
Our
principal executive offices are located at 6 Youyi Dong Lu, Han Yuan 4 Lou,
Xi’an, Shaanxi Province, China 710054. This office consists of approximately
2,608.06 square meters which we own.
Our
properties are located in Xi’an, Shaanxi province in China.
|
Name of project
|
Geographic
location
|
Subsistence
area
(square
meter)
|
||||
|
Tsining
JunJing I
|
North
Jinhua Road Xi'an City
|
29,929
|
||||
|
Tsining-24G
|
East
Erhuan of Xi'an City
|
8,999
|
||||
|
Tsining
JunJing II Phase one
|
Dongzhan
Road of Xi'an City
|
136,012
|
||||
|
Tsining
JunJing II Phase two
|
Dongzhan
Road of Xi'an City
|
112,556
|
||||
|
Yijing
Yuan (Land)
|
South
Erhuan of Xi'an City
|
60,666
|
||||
|
Other
Projects
|
4,218
|
|||||
|
Total
|
352,380
|
|||||
|
(1)
|
The
Company started the JunJing II phase one in the third quarter of 2007 and
expects to complete it in the third quarter 2009. Total GFA will be
136,012 square meters. As of December 31, 2008, we have sold 57,098 square
meters, with 78,914 square meters remaining to be
sold.
|
|
(2)
|
The
Company is planning to start the JunJing II phase two in the second
quarter of 2009 and expects to complete it in the second quarter of 2010
with total GFA of 112,556 square
meters.
|
- 24
-
ITEM
3. LEGAL PROCEEDINGS
From time
to time, we may become involved in various lawsuits and legal proceedings, which
arise in the ordinary course of business. However, litigation is subject to
inherent uncertainties, and an adverse result in these or other matters may
arise from time to time that may harm business. We are currently not aware of
any such legal proceedings or claims that will have, individually or in the
aggregate, a material adverse affect on business, financial condition or
operating results.
ITEM
4. SUBMISSION OF MATTERS TO VOTE OF SECURITY HOLDERS
None.
PART
II
ITEM
5. MARKET FOR REGISTRANT’S COMMON EQUITY AND RELATED STOCKHOLDER
MATTERS
Our
common stock is traded on NASDAQ under the symbol CHLN. The following table
shows, for the periods indicated, the high and low trading prices for our common
stock as reported by the National Quotation Bureau, Inc., from the second
quarter of 2006 through May 15, 2008 when our stock traded on the OTC Bulletin
Board, and as reported by NASDAQ from May 16, 2008 onward.
|
High &
Low Stock
Price
|
1st
Quarter
|
2nd
Quarter
|
3rd
Quarter
|
4th
Quarter
|
||||||||||||
|
2008
|
||||||||||||||||
|
High
|
6.10
|
5.65
|
4.25
|
2.33
|
||||||||||||
|
Low
|
3.30
|
3.80
|
1.85
|
0.75
|
||||||||||||
|
2007
|
||||||||||||||||
|
High
|
3.85
|
5.20
|
5.00
|
8.20
|
||||||||||||
|
Low
|
2.00
|
3.15
|
3.20
|
4.25
|
||||||||||||
|
2006
|
||||||||||||||||
|
High
|
N/A
|
4.25
|
3.75
|
3.10
|
||||||||||||
|
Low
|
N/A
|
3.50
|
1.70
|
1.55
|
||||||||||||
On
September 3, 2009, the closing price of our common stock was $3.81.
As of
December 31, 2008, there were approximately 154 shareholders of record of
our common stock, excluding shareholders who have their shares held in street
name (by their stock brokerage firms).
RECENT
SALES OF UNREGISTERED SECURITIES.
Private
Placement on January 28, 2008
On
January 28, 2008, China Housing & Land Development, Inc., (Company) entered
into a Securities Purchase Agreement (Purchase Agreement) with certain investors
(Investors). Pursuant to the Agreement, the Company agreed to sell to Investors
5.0% Senior Secured Convertible Debt, which are convertible into shares of the
Company’s Common Stock, for an aggregate purchase price of US$ 20,000,000
and to receive, in consideration for such purchase, Warrants to acquire
additional shares of Common Stock.
The 5%
Senior Secured Convertible Debt (Convertible Debt) shall bear interest at a rate
of 5% per annum (computed based on the actual days elapsed in a period of 360
days) of the RMB Notional Principal Amount, payable quarterly in arrears in
lawful money of the United States (U.S. Dollars) on the first business day of
each calendar quarter and on the Maturity Date, in each case in an amount
equal to the amount of such interest as expressed in RMB multiplied by the
US$-RMB Exchange Rate as of the applicable Interest Exchange Rate Determination
Date. The Notes are secured by a first priority, perfected security interest in
certain shares of Common Stock of Lu Pingji, as evidenced by the pledge
agreement. The Notes are subject to events of default customary for convertible
securities and for a secured financing.
The
Company’s 5.0% Senior Secured Convertible Debt were purchased by the following
investors: Whitebox Intermarket Partners, LP, Whitebox Convertible Arbitrage
Partners, LP, Whitebox Hedged High Yield Partners, LP, Whitebox Special
Opportunities Fund Series B Partners, LP, Pope Investments II, LLC, Berlin
Income, L.P., Berlin Capital growth, L.P., Thomas G. Berlin, and Eastern
Management & Financial, LLC. The shares of Common Stock covered by warrants
were 1,437,467 in total. The securities were being offered and sold in
reliance upon the exemptions from securities registration afforded by Section
4(2) of the Securities Act and Rule 506 under Regulation D. All securities were
sold to accredited investors and the Company did not use general solicitation or
advertising to market the securities. Capitalized terms used herein and not
otherwise defined have the meanings set forth in the Purchase
Agreement.
- 25
-
The
Warrants grant the Investors the right to acquire shares of Common Stock at
$6.07 per share of Common Stock, subject to customary anti-dilution adjustments.
The Warrants may be exercised to purchase Common Stock at any time after January
28, 2008 to and including February 28, 2013, the expiration date of the
Warrants.
In
connection with this transaction, the Company and the Investors entered into a
Registration Rights Agreement (Registration Rights Agreement). Pursuant to the
terms and conditions of the Registration Rights Agreement, the Company has
agreed to register within 60 calendar days after closing shares of Common Stock
issuable to the Investors for resale on a Form S-3 Registration Statement to be
effective by 90 calendar days or 120 days if the registration statement is
subject to a full review by the U.S. Securities and Exchange Commission.
The Company shall register an amount of Common Stock for resale that equals at
least 120% of the sum of shares issuable upon conversion of the Notes, the
exercise of the Warrants and the payment of interest accrued on the Notes. The
registration rights granted under the Registration Rights Agreement are subject
to customary exceptions and qualifications and compliance with certain
registration procedures.
SUBSEQUENT
DEVELOPMENTS
On
January 21, 2009, the Company completed the acquisition of Xi’an Xinxing
Property Management Co., Ltd., (“Xinxing”). Xinxing was privately owned and
provides property management services to most of China Housing’s past
residential and commercial projects, as well as to other prominent customers
like the Xi’an branch office building of the People’s Bank of China, China Xi’an
Electric Group headquarters, Shaanxi Bureau of State Taxation offices, and the
Xi’an University of International Studies, to name a few. Xinxing’s current
service area totals 1.67 million square meters in 43 facilities that
include residential, commercial, and school buildings and parks. Xinxing’s
revenues in 2008 were RMB 15.42 million, net income was RMB 1.82 million, and
assets at yearend 2008 totaled RMB 11.29 million. Total consideration for the
acquisition will be 12 million RMB.
ITEM
6. SELECTED FINANCIAL DATA
|
Summary
of operations
(US$
in thousands, except per share amounts)
|
||||||||||||
|
As
of December 31
|
||||||||||||
|
2008
|
2007
|
2006
|
||||||||||
|
Total
revenue
|
$
|
26,466
|
$
|
73,913
|
$
|
54,099
|
||||||
|
Cost
of sales
|
21,473
|
43,222
|
36,750
|
|||||||||
|
Selling,
general, and administrative expenses
|
8,498
|
2,919
|
3,197
|
|||||||||
|
Stock-based
compensation
|
3,079
|
-
|
-
|
|||||||||
|
Other
expenses
|
296
|
57
|
301
|
|||||||||
|
Income
(loss) from operations
|
(6,880)
|
27,715
|
13,851
|
|||||||||
|
Net
income
|
$
|
8,942
|
$
|
16,686
|
$
|
9,051
|
||||||
|
Net
income per common share - Basic
|
0.29
|
0.62
|
0.45
|
|||||||||
|
Net
income per common share - Diluted
|
0.28
|
0.62
|
0.45
|
|||||||||
|
Financial
data
(in
thousands)
|
||||||||
|
As
of December 31
|
||||||||
|
2008
|
2007
|
|||||||
|
Total
assets
|
$ | 222,355 | $ | 155,707 | ||||
|
Total
shareholders’ equity
|
84,012 | 66,178 | ||||||
|
Basic
weighted average shares outstanding
|
30,516 | 26,817 | ||||||
|
Diluted
weighted average shares
|
30,527 | 26,817 | ||||||
- 26
-
ITEM
7. MANAGEMENT’S DISCUSSION AND ANALYSIS OF FINANCIAL CONDITION AND RESULTS OF
OPERATIONS
FORWARD-LOOKING
STATEMENTS
Some of
the statements contained in this Form 10-K that are not historical facts are
“forward-looking statements” that can be identified by the use of terminology
such as estimates, projects, plans, believes, expects, anticipates, intends, or
the negative or other variations of those words, or by discussions of strategy
that involve risks and uncertainties. We urge you to be cautious of the
forward-looking statements, that such statements, which are contained in this
Form 10-K, reflect our current beliefs with respect to future events and involve
known and unknown risks, uncertainties and other factors affecting our
operations, market growth, services, products, and licenses. No assurances can
be given regarding the achievement of future results, as actual results may
differ materially as a result of the risks we face, and actual events may differ
from the assumptions underlying the statements that have been made regarding
anticipated events. Factors that may cause actual results, our performance or
achievements, or industry results, to differ materially from those contemplated
by such forward-looking statements include without limitation: our ability to
attract and retain management, and to integrate and maintain technical
information and management information systems; our ability to raise capital
when needed and on acceptable terms and conditions; the intensity of
competition; and general economic conditions. All written and oral
forward-looking statements made in connection with this Form 10-K that are
attributable to us or persons acting on our behalf are expressly qualified in
their entirety by these cautionary statements. Given the uncertainties that
surround such statements, you are cautioned not to place undue reliance on
such forward-looking statements.
GENERAL
China
Housing & Land Development, Inc., is a leading developer of residential and
commercial properties in northwest China. The Company is based in Xi’an, the
capital city of China’s Shaanxi province. Since 1992, China Housing has been
engaged in the acquisition, development, management, and sales of residential
and commercial real estate properties and land through its subsidiaries in
China. China Housing & Land Development is the first and only Chinese real
estate development company traded on NASDAQ.
Critical
Accounting Policies and Estimates
We
prepare our consolidated financial statements in accordance with U.S. GAAP,
which requires us to make judgments, estimates and assumptions that affect (i)
the reported amounts of our assets and liabilities, (ii) the disclosure of our
contingent assets and liabilities at the end of each reporting period and
(iii) the reported amounts of revenues and expenses during each reporting
period. We continually evaluate these estimates based on our own experience,
knowledge and assessment of current business and other conditions, our
expectations regarding the future based on available information and
reasonable assumptions, which together form our basis for making judgments about
matters that are inherently uncertain. Since the use of estimates is an integral
component of the financial reporting process, our actual results could differ
from those estimates. Some of our accounting policies require a higher degree of
judgment than others in their application.
When
reading our financial statements, you should consider (i) our selection of
critical accounting policies, (ii) the judgment and other uncertainties
affecting the application of such policies and (iii) the sensitivity of reported
results to changes in conditions and assumptions. We believe the following
accounting policies involve the most significant judgments and estimates used in
the preparation of our financial statements.
Restatement
of Financial Statements
On
October 21, 2009, we determined that the Company will restate its financial
statements for the year ended December 31, 2008 as reported on Form 10-K filed
March 25, 2009, as amended. Pursuant to a registration rights agreement entered
into in connection with the Company’s issuance of its 5.0% Senior Secured
Convertible Debt, the Company is required to pay the investors of the debt
certain late registration payments (“Late Payments”) if the Company failed to
file a registration statement within 60 days after the closing date of the
transaction or if such registration statement failed to become effective by 90
calendar days, or 120 days if the registration statement is subject to a full
review by the U.S. Securities and Exchange Commission. The Company commenced
negotiations with the investors of the 5.0% Senior Secured Convertible Debt to
waive the Late Payments in December 2008. The investors of the 5.0% Senior
Secured Convertible Debt have thereafter decided to claim the Late Payments.
Because the Company failed to accrue the Late Payments, the Company has decided
to restate its financial statements for the year ended December 31, 2008 as
reported on Form 10-K to accrue the corresponding expenses. Prior to the
restatement, the Company did not accrue the Late Payments. After the
restatement, the Company will present the Late Payments as security registration
expense.
Warrants
and derivative liability
As of
December 31, 2008, the Company has approximately $1.1 million of warrants
liability and $0.8 million of fair value of embedded derivatives on the balance
sheet, which is approximately 1.0% and 0.7% of the total liabilities,
respectively.
We are
using the Cox-Rubinstein-Ross (“CRR”) Binomial Lattice Model to estimate the
fair values of warrants liability and embedded derivatives. The CRR
model depends on the following assumptions: the Company’s common stock
price underlying the warrants; strike price; conversion price; expected life;
expected volatility; risk free interest rate; and dividend rate. We used the CRR
Binomial Lattice Model for the past 3 years and we do not expect any significant
changes to assumptions except for the common share price and the expected
volatility.
- 27
-
We
estimate the fair value of warrant liability and embedded derivatives every
quarter and recognize the change of fair value as gain or loss in our current
quarter consolidated statement of income. The fair values of warrants liability
and embedded derivatives have changed during the past few years according to the
valuation models and the fair values are positively related to the market share
price movement and the volatility.
The
following table summarizes the fair value of warrant liability and embedded
derivative as at various periods.
|
(in
millions)
|
2008
|
|||||||
|
3rd Quarter
|
4th Quarter
|
|||||||
|
Warrants
Liability
|
$
|
2.2
|
$
|
1.1
|
||||
|
Fair
value of embedded derivatives
|
$
|
1.4
|
$
|
0.8
|
||||
Real
estate held for development or sale, intangible asset and deposits on land use
rights
As of
October 27, 2009, our market capitalization is approximately
$115million.
We
evaluate the recoverability of our real estate developments taking into account
several factors including, but not limited to, our plans for future operations,
prevailing market prices for similar properties and projected cash
flows.
We review
real estate projects, whenever events or changes in circumstances indicate that
the carrying amount of an asset may no longer be recoverable. When these events
occur, we measure impairment by comparing the carrying value to the estimated
undiscounted future cash flows expected as a result from the use of the assets
and their eventual disposition. If the total of the expected undiscounted cash
flow is less than the carrying amount of the assets, we would recognize an
impairment loss based on the fair value of the assets.
Our
significant judgments and estimates related to impairment include our
determination if an event has occurred to warrant an impairment test. If a test
is required, other significant judgments and estimates will include our
expectations of future cash flows and the calculation of the fair value of the
impaired assets.
When real
estate costs are determined to be impaired, they are written down to their
estimated net realizable value. The Company evaluates the carrying value for
impairment based on the undiscounted future cash flows of the assets.
Write-downs of real estate costs deemed impaired would be recorded as
adjustments to the cost basis. There has been no impairment on the real estate
inventories and no impairment loss has been recorded for the year ended December
31, 2008 and 2007.
The
following summarizes the components of real estate inventories as at December
31, 2008 and 2007.
|
2008
|
2007
|
|||||||
|
Finished
projects
|
$
|
10,181,827
|
$
|
16,130,130
|
||||
|
Construction
in progress
|
50,468,184
|
24,856,801
|
||||||
|
Total
real estate held for development or sale
|
$
|
60,650,011
|
$
|
40,986,931
|
||||
Intangible
asset
The
Company’s intangible asset is related to the exclusive rights to develop 487
acres land in the Baqiao area that the Company acquired during 2007. We assessed
the fair value of this intangible asset based on the current-period operating
cash flow and a projection of future cash flows. It is the Company’s
understanding that the cooperation agreement with Baqiao District Government
will be extended after June 2011. Based on the prevailing market condition in
Xi’an city we concluded that there is no impairment.
As of
December 31, 2008 and 2007, intangible asset consists of the
following:
|
2008
|
2007
|
|||||||
|
Intangible
acquired
|
$
|
47,334,342
|
$
|
49,412,847
|
||||
|
Accumulated
amortization
|
(1,290,682
|
)
|
(1,207,150
|
)
|
||||
|
Intangible
assets, net
|
$
|
46,043,660
|
$
|
48,205,697
|
||||
According
to the agreement with Baqiao District Government, at the beginning of each year,
the Company will prepare the annual work plan and have it approved by Baqiao
District Government. The annual work plan will include the detailed projects
that will be started during that year and the Baqiao District Government is
responsible for the land clearance. Due to the delay of land clearance progress,
some scheduled projects have been postponed. The Baqiao District Government
acknowledged the delay and informed us their intention to extend the agreement.
Currently, we still have 348 acres land undeveloped, and $46 million
intangible assets. If we are not able to achieve the extension of the agreement
with Baqiao District Government, we will have to write off the intangible assets
from our balance sheet, which will affect our income statement in
2011.
- 28
-
As of
December 31, 2008, the amount recorded for its intangible assets were
$46,043,660 (December 31, 2007 - $48,205,697). The Company evaluates its
intangible assets for impairment whenever events or changes in circumstances
indicate the carrying value may not be recoverable. Based on the estimated
future cash flows, the Company records a write-down for impairment, if
appropriate. For the year ended December 31, 2008, the Company has recorded $0
(2007 - $1,157,758) of amortization on the intangible asset.
The
Company amortized the intangible asset based on the percentage of the profit
margin realized over the total expected profit margin to be realized from 487
acre land in the Baqiao project. During fiscal 2007, the Company sold 18.5 acre
land and the related profit margin realized on that sale represents 2.4% of
total estimated profit margin on the whole 487 acre project, therefore the
Company amortized $1,157,758 (2.4% ) of total intangible asset during fiscal
2007. This method is intended to match the pattern of amortization with the
income-generating capacity of the intangible asset. For the year ended December
31, 2008, the Company has recorded $0 (2007 -$1,157,758) of amortization on the
intangible asset. The amortization expense was capitalized in the real estate
construction in progress.
Management
re-evaluated the expected profit margin from the 487 acre land as at December
31, 2008 and recalculated the intangible amortization related to the 2008 land
sales based on the new estimate. As a result, management found the difference
resulting from change of estimate was not material. Therefore there was no
adjustment made in the year ended December 31, 2008 due to the change of
accounting estimate of total profit margin in 487 acres land.
The
Company evaluates its intangible assets for impairment whenever events or
changes in circumstances indicate the carrying value may not be recoverable.
Based on the estimated future cash flows, the Company records a write-down for
impairments, if appropriate. For the year ended December 31, 2008, the
Company has recorded $0 (2007 $0) of impairment on the intangible
asset.
Deposits
on land use rights
|
2008
|
2007
|
|||||||
|
Deposits
on land use rights
|
47,333,287
|
29,694,103
|
||||||
We
conduct regular reviews of our deposits on land use rights. After our year
end review and assessment, we concluded that there was no significant
decrease in the market price and therefore impairment write down was not
required. The average sale price in Xi’an city was stable during 2008 and
according to the Xi’an Bureau of Statistics’ data, the average sale price
increased to 4,455RMB per square meter (approxmately US$650 per
square meter), and representing about 18% year-on-year growth.
Material
trends and uncertainties that may impact our continuing operations
Changes
in national and regional economic conditions, as well as local economic
conditions where we conduct our operations and where prospective purchasers of
our homes live, may result in more caution on the part of homebuyers and
consequently fewer home purchases. According to the data from Xi’an Bureau of
Statistics, Xi’an city’s real estate transaction volume (in terms of sq. meter
signed) decreased about 30% in 2008 compared to 2007. As currently all our
projects are in Xi’an city, the downturn of the real estate market in Xi’an
caused the decline of our operating revenues in 2008. Since 2009, we see the
market sentiment has improved and the transaction volume has increased compared
to same period of 2008. During the second quarter of 2009, our revenue
increased approximately 70.7% over same period 2008.
Virtually
all purchasers of our homes finance their acquisitions through lenders providing
mortgage financing. A substantial increase in mortgage interest rates or
unavailability of mortgage financing would adversely affect the ability of
prospective homebuyers to obtain the financing they would need in order to
purchase our homes, as well as adversely affect the ability of prospective
move-up homebuyers to sell their current homes. For example, if mortgage
financing became less available, demand for our homes could decline. A reduction
in demand could also have an adverse effect on the pricing of our homes because
we and our competitors may reduce prices in an effort to better compete for home
buyers. A reduction in pricing could result in a decline in revenues and in our
margins. We do not expect any substantial change of current mortgage policy and
the prevailing mortgage rate in the near future.
The real
estate development industry is capital intensive, and development requires
significant up-front expenditures to acquire land and begin development.
Accordingly, we incur substantial indebtedness to finance our homebuilding and
land development activities. Although we believe that internally generated funds
and current borrowing capacity will be sufficient to fund our capital and other
expenditures (including land acquisition, development and construction
activities), the amounts available from such sources may not be adequate to meet
our needs. If such sources are not sufficient, we would seek additional capital
in the form of debt or equity financing from a variety of potential sources,
including bank financing and/or securities offerings. The availability of
borrowed funds, to be utilized for land acquisition, development and
construction, may be greatly reduced, and the lending community may require
increased amounts of equity to be invested in a project by borrowers in
connection with new loans. Failure to obtain sufficient capital to fund its
planned capital and other expenditures could have a material adverse effect on
our business.
- 29
-
In
addition, regulatory requirements could cause us to incur significant
liabilities and operating expenses and could restrict our business activities.
We are subject to statutes and rules regulating, among other things, certain
developmental matters, building and site design, and matters concerning the
protection of health and the environment. Our operating expenses may be
increased by governmental regulations such as building permit allocation
ordinances and impact and other fees and taxes, which may be imposed to defray
the cost of providing certain governmental services and improvements. Any delay
or refusal from government agencies to grant us necessary licenses, permits and
approvals could have an adverse effect on our operations.
As of
December 31, 2008, we had $38,230,352 of cash and cash equivalents,
an increase of $35,777,986, compared with $2,452,366 of cash and cash
equivalents as of December 31, 2007.
The
Company believes that the combination of present capital resources, internally
generated funds, and unused financing sources are more than adequate to meet
cash requirements for the year 2009. We intend to meet our liquidity
requirements, including capital expenditures related to the purchase of land for
the development of our future projects, through cash flow provided by operations
and additional funds raised by future financings. Upon acquiring land for future
development, we intend to raise funds to develop our projects by obtaining
mortgage financing mainly from local banking institutions with which we have
done business in the past. We believe that our relationships with these banks
are in good standing and that our real estate will secure the loans needed. We
believe that adequate cash flow will be available to fund our
operations.
CONSOLIDATED
OPERATING RESULTS
Comparison
of years 2008, 2007, and 2006
Revenues
Our
revenues from sales of properties are mainly derived from the sale of
residential and commercial units and buildings, infrastructure work we perform
for the local government, and land development projects in the Baqiao
area.
In 2008,
most of our revenues came from Tsining JunJing II phase one, which consists of
13 residential buildings and 3 auxiliary buildings, including one kindergarten,
with a gross floor area of about 136,012 square meters. This project is
currently under construction and collecting funds under pre-sales
agreements.
Effective
January 1, 2008, the company adopted the percentage of completion method of
accounting for revenue recognition for all building construction projects in
progress, which currently includes project Tsining JunJing II. The full accrual
method was used before that date for all our residential, commercial, and
infrastructure projects. Infrastructure projects continue to be accounted for
using the full accrual method of accounting.
|
Revenues
by project:
|
2008
|
2007
|
2006
|
|||||||||
|
US$
|
||||||||||||
|
Project
Under Construction
|
||||||||||||
|
Tsining
JunJing II Phase one
|
$
|
23,776,789
|
$
|
-
|
$
|
-
|
||||||
|
Projects
Completed
|
||||||||||||
|
Tsining
JunJing I
|
264,066
|
8,964,784
|
39,670,186
|
|||||||||
|
Tsining-24G
|
27,243
|
25,198,129
|
13,000,694
|
|||||||||
|
Tsining
Gangwan
|
58,427
|
2,368,602
|
318,338
|
|||||||||
|
Tsining
Hanyuan
|
13,894
|
3,100
|
161,274
|
|||||||||
|
Tsining
Home In
|
121,076
|
323,751
|
-
|
|||||||||
|
Tsining
Mingyuan
|
44,567
|
247,298
|
352,199
|
|||||||||
|
Lidu
Mingyuan
|
-
|
303,124
|
144,483
|
|||||||||
|
Infrastructure
Project
|
||||||||||||
|
Baqiao
infrastructure construction
|
-
|
10,790,610
|
-
|
|||||||||
|
Project
In Process
|
||||||||||||
|
Baqiao
|
-
|
24,405,717
|
-
|
|||||||||
|
Revenues
from the sales of properties
|
$
|
24,306,062
|
$
|
73,579,325
|
$
|
53,647,174
|
||||||
- 30
-
The
revenues from the sale of properties in the 2008 decreased 67.0% to $24,306,062
from $73,579,325 in 2007. The decrease was primarily due to the absence of a
land sale in 2007, and the completion of several projects in 2007. Revenues in
2007 increased 37.2% from 2006.
The
revenue from our project under construction and completed projects totaled
$24,306,062 in 2008 compared with $38,382,998 in 2007. The 36.7% decrease was
due mainly to the absence of 2007 revenues from Tsining-24G and JunJing I
because both projects had come to completion and most of the revenues for those
two projects were recognized at one moment using the full accrual method of
accounting, partly offset in 2008 by revenues we recognized from Tsining JunJing
II phase one using the percentage of completion method of accounting and by the
2008 sales of some units in completed projects.
Our
infrastructure project in the Baqiao area generated $1,433,837 in revenues and
was booked under other revenue in 2008, which consisted of the government’s
allowance for the equivalent cost of interest on the company’s investments
required to support the infrastructure construction, plus continued river
management and suburban planning for the entire Baqiao high-technology
industrial park. In 2007 we acquired the Baqiao infrastructure project and
constructed and delivered a river dam to the local government during the year,
for which we recognized $10,790,610 in revenues in 2007. In 2008, we were
awarded another dam project on the same river but have not recognized revenues
from it under full accrual method of accounting because the project is still in
progress. We expect to finish the river dam in second quarter 2009 and recognize
the revenues when the project is delivered to the local government.
Our
project in process is the Baqiao project where we have the exclusive right to
develop 487 acres. We acquired the development rights in 2007 and recognized
$24,405,717 in revenue in 2007 as a result of a land 18.4 acre land sale to an
unrelated developer, we established a joint venture with Prax Capital Real
Estate Holdings Limited (Prax Capital) to co-develop 79 acres within the Baqiao
project. Prax Capital invested $29.3 million cash in the joint venture. Under
Generally Accepted Accounting Principles, we did not recognize any revenue from
the creation of this development project in 2008. About 390 acres remain
available for development in the Baqiao project.
|
Revenues
by project:
|
2008
|
2007
|
2006
|
|||||||||
|
US$
|
||||||||||||
|
Project
Under Construction
|
||||||||||||
|
Tsining
JunJing II Phase Two contract sales
|
||||||||||||
|
Revenue
|
||||||||||||
|
Total
gross floor area (GFA) available for sale
|
||||||||||||
|
GFA
sold during the period
|
||||||||||||
|
Remaining
GFA available for sale
|
||||||||||||
|
Percentage
of completion
|
||||||||||||
|
Percentage
GFA sold during the period
|
||||||||||||
|
Percentage
GFA sold to date
|
||||||||||||
|
Average
sales price per GFA
|
||||||||||||
|
Tsining
JunJing II Phase one contract sales
|
33,166,864 | |||||||||||
|
Revenue
|
$ | 23,776,789 | ||||||||||
|
Total
gross floor area (GFA) available for sale
|
136,012 | |||||||||||
|
GFA
sold during the period
|
57,006 | |||||||||||
|
Remaining
GFA available for sale
|
79,006 | |||||||||||
|
Percentage
of completion
|
65.95 | % | ||||||||||
|
Percentage
GFA sold during the period
|
41.91 | % | ||||||||||
|
Percentage
GFA sold to date
|
41.91 | % | ||||||||||
|
Average
sales price per GFA
|
582 | |||||||||||
|
Projects
Completed
|
||||||||||||
|
Tsining
JunJing I
|
$ | 264,066 | $ | 8,964,784 | $ | 39,670,186 | ||||||
|
Total
gross floor area (GFA) available for sale
|
167,931 | 167,931 | 167,931 | |||||||||
|
GFA
sold during the period
|
6,969 | 9,135 | 35,769 | |||||||||
|
Remaining
GFA available for sale
|
# | 9,505 | 16,474 | 25,610 | ||||||||
|
Percentage
of completion
|
100 | % | 100 | % | 100 | % | ||||||
|
Percentage
GFA sold during the period
|
4.15 | % | 5.44 | % | 21.30 | % | ||||||
|
Percentage
GFA sold to date
|
94.34 | % | 90.19 | % | 84.75 | % | ||||||
|
Average
sales price per GFA
|
** | 981 | 1,109 | |||||||||
|
Tsining-24G
|
$ | 27,243 | $ | 25,198,129 | $ | 13,000,694 | ||||||
|
Total
gross floor area (GFA) available for sale
|
43,563 | 43,563 | 43,563 | |||||||||
|
GFA
sold during the period
|
- 381 | 21,359 | 11,583 | |||||||||
|
Remaining
GFA available for sale
|
6,060 | 5,679 | 27,038 | |||||||||
|
Percentage
of completion
|
100 | % | 100 | % | 100 | % | ||||||
|
Percentage
GFA sold during the period
|
-0.88 | % | 49.03 | % | 26.59 | % | ||||||
|
Percentage
GFA sold to date
|
86.09 | % | 86.97 | % | 37.94 | % | ||||||
|
Average
sales price per GFA
|
** | 1,180 | 1,122 | |||||||||
|
Tsining
Gangwan
|
$ | 58,427 | $ | 2,368,602 | $ | 318,338 | ||||||
|
Total
gross floor area (GFA) available for sale
|
41,803 | 41,803 | 41,803 | |||||||||
|
GFA
sold during the period
|
100 | 4,979 | 171 | |||||||||
|
Remaining
GFA available for sale
|
1,384 | 1,484 | 1,927 | |||||||||
|
Percentage
of completion
|
100 | % | 100 | % | 100 | % | ||||||
|
Percentage
GFA sold during the period
|
0.24 | % | 11.91 | % | 0.41 | % | ||||||
|
Percentage
GFA sold to date
|
96.69 | % | 96.45 | % | 84.54 | % | ||||||
|
Average
sales price per GFA
|
582 | 476 | 1,857 | |||||||||
|
Tsining
Hanyuan
|
$ | 13,894 | $ | 3,100 | $ | 161,274 | ||||||
|
Total
gross floor area (GFA) available for sale
|
32,229 | 32,229 | 32,229 | |||||||||
|
GFA
sold during the period
|
48 | N/A | 593 | |||||||||
|
Remaining
GFA available for sale
|
- | 48 | 103 | |||||||||
|
Percentage
of completion
|
100 | % | 100 | % | 100 | % | ||||||
|
Percentage
GFA sold during the period
|
0.15 | % | 0.17 | % | 1.84 | % | ||||||
|
Percentage
GFA sold to date
|
100 | % | 99.85 | % | 99.68 | % | ||||||
|
Average
sales price per GFA
|
287 | N/A | 272 | |||||||||
|
Tsining
Home In
|
$ | 121,076 | $ | 323,751 | $ | 351,815 | ||||||
|
Total
gross floor area (GFA) available for sale
|
30,072 | 30,072 | 30,072 | |||||||||
|
GFA
sold during the period
|
345 | 821 | 845 | |||||||||
|
Remaining
GFA available for sale
|
2,851 | 3,194 | 4,015 | |||||||||
|
Percentage
of completion
|
100 | % | 100 | % | 100 | % | ||||||
|
Percentage
GFA sold during the period
|
1.14 | % | 2.73 | % | 1.97 | % | ||||||
|
Percentage
GFA sold to date
|
90.52 | % | 89.38 | % | 86.65 | % | ||||||
|
Average
sales price per GFA
|
351 | 394 | 416 | |||||||||
|
Tsining
Mingyuan
|
$ | 44,567 | $ | 247,298 | $ | 352,199 | ||||||
|
Total
gross floor area (GFA) available for sale
|
53,055 | 53,055 | 53,055 | |||||||||
|
GFA
sold during the period
|
80 | 297 | 202 | |||||||||
|
Remaining
GFA available for sale
|
- | 80 | 377 | |||||||||
|
Percentage
of completion
|
100 | % | - | - | ||||||||
|
Percentage
GFA sold during the period
|
0.15 | % | 0.56 | % | 0.38 | % | ||||||
|
Percentage
GFA sold to date
|
100 | % | 99.85 | % | 99.29 | % | ||||||
|
Average
sales price per GFA
|
560 | 832 | 1,747 | |||||||||
|
Lidu
Mingyuan
|
$ | - | $ | 303,124 | $ | 144,483 | ||||||
|
Total
gross floor area (GFA) available for sale
|
8,284 | 8,284 | 8,284 | |||||||||
|
GFA
sold during the period
|
- | 92 | - | |||||||||
|
Remaining
GFA available for sale
|
- | - | 92 | |||||||||
|
Percentage
of completion
|
100 | % | 100 | % | 100 | % | ||||||
|
Percentage
GFA sold during the period
|
0 | % | 1.11 | % | 0 | % | ||||||
|
Percentage
GFA sold to date
|
100 | % | 100 | % | 98.89 | % | ||||||
|
Average
sales price per GFA
|
N/A | 3,297 | N/A | |||||||||
|
Infrastructure
Project
|
||||||||||||
|
Baqiao
infrastructure construction
|
$ | - | $ | 10,790,610 | $ | - | ||||||
|
Project
In Process
|
||||||||||||
|
Baqiao
|
$ | - | $ | 24,405,717 | $ | - | ||||||
|
Revenues
from the sales of properties
|
$ | 24,306,062 | $ | 73,579,325 | $ | 53,647,174 | ||||||
* The
figure is unavailable as percentage of completion is calculated by buildings,
and each building has different percentage of completion.
** The
figure is unavailable due to return of units during this period.
Revenues
from projects under construction
Tsining
JunJing II Phase one
Tsining
JunJing II Phase one was our major revenue generating construction project in
2008, contributing $23,776,789 in revenues. We began construction in 2007
however; as a result of utilizing the percentage of completion method of
accounting, we did not begin to realize revenues from our pre-sales until we met
certain construction milestones in the second quarter of 2008. By the
end of 2008, we had pre-sold about 564 units in the project.
JunJing
II phase one consists of 13 middle-rise and high-rise residential buildings and
3 auxiliary buildings, including a kindergarten, with a gross floor area of
about 136,012 square meters. Estimated total revenues from phase one are about
$101.6 million. The company expects to complete the construction of phase one in
the third quarter of 2009.
Phase two
of JunJing II consists of 12 middle-rise and high-rise buildings and is expected
to start construction during the second quarter of 2009 and should begin
contributing revenue from third quarter of 2009 or the first quarter of 2010.
The total revenues from phase two are expected to be about $94.1
million.
Revenues
from projects completed
Tsining
JunJing I
Project
Tsining JunJing I’s revenues for the year 2008 decreased 97.1percent to $264,066
from $8,964,783 in 2007 because the project was completed and most units were
delivered in 2006 and the sale of additional residential and retail units
occurred in 2007. The revenues in 2008 came from the sales of a few remaining
retail units and parking spaces.
Tsining
JunJing I revenues in 2007 declined 77.4 percent to $8,964,783 from
$39,670,186 in 2006 due to the fact that the project was completed and most
units were delivered in 2006. The 2007 revenues came from the sale of additional
residential and commercial units in the project.
Tsining-24G
Project
Tsining-24G’s revenues for the year 2008 decreased 99.9 percent to $27,243
compared with $25,198,128 for the year 2007, due to the completion of the
residential, hotel, and retail project in the second quarter 2007, when most of
the revenues were recognized using the full accrual method of accounting. The
sale of the hotel portion of the building and most retail spaces in Tsining-24G
were recognized in second quarter 2007 revenues. The revenues in 2008 resulted
from the sales of a few remaining retail and parking spaces.
- 31
-
Project
Tsining-24G revenues in 2007 grew 93.9 percent to $25,198,128 compared with
$13,000,694 in 2006. The increase was due to the block sale of the hotel portion
of one building in 2007.
Other
Projects
Revenues
in 2008 for other projects decreased 92.7 percent to $237,964 compared with
$3,245,875 in 2007. All remaining units from the company’s projects completed
that are not listed above are included in other projects. The decrease in
revenues in 2008 was primarily due to the absence of the sales of a
residential-commercial building, which was rented out before the sales and
several residential units in the company's previously completed projects in
2007.
Revenues
in 2007 for other projects were $3,245,875, up 231.6 percent compared with
$976,294 in 2006. The increase in 2007 was primarily due to the sale of an
occupied residential-commercial building and the sale of several units in the
company’s older projects.
Other
income
Other
income includes rental income, revenues from disposal of fixed assets as well as
government’s allowance for the equivalent cost of interest on the company’s
investments required to support infrastructure construction, plus continued
river management and suburban planning for the entire Baqiao high-technology
industrial park. We recognized $2,159,784 as other income in 2008
compared with $333,525 in 2007. Also in 2008, we generated a minor amount of
revenue from leasing commercial units, parking spaces, and ancillary facilities
in our completed projects. Other income in 2007 decreased 26.3 percent to
$333,525 from $452,312 in 2006 primarily due to the absence in 2007 of a
property clean-up project performed in 2006.
Cost
of properties and land
2008 – The cost of
properties and land in 2008 decreased 50.3 percent to $21,473,426 compared with
$43,221,757 in 2007. The decrease was primarily as a result of the lower number
of projects sold. In 2008, we had one project recognize a portion of pre-sales
using the percentage of completion method of accounting, compared with sales of
two projects in 2007 using the full accrual method of accounting.
Revenues
and the cost of revenues from Project Tsining JunJing II phase one began to
be recognized in the second quarter 2008 and are being recognized using the
percentage of completion method of accounting. The revenues and cost of revenues
for Tsining-24G, most of which was sold in the first quarter 2007, were
recognized using the full accrual method of accounting.
2007 – The cost of sales
in 2007 increased 17.6 percent to $43,221,757 compared with $36,749,683 in 2006.
The primary sources of the higher cost were the Baqiao infrastructure
construction and land development projects that were new in 2007.
Gross
profit and profit margin
2008 – Gross profit for
2008 was $4,992,420, down 83.7 percent from $30,691,093 in 2007. The gross
profit margin for 2008 was 18.9 percent compared with 41.5 percent in 2007. The
decrease in the gross profit was due to the smaller number of projects on sale
in 2008 and the sales of residential units in 2008 had lower profit margins than
the premium-priced retail and residential units sold in 2007 and the sale of
land in 2007 had a better margin. Most buildings sold in 2008 were in the
Tsining JunJing II residential project, which included the first units in
the project that were negotiated in 2007 at attractive prices to stimulate the
market interest and encourage future sales.
2007 – Gross profit for
2007 was $30,691,093, up 76.9 percent from $17,349,803 in 2006. The gross
profit margin for 2007 was 41.5 percent compared with 32.1 percent in 2006. The
increases in gross profit and gross profit margin were primarily due to the
Baqiao land development and infrastructure construction projects in 2007 that
were not part of the company in 2006.
- 32
-
Selling,
general, and administrative expenses
2008 – Selling, general,
and administrative expenses for 2008 increased 191.1 percent to $8,497,562 from
$2,919,360 in 2007. The increase in selling, general, and administrative
expenses was due primarily to the following reasons:
1. Higher
advertising, marketing, and selling expenses totaled $1,540,662 in 2008 compared
with $781,998 in 2007. Advertising and sales promotion costs are expensed as
incurred. The higher advertising, marketing, and selling expenses resulted from
the Company’s aggressive marketing campaign during 2008 for Tsining JunJing II
phase one project, which included advertising and fully furnished showrooms
where potential buyers could see possible layouts and decorative effects. These
showrooms have attracted hundreds of potential buyers and continue to create
buyer interest and result in additional pre-sales purchase
agreements.
2. During
the fourth quarter of 2008, we completed the formation of the Puhua with Prax
Capital. Start-up costs totaling $637,522 were expensed in 2008. We had no
similar start-up costs in 2007.
3.
An increase in allowance for bad debts. The Company provides an allowance for
doubtful accounts equal to the estimated uncollectible amounts. The Company's
estimated uncollectible amounts are based on historical collection experience
and a review of the current status of trade accounts receivable. We booked an
allowance for doubtful accounts of $1,278,516 in 2008 compared with $94,514 in
2007.
In 2008,
we estimated the allowance based on each account and we discussed all accounts
over 6 months and any amounts over 1 year because it is conservative given the
economic down-turn and circumstances at that time. A big portion of the
allowance is due to a customer refusing to pay and the dispute is in the legal
process. We have classified this as uncollectable. There was an allowance of
$94,514 in 2007.
4.
Higher professional expenses that resulted from the Company’s upgrade to NASDAQ
where its common shares began trading in May 2008. The Company believes its
listing on NASDAQ will provide more liquidity and transparency for shareholders
and additional financing flexibility for the company. Audit, legal, and other
professional costs totaled $1,405,178 in 2008 compared with $392,251 in
2007.
5.
Higher stamp tax and land use tax paid in 2008 due to changes in local
regulations that caused us to recognize $429,593 for those taxes in 2008
compared with $6,964 in 2007.
6.
Debt issuance costs are capitalized as deferred financing cost and amortized on
a straight line basis over the term of the debt. The amortization of debt
issuance costs for 2008 was $148,606 and no such costs were incurred in
2007.
7. Higher
administrative expenses occurred in 2008. Due to the
increase of management’s salary and bonus of $ 899,157. And also
$241,403 property management fee was higher charged in 2008 than $104,160
in 2007.
2007 – Selling, general,
and administrative expenses for 2007 decreased 8.7 percent to $2,919,360 from
$3,197,310 in 2006. The decrease in selling, general, and administrative
expenses was due primarily to the benefits from the Enterprise Resources
Planning system adopted by the Company in 2007 to control expenses.
Stock-based
compensation
2008 – The company
recorded a $3 million noncash expense for restricted common shares during the
third quarter of 2008, which was related the company’s incentive program for
performance achieved in 2007. The company also recorded a $78,600 noncash
expense as we issued shares to certain directors and officer as part of their
2008 salary.
2007 and 2006– The company did not
incur any stock-based compensation cost in 2007 or 2006.
Other
expenses
Other
expenses mainly consist of the losses (gains) related to the cleanup of fixed
assets, donations to charitable organizations, late delivery settlements, and
maintenance costs.
2008 – Other expenses in
2008 increased 414.8 percent to $295,595 compared with $57,416 in 2007. The
other expenses in 2008 include $146,412 (RMB 1,000,000) in donations to
earthquake relief funds in China.
2007 – Other expenses in
2007 decreased 80.9 percent to $57,416 compared with $301,158 in 2006. The 2007
decline was primarily due to the 2007 absence of the expenses in 2006 associated
with the normal added fixtures and finishing in the Tsining JunJing I and
Tsining-24G projects desired by the customers to reach final
satisfaction.
Operating
profit and operating profit margin
Operating
profit is defined as gross profit minus selling, general, and administrative
expenses, stock-based compensation, and Other expenses.
2008 – Operating
loss in 2008 was $(6,879,337) compared with income of $27,714,317
in 2007, down 124.8 percent, primarily due to lower gross profit on the
residential portion of Tsining JunJing II, the absence of high operating profit
from the Tsining-24G commercial spaces sold in the first quarter of 2007
and the higher profit from the land sale in 2007, and higher selling, general,
and administrative expenses in the 2008 that included higher professional
expenses associated with the listing on the NASDAQ stock market and the non-cash
stock-based incentive compensation in 2008. As a result, the operating profit
margin was (26.0)% for the 2008 compared with 37.5% for 2007.
- 33
-
2007 – Operating profit
in 2007 increased 100.1 percent to $27,714,317 from $13,851,335 in 2006, due
primarily to higher revenues in 2007 from the Baqiao infrastructure construction
and from land development sales at attractive profit margins. The profit margin
increased to 37.5 percent in 2007, compared with 25.6 percent in 2006, primarily
due to the attractive pricing and low costs associated with the two Baqiao
projects listed above.
Interest
expense
2008 – Interest expense
in 2008 decreased 18.5 percent to $1,346,183 from $1,652,349 in 2007. The
decrease was primarily due to the capitalization of interest directly related to
the construction. We capitalized $4.7 million in year ended December 31, 2008
compare to $3.5 million during the same period of 2007. In mid-2008, the company
signed a RMB 1 billion (about $147 million) construction credit line agreement
with China Construction Bank. During 2008, we drew down about $22 million in the
credit line. The loan from China Construction Bank has an interest rate that
floats at 110 percent of the People’s Bank of China reference rate.
2007 – Interest expense
in 2007 increased 471.6 percent to $1,652,349 from $289,083 in 2006. The
increase in 2007 was due primarily to the financing associated with the purchase
of the company that owned the exclusive right to develop the Baqiao project and
to perform the related infrastructure construction.
Change
in fair value of embedded derivatives
The
embedded derivatives are related to the company’s $20 million convertible debt
offering completed in January 2008. The change in the fair value of embedded
derivatives was a periodic adjustment to the estimated cost to the company,
which was provided by a valuation model. The company booked $(3,166,977) in 2008
as the decrease in the fair value of embedded derivatives compared with no such
costs in 2007 and 2006, since the convertible debt did not exist in those
years.
We are
using the CRR Binomial Lattice Model to estimate the fair values of warrants
liability and embedded derivatives. The CRR model depends on the following
assumptions: the price of the Company’s common stock underlying the warrants;
the strike price; the conversion price; expected life; expected volatility; risk
free interest rate; and dividend rate. We have used the CRR Binomial Lattice
Model in the past 3 years and do not expect any significant changes to
assumptions expect common share price and the volatility.
The fair
values of warrants liability and embedded derivatives have changed during the
past few years according to the valuation models and the fair values are
positively related to the market share price movement and the volatility. During
the fiscal year 2008, the Company’s common stock price decreased, which also
caused the decrease of the fair values. We estimated the fair values of warrants
liability and embedded derivatives every quarter and recognized the change of
fair values as gain or lose in our current quarter’s income statement. During
the fiscal year 2008, we recognized approximately $4.93 million as change in
fair value of warrants and $3.17 million as change in fair value of embedded
derivatives.
|
Conversion
Option
Valuation:
|
1/28/2008
|
3/31/2008
|
6/30/2008
|
9/30/2008
|
12/31/2008
|
|||||||||||||||
|
Strike
price
|
5.57
|
5.57
|
5.57
|
5.57
|
5.57
|
|||||||||||||||
|
Market
price
|
4.25
|
4.55
|
3.99
|
2.20
|
1.29
|
|||||||||||||||
|
Valuation
date
|
1/28/2008
|
3/312008
|
6/30/2008
|
9/30/2008
|
12/31/2008
|
|||||||||||||||
|
Expiry
date
|
2/28/2013
|
2/28/2013
|
2/28/2013
|
2/28/2013
|
2/28/2013
|
|||||||||||||||
|
Volatility
|
75.00
|
%
|
75.00
|
%
|
75.00
|
%
|
75.00
|
%
|
90.00
|
%
|
||||||||||
|
Risk
free rate
|
2.80
|
%
|
2.46
|
%
|
3.22
|
%
|
2.79
|
%
|
1.31
|
%
|
||||||||||
|
Option
value
|
2.43061
|
2.60669
|
2.14933
|
0.84853
|
0.4706
|
|||||||||||||||
|
Host
Value - principal
|
9,000,000
|
9,000,000
|
9,000,000
|
9,000,000
|
9,000,000
|
|||||||||||||||
|
Host
Value - interest (1)
|
0
|
0
|
0
|
0
|
0
|
|||||||||||||||
|
|
|
|
|
|
||||||||||||||||
|
Shares
issuable on conversion
|
1,615,799
|
1,615,799
|
1,615,799
|
1,615,799
|
1,615,799
|
|||||||||||||||
|
Host
Value - principal
|
3,927,375
|
4,211,886
|
3,472,887
|
1,371,062
|
760,398
|
|||||||||||||||
|
Host
Value - interest (1)
|
0
|
0
|
0
|
0
|
0
|
|||||||||||||||
|
Option
value - total
|
3,927,375
|
4,211,886
|
3,472,887
|
1,371,062
|
760,398
|
|||||||||||||||
|
Derivative
value
|
3,927,375
|
4,211,886
|
3,472,887
|
1,371,062
|
760,398
|
|||||||||||||||
Change
in fair value of warrants
|
Investor
Warrants:
|
1/28/2008
|
3/31/2008
|
6/30/2008
|
9/30/2008
|
12/31/2008
|
|||||||||||||||
|
Strike
price
|
6.07
|
6.07
|
6.07
|
6.07
|
6.07
|
|||||||||||||||
|
Market
price
|
4.25
|
4.55
|
3.99
|
2.2
|
1.29
|
|||||||||||||||
|
Valuation
date
|
1/28/2008
|
3/312008
|
6/30/2008
|
9/30/2008
|
12/31/2008
|
|||||||||||||||
|
Expiry
date
|
2/28/2013
|
2/28/2013
|
2/28/2013
|
2/28/2013
|
2/28/2013
|
|||||||||||||||
|
Vlolatility
|
75.00
|
%
|
75.00
|
%
|
75.00
|
%
|
75.00
|
%
|
90.00
|
%
|
||||||||||
|
Risk
free rate
|
2.80
|
%
|
2.46
|
%
|
3.22
|
%
|
2.79
|
%
|
1.33
|
%
|
||||||||||
|
Option
value
|
2.37894
|
2.54852
|
2.09442
|
0.82287
|
0.45822
|
|||||||||||||||
|
#
of warrants
|
1,437,467
|
1,437,467
|
1,437,467
|
1,437,467
|
1,437,467
|
|||||||||||||||
|
|
|
|
|
|
||||||||||||||||
|
Value
|
3,419,653
|
3,663,409
|
3,010,665
|
1,182,842
|
658,682
|
|||||||||||||||
- 34
-
|
Exercised
|
Exercised
|
|||||||||||||||||||||||||||||||||||||||
|
Investor Warrants: 5-7-2007
|
5/7/2007
|
6/302007
|
9/30/2007
|
11/5/2007
|
12/31/2007
|
2/27/2008
|
3/31/2008
|
6/30/2008
|
9/30/2008
|
12/31/2008
|
||||||||||||||||||||||||||||||
|
Strike
price
|
4.50
|
4.50
|
4.50
|
4.50
|
4.50
|
4.50
|
4.50
|
4.50
|
4.50
|
4.50
|
||||||||||||||||||||||||||||||
|
Market
price
|
4.30
|
4.35
|
4.69
|
6.25
|
5.01
|
5.42
|
4.55
|
3.99
|
2.20
|
1.29
|
||||||||||||||||||||||||||||||
|
Valuation
date
|
5/7/2007
|
6/302007
|
9/30/2007
|
11/5/2007
|
12/31/2007
|
2/27/2008
|
3/31/2008
|
6/30/2008
|
9/30/2008
|
12/31/2008
|
||||||||||||||||||||||||||||||
|
Expiry
date
|
5/9/2012
|
5/9/2012
|
5/9/2012
|
5/9/2012
|
5/9/2012
|
5/9/2012
|
5/9/2012
|
5/9/2012
|
5/9/2012
|
5/9/2012
|
||||||||||||||||||||||||||||||
|
Vlolatility
|
75.00
|
%
|
75.00
|
%
|
75.00
|
%
|
75.00
|
%
|
75.00
|
%
|
75.00
|
%
|
75.00
|
%
|
75.00
|
%
|
75.00
|
%
|
90.00
|
%
|
||||||||||||||||||||
|
Risk
free rate
|
4.55
|
%
|
4.92
|
%
|
4.23
|
%
|
3.90
|
%
|
3.35
|
%
|
2.57
|
%
|
2.12
|
%
|
3.11
|
%
|
2.48
|
%
|
1.09
|
%
|
||||||||||||||||||||
|
Option
value
(calculated
using above parameters and Excel add-in function)
|
2.72957
|
2.75251
|
2.94544
|
4.23084
|
3.10898
|
3.36706
|
2.61279
|
2.15108
|
0.82447
|
0.43349
|
||||||||||||||||||||||||||||||
|
Option
value per binomial spreadsheet - not capped
|
0.72695
|
2.74951
|
2.94257
|
4.22201
|
3.10850
|
3.36983
|
2.60885
|
2.15127
|
0.82460
|
0.43222
|
||||||||||||||||||||||||||||||
|
Option
value per binomial spreadsheet - not capped
|
0.60849
|
0.62303
|
0.69602
|
0.89087
|
0.76285
|
0.83059
|
0.70896
|
0.64546
|
0.33220
|
0.16402
|
||||||||||||||||||||||||||||||
|
#
of warrants
|
2,778,554
|
2,778,554
|
2,778,554
|
45,302
|
2,733,252
|
1,870
|
2,731,382
|
2,731,382
|
2,731,382
|
2,731,382
|
||||||||||||||||||||||||||||||
|
|
|
|
|
|
|
|
|
|
|
|||||||||||||||||||||||||||||||
|
Value
|
1,690,725
|
1,731,132
|
1,933,935
|
40,358
|
2,085,073
|
1,553
|
1,936,439
|
1,763,007
|
907,358
|
448,011
|
||||||||||||||||||||||||||||||
- 35
-
In 2006,
2007, and 2008 the company issued warrants in conjunction with the issuance of
common shares or convertible debt. The warrants permit the shareholders to buy
additional common shares at the prices specified in the warrant
agreements.
In 2008,
shareholders exercised a total of 1,870 warrants to buy a total of 1,870 common
shares. A shareholder typically only exercises a warrant to buy common shares
when the stock price is higher than the warrant exercise price, the shareholder
pays the exercise price and the company covers the difference between the
warrant exercise price and the share price at the time of
conversion.
The
company was required to estimate the fair value of its remaining warrants
outstanding and adjust the value as needed, and it chose to use the
Cox-Ross-Rubinstein Binomial Lattice valuation model to estimate their fair
value.
The
change in fair value of warrants of $(4,932,961) in 2008 consisted of the
periodic adjustment to the estimated cost to the company to provide the common
shares, assuming that all the warrants will be exercised sometime in the future.
The basis for estimating the cost to provide those common shares was provided by
the valuation model.
Security
registration expenses
Pursuant
to the agreement with the investors of the 5% Senior Secured Convertible
Debt (Note 14), the Company was required to pay the investors certain late
registration payments (“Late Payments”) if the company failed to file a
Registration Statement within 60 days after the closing date of the 5% Senior
Secured Convertible Debt. The Company commenced negotiations with the investors
of the 5% Senior Secured Convertible Debt to waive the Late Payments in December
2008, as both parties believed that the registration statement would become
effective within a short period of time. However, as the registration statement
has not become effective as of September 2009, the investors of the 5% Senior
Secured Convertible Debt have decided to claim the Late Payments. The
Company has decided to present the Late Payments as security registration
expenses.
The
security registration expenses were $613,483 for the year ended December 31,
2008. The Company had no such expenses in the same period of 2007.
Provision
for income taxes
During
the fourth quarter of 2008, the local tax authority conducted a tax examination
and reached a tax settlement with us regarding our income tax liability; we
realized a gain of $12,712,153, which is included in the provision for income
taxes. Local tax authority examined the Company’s tax records and issued an
income tax settlement report. As a result, the company adjusted its provision
for income taxes to $(10,490,833) compared with the $8,743,556 provision
recorded in 2007.
The
effective tax rate was 34.4 percent for 2007 and 33.3 for 2006. The slightly
higher effective rate is due primarily to one of the company’s operations whose
required structure entails owning two subsidiaries that create costs that cannot
be used to reduce the company’s tax obligation.
- 36
-
Minority
Interest
We
recorded $(159,564) minority interest attributable to the minority
shareholder of Puhua and Success Hill, which is relate to the formation of Puhua
in the fourth quarter of 2008. We did not have any minority interest in
2007.
Net
income
2008 – Net income in
2008 decreased 46.4 percent to $8,942,370 from $16,686,116 in 2007.
As
explained above, the decrease in net income was due primarily to the absence of
a land sale, fewer projects in the sales cycle, lower gross profit, higher
selling, general, and administrative expenses, the restricted common stock
issued in 2008 as incentive compensation for the year 2007, and accretion on
convertible debt, partly offset by the change in the fair value of warrants and
embedded derivatives and the tax settlement in fourth quarter of
2008.
2007 – Net income for
the year 2007 increased 84.4 percent to $16,686,116 from $9,050,810 for the year
2006. The increase was primarily due to the 2007 revenue from the land sale and
infrastructure project related to the Baqiao project, partly offset by the
absence of the 2006 sales of the Tsining JunJing I and Tsining-24G projects, the
2007 change in the fair value of the warrants, and the higher interest expense
associated with borrowings to acquire the Baqiao project in 2007.
Basic
and diluted earnings per share
2008 – Basic earnings
per share were $0.29 in 2008, down 53.2 percent from $0.62 in 2007. Diluted
earnings per share were $0.28 in 2008, down 54.8 percent from $0.62 in
2007. The increases in the weighted average shares outstanding in 2008 compared
with 2007 were due to the restricted common shares issued in the third quarter
2008 as incentive compensation for the year 2007 performance.
2007 – Basic and diluted
earnings per share were $0.62 in 2007, up 37.8 percent from $0.45 in 2006. The
basic and diluted earnings per share were both $0.62 in 2007 because the
warrants were anti-dilutive. Likewise, the basic and diluted earnings per share
were both $0.45 in 2006 for the same reason.
Common
shares used to calculate basic and diluted EPS
2008 — The weighted
average shares outstanding used to calculate the basic earnings per share were
30,516,411 shares in 2008 and 26,871,388 shares in 2007. The weighted average
shares outstanding used to calculate the diluted earnings per share were
30,527,203 shares in 2008 and 26,871,388 shares in 2007. The increase was
primarily due to the incentive shares we issued to certain managements for their
2007 performance.
2007 — Basic and diluted
earnings per share were based on weighted average shares outstanding of
26,817,388 for 2007 and 20,277,615 for 2006. The 32.3 percent increase in the
weighted average shares outstanding was due to the common shares with warrants
issued in 2007, as well as the common stock with warrants that were issued in
2006.
Gain
on foreign exchange
The
company operates in China and accounts in the Chinese renminbi but reports its
financial results in U.S. dollars, based on the exchange rates of the two
currencies. During 2006, 2007, and 2008, the renminbi appreciated in value
against the U.S. dollar, which, when translating the operating results and
financial positions at different exchange rates, created the accrued gain on
foreign exchange.
Cash
flow discussion
2008 – The increase in
cash for the year 2008 was $34,346,145 compared with $2,007,132 in
2007.
Cash flow
from operating activities in 2008 decreased 436.9 percent to $(29,076,622) from
$8,611,383 in 2007, primarily due to the operating cash outflow associated with
the development of Tsining JunJing II phase one.
The use
of cash in investing activities in 2008 was $(510,713), which was 98.0 percent
less than 2007, primarily due to the increase of the restricted cash and the
absence of the subsidiary acquisition. We acquired 100 percent equity of New
Land in March 2007.
Cash flow
from financing activities in 2008 provided $63,933,479, up 247.2 percent from
2007, primarily due to $29,268,913 net proceeds from the creation of the joint
venture with Prax Capita, the $19,230,370 proceeds from the convertible debt
offering in January 2008 and funds from construction loans with banks that
totaled $46,054,762, partly offset by payments on loans totaling
$25,905,804.
- 37
-
In
mid-2008, the company signed a RMB 1 billion (about $147 million) construction
credit line agreement with China Construction Bank to support the company’s
development projects. The company has been granted a total RMB 22 million loan
for the JunJing II phase one project and expects another 22 million loan once
the JunJing II phase two project begins.
2007 – The increase in
cash for the year 2007 was $2,007,132 compared with $358,864 in
2006.
Cash flow
from operating activities in 2007 increased 35.75 percent to $8,611,383 from
2006, this was primarily due to higher net income from the sale of real estate
and profit from the sale of a land use right.
Cash flow
from investing activities in 2007 consumed $25,020,248, up 70.4 percent from
2006, primarily due to higher expenditures to acquire a company that held the
right to develop the Baqiao project, and the absence of the 2006 purchases of
buildings, equipment, and automobiles.
Cash flow
from financing activities in 2007 provided $18,415,997, up 111.8 percent from
$8,696,388 in 2006, primarily due to the issuance of common stock and warrants,
which was partly offset by payments on loans.
Debt
leverage
Total
debt consists of the sum of the balance sheet lines titled Payable to New
Land’s previous shareholders, Loans from employees, Loans payable and
convertible debt.
2008 – Total debt
outstanding as of December 31, 2008 was $59,186,304 compared with $27,922,125 on
December 31, 2007.
Net debt
outstanding (total debt less cash) as of December 31, 2008 was $20,955,952
compared with $25,469,759 on December 31, 2007. The company's net debt as a
percent of total capital (net debt plus shareholders' equity) was
15.6 percent on December 31, 2008 and 27.8 percent on December 31, 2007.
The decrease in net debt as a percent of total capital was primarily due to the
increase of cash. In the fourth quarter of 2008, we completed the formation
of a joint venture and received $29.3 million in cash from Prax Capital for
their share of the participation.
2007 – Total debt
outstanding at year end 2007 was $27,922,125 compared with $29,707,492 at
yearend 2006. Net debt outstanding (total debt less cash) at yearend 2007 was
$25,469,759 compared with $28,219,588 at yearend 2006. The company’s net debt as
a percent of total capital (net debt plus shareholders’ equity) was 27.79
percent at yearend 2007 and 59.49 percent at yearend 2006. The reduction in net
debt leverage was primarily due to the issuance of common stock and warrants and
the net reduction in loans.
Liquidity
and capital resources
Our
principal demands for liquidity are for the development of new properties,
property acquisitions, and general corporate purposes.
As of
December 31, 2008, we had $38,230,352 of cash and cash equivalents, an increase
of $35,777,986 compared with $2,452,366 of cash and cash equivalents as of
December 31, 2007.
Financial
obligations
As of
December 31, 2008, we had total bank loans of $35,617,442 with a weighted
average interest rate of 10.65 percent. Future scheduled maturities of loans
payable were as follows:
|
Due
Date
|
Outstanding
Amount
|
|||
|
2009-09-14
|
$
|
3,371,198
|
||
|
2009-12-25
|
$
|
5,130,084
|
||
|
2010-08-29
|
$
|
5,130,084
|
||
|
2011-08-27
|
$
|
21,986,076
|
||
Mortgage
debt (total bank loans) is secured by the assets of the company.
Loans
payable
Loans
payable represent amounts due to various banks and are due on demand or normally
due within one year. These loans generally can be renewed with the banks when
the loans mature.
- 38
-
Most of
the obligations of the company are tied to specific projects. The terms of the
loans typically are 1 to 3 years. Loan extensions are determined by mutual
agreement when the current term expires and both parties will consider the
remaining time needed to complete the project. Most of these loans are payable
when the project has been completed and the residents or businesses take
possession.
The
following table summarizes the company's loans payable that were outstanding as
of December 31, 2008:
|
(Millions of dollars)
|
Balance
|
Interest rate
|
Due date
|
|||||||
|
Xi'an
Rural Credit Union
|
$
|
3.37
|
9.53
|
%
|
14-Sep-2009
|
|||||
|
Commercial
Bank Weilai
|
$
|
5.13
|
9.47
|
%
|
25-Dec-2009
|
|||||
|
Commercial
Bank Weilai
|
$
|
5.13
|
10.21
|
%
|
29-Aug-2010
|
|||||
|
China
Construction Bank
|
$
|
22.00
|
6.14
|
%
|
28-Aug-2011
|
|||||
The
currently indicated annual interest requirement on these loans totals about
$3.8 million. The loan from China Construction Bank has an interest rate
that floats at 110 percent of the People’s Bank of China reference
rate.
The
following table summarizes the amounts and types of the company's obligations
and provides the estimated period of maturity for the financial obligations by
class as of December 31, 2008:
|
Obligations Due by
Period
|
1 year
|
1-3 years
|
3-5 years
|
|||||||||
|
(Millions
of dollars)
|
||||||||||||
|
Current
liabilities:
|
||||||||||||
|
Accounts
payable
|
$
|
10.53
|
||||||||||
|
Income
and other taxes payable
|
$
|
7.53
|
||||||||||
|
Other
payables
|
$
|
5.18
|
||||||||||
|
Advances
(deposits) from customers
|
$
|
9.26
|
||||||||||
|
Accrued
expenses
|
$
|
3.54
|
||||||||||
|
Accrued
security registration expenses
|
$
|
0.61
|
||||||||||
|
Long-term
liabilities:
|
||||||||||||
|
Warranties
liabilities
|
$
|
1.12
|
||||||||||
|
Deferred
tax
|
$
|
11.50
|
||||||||||
|
Fair
value of embedded derivatives
|
$
|
0.76
|
||||||||||
|
convertible
debt
|
$
|
13.62
|
||||||||||
|
Long-term
debt:
|
||||||||||||
|
Loans
payable
|
$
|
8.50
|
$
|
27.13
|
||||||||
|
Payable
to New Land’s previous shareholders
|
$
|
8.43
|
||||||||||
|
Loans
from employees
|
$
|
1.52
|
||||||||||
Liquidity
expectation
The
company believes that the combination of present capital resources, internally
generated funds, and unused financing sources are more than adequate to meet
cash requirements for the year 2009.
We intend
to meet our liquidity requirements, including capital expenditures related to
the purchase of land for the development of our future projects, through cash
flow provided by operations and additional funds raised by future financings.
Upon acquiring land for future development, we intend to raise funds to
develop our projects by obtaining mortgage financing from local banking
institutions with which we have done business in the past. We believe that our
relationships with these banks are in good standing and that our real
estate will secure the loans needed. We believe that adequate cash flow will be
available to fund our operations.
- 39
-
As part
of our funding plan, on March 9, 2007, we entered into a Shares Transfer
Agreement with the shareholders of New Land, pursuant to which we
have acquired 32,000,000 shares of the New Land, constituting 100 percent equity
ownership of New Land.
New Land
is now in cooperation with the Baqiao District Government of Xi'an City in
developing the Baqiao Science & Technology Industrial Park, a provincial
development zone in Shaanxi Province. This acquisition has been completed, and
the Company has the right to develop and sell 487 acres of property
that has been targeted for new residential developments.
The
majority of the company's revenues and expenses were denominated primarily in
renminbi (RMB), the currency of the People's Republic of China. There is no
assurance that exchange rates between the RMB and the U.S. dollar will remain
stable. The company does not engage in currency hedging. Inflation has not had a
material impact on the company's business.
Off-Balance
Sheet Arrangements
Neither
us, nor any of our subsidiaries has any off-balance sheet arrangements that have
or are reasonably likely to have a current or future effect on their financial
condition or results of operations.
Other
events
On
January 28, 2008, the company raised $20 million through the issuance of senior
secured convertible debt to institutional investors. As part of the private
placement, the company issued five-year senior secured convertible debt with an
aggregate principal amount of $20 million that pays cash interest of 5 percent
per annum. $9 million of the notes are convertible into common stock and carry
an initial conversion price of $5.57 per share, which can be increased if
certain stock price thresholds are met. Additionally, forced conversion can also
occur at the Company’s discretion if certain stock price thresholds are met. The
notes are secured by certain real estate assets and additionally through a
pledge of common shares owned by Mr. Pingji Lu, the Company’s Chairman.
Additionally, investors in the private placement were granted 1,437,467
five-year warrants with a strike price of $6.07 per common share, which are
callable if certain stock price thresholds are met. Approximately 215,620 of the
warrants are available as a management incentive if certain milestones are
met.
On July
7, 2008, the company signed a strategic partnership agreement with the China
Construction Bank Shaanxi Branch that establishes a RMB 1 billion construction
credit line to support the construction work of China Housing and its
subsidiaries. The new strategic partnership is the first and only one of its
kind for both China Housing & Land Development and China Construction Bank
Shaanxi Branch. The agreement also establishes China Housing as a VIP client for
the bank.
On
October 13, 2008, the company announced that it recently began constructing its
third dam on the Ba River, adjacent to the company's 487-acre Baqiao housing
project. The dam is expected to be completed in the second quarter of 2009. The
company expects to record $3.7 million in revenue and about $0.6 million in net
income when the dam is finished. The company already has secured an
infrastructure construction loan of about RMB 35 million with the Xi'an
Commercial Bank to finance this project. The dam will create a large lake about
three meters deep on the Ba River that will increase the attractiveness and
value of the Company's Baqiao housing project.
In early
November 2008, China Housing and Prax Capital China Real Estate Fund I, Inc.,
entered into a joint agreement to develop 79 acres within China Housing’s Baqiao
project. The joint venture was formed in late December 2008, subject to certain
conditions and approvals, which were met. Prax Capital Real Estate Holdings
Limited invested US$29.3 million cash in the joint venture, the joint venture
acquired the land use rights early in the first quarter 2009 and the joint
venture is proceeding with the project.
- 40
-
ITEM
7A. QUANTITATIVE AND QUALITATIVE DISCLOSURE ABOUT MARKET RISK
The
company is subject to the following market risks, including but not limit
to:
General
Real Estate Risk
There is
a risk that the company’s property values could go down due to general economic
conditions, a weak market for real estate generally, or changing supply and
demand. The company’s property held for sale value, approximately $14 million at
the end of December, 2008, may change due to market fluctuations. Currently, it
is valued at our cost which is significantly below the market
value.
Risk
Relating to Property Sales
The
company may not be able to sell a property at a particular time for our full
value, particularly in a poor market.
Foreign
Currency Exchange Rate Risk
The
company is doing all our business in the People’s Republic of China. All the
revenue and profit is denominated in RMB. When RMB depreciates, it may adversely
affect the company’s financial performance. Specifically, since the company’s
recent $20 million senior convertible debt interest payment is denominated in
U.S. dollars; the depreciation of RMB may incur additional cost to our financial
cost. However, the effect likely would be small.
- 41
-
ITEM
8. NOTES & CONSOLIDATED FINANCIAL STATEMENTS
Report
of Independent Registered Public Accounting Firm
To the
Shareholders and Board of Directors of China Housing & Land Development,
Inc.
We have
audited the accompanying consolidated balance sheets of China Housing & Land
Development, Inc., and subsidiaries (the “Company”) as at December 31, 2008 and
2007 and the related consolidated statements of income and comprehensive income,
shareholders’ equity and cash flows for the years then ended. These consolidated
financial statements are the responsibility of the Company’s management.
Our responsibility is to express an opinion on these financial statements
based on our audits.
We
conducted our audits in accordance with standards of the Public Company
Accounting Oversight Board (United States). Those standards require that we plan
and perform the audit to obtain reasonable assurance about whether the financial
statements are free of material misstatement. We are not engaged to perform an
audit of the Company’s internal control over financial reporting. Our audits
included consideration of internal control over financial reporting as a basis
for designing audit procedures that are appropriate in the circumstances, but
not for the purpose of expressing an opinion on the effectiveness of the
Company’s internal control over financial reporting. Accordingly, we
express no such opinion. An audit includes examining, on a test basis, evidence
supporting the amounts and disclosures in the financial statements. An audit
also includes assessing the accounting principles used and significant
estimates made by management, as well as evaluating the overall financial
statement presentation. We believe that our audit provides a reasonable basis
for our opinion.
As
discussed in Note 3 to the consolidated financial statements, effective
January 1, 2008, the Company changed its method of revenue
recognition.
In our
opinion, these consolidated financial statements present fairly, in all material
respects, the financial position of the Company as at December 31, 2008 and 2007
and the results of its operations and its cash flows for the years then ended in
accordance with accounting principles generally accepted in the United States of
America.
As
discussed in Note 2 to the consolidated financial statements, China Housing
& Land Development, Inc. has restated its financial statements for the year
ended December 31, 2008 to reflect the accrual of security registration
expenses.
Signed:
“MSCM LLP”
MSCM
LLP
Toronto,
Canada
March 25,
2009
except
for Note 2 as to which the date is October 28, 2009
Report
of Independent Registered Public Accounting Firm
To the
Board of Directors and Stockholders
China
Housing & Land Development Inc.
We have
audited the accompanying consolidated statements of income and other
comprehensive income, shareholders’ equity and cash flows of China Housing &
Land Development Inc. and subsidiaries (the "Company") for the year ended
December 31, 2006. These statements are the responsibility of the Company's
management. Our responsibility is to express an opinion on these statements
based on our audit.
We
conducted our audit in accordance with standards of the Public Company
Accounting Oversight Board (United States). Those standards require that we plan
and perform the audit to obtain reasonable assurance about whether the
consolidated financial statements are free of material misstatement. The company
was not required to have, nor were we engaged to perform, and audit of its
internal control over financial reporting. Our audit included consideration of
internal control over financial reporting as a basis for designing audit
procedures that are appropriate in the circumstances, but not for the purpose of
expressing an opinion on the effectiveness of the company's internal control
over financial reporting. Accordingly, we express no such opinion. An audit also
includes examining, on a test basis, evidence supporting the amounts and
disclosures in the consolidated financial statements, assessing the accounting
principles used and significant estimates made by management, as well as
evaluation the overall financial statement presentation. We believe that our
audit provide a reasonable basis for our opinion.
In our
opinion, the consolidated statements of income and comprehensive income,
shareholders' equity and cash flows referred to above presents fairly, in all
material respects, the results of the operations and its cash flows of China
Housing & Land Development Inc for the year ended December 31, 2006, in
conformity with accounting principles generally accepted in the United States of
America.
|
/s/ Moore
Stephens Wurth Frazer and Torbet, LLP
|
|
Walnut,
California
|
|
March
26, 2007
|
- 42
-
CHINA
HOUSING & LAND DEVELOPMENT, INC., AND SUBSIDIARIES
Consolidated
Balance Sheets
As of
December 31, 2008 and December 31, 2007
|
December 31,
|
December 31,
|
|||||||
|
2008
|
2007
|
|||||||
|
(Restated - Note 2)
|
||||||||
|
ASSETS
|
||||||||
|
Cash
|
$
|
37,425,340
|
$
|
2,351,015
|
||||
|
Cash
- restricted
|
805,012
|
101,351
|
||||||
|
Accounts
receivable, net of allowance for doubtful accounts of $1,278,156 and
$94,514, respectively
|
|
|
813,122
|
|
|
|
12,107,882
|
|
|
Other
receivables, prepaid expenses and other assets
|
446,497
|
567,308
|
||||||
|
Notes
receivable, net
|
811,695
|
947,918
|
||||||
|
Real
estate held for development or sale
|
60,650,011
|
40,986,931
|
||||||
|
Property
and equipment, net
|
12,391,501
|
5,707,012
|
||||||
|
Assets
held for sale
|
14,308,691
|
12,910,428
|
||||||
|
Advance
to suppliers
|
704,275
|
2,071,549
|
||||||
|
Deposits
on land use rights
|
47,333,287
|
29,694,103
|
||||||
|
Intangible
assets, net
|
46,043,660
|
48,205,697
|
||||||
|
Deferred
financing costs
|
622,118
|
55,451
|
||||||
|
Total
assets
|
222,355,209
|
155,706,645
|
||||||
|
LIABILITIES
|
||||||||
|
Accounts
payable
|
$
|
10,525,158
|
$
|
9,311,995
|
||||
|
Advances
from customers
|
9,264,385
|
5,258,351
|
||||||
|
Accrued
expenses
|
3,539,842
|
1,903,451
|
||||||
|
Accrued
security registration expenses
|
613,483
|
-
|
||||||
|
Payable
to New Land’s previous shareholders
|
8,429,889
|
11,413,229
|
||||||
|
Income
and other taxes payable
|
7,532,730
|
22,711,981
|
||||||
|
Other
payables
|
5,183,251
|
3,881,137
|
||||||
|
Loans
from employees
|
1,517,039
|
2,388,862
|
||||||
|
Loans
payable
|
35,617,442
|
14,120,034
|
||||||
|
Deferred
tax liability
|
11,510,915
|
15,907,880
|
||||||
|
Warrants
liability
|
1,117,143
|
2,631,991
|
||||||
|
Fair
value of embedded derivatives
|
760,398
|
-
|
||||||
|
convertible
debt
|
13,621,934
|
-
|
||||||
|
Total
liabilities
|
109,233,609
|
89,528,911
|
||||||
|
MINORITY
INTEREST IN SUBSIDIARIES
|
29,109,350
|
-
|
||||||
|
SHAREHOLDERS'
EQUITY
|
||||||||
|
Common
stock: $.001 par value, authorized 100,000,000 shares issued and
outstanding 30,893,757 and 30,141,887, respectively
|
30,894
|
30,142
|
||||||
|
Additional
paid in capital
|
31,390,750
|
28,381,534
|
||||||
|
Statutory
reserves
|
3,541,226
|
2,885,279
|
||||||
|
Retained
earnings
|
38,651,579
|
30,365,156
|
||||||
|
Accumulated
other comprehensive income
|
10,397,801
|
4,515,623
|
||||||
|
Total
China Housing & Land Development, Inc. shareholders’
equity
|
84,012,250
|
66,177,734
|
||||||
|
Total
liabilities and shareholders' equity
|
$
|
222,355,209
|
$
|
155,706,645
|
||||
The
accompanying notes are an integral part of these consolidated financial
statements.
- 43
-
CHINA
HOUSING & LAND DEVELOPMENT, INC., AND SUBSIDIARIES
Consolidated
Statements of Income and Comprehensive Income
For The
Years Ended December 31, 2008, 2007 and 2006
|
2008
|
2007
|
2006
|
||||||||||
|
(Restated - Note 2)
|
||||||||||||
|
REVENUES
|
||||||||||||
|
Sale
of properties
|
$
|
24,306,062
|
$
|
73,579,325
|
$
|
53,647,174
|
||||||
|
Other
income
|
2,159,784
|
333,525
|
452,312
|
|||||||||
|
Total
revenues
|
26,465,846
|
73,912,850
|
54,099,486
|
|||||||||
|
COSTS
AND EXPENSES
|
||||||||||||
|
Cost
of properties and land
|
21,473,426
|
43,221,757
|
36,749,683
|
|||||||||
|
Selling,
general, and administrative expenses
|
8,497,562
|
2,919,360
|
3,197,310
|
|||||||||
|
Stock-based
compensation
|
3,078,600
|
-
|
-
|
|||||||||
|
Security
registration expenses
|
613,483
|
-
|
-
|
|||||||||
|
Other
expenses
|
295,595
|
57,416
|
301,158
|
|||||||||
|
Interest
expense
|
1,346,183
|
1,652,349
|
289,083
|
|||||||||
|
Accretion
expense on convertible debt
|
968,962
|
-
|
-
|
|||||||||
|
Change
in fair value of embedded derivatives
|
(3,166,977
|
)
|
-
|
-
|
||||||||
|
Change
in fair value of warrants
|
(4,932,961
|
)
|
632,296
|
-
|
||||||||
|
Total
costs and expenses
|
28,173,873
|
48,483,178
|
40,537,234
|
|||||||||
|
(Loss)
income before provision for income taxes and minority
interest
|
(1,708,027
|
)
|
25,429,672
|
13,562,252
|
||||||||
|
(Recovery)
provision for income taxes
|
(10,490,833
|
)
|
8,743,556
|
4,511,442
|
||||||||
|
Income
before minority interest
|
8,782,806
|
16,686,116
|
9,050,810
|
|||||||||
|
Minority
interest in net loss of subsidiaries, net of tax
|
159,564
|
-
|
-
|
|||||||||
|
NET
INCOME
|
8,942,370
|
16,686,116
|
9,050,810
|
|||||||||
|
Gain
on foreign exchange
|
5,882,178
|
3,617,405
|
655,435
|
|||||||||
|
COMPREHENSIVE
INCOME
|
$
|
14,824,548
|
$
|
20,303,521
|
$
|
9,706,245
|
||||||
|
WEIGHTED
AVERAGE SHARES OUTSTANDING
|
||||||||||||
|
Basic
|
30,516,411
|
26,871,388
|
20,277,615
|
|||||||||
|
Diluted
|
30,527,203
|
26,871,388
|
20,277,615
|
|||||||||
|
|
||||||||||||
|
EARNINGS
PER SHARE
|
||||||||||||
|
Basic
|
$
|
0.29
|
$
|
0.62
|
$
|
0.45
|
||||||
|
Diluted
|
$
|
0.28
|
$
|
0.62
|
$
|
0.45
|
||||||
The
accompanying notes are an integral part of these consolidated financial
statements.
- 44
-
CHINA
HOUSING & LAND DEVELOPMENT INC., AND SUBSIDIARIES
Consolidated
Statements of Cash Flows
For The
Years Ended December 31, 2008, 2007 and 2006
|
2008
|
2007
|
2006
|
||||||||||
|
(Restated - Note 2)
|
||||||||||||
|
CASH
FLOWS FROM OPERATING ACTIVITIES:
|
||||||||||||
|
Net
income
|
$
|
8,942,370
|
$
|
16,686,116
|
$
|
9,050,810
|
||||||
|
Adjustments
to reconcile net income to cash
|
||||||||||||
|
provided
by (used in) operating activities:
|
||||||||||||
|
Minority
interest in subsidiaries
|
(159,564
|
)
|
-
|
-
|
||||||||
|
Bad
debt expense
|
1,420,434
|
-
|
509,435
|
|||||||||
|
Depreciation
|
454,728
|
423,932
|
354,444
|
|||||||||
|
Gain
on disposal of fixed assets
|
15,167
|
(48,347
|
)
|
(149,830
|
)
|
|||||||
|
Gain
on income tax settlement
|
(12,712,153
|
)
|
-
|
-
|
||||||||
|
Amortization
of stock issued for investor relations fees
|
-
|
131,400
|
-
|
|||||||||
|
Amortization
of deferred financing costs
|
148,606
|
-
|
-
|
|||||||||
|
Amortization
of intangible assets
|
-
|
1,157,758
|
-
|
|||||||||
|
Stock-based
compensation
|
3,078,600
|
-
|
-
|
|||||||||
|
Change
in fair value of warrants
|
(4,932,961
|
)
|
632,296
|
-
|
||||||||
|
Change
in fair value of embedded derivatives
|
(3,166,977
|
)
|
-
|
-
|
||||||||
|
Accretion
expense on convertible debt
|
968,962
|
-
|
-
|
|||||||||
|
Non-cash
proceeds from sales
|
(166,148
|
)
|
(10,783,201
|
)
|
-
|
|||||||
|
(Increase)
decrease in assets:
|
||||||||||||
|
Accounts
receivable
|
10,758,758
|
(8,463,433
|
)
|
(431,805
|
)
|
|||||||
|
Real
estate
|
(23,463,229
|
)
|
13,696,294
|
3,640,231
|
||||||||
|
Advances
to suppliers
|
1,600,308
|
(1,480,596
|
)
|
11,930,759
|
||||||||
|
Deposit
on land use rights
|
(15,387,541
|
)
|
(17,695,934
|
)
|
-
|
|||||||
|
Other
receivables and deferred charges
|
(114,638
|
)
|
658,893
|
(1,118,155
|
)
|
|||||||
|
Deferred
financing costs
|
202,888
|
-
|
-
|
|||||||||
|
Increase
(decrease) in liabilities:
|
||||||||||||
|
Accounts
payable
|
570,250
|
2,556,717
|
2,716,495
|
|||||||||
|
Advances
from customers
|
3,576,253
|
2,066,546
|
(28,428,381
|
)
|
||||||||
|
Accrued
expense
|
1,607,633
|
42,522
|
1,625,843
|
|||||||||
|
Other
payable
|
1,003,031
|
(1,016,610
|
)
|
(266,309
|
)
|
|||||||
|
Income
and other taxes payable
|
(3,934,882
|
)
|
10,047,030
|
6,909,809
|
||||||||
|
Accrued
security registration expenses
|
613,483
|
-
|
-
|
|||||||||
|
Net
cash provided by (used in) operating activities
|
(29,076,622
|
)
|
8,611,383
|
6,343,346
|
||||||||
|
CASH
FLOWS FROM INVESTING ACTIVITIES:
|
||||||||||||
|
Change
in restricted cash
|
(684,040
|
)
|
1,039,410
|
591,312
|
||||||||
|
Purchase
of buildings, equipment and automobiles
|
(1,063,332
|
)
|
(244,355
|
)
|
(13,269,773
|
)
|
||||||
|
Notes
receivable collected
|
364,313
|
1,272,541
|
(2,246,025
|
)
|
||||||||
|
Proceed
from sale of fixed assets
|
872,346
|
-
|
243,616
|
|||||||||
|
Acquisition
of subsidiary
|
-
|
(27,087,844
|
)
|
-
|
||||||||
|
Net
cash provided by (used in) investing activities
|
(510,713
|
)
|
(25,020,248
|
)
|
(14,680,870
|
)
|
||||||
|
CASH
FLOWS FROM FINANCING ACTIVITIES:
|
||||||||||||
|
Net
proceeds from issuance of convertible debt
|
19,230,370
|
-
|
-
|
|||||||||
|
Investment
and advances from minority shareholder
|
29,268,913
|
-
|
-
|
|||||||||
|
Loans
from bank
|
46,054,762
|
3,944,359
|
13,835,303
|
|||||||||
|
Payments
on loans
|
(25,905,804
|
)
|
(14,202,410
|
)
|
(7,905,887
|
)
|
||||||
|
Loans
to or from employees, net
|
(1,018,357
|
)
|
1,226,736
|
1,016,551
|
||||||||
|
Repayment
of loan from New Land previous shareholders
|
(3,704,820
|
)
|
4,207,315
|
-
|
||||||||
|
Proceeds
from issuance of common stock and warrants
|
8,415
|
23,239,997
|
1,750,421
|
|||||||||
|
Net
cash provided by financing activities
|
$
|
63,933,479
|
$
|
18,415,997
|
$
|
8,696,388
|
||||||
|
INCREASE
IN CASH
|
34,346,145
|
2,007,132
|
358,864
|
|||||||||
|
Effects
on foreign current exchange
|
728,180
|
(35,750
|
)
|
(9,976
|
)
|
|||||||
|
CASH,
beginning of year
|
2,351,015
|
379,633
|
30,745
|
|||||||||
|
CASH,
end of year
|
$
|
37,425,340
|
$
|
2,351,015
|
$
|
379,633
|
||||||
- 45
-
CHINA
HOUSING & LAND DEVELOPMENT, INC., AND SUBSIDIARIES
Consolidated
Statements of Shareholders' Equity
For The
Years Ended December 31, 2008, 2007 and 2006
|
Additional
|
Capital
|
Other
|
||||||||||||||||||||||||||||||
|
Common Stock
|
paid in
|
Statutory
|
Retained
|
contribution
|
comprehensive
|
|||||||||||||||||||||||||||
|
Shares
|
Par Value
|
capital
|
reserves
|
earnings
|
receivable
|
income
|
Totals
|
|||||||||||||||||||||||||
|
(Restated - Note 2)
|
(Restated - Note 2)
|
|||||||||||||||||||||||||||||||
|
BALANCE,
December
31, 2005
|
20,000,000
|
$
|
20,000
|
$
|
5,442,798
|
$
|
1,234,178
|
$
|
6,279,331
|
$
|
-
|
$
|
242,783
|
$
|
13,219,090
|
|||||||||||||||||
|
Common
stock issued for cash at $3.25
|
619,223
|
619
|
1,749,802
|
-
|
-
|
-
|
-
|
1,750,421
|
||||||||||||||||||||||||
|
Net
Income
|
-
|
-
|
-
|
-
|
9,050,810
|
-
|
-
|
9,050,810
|
||||||||||||||||||||||||
|
Adjustment
to statutory reserve
|
-
|
-
|
-
|
915,960
|
(915,960
|
)
|
-
|
-
|
-
|
|||||||||||||||||||||||
|
Capital
contribution receivable
|
-
|
-
|
-
|
-
|
-
|
(5,462,798
|
)
|
-
|
(5,462,798
|
)
|
||||||||||||||||||||||
|
Foreign
currency translation adjustment
|
-
|
-
|
-
|
-
|
-
|
-
|
655,435
|
655,435
|
||||||||||||||||||||||||
|
BALANCE,
December 31, 2006
|
20,619,223
|
$
|
20,619
|
$
|
7,192,600
|
$
|
2,150,138
|
$
|
14,414,181
|
$
|
(5,462,798
|
)
|
$
|
898,218
|
$
|
19,212,958
|
||||||||||||||||
|
Common
stock issued for consulting services
|
60,000
|
60
|
131,340
|
-
|
-
|
-
|
-
|
131,400
|
||||||||||||||||||||||||
|
Common
stock and warrants issued at $2.70
|
9,387,985
|
9,388
|
20,532,623
|
-
|
-
|
-
|
-
|
20,542,011
|
||||||||||||||||||||||||
|
Common
Stock issued from warrants conversion
|
74,679
|
75
|
524,971
|
-
|
-
|
-
|
-
|
525,046
|
||||||||||||||||||||||||
|
Net
Income
|
-
|
-
|
-
|
-
|
16,686,116
|
-
|
-
|
16,686,116
|
||||||||||||||||||||||||
|
Adjustment
to statutory reserve
|
-
|
-
|
-
|
735,141
|
(735,141
|
)
|
-
|
-
|
-
|
|||||||||||||||||||||||
|
Capital
contribution receivable
|
-
|
-
|
-
|
-
|
-
|
5,462,798
|
-
|
5,462,798
|
||||||||||||||||||||||||
|
Foreign
currency translation adjustment
|
-
|
-
|
-
|
-
|
-
|
3,617,405
|
3,617,405
|
|||||||||||||||||||||||||
|
BALANCE,
December 31, 2007
|
30,141,887
|
$
|
30,142
|
$
|
28,381,534
|
$
|
2,885,279
|
$
|
30,365,156
|
$
|
-
|
$
|
4,515,623
|
$
|
66,177,734
|
|||||||||||||||||
|
Common
Stock issued from warrants conversion
|
1,870
|
2
|
9,966
|
-
|
-
|
-
|
-
|
9,968
|
||||||||||||||||||||||||
|
Stock
based compensation
|
750,000
|
750
|
2,999,250
|
-
|
-
|
-
|
-
|
3,000,000
|
||||||||||||||||||||||||
|
Net
Income
|
-
|
-
|
-
|
-
|
8,942,370
|
-
|
-
|
8,942,370
|
||||||||||||||||||||||||
|
Adjustment
to statutory reserve
|
-
|
-
|
-
|
655,947
|
(655,947
|
)
|
-
|
-
|
-
|
|||||||||||||||||||||||
|
Foreign
currency translation adjustment
|
-
|
-
|
-
|
-
|
-
|
-
|
5,882,178
|
5,882,178
|
||||||||||||||||||||||||
|
BALANCE,
December 31, 2008
|
30,893,757
|
$
|
30,894
|
$
|
31,390,750
|
$
|
3,541,226
|
$
|
38,651,579
|
$
|
-
|
$
|
10,397,801
|
$
|
84,012,250
|
|||||||||||||||||
The
accompanying notes are an integral part of these consolidated financial
statements.
- 46
-
Note
1 — Organization and Basis of Presentation
China
Housing & Land Development, Inc., (the Company) is a Nevada corporation,
incorporated on July 6, 2004 under the name Pacific Northwest Productions Inc.,
(Pacific). On May 5, 2006, the Company changed its name to China Housing &
Land Development, Inc. The Company, through its subsidiaries, is engaged in
acquisition, development, management, and sale of commercial and residential
real estate properties located primarily in Xi'an, Shaanxi Province, People’s
Republic of China (PRC or China).
The
accompanying consolidated financial statements include the accounts of the
Company and its wholly owned subsidiaries, Xi'an Tsining Housing Development
Company Inc. (Tsining), Xi'an New Land Development Co. (New Land), Xi'an Hao Tai
Housing Development Company Inc. (Hao Tai), Manstate Assets Management
Limited (Manstate), Puhua (Xi’an) Real Estate Development Co., Ltd
(75% interest) (Puhua), Success Hill Investments Limited (60% interest)
(Success Hill) (collectively, the Subsidiaries). All inter-company accounts
and transactions have been eliminated on consolidation. The accompanying
consolidated financial statements have been prepared in conformity with
accounting principles generally accepted in the United States of America
(GAAP).
Tsining
was established during May 1992 as a state-owned enterprise, whose former name
is Xi’an New Star Group Real Estate Development Co. Ltd, and was reorganized as
a limited liability company with equity capital invested by management personnel
in September 1999 with registered capital of approximately $3,140,000 (RMB
26,000,000). On March 28, 2002, the registered capital of Tsining was increased
to approximately $6,050,000 (RMB 50,000,000). On May 21, 2007, the registered
capital of Tsining was further increased to $17,000,000 (RMB
132,838,270).
On April
21, 2006, Tsining entered into and closed a share purchase agreement with
Pacific, incorporated in the state of Nevada in the United States of America.
Pursuant to the purchase agreement, Pacific acquired all of the issued and
outstanding capital stock of Tsining in exchange for 16,000,000 (post-split)
shares of Pacific’s common stock.
Concurrent
with the closing of the purchase agreement and as a condition thereof, Pacific
entered into an agreement with Deljit Bains and Davinder Bains, its then
executive officers, pursuant to which they each returned 4,000,000 (post-split)
shares (8,000,000 shares in total) of Pacific common stock to Pacific for
cancellation. They were not compensated in any way for the cancellation of their
shares of Pacific common stock. Upon completion of the foregoing transactions,
Pacific had an aggregate of 20,000,000 shares of common stock issued and
outstanding.
As a
result of the transaction, Tsining’s stockholders owned approximately 80% of the
combined company and the directors and executive officers of Tsining became the
directors and executive officers of Pacific. Accordingly, the transaction has
been accounted for as a reverse acquisition of Pacific by Tsining resulting in a
recapitalization of Tsining. Tsining was deemed to be the purchaser and
surviving company for accounting purposes.
On May 5,
2006, Pacific changed its name to China Housing & Land Development, Inc. and
the stockholders approved a stock dividend of seven shares for each share held,
which has been accounted for as an eight to one forward stock split. All shares
and per share data have been restated retrospectively.
On March
9, 2007, the Company acquired 100% of the equity of New Land.
New Land
was originally incorporated in September 2003 in Xi’an City in Shaanxi province,
China. In 2006, New Land entered into an agreement with the Baqiao District
Government of Xi’an City to develop Baqiao Science & Technology Industrial
Park (“Baqiao Park”), a provincial development zone in Shaanxi Province, to
establish a joint venture for New Land to develop and purchase approximately 487
acres in Baqiao Park. The agreement covers the period from July 2006 to June
2011. New Land is responsible for the installation and maintenance of all basic
infrastructure, including water, electricity, and gas supply, along with
telecommunication and sewer systems. In return, New Land has been given the
exclusive right to obtain 487 acres of land use rights (“Baqiao
Project”).
On June
19, 2007, New Land established Xi’an Hao Tai Housing Development Company Inc.
(“Hao Tai”) for the purpose of obtaining, developing, and trading land use
rights in China. Hao Tai is 100% owned by New Land and received its formal
business license from the government in July 2007.
On
November 10, 2008, the Company entered into a framework agreement with Prax
Capital China Real Estate Fund I, Ltd., (“Prax Capital”) to develop 79 acres
within the Company’s Baqiao Project site. Pursuant to the Agreement, as of
December 31, 2008, Prax Capital Real Estate Holdings Limited has invested
US$29,270,000 into Success Hill for an ultimate 25% interest in Puhua
with various distribution rights. Prax Capital’s interest is recorded as
minority interest in the consolidated financial statements. The Company holds
the remaining 75% interest in Puhua directly and indirectly through Manstate and
Success Hill.
- 47
-
Note
2—Restatement
of Security Registration Expenses
Pursuant
to the agreement with the investors of the 5% Senior Secured Convertible
Debt (Note 14), the Company was required to pay the
investors certain late registration payments (“Late Payments”) if the
Company failed to file a Registration Statement within 60 days after the
closing date of the 5% Senior Secured Convertible Debt. The Company commenced
negotiations with the investors of the 5% Senior Secured Convertible Debt to
waive the Late Payments in December 2008, as both parties believed that the
registration statement would become effective within a short period of
time. However, as the registration statement has not become effective as of
September 2009, the investors of the 5% Senior Secured Convertible Debt
have decided to claim the Late Payments. Because the Company failed to accrue
the Late Payments, the Company has restated the 2008 year end, 2009 quarter one
and 2009 quarter two consolidated financial statements to accrue the
corresponding expenses.
The
restatement had the following impact on the Company’s previously reported
results of operations for the year ended December 31, 2008:
|
For
The Year
Ended
December
31,
2008
|
||||
|
Security
registration expenses as previously reported
|
$ | - | ||
|
Adjustment
to accrue security registration expenses
|
613,483 | |||
|
Security
registration expenses as restated
|
$ | 613,483 | ||
|
Net
income as previously reported
|
$ | 9,396,289 | ||
|
Adjustment
to accrue security registration expenses
|
(613,483 | ) | ||
|
Net
income as restated
|
$ | 8,782,806 | ||
|
Basic
earnings per share
|
||||
|
As
previously reported
|
$ | 0.31 | ||
|
As
restated
|
$ | 0.29 | ||
|
Diluted
earnings per share
|
||||
|
As
previously reported
|
$ | 0.30 | ||
|
As
restated
|
$ | 0.28 | ||
|
December
31,
2008
|
||||
|
Accrued
security registration expenses as previously reported
|
$ | - | ||
|
Adjustment
to accrue security registration expenses
|
613,483 | |||
|
Accrued
security registration expenses as restated
|
$ | 613,483 | ||
Prior to
the restatement, the Company did not accrue the Late Payments. After the
restatement, the Company has presented the Late Payments as security
registration expenses.
Note
3 — Summary of Significant Accounting Policies
Principles
of Consolidation and Basis of Presentation
The
accompanying consolidated financial statements include the accounts of the
Company and its wholly owned subsidiaries, Tsining, New Land, Hao Tai and
Manstate, its 75% interest in Puhua and 60% interest in Success
Hill. All inter-company accounts and transactions have been eliminated on
consolidation. The accompanying consolidated financial statements have been
prepared in conformity with GAAP.
Use of
Estimates
The
preparation of financial statements in conformity with GAAP requires management
to make estimates and assumptions that affect the reported amounts of assets and
liabilities and disclosure of contingent assets and liabilities at the date of
the financial statements and the reported amounts of revenues and expenses
during the reporting period. Actual results could differ from those
estimates.
Reporting
Currency and Foreign Currency Translation
As of
December 31, 2008, the accounts of the Company and its Subsidiaries are
maintained in their functional currency, the Chinese Yuan Renminbi ("RMB"). The
consolidated financial statements of the Company have been translated into U.S.
dollars in accordance with Statement of Financial Accounting Standards (“SFAS”)
No.52, “Foreign Currency Translation”. According to SFAS No. 52, all assets and
liabilities of the Subsidiaries are translated at the exchange rate on the
balance sheet date, shareholders' equity is translated at the historical rates
and the statements of income and cash flows are translated at the weighted
average exchange rate for the year. The resulting translation adjustments are
reported under comprehensive income in accordance with SFAS No. 130, "Reporting
Comprehensive Income."
Foreign
exchange rates used:
|
December
31, 2008
|
December
31, 2007
|
December
31, 2006
|
||||||||||
|
Period end
RMB/U.S. Dollar exchange rate
|
6.8225
|
7.2946
|
7.8041
|
|||||||||
|
Average
RMB/U.S. Dollar exchange rate
|
6.9483
|
7.6058
|
7.9723
|
|||||||||
Revenue
Recognition
Effective
January 1, 2008, the Company changed its revenue recognition policy for sales of
development properties to the percentage of completion method. Previously, the
full accrual method was used. The percentage of completion method is based on
estimated costs incurred. The change is preferable as it accurately reflects the
business activity of the Company and matches revenues with the costs incurred in
the pursuit of such revenue. SFAS No. 154, "Accounting Changes and Error
Corrections," requires that a change in accounting policy be reflected through
retrospective application of the new accounting policy to all prior
periods, unless it is impracticable to do so. The Company has determined that
retrospective application to periods prior to January 1, 2008 is not practical
as the necessary information needed to restate prior periods is not available.
Therefore, the Company began to apply the percentage completion method on a
prospective basis beginning January 1, 2008.
Real
estate sales are reported in accordance with the provisions of SFAS No. 66,
"Accounting for Sales of Real Estate". Profit from the sales of real estate
properties, is recognized by the percentage of completion method on the sale of
individual units when all the following criteria are met:
|
a.
|
Construction
is beyond a preliminary stage.
|
|
b.
|
The
buyer is committed to the extent of being unable to require a refund
except for non-delivery of the unit or
interest.
|
|
c.
|
Sufficient
units have already been sold to assure that the entire property will not
revert to rental property.
|
|
d.
|
Sales
prices are collectible.
|
|
e.
|
Aggregate
sales proceeds and costs can be reasonably
estimated.
|
- 48
-
If any of
the above criteria is not met, proceeds shall be accounted for as deposits until
the criteria are met.
Under the
percentage of completion method, revenues from condominium units sold and
related costs are recognized over the course of the construction period, based
on the completion progress of a project. In relation to any project, revenue is
determined by calculating the ratio of incurred costs, including land use rights
costs and construction costs, to total estimated costs and applying that ratio
to the contracted sales amounts. Cost of sales is recognized by determining
the ratio of contracted sales during the period to total estimated sales value,
and applying that ratio to the incurred costs. Current period amounts are
calculated based on the difference between the life-to-date project totals and
the previously recognized amounts.
Significant
judgments and estimates related to applying the percentage of completion method
include the Company’s estimates of the time necessary to complete the project,
the total expected revenue and the total expected costs. Fluctuations in sale
prices and variances in costs from budgets could change the percentages of
completion and affect the amount of revenue and costs recognized. Changes in
total estimated project costs or losses, if any, are recognized in the period in
which they are determined. Revenue recognized to date in excess of amounts
received from customers is included in account receivable. As of December 31,
2008, the related account receivable balance was $299,745 ( 2007 and 2006 –
$Nil). Amounts received from customers in excess of revenue recognized to date
are classified as current liabilities under advances from customers. As of
December 31, 2008 and 2007, the related advances from customers were $9,264,385
and $5,258,351, respectively.
For
Company’s financed sales, the Company recognizes sales based on the full accrual
method provided that the buyer's initial and continuing investment is adequate
according to SFAS No. 66, “Accounting For Sales of Real Estate”. The initial
investment is the buyer's down-payment less the loan amount provided by the
Company. Interest on these loans is amortized over the term of the
loans.
For land
sales, the Company recognizes revenue when title of the land development right
is transferred and collectability is assured.
Real
estate rental income is recognized on the straight-line basis over the
terms of the tenancy agreements.
For the
reimbursement on infrastructure costs, the Company recognizes income, which is
at a value agreed to by the Company and the government of the PRC, when they
enter into a binding agreement.
Real
Estate Capitalization and Cost Allocation
Real
estate held for development or sale consists of residential and commercial units
under construction and units completed. Construction in progress includes costs
associated with development and construction of the Baqiao project, the JunJing
II project and prepayment paid on the Tang Du project.
The
Company leases land for the residential and commercial unit sites under land use
rights from the government of the PRC.
Real
estate held for development or sale is stated at cost or estimated net
realizable value, whichever is lower. Costs include land and land improvements,
direct construction costs and development costs, including predevelopment costs,
engineering costs, interest on indebtedness, real estate taxes, wages,
insurance, construction overhead and indirect project costs. All costs are
accumulated by specific projects and allocated to residential and commercial
units within the respective projects. Selling and advertising costs are expensed
as incurred. Total estimated costs of multi-unit developments are
allocated to individual units based upon specific identification
methods.
Land and
land improvement costs include cost of land use rights, land improvements, and
real estate taxes. Appropriate costs are allocated to projects on the basis of
acreage, dwelling units and relative sales value.
Land and
land improvements applicable to apartments and retail space are transferred to
construction in progress when construction commences.
When real
estate costs are determined to be impaired, they are written down to their
estimated net realizable value. The Company evaluates the carrying value for
impairment based on the undiscounted future cash flows of the assets.
Write-downs of real estate costs deemed impaired would be recorded as
adjustments to the cost basis. No impairment loss was incurred or recorded for
the year ended December 31, 2008 (December 31, 2007 - $Nil and 2006 -
$79,665).
- 49
-
No
depreciation is provided for construction in progress.
Capitalization
of Interest
In
accordance with SFAS No.34, “Capitalization of Interest Cost”, interest incurred
during and directly related to construction is capitalized to construction in
progress. All other interest is expensed as incurred.
For the
year ended December 31, 2008, interest incurred by the Company was
$4,659,778 (December 31, 2007 - $3,454,862 and 2006 - $2,245,021) and
capitalized interest for the same period was $3,313,595 (December 31, 2007
- $1,904,096 and 2006-$1,975,588).
Concentration
of Risks
The
Company sells residential and commercial units to residents and small business
owners and the Company sells land to other real estate developers. There was no
major customer that accounted for more than 5% of the sales for the year ended
December 31, 2008. One customer accounted for approximately 44% of accounts
receivable as at December 31, 2008. The Company had four major customers
that accounted for approximately 62% of the Company’s sales for the year ended
December 31, 2007. One of these customers accounted for 84% of
accounts receivable as at December 31, 2007. The Company has no major customer
that accounts for more than 5% of revenue for the year ended December 31,
2006.
The
Company is dependent on third-party sub-contractors, manufacturers, and
distributors for all of construction services and supply of construction
materials. Construction services or products purchased from the Company's five
largest subcontractors/suppliers accounted for 30% of total services and
supplies for the year ended December 31, 2008 (December 31, 2007 - 56%
and December 31, 2006 – 41%).
Accounts
payables to these subcontractors/suppliers amounted to $4,490,185 at December
31, 2008 (December 31, 2007 - $1,723,020).
The
Company's operations are carried out in the PRC. Accordingly, the Company's
business, financial condition and results of operations may be influenced by the
political, economic and legal environments in the PRC and by the general state
of the PRC’s economy. The Company's business may be influenced by changes in
governmental policies with respect to laws and regulations, anti-inflationary
measures, currency conversion and remittance abroad, and rates and methods of
taxation, among other things.
Cash and
Concentration of Risk
Cash
includes cash on hand and restricted cash in accounts maintained with
state-owned banks within the PRC. Total cash in state-owned banks at December
31, 2008 amounted to $38,230,352 (December 31, 2007 - $2,452,366) of which
no deposits are covered by insurance. The Company has not experienced any losses
in such accounts.
Restricted
Cash
The bank
grants mortgage loans to home purchasers and will transfer these amounts to the
Company's bank account once title passes. If the homes are not completed and the
new home owners have no ownership documents to secure the loan, the bank will
deduct 10% of the home owner's loan from the Company's bank account and transfer
that amount to a designated bank account classified on the balance sheet as
restricted cash. Interest earned on the restricted cash is credited to the
Company's normal bank account. The bank will release the restricted cash after
home purchasers have obtained the ownership documents to secure the mortgage
loan. Total restricted cash amounted to $805,012 as of December 31, 2008
(December 31, 2007 - $101,351).
Accounts
Receivable
Accounts
receivable consists of balances due from customers for the sale of residential
and commercial units in the PRC. The Company provides an allowance for doubtful
accounts equal to the estimated uncollectible amounts. The Company's estimated
uncollectible amounts are based on historical collection experience and a review
of the current status of trade accounts receivable. It is reasonably possible
that the Company's estimate of the allowance for doubtful accounts will
change. Accounts receivable are $813,122 at December 31, 2008 (December 31,
2007-$12,107,882). And the accounts receivable are presented net of an allowance
for doubtful accounts of $1,278,156 at December 31, 2008 (December 31, 2007
- $94,514).
- 50
-
Other
Receivables
Other
receivables consist of various cash advances to unrelated companies and
individuals. These amounts are not related to operations of the Company, are
unsecured, non-interest bearing and generally short term in nature. The balance
of other receivables after deduction of an allowance for doubtful accounts, was
$446,497 as of December 31, 2008 (December 31, 2007 - $567,308). Other
receivables are reviewed annually as to whether their carrying value has become
impaired. As of December 31, 2008, the Company has established an allowance for
doubtful accounts of $473,058 (December 31, 2007 - $190,372).
Notes
Receivable
The
Company finances sales to certain new homeowners with terms of one to three
years. These loans are non-interest bearing, therefore the Company has
discounted the carrying amount of notes receivable at the market mortgage rate
at 5.4% (2007 – 6.35%). Notes receivable are presented net of allowance for
doubtful accounts.
|
2008
|
2007
|
|||||||
|
Notes
receivable
|
$
|
859,682
|
$
|
1,036,75
|
||||
|
Less:
unamortized interest
|
(47,988
|
)
|
(88,857
|
)
|
||||
|
Notes
receivable, net
|
$
|
811,695
|
$
|
947,918
|
||||
Property
and Equipment
Property
and equipment are recorded at cost. Depreciation is computed using the
straight-line method over the estimated useful lives of the assets. Depreciation
expense for the year ended December 31, 2008, 2007 and 2006 amounted to
$454,728, $423,932 and $354,444 respectively. Depreciation expense was included
in the selling, general and administrative expenses and other income. Estimated
useful lives of the assets are as follows:
|
Estimated
Useful Life
|
|
|
Head
office buildings and improvements
|
30
years
|
|
Income
producing properties
|
21
- 30 years
|
|
Vehicles
|
6
years
|
|
Electronic
equipment
|
5
years
|
|
Office
furniture
|
5years
|
|
Computer
software
|
3
years
|
Maintenance
and repairs are charged directly to expenses as incurred. Major additions and
betterment to property and equipment are capitalized and depreciated over the
remaining useful life of the assets.
Asset
Held for Sale
The
Company intends to sell one of its fixed assets which consist of 13,609 square
meters of retail units with net book value of $14,308,691 as of December
31, 2008 (December 31, 2007 - $12,910,428) and the Company ceases depreciation
of the asset.
Long-lived
Assets
The
Company periodically evaluates the carrying value of long-lived assets to be
held and used in accordance with SFAS No. 144, “Accounting For Impairment on
Disposal of Long-Lived Assets” which requires impairment losses to be recorded
on long-lived assets used in operations when indicators of impairment are
present and the undiscounted cash flows estimated to be generated by those
assets are less than the assets' carrying amounts. In that event, a loss is
recognized based on the amount by which the carrying amount exceeds the fair
value of the long-lived assets. Loss on long-lived assets to be disposed of is
determined in a similar manner, except that fair values are reduced for the cost
of disposal. Based on its review, the Company believes there were no
impairments of its long-lived assets as of December 31, 2008 and
2007.
Advances
to Suppliers
Advances
to suppliers consist of amounts paid in advance to contractors and vendors for
services and materials. Advances amounted to $704,275 as of December 31,
2008 (December 31, 2007 - $2,071,549).
- 51
-
Deposits
on Land Use Rights
Deposits
on land use rights consist of deposits held by the PRC government to purchase
land use rights in Baqiao and other projects under planning. Deposits amounted
to $47,333,287 as of December 31, 2008 (December 31, 2007 -
$29,694,103).
Intangible
Assets
Intangible
assets relate to the development right for the 487 acres of land in Baqiao
Park obtained from the acquisition of New Land in fiscal 2007. The
intangible assets have a definite life. In accordance with SFAS No. 142,
“Goodwill and Other Intangible Assets”, the intangible assets are subject
to amortization over their useful life. The method of amortization selected
reflects the pattern in which the economic benefit of the intangible
assets are realized. The amortization of the intangible assets is based on
the percentage of profit margin realized over the total expected profit margin
to be realized from the 487 acres of land in the Baqiao project. The Company
reviews its business plan for its 487 acres of land in Baqiao Park
periodically and updates its assumptions based on the prevailing market prices
and the management’s judgments on the profit margins. This method is
intended to match the pattern of amortization with the income-generating
capacity of the assets.
As of
December 31, 2008, the amount recorded for its intangible assets were
$46,043,660 (December 31, 2007 - $48,205,697). The Company evaluates its
intangible assets for impairment whenever events or changes in circumstances
indicate the carrying value may not be recoverable. Based on estimated future
cash flows, the Company records a write-down for impairments, if
appropriate. For the year ended December 31, 2008, the Company has
recorded $0 (2007 - $1,157,758) of amortization on the intangible
asset.
Deferred
Financing Costs
Debt
issuance costs are capitalized as deferred financing costs and amortized on a
straight line basis over the term of the debt. The amortization expense for the
year ended December 31, 2008 was $148,606 (2007 and 2006 -$0). This
amortization expense was included in the general administrative
expense.
Fair
Value of Financial Instruments
Effective
January 1, 2008, the Company adopted SFAS No. 157, "Fair Value Measurements,"
(as impacted by FSP No. 157-1 and 157-2), which provides a framework for
measuring fair value under GAAP. As defined in SFAS No. 157, fair value is the
price that would be received to sell an asset or paid to transfer a liability in
an orderly transaction between market participants at the measurement date (exit
price). The Company utilizes market data or assumptions that the Company
believes market participants would use in pricing the asset or liability,
including assumptions about risk and the risks inherent in the inputs to the
valuation technique. These inputs can be readily observable, market corroborated
or generally unobservable.
The
Company primarily applies the market approach for recurring fair value
measurements and endeavors to utilize the best available information.
Accordingly, the Company utilizes valuation techniques that maximize the use of
observable inputs and minimize the use of unobservable inputs. The Company is
able to classify fair value balances based on the observability of those
inputs.
SFAS No.
157 establishes a fair value hierarchy that prioritizes the inputs used to
measure fair value. The hierarchy gives the highest priority to unadjusted
quoted prices in active markets for identical assets or liabilities (Level 1
measurement) and the lowest priority to unobservable inputs (Level 3
measurement). The three levels of the fair value hierarchy defined by SFAS No.
157 are as follows:
|
Level
1
|
Quoted
prices are available in active markets for identical assets
or liabilities as of the reporting date. Active markets are those
in which transactions for the asset or liability occur in
sufficient frequency and volume to provide pricing information on an
ongoing basis. Level 1 primarily consists of financial instruments
such as exchange-traded derivatives, listed equities and U.S.
government treasury
securities.
|
|
Level
2
|
Pricing
inputsare other than quoted prices in active markets included in
Level 1, which are either directly or indirectly observable as of the
reporting date. Level 2 includes those financial instruments that are
valued using models or other valuation methodologies. These
models are primarily industry-standard models that consider
various assumptions, including quoted forward prices for commodities,
time value, volatility factors, and current market and contractual
prices for the underlying instruments, as well as other relevant
economic measures. Substantially all of these assumptions are
observable in the marketplace throughout the full term of the
instrument, can be derived from observable data or are supported by
observable levels at which transactions are executed in the
marketplace. Instruments in this category include non-exchange-traded
derivatives such as over the counter forwards, options and repurchase
agreements.
|
|
Level
3
|
Pricing
inputs include significant inputs that are generally less observable
from objective sources. These inputs may be used with internally
developed methodologies that result in management's best estimate of
fair value from the perspective of a market participant. Level 3
instruments include those that may be more structured or otherwise
tailored to customers' needs. At each balance sheet date, the
Company performs an analysis of all instruments subject to SFAS No.
157 and includes in Level 3 all of those whose fair value is based on
significant unobservable
inputs.
|
- 52
-
Assets
and liabilities measured at fair value on a recurring basis include the
following as of December 31, 2008:
|
Fair Value Measurements
Using
|
Assets/Liabilities
|
|||||||||||||||
|
Level 1
|
Level 2
|
Level3
|
At Fair Value
|
|||||||||||||
|
Warrants
liabilities
|
-
|
$
|
1,117,143
|
-
|
$
|
1,117,143
|
||||||||||
|
Derivative
liabilities
|
-
|
760,398
|
-
|
760,398
|
||||||||||||
|
Total
|
-
|
$
|
1,877,541
|
-
|
$
|
1,877,541
|
||||||||||
Accounts
Payable
Accounts
payable consists of balances due to subcontractors and suppliers for the
purchase of construction services and the Baqiao government for land use rights.
Accounts payable amounted to $10,525,158 at December 31, 2008 (December 31,
2007 - $9,311,995).
Advances
from Customers
Advances
from customers represent prepayments by customers for home purchases. The
Company records such prepayments as advances from customers when the payments
are received. The balance is reduced by the percentage of revenue recognized.
Advances from customers amounted to $9,264,385 at December 31, 2008
(December 31, 2007 - $5,258,351).
Other
Payables
Other
Payables consist of balances for non-construction costs with unrelated companies
and individuals. These amounts are unsecured, non-interest bearing and short
term in nature. Other payables amounted to $5,183,251 as of December 31,
2008 (December 31, 2007 - $3,881,137) of which, $731,087 is
payable for JV set up (2007 -$Nil).
Advertising
Costs
Advertising
and sales promotion costs are expensed as incurred. Advertising expense for the
year totaled $1,261,495 (2007 - $781,998 and 2006 - $565,577)
Warranty
Costs
Generally,
the Company provides all of its customers with a limited (half a year to 5
years) warranty period for defective workmanship. The Company accrues the
estimated warranty costs into the cost of its homes as a liability after each
project is closed based on the Company's historical experience, which normally
is less than 0.2% of total costs of the project. Any excess amounts are expensed
in the period when they occur. Any significant material defects are generally
under warranty with the Company's suppliers. Currently, the Company retains 5%
of the total construction contract from the construction contractors for a
period of one year after the completion of the construction. Such retention
amounts will be used to pay for any repair expense incurred due to defects in
the construction. The Company has not historically incurred any significant
litigation requiring additional specific reserves for its product offerings. As
of December 31, 2008 and 2007, the Company did not accrue for warranty
costs.
Income
Taxes
The
Company utilizes SFAS No. 109, "Accounting for Income Taxes," which requires the
recognition of deferred tax assets and liabilities for the expected future tax
consequences of events that have been included in the financial statements or
tax returns. Under this method, deferred income taxes are recognized for
the tax consequences in future years of differences between the tax bases of
assets and liabilities and their financial reporting amounts at each period end
based on enacted tax laws and statutory tax rates applicable to the periods
in which the differences are expected to affect taxable income. Valuation
allowances are established, when necessary, to reduce deferred tax assets to the
amount expected to be realized. At December 31, 2008 and 2007 the
significant accounting to tax difference was related to the intangible assets
which have no tax value.
- 53
-
The
Company adopted the provisions of FASB Interpretation No. 48, "Accounting for
Uncertainty in Income Taxes, an Interpretation of FASB Statement No. 109", ("FIN
48"), on January 1, 2007. The Company did not have any material unrecognized tax
benefits and there was no effect on its financial condition or results of
operations as a result of implementing FIN 48. During fiscal 2008, the Company
settled a prior year income tax liability with the PRC local tax authority
resulting in a gain of $12,712,153 included in the provision for income taxes.
The local tax authority examined the Company’s tax records and issued an income
tax settlement report. Management believes there is only a remote possibility
that the local tax authority or higher tax authority will reassess the tax
settlement.
The
Company files income tax returns in the PRC jurisdictions. The Company does not
believe there will be any material changes in its unrecognized tax positions
over the next 12 months.
The
Company's policy is to recognize interest and penalties accrued on any
unrecognized tax liability as a component of general and administrative expense.
As of the date of adoption of FIN 48, the Company did not have any accrued
interest or penalties associated with any unrecognized tax rate differences from
the federal statutory rate primarily due to non-deductible expenses, temporary
differences and preferential tax treatment. No assessments of income taxes
for the years ended December 31, 2008, 2007 and 2006 have been received by
the Company, except for the income tax settlement report issued by local tax
authority as previously described.
PRC and
Local Income Tax
The
subsidiaries of the Company are governed by the Income Tax Laws of the PRC
concerning Chinese registered limited liability companies. Under the Income Tax
Laws of the PRC, Chinese enterprises are generally subject to income tax at a
statutory rate of 25% on income reported in the statutory financial statements
after appropriate tax adjustments, unless the enterprise is located in a
specially designated region for which more favorable effective tax rates are
applicable. New Land and Hao Tai are entitled to a refund of 6% of taxes
otherwise payable if they meet certain annual earning criteria.
The
provision for income taxes for the year ended December 31, 2008, 2007 and 2006
consisted of the following:
|
2008
|
2007
|
2006
|
||||||||||
|
(Recovery)
provision for China income and local tax
|
$
|
(10,490,833
|
)
|
$
|
9,125,616
|
$
|
4,511,442
|
|||||
|
Provision
of deferred taxes
|
-
|
(382,060
|
)
|
-
|
||||||||
|
Total
(recovery) provision for income taxes
|
$
|
(10,490,833
|
)
|
$
|
8,743,556
|
$
|
4,511,442
|
|||||
|
2008
|
2007
|
2006
|
||||||||||
|
(Loss)
income before provision for income taxes
|
$
|
(1,708,027
|
)
|
$
|
25,429,672
|
$
|
13,562,252
|
|||||
|
U.S.
statutory rate of 34%
|
(580,729
|
)
|
8,646,088
|
4,611,166
|
||||||||
|
Foreign
loss (income) not recognized in USA
|
2,092,057
|
(9,766,843
|
)
|
(4,611,166
|
)
|
|||||||
|
Non-taxable
income and non-deductible expense
|
(2,215,948
|
)
|
819,055
|
-
|
||||||||
|
Foreign
(loss) income tax rate of 25% (2007 and 2006 -33%)
|
(1,538,277
|
)
|
9,541,001
|
4,511,442
|
||||||||
|
Favorable
foreign income tax settlement
|
(12,712,153
|
)
|
-
|
-
|
||||||||
|
Tax
on favorable foreign income tax settlement
|
3,170,407
|
-
|
-
|
|||||||||
|
Tax
incentive on New Land and Hao Tai
|
-
|
(344,133
|
)
|
-
|
||||||||
|
Recovery
of future income tax provision
|
(382,060
|
)
|
||||||||||
|
Change
in valuation allowance
|
1,293,810
|
230,448
|
-
|
|||||||||
|
(Recovery)
provision for income taxes
|
(10,490,833
|
)
|
8,743,556
|
4,511,442
|
||||||||
- 54
-
Deferred
Tax
The tax
effects of temporary differences that give rise to the Company’s deferred tax
liability as of December 31, 2008 and December 31, 2007 are as
follows:
|
2008
|
2007
|
|||||||
|
Deferred
tax asset
|
||||||||
|
Non-capital
losses
|
1,530,488
|
236,678
|
||||||
|
Valuation
allowance
|
(1,530,488
|
)
|
(236,678
|
)
|
||||
|
Net
deferred tax asset
|
-
|
-
|
||||||
|
Deferred
tax liability
|
||||||||
|
Temporary
difference related to intangible asset
|
$
|
15,907,880
|
$
|
15,907,880
|
||||
|
Foreign
exchange rate change
|
(4,396,965
|
)
|
||||||
|
Net
deferred tax liability
|
$
|
11,510,915
|
$
|
15,907,880
|
||||
As of
December 31, 2008, the Company has PRC subsidiaries that are in the start up
stage and have a net operating loss carry forward of approximately
$2,356,757, which will begin to expire in 2013. The Company also has a U.S.
net operating loss carry forward of approximately $2,768,525 from the
holding company, which will begin to expire in 2026. A
valuation allowance for the full amount was recognized.
Basic and
Diluted Earnings Per Share
Earnings
per share is calculated in accordance with the SFAS No. 128, "Earnings per
Share". Basic net earnings per share are based upon the weighted average number
of common shares outstanding. Diluted net earnings per share are based on the
assumption that all dilutive convertible shares, stock options and warrants were
converted or exercised. Dilution is computed by applying the treasury stock
method.
Under
this method, options and warrants are assumed to be exercised at the beginning
of the period (or at the time of issuance, if later), and as if funds obtained
thereby were used to purchase common stock at the average market price during
the year.
Minority
Interest
Minority
interest is attributable to the minority shareholders of Puhua and Success Hill.
Minority interests in net income and losses are generally subtracted from or
added to arrive at consolidated net income.
Share
Based Compensation
The
Company records stock-based compensation pursuant to Statement of Financial
Accounting Standard No. 123 (revised 2004), “Share-Based Payments,” (“FAS123R”),
which established standards for the accounting for transactions in which an
entity exchanges its equity instruments for goods or services. This statement
requires companies to measure the cost of services received in exchange for an
award of equity instruments based on the grant-date fair value of the award. The
cost is recognized over the period of services rendered.
Comprehensive
Income
Comprehensive
income consists of net income and foreign currency translation gains and losses
affecting shareholders' equity that, under GAAP, are excluded from net income.
The gain on foreign exchange translations totaled $5,882,178, $3,617,405 and
$655,435 for the year ended December 31, 2008, 2007 and 2006,
respectively.
Statement
of Cash Flows
In
accordance with SFAS No. 95, "Statement of Cash Flows," cash flows from the
Company's operations are calculated based upon the local currencies translated
at the weighted average exchange rate for the year. As a result, amounts related
to assets and liabilities reported on the statement of cash flows will not
necessarily agree with changes in the corresponding balances on the balance
sheet.
- 55
-
Accounting
Principles Recently Adopted
SFAS No.
159, "The Fair Value Option for Financial Assets and Financials Liabilities —
Including an Amendment of FASB Statement No.115" issued by FASB in February
2007, permits measurement of certain financial assets and financial liabilities
at fair value. If the fair value option is elected, the unrealized gains and
losses are reported in earnings at each reporting date. Generally, the fair
value option may be elected on an instrument by instrument basis, as long as it
is applied to the instrument in its entirety. The fair value option election is
irrevocable, unless a new election date occurs. SFAS No. 159 requires
prospective application and certain additional presentation and disclosure
requirements. The adoption on January 1, 2008 of this statement did not have a
material impact on the Company's consolidated financial statements.
Recent
Accounting Pronouncements
In
December 2007, the FASB issued SFAS No. 141(R), "Business Combinations" which
revised SFAS No. 141, "Business Combinations". SFAS No. 141(R) establishes
principles and requirements for how an acquirer recognizes and measures in its
financial statements the identifiable assets acquired, the liabilities assumed,
any non-controlling interest in the acquirer and the goodwill acquired. SFAS No.
141(R) also establishes disclosure requirements which will enable users to
evaluate the nature and financial effects of the business combination. This
standard is effective for fiscal years beginning after December 15, 2008. As the
provisions of SFAS No. 141(R) are applied prospectively, the impact of this
standard cannot be determined until the transactions occur.
In
December 2007, the FASB issued SFAS No. 160, "Noncontrolling Interests in
Consolidated Financial Statements". SFAS No. 160 establishes accounting and
reporting standards for ownership interests in subsidiaries held by parties
other than the parent, the amount of consolidated net income attributable to the
parent and to the noncontrolling interest, changes in a parent's ownership
interest and the valuation of retained noncontrolling equity investments when a
subsidiary is deconsolidated. SFAS No. 160 also establishes reporting
requirements that provide sufficient disclosures that clearly identify and
distinguish between the interests of the parent and the interests of the
noncontrolling owners. This standard is effective for fiscal years
beginning after December 15, 2008. The Company is currently evaluating the
impact of the adoption of SFAS No. 160.
In March
2008, the FASB issued SFAS No. 161, "Disclosures about Derivative Instruments
and Hedging Activities" ("SFAS No. 161"). SFAS No. 161 amends and expands the
disclosure requirements of FASB Statement 133, "Accounting for Derivative
Instruments and Hedging Activities" ("SFAS No. 133") to require qualitative
disclosures about objectives and strategies for using derivatives, quantitative
disclosures about fair value amounts of and gains and losses on derivative
instruments, and disclosures about credit risk-related contingent features in
derivative agreements. The Statement is effective for financial statements
issued for fiscal years and interim periods beginning after November 15, 2008.
Early application is encouraged. The Company is currently evaluating the impact
of the adoption of SFAS No. 161.
In April
2008, the FASB issued FSP SFAS 142-3, "Determination of the Useful Life of
Intangible Assets" ("FSP 142-3"). This guidance is intended to improve the
consistency between the useful life of a recognized intangible asset under SFAS
No. 142, "Goodwill and Other Intangible Assets" ("SFAS 142"), and the period of
expected cash flows used to measure the fair value of the asset under SFAS 141R
when the underlying arrangement includes renewal or extension of terms that
would require substantial costs or result in a material modification to the
asset upon renewal or extension. Companies estimating the useful life of a
recognized intangible asset must now consider their historical experience in
renewing or extending similar arrangements or, in the absence of historical
experience, must consider assumptions that market participants would use about
renewal or extension as adjusted for SFAS 142's entity-specific factors. FSP
142-3 is effective for for financial statements issued for fiscal years and
interim periods beginning January 1, 2009. The Company is currently evaluating
the potential impact of the adoption of FSP 142-3.
In May
2008, the FASB issued SFAS No. 162, "The Hierarchy of Generally Accepted
Accounting Principles." SFAS No. 162 identifies the sources of accounting
principles and the framework for selecting the principles to be used in the
preparation of financial statements of nongovernmental entities that are
presented in conformity with GAAP. SFAS No. 162 bacame effective on November 15,
2008. The Company is currently evaluating the potential impact of the adoption
of SFAS No. 162.
In May
2008, the FASB issued FASB FSP APB 14-1, "Accounting for convertible debt
Instruments That May Be Settled in Cash upon Conversion (Including Partial Cash
Settlement)". FSP APB 14-1 requires the issuer of certain Convertible Debt
instruments that may be settled in cash (or other assets) on conversion to
separately account for the liability (debt) and equity (conversion option)
components of the instrument in a manner that reflects the issuer's
non-Convertible Debt borrowing rate. Such separate accounting also requires
accretion of the resulting discount on the liability component of the debt to
result in interest expense equal to an issuer`s nonconvertible debt borrowing
rate. In addition, the FSP provides for certain changes related to the
measurement and accounting related to derecognition, modification or exchange.
FSP APB 14-1 is effective for fiscal years beginning after December 15, 2008 on
a retroactive basis. The adoption of FASB FSP APB 14-1 is not expected to have a
significant impact on the Company’s consolidated financial
statements.
- 56
-
In
September 2008, the FASB issued FSP EITF 03-6-1, "Determining Whether
Instruments Granted in Share-Based Payment Transactions Are Participating
Securities." FSP EITF 03-6-1 addresses whether instruments granted in
share-based payment transactions are participating securities prior to vesting
and, therefore, need to be included in the earnings allocation in computing
income per share under the two-class method pursuant to SFAS No. 128, "Earnings
per Share." This guidance establishes that unvested share-based payment awards
that contain nonforfeitable rights to dividends or dividend equivalents (whether
paid or unpaid) are participating securities and shall be included in the
computation of earnings per share pursuant to the two-class method. FSP EITF
03-6-1 is effective for financial statements issued for fiscal years beginning
after December 15, 2008. Furthermore, all prior period earnings per share data
presented shall be adjusted retrospectively to conform to the provisions of FSP
EITF 03-6-1. The Company is currently evaluating the potential impact of the
adoption of FSP EITF 03-6-1.
Note
4 — Acquisition
On March
9, 2007, the Company entered into a Share Transfer Agreement (the “Agreement”)
to acquire RMB 32 million of registered and paid-in capital of New Land,
representing 100% equity ownership of New Land. The acquisition was effective on
May 31, 2007. The total purchase price for the acquisition was RMB 270
million, (approximately $35.2 million). The total purchase price included 1) an
initial cash payment of RMB 5 million, (approximately $0.6 million), payable
within 20 days after the signing of the Agreement, 2) an additional cash payment
of RMB 57 million, approximately $7.4 million, within 30 days of the
receipt of the due diligence report and 3) a promissory note of the aggregate
amount of RMB 208 million, (approximately $27.2 million), bearing 10% interest
with a maturity of January 30, 2009. As of December 31, 2008, the remaining
balance of the above note payable under the Agreement amounted to $5,606,449
(2007 - $8,717,684) (see note 10) and New Land’s original shareholders have
agreed to extend the loan to December 31, 2009.
The
Company accounted for the business combination using the purchase method of
accounting pursuant to SFAS No. 141, “Business Combinations”. The purchase price
was allocated to the identifiable assets and liabilities assumed based on their
estimated fair values.
|
Purchase
Price
|
$
|
35,286,737
|
||
|
Value
assigned to assets and liabilities:
|
||||
|
Assets:
|
||||
|
Cash
|
$
|
50,390
|
||
|
Other
receivables
|
20,318
|
|||
|
Equipment
|
102,577
|
|||
|
Work
in progress
|
6,448,748
|
|||
|
Prepayment
|
224,597
|
|||
|
Intangible
assets
|
47,107,396
|
|||
|
Liabilities:
|
||||
|
Accounts
payable
|
(963,233
|
)
|
||
|
Other
payables
|
(2,100,310
|
)
|
||
|
Accrued
expenses
|
(58,304
|
)
|
||
|
Deferred
tax
|
(15,545,441
|
)
|
||
|
Total
net assets
|
$
|
35,286,637
|
The
operations of New Land, starting from June 1, 2007, are included in the
Company’s consolidated financial statements.
Note
5 — Supplemental Disclosure of Cash Flow Information
Income
taxes paid amounted to $225,964, $384,615 and $0 for the year ended December 31,
2008, 2007 and 2006, respectively. Interest paid for the year ended December 31,
2008, 2007 and 2006 amounted to $3,724,070, $1,975,917 and $2,147,800
respectively.
- 57
-
Note
6 – Real Estate
The
following summarizes the components of real estate inventories as at December
31, 2008 and 2007:
|
2008
|
2007
|
|||||||
|
Finished
projects
|
$
|
10,181,827
|
$
|
16,130,130
|
||||
|
Construction
in progress
|
50,468,184
|
24,856,801
|
||||||
|
Total
real estate held for development or sale
|
$
|
60,650,011
|
$
|
40,986,931
|
||||
Note
7 — Accounts Receivable
Accounts
receivable consist of the following as at December 31, 2008 and
2007:
|
2008
|
2007
|
|||||||
|
Accounts
receivable
|
$
|
2,691,278
|
$
|
12,202,396
|
||||
|
Allowance
for doubtful accounts
|
(1,278,156
|
)
|
(94,514
|
)
|
||||
|
Accounts
receivable, net
|
$
|
813,122
|
$
|
12,107,882
|
||||
Note
8 — Other Receivables, Prepaid Expenses and Other Assets
Other
receivables, prepaid expenses and other assets consist of the following as at
December 31, 2008 and 2007:
|
2008
|
2007
|
|||||||
|
Other
receivables
|
$
|
916,886
|
$
|
749,890
|
||||
|
Allowance
for bad debts
|
(473,058
|
)
|
(190,372
|
)
|
||||
|
Prepaid
expenses
|
2,669
|
7,790
|
||||||
|
Other
receivables, prepaid expense other assets
|
$
|
446,497
|
$
|
567,308
|
||||
Note
9 — Property and Equipment, Net
Property
and equipment consist of the following as at December 31, 2008 and December 31,
2007:
|
2008
|
2007
|
|||||||
|
Head
office buildings and improvements
|
$
|
3,234,628
|
$
|
1,018,494
|
||||
|
Income
producing properties
|
24,588,347
|
18,469,852
|
||||||
|
Electronic
equipment
|
238,422
|
195,244
|
||||||
|
Vehicles
|
71,140
|
87,740
|
||||||
|
Office
furniture
|
183,939
|
119,960
|
||||||
|
Computer
software
|
91,272
|
48,180
|
||||||
|
Totals
|
28,407,748
|
19,939,470
|
||||||
|
Accumulated
depreciation
|
(1,707,556
|
)
|
(1,322,030
|
)
|
||||
|
Net
book value of assets held for sale
|
(14,308,691
|
)
|
(12,910,428
|
)
|
||||
|
Property
and equipment, net
|
$
|
12,391,501
|
$
|
5,707,012
|
||||
During
the years ended December 31, 2208 and 2007, no depreciation was recorded with
respect to the assets held for sale.
- 58
-
Note
10 — Intangible assets
Intangible
asset consists of the following as at December 31, 2008 and 2007:
|
2008
|
2007
|
|||||||
|
Intangible
acquired
|
$
|
47,334,342
|
$
|
49,412,847
|
||||
|
Accumulated
amortization
|
(1,290,682
|
)
|
(1,207,150
|
)
|
||||
|
Intangible
assets, net
|
$
|
46,043,660
|
$
|
48,205,697
|
||||
Note
11 – Loans payable to New Land’s previous shareholders
The
Company has loans payable to previous shareholders of New Land totaling to
$8,429,889 at December 31, 2008 (December 31, 2007 - $11,413,229). $5,606,449
(2007 - $8,717,684) of the total relates to the acquisition of New Land (see
note 3) and is due in December 2009. The remaining balance pertains to
additional loans made by these shareholders and is due in December 2009. The
loans bear interest at 10% per annum.
Note
12 — Loans from Employees
The
Company has borrowed monies from certain employees to fund the Company's
construction projects. These loans bear interest at rates ranging between 7% and
12% and all principal amounts matures in 2009. At December 31, 2008, loans from
employees amounted to $1,517,039 (December 31, 2007 - $2,388,862).
Note
13 — Loans Payable
Loans
payable represent amounts due to various banks and are due on demand or within
three years. These loans generally can be renewed with the banks when they
mature. Loans payable at December 31, 2008 and December 31, 2007 consisted of
the following:
|
2008
|
2007
|
|||||||
|
Commercial
Bank Weilai Branch
|
||||||||
|
Due
August 29, 2008, annual interest rate is at 11.34 percent, secured by the
Company's Xin Xing Gangwan, Xin Xing Tower and Ming Yuan Yuan
projects
|
$
|
-
|
$
|
5,209,333
|
||||
|
Commercial
Bank Weilai Branch
|
||||||||
|
Due
December 25, 2009, annual interest is at 9.47 percent, secured by the
Company's 24G projects
|
5,130,084
|
5,483,508
|
||||||
|
Commercial
Bank Weilai Branch
|
||||||||
|
Due
August 29, 2010, annual interest is at 10.21 percent, guaranteed by
Tsining and secured by the Company's Xin Xing Tower and part of the
JunJing II project
|
5,130,084
|
-
|
||||||
|
Xi'an
Rural Credit union Zao Yuan Rd. Branch
|
||||||||
|
Due
September 14, 2009, annual interest is at 9.527 percent, secured by the
Company's Jun Jing Yuan I, Han Yuan and Xin Xing Tower
projects
|
3,371,198
|
3,427,193
|
||||||
|
China
Construction Bank, Xi'an Branch
|
||||||||
|
Due
August 27, 2011, annual interest is at floating interest rate based on
110% of People’s Bank of China rate, secured by the Company's Jun Jing
Yuan II project
|
21,986,076
|
-
|
||||||
|
Total
|
$
|
35,617,442
|
$
|
14,120,034
|
||||
All loans
were borrowed for construction projects. All interest paid was capitalized and
allocated to JunJing II project.
On June
28, 2008, the Company signed a strategic partnership Memorandum of Understanding
(“MOU”) with China Construction Bank Xi’an Branch that established a RMB 1
billion (approximately US$147 million) credit line for real estate development
by the Company and its subsidiaries. Under the MOU, the company and
its subsidiaries are required to set up a basic deposit account with China
Construction Bank, to maintain a current ratio of not less than 90% and to
maintain liabilities to assets ratio of not greater than 65%. On August 28,
2008, the Company entered a loan agreement with China Construction Bank Xi’an
Branch to draw down the first RMB 150 million loan, which will mature
on August 27, 2011. $21,986,075 (RMB 150 million) was received by the
Company on December 31, 2008. As of December 31, 2008, our current ratio was
approximately 136.3%, and our liabilities to assets ratio
was approximately 49.1%. The Company will be able to draw down
approximately another $101 million before we reach the maximum liabilities
to assets ratio of 65%. If we are unable to meet all above covenants, we may not
be able to draw down new loans from China Construction Bank and this will cause
the delay of our projects under construction.
- 59
-
Note
14 - Convertible Debt
On
January 28, 2008, the Company issued Senior Secured Convertible Debt due in 2013
(the "Convertible Debt") and warrants to subscribe for common shares for an
aggregate purchase price of US$20 million. The Convertible Debt bears interest
at 5% per annum (computed based on the actual days elapsed in a period of 360
days) of the RMB notional principle amount, payable quarterly in arrears in U.S.
Dollars on the first business day of each calendar quarter and on the maturity
date. In addition, 1,437,467 five-year warrants were granted with a strike price
of $6.07 per common share, which are callable if certain stock price thresholds
are met. Approximately 215,620 warrants are also available as a management
incentive if certain milestones are met. If the aggregate principal amount of
the Convertible Debt is reduced to US$10 million or less as a result
of repayment by the Company pursuant to the Convertible Debt as a result of any
optional conversion by the Investors or mandatory conversion by the Company of
the Convertible Debt, then each Investor agrees to surrender to the Company
warrants for an aggregate number of shares of common stock equal to such
Investors’ pro rata share of 107,810 shares. If the aggregate principal amount
of the Convertible Debt is reduced to $Nilas a result of repayment by the
Company pursuant to the Convertible Debt as a result of any optional conversion
by the Investors or mandatory conversion by the Company of the Convertible Debt,
then each Investor agrees to surrender to the Company warrants in addition to
the 107,810 warrants surrendered pursuant to the $10 million reduction
noted above for an aggregate number of shares of common stock equal to such
Investor’s pro rata share of 107,810 shares. The Company may hold in treasury
and reissue to the officers and directors of the Company any warrants
surrendered by the Investors. As of October 28, 2009, the Company did
not repay any principle of Convertible Debt and the Investors did not
deliver any optional conversion request to the Company.
The
Investors have the right to convert up to 45% ($9 million) of the
principal amount of the Convertible Debt into common shares at an initial
conversion price of $5.57, subject to an upward adjustment. The Company, at
its discretion, may redeem the remaining $11 million of Convertible Debt at
100% of the principle amount, plus any accrued and unpaid interest. The
warrants associated with the Convertible Debt grant the Investors the right
to acquire shares of common stock at $6.07 per share, subject to customary
anti-dilution adjustments. The warrants may be exercised to purchase common
stock at any time up to and including February 28, 2013.
The
Convertible Debt is secured by a first priority, perfected security
interest in certain shares of common stock of Lu Pingji, the
Chairman of the Company. The Convertible Debt is subject to events of
default customary for convertible securities and for a secured
financing.
Both the
warrant and embedded conversion option associated with the Convertible Debt meet
the definition of a derivative instrument according to FASB No. 133, ”Accounting
for Derivative Instruments and Hedging Activities”. Because the
warrant and the convertible debt are denominated in U.S. dollars but the
company’s functional currency is the Chinese Renminbi, the exemption from
derivative instrument accounting provided by FASB No. 133, paragraph 11(a)(1) is
not available and therefore the warrant and embedded conversion option are
recorded as a derivative instrument liability and periodically marked-to-market.
The fair value of the warrants and embedded conversion option on inception were
determined to be $3,419,653 and $3,927,375, respectively, using the
Cox-Ross-Rubinstein Binomial Lattice Model (the “CRR Model”) with the following
assumptions: expected life 4.32 years, expected volatility - 75%, risk free
interest rate - 2.46% and dividend rate - 0%. The fair value of the warrants and
embedded conversion option at December 31, 2008 were determined to be of
$658,682 and $760,398, respectively, using the CRR Model with the following
assumption: expected life 4.08 - 4.16 years, expected volatility - 90%, risk
free interest rate - 1.31%-1.33% and dividend rate - 0%. For the year ended
December 31, 2008, the Company recorded a change in fair value for the warrants
and embedded derivatives of $(2,760,971) and $(3,166,977), respectively in the
consolidated statement of income and comprehensive income.
- 60
-
After
allocating the gross proceeds to the fair value of the warrants and the embedded
derivative instrument, the remaining proceeds were allocated as the initial
carrying value of the Convertible Debt. The initial carrying value of the
Convertible Debt is accreted to its stated amount on maturity using the
effective interest method. The effective interest rate was determined to be
15.42%. The carrying value of Convertible Debt at December 31, 2008 was
$13,621,934. Related interest expense and accretion expense for the year ended
December 31, 2008 were $964,897 and $968,962, respectively.
In
connection with this transaction, the Company and the Investors entered into a
registration rights agreement (the “Registration Rights Agreement”). Pursuant to
the terms and conditions of the Registration Rights Agreement, the Company
agreed to register within 60 calendar days after closing shares of common stock
issuable to the Investors for resale on a Form S-3 Registration Statement to be
effective no later than the 180th day after the closing date of the transaction.
If the Form S-3 is not available at that time, then the Company will file a
Registration Statement on such form as is then available to effect a
registration of the registrable securities, subject to the consent of the
Investors, which consent will not be unreasonably withheld. The Company shall
register an amount of common stock for resale that equals at least 125% of the
sum of shares issuable upon conversion of the Convertible Debt and the exercise
of the warrants. The registration rights granted under the Registration Rights
Agreement are subject to customary exceptions and qualifications and compliance
with certain registration procedures. The Company is subject to the late
registration penalty payment (the “Late Payments”) equal to the product of (i)
the Investor’s outstanding principal amount and (ii) the quotient obtained by
dividing 12% by 360.
The
Company commenced negotiations with the Investors in December 2008 for a waiver
for the Late Payments, as the Company and the Investors believed that the
registration would become effective within a short period of time. However, as
the registration has not become effective as of September 2009, the Company has
accrued for the Late Payments (see Note 2). On September 28, 2009, the Company
reached a First Amendment (the “Amendment”) with the Investors to settle the
Late Payments, in the amount of $2,400,000, by the issuance of 614,290 common
stock. The 614,290 common stock was determined by dividing $2,400,000, the total
Late Payments up to September 28, 2009, by 95% of the historical volume weighted
average price (“VWAP”) of the common stock, as determined by using Bloomberg
function VWAP, for the immediate preceding 30 days period. In accordance with
the Amendment, the Investors waived any further Late Payments against the
Company under the Registration Rights Agreement.
Note
15 — Minority interest
Minority
interest consists of the interest of minority shareholders in the subsidiaries
of the Company. As of December 31, 2008 minority interest amounted to
$29,109,350 (December 31, 2007 - $Nil).
On
November 5, 2008, the Company and Prax Capital entered into a conditional joint
agreement to develop 79 acres within China Housing’s Baqiao project located in
Xi’an. Prax Capital invested US$ 29.3 million for a 25% interest in Puhua with
various distribution rights by acquiring 1,000 Class A shares of Success Hill.
Prax Capital’s Class A Shares in Success Hill are redeemable at the option of
holder, provided that Prax gives advance notice, and with the Company’s
approval. Prax has the first right of the distribution on profits, commencing
with a cumulative annual return rate of 25% for their equity ownership, capped
out at an additional 10% based on the success of the development and on the
market conditions. At this time, the company believes that it is not probable
that Prax Capital will exercise their redemption option.
Under FAS
150, “Accounting for Certain Financial Instruments with Characteristics of Both
Liabilities and Equity” the shares with the redeemable feature are not
classified as a liability since they are not mandatorily
redeemable.
Rule
5-02.28 of Regulation S-X (and ASR 268) specifically requires preferred
securities that are redeemable for cash or other assets to be classified outside
of permanent equity if they are contractually redeemable 1) at a fixed or
determinable price on a fixed or determinable date or dates, 2) at the option of
the holder, or 3) upon the occurrence of an event that is not solely within the
control of the issuer.
As Prax’s
put option provides them the right to sell the Preferred Shares back to the
Company, the Preferred Shares meet 2) “at the option of the holder” above. As
such, the Class A shares in Success Hill should be classified as mezzanine
equity.
On
November 5, 2008, the Company entered into a Deed of Guarantee (the
“Guarantee”), in favor of Prax Capital and Success Hill (Success Hill and
together with Prax, the “Beneficiaries”) whereby the Company guarantees the
performance of certain obligations relating to the agreements entered into with
Prax Capital.
- 61
-
The
Guarantee is a continuing Guarantee and shall remain effective until a
termination event occurs as contemplated by the Guarantee. If the Company fails
to timely and fully perform its obligations under the Guarantee then the
Beneficiaries shall be afforded the appropriate remedy as contemplated by the
Guarantee, including, but not limited to, the claim for damages and the
reimbursement of expenses. Any amounts payable under the Guarantee by the
Company shall include interest accrued at the rate of 10% from the due date of
such payment.
As of
December 31, 2008, the Company owned a 75% interest in Puhua. Given the
Company’s majority ownership interest, the accounts of Puhua have been
consolidated with the accounts of the Company, and a minority interest has been
recorded for the minority investors’ interests in the net assets and operations
of Puhua to the extent of the minority investor’s investments.
|
Minority interest
|
||||
|
Minority
interest at November 5, 2008
|
$
|
29,268,914
|
||
|
Minority
interests’ share of loss for the year
|
(159,564
|
)
|
||
|
Distributions
for the year
|
0
|
|||
|
Minority
Interest at December 31, 2008
|
$
|
29,109,350
|
||
Note
16 — Accrued Expenses
|
2008
|
2007
|
|||||||
|
Accrued
expenses
|
$
|
855,270
|
$
|
362,854
|
||||
|
Accrued
Interest
|
$
|
2,684,572
|
1,540,597
|
|||||
|
Total
|
$
|
3,539,842
|
$
|
1,903,451
|
||||
In
accrued expense, there is a $293,148 (RMB 2 million) finder fee payable to an
unrelated party that assisted the Company in the formation of
Puhua.
Note
17 — Shareholders' Equity
Common
stock
|
(1)
|
On
June 28, 2006, the Company entered into securities purchase agreements
with accredited investors and completed the issue of $1,075,000 of the
Company’s common stock and common stock purchase warrants. The securities
sold were an aggregate of 330,769 shares of common stock and 99,231
warrants. Each warrant is exercisable for three years with an initial
exercise price of $3.60 per share. The exercise price was amended to $3.31
per share during 2007 with additional 8,770 warrants were
issued.
|
Pursuant
to the terms of the warrants, each investor has contractually agreed to restrict
its ability to exercise the warrants to an amount which would not exceed the
difference between the number of shares of common stock beneficially owned by
the holder or issuable upon exercise of the warrant held by such holder and 9.9%
of the outstanding shares of common stock of the Company.
In
connection with the offering, the Company paid a placement fee of 10% of the
proceeds in cash, together with other expenses in the amount of 3% of the
proceeds, in cash. In addition, the placement agent was issued warrants to
purchase 66,154 shares of common stock on the same terms and conditions as the
investors. The fair value of these warrants was determined to be $118,340 on the
date they were issued, and were exercised during 2007.
The fair
value of each warrants at December 31, 2008 was determined to be $0.04 (2007
-$2.52) using the CRR Binomial Lattice Model with the following assumptions:
expected life – 0.47 years (2007 – 1.47 years); expected volatility – 90% (2007
- 75%), risk free interest rate – 0.27% (2007 – 3.20%) and dividend rate – 0%
(2007 – 0%).
|
(2)
|
Pursuant
to securities purchase agreements with accredited investors dated July 7,
2006, the Company received $124,975 and issued 38,454 shares of common
stock and 11,536 warrants. Each warrant is exercisable for three years at
an initial exercise price of $3.60 per share. The exercise price was
amended to $3.31 per share during 2007 with 1,020 warrants were
issued.
|
In
connection with the offering, the Company paid a placement fee of 10% of the
proceeds in cash, together with other expenses in the amount of 3% of the
proceeds, in cash. In addition, the placement agent was issued warrants to
purchase 7,691 shares of common stock on the same terms and conditions as the
investors. The fair value of these warrants was determined to be $13,727 on the
date they were issued, and were exercised during 2007.
The fair
value of each warrant at December 31, 2008 was determined to be $0.04 (2007
-$2.53) using the CRR Binomial Lattice Model with the following assumptions:
expected life – 0.49 years (2007 – 1.49 years); expected volatility – 90% (2007
- 75%), risk free interest rate – 0.27% (2007 – 3.20%) and dividend rate – 0%
(2007 – 0%).
|
(3)
|
Pursuant
to securities purchase agreements with accredited investors dated August
21, 2006, the Company received $812,500 and issued 198,845 shares of
common stock and 75,000 warrants. Each warrant is exercisable for three
years at $3.60 per share. The exercise price was amended to $3.31 per
share during 2007 with 17,574 warrants were
issued.
|
In
connection with the offering, the Company paid a placement fee of 10% of the
proceeds in cash, together with other expenses in the amount of 3% of the
proceeds, in cash. In addition, the placement agent was issued warrants to
purchase 50,000 shares of common stock on the same terms and conditions as the
investors. The fair value of these warrants was determined to be $94,646 on the
date they were issued, and were exercised during 2007.
- 62
-
The fair
value of each warrant at December 31, 2008 was determined to be $0.06 (2007
-$2.59) using the CRR Binomial Lattice Model with the following assumptions:
expected life – 0.62 years (2007 – 1.62 years); expected volatility – 90% (2007
- 75%), risk free interest rate – 0.30% (2007 – 3.20%) and dividend rate – 0%
(2007 – 0%).
The
Company filed the registration statement registering the resale of shares of the
Company’s common stock and those issuable upon exercise of the warrants on
August 21, 2006 and the registration statement was effective on September 14,
2006.
|
(4)
|
On
January 15, 2007, the Company issued 60,000 shares of common stock to an
investor relations company in consideration for one year of consulting
service through December 31, 2007. The 60,000 shares of common stock have
been recorded at $2.19 per share or $131,400 based on the trading price of
the shares at January 12, 2007. This amount was included in prepaid
expenses and is being amortized over the service
period.
|
|
(5)
|
Pursuant
to securities purchase agreements with accredited investors dated May 7,
2007, the Company received $25,006,978 and issued 9,261,847 shares of
common stock and 2,778,554 warrants. Each warrant is exercisable for five
years at $4.50 per share. In connection with the offering, the Company
paid a 7% placement fee and $173,689 in legal
fees.
|
45,302
warrants having an exercise price of $4.50 were exercised in July 2007 on a cash
basis, resulting in the issuance of 45,302 shares of common stock.
1,870
warrants having an exercise price of $4.50 were exercised in February 2008 on a
cash basis, resulting in the issuance of 1,870 shares of common stock with
proceeds of $8,415.
The fair
value of each warrant at December 31, 2008 was determined to be $0.16 (2007
-$0.76) using the CRR Binomial Lattice Model with the following assumptions:
expected life – 3.34 years (2007 – 4.34 years); expected volatility – 90% (2007
- 75%), risk free interest rate – 1.09% (2007 – 3.35%) and dividend rate –
0% (2007 – 0%).
|
(6)
|
According
to Section 4.8, Anti-Dilute of the Share Purchase Agreements dated June
28, 2006, July 7, 2006 and August 21, 2006, the Company issued 126,138
shares of common stock and 27,364 warrants during 2007; additionally, the
Company reduced the exercise price of all related warrants from $3.60 to
$3.31.
|
123,845
warrants having an exercise price of $3.31 were exercised in July 2007 on
non-cash, basis resulting in the issuance of 29,377 shares of common
stock.
The fair
value of each additional warrant at December 31, 2008 was determined to be in
the range from $0.04 to $0.06 (2007 – $2.54 to $2.60) using the CRR Binomial
Lattice Model with the following assumptions: expected life ranges from 0.47 to
0.62 years (2007 – 1.47 to 1.62); expected volatility – 90% (2007 – 75%), risk
fee interest rate ranges from 0.27% to 0.3% and dividend rate – 0% (2007 –
0%).
Pursuant
to EITF 00-19, "Accounting for Derivative Financial Instruments Indexed to, and
Potentially Settle in, a Company's Own Stock," the warrants issued contain a
provision permitting the holder to demand payment based on a Black Scholes
valuation in certain circumstances. Therefore, under EITF 00-19 and SFAS No.
133, the Company recorded all warrants as a liability at their fair value on the
date of grant and then marked them to $458,461(2007 - $2,631,991) at December
31, 2008. The change in fair value of related warrants for the year ended
December 31, 2008 was $2,171,990 (2007 -$632,296 and 2006
-$Nil).
- 63
-
Including
the fair value of warrants associated with convertible debenture (see note 13),
the total warrant liability as at December 31, 2008 was $1,117,143 (2007 -
$2,631,991). The total change in fair value of warrants for the year ended
December 31, 2008 was $4,932,961 (2007 - $632,296 and 2006- $Nil).
The
Company filed the registration statement registering the resale of shares of the
Company’s common stock on June 22, 2007 and the registration statement was
effective on July 5, 2007.
On July
2, 2008, the Company granted 750,000 shares of common stock that vested
immediately to members of management. The number of shares granted to each
individual is calculated in accordance with the Company’s Detail Implementation
Rule for Restricted Stock Incentive Plan of 2007-2008. The Company recognized a
$3,000,000, based on the stock price on the grant date, stock based compensation
expense for the year ended December 31, 2008 (2007 and 2006 – Nil).
In July
2007, the Board of Directors and the Compensation Committee approved the
Restricted Stock Incentive Plan of 2007-2008 (the 2007 Plan). The Plan covers
fiscal year 2007 and 2008 and if the restricted shares were not fully utilized,
the Plan will continue to fiscal year 2009. The total number of shares of
restricted stock that may be granted under the 2007 Plan is 1,000,000
shares.
The 2007
Plan was proposed by the Board of Directors in July 2007. The majority
shareholders also approved the 2007 Plan in July 2007. However, the Board of
Directors and the majority shareholders only approved the maximum aggregate
number of shares that may be issued under the 2007 Plan. The detailed incentive
plan for fiscal year 2007 which specified a performance goal of $16.3 million
net profit without stock-based compensation, the calculation formula, the
discretionary individual’s performance assessment scores in current year and the
750,000 restricted shares to be issued for 2007 performance were not reviewed by
the Compensation Committee until June 6, 2008, and not approved by the Board of
Directors until July 2, 2008. Therefore, the award was not authorized until July
2nd,
2008 which is considered as the date of grant.
In
addition, all employees under the Plan were notified of the general framework of
the 2007 Plan but were not aware of the detailed calculation formula and the
performance goal for fiscal year 2007 until July 2, 2008. Therefore, July 2nd, 2008
is the grant date.
As at
December 31, 2008, the Company accrued as a liability $78,600 stock based
compensation expense for 54,583 shares of common stocks to be granted by the
Company to various directors and executive in 2009.
Warrants
Following
is a summary of the warrant activity:
|
Number
of
Warrants
Outstanding
|
Weighted
Average
Exercise
Price
|
|||||||
|
December
31, 2005
|
-
|
$
|
-
|
|||||
|
Granted
|
309,612
|
3.31
|
||||||
|
December
31, 2006
|
309,612
|
3.31
|
||||||
|
Granted
|
2,805,918
|
4.49
|
||||||
|
Exercised
|
(169,147
|
)
|
3.63
|
|||||
|
December
31, 2007
|
2,946,383
|
$
|
4.41
|
|||||
|
Granted
|
1,437,467
|
$
|
6.07
|
|||||
|
Exercised
|
(1,870
|
)
|
$
|
4.50
|
||||
|
December
31, 2008
|
4,381,980
|
$
|
4.96
|
|||||
Following
is a summary of the status of warrants outstanding at December 31,
2008:
|
Outstanding
Warrants
|
|||||||
|
Exercise
Price
|
Number
|
Average
Remaining
Contractual
Life
|
|||||
| $ | 3.31 | 213,131 |
0.53
years
|
||||
| $ | 4.50 | 2,731,382 |
3.34
years
|
||||
| $ | 6.07 | 1,437,467 |
4.16
years
|
||||
Note
18 — Statutory Reserves
In
accordance with the laws and regulations of the PRC, a wholly-owned Foreign
Invested Enterprises' income, after the payment of the PRC income taxes, shall
be allocated to the statutory surplus reserves. The proportion of allocation for
reserve funds is no less than 10 percent of the profit after tax until the
accumulated amount of allocation for statutory surplus reserve funds reaches 50
percent of the registered capital. Statutory reserves represent restricted
retained earnings.
Statutory
surplus reserves are to be utilized to offset prior years' losses, or to
increase its share capital. When a limited liability company converts its
surplus reserves to capital in accordance with a shareholders' resolution, the
Company will either distribute new shares in proportion to the number of shares
held by each shareholder, or increase the par value of each share. Except
for the reduction of losses incurred, any other usage should not result in this
reserve balance falling below 25% of the registered capital. Total registered
capital of all the PRC subsidiaries at December 31, 2008 is approximately $81.8
million (December 31, 2007 - $23.6 million).
Pursuant
to the board of directors' resolution, Tsining transferred 10% of its net
income, as determined in accordance with the PRC accounting rules and
regulations, to a statutory surplus reserve fund until such reserve balance
reaches 50% of the PRC subsidiaries’ registered capital.
The
transfer to this reserve must be made before distributions of any dividends to
shareholders. For the year ended December 31, 2008, the Company appropriated
$665,947 (December 31, 2007 - $735,141 and 2006 - $915,960) to this surplus
reserve.
Note
19 — Employee Welfare Plan
Regulations
in the PRC require the Company to contribute to a defined contribution
retirement plan for all permanent employees. The Company established a
retirement pension insurance, unemployment insurance, health insurance and house
accumulation fund for the employees during the term they are employed. For the
year ended December 31, 2008, 2007 and 2006, the Company made contributions in
the amount of $71,705, $51,781 and $13,922, respectively.
- 64
-
Note
20 — Earnings Per Share
Earnings
per share for years ended December 31, 2008, 2007 and 2006 were determined by
dividing net income for the years by the weighted average number of both basic
and diluted shares of common stock and common stock equivalents
outstanding.
|
2008
|
2007
|
2006
|
||||||||||
|
Numerator
|
||||||||||||
|
Income
attributable to common shareholders - basic
|
$
|
8,942,370
|
$
|
16,686,115
|
$
|
9,050,810
|
||||||
|
Effect
of dilutive securities
|
||||||||||||
|
Warrants
|
(536,480
|
)
|
-
|
-
|
||||||||
|
Income
attributable to common shareholders - diluted
|
$
|
8,405,890
|
$
|
16,686,115
|
$
|
9,050,810
|
||||||
|
Denominator
|
||||||||||||
|
Weighted
average shares outstanding - basic
|
30,516,411
|
26,871,388
|
20,277,615
|
|||||||||
|
Effect
of dilutive securities
|
||||||||||||
|
Warrants
|
10,792
|
-
|
-
|
|||||||||
|
Weighted
average shares outstanding - diluted
|
30,527,203
|
26,871,388
|
20,277,615
|
|||||||||
|
Earnings
per share
|
||||||||||||
|
Basic
earnings per share
|
$
|
0.29
|
$
|
0.62
|
$
|
0.45
|
||||||
|
Diluted
earnings per share
|
$
|
0.28
|
$
|
0.62
|
$
|
0.45
|
||||||
Certain
outstanding warrants have an anti-dilutive effect on the earnings per share and
are therefore excluded from the determination of diluted earnings per share
calculation.
Notes
21 — Other Income
The
Company rents certain portions of its residential and commercial units to
individuals and businesses for 1 year terms, renewed annually.
Rental
income and other income and expenses for the year ended December 31 consisted of
the following:
|
2008
|
2007
|
2006
|
||||||||||
|
Other
interest income
|
$
|
1,433,837
|
$
|
42,380
|
$
|
30,395
|
||||||
|
Other
non-operating income
|
339,568
|
89,439
|
58,543
|
|||||||||
|
Rental
income, net
|
369,798
|
153,359
|
213,544
|
|||||||||
|
Gain
on disposal of fixed assets and inventory
|
16,581
|
48,347
|
149,830
|
|||||||||
|
Total
|
$
|
2,159,784
|
$
|
333,525
|
$
|
452,312
|
||||||
Note
22 — Segmented Information
The
Company has one operating segment, being the real-estate sales and development.
All revenue is from customers in the PRC and all of the Company’s assets are
located in the PRC.
Note
23 — Commitments and Contingencies
The
Company leases part of its office space under non-cancelable operating lease
agreements. The leases expired on December 31, 2008 and the Company is in the
process of renewing the lease. The future minimum rental payments required
under the operating lease agreements are $118,095. The leases are expected to be
renewed on annual basis.
The
Company entered into a contract with Xi’an Baqiao local government for a rubber
dam construction project. The Company is committed to spend approximately
$1,026,017 for this project.
- 65
-
As of
December 31, 2008, the Company was committed to one land use right with an
unpaid balance of approximately $2.6 million. The balance is not due until the
vendor removes the existing building on the land and changes the zoning status
on the land use right certificate.
On
December 12, 2008, the Company entered into a contract to acquire a land use
right for total consideration of $37.5 million. Approximately, $7.3 million was
paid and is included in Deposits on land use rights.
Note
24 — Subsequent event
On
January 21, 2009, the Company completed the acquisition of Xi’an Xinxing
Property Management Co., Ltd. (“Xinxing Property”). Xinxing Property was
privately owned and provides property management services to most of the
Company’s past residential and commercial projects. Xinxing Property’s current
service area totals 1.67 million square meters in 43 facilities that include
residential, commercial, and school buildings and parks. Total consideration
for the acquisition is RMB 12 million.
Xinxing
Property provided the property management services to the Company during the
year ended December 31, 2008 totaled $144,384 (2007 - $35,793 and 2006 -
$69,234) and Xinxing Property leased the offices from the Company for $303,988
during the same year (2007 - $85,219 and 2006 – $45,308) . The Company has a
receivable balance of $1,901 (2007- $1,778) and a payable balance of $1,207,047
(2007 -$1,128,928) with Xinxing property as of December 31, 2008.
ITEM
9. CHANGES IN AND DISAGREEMENTS WITH ACCOUNTANTS ON ACCOUNTING AND FINANCIAL
DISCLOSURE
Effective
December 10, 2007, Moore Stephens Wurth Frazer and Torbet, LLP (MSWFT) resigned
as the independent certified public accounting firm for China Housing & Land
Development, Inc. (the Company). MSWFT’s resignation letter was dated December
10, 2007.
The audit
reports of MSWFT on the consolidated financial statements of the Company as of
and for the year ended December 31, 2006 did not contain an adverse opinion or a
disclaimer of opinion, and were not qualified or modified as to uncertainty,
audit scope or accounting principles.
In
connection with the audit of the Company’s consolidated financial statements for
each of the fiscal years ended December 31, 2006 and through December 10, 2007,
there were: (i) no disagreements between the Company and MSWFT on any matters of
accounting principles or practices, financial statement disclosure, or auditing
scope or procedures, which disagreements, if not resolved to the satisfaction of
MSWFT, would have caused MSWFT to make reference to the subject matter of the
disagreement in their reports on the Company’s financial statements for such
years, and (ii) no reportable events within the meaning set forth in Item
304(a)(1)(v) of Regulation S-K.
Effective
as of December 13, 2007, the engagement date, the Company engaged MSCM LLP (New
Auditor) as the Company’s new independent registered public accounting firm. The
decision to engage the New Auditor as the Company’s independent registered
public accounting firm was approved by the Company’s Board of Directors on
December 10, 2007.
During
the Company’s two most recent fiscal years ended December 31, 2006 and 2005 and
through the date of this current report, the Company did not consult with the
New Auditor on (i) the application of accounting principles to a specified
transaction, either completed or proposed, or the type of audit opinion that may
be rendered on the Company’s financial statements, and the New Auditor did not
provide either a written report or oral advice to the Company that the New
Auditor concluded was an important factor considered by the Company in reaching
a decision as to any accounting, auditing, or financial reporting issue; or (ii)
the subject of any disagreement, as defined in Item 304 (a)(1)(iv) of Regulation
S-K and the related instructions, or a reportable event within the meaning set
forth in Item 304(a)(1)(v) of Regulation S-K
ITEM
9A(T). CONTROLS AND PROCEDURES.
(a)
Evaluation of Disclosure Controls and
Procedures.
Under the
supervision and with the participation of our management, including our Chief
Executive Officer and Chief Financial Officer, we evaluated the effectiveness of
the design and operation of our disclosure controls and procedures (as such term
is defined in Rules 13a-15(e) and 15d-15(e) under the Securities Exchange Act of
1934 (the Exchange Act)). Disclosure controls and procedures are the controls
and other procedures that we designed to ensure that we record, process,
summarize and report in a timely manner the information we must disclose in
reports that we file with or submit to the Securities and Exchange Commission
under the Exchange Act. Based on this evaluation, our Chief Executive Officer
and our Chief Financial Officer concluded that our disclosure controls and
procedures as of the end of the period covered by this report were not
effective because of the significant deficiencies in our internal control
over financial reporting as described below. The company has engaged Ernest
& Young to help us comply with SOX 404.
- 66
-
Disclosure
controls and procedures are controls and procedures that are designed to ensure
that information required to be disclosed in our reports filed or submitted
under the Securities Exchange Act is recorded, processed, summarized and
reported, within the time periods specified in the Securities and Exchange
Commission’s rules and forms. Disclosure controls and procedures include,
without limitation, controls and procedures designed to ensure that information
required to be disclosed in our reports filed under the Exchange Act is
accumulated and communicated to management, including our principal executive
officer and our principal financial officer, as appropriate, to allow timely
decisions regarding required disclosure.
Management’s
Annual Report on Internal Control Over Financial Reporting
Our
management is responsible for establishing and maintaining adequate internal
control over financial reporting as defined in Rules 13a-15(f) and 15d-15(f)
under the Securities Exchange Act. We performed an evaluation of the
effectiveness of our internal control over financial reporting that is designed
by, or under the supervision of, our principal executive and principal financial
officers, and effected by our board of directors, management, and other
personnel, to provide reasonable assurance regarding the reliability of
financial reporting and the preparation of financial statements for external
purposes in accordance with GAAP and includes those policies and procedures
that:
|
·
|
pertain
to the maintenance of records that, in reasonable detail, accurately and
fairly reflect the transactions and dispositions of the assets of the
Company;
|
|
·
|
provide
reasonable assurance that transactions are recorded as necessary to permit
preparation of financial statements in accordance with Generally Accepted
Accounting Principles, and that receipts and expenditures of the Company
are being made only in accordance with authorizations of management and
directors of the Company; and
|
|
·
|
provide
reasonable assurance regarding prevention or timely detection of
unauthorized acquisition, use, or disposition of the Company's assets that
could have a material effect on the financial
statements.
|
Because
of its inherent limitations, internal control over financial reporting may not
prevent or detect misstatements. Projections of any evaluation of effectiveness
to future periods are subject to the risk that controls may become inadequate
because of changes in conditions, or that the degree of compliance with the
policies or procedures may deteriorate.
Under the
supervision and with the participation of our management, including our
principal executive officer and principal financial officer, we conducted an
evaluation of the effectiveness of our internal control over financial reporting
as of December 31, 2008. Based on such evaluation, our management, including the
CEO and CFO, has concluded that the Company’s internal control over financial
reporting (as defined in Rules 13a-15(f) and 15d-15(f) of the Securities
Exchange Act of 1934, as amended) as of December 31, 2008 were not effective,
based on the criteria established in COSO's Internal Control — Integrated
Framework because there were certain identified significant deficiencies as of
December 31, 2008 as follows:
|
·
|
the
Company does not have adequate qualified personnel to ensure the
accounting records are in accordance with U.S. GAAP;
and
|
|
·
|
the
Company does not have formal and accurate documentation on review or
approval procedures for the work performed by accounting
staff.
|
These
significant deficiencies resulted in misstatements related to the accrual of
certain late payments pursuant to an agreement with the investors of our 5%
Senior Secured Convertible Debt in our consolidated financial statements as of
and for the year ended December 31, 2008 that are corrected in our restated
consolidated financial statements as of and for the year ended December 31,
2008.
Notwithstanding
the foregoing, there can be no assurance that the Company’s internal control
over financial reporting will detect or uncover all failures of persons within
the Company to comply with these procedures.
This
annual report does not include an attestation report of our registered public
accounting firm regarding internal control over financial reporting.
Management’s report was not subject to attestation by our registered public
accounting firm pursuant to temporary rules of the SEC that permit us to provide
only management’s report in this annual report.
Starting
February 2009, the Company has engaged Ernest & Young to help the Company
perform SOX 404 evaluation and preparation work. Our management hopes that this
course of action will further improve the company’s internal control over
financial reporting by the end of 2009.
Changes
in Internal Control over Financial Reporting.
During
the year ended December 31, 2008, there was no change in our internal control
over financial reporting (as such term is defined in Rule 13a-15(f)under the
Exchange Act) that has materially affected, or is reasonably likely to
materially affect, our internal control over financial reporting.
ITEM
9B. OTHER INFORMATION.
Not
Applicable.
- 67
-
PART
III
ITEM
10. DIRECTORS, EXECUTIVE OFFICERS, PROMOTERS, CONTROL PERSONS AND CORPORATE
GOVERNANCE COMPLIANCE WITH SECTION 16(a) OF THE EXCHANGE ACT.
Executive
Officers and Directors
Below are
the names and certain information regarding our executive officers and
directors.
|
Name
|
Age
|
Title
(1)
|
||
|
Mr.
Pingji Lu
|
58
|
Chairman
of the Board of Directors
|
||
|
Mr.
Xiaohong Feng
|
44
|
Chief
Executive Officer & Managing Director
|
||
|
Ms.
Jing Lu
|
29
|
Chief
Operating Officer & Board Secretary
|
||
|
Mr.
GenXi’ang Xiao
|
46
|
Vice
President & Managing Director
|
||
|
Mr.
Michael Marks
|
37
|
Independent
Director
|
||
|
Mr.
Albert McLelland
|
50
|
Independent
Director
|
||
|
Ms.
Carolina Woo
|
69
|
Independent
Director
|
||
|
Mr.
Suiyin Gao
|
55
|
Independent
Director
|
||
|
Mr.
William Xin
|
42
|
Chief
Financial Officer
|
Officers
are elected annually by the Board of Directors, at the Company’s annual meeting,
to hold such office until an officer’s successor has been duly appointed and
qualified, unless an officer sooner dies, resigns or is removed by the
Board.
Background
of Executive Officers and Directors
Mr. Lu
Pingji, Chairman of the Board of Directors
Mr. Lu
has served as the Chairman of the Board of Directors since he joined the company
in 1999. He also served as the company’s Chief Executive Officer from 1999 until
January 2009, when his CEO duties were assumed by Mr. Xiaohong Feng. Mr. Lu has
more than 40 years of experience in housing development, management, and
construction. After graduating from the Xi’an Army College with a major in
architectural engineering, Mr. Lu served 32 years in the Chinese Army in
architecture and engineering and completed his military career with the rank of
Senior Colonel. Mr. Lu was the founder of Lanbo Financial Investment Company
Group Limited, where he was the Chairman of the Board and Chief Executive
Officer from its formation in September 2003 until its merger with Lanbo
Financial Group, Inc. Mr. Lu served as the Chairman of the Board and Chief
Executive Officer of Lanbo Financial Group, Inc., until December 2005. Prior to
that, Mr. Lu served as Chairman of the Board and Chief Executive Officer of
Xi’an Newstar Real Estate Development Co., Ltd., from 1998 until December 2005.
He previously served as its General Manager from 1992 to 2003. He is member of
the Enterprise Credit Association of Shaanxi Province.
Mr. Feng
Xiaohong, Chief Executive Officer & Managing Director
Mr. Feng
was elected Chief Executive Officer in January 2009. He previously served as the
company’s Chief Operating Officer from 2003 through 2008. He has been a member
of the Board of Directors since he joined the company in 2003. With more than 20
years in the industry, Mr. Feng’s experience in architectural design and real
estate development is leveraged as a member of the China Architecture
Association, as Vice President of the Shaanxi Provincial Real Estate
Association, and as Vice Director of Xi’an Decoration Association. From June
1996 to December 2002, Mr. Feng was General Manager and President of Xi'an
Honghua Industry, Inc. He is a Registered Architect, and received his Master of
Science degree in Architecture Science from Xi’an Architecture & Technology
University.
Ms. Lu
Jing, Chief Operating Officer & Board Secretary
Ms. Lu,
was elected to her current position in January 2009. She previously served as
Vice President of the company from 2004 through 2008. Ms. Lu continues to serve
as Board Secretary, which she has done since 2004, and is the company's primary
spokesperson with investors and security analysts. She received her Master's
degree from King's College in London in September 2004. Ms. Lu is the daughter
of Mr. Pingji Lu.
- 68
-
Mr. Xiao
GenXi’ang, Vice President & Managing Director
Mr. Xiao
GenXi’ang, the Chief Administrative Officer of the Company, joined the company
and became CAO and Board Member in September 1999. In addition, Mr. Xiao was a
director and Executive Vice President of Lanbo Financial Investment Company
Group Limited from October 2003 until our merger with Lanbo Financial Group,
Inc., when Mr. Xiao served as the Executive Vice President, Chief Operating
Officer and a director of Lanbo Financial Group, Inc. until December 2005. Prior
to that Mr. Xiao was a director and President of Xi’an Newstar Real Estate
Development Co., Ltd. from 1999. Mr. Xiao received an M.B.A from Xi’an Jiaotong
University in 2001.
Mr.
William Xin, Chief Financial Officer
Mr.
William Xin, has been Chief Financial Officer of the Company since joining in
January 2008. Mr. Xin has over ten years of experience in finance and
international executive management operating in a broad range of industries.
Most recently he was managing partner of Golden Leaf Investment Group, where he
provided financial consulting, strategic planning, market research and venture
capital services for multiple Chinese companies. Since 2005, Mr. Xin has served
as Managing Partner at Golden Leaf Investment Group in New York City where he
has provided financial consulting, strategic planning, market research and
venture capital services on a number of projects including a hydropower company,
a nanotechnology company and two emerging telecommunications companies. From
2000 through 2005, Mr. Xin was co-founder, chairman and CEO of BChinaB, Inc., a
vertically-integrated US-based outsourcing company, where he helped companies
such as Henry Schein, Libbey Inc., Ametek, Inc. Champion Enterprises and Rheem
Air Conditioners increase profitability by outsourcing their supply chains to
China. Mr. Xin has been featured in the Wall Street Journal and Crain’s magazine
as a China business expert and has spoken on many panels regarding China.
Mr. Xin earned his Bachelor’s degree and Master of Business Administration
degree from Yale University in New Haven, Connecticut.
Ms.
Carolina Woo, Independent Directors
Ms.
Carolina Woo, is currently the owner of CW Group, a consulting firm focused in
real estate development, planning and design. Ms. Woo is also a member of the
Board of Trustees of the Rhode Island School of Design. Previously, Ms. Woo
worked at Skidmore, Owings & Merrill LLP (SOM) beginning in 1969, and
retired as a partner of the international architecture-engineering office of SOM
where she served as the President of SOM International Ltd. with overall
responsibility for SOM’s work in China, Hong Kong, Taiwan, and the Asia-Pacific
region. Ms. Woo received her Master’s Degree from Columbia University
Graduate School of Business and her Bachelor’s Degree in Architecture from the
Road Island School of Design.
Mr.
Michael Marks, Independent Director
Mr.
Michael Marks is currently president and director of Middle Kingdom Alliance
Corp., a special purpose acquisition corporation listed on Over-the-Counter
Bulletin Board. Mr. Marks is also an independent director of Genesis
Pharmaceuticals Enterprises, Inc. (GNPH: OTCBB) and of Yanglin Soybean, Inc.
(YSYB: OTCBB). Previously, Mr. Marks served as a managing
director and principal of Sonnenblick Goldman Asia Pacific Limited, a firm that
provides advisory services in real estate investments, until December 2007. Mr.
Marks also previously served as a director of Horwath Asia Pacific from January
2002 to December 2005 and was chief executive officer and director at B2Gglobe
(Pty) Limited from May 2001 to December 2002. Mr. Marks received both Bachelor’s
and Master’s Degrees in Commerce from the University of the Witwatersrand in
Johannesburg, South Africa in 1994 and 1997, respectively, and also received a
Bachelor’s Degree in Psychology from the University of South Africa in 1998. In
1997, Mr. Marks qualified as a Chartered Accountant in South Africa, and in 1999
as a Fellow of the Association of International Accountants in the United
Kingdom.
Mr.
Suiyin Gao, Independent Director
Mr.
Suiyin Gao, has over 30 years experience in human resource and management
consultant area. Mr. Gao is currently the head of the Shaanxi Senior Talent
Office, which is affiliated with Shaanxi Provincial government and focused on
corporation management, consultation and human resources services. Mr. Gao is
the founder and chairman of Shanxi management Member Club, one of the largest
manager clubs in Shanxi province. Mr. Gao is currently an independent director
of six enterprises, and also acted as senior consultant for more than twenty
enterprises. Previously, Mr. Gao worked)government since 1973. In 1998, Mr.
Gao received his degree in Master of Business Administration from Northwest
University in China.
- 69
-
Mr.
Albert McLelland, Independent Director
Mr.
Albert McLelland began serving as an independent director in February 2009. He
also serves as the Chairman of the Board's Audit Committee. Mr. McLelland has
been Senior Managing Director of AmPac Strategic Capital LLC since 2003. He is
also a founder and Managing Director of AmPac-TDJ LLC. Prior to founding AmPac
Strategic Capital, Mr. McLelland was responsible for the day to day cross-border
transactions practice of PricewaterhouseCoopers’ Financial Advisory Services.
Mr. McLelland has extensive investment and merchant banking experience, has
built two Asian-based financial service firms, and has led the corporate finance
department at CEF Taiwan Limited. He began his investment banking career in
Public Finance at Shearson Lehman. He holds an M.B.A. degree from the University
of Chicago and a Master of International Affairs degree from Columbia
University. He completed his undergraduate studies at the University of South
Florida and studied Mandarin at the National Normal University in Taiwan. Since
September 2008, Mr. McLelland has served as an independent director and Chairman
of the audit committee of the Board of Directors for China Fire & Security
Group, Inc. On March 9, 2009, Mr. McLelland became an independent director and
Chairman of the audit committee of the Board of Directors for Yanglin Soybean,
Inc.
|
(1)
|
In
early January 2009, executives in the Company changed positions. Mr.
Pingji Lu continued as Chairman of the Board of Directors and his CEO
responsibilities were assumed by Mr. Xiaohong Feng, who was previously
Chief Operating Officer. Ms. Jing Lu, previously Vice President, was
elected Chief Operating Officer.
|
SECTION
16(a) BENEFICIAL OWNERSHIP REPORTING COMPLIANCE
Section
16(a) of the Securities Exchange Act of 1934, as amended (the Exchange Act),
requires our executive officers, directors and persons who own more than 10
percent of our common stock to file initial reports of ownership on Form 3 and
changes in ownership on Forms 4 or 5 with the SEC. Such executive officers,
directors and over 10 percent stockholders are also required by SEC rules to
furnish us with copies of all such forms they file.
Based
solely on our review of the copies of such forms we have received, or written
representations from certain reporting persons, we believe that, during the year
ended December 31, 2008, all executive officers, directors and over 10 percent
stockholders filed on a timely basis all reports required to be filed by them
under Section 16(a) with respect to our common stock,
CODE OF
ETHICS
On
November 8, 2007, the Company’s Board of Directors adopted a Code of Ethics that
applies to the Company’s principal executive officer, principal financial
officer, principal accounting officer or controller, or persons performing
similar functions. A copy of this Code of Ethics is available on the Company’s
website, www.chldinc.com, in the section titled officers & directors, which
can be found on our home page. The website and information contained on it or
incorporated in it are not intended to be incorporated in this Annual Report on
Form 10-K or other filings with the U.S. Securities and Exchange
Commission.
AUDIT
COMMITTEE
The
members of the Audit Committee are Mr. Albert McLelland, Mr. Michael Marks, and
Ms. Caroline Woo, with Mr. McLelland serving as chairman of the audit committee.
All members of the Audit Committee are independent directors. The Company’s
Board of Directors has determined that Mr. McLelland possesses accounting or
related financial management expertise and that he qualifies as an “audit
committee financial expert” as defined in Item 407 of Regulation
S-K.
- 70
-
ITEM
11. EXECUTIVE COMPENSATION
COMPENSATION
DISCUSSION AND ANALYSIS
The
following table sets forth all compensation paid in respect of our Chief
Executive Officer and those individuals who received compensation in excess of
$100,000 per year (collectively, the Named Executive Officers) for our last two
completed fiscal years. The compensation is comprised of base salary and
bonus. The Company’s compensation committee has not completed the 2008
annual review for our executive officers and all 2008 bonus numbers are
preliminary and subject to change.
SUMMARY
COMPENSATION TABLE
The
following table sets forth all compensation paid in respect of our Chief
Executive Officer, Chief Financial Officer and those individuals who received
compensation in excess of $100,000 per year (collectively, the Named Executive
Officers) for our last four completed fiscal years. The compensation is
comprised of base salary and bonus. The Company’s compensation committee has not
completed the 2008 annual review for our executive officers and all 2008 bonus
numbers are preliminary and subject to change.
|
Name and
|
Base
|
Bonus
(2)
|
Stock
|
Option
|
Non-Equity
Incentive
Plan
|
Nonqualified
Deferred
Compensation
|
All
Other
|
|||||||||||||||||||||||||||||||
|
Principal
Position
|
Year
|
Salary
($) (1)
|
Cash
($)
|
Stock
($)
|
Awards
($) (3)
|
Awards
($)
|
Compensation
($)
|
Earnings
($)
|
Compensation
($)
|
Total
($)
|
||||||||||||||||||||||||||||
|
Pingji
Lu (4)
|
2008
|
$
|
3,868
|
30,066
|
N/A
|
N/A
|
N/A
|
0
|
0
|
0
|
33,934
|
|||||||||||||||||||||||||||
|
Chairman
of the
|
2007
|
$
|
2,174
|
17,111
|
1,641,626
|
1,641,626
|
N/A
|
0
|
0
|
0
|
1,660,911
|
|||||||||||||||||||||||||||
|
Board
of Directors
|
2006
|
$
|
1,769
|
15,015
|
N/A
|
N/A
|
N/A
|
0
|
0
|
0
|
16,784
|
|||||||||||||||||||||||||||
|
2005
|
$
|
1,561
|
15,326
|
N/A
|
N/A
|
N/A
|
0
|
0
|
0
|
16,887
|
||||||||||||||||||||||||||||
|
GenXi’ang
Xiao
|
2008
|
$
|
3,516
|
16,670
|
N/A
|
N/A
|
N/A
|
0
|
0
|
0
|
20,186
|
|||||||||||||||||||||||||||
|
Vice
President &
|
2007
|
$
|
2,174
|
9,729
|
348,730
|
348,730
|
N/A
|
0
|
0
|
0
|
360,633
|
|||||||||||||||||||||||||||
|
Managing
Director
|
2006
|
$
|
1,769
|
11,994
|
N/A
|
N/A
|
N/A
|
0
|
0
|
0
|
13,763
|
|||||||||||||||||||||||||||
|
2005
|
$
|
1,561
|
12,286
|
N/A
|
N/A
|
N/A
|
0
|
0
|
0
|
13,847
|
||||||||||||||||||||||||||||
|
Xiaohong
Feng
|
2008
|
$
|
3,516
|
21,928
|
N/A
|
N/A
|
N/A
|
0
|
0
|
0
|
25,444
|
|||||||||||||||||||||||||||
|
Chief
Executive Officer &
|
2007
|
$
|
2,174
|
16,647
|
427,006
|
427,006
|
N/A
|
0
|
0
|
0
|
445,827
|
|||||||||||||||||||||||||||
|
Managing
Director
|
2006
|
$
|
1,769
|
13,507
|
N/A
|
N/A
|
N/A
|
0
|
0
|
0
|
15,276
|
|||||||||||||||||||||||||||
|
2005
|
$
|
1,561
|
13,809
|
N/A
|
N/A
|
N/A
|
0
|
0
|
0
|
15,370
|
||||||||||||||||||||||||||||
|
Yulong
Wan
|
2008
|
$
|
N/A
|
N/A
|
N/A
|
N/A
|
N/A
|
0
|
0
|
0
|
0
|
|||||||||||||||||||||||||||
|
Former
Chief Financial Officer
|
2007
|
$
|
1,777
|
N/A
|
73,815
|
73,815
|
N/A
|
0
|
0
|
0
|
75,592
|
|||||||||||||||||||||||||||
|
Notes:
Working Period
|
2006
|
$
|
1,385
|
5,853
|
N/A
|
N/A
|
N/A
|
0
|
0
|
0
|
7,238
|
|||||||||||||||||||||||||||
|
(Jan
to Apr, 2007)
|
2005
|
$
|
1,190
|
6,093
|
N/A
|
N/A
|
N/A
|
0
|
0
|
0
|
7,283
|
|||||||||||||||||||||||||||
|
Zhiyong
Shi
|
2008
|
$
|
3,516
|
12,756
|
N/A
|
N/A
|
N/A
|
0
|
0
|
0
|
16,272
|
|||||||||||||||||||||||||||
|
Former
Vice President, Chief Legal
|
2007
|
$
|
725
|
757
|
N/A
|
N/A
|
N/A
|
0
|
0
|
0
|
1,482
|
|||||||||||||||||||||||||||
|
Counsel,
and Board Member
|
2006
|
$
|
1,769
|
6,962
|
N/A
|
N/A
|
N/A
|
0
|
0
|
0
|
8,731
|
|||||||||||||||||||||||||||
|
Notes:
Working Period (Jan to Apr, 2007)
|
2005
|
$
|
1,561
|
7,224
|
N/A
|
N/A
|
N/A
|
0
|
0
|
0
|
8,785
|
|||||||||||||||||||||||||||
|
William
Xin (5)
|
2008
|
$
|
36,000
|
0
|
0
|
43,000
|
0
|
0
|
0
|
0
|
79,000
|
|||||||||||||||||||||||||||
|
Chief
Financial Officer
|
2007
|
$
|
N/A
|
N/A
|
N/A
|
N/A
|
N/A
|
0
|
0
|
0
|
0
|
|||||||||||||||||||||||||||
|
2006
|
$
|
N/A
|
N/A
|
N/A
|
N/A
|
N/A
|
0
|
0
|
0
|
0
|
||||||||||||||||||||||||||||
|
2005
|
$
|
N/A
|
N/A
|
N/A
|
N/A
|
N/A
|
0
|
0
|
0
|
0
|
||||||||||||||||||||||||||||
|
Jing
Lu
|
2008
|
$
|
2,813
|
8,626
|
N/A
|
N/A
|
N/A
|
0
|
0
|
0
|
11,439
|
|||||||||||||||||||||||||||
|
Chief
Operating Officer &
|
2007
|
$
|
6,957
|
6,957
|
312,082
|
312,082
|
N/A
|
0
|
0
|
0
|
325,996
|
|||||||||||||||||||||||||||
|
Board
Secretary
|
2006
|
$
|
4,615
|
4,615
|
N/A
|
N/A
|
N/A
|
0
|
0
|
0
|
9,230
|
|||||||||||||||||||||||||||
|
2005
|
$
|
N/A
|
N/A
|
N/A
|
N/A
|
N/A
|
0
|
0
|
0
|
0
|
||||||||||||||||||||||||||||
|
1.
|
The
Company pays salaries in RMB to all executive officers every month. The
RMB amount is translated into US$ when the Company files SEC documents.
The exchange rates used were the average rates of 2008, 2007 and 2006.
They were 0.1439, 0.1315 and 0.12557 respectively. The stock awards were
valued based on the closing price of our common stock on the NASDAQ on
July 2, 2008.
|
|
2.
|
The
Company’s bonus has been mostly in cash. Whether the bonus can be issued
in stock is discretionary with the Compensation Committee. Other than the
stocks issued under the 2007 Stock Incentive Plan, we have not issued any
stock bonus. The dollar value of stock is based on the stock price of
$3.99 per share.
|
|
3.
|
The
stock awards column shows all stocks paid to our executives, which
includes the stocks paid in 2008 for their 2007 performance. The stock
awards amount is based on the stock price of $3.99.
|
|
4.
|
Since
June 1st, 2008, Chairman Mr. Lu’s salary increased to US$ 200,000, which
was approved by compensation committee on June 1, 2008.
|
|
5.
|
William
Xin’s compensation package includes base salary and a total of 100,000
shares of the Company’s common stock which will be vested equally over the
three year employment period by 33.33% each year and are not based on the
performance evaluation at the year end. For 2008, the stock amount he
received as part of his compensation is based on the stock price of
$1.29.
|
- 71
-
COMPENSATION
OF NAMED EXECUTIVES
On June
1, 2008 the Company entered into a one-year employment agreement with Pingji Lu
as President and Chief Executive Officer. The annual compensation is US$200,000.
The agreement provides for a monthly base salary of RMB 2,200 (or US$ 301,
determined based on the minimum base salary requirements by the Employment Law
of the PRC), and a monthly bonus payment of RMB 22,000 (or US$3,010), which for
12 months, constitutes 20% to 40% of the annual compensation based on the
Guidelines. The performance or bonus payment is given pursuant to the Guidelines
in accordance with relevant laws. The Company has the right to adjust Mr. Lu’s
salary according to his production operations, alteration of his post and
distribution methods for labor remuneration established under the law. Mr. Lu is
entitled to pension insurance, unemployment insurance, medical insurance,
overall-planned medical care for serious illnesses, housing fund and other
social insurance of the Company pursuant to relevant regulations of the province
and Xi’an city. In the event the Company terminates Mr. Lu’s employment in
violation of the agreement, the Company shall be required to pay Mr. Lu, in
addition to paying the salaries for the remaining months of the term in full,
economic compensation equal to 25% of the corresponding salaries. The Company
has established annual personal performance targets for Mr. Pingji Lu. Mr. Lu’s
monthly bonus is based on a percentage of his expected annual compensation and
assumes his reasonable progress during the year against his annual performance
targets established at the beginning of the year. The monthly bonus is based on
his contribution to the Company and is reviewed and is subject to periodic
adjustment within his total annual compensation by the Compensation
Committee.
In 2008,
Mr. Lu was paid 60,000 shares at a value of $239,400 as his performance bonus
based on the Compensation Committee’s decision in view of the audited financial
statements of 2007.
Our Human
Resources department measured Mr. Lu’s performance scores in accordance with his
annual targets agreement. Mr. Lu signed his annual targets agreement with
the Company at the beginning of 2007. At the beginning of 2008, the Human
Resources department reviewed the targets agreement to measure how many targets
had been met by Mr. Lu and then set his targets achievement score
accordingly. The result was then sent to our Compensation Committee for
consideration and approval.
On
January 2, 2008 the Company entered into a three-year employment agreement with
William Xin as Chief Financial Officer. The agreement provides for an annualized
base salary to Mr. Xin of $36,000 before tax. The base salary will be reviewed
annually by the Board of Directors of the Company, provided, however, that the
base salary shall not be decreased below the amount set forth in the first year.
During Mr. Xin’s term of three year, totally 100,000 shares of the Company’s
common stock should be granted to him. All of the shares of common stock shall
be vested equally over the three year employment period by 33.33% each year
with pro rata vesting if it is less than a full year. In the event the Company
terminates Mr. Xin’s employment without cause, as defined in the agreement, or
due to the change of control, the Company shall be required to pay Mr. Xin the
lesser of (1) six months, or (2) the balance of the remaining three year
contract all the salary and economic benefits including but not limited to all
the unvested shares, health insurance and other infringe benefit.
On
January 12, 2009, Mr. Xiaohong Feng was appointed as the new Chief Executive
Officer of the Company. Mr. Feng's employment agreement is still in negotiation
and the Company will file a Form 8-K to disclose the agreement as soon as the
Compensation Committee approves it.
DIRECTOR
COMPENSATION
The table
below sets forth the salary our independent director received for the services
performed in the last three years. Our directors’ salary comprises of both cash
and stock. For 2008, the stock value is based on the stock price of $1.29. The
cash salary is paid to all directors in US$ every quarter.
|
Name and
|
Salary
|
Option
|
Non-Equity
Incentive Plan
|
Change in
Pension Value
and
Nonqualified
Deferred
|
All Other
|
|||||||||||||||||||||
|
Principal
Position
|
Year
|
Cash
($)
|
Stock
($)
|
Awards
($)
|
Compensation
($)
|
Compensation
Earnings ($)
|
Compensation
($)
|
|||||||||||||||||||
|
Carolina Woo
|
2008
|
$
|
20,000
|
9,675
|
0
|
0
|
0
|
0
|
||||||||||||||||||
|
Independent
director
|
2007
|
$
|
3,333
|
N/A
|
0
|
0
|
0
|
0
|
||||||||||||||||||
|
of
the Board
|
2006
|
$
|
N/A
|
N/A
|
0
|
0
|
0
|
0
|
||||||||||||||||||
|
Edward
Meng (1)
|
2008
|
$
|
20,000
|
4,838
|
0
|
0
|
0
|
0
|
||||||||||||||||||
|
Independent
director
|
2007
|
$
|
3,333
|
N/A
|
0
|
0
|
0
|
0
|
||||||||||||||||||
|
of
the Board
|
2006
|
$
|
N/A
|
N/A
|
0
|
0
|
0
|
0
|
||||||||||||||||||
|
Michael
Marks
|
2008
|
$
|
15,000
|
6,450
|
0
|
0
|
0
|
0
|
||||||||||||||||||
|
Independent
director
|
2007
|
$
|
2,500
|
N/A
|
0
|
0
|
0
|
0
|
||||||||||||||||||
|
of
the Board
|
2006
|
$
|
N/A
|
N/A
|
0
|
0
|
0
|
0
|
||||||||||||||||||
|
Suiyin
Gao
|
2008
|
$
|
15,000
|
6,450
|
0
|
0
|
0
|
0
|
||||||||||||||||||
|
Independent
director
|
2007
|
$
|
2,500
|
N/A
|
0
|
0
|
0
|
0
|
||||||||||||||||||
|
of
the Board
|
2006
|
$
|
N/A
|
N/A
|
0
|
0
|
0
|
0
|
||||||||||||||||||
(1) Edward
Meng resigned as independent director on October 10, 2008.
- 72
-
COMPENSATION
COMMITTEE INTERLOCKS AND INSIDER PARTICIPATION
We do not have any member of our compensation committee who is, or was an
officer or employee, or had any relationship with the Company requiring
disclosure under Item 404 of Regulation S-K. We also do not have any executive
officer who served as a member of the compensation committee of another entity
or a director of another entity, whose executive officers served on our
compensation committee or served as a director of our board.
ITEM
12. SECURITY OWNERSHIP OF CERTAIN BENEFICIAL OWNERS AND MANAGEMENT AN RELATED
STOCKHOLDER MATTERS.
The
following table sets forth certain information, as of March 24, 2009, with
respect to the beneficial ownership of the outstanding common stock by (i) any
holder of more than five (5 percent) percent; (ii) each of the Company’s
executive officers and directors; and (iii) the Company’s directors and
executive officers as a group. Except as otherwise indicated, each of the
stockholders listed below has sole voting and investment power over the shares
beneficially owned.
|
Name
|
Title
|
Shares
ownership
|
Percentage
of
Owned
|
|||||||
|
Mr.
Pingji Lu
|
Chairman
|
3,950,935
|
12.77
|
%
|
||||||
|
Mr.
Xiaohong Feng
|
CEO
& Managing Director
|
707,019
|
2.28
|
%
|
||||||
|
Mr.
GenXi’ang Xiao
|
Vice
President &
Managing Director |
552,401
|
1.78
|
%
|
||||||
|
Mr.
William Xin (3)
|
CFO
|
33,333
|
0.11
|
%
|
||||||
|
Ms.
Jing Lu
|
COO
& Board Secretary
|
578,216
|
1.87
|
%
|
||||||
|
Mr.
Michael Marks(3)
|
Independent
Director
|
5,000
|
0.02
|
%
|
||||||
|
Ms.
Carolina Woo(3)
|
Independent
Director
|
7,500
|
0.02
|
%
|
||||||
|
Mr.
Suiyin Gao(3)
|
Independent
Director
|
5,000
|
0.02
|
%
|
||||||
|
Mr.
Edward Meng (3)(4)
|
Independent
Director
|
3,750
|
0.01
|
%
|
||||||
|
Total
|
5,843,154
|
18.88
|
%
|
|||||||
|
(1)
|
Except
as otherwise indicated, the address of each beneficial owner is c/o Xi’an
Tsining Housing Development CO., Ltd., 6 Youyi Dong Lu, Han Yuan 4 Lou,
Xi’an, Shaanxi Province, China
710054.
|
|
(2)
|
Applicable
percentage ownership is based on 30,948,340 shares of common stock
outstanding as of March 24, 2009. Beneficial ownership is determined in
accordance with the rules of the Securities and Exchange Commission and
generally includes voting or investment power with respect to
securities.
|
|
(3)
|
On
Feb. 29, 2009, the Company issued shares to certain officer and
independent directors according to their respective contract as part of
their 2008 compensation.
|
|
(4)
|
Edward
Meng resigned as independent director on October 10,
2008.
|
We have
four directors that are independent under the independence standards of S-K Item
407(a)(1). They are: Mr. Michael Marks, Mr. Albert McLelland, Mr. Suiyin Gao,
and Ms. Carolina Woo.
The
Company has borrowed money from certain employees to fund the Company's
construction projects. The loans bear interest ranging between 7% to 12% and the
principal matures within one to three years. As of December 31, 2008, loan from
employees amounted to $1,517,039. The following table sets forth the largest
aggregate amount of principal outstanding during fiscal year 2007 and
2008:
|
Fiscal year 2007
|
Fiscal year 2008
|
|||||||||||||||
|
Item
|
RMB
|
USD
|
RMB
|
USD
|
||||||||||||
|
The
largest aggregate amount of principal outstanding
|
19,909,569
|
2,729,602
|
12,770,236
|
1,880,769
|
||||||||||||
|
Principal
paid
|
5,963,716
|
784,101
|
2,645,236
|
389,584
|
||||||||||||
|
Interest
Paid
|
768,786
|
101,079
|
215,350
|
31,716
|
||||||||||||
|
Total
Amount of Loans Outstanding
|
17,424,230
|
2,388,862
|
10,350,000
|
1,517,039
|
||||||||||||
- 73
-
The
Company does not allow borrowing by the employees from the Company. There are no
buying/selling transactions between the employees and the Company. The employee
loans were made at a time when the Company needed working capital to expand
operation and the employees helped the Company by giving their loans. The loans
were made at or below the then current market rate. Although we have the overall
policy of not allowing related party transaction unless the Company benefits, we
have no written policies and procedures for the review, approval, ratification
of any related party transaction. All our directors and officers understand that
they should not engage in any related party transactions and we have announced
the rule to the employees of the Company a few times at different employee
meetings. The Company will work with the audit committee to set up such written
policies and procedures for the review, approval, ratification of any related
party transaction.
The
following table sets forth all loans the Company and New Land, its subsidiary,
have made with their employees during the period for which this report is
provided.
|
Tsining (As of December 31, 2008)
|
||||||||||
|
First
|
Last
|
Ex rate: 6.8225
|
||||||||
|
Name
|
Name
|
Amount (RMB)
|
Amount (USD)
|
|||||||
|
Zhongbiao
|
Wang
|
200,000
|
29,315
|
|||||||
|
Qiang
|
Tong
|
75,000
|
10,993
|
|||||||
|
Zhiyong
|
Shi
|
160,000
|
23,452
|
|||||||
|
Fang
|
Shen
|
140,000
|
20,520
|
|||||||
|
Lijun
|
Lu
|
80,000
|
11,726
|
|||||||
|
Fengrong
|
Jiao
|
330,000
|
48,369
|
|||||||
|
Ming
|
Hui
|
70,000
|
10,260
|
|||||||
|
Yan
|
Huang
|
30,000
|
4,397
|
|||||||
|
Weiping
|
Fu
|
335,000
|
49,102
|
|||||||
|
Enhu
|
Fan
|
100,000
|
14,657
|
|||||||
|
LieXi’ang
|
Chen
|
500,000
|
73,287
|
|||||||
|
Yongan
|
Chang
|
200,000
|
29,315
|
|||||||
|
Yuewu
|
Bian
|
400,000
|
58,630
|
|||||||
|
Zhongquan
|
Yang
|
370,000
|
54,232
|
|||||||
|
Total
|
2,990,000
|
438,256
|
||||||||
|
New Land (As of December 31, 2008)
|
||||||||||
|
First
|
Last
|
Ex rate: 6.8225
|
||||||||
|
Name
|
Name
|
Amount (RMB)
|
Amount (USD)
|
|||||||
|
Jiaqun
|
Zhou
|
100,000
|
14,657
|
|||||||
|
Chenyang
|
Zhang
|
200,000
|
29,315
|
|||||||
|
Ganming
|
Yi
|
200,000
|
29,315
|
|||||||
|
Qian
|
Xue
|
150,000
|
21,986
|
|||||||
|
Xiuqin
|
Wang
|
110,000
|
16,123
|
|||||||
|
Shangyuan
|
Wan
|
320,000
|
46,904
|
|||||||
|
Qiang
|
Tong
|
10,000
|
1,466
|
|||||||
|
Xijing
|
Tao
|
300,000
|
43,972
|
|||||||
|
Yan
|
Tao
|
130,000
|
19,055
|
|||||||
|
Zhiyong
|
Shi
|
300,000
|
43,972
|
|||||||
|
Fang
|
Shen
|
110,000
|
16,123
|
|||||||
|
Junfeng
|
Qiao
|
100,000
|
14,657
|
|||||||
|
Meng
|
Luo
|
200,000
|
29,315
|
|||||||
|
Lijun
|
Lu
|
20,000
|
2,931
|
|||||||
|
Runsheng
|
Lu
|
45,000
|
6,596
|
|||||||
|
Pengfei
|
Liu
|
10,000
|
1,466
|
|||||||
|
Wen
|
Liu
|
20,000
|
2,931
|
|||||||
|
Jine
|
Li
|
210,000
|
30,781
|
|||||||
|
Xuesong
|
Li
|
670,000
|
98,204
|
|||||||
|
Lanqiu
|
Kang
|
400,000
|
58,630
|
|||||||
|
Fengrong
|
Jiao
|
2,045,000
|
299,743
|
|||||||
|
Yuan
|
Jiao
|
70,000
|
10,260
|
|||||||
|
Aiguo
|
Fu
|
1,200,000
|
175,889
|
|||||||
|
Delin
|
Chen
|
250,000
|
36,643
|
|||||||
|
Yuewu
|
Bian
|
190,000
|
27,849
|
|||||||
|
Total
|
7,360,000
|
1,078,783
|
||||||||
During
fiscal 2007 and 2008 our principal independent auditor was MSCM, LLP. MSCM, LLP
performed the audit for the year ended December 31, 2008. Moore Stephens Wurth
Frazer and Torbet, LLP reviewed for the 9 months ended September 30, 2007 and
reported on the company’s financial statements for the year ended December 31,
2006.
The audit
of our annual financial statement for this 10-K for the period ended December
31, 2008, were performed by our current principal independent auditor MSCM, LLP.
The following are the services provided and the amount billed:
|
(a)
|
AUDIT
FEES
|
The
aggregate fees billed or to be billed for professional services rendered by our
principal accountants for the audit of our annual financial statements for the
ended December 31, 2008, 2007 and 2006 were $190,000, $160,000 and $100,000,
respectively. The reviews for the financial statements included in our quarterly
reports on Form 10-QSB during the fiscal years ended December 31, 2008, 2007 and
2006 were $120,000, $75,000 and $75,000, respectively.
- 74
-
|
(b)
|
AUDIT-RELATED
FEES
|
We
incurred $86,070 fees for the fiscal years ended December 31, 2008 and none for
2007 for assurance and related services by our principal accountant that were
reasonably related to the performance of the audit or review of our financial
statements, and not reported under Audit fees above.
|
(c)
|
TAX
FEES
|
The
aggregate fees billed for professional services rendered by our principal
accountant for tax compliance, tax advice, preparation and filing of tax returns
and tax planning for the fiscal years ended December 31, 2008 and 2007 were
$5,250 and $0.
|
(d)
|
ALL
OTHER FEES
|
All other
fees billed for the fiscal years ended December 31, 2008 and 2007 were $30,660
and $Nil.
Our audit
committee consists of three independent directors.
ITEM
15. EXHIBITS AND REPORTS ON FORM 10-K.
|
EXHIBIT
NO.
|
DESCRIPTION
OF EXHIBIT
|
|
|
3.1
|
Articles
of Incorporation (incorporated by reference to the exhibits to Registrants
Form SB-2 filed on October 27, 2004)
|
|
|
3.2
|
Registrant's
By-Laws (incorporated by reference to the exhibits to Registrants Form
SB-2 filed on October 27, 2004)
|
|
|
10.1
|
Securities
Purchase Agreement (incorporated by reference to the exhibits to
Registrant's Form 8-K filed on January 30, 2008).
|
|
|
10.2
|
Form
of Convertible debt (incorporated by reference to the exhibits to
Registrant's Form 8-K filed on January 30, 2008).
|
|
|
10.3
|
Form
of Warrant (incorporated by reference to the exhibits to Registrant's Form
8-K filed on January 30, 2008).
|
|
|
10.4
|
Form
of Pledge Agreement (incorporated by reference to the exhibits to
Registrant's Form 8-K filed on January 30, 2008).
|
|
|
10.5
|
Form
of Registration Rights Agreement (incorporated by reference to the
exhibits to Registrant's Form 8-K filed on January 30,
2008).
|
|
|
10.6
|
Framework
Agreement, dated November 5, 2008, by and between the Registrant and Prax
Capital China Real Estate Fund I, Ltd. (incorporated by reference to the
exhibits to the Registrant’s Form 10-K filed on March 25,
2009).
|
|
|
10.7
|
Deed
of Guarantee, dated November 5, 2008, made by the Registrant in favor of
Success Hill Investments Limited and Prax Capital Real Estate Holding
Limited (incorporated by reference to the exhibit to Registrant's Form 8-K
filed on January 28, 2009).
|
|
|
21.1
|
List
of subsidiaries. (incorporated by reference to the exhibits to the
Registrant’s Form 10-K filed on March 25, 2009).
|
|
|
23.1
|
Consent
of Moore Stephens Wurth Frazer and Torbet, LLP. (incorporated by reference
to the exhibits to the Registrant's Form 10-K filed on March 25,
2009).
|
|
|
23.2
|
Consent
of MSCM LLP.*
|
|
|
31.1
|
Certification
of Chief Executive Officer Pursuant to Section 302 of the Sarbanes-Oxley
Act.*
|
|
|
31.2
|
Certification
of Principal Financial and Accounting Officer Pursuant to Section 302 of
the Sarbanes-Oxley Act.*
|
|
|
32.1
|
Certification
of Chief Executive Officer Pursuant to Section 906 of the Sarbanes-Oxley
Act.*
|
|
|
32.2
|
|
Certification
of Chief Accounting Officer Pursuant to Section 906 of the Sarbanes-Oxley
Act.*
|
* Filed
herewith
- 75
-
Pursuant
to the requirements of Section 13 or 15(d) of the Securities Exchange Act of
1934, the registrant has duly caused this report to be signed on our behalf by
the undersigned, thereunto duly authorized.
|
CHINA
HOUSING AND LAND DEVELOPMENT,
INC.
|
||
|
October
30, 2009
|
By:
|
/s/ Feng Xiaohong
|
|
Name:
Feng Xiaohong
Title:
Chief Executive Officer
|
||
|
October
30, 2009
|
By:
|
/s/ Cangsang Huang
|
|
Name:
Cangsang Huang
Title:
Chief Financial Officer
(Principal
Financial and Accounting
Officer)
|
||
Pursuant
to the requirements of the Securities Act of 1933, this Form 10-K has been
signed by the following persons in the capacities and on the dates
indicated.
|
SIGNATURE
|
TITLE
|
DATE
|
||
|
/s/
Lu Pingji
|
Chairman
of the Board
|
October
30, 2009
|
||
|
Lu
Pingji
|
||||
|
/s/
Feng Xiaohong
|
Chief Executive Officer & Managing Director
|
October
30, 2009
|
||
|
Feng
Xiaohong
|
||||
|
/s/
Xiao GenXi’ang
|
Vice
President & Managing Director
|
October
30, 2009
|
||
|
Xiao
GenXi’ang
|
||||
|
/s/
Cangsang Huang
|
Chief
Financial Officer
|
October
30, 2009
|
||
|
Cangsang
Huang
|
||||
|
October
30, 2009
|
||||
|
/s/
Albert S. McLelland
|
Independent
Director
|
|||
|
Albert
S. McLelland
|
||||
|
October
30, 2009
|
||||
|
/s/
Mr. Michael Marks
|
Independent
Director
|
|||
|
Michael
Marks
|
||||
|
October
30, 2009
|
||||
|
/s/
Mr. Carolina Woo
|
Independent
Director
|
|||
|
Carolina
Woo
|
||||
|
October
30, 2009
|
||||
|
/s/
Mr. Gao Suiyi
|
Independent
Director
|
|||
|
Gao
Suiyi
|
|
|
- 76
-