Attached files
| file | filename |
|---|---|
| 8-K - 8-K - CBRE GROUP, INC. | a09-32416_18k.htm |
| EX-99.1 - EX-99.1 - CBRE GROUP, INC. | a09-32416_1ex99d1.htm |
Exhibit 99.2
|
|
Third Quarter 2009 Earnings Conference Call October 29, 2009 CB Richard Ellis Group, Inc. |
|
|
Forward Looking Statements This presentation contains statements that are forward looking within the meaning of the Private Securities Litigation Reform Act of 1995, including statements regarding our momentum in 2009, future operations and future financial performance. These statements should be considered as estimates only and actual results may ultimately differ from these estimates. Except to the extent required by applicable securities laws, we undertake no obligation to update or publicly revise any of the forward-looking statements that you may hear today. Please refer to our current annual report on Form 10-K and our current quarterly Form 10-Q, in particular any discussion of risk factors or forward-looking statements, which are filed with the SEC and available at the SEC’s website (http://www.sec.gov), for a full discussion of the risks and other factors that may impact any estimates that you may hear today. We may make certain statements during the course of this presentation which include references to “non-GAAP financial measures,” as defined by SEC regulations. As required by these regulations, we have provided reconciliations of these measures to what we believe are the most directly comparable GAAP measures, which are attached hereto within the appendix. |
|
|
Conference Call Participants Brett White President & Chief Executive Officer Bob Sulentic Group President & Chief Financial Officer Nick Kormeluk Investor Relations |
|
|
Business Overview Highlights: Outsourcing business continued to post solid results Recurring revenues now comprise approximately 60% of total Appraisal business improving due to workouts, bankruptcies and foreclosures Asia Pacific geography showed strongest recovery Cost reductions complete relative to $600 million target Balance sheet improvements continued with $985 million of loan modifications |
|
|
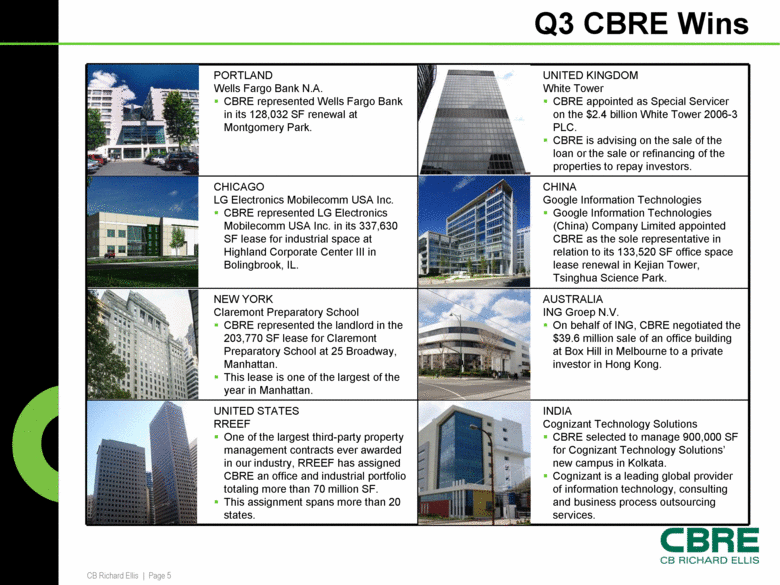
Q3 CBRE Wins PORTLAND Wells Fargo Bank N.A. CBRE represented Wells Fargo Bank in its 128,032 SF renewal at Montgomery Park. UNITED KINGDOM White Tower CBRE appointed as Special Servicer on the $2.4 billion White Tower 2006-3 PLC. CBRE is advising on the sale of the loan or the sale or refinancing of the properties to repay investors. CHICAGO LG Electronics Mobilecomm USA Inc. CBRE represented LG Electronics Mobilecomm USA Inc. in its 337,630 SF lease for industrial space at Highland Corporate Center III in Bolingbrook, IL. CHINA Google Information Technologies Google Information Technologies (China) Company Limited appointed CBRE as the sole representative in relation to its 133,520 SF office space lease renewal in Kejian Tower, Tsinghua Science Park. NEW YORK Claremont Preparatory School CBRE represented the landlord in the 203,770 SF lease for Claremont Preparatory School at 25 Broadway, Manhattan. This lease is one of the largest of the year in Manhattan. AUSTRALIA ING Groep N.V. On behalf of ING, CBRE negotiated the $39.6 million sale of an office building at Box Hill in Melbourne to a private investor in Hong Kong. UNITED STATES RREEF One of the largest third-party property management contracts ever awarded in our industry, RREEF has assigned CBRE an office and industrial portfolio totaling more than 70 million SF. This assignment spans more than 20 states. INDIA Cognizant Technology Solutions CBRE selected to manage 900,000 SF for Cognizant Technology Solutions’ new campus in Kolkata. Cognizant is a leading global provider of information technology, consulting and business process outsourcing services. |
|
|
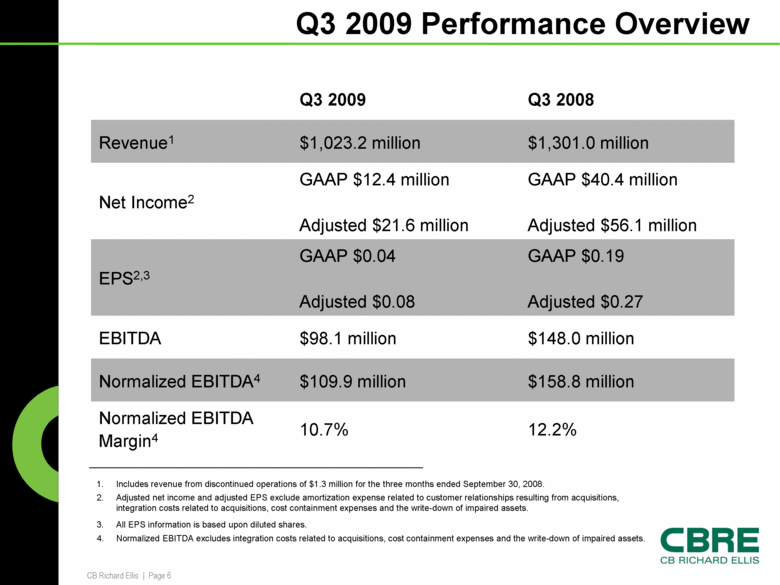
Q3 2009 Performance Overview Q3 2008 Q3 2009 $158.8 million $109.9 million Normalized EBITDA4 12.2% 10.7% Normalized EBITDA Margin4 $148.0 million $98.1 million EBITDA GAAP $0.19 Adjusted $0.27 GAAP $0.04 Adjusted $0.08 EPS2,3 GAAP $40.4 million Adjusted $56.1 million GAAP $12.4 million Adjusted $21.6 million Net Income2 $1,301.0 million $1,023.2 million Revenue1 Includes revenue from discontinued operations of $1.3 million for the three months ended September 30, 2008. Adjusted net income and adjusted EPS exclude amortization expense related to customer relationships resulting from acquisitions, integration costs related to acquisitions, cost containment expenses and the write-down of impaired assets. All EPS information is based upon diluted shares. Normalized EBITDA excludes integration costs related to acquisitions, cost containment expenses and the write-down of impaired assets. |
|
|
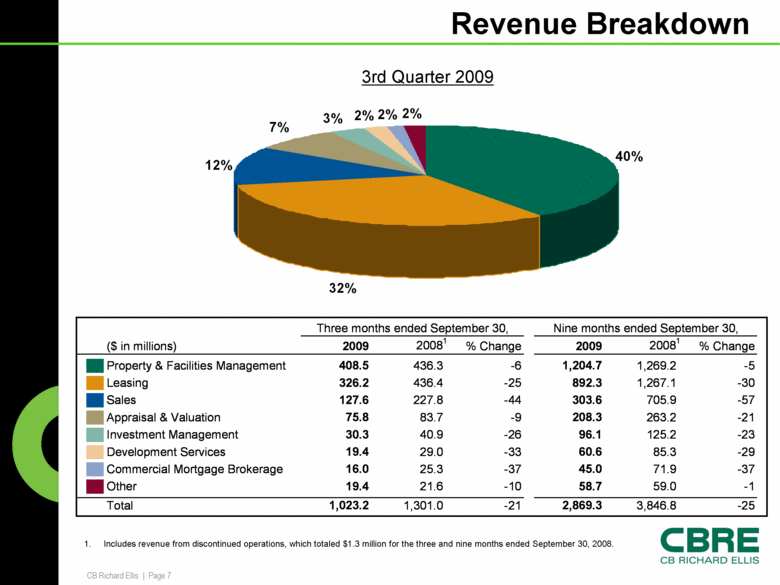
Revenue Breakdown 3rd Quarter 2009 Includes revenue from discontinued operations, which totaled $1.3 million for the three and nine months ended September 30, 2008. 40% 32% 12% 7% 3% 2% 2% 2% ($ in millions) 2009 20081 % Change 2009 20081 % Change Property & Facilities Management 408.5 436.3 -6 1,204.7 1,269.2 -5 Leasing 326.2 436.4 -25 892.3 1,267.1 -30 Sales 127.6 227.8 -44 303.6 705.9 -57 Appraisal & Valuation 75.8 83.7 -9 208.3 263.2 -21 Investment Management 30.3 40.9 -26 96.1 125.2 -23 Development Services 19.4 29.0 -33 60.6 85.3 -29 Commercial Mortgage Brokerage 16.0 25.3 -37 45.0 71.9 -37 Other 19.4 21.6 -10 58.7 59.0 -1 Total 1,023.2 1,301.0 -21 2,869.3 3,846.8 -25 Nine months ended September 30, Three months ended September 30, |
|
|
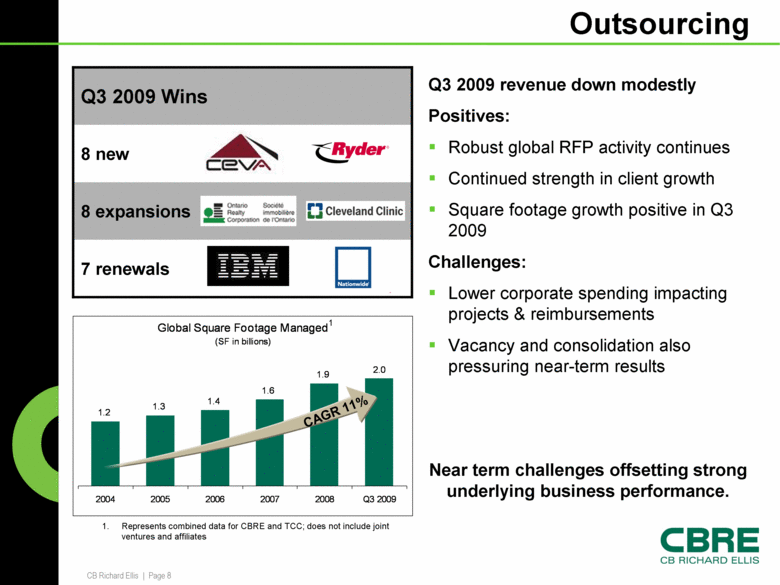
Outsourcing Q3 2009 Wins 7 renewals 8 expansions 8 new CAGR 11% 1. Represents combined data for CBRE and TCC; does not include joint ventures and affiliates 1 Q3 2009 revenue down modestly Positives: Robust global RFP activity continues Continued strength in client growth Square footage growth positive in Q3 2009 Challenges: Lower corporate spending impacting projects & reimbursements Vacancy and consolidation also pressuring near-term results Near term challenges offsetting strong underlying business performance. Global Square Footage Managed (SF in billions) 1.2 1.3 1.4 1.6 2.0 1.9 2004 2005 2006 2007 2008 Q3 2009 |
|
|
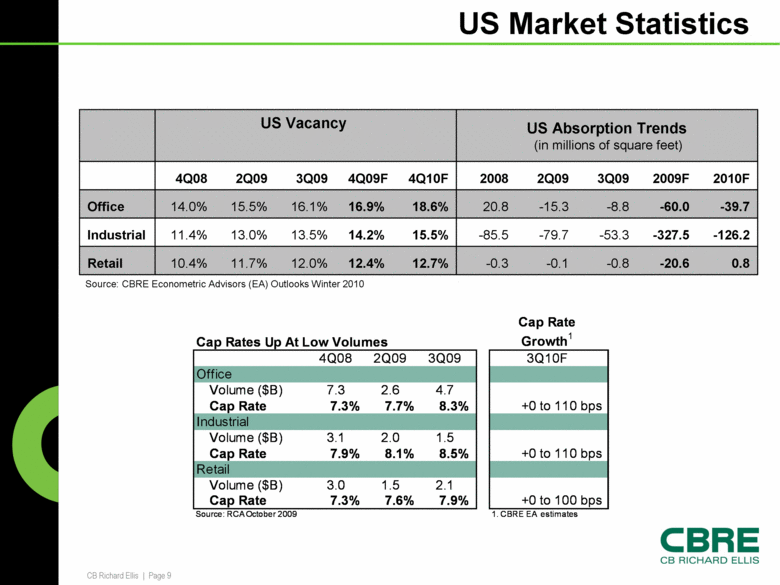
US Market Statistics 0.8 -20.6 -0.8 -0.1 -0.3 12.7% 12.4% 12.0% 11.7% 10.4% Retail -126.2 -327.5 -53.3 -79.7 -85.5 15.5% 14.2% 13.5% 13.0% 11.4% Industrial -39.7 -60.0 -8.8 -15.3 20.8 18.6% 16.9% 16.1% 15.5% 14.0% Office 2010F 2009F 3Q09 2Q09 2008 4Q10F 4Q09F 3Q09 2Q09 4Q08 US Absorption Trends (in millions of square feet) US Vacancy Source: CBRE Econometric Advisors (EA) Outlooks Winter 2010 3Q10F Cap Rates Up At Low Volumes Cap Rate Growth1 4Q08 2Q09 3Q09 3Q10F Office Volume ($B) 7.3 2.6 4.7 Cap Rate 7.3% 7.7% 8.3% +0 to 110 bps Industrial Volume ($B) 3.1 2.0 1.5 Cap Rate 7.9% 8.1% 8.5% +0 to 110 bps Retail Volume ($B) 3.0 1.5 2.1 Cap Rate 7.3% 7.6% 7.9% +0 to 100 bps Source: RCA October 2009 1. CBRE EA estimates |
|
|
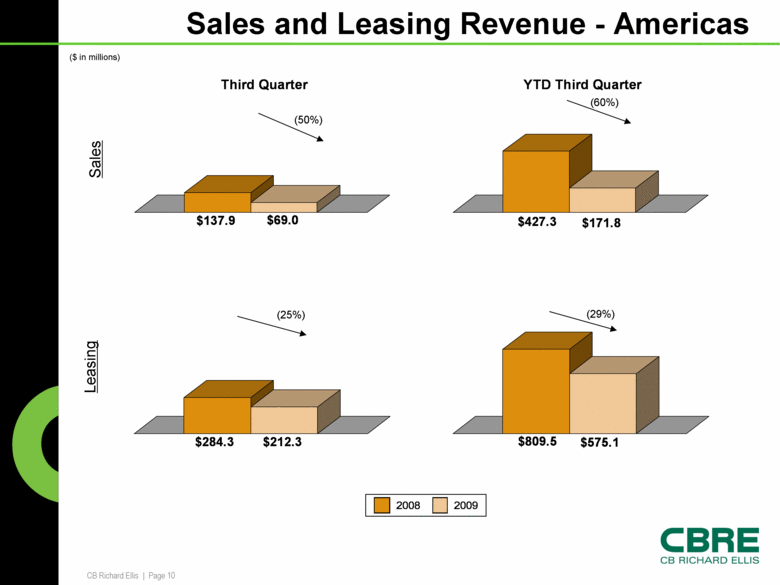
Sales and Leasing Revenue - Americas ($ in millions) Sales Leasing (60%) (29%) (50%) (25%) $284.3 $212.3 $427.3 $171.8 YTD Third Quarter $137.9 $69.0 Third Quarter $809.5 $575.1 2008 2009 |
|
|
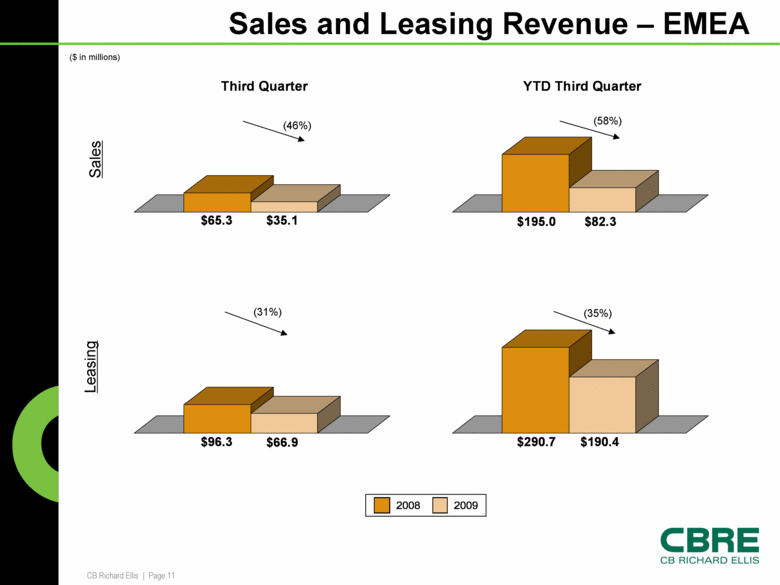
Sales and Leasing Revenue – EMEA ($ in millions) Sales Leasing (58%) (35%) (46%) (31%) $96.3 $66.9 $290.7 $190.4 $195.0 $82.3 YTD Third Quarter $65.3 $35.1 Third Quarter 2008 2009 |
|
|
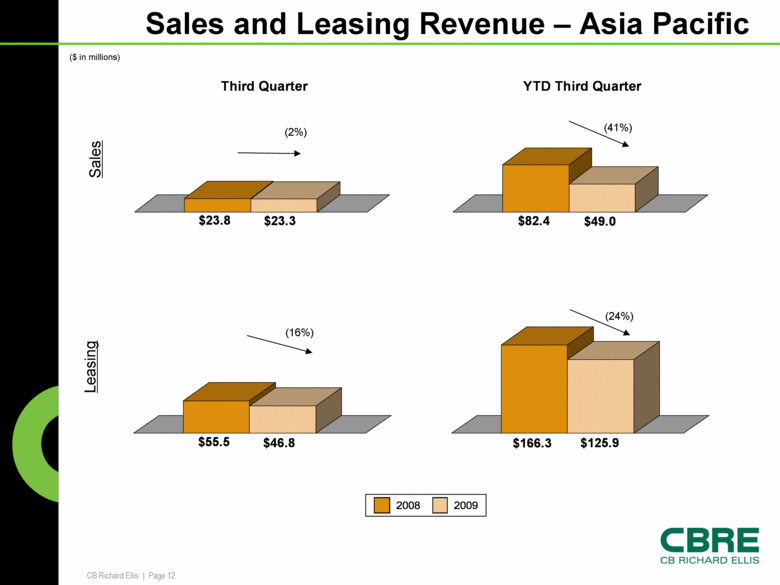
Sales and Leasing Revenue – Asia Pacific ($ in millions) Sales Leasing (41%) (2%) (24%) (16%) $23.8 $23.3 Third Quarter $82.4 $49.0 YTD Third Quarter $55.5 $46.8 $166.3 $125.9 2008 2009 |
|
|
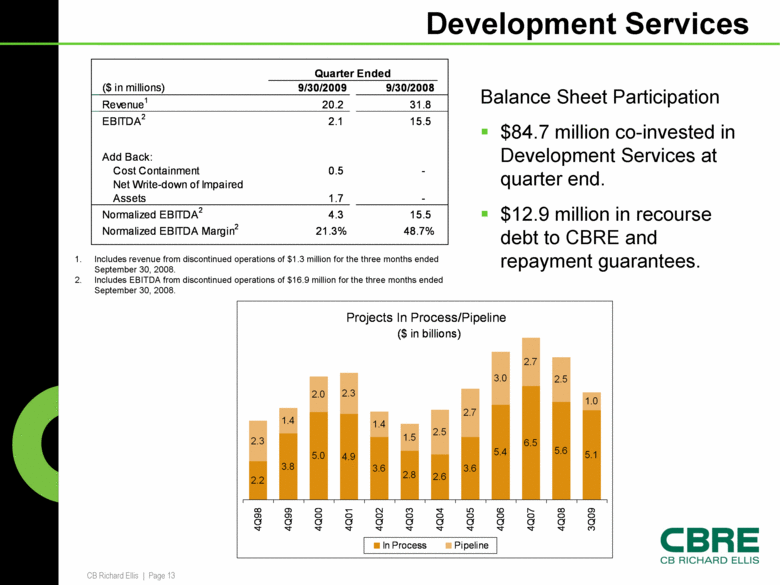
Development Services Balance Sheet Participation $84.7 million co-invested in Development Services at quarter end. $12.9 million in recourse debt to CBRE and repayment guarantees. Includes revenue from discontinued operations of $1.3 million for the three months ended September 30, 2008. Includes EBITDA from discontinued operations of $16.9 million for the three months ended September 30, 2008. 15.5 4.3 - 1.7 Projects In Process/Pipeline ($ in billions) 2.2 3.8 5.0 4.9 3.6 2.8 2.6 3.6 5.4 6.5 5.6 5.1 2.3 1.4 2.0 2.3 1.4 1.5 2.5 2.7 3.0 2.7 2.5 1.0 4Q98 4Q99 4Q00 4Q01 4Q02 4Q03 4Q04 4Q05 4Q06 4Q07 4Q08 3Q09 In Process Pipeline Quarter Ended Year Ended ($in millions) 9/30/2009 9/30/2008 12/31/2008 Revenue1 20.2 31.8 120.1 EBITDA2 2.1 15.5 (34.4) Add Back: Cost Containment - 3.1 Net Write-down of Impaired 0.5 Assets 1.7 - 49.2 Normalized EBITDA2 4.3 15.5 17.9 Normalized EBITDA Margin2 21.3% 48.7% 14.9% |
|
|
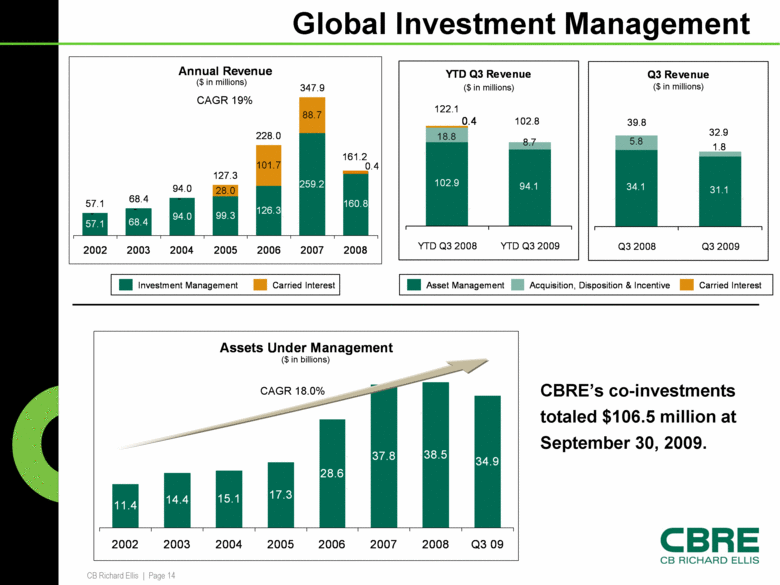
Global Investment Management ($ in billions) ($ in millions) CBRE’s co-investments totaled $106.5 million at September 30, 2009. CAGR 19% CAGR 18.0% ($ in millions) ($ in millions) YTD Q3 Revenue 102.9 94.1 18.8 8.7 0.4 122.1 102.8 YTD Q3 2008 YTD Q3 2009 Q3 Revenue 34.1 31.1 5.8 1.8 32.9 39.8 Q3 2008 Q3 2009 Assets Under Management 11.4 14.4 15.1 17.3 28.6 37.8 38.5 34.9 2002 2003 2004 2005 2006 2007 2008 Q3 09 Investment Management Carried Interest Asset Management Acquisition, Disposition & Incentive Carried Interest Annual Revenue 57.1 68.4 94.0 99.3 126.3 259.2 160.8 - - - 28.0 101.7 88.7 0.4 57.1 68.4 94.0 127.3 228.0 347.9 161.2 2002 2003 2004 2005 2006 2007 2008 |
|
|
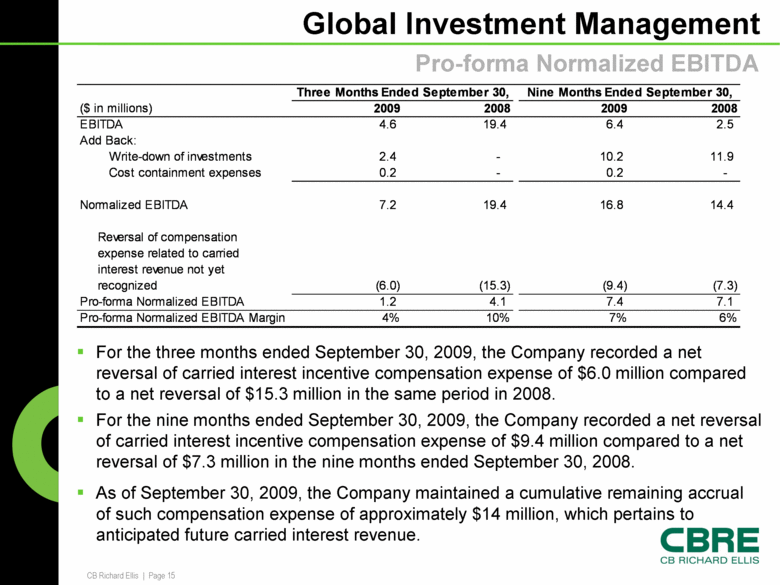
Global Investment Management For the three months ended September 30, 2009, the Company recorded a net reversal of carried interest incentive compensation expense of $6.0 million compared to a net reversal of $15.3 million in the same period in 2008. For the nine months ended September 30, 2009, the Company recorded a net reversal of carried interest incentive compensation expense of $9.4 million compared to a net reversal of $7.3 million in the nine months ended September 30, 2008. As of September 30, 2009, the Company maintained a cumulative remaining accrual of such compensation expense of approximately $14 million, which pertains to anticipated future carried interest revenue. Pro-forma Normalized EBITDA 4.1 YTD Q3 2008 YTD Q3 2009 Asset Management 102.9 94.1 Acquisition, Disposition & Incentive 18.8 8.7 Carried Int 0.4 0.0 Total 122.1 102.8 Q3 2008 Q3 2009 Asset Management 34.1 31.1 Acquisition, Disposition & Incentive 5.8 1.8 Carried Int 0.0 0.0 Total 39.8 32.9 |
|
|
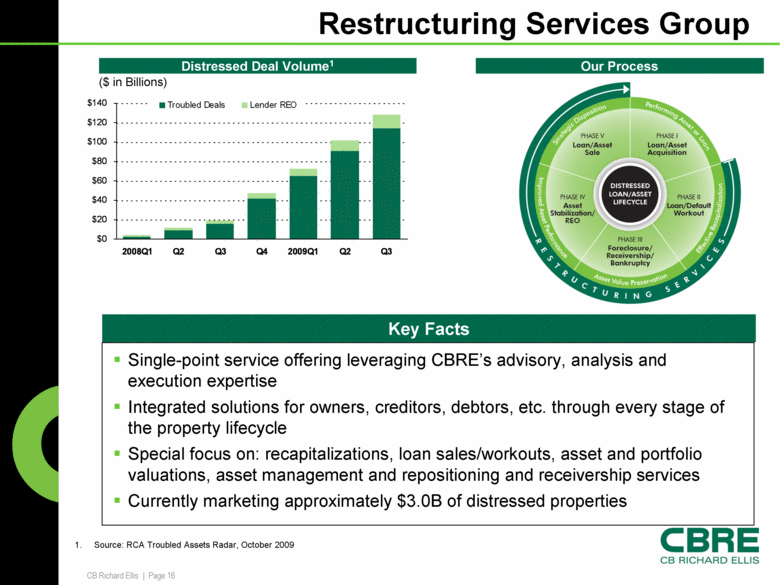
Restructuring Services Group Distressed Deal Volume1 Source: RCA Troubled Assets Radar, October 2009 Our Process Single-point service offering leveraging CBRE’s advisory, analysis and execution expertise Integrated solutions for owners, creditors, debtors, etc. through every stage of the property lifecycle Special focus on: recapitalizations, loan sales/workouts, asset and portfolio valuations, asset management and repositioning and receivership services Currently marketing approximately $3.0B of distressed properties Key Facts ($ in Billions) $0 $20 $40 $60 $80 $100 $120 $140 2008Q1 Q2 Q3 Q4 2009Q1 Q2 Q3 Troubled Deals Lender REO |
|
|
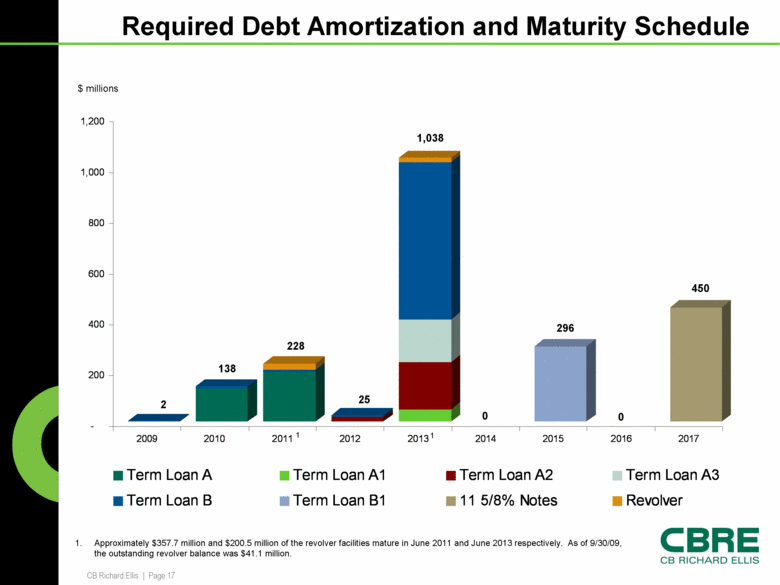
Required Debt Amortization and Maturity Schedule $ millions 1,038 2 138 228 25 296 450 Approximately $357.7 million and $200.5 million of the revolver facilities mature in June 2011 and June 2013 respectively. As of 9/30/09, the outstanding revolver balance was $41.1 million. 0 0 1 1 - 200 400 600 800 1,000 1,200 2009 2010 2011 2012 2013 2014 2015 2016 2017 Term Loan A Term Loan A1 Term Loan A2 Term Loan A3 Term Loan B Term Loan B1 11 5/8% Notes Revolver |
|
|
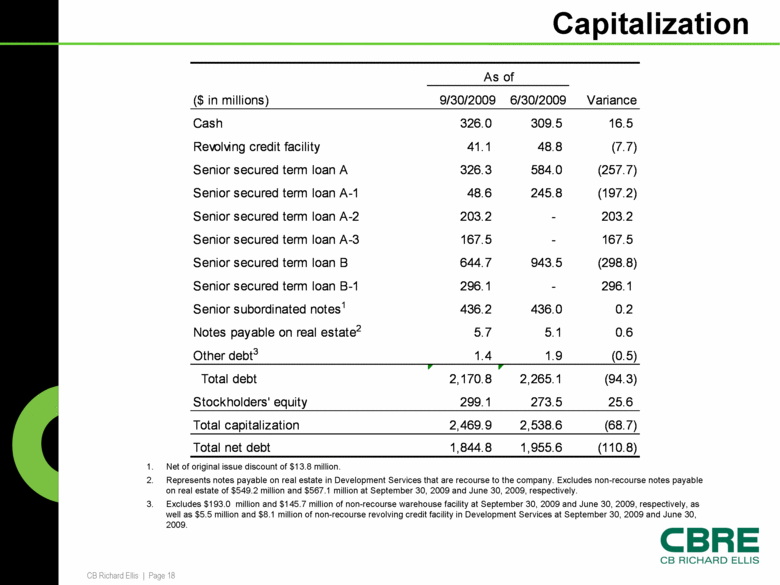
Capitalization Net of original issue discount of $13.8 million. Represents notes payable on real estate in Development Services that are recourse to the company. Excludes non-recourse notes payable on real estate of $549.2 million and $567.1 million at September 30, 2009 and June 30, 2009, respectively. Excludes $193.0 million and $145.7 million of non-recourse warehouse facility at September 30, 2009 and June 30, 2009, respectively, as well as $5.5 million and $8.1 million of non-recourse revolving credit facility in Development Services at September 30, 2009 and June 30, 2009. (110.8) 1,955.6 1,844.8 Total net debt (68.7) 2,538.6 2,469.9 Total capitalization 25.6 273.5 299.1 Stockholders' equity (94.3) 2,265.1 2,170.8 Total debt (0.5) 1.9 1.4 Other debt3 0.6 5.1 5.7 Notes payable on real estate2 0.2 436.0 436.2 Senior subordinated notes1 296.1 - 296.1 Senior secured term loan B-1 (298.8) 943.5 644.7 Senior secured term loan B 167.5 - 167.5 Senior secured term loan A-3 203.2 - 203.2 Senior secured term loan A-2 (197.2) 245.8 48.6 Senior secured term loan A-1 (257.7) 584.0 326.3 Senior secured term loan A (7.7) 48.8 41.1 Revolving credit facility 16.5 309.5 326.0 Cash Variance 6/30/2009 9/30/2009 ($ in millions) As of |
|
|
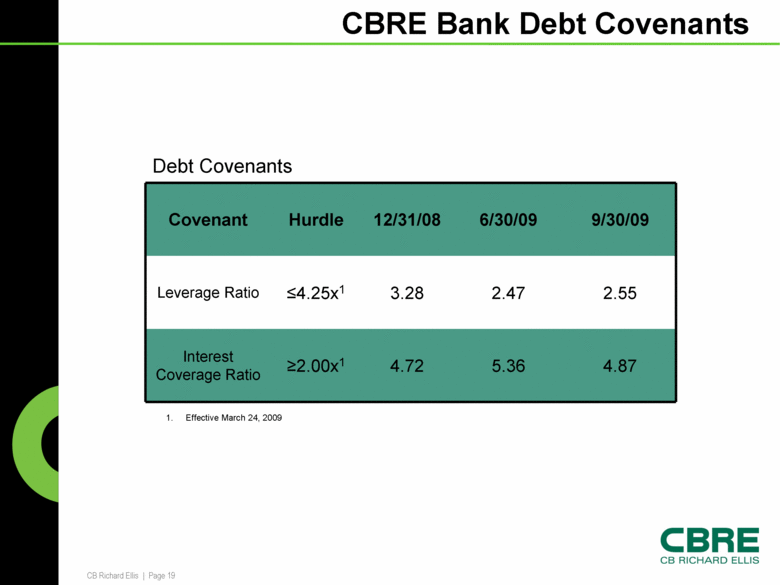
CBRE Bank Debt Covenants Covenant Hurdle 12/31/08 6/30/09 9/30/09 Leverage Ratio <4.25x1 3.28 2.47 2.55 Interest Coverage Ratio >2.00x1 4.72 5.36 4.87 Debt Covenants Effective March 24, 2009 |
|
|
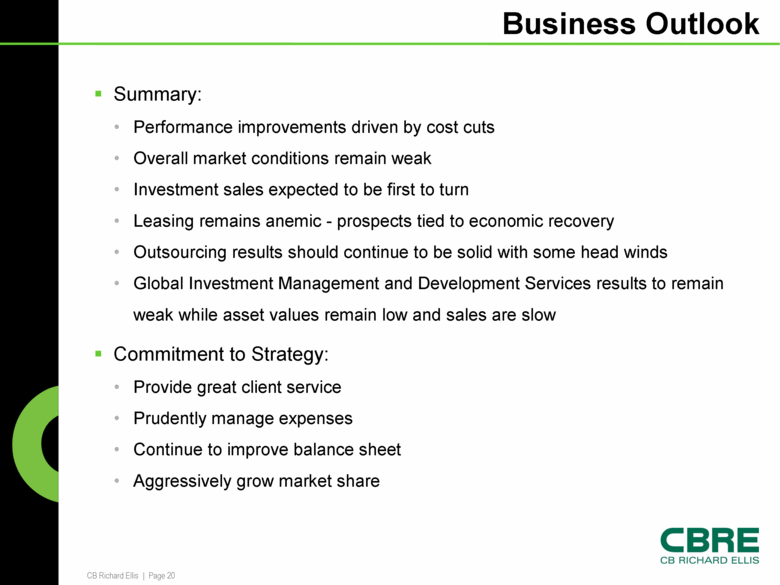
Business Outlook Summary: Performance improvements driven by cost cuts Overall market conditions remain weak Investment sales expected to be first to turn Leasing remains anemic - prospects tied to economic recovery Outsourcing results should continue to be solid with some head winds Global Investment Management and Development Services results to remain weak while asset values remain low and sales are slow Commitment to Strategy: Provide great client service Prudently manage expenses Continue to improve balance sheet Aggressively grow market share |
|
|
GAAP Reconciliation Tables |
|
|
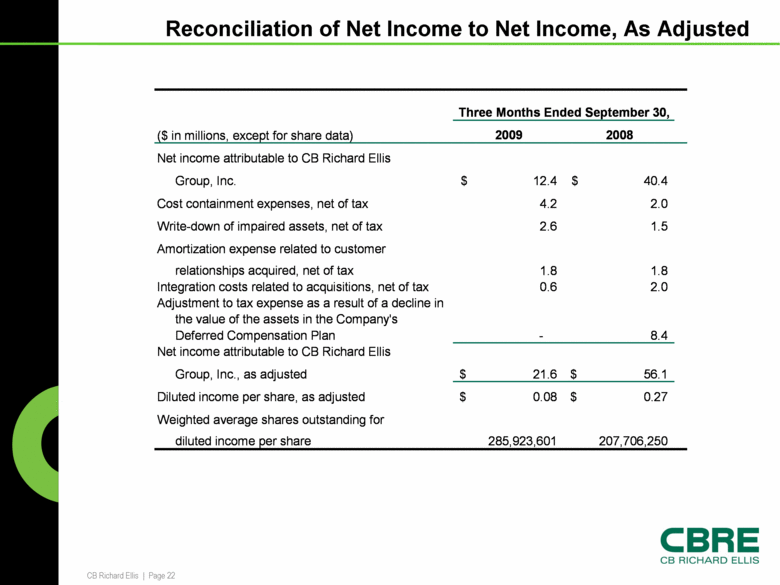
Reconciliation of Net Income to Net Income, As Adjusted 207,706,250 285,923,601 diluted income per share Weighted average shares outstanding for $ 0.27 $ 0.08 Diluted income per share, as adjusted $ 56.1 $ 21.6 Group, Inc., as adjusted Net income attributable to CB Richard Ellis 8.4 - Deferred Compensation Plan the value of the assets in the Company's Adjustment to tax expense as a result of a decline in 2.0 0.6 Integration costs related to acquisitions, net of tax 1.8 1.8 relationships acquired, net of tax Amortization expense related to customer 1.5 2.6 Write-down of impaired assets, net of tax 2.0 4.2 Cost containment expenses, net of tax $ 40.4 $ 12.4 Group, Inc. Net income attributable to CB Richard Ellis 2008 2009 ($ in millions, except for share data) Three Months Ended September 30, |
|
|
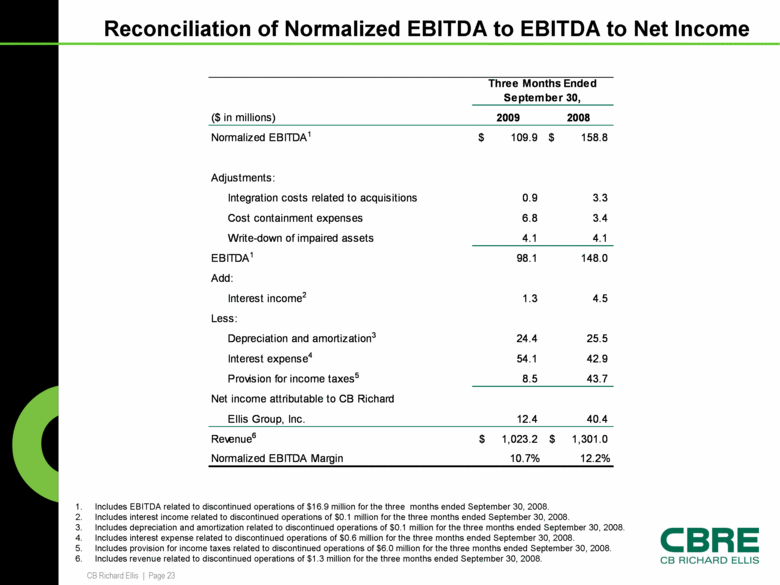
Reconciliation of Normalized EBITDA to EBITDA to Net Income Includes EBITDA related to discontinued operations of $16.9 million for the three months ended September 30, 2008. Includes interest income related to discontinued operations of $0.1 million for the three months ended September 30, 2008. Includes depreciation and amortization related to discontinued operations of $0.1 million for the three months ended September 30, 2008. Includes interest expense related to discontinued operations of $0.6 million for the three months ended September 30, 2008. Includes provision for income taxes related to discontinued operations of $6.0 million for the three months ended September 30, 2008. Includes revenue related to discontinued operations of $1.3 million for the three months ended September 30, 2008. Three Months Ended September 30, ($in millions) 2009 2008 Normalized EBITDA1 $109.9 $158.8 Adjustments: Integration costs related to acquisitions 0.9 3.3 Cost containment expenses 6.8 3.4 Write-down of impaired assets 4.1 4.1 EBITDA1 98.1 148.0 Add: Interest income2 1.3 4.5 Less: Depreciation and amortization3 24.4 25.5 Interest expense4 54.1 42.9 Provision for income taxes5 8.5 43.7 Net income attributable to CB Richard Ellis Group, Inc. 12.4 40.4 Revenue6 $1,023.2 $1,301.0 Normalized EBITDA Margin 10.7% 12.2% |

