Attached files
| file | filename |
|---|---|
| 8-K - FORM 8-K - REGIONS FINANCIAL CORP | d8k.htm |
| EX-99.1 - PRESS RELEASE - REGIONS FINANCIAL CORP | dex991.htm |
| EX-99.2 - SUPPLEMENTAL FINANCIAL INFORMATION - REGIONS FINANCIAL CORP | dex992.htm |
 Regions Financial 3rd Quarter Earnings Conference Call October 20, 2009 * * * * * * * * * * * * Exhibit 99.3 |
| Forward
Looking Statements The information contained in this presentation may include
forward-looking statements which reflect Regions' current views with respect to future events and financial performance. The Private Securities Litigation Reform Act of 1995 (the “Act”) provides a “safe harbor” for forward-looking statements which are identified as such and are accompanied by the identification of important factors that could cause actual results
to differ materially from the forward-looking statements. For these statements, we, together with our subsidiaries, claim the protection afforded by the safe harbor in the Act. Forward-looking statements are not based on historical information, but rather are related to future operations, strategies, financial results or other developments.
Forward-looking statements are based on management’s expectations as well as certain assumptions and estimates made by, and information available to, management at the time the statements are made. Those statements are based on
general assumptions and are subject to various risks, uncertainties and
other factors that may cause actual results to differ materially from the views, beliefs and projections expressed in such statements. These risks, uncertainties and other factors include, but are not
limited to, those described below: › In October 2008 Congress enacted and the President signed into law the Emergency
Economic Stabilization Act of 2008, and on February 17, 2009 the American Recovery and Reinvestment Act of 2009 was signed into law. Additionally, the Department of the U.S. Treasury and federal banking regulators are implementing a number of programs to address capital and liquidity issues in the banking system, and
may announce additional programs in the future, all of which may have significant effects on Regions and the financial services industry, the exact nature and extent of which cannot be determined at this time. › The impact of compensation and other restrictions imposed under the Troubled Asset
Relief Program (“TARP”) until Regions is able to repay the outstanding preferred stock issued under the TARP. › Possible additional loan losses and impairment of goodwill and other intangibles and the
impact on earnings and capital. › Possible changes in interest rates may affect funding costs and reduce earning asset
yields, thus reducing margins. › Possible changes in general economic and business conditions in the United States in
general and in the communities Regions serves in particular. ›
Possible changes in the creditworthiness of customers and the possible impairment of the collectibility of loans. › Possible changes in trade, monetary and fiscal policies, laws and regulations, and other
activities of governments, agencies, and similar organizations, including changes in accounting standards, may have an adverse effect on business. › The current stresses in the financial and real estate markets, including possible
continued deterioration in property values. › Regions' ability to manage fluctuations in the value of assets and liabilities and
off-balance sheet exposure so as to maintain sufficient capital and liquidity to support Regions' business. › Regions' ability to achieve the earnings expectations related to businesses that have been acquired or that may be acquired in the future. › Regions' ability to expand into new markets and to maintain profit margins in the face
of competitive pressures. › Regions' ability to develop competitive new products and services in a timely manner and
the acceptance of such products and services by Regions' customers and potential customers. › Regions' ability to keep pace with technological changes. › Regions' ability to effectively manage credit risk, interest rate risk, market risk,
operational risk, legal risk, liquidity risk, and regulatory and compliance risk. › The cost and other effects of material contingencies, including litigation
contingencies. › The effects of increased competition from both banks and non-banks. › The effects of geopolitical instability and risks such as terrorist attacks. › Possible changes in consumer and business spending and saving habits could affect
Regions' ability to increase assets and to attract deposits. ›
The effects of weather and natural disasters such as droughts and hurricanes.
The foregoing list of factors is not exhaustive; for discussion of these and other risks that may cause actual results to differ from expectations, please look under the caption “Forward-Looking Statements” in Regions’ Annual Report on Form 10-K for the year ended December 31, 2008 and Forms 10-Q
for the quarters ended March 31, 2009 (as amended) and June 30, 2009, as on file with the Securities and Exchange Commission. See also Item 1A. “Risk Factors” of the June 30, 2009 Quarterly Report on Form 10-Q. The words "believe," "expect," "anticipate," "project,"
and similar expressions often signify forward-looking statements. You should not place undue reliance on any forward- looking statements, which speak only as of the date made. We assume no obligation to
update or revise any forward-looking statements that are made from time to time. |
| Summary of Third Quarter 2009 Results › Loss per diluted share of $0.37 › Average low-cost customer deposit growth again strong, up $1.3 billion, reflective
of: › $701 million or 3% increase in non-interest bearing deposits; › $969 million or 4% increase in money market deposits › Loans declined $1 billion on average, on light recession-impacted demand › Net interest margin rose 11 basis points to 2.73%, benefiting from low cost deposit
growth and improved loan spreads; net interest income rose $14 million
despite smaller earning asset base › Non-interest revenues, as adjusted, were essentially unchanged as higher service
charges and mortgage income were partially offset by a reduction in
brokerage revenues › Non-interest expenses increased due to branch consolidation costs, increased
recession-related professional fees and other real estate
write-downs › Capital ratios remain strong, with Tier 1 of 12.1% and Tier 1 Common equity of
7.8% › Credit quality › Annualized net charge-offs increased to 2.86% of average loans, driven by
value-related charges and aggressive asset dispositions › Allowance for credit losses stands at 2.90% of loans with $1.025 billion provision exceeding net charge-offs by $345 million › Allowance for loan losses coverage of non-performing loans of 0.82x (1) › Non-performing loans increased $598 million to $3.2 billion (1) Note: Comparisons are to previous quarter (1) Excluding loans held for sale |
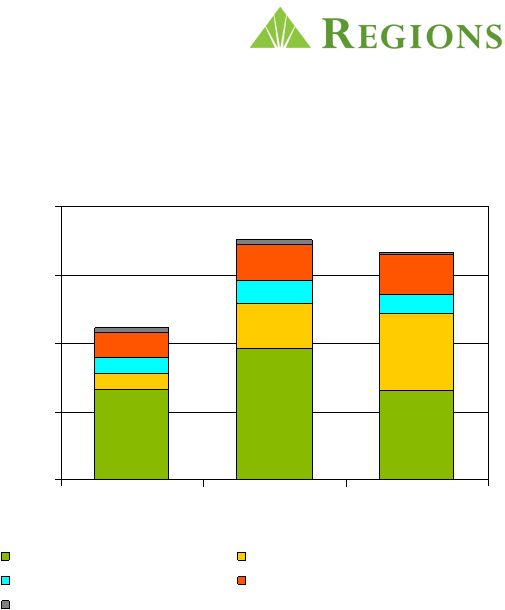
 Elevated Loan Loss Provision Driven by Real Estate Portfolios › Increase in net charge-offs of $189 million › CRE Valuation losses increased – 85% were first time charges (in millions) 4Q08 1Q09 2Q09 3Q09 Net Charge-offs CRE Valuation Losses $124 $92 $129 $191 Commercial Real Estate 13 24 39 45 Other Commercial 67 70 99 136 Consumer Real Estate 95 134 164 150 Other Consumer 31 29 24 30 Net Charge-offs excluding charge- offs from Sales / Transfers to HFS 330 349 455 552 Sales/Transfer to HFS 466 41 36 128 Total Net Charge-offs 796 390 491 680 Provision Over Net Charge-Offs 354 35 421 345 Loan Loss Provision $1,150 $425 $912 $1,025 |
 Focused on Resolution of Non-Performing Assets 1. Excludes Held for Sale. ($ in millions) 3Q 2008 4Q 2008 1Q 2009 2Q 2009 3Q 2009 Beginning Non-Performing Assets¹ $ 1,621 $ 1,642 $ 1,295 $ 1,935 $ 3,057 Additions $ 721 $ 1,004 $ 1,116 $ 1,758 $ 1,667 Payments (70) (82) (55) (116) (90) Returned to Accruing Status (19) (44) (34) (10) (42) Charge-Offs / OREO Write-Downs (180) (243) (215) (296) (440) Net Additions $ 452 $ 635 $ 812 $ 1,336 $ 1,095 Dispositions (173) (276) (81) (80) (232) Moved to Held for Sale (258) (706) (91) (134) (201) Ending Non-Performing Assets¹ $ 1,642 $ 1,295 $ 1,935 $ 3,057 $ 3,719 Change Versus Previous Quarter $21 ($347) $640 $1,122 $662 |
 $1,116 $1,758 $1,667 › Income producing CRE, principally Multi-Family and Retail, continued to increase while the combined Homebuilder and Condo migration declined › 51% of Total CRE non- performing loans are in Florida and Georgia, our two primary markets of concern Gross NPA Migration Lower than Prior Quarter $0 $500 $1,000 $1,500 $2,000 1Q09 2Q09 3Q09 Homebuilder, Condo and Other Income Producing CRE Business and Community Commercial Consumer $ Millions |
 Problem Asset Dispositions ($ in millions) 1Q 2009 2Q 2009 3Q 2009 2009 YTD OREO $ 57 $ 65 $ 111 $ 233 Problem Loan Sales 24 15 170 209 Held for Sale 56 67 72 195 Total Sales $ 137 $ 147 $ 353 $ 637 Transfer to Held for Sale 91 134 201 426 Total Dispositions $ 228 $ 281 $ 554 $ 1,063 Held for Sale Balance 393 371 380 380 |
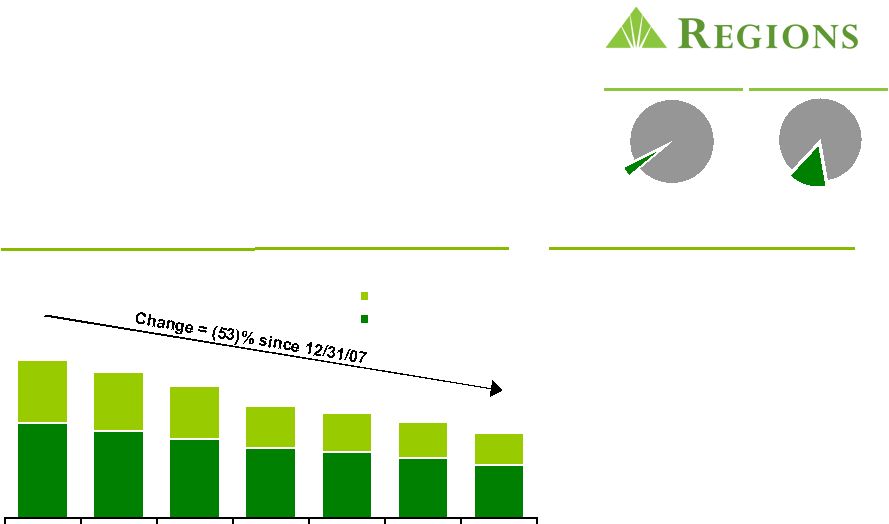 Homebuilder $3.4bn / 3.6% of Total Portfolio; 14.6% of NOO-CRE % of Total Portfolio % of Total CRE NOO 3.6% Continue to Reduce Exposure ($mm) 14.6% › Reduced exposure by 53% since 12/31/07 › Transferred 68 Real Estate bankers to workout positions › Frequent contact with borrowers › Closely tracking collateral values › Starting to see more short- sale activity indicating values are beginning to stabilize Observations 1Q08 2Q08 3Q08 4Q08 1Q09 2Q09 3Q09 FL / N. GA Remaining Portfolio $4,402 $5,202 $5,758 $6,231 $4,148 $3,786 $3,352 |
 Condominium $647mm / 0.7% of Total Portfolio % of Total Portfolio % of Total CRE NOO Effectively Reducing Exposure ($mm) › Minimal exposure remaining › 50% of portfolio is in Florida 0.7% 2.8% 1Q08 2Q08 3Q08 4Q08 1Q09 2Q09 3Q09 Florida Remaining Portfolio $ 1,367 $ 1,266 $ 1,082 $ 946 $ 850 $ 711 $ 647 |
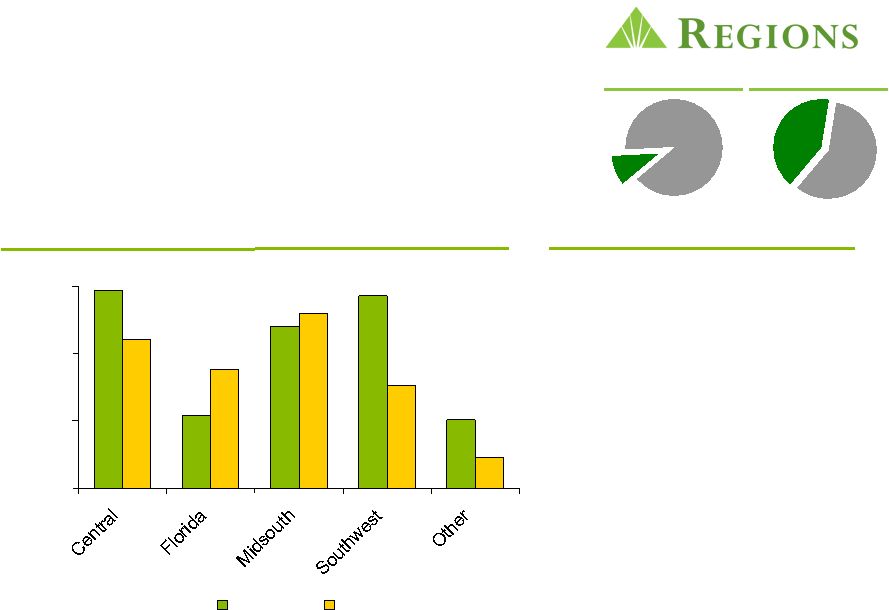 Multi-Family and Retail Including Business and Community $9.4bn / 10% of Total Portfolio › More subject to workout and restructure and subsequent return to accrual status › Well-diversified by type and geography % of Total Portfolio % of Total CRE NOO By Geography Observations $0 $500 $1,000 $1,500 Multi-Family Retail Note: Central includes: AL, GA, SC; Midsouth includes: IL, IN, IA, KY, MO, NC, VA, TN; Southwest includes: AR, LA, MS, TX $ Millions 10.2% 41.3% |
 Home
Equity - $15.6bn / 17% of Total Loans Most Stressed Portion is Florida 2 nd Liens - 3.8% of Total Loans Entire Home Equity Portfolio: › Branch originated, in-footprint balances › Active monitoring and management of lines › Home equity charge-offs declined $19 million linked quarter › Weighted average FICO of 738 › 42% in 1 st lien position › Average loan size of $75 thousand Florida 2 nd Lien Portion: › Florida 2 nd Lien 3Q09 charge-offs of 6.33% vs. 1.20% for remainder of portfolio › Florida 2 nd lien concentration (23%) primary driver of recent Home Equity performance Observations Other States 1 st Lien 28% Other States 2 nd Lien 35% Florida 1 st Lien 14% Florida 2 nd Lien 23% |
 Appropriate Reserve Coverage Total Loan Balances NPL Balances Allowance Total Loans NPLs Specific Analysis Loans (loans over $2.5 million) 2,039 2,039 404 19.8% 0.20x All Other Loans 90,715 1,177 2,223 2.5% 1.89x Total 92,754 3,216 2,627 2.8% 0.82x ALLL as % of |
 Loan
Trends ($ in millions) 6/30/2009 9/30/2009 $ Change % Change Commercial & Industrial 22,707 $ 22,443 $ (264) $ -1% Commercial Real Estate - Non Owner-Occupied 16,081 16,470 389 2% Commercial Real Estate - Owner-Occupied 11,983 12,188 205 2% Construction - Non Owner-Occupied 7,474 7,010 (464) -6% Construction - Owner-Occupied 1,198 944 (254) -21% Commercial 59,443 59,055 (388) -1% Residential First Mortgage 15,593 15,508 (85) -1% Home Equity 15,940 15,714 (226) -1% Other consumer 4,406 4,077 (329) -7% Consumer 35,939 35,299 (640) -2% Total Loans 95,382 $ 94,354 $ (1,028) $ -1% Loan Portfolio - Average Balances |
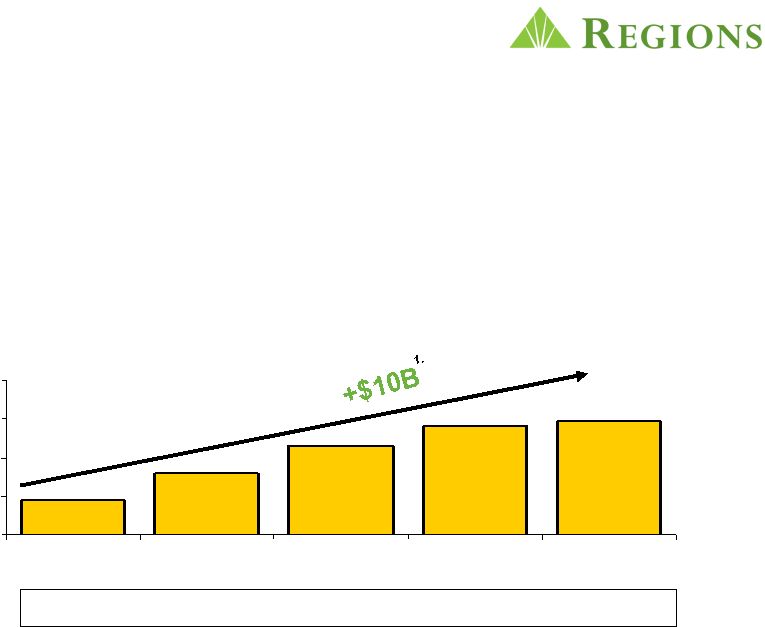 Total Average Customer
Deposits 80 85 90 95 100 Q3 '08 Q4 '08 Q1 '09 Q2 '09 Q3 '09 Strong Account Growth and High Customer Retention Lead to Rising Customer Deposits › Opened a record 270,000 new retail and business checking accounts in 3Q09 YTD up 29% versus 3Q08; 762,000 new accounts YTD; On the road to 1 MM new accounts in 2009 › Retention remains better than industry norms and at historical highs › Average customer deposits grew over $10 billion in the last 4 quarters 1. Average deposits. Excludes wholesale deposit funding. $87.9 $94.7 $94.1 $91.6 $84.5 |
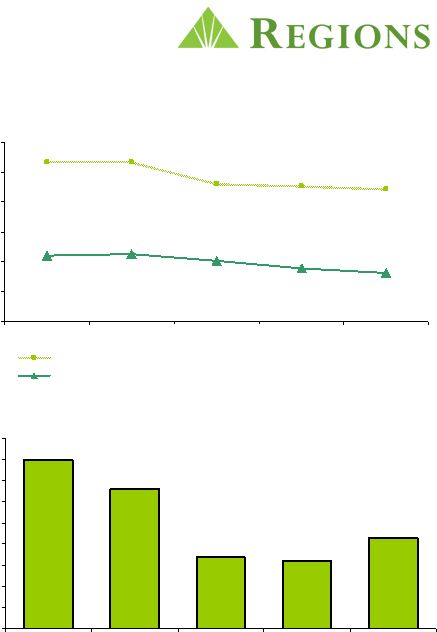 Improving Margin and Net Interest Income › Taxable-equivalent net interest income of $853 million - up $13 million › Higher net interest margin of 2.73% - up 11 basis points › Continued non-interest bearing deposit growth benefiting margin › Loan and deposit pricing improvements having a positive influence › Asset sensitive balance sheet well positioned for eventual rising rate environment Loan Yields and Deposit Costs 0.00 1.00 2.00 3.00 4.00 5.00 6.00 Q3 '08 Q4 '08 Q1 '09 Q2 '09 Q3 '09 Loan Yields Deposit Costs Net Interest Margin 2.30 2.40 2.50 2.60 2.70 2.80 2.90 3.00 3.10 3.20 Q3 '08 Q4 '08 Q1 '09 Q2 '09 Q3 '09 |
 Non-Interest Revenues Level with Prior Quarter › Service charges income improved reflecting higher level of customer transactions and account growth › Brokerage income lower compared to strong previous quarter › Mortgage income remains solid ($ in millions) Q2' 09 Q3' 09 $ % Non-interest revenue 1,199 $ 772 $ (427) $ -36% - Leveraged lease termination gains 189 4 - Securities gains 108 4 - VISA shares sale gain 80 - - Trust preferred exchange gain 61 - Non-interest revenue after adjustments 761 $ 764 $ 3 $ 0% Difference B/(W) |
| Solid
Morgan Keegan results › Fixed Income Capital Markets solid but lower versus an especially strong second quarter › Private Client revenue rises › Reflects strong equity markets and new financial advisors › Trust and Asset Management revenues higher › Customer and trust assets trending upward › New account openings reflect continued momentum |
| Non-interest Expenses › As reported non-interest expense up 1% linked quarter › Branch consolidation expenses totaled $41 million › Core non-interest expenses increased 9%, drivers included: › Other Real Estate costs › Professional fees › FDIC insurance expense, excluding special assessment › Salaries and benefits cost lower primarily due to headcount reductions and decreased brokerage-related incentive costs |
| Branch Consolidation Plan › $41 million in branch consolidation costs › 121 branches consolidated into existing locations › Branches will be consolidated due to proximity and opportunity for combined performance improvement › Execution will occur in 1 st Quarter of 2010 › Expected annual net savings of $21 million |
 PPNR
Adversely Impacted by Higher Credit- related Costs ($ in millions) Q2' 09 Q3' 09 $ % Pre-tax, Pre-provision Net Revenue 799 $ 374 $ (425) $ -53% - Leveraged lease termination impact (189) (4) 185 - Securities gains / VISA / TRUPS exchange (249) (4) 245 - FDIC special assessment 64 - (64) - Securities impairment 69 3 (66) - Branch consolidation costs - 41 41 Adjusted PPNR 494 $ 410 $ (84) $ -17% Difference B/(W) |
 After
three quarters, over $1 billion favorable to SCAP Stress Case scenario
* PPNR adjusted for Q2 capital raise activities 1. Regions PPNR – Q309 YTD 2. SCAP assumptions straight-lined; PPNR includes $0.4 billion overage from
1Q09 (in millions) RF 1 SCAP 2 Difference B/(W) Net Charge-offs (1,561) $ (3,450) $ 1,889 $ Provision Over Charge-offs (801) - (801) Total Loan Loss Provision (2,362) (3,450) 1,088 PPNR* 1,741 1,638 103 Pre-tax (621) $ (1,812) $ 1,191 $ |
 Net
Charge-Offs Below Fed Stress Test Level - Cumulative 0 200 400 600 800 1,000 1,200 1,400 1Q09 2Q09 3Q09 4Q09 1Q10 2Q10 3Q10 4Q10 Regulators - Stress Net Charge-Offs Regions - Base Net Charge-Offs Regions - Stress Net Charge-Offs Regions - Actual Net Charge-Offs $ millions $9.2B $5.9B $3.4B Does not include Provision over Net Charge-Offs |
 Capital Ratios Remain Strong › Tier 1 and Total Risk-Based capital very strong › Tier 1 Capital $6.5 billion in excess of “Well Capitalized” minimums › Ratios compare favorably to peer group 2Q09 3Q09 (1) Total Risk-Based Capital Ratio 16.2% 16.2% Tier 1 Capital Ratio 12.2% 12.1% Tier 1 Common 8.1% 7.8% (1) Current quarter ratios are estimated |
 * * * * * * |